1 Comprehensive Energy Audit For Rampart Washeteria & Water Treatment Plant Prepared For Rampart Village August 6, 2015 Prepared By: ANTHC-DEHE 3900 Ambassador Dr Suite 301 Anchorage, AK 99508
2.1 Program Description ........................................................................................................................... 5 2.2 Audit Description ................................................................................................................................ 5 2.3. Method of Analysis ............................................................................................................................ 6 2.4 Limitations of Study ............................................................................................................................ 7
3. Rampart Washeteria & Water Treatment Plant ...................................................................................... 8 3.1. Building Description ........................................................................................................................... 8 3.2 Predicted Energy Use ........................................................................................................................ 11
3.2.1 Energy Usage / Tariffs ................................................................................................................ 11 3.2.2 Energy Use Index (EUI) ............................................................................................................... 13
4.1 Summary of Results .......................................................................................................................... 16 4.2 Interactive Effects of Projects ........................................................................................................... 17
Appendix A – Energy Audit Report – Project Summary .............................................................................. 22 Appendix B – Actual Fuel Use versus Modeled Fuel Use ............................................................................ 23
PREFACE
This energy audit was conducted using funds from the United States Department of Agriculture Rural Utilities Service as well as the State of Alaska Department of Environmental Conservation. Coordination with the State of Alaska Remote Maintenance Worker (RMW) Program and the associated RMW for each community has been undertaken to provide maximum accuracy in identifying audits and coordinating potential follow up retrofit activities. The Energy Projects Group at the Alaska Native Tribal Health Consortium (ANTHC) prepared this document for Rampart Village. The authors of this report are Carl Remley, Certified Energy Auditor (CEA) and Certified Energy Manager (CEM) and Kevin Ulrich. Energy Manager-in-Training (EMIT). The purpose of this report is to provide a comprehensive document of the findings and analysis that resulted from an energy audit conducted in June of 2015 by the Energy Projects Group of ANTHC. This report analyzes historical energy use and identifies costs and savings of recommended energy conservation measures. Discussions of site-specific concerns, non-recommended measures, and an energy conservation action plan are also included in this report.
ACKNOWLEDGMENTS The ANTHC Energy Projects Group gratefully acknowledges the assistance of Water Treatment Plant Operator Mike Wiehl, Energy Specialist Patty Wiehl, and First Chief and Tribal Administrator Floyd Green.
3
1. EXECUTIVE SUMMARY
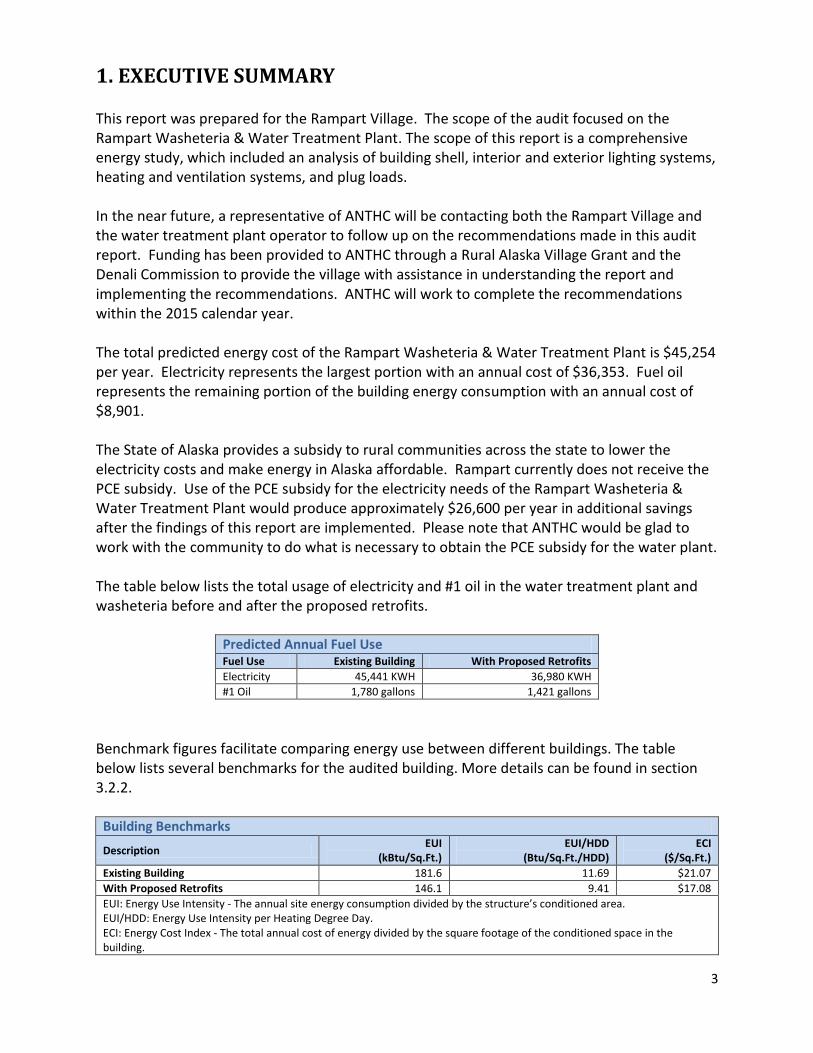
This report was prepared for the Rampart Village. The scope of the audit focused on the Rampart Washeteria & Water Treatment Plant. The scope of this report is a comprehensive energy study, which included an analysis of building shell, interior and exterior lighting systems, heating and ventilation systems, and plug loads. In the near future, a representative of ANTHC will be contacting both the Rampart Village and the water treatment plant operator to follow up on the recommendations made in this audit report. Funding has been provided to ANTHC through a Rural Alaska Village Grant and the Denali Commission to provide the village with assistance in understanding the report and implementing the recommendations. ANTHC will work to complete the recommendations within the 2015 calendar year. The total predicted energy cost of the Rampart Washeteria & Water Treatment Plant is $45,254 per year. Electricity represents the largest portion with an annual cost of $36,353. Fuel oil represents the remaining portion of the building energy consumption with an annual cost of $8,901. The State of Alaska provides a subsidy to rural communities across the state to lower the electricity costs and make energy in Alaska affordable. Rampart currently does not receive the PCE subsidy. Use of the PCE subsidy for the electricity needs of the Rampart Washeteria & Water Treatment Plant would produce approximately $26,600 per year in additional savings after the findings of this report are implemented. Please note that ANTHC would be glad to work with the community to do what is necessary to obtain the PCE subsidy for the water plant. The table below lists the total usage of electricity and #1 oil in the water treatment plant and washeteria before and after the proposed retrofits.
Predicted Annual Fuel Use Fuel Use Existing Building With Proposed Retrofits
Electricity 45,441 KWH 36,980 KWH
#1 Oil 1,780 gallons 1,421 gallons
Benchmark figures facilitate comparing energy use between different buildings. The table below lists several benchmarks for the audited building. More details can be found in section 3.2.2.
Building Benchmarks
Description EUI
(kBtu/Sq.Ft.) EUI/HDD
(Btu/Sq.Ft./HDD) ECI
($/Sq.Ft.)
Existing Building 181.6 11.69 $21.07
With Proposed Retrofits 146.1 9.41 $17.08
EUI: Energy Use Intensity - The annual site energy consumption divided by the structure’s conditioned area. EUI/HDD: Energy Use Intensity per Heating Degree Day. ECI: Energy Cost Index - The total annual cost of energy divided by the square footage of the conditioned space in the building.
4
Table 1.1 below summarizes the energy efficiency measures analyzed for the Rampart Washeteria & Water Treatment Plant. Listed are the estimates of the annual savings, installed costs, and two different financial measures of investment return.
Table 1.1 PRIORITY LIST – ENERGY EFFICIENCY MEASURES
Rank Feature Improvement Description
Annual
Energy
Savings
Installed
Cost
Savings to
Investment
Ratio, SIR1
Simple
Payback
(Years)2
CO2
Savings
1 Other Electrical -
Controls Retrofit: Lift
Station Electric Heat
Lower temperature setting
to 50 deg. F when
unoccupied.
$1,474 $500 34.63 0.3 4,053.5
2 Other Electrical -
Controls Retrofit:
Sewr Line Heat Tape
Shut off heat tape and
use only for emergency
purposes.
$2,930 $2,500 13.77 0.9 8,058.1
3 Ventilation Rewire thermostat from
heating to cooling.
$264 $300 11.50 1.1 1,006.2
4 Lighting - Power
Retrofit: Exterior
Lighting
Replace with new energy-
efficient lighting
$838 $1,200 10.20 1.4 2,304.9
5 Lighting - Power
Retrofit: Main
Washeteria Lighting
Replace with new energy-
efficient lighting
$717 $1,020 9.96 1.4 1,807.0
6 Lighting - Power
Retrofit: Rest Room
& Shower CFL
Replace with new energy-
efficient lighting
$92 $180 7.24 2.0 232.0
7 Lighting - Power
Retrofit: Rest Room
& Shower 4 Ft T8
Replace with new energy-
efficient lighting
$127 $300 5.99 2.4 319.8
8 Heating, Ventilation,
and Domestic Hot
Water
Add a Tekmar controller
to operate the boilers
based on water treatment
plant demand. Re-
commission the dryer
plenum dampers.
$1,802 $7,500 4.19 4.2 7,619.4
9 Lighting - Power
Retrofit: Main WTP
Lighting
Replace with new energy-
efficient lighting
$301 $1,080 3.95 3.6 755.9
10 Lighting - Power
Retrofit: Office
Lighting
Replace with new energy-
efficient lighting
$8 $60 1.97 7.2 20.9
11 Lighting - Power
Retrofit: Generator
Room Lighting
Replace with new energy-
efficient lighting
$13 $140 1.26 11.2 31.4
TOTAL, all measures $8,567 $14,780 7.89 1.7 26,209.1
Table Notes:
1 Savings to Investment Ratio (SIR) is a life-cycle cost measure calculated by dividing the total savings over the life of a project (expressed in today’s dollars) by its investment costs. The SIR is an indication of the profitability of a measure; the higher the SIR, the more profitable the project. An SIR greater than 1.0 indicates a cost-effective project (i.e. more savings than cost). Remember that this profitability is based on the position of that Energy Efficiency Measure (EEM) in the overall list and assumes that the measures above it are implemented first.
5
2 Simple Payback (SP) is a measure of the length of time required for the savings from an EEM to payback the investment cost, not counting interest on the investment and any future changes in energy prices. It is calculated by dividing the investment cost by the expected first-year savings of the EEM.
With all of these energy efficiency measures in place, the annual utility cost can be reduced by $8,567 per year, or 18.9% of the buildings’ total energy costs. These measures are estimated to cost $14,780, for an overall simple payback period of 1.7 years Table 1.2 below is a breakdown of the annual energy cost across various energy end use types, such as Space Heating and Water Heating. The first row in the table shows the breakdown for the building as it is now. The second row shows the expected breakdown of energy cost for the building assuming all of the retrofits in this report are implemented. Finally, the last row shows the annual energy savings that will be achieved from the retrofits.
Table 1.2
Annual Energy Cost Estimate Description Space Heating Water Heating Ventilation Fans Clothes Drying Lighting Other Electrical Total Cost
Existing Building $5,586 $2,427 $117 $3,742 $6,077 $27,304 $45,254
With Proposed Retrofits $5,493 $1,660 $58 $2,808 $3,767 $22,900 $36,687
Savings $93 $767 $58 $934 $2,310 $4,404 $8,567
2. AUDIT AND ANALYSIS BACKGROUND
2.1 Program Description
This audit included services to identify, develop, and evaluate energy efficiency measures at the Rampart Washeteria & Water Treatment Plant. The scope of this project included evaluating building shell, lighting and other electrical systems, and heating and ventilation equipment, motors and pumps. Measures were analyzed based on life-cycle-cost techniques, which include the initial cost of the equipment, life of the equipment, annual energy cost, annual maintenance cost, and a discount rate of 3.0%/year in excess of general inflation.
2.2 Audit Description
Preliminary audit information was gathered in preparation for the site survey. The site survey provides critical information in deciphering where energy is used and what opportunities exist within a building. The entire site was surveyed to inventory the following to gain an understanding of how each building operates:
• Building envelope (roof, windows, etc.) • Heating and ventilation equipment • Lighting systems and controls • Building-specific equipment
6
The building site visit was performed to survey all major building components and systems. The site visit included detailed inspection of energy consuming components. Summary of building occupancy schedules, operating and maintenance practices, and energy management programs provided by the building manager were collected along with the system and components to determine a more accurate impact on energy consumption. Details collected from Rampart Washeteria & Water Treatment Plant enable a model of the building’s energy usage to be developed, highlighting the building’s total energy consumption, energy consumption by specific building component, and equivalent energy cost. The analysis involves distinguishing the different fuels used on site, and analyzing their consumption in different activity areas of the building. Rampart Washeteria & Water Treatment Plant is classified as being made up of the following activity areas: 1) Washeteria: 1,248 square feet 2) Water Treatment Plant: 900 square feet In addition, the methodology involves taking into account a wide range of factors specific to the building. These factors are used in the construction of the model of energy used. The factors include:
• Occupancy hours • Local climate conditions • Prices paid for energy
Investment in the SIR calculation includes the labor and materials required to install the measure. An SIR value of at least 1.0 indicates that the project is cost-effective—total savings exceed the investment costs. Simple payback is a cost analysis method whereby the investment cost of a project is divided by the first year’s savings of the project to give the number of years required to recover the cost of the investment. This may be compared to the expected time before replacement of the system or component will be required. For example, if a boiler costs $12,000 and results in a savings of $1,000 in the first year, the payback time is 12 years. If the boiler has an expected life to replacement of 10 years, it would not be financially viable to make the investment since the payback period of 12 years is greater than the project life. The Simple Payback calculation does not consider likely increases in future annual savings due to energy price increases. As an offsetting simplification, simple payback does not consider the need to earn interest on the investment (i.e. it does not consider the time-value of money). Because of these simplifications, the SIR figure is considered to be a better financial investment indicator than the Simple Payback measure. Measures are implemented in order of cost-effectiveness. The program first calculates individual SIRs, and ranks all measures by SIR, higher SIRs at the top of the list. An individual measure must have an individual SIR>=1 to make the cut. Next the building is modified and re-simulated with the highest ranked measure included. Now all remaining measures are re-evaluated and ranked, and the next most cost-effective measure is implemented. AkWarm goes through this iterative process until all appropriate measures have been evaluated and installed. It is important to note that the savings for each recommendation is calculated based on implementing the most cost effective measure first, and then cycling through the list to find the next most cost effective measure. Implementation of more than one EEM often affects the savings of other EEMs. The savings may in some cases be relatively higher if an individual EEM is implemented in lieu of multiple recommended EEMs. For example implementing a reduced operating schedule for inefficient lighting will result in relatively high savings. Implementing a reduced operating schedule for newly installed efficient lighting will result in lower relative savings, because the efficient lighting system uses less energy during each hour of operation. If multiple EEM’s are recommended to be implemented, AkWarm calculates the combined savings appropriately. Cost savings are calculated based on estimated initial costs for each measure. Installation costs include labor and equipment to estimate the full up-front investment required to implement a change. Costs are derived from Means Cost Data, industry publications, and local contractors and equipment suppliers.
2.4 Limitations of Study
All results are dependent on the quality of input data provided, and can only act as an approximation. In some instances, several methods may achieve the identified savings. This report is not intended as a final design document. The design professional or other persons following the recommendations shall accept responsibility and liability for the results.
8
3. Rampart Washeteria & Water Treatment Plant
3.1. Building Description
The 2,148 square foot Rampart Washeteria & Water Treatment Plant was constructed in 1998. The number of hours of operation for this building is approximately 7.5 hours per day, considering all seven days of the week. The Rampart Washeteria & Water Treatment Plant serves as the water gathering point for the residents of the community and as a location for laundromat and shower services. There is one watering point with a ¾” pipe that provides treated water for community pickup. There are four washers and four dryers in the washeteria that are available for public use. At the time of the energy audit, two of the four washers were in operation. Water is pumped into the water treatment plant from the raw water intake that draws water from a nearby well. The water is pumped through two pressure filters before receiving an addition of chlorine and entering the 4,000 gallon water storage tank. Pressure pumps are used to keep the pressure up for use in the washeteria and showers. The facility has a single watering point that is used by the residents to collect their own water supply. The rest of the water is used in the washing machines and restrooms. Description of Building Shell The exterior walls are constructed from stressed skin panel construction with 5.5 inches of polyurethane foam insulation. The insulation has some moderate damage and there is approximately 1,840 square feet of wall space. The roof of the building has a cathedral ceiling that is constructed with standard 24” lumber framing and 5.5 inches of polyurethane foam insulation. The insulation has some moderate damage and there is approximately 2,215 square feet of roof space. The building is built on pilings with approximately 48 inches of clearance between the building and the ground. The floor is framed with standard lumber and has 9.5 inches of polyurethane foam insulation. There is approximately 2,148 square feet of floor space. There are six windows in the building that are not south-facing and three windows that are south-facing. The six windows that are not south-facing are all triple-paned windows and combine to have approximately 36 square feet of window space. The three south-facing windows are all double-paned windows and combine to have approximately 18 square feet of window space. All the windows in the building have wooden window frames. There are three exterior doors present in the building. Each door is made of metal with a fiberglass insulation core. The doors combine to have approximately 63 square feet of door space. Description of Heating Plants
9
The Heating Plants used in the building are: Boiler 1 Nameplate Information: Weil McLain 678 Fuel Type: #1 Oil Input Rating: 559,000 BTU/hr Steady State Efficiency: 78 % Idle Loss: 0.9 % Heat Distribution Type: Glycol Boiler Operation: All Year Boiler 2 Nameplate Information: Weil McLain-678 Fuel Type: #1 Oil Input Rating: 559,000 BTU/hr Steady State Efficiency: 78 % Idle Loss: 0.9 % Heat Distribution Type: Glycol Boiler Operation: All Year Space Heating Distribution Systems There are three unit heaters in the building that circulate heat through the building. There is one unit heater that provides heat to the water treatment plant main room and produces approximately 5000 BTU/hr. There is a second unit heater in the attic that also acts as a dryer plenum and produces approximately 41,000 BTU/hr. There is a third unit heater in the washeteria main room that circulates heat through the occupied part of the washeteria and produces approximately 27,000 BTU/hr. The hydronic system also has a circulation pump that circulates heated glycol through a hydronic loop to the different heat loads. The pump is rated at ½ HP. Domestic Hot Water System There is a hot water heater that provides hot water to the washers and showers. A circulation pump is used to pump hot water throughout the building. The pump is rated at ½ HP. Description of Building Ventilation System There is an exhaust fan in the washeteria that is used to circulate the air from the interior of the building to the exterior of the building. The fan is currently wired opposite of its intended function such that it attempts to heat the room when it should be cooling and it attempts to cool the room when it should be heating. The fan circulates approximately 100 CFM of air. Lighting The main washeteria room has 17 fixtures with two T8 fluorescent light bulbs in each fixture.
10
The main water treatment plant room has 18 fixtures with two T8 fluorescent light bulbs in each fixture. The generator room has three fixtures with two T8 fluorescent light bulbs in each fixture. The office has one fixture with two T8 fluorescent light bulbs in each fixture. The rest rooms and shower rooms combine to have five fixtures with two T8 fluorescent light bulbs in each fixture. The rest rooms and shower rooms also combine to have nine fixtures with a 20 Watt CFL light bulb in each fixture. The exterior of the building has three fixtures with a 150 Watt high pressure sodium light bulb in each fixture. Plug Loads The water treatment plant has a variety of power tools, a telephone, and some other miscellaneous loads that require a plug into an electrical outlet. The use of these items is infrequent and consumes a small portion of the total energy demand of the building. Major Equipment There is a heat tape that is used to protect the sewer line from freezing and consumes approximately 18,314 KWH annually. There is a heat tape that is used to protect the well line from freezing and consumes approximately 3,450 KWH annually. There is an electric heater in the lift station that is used to provide heat and prevent the sewage from freezing. The heater consumes approximately 4,935 KWH annually. There is a pump in the lift station that is used to pump the community sewage to the sewage lagoon. The pump consumes approximately 3,143 KWH annually. There is a well pump that is used to pump raw water from the well into the water treatment plant. The pump consumes approximately 263 KWH annually. There is a back wash pump that is used to backwash the pressure filters during the water treatment process. The backwash pump consumes approximately 263 KWH annually. There are two pressure pumps that are used to pressurize the water in the treatment process. The pumps consume approximately 526 KWH annually. There is a small pump that is used to circulate heat to the watering point to prevent freezing. The pump consumes approximately 261 KWH annually.
11
There are two clothes washers that are currently in operation in the washeteria. The washers combine to consume approximately 731 KWH. There are five exhaust fans in the rest rooms with one fan per room that provide ventilation to the rooms when they are in use. The fans combine to consume approximately 274 KWH annually. There are a variety of miscellaneous pumps and controls within the building that are used to operate the water treatment plant and washeteria in their basic functions. This equipment consumes approximately 1,972 KWH annually.
3.2 Predicted Energy Use
3.2.1 Energy Usage / Tariffs
The electric usage profile charts (below) represents the predicted electrical usage for the building. If actual electricity usage records were available, the model used to predict usage was calibrated to approximately match actual usage. The electric utility measures consumption in kilowatt-hours (KWH) and maximum demand in kilowatts (kW). One KWH usage is equivalent to 1,000 watts running for one hour. One KW of electric demand is equivalent to 1,000 watts running at a particular moment. The basic usage charges are shown as generation service and delivery charges along with several non-utility generation charges. The fuel oil usage profile shows the fuel oil usage for the building. Fuel oil consumption is measured in gallons. One gallon of #1 Fuel Oil provides approximately 132,000 BTUs of energy. The following is a list of the utility companies providing energy to the building and the class of service provided: Electricity: Rampart Village Power Plant The average cost for each type of fuel used in this building is shown below in Table 3.1. This figure includes all surcharges, subsidies, and utility customer charges:
Table 3.1 – Average Energy Cost Description Average Energy Cost
figure to the “Existing” bar shows the potential savings from implementing all of the energy efficiency measures shown in this report.
Figure 3.1 Annual Energy Costs by End Use
Figure 3.2 below shows how the annual energy cost of the building splits between the different fuels used by the building. The “Existing” bar shows the breakdown for the building as it is now; the “Retrofit” bar shows the predicted costs if all of the energy efficiency measures in this report are implemented.
Figure 3.2 Annual Energy Costs by Fuel Type
Figure 3.3 below addresses only Space Heating costs. The figure shows how each heat loss component contributes to those costs; for example, the figure shows how much annual space heating cost is caused by the heat loss through the Walls/Doors. For each component, the space heating cost for the Existing building is shown (blue bar) and the space heating cost assuming all retrofits are implemented (yellow bar) are shown.
13
Figure 3.3 Annual Space Heating Cost by Component
The tables below show AkWarm’s estimate of the monthly fuel use for each of the fuels used in the building. For each fuel, the fuel use is broken down across the energy end uses. Note, in the tables below “DHW” refers to Domestic Hot Water heating.
Electrical Consumption (KWH)
Jan Feb Mar Apr May Jun Jul Aug Sept Oct Nov Dec Space_Heating 307 269 278 169 9 2 1 4 128 260 277 304
Energy Use Index (EUI) is a measure of a building’s annual energy utilization per square foot of building. This calculation is completed by converting all utility usage consumed by a building for one year, to British Thermal Units (Btu) or kBtu, and dividing this number by the building square footage. EUI is a good measure of a building’s energy use and is utilized regularly for comparison of energy performance for similar building types. The Oak Ridge National Laboratory (ORNL) Buildings Technology Center under a contract with the U.S. Department of
14
Energy maintains a Benchmarking Building Energy Performance Program. The ORNL website determines how a building’s energy use compares with similar facilities throughout the U.S. and in a specific region or state. Source use differs from site usage when comparing a building’s energy consumption with the national average. Site energy use is the energy consumed by the building at the building site only. Source energy use includes the site energy use as well as all of the losses to create and distribute the energy to the building. Source energy represents the total amount of raw fuel that is required to operate the building. It incorporates all transmission, delivery, and production losses, which allows for a complete assessment of energy efficiency in a building. The type of utility purchased has a substantial impact on the source energy use of a building. The EPA has determined that source energy is the most comparable unit for evaluation purposes and overall global impact. Both the site and source EUI ratings for the building are provided to understand and compare the differences in energy use. The site and source EUIs for this building are calculated as follows. (See Table 3.4 for details): Building Site EUI = (Electric Usage in kBtu + Fuel Oil Usage in kBtu) Building Square Footage Building Source EUI = (Electric Usage in kBtu X SS Ratio + Fuel Oil Usage in kBtu X SS Ratio) Building Square Footage where “SS Ratio” is the Source Energy to Site Energy ratio for the particular fuel.
15
Table 3.4 Rampart Washeteria & Water Treatment Plant EUI Calculations
Energy Type Building Fuel Use per Year Site Energy Use per Year, kBTU
Source/Site Ratio
Source Energy Use per Year, kBTU
Electricity 45,441 KWH 155,090 3.340 517,999
#1 Oil 1,780 gallons 234,982 1.010 237,332
Total 390,072 755,331
BUILDING AREA 2,148 Square Feet
BUILDING SITE EUI 182 kBTU/Ft²/Yr
BUILDING SOURCE EUI 352 kBTU/Ft²/Yr
* Site - Source Ratio data is provided by the Energy Star Performance Rating Methodology for Incorporating Source Energy Use document issued March 2011.
Table 3.5
Building Benchmarks
Description EUI
(kBtu/Sq.Ft.) EUI/HDD
(Btu/Sq.Ft./HDD) ECI
($/Sq.Ft.)
Existing Building 181.6 11.69 $21.07
With Proposed Retrofits 146.1 9.41 $17.08
EUI: Energy Use Intensity - The annual site energy consumption divided by the structure’s conditioned area. EUI/HDD: Energy Use Intensity per Heating Degree Day. ECI: Energy Cost Index - The total annual cost of energy divided by the square footage of the conditioned space in the building.
4.1 Summary of Results The energy saving measures are summarized in Table 4.1. Please refer to the individual measure descriptions later in this report for more detail.
Table 4.1 Rampart Washeteria & Water Treatment Plant, Rampart, Alaska
PRIORITY LIST – ENERGY EFFICIENCY MEASURES
Rank Feature
Improvement
Description
Annual
Energy
Savings
Installed
Cost
Savings to
Investment
Ratio, SIR
Simple
Payback
(Years)
CO2
Savings
1 Other Electrical
- Controls
Retrofit: Lift
Station Electric
Heat
Lower temperature
setting to 50 deg. F when
unoccupied.
$1,474 $500 34.63 0.3 4,053.5
2 Other Electrical
- Controls
Retrofit: Sewer
Line Heat Tape
Shut off heat tape and
use only for emergency
purposes.
$2,930 $2,500 13.77 0.9 8,058.1
3 Ventilation Rewire thermostat from
heating to cooling.
$264 $300 11.50 1.1 1,006.2
4 Lighting -
Power Retrofit:
Exterior Lighting
Replace with new
energy-efficient lighting
$838 $1,200 10.20 1.4 2,304.9
5 Lighting -
Power Retrofit:
Main
Washeteria
Lighting
Replace with new
energy-efficient lighting
$717 $1,020 9.96 1.4 1,807.0
6 Lighting -
Power Retrofit:
Rest Room &
Shower CFL
Replace with new
energy-efficient lighting
$92 $180 7.24 2.0 232.0
17
Table 4.1 Rampart Washeteria & Water Treatment Plant, Rampart, Alaska
PRIORITY LIST – ENERGY EFFICIENCY MEASURES
Rank Feature
Improvement
Description
Annual
Energy
Savings
Installed
Cost
Savings to
Investment
Ratio, SIR
Simple
Payback
(Years)
CO2
Savings
7 Lighting -
Power Retrofit:
Rest Room &
Shower 4 Ft T8
Replace with new
energy-efficient lighting
$127 $300 5.99 2.4 319.8
8 Heating,
Ventilation,
and Domestic
Hot Water
Add a Tekmar controller
to operate the boilers
based on water
treatment plant
demand. Re-
commission the dryer
plenum dampers.
$1,802 $7,500 4.19 4.2 7,619.4
9 Lighting -
Power Retrofit:
Main WTP
Lighting
Replace with new
energy-efficient lighting
$301 $1,080 3.95 3.6 755.9
10 Lighting -
Power Retrofit:
Office Lighting
Replace with new
energy-efficient lighting
$8 $60 1.97 7.2 20.9
11 Lighting -
Power Retrofit:
Generator
Room Lighting
Replace with new
energy-efficient lighting
$13 $140 1.26 11.2 31.4
TOTAL, all
measures
$8,567 $14,780 7.89 1.7 26,209.1
4.2 Interactive Effects of Projects The savings for a particular measure are calculated assuming all recommended EEMs coming before that measure in the list are implemented. If some EEMs are not implemented, savings for the remaining EEMs will be affected. For example, if ceiling insulation is not added, then savings from a project to replace the heating system will be increased, because the heating system for the building supplies a larger load. In general, all projects are evaluated sequentially so energy savings associated with one EEM would not also be attributed to another EEM. By modeling the recommended project sequentially, the analysis accounts for interactive affects among the EEMs and does not “double count” savings. Interior lighting, plug loads, facility equipment, and occupants generate heat within the building. When the building is in cooling mode, these items contribute to the overall cooling demands of the building; therefore, lighting efficiency improvements will reduce cooling requirements in air-conditioned buildings. Conversely, lighting-efficiency improvements are anticipated to slightly increase heating requirements. Heating penalties and cooling benefits were included in the lighting project analysis.
18
4.3 Mechanical Equipment Measures
4.3.1 Heating /Domestic Hot Water Measure
4.3.2 Ventilation System Measures
4.4 Electrical & Appliance Measures 4.4.1 Lighting Measures The goal of this section is to present any lighting energy conservation measures that may also be cost beneficial. It should be noted that replacing current bulbs with more energy-efficient equivalents will have a small effect on the building heating loads. The building cooling load will see a small decrease from an upgrade to more efficient bulbs and the heating load will see a small increase, as the more energy efficient bulbs give off less heat.
8 Add a Tekmar controller to operate the boilers based on water treatment plant demand. Re-commission the dryer plenum dampers.
Installation Cost $7,500 Estimated Life of Measure (yrs) 20 Energy Savings (/yr) $1,802
Breakeven Cost $31,407 Savings-to-Investment Ratio 4.2 Simple Payback yrs 4
Auditors Notes: Add a Tekmar 268 controller with outdoor reset to control the two boilers and main circulation pumps. The Tekmar would have a demand signal override for both the dryers and hot water heater. Also, re-commission the dryer plenum dampers on the gable end of the building.
Rank Description Recommendation
3 Rewire thermostat from heating to cooling.
Installation Cost $300 Estimated Life of Measure (yrs) 15 Energy Savings (/yr) $264
Breakeven Cost $3,450 Savings-to-Investment Ratio 11.5 Simple Payback yrs 1
Auditors Notes: Convert line voltage thermostat from heating to cooling. The fan is currently wired in backwards and needs to be rewired so that the fan operates in the proper mode.
Rank Location Existing Condition Recommendation
4 Exterior Lighting 3 HPS 150 Watt StdElectronic with Manual Switching Replace with new energy-efficient lighting
Installation Cost $1,200 Estimated Life of Measure (yrs) 20 Energy Savings (/yr) $838
Breakeven Cost $12,245 Savings-to-Investment Ratio 10.2 Simple Payback yrs 1
Auditors Notes: Replace 150 watt HPS wall pack fixtures with 25 watt LED wall pack fixtures.
19
Rank Location Existing Condition Recommendation
5 Main Washeteria Lighting
17 FLUOR (2) T8 4' F32T8 32W Standard Instant StdElectronic with Manual Switching
Replace with new energy-efficient lighting
Installation Cost $1,020 Estimated Life of Measure (yrs) 20 Energy Savings (/yr) $717
Breakeven Cost $10,159 Savings-to-Investment Ratio 10.0 Simple Payback yrs 1
Auditors Notes: Convert T8 fluorescent fixtures to 17 watt LED and remove ballast.
Rank Location Existing Condition Recommendation
6 Rest Room & Shower CFL
9 FLUOR CFL, A Lamp 20W with Manual Switching Replace with new energy-efficient lighting
Installation Cost $180 Estimated Life of Measure (yrs) 20 Energy Savings (/yr) $92
Breakeven Cost $1,303 Savings-to-Investment Ratio 7.2 Simple Payback yrs 2
Auditors Notes: Convert 4 decorative 40 Watt incandescent and 5 26 watt CFLs to 10 watt LED A lamps.
Rank Location Existing Condition Recommendation
7 Rest Room & Shower 4 Ft T8
5 FLUOR (2) T8 4' F32T8 32W Standard Instant StdElectronic with Manual Switching
Replace with new energy-efficient lighting
Installation Cost $300 Estimated Life of Measure (yrs) 20 Energy Savings (/yr) $127
Breakeven Cost $1,797 Savings-to-Investment Ratio 6.0 Simple Payback yrs 2
Auditors Notes: Convert T8 fluorescent to 17 watt LED and remove ballast.
Rank Location Existing Condition Recommendation
9 Main WTP Lighting 18 FLUOR (2) T8 4' F32T8 32W Standard Instant StdElectronic with Manual Switching
Replace with new energy-efficient lighting
Installation Cost $1,080 Estimated Life of Measure (yrs) 20 Energy Savings (/yr) $301
Breakeven Cost $4,264 Savings-to-Investment Ratio 3.9 Simple Payback yrs 4
Auditors Notes: Convert T8 fluorescent to 17 watt LED and remove ballast.
Rank Location Existing Condition Recommendation
10 Office Lighting FLUOR (2) T8 4' F32T8 32W Standard Instant StdElectronic with Manual Switching
Replace with new energy-efficient lighting
Installation Cost $60 Estimated Life of Measure (yrs) 20 Energy Savings (/yr) $8
Breakeven Cost $118 Savings-to-Investment Ratio 2.0 Simple Payback yrs 7
Auditors Notes: Convert T8 fluorescent to 17 watt LED and remove ballast.
Rank Location Existing Condition Recommendation
11 Generator Room Lighting
3 FLUOR (2) T8 4' F32T8 32W Standard Instant StdElectronic with Manual Switching
Replace with new energy-efficient lighting
Installation Cost $140 Estimated Life of Measure (yrs) 20 Energy Savings (/yr) $13
Breakeven Cost $177 Savings-to-Investment Ratio 1.3 Simple Payback yrs 11
Auditors Notes: Convert T8 fluorescent to 17 watt LED and remove ballast.
20
4.4.2 Other Electrical Measures
Rank Location Description of Existing Efficiency Recommendation
1 Lift Station Electric Heat Lift Station Electric Heat with Manual Switching Lower temperature setting to 50 deg. F when unoccupied.
Installation Cost $500 Estimated Life of Measure (yrs) 15 Energy Savings (/yr) $1,474
Breakeven Cost $17,314 Savings-to-Investment Ratio 34.6 Simple Payback yrs 0
Auditors Notes: Thermostat that controls electric heater in lift station is presently set at 70 degrees in heating season. It should do fine with setting to 50 degrees.
Rank Location Description of Existing Efficiency Recommendation
2 Sewer Line Heat Tape 3 Sewer Line Heat Tape with Manual Switching Shut off heat tape and use only for emergency purposes.
Installation Cost $2,500 Estimated Life of Measure (yrs) 15 Energy Savings (/yr) $2,930
Breakeven Cost $34,420 Savings-to-Investment Ratio 13.8 Simple Payback yrs 1
Auditors Notes: Add a temperature sensor to the above ground section of heat tape and shut it off with a temperature controller when the outside temperature is above freezing.
21
5. ENERGY EFFICIENCY ACTION PLAN
Through inspection of the energy-using equipment on-site and discussions with site facilities personnel, this energy audit has identified several energy-saving measures. The measures will reduce the amount of fuel burned and electricity used at the site. The projects will not degrade the performance of the building and, in some cases, will improve it. Several types of EEMs can be implemented immediately by building staff, and others will require various amounts of lead time for engineering and equipment acquisition. In some cases, there are logical advantages to implementing EEMs concurrently. For example, if the same electrical contractor is used to install both lighting equipment and motors, implementation of these measures should be scheduled to occur simultaneously. In the near future, a representative of ANTHC will be contacting both the Rampart Village and the water treatment plant operator to follow up on the recommendations made in this audit report. Funding has been provided to ANTHC through a Rural Alaska Village Grant and the Denali Commission to provide the city with assistance in understanding the report and implementing the recommendations. ANTHC will work to complete the recommendations within the 2015 calendar year.
22
APPENDICES
Appendix A – Energy Audit Report – Project Summary
ENERGY AUDIT REPORT – PROJECT SUMMARY General Project Information PROJECT INFORMATION AUDITOR INFORMATION
Building: Rampart Washeteria & Water Treatment Plant
Auditor Company: ANTHC-DEHE
Address: PO Box 29 Auditor Name: Carl Remley & Kevin Ulrich
City: Rampart Auditor Address: 3900 Ambassador Dr Suite 301 Anchorage, AK 99508 Client Name: Mike Wiehl
Client Address: PO Box 29 Rampart, AK 99767
Auditor Phone: (907) 729-3543
Auditor FAX:
Client Phone: (907) 358- Auditor Comment:
Client FAX:
Design Data
Building Area: 2,148 square feet Design Space Heating Load: Design Loss at Space: 34,970 Btu/hour with Distribution Losses: 36,811 Btu/hour Plant Input Rating assuming 82.0% Plant Efficiency and 25% Safety Margin: 56,114 Btu/hour Note: Additional Capacity should be added for DHW and other plant loads, if served.
Typical Occupancy: 0 people Design Indoor Temperature: 70 deg F (building average)
Actual City: Rampart Design Outdoor Temperature: -54.8 deg F
Electric Utility: Self Generated Power (oil) - Residential
Natural Gas Provider: None
Average Annual Cost/KWH: $0.80/KWH Average Annual Cost/ccf: $0.000/ccf
Annual Energy Cost Estimate Description Space Heating Water Heating Ventilation Fans Clothes Drying Lighting Other Electrical Total Cost
Existing Building $5,586 $2,427 $117 $3,742 $6,077 $27,304 $45,254
With Proposed Retrofits $5,493 $1,660 $58 $2,808 $3,767 $22,900 $36,687
Savings $93 $767 $58 $934 $2,310 $4,404 $8,567
Building Benchmarks
Description EUI
(kBtu/Sq.Ft.) EUI/HDD
(Btu/Sq.Ft./HDD) ECI
($/Sq.Ft.)
Existing Building 181.6 11.69 $21.07
With Proposed Retrofits 146.1 9.41 $17.08
EUI: Energy Use Intensity - The annual site energy consumption divided by the structure’s conditioned area. EUI/HDD: Energy Use Intensity per Heating Degree Day. ECI: Energy Cost Index - The total annual cost of energy divided by the square footage of the conditioned space in the building.
23
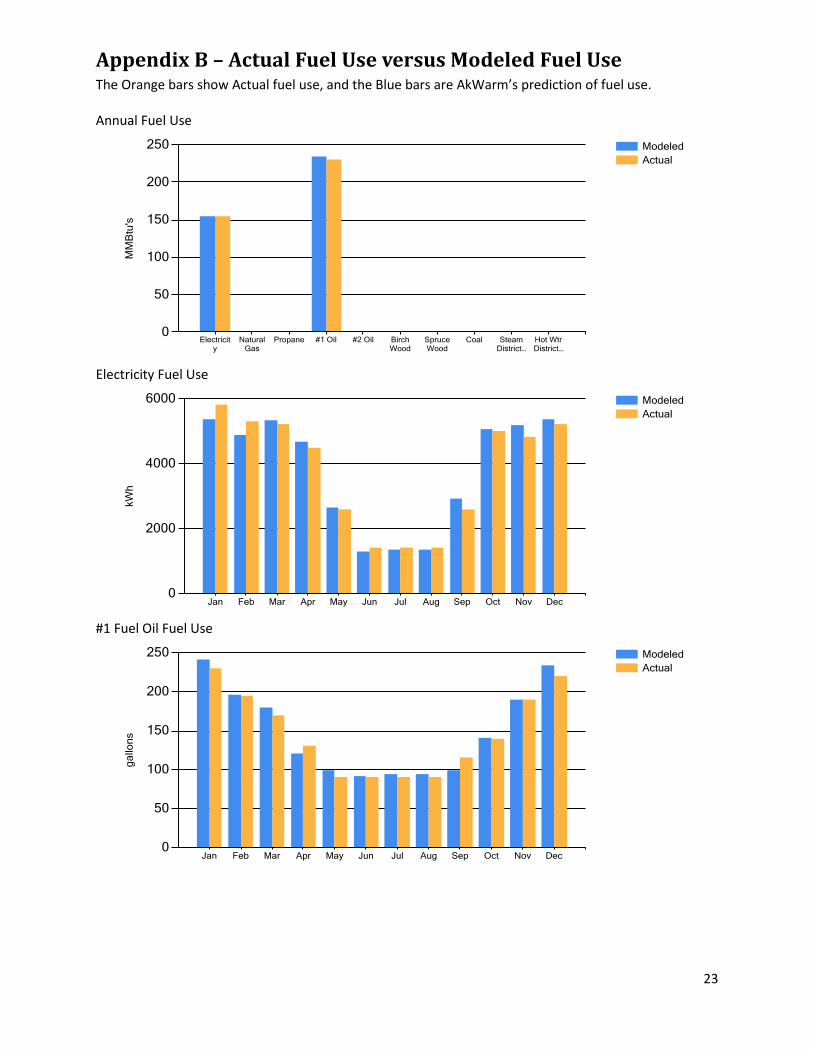
Appendix B – Actual Fuel Use versus Modeled Fuel Use The Orange bars show Actual fuel use, and the Blue bars are AkWarm’s prediction of fuel use. Annual Fuel Use