COMPREHENSIVE HOUSING MARKET ANALYSIS New Orleans, Louisiana U.S. Department of Housing and Urban Development Office of Policy Development and Research As of October 1, 2015 Louisiana Mississippi Lafourche Jackson St. Tammany Stone Pearl River Livingston Harrison Washington Hancock Orleans Tangipahoa St. Bernard St. Helena Ascension St. James Plaquemines Jefferson St. John the Baptist St. Charles Gulf of Mexico Terrebonne Assumption Housing Market Area The New Orleans Housing Market Area (HMA) is near the mouth of the Mississippi River in southeastern Louisiana. The HMA, which is coterminous with the New Orleans-Metairie, LA Metropolitan Statistical Area, comprises eight parishes—Jefferson, Orleans, Plaquemines, St. Bernard, St. Charles, St. James, St. John the Baptist, and St. Tammany. For purposes of this analysis, the HMA is divided into three submarkets—the Jefferson Parish submarket; the Orleans Parish submarket, which is coterminous with the city of New Orleans; and the Remainder sub- market, which consists of the remaining six parishes. Demographic, employment, and housing data for the HMA appear in Table DP-1 at the end of this report. Summary Economy Economic growth in the New Orleans HMA slowed during the past year. Nonfarm payrolls during the 12 months ending September 2015 averaged 563,700 jobs, up by 500, or 0.1 percent, from a year earlier. By comparison, payrolls increased 2.0 percent during the same period a year earlier. The HMA has struggled to recover from the effects of Hurricane Katrina, which made landfall in 2005. Current payrolls remain about 9.0 percent lower than the pre-Hurricane Katrina payroll level. During the next 3 years, nonfarm payrolls are expected to increase an average of less than 1.0 percent annually. Sales Market Population growth during the past 4 years contributed to slightly tight sales housing market conditions in the HMA overall compared with a soft sales market in 2010. During the 3-year forecast period, demand is expected for 10,450 new homes (Table 1). The 530 homes currently under construction and a portion of the 41,800 other vacant units in the HMA that might come back on the market will likely satisfy some of the forecast demand. Rental Market Rental housing market conditions in the HMA have fluctuated greatly since Hurricane Katrina made landfall in 2005 because of swings in both demand and available supply. Rental market conditions are currently soft, although improved, compared with conditions in April 2010. During the forecast period, demand is expected for approxi- mately 1,375 new market-rate rental units in the HMA (Table 1). The 1,200 units currently under construc- tion will likely satisfy some of that demand. Market Details Economic Conditions ......................... 2 Population and Households ............... 6 Housing Market Trends .................... 12 Data Profiles ..................................... 27
Transcript
C O M P R E H E N S I V E H O U S I N G M A R K E T A N A L Y S I S
New Orleans, LouisianaU.S. Department of Housing and Urban Development Office of Policy Development and Research As of October 1, 2015
LouisianaMississippi
Lafourche
Jack
son
St. Tammany
Stone
Pearl River
LivingstonHarrison
Washington
Hancock
Orleans
Tan
gipa
hoa
St. Bernard
St. Helena
Ascension
St. James
Plaquemines
Jeff
erso
n
St. Jo
hn
the B
aptis
t
St. C
harle
s
Gulf of Mexico
Terrebonne
Assumption
Housing Market AreaThe New Orleans Housing Market Area (HMA) is near the mouth of the Mississippi River in southeastern
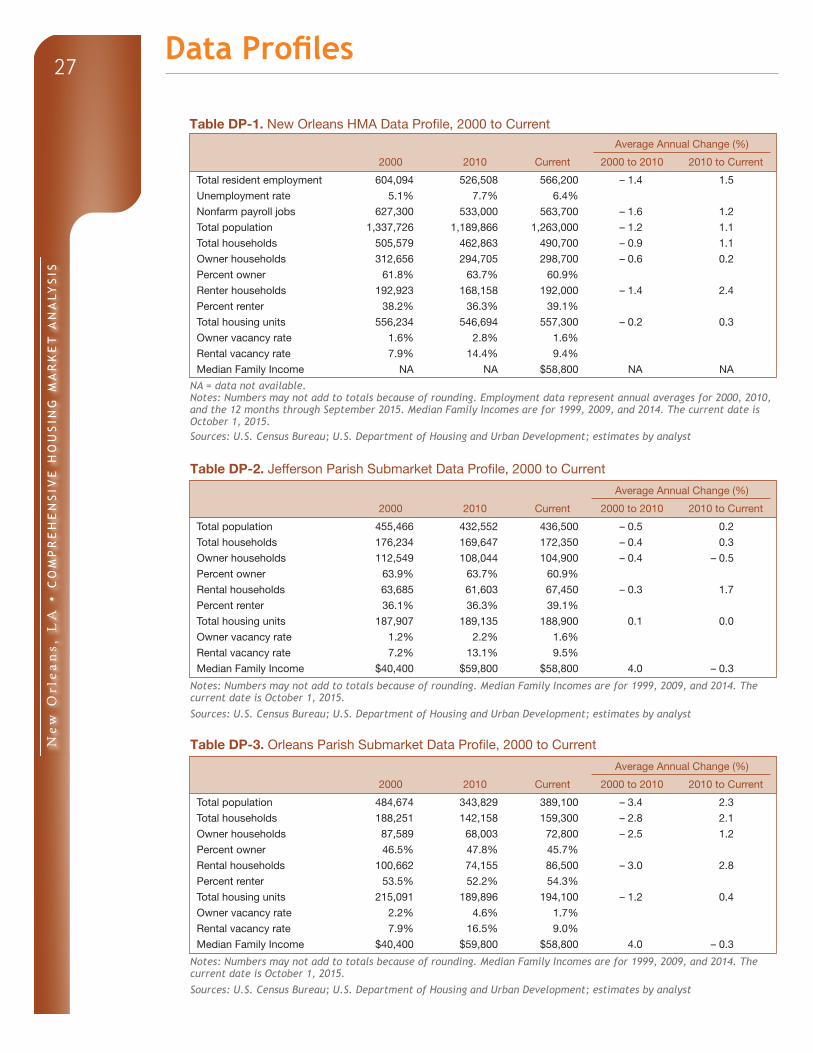
Louisiana. The HMA, which is coterminous with the New Orleans-Metairie, LA Metropolitan Statistical Area, comprises eight parishes—Jefferson, Orleans, Plaquemines, St. Bernard, St. Charles, St. James, St. John the Baptist, and St. Tammany. For purposes of this analysis, the HMA is divided into three submarkets—the Jefferson Parish submarket; the Orleans Parish submarket, which is coterminous with the city of New Orleans; and the Remainder sub-market, which consists of the remaining six parishes. Demographic, employment, and housing data for the HMA appear in Table DP-1 at the end of this report.
SummaryEconomy Economic growth in the New Orleans HMA slowed during the past year. Nonfarm payrolls during the 12 months ending September 2015 averaged 563,700 jobs, up by 500, or 0.1 percent, from a year earlier. By comparison, payrolls increased 2.0 percent during the same period a year earlier. The HMA has struggled to recover from the effects of Hurricane Katrina, which made landfall in 2005. Current payrolls remain about 9.0
percent lower than the pre-Hurricane Katrina payroll level. During the next 3 years, nonfarm payrolls are expected to increase an average of less than 1.0 percent annually.
Sales MarketPopulation growth during the past 4 years contributed to slightly tight sales housing market conditions in the HMA overall compared with a soft sales market in 2010. During the 3-year forecast period, demand is expected for 10,450 new homes (Table 1). The 530 homes currently under construction and a portion of the 41,800 other vacant units in the HMA that might come back on the market will likely satisfy some of the forecast demand.
Rental MarketRental housing market conditions in the HMA have fluctuated greatly since Hurricane Katrina made landfall in 2005 because of swings in both demand and available supply. Rental market conditions are currently soft, although improved, compared with conditions in April 2010. During the forecast period, demand is expected for approxi-mately 1,375 new market-rate rental units in the HMA (Table 1). The 1,200 units currently under construc-tion will likely satisfy some of that demand.
Data Profiles ..................................... 27
Ne
w O
rle
an
s, L
A •
CO
MP
RE
HE
NS
IVE
HO
US
ING
MA
RK
ET
AN
ALY
SIS
2
Table 1. Housing Demand in the New Orleans HMA During the Forecast Period
New OrleansHMA
Jefferson Parish Submarket
Orleans Parish Submarket
RemainderSubmarket
SalesUnits
RentalUnits
SalesUnits
RentalUnits
SalesUnits
RentalUnits
SalesUnits
RentalUnits
Total demand 10,450 1,375 800 0 4,150 1,375 5,500 0
Under construction 530 1,200 100 0 130 960 300 240
Notes: Total demand represents estimated production necessary to achieve a balanced market at the end of the forecast period. Units under construction as of October 1, 2015. A portion of the estimated 41,800 other vacant units in the HMA will likely satisfy some of the forecast demand. The forecast period is October 1, 2015, to October 1, 2018.Source: Estimates by analyst
Economic Conditions
The effects of Hurricane Katrina on the economy of the New
Orleans HMA were unprecedented and resonate more than 10 years later. Nonfarm payrolls during the 12 months ending August 2005, when Hurricane Katrina made landfall, averaged 621,800 jobs, but, during the 12 months ending August 2006, pay-rolls declined by 147,700 jobs, or 23.8 percent. The average unemployment rate increased significantly during the 3 months after Hurricane Katrina made landfall. During the 3 months ending November 2005, the average unemployment rate increased to 15.6 percent compared with 5.2 percent during the same period a year earlier. As the population relocated to areas
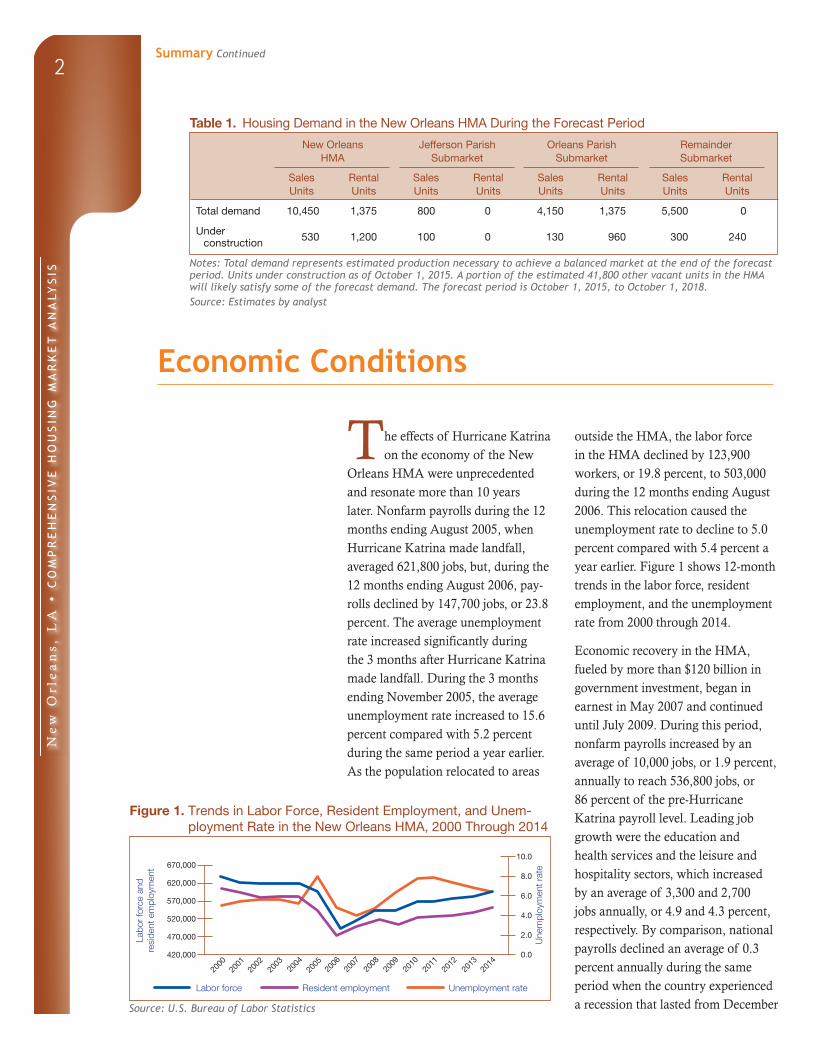
outside the HMA, the labor force in the HMA declined by 123,900 workers, or 19.8 percent, to 503,000 during the 12 months ending August 2006. This relocation caused the unemployment rate to decline to 5.0 percent compared with 5.4 percent a year earlier. Figure 1 shows 12-month trends in the labor force, resident employment, and the unemployment rate from 2000 through 2014.
Economic recovery in the HMA, fueled by more than $120 billion in government investment, began in earnest in May 2007 and continued until July 2009. During this period, nonfarm payrolls increased by an average of 10,000 jobs, or 1.9 percent, annually to reach 536,800 jobs, or 86 percent of the pre-Hurricane Katrina payroll level. Leading job growth were the education and health services and the leisure and hospitality sectors, which increased by an average of 3,300 and 2,700 jobs annually, or 4.9 and 4.3 percent, respectively. By comparison, national payrolls declined an average of 0.3 percent annually during the same period when the country experienced a recession that lasted from December
Figure 1. Trends in Labor Force, Resident Employment, and Unem-ployment Rate in the New Orleans HMA, 2000 Through 2014
Source: U.S. Bureau of Labor Statistics
Summary Continued
Une
mpl
oym
ent r
ate
Labo
r fo
rce
and
resi
dent
em
ploy
men
t 670,000
620,000
570,000
520,000
470,000
420,000
2000
2002
2004
Labor force Resident employment Unemployment rate
10.0
8.0
6.0
4.0
2.0
0.0
2006
2001
2003
2005
2007
2009
2010
2008
2012
2013
2014
2011
Ne
w O
rle
an
s, L
A •
CO
MP
RE
HE
NS
IVE
HO
US
ING
MA
RK
ET
AN
ALY
SIS
3
2007 through June 2009. During the period of May 2007 through July 2009, the 12-month average unem-ployment rate in the HMA increased from a 4.1-percent rate recorded in May 2007 to a rate of 6.2 percent by July 2009.
Although rebuilding efforts in the HMA buffered the local economy from the brunt of the effects of the recent national recession, nonfarm payrolls declined from August 2009 through 2010, with an average decrease of 1,700 jobs, or 0.3 percent, annually. By comparison, national payrolls declined an average of 2.4 percent annually during the same period. Job losses in the HMA during this period occurred in nearly every sector but were greatest in the manu-facturing sector, which declined by an average of 1,800 jobs, or 4.6 percent, to 34,900 jobs, partly the result of the discontinuation of shipbuilding for the U.S. Navy at the Huntington Ingalls Industries, Inc. shipyard in the city of Avondale in the Jefferson Par-ish submarket. Since October 2010, all 5,000 Huntington Ingalls employ-ees working at the Avondale shipyard have been laid off as a result of the cutback in shipbuilding. A portion of total nonfarm payroll losses from August 2009 through 2010 was offset by gains in the education and health services sector, which increased by an average of 3,300 jobs, or 4.6 percent, annually to 77,400 jobs. The reopening of several medical facilities that were damaged by Hurricane Katrina contributed to job growth in this sector. The 12-month average unemployment rate continued to increase during this period and, by December 2010, reached 7.7 percent compared with a rate of 6.3 percent during the 12 months ending August 2009.
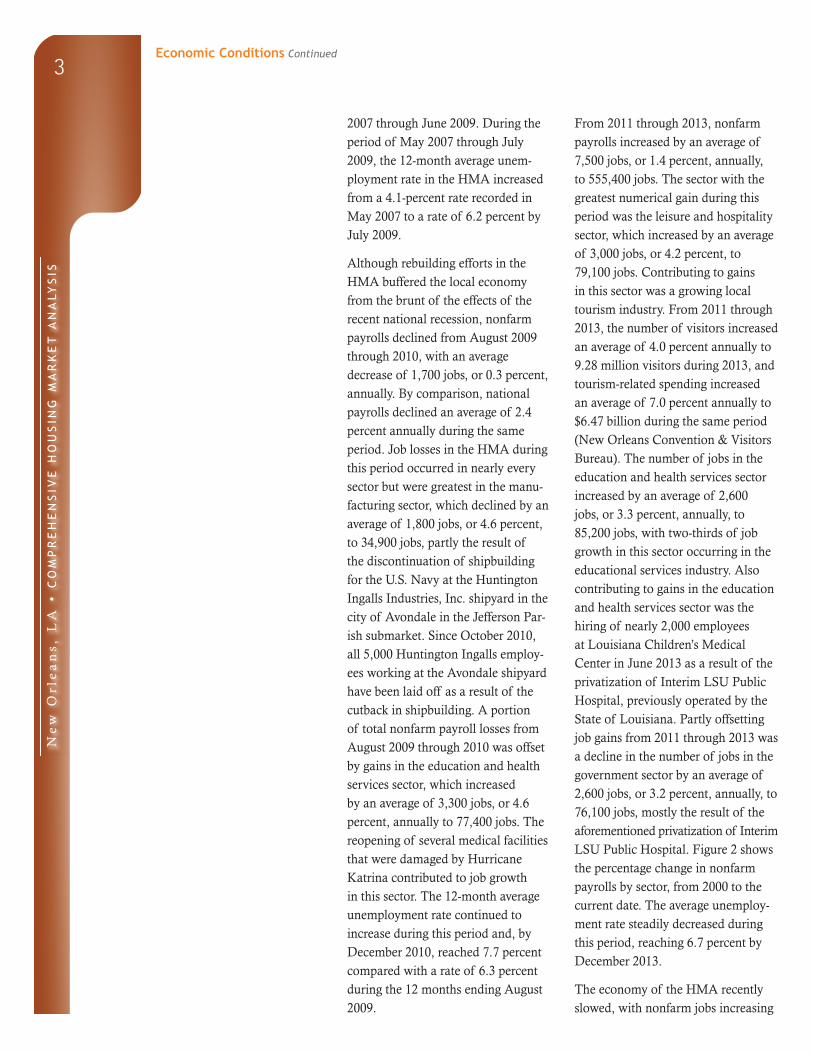
From 2011 through 2013, nonfarm payrolls increased by an average of 7,500 jobs, or 1.4 percent, annually, to 555,400 jobs. The sector with the greatest numerical gain during this period was the leisure and hospitality sector, which increased by an average of 3,000 jobs, or 4.2 percent, to 79,100 jobs. Contributing to gains in this sector was a growing local tourism industry. From 2011 through 2013, the number of visitors increased an average of 4.0 percent annually to 9.28 million visitors during 2013, and tourism-related spending increased an average of 7.0 percent annually to $6.47 billion during the same period (New Orleans Convention & Visitors Bureau). The number of jobs in the education and health services sector increased by an average of 2,600 jobs, or 3.3 percent, annually, to 85,200 jobs, with two-thirds of job growth in this sector occurring in the educational services industry. Also contributing to gains in the education and health services sector was the hiring of nearly 2,000 employees at Louisiana Children’s Medical Center in June 2013 as a result of the privatization of Interim LSU Public Hospital, previously operated by the State of Louisiana. Partly offsetting job gains from 2011 through 2013 was a decline in the number of jobs in the government sector by an average of 2,600 jobs, or 3.2 percent, annually, to 76,100 jobs, mostly the result of the aforementioned privatization of Interim LSU Public Hospital. Figure 2 shows the percentage change in nonfarm payrolls by sector, from 2000 to the current date. The average unemploy-ment rate steadily decreased during this period, reaching 6.7 percent by December 2013.
The economy of the HMA recently slowed, with nonfarm jobs increasing
Economic Conditions Continued
Ne
w O
rle
an
s, L
A •
CO
MP
RE
HE
NS
IVE
HO
US
ING
MA
RK
ET
AN
ALY
SIS
4
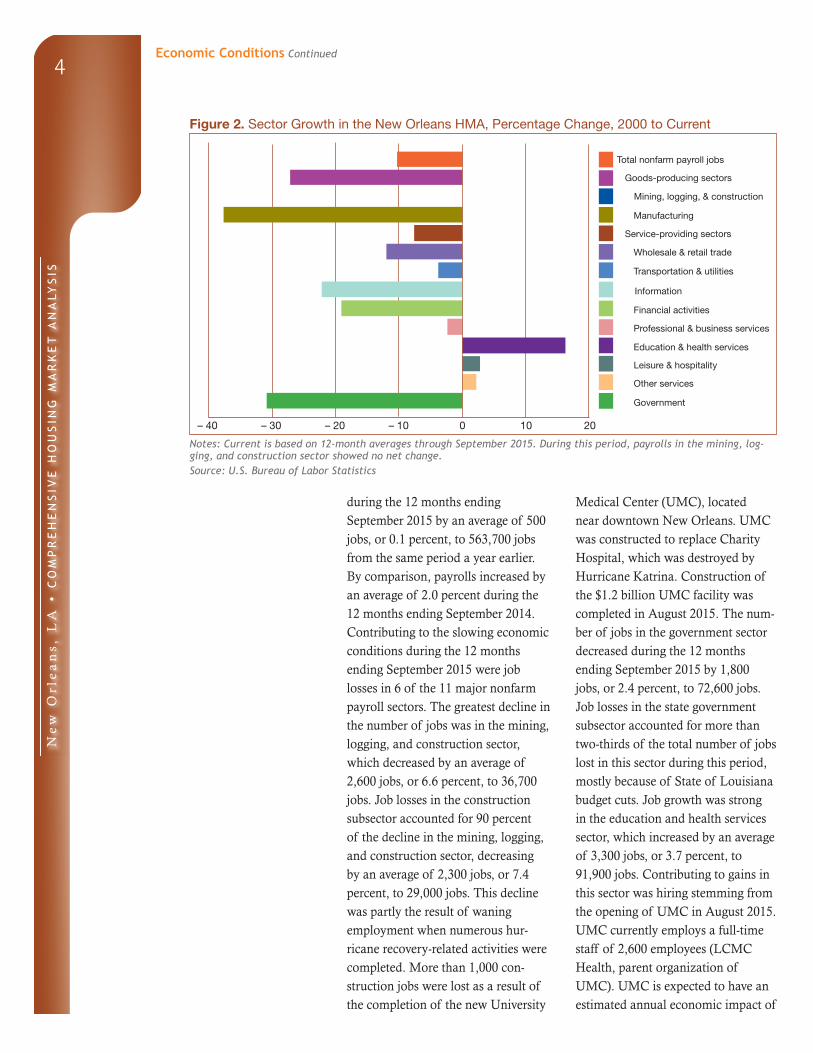
Figure 2. Sector Growth in the New Orleans HMA, Percentage Change, 2000 to Current
Notes: Current is based on 12-month averages through September 2015. During this period, payrolls in the mining, log-ging, and construction sector showed no net change.Source: U.S. Bureau of Labor Statistics
during the 12 months ending September 2015 by an average of 500 jobs, or 0.1 percent, to 563,700 jobs from the same period a year earlier. By comparison, payrolls increased by an average of 2.0 percent during the 12 months ending September 2014. Contributing to the slowing economic conditions during the 12 months ending September 2015 were job losses in 6 of the 11 major nonfarm payroll sectors. The greatest decline in the number of jobs was in the mining, logging, and construction sector, which decreased by an average of 2,600 jobs, or 6.6 percent, to 36,700 jobs. Job losses in the construction subsector accounted for 90 percent of the decline in the mining, logging, and construction sector, decreasing by an average of 2,300 jobs, or 7.4 percent, to 29,000 jobs. This decline was partly the result of waning employment when numerous hur-ricane recovery-related activities were completed. More than 1,000 con-struction jobs were lost as a result of the completion of the new University
Medical Center (UMC), located near downtown New Orleans. UMC was constructed to replace Charity Hospital, which was destroyed by Hurricane Katrina. Construction of the $1.2 billion UMC facility was completed in August 2015. The num-ber of jobs in the government sector decreased during the 12 months ending September 2015 by 1,800 jobs, or 2.4 percent, to 72,600 jobs. Job losses in the state government subsector accounted for more than two-thirds of the total number of jobs lost in this sector during this period, mostly because of State of Louisiana budget cuts. Job growth was strong in the education and health services sector, which increased by an average of 3,300 jobs, or 3.7 percent, to 91,900 jobs. Contributing to gains in this sector was hiring stemming from the opening of UMC in August 2015. UMC currently employs a full-time staff of 2,600 employees (LCMC Health, parent organization of UMC). UMC is expected to have an estimated annual economic impact of
Economic Conditions Continued
Total nonfarm payroll jobs
Goods-producing sectors
Mining, logging, & construction
Manufacturing
Service-providing sectors
Wholesale & retail trade
Information
Financial activities
Professional & business services
Education & health services
Government
Other services
Leisure & hospitality
Transportation & utilities
– 20– 30– 40 20– 10 0 10
Ne
w O
rle
an
s, L
A •
CO
MP
RE
HE
NS
IVE
HO
US
ING
MA
RK
ET
AN
ALY
SIS
5
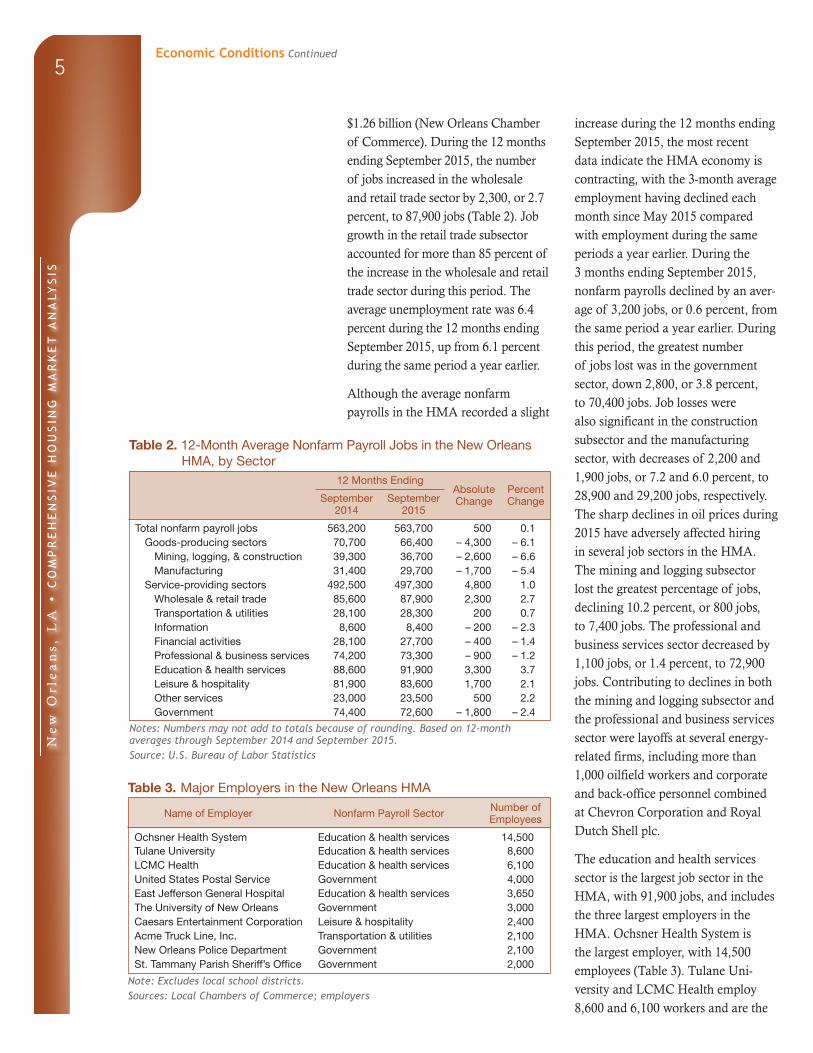
$1.26 billion (New Orleans Chamber of Commerce). During the 12 months ending September 2015, the number of jobs increased in the wholesale and retail trade sector by 2,300, or 2.7 percent, to 87,900 jobs (Table 2). Job growth in the retail trade subsector accounted for more than 85 percent of the increase in the wholesale and retail trade sector during this period. The average unemployment rate was 6.4 percent during the 12 months ending September 2015, up from 6.1 percent during the same period a year earlier.
Although the average nonfarm payrolls in the HMA recorded a slight
increase during the 12 months ending September 2015, the most recent data indicate the HMA economy is contracting, with the 3-month average employment having declined each month since May 2015 compared with employment during the same periods a year earlier. During the 3 months ending September 2015, nonfarm payrolls declined by an aver-age of 3,200 jobs, or 0.6 percent, from the same period a year earlier. During this period, the greatest number of jobs lost was in the government sector, down 2,800, or 3.8 percent, to 70,400 jobs. Job losses were also significant in the construction subsector and the manufacturing sector, with decreases of 2,200 and 1,900 jobs, or 7.2 and 6.0 percent, to 28,900 and 29,200 jobs, respectively. The sharp declines in oil prices during 2015 have adversely affected hiring in several job sectors in the HMA. The mining and logging subsector lost the greatest percentage of jobs, declining 10.2 percent, or 800 jobs, to 7,400 jobs. The professional and business services sector decreased by 1,100 jobs, or 1.4 percent, to 72,900 jobs. Contributing to declines in both the mining and logging subsector and the professional and business services sector were layoffs at several energy-related firms, including more than 1,000 oilfield workers and corporate and back-office personnel combined at Chevron Corporation and Royal Dutch Shell plc.
The education and health services sector is the largest job sector in the HMA, with 91,900 jobs, and includes the three largest employers in the HMA. Ochsner Health System is the largest employer, with 14,500 employees (Table 3). Tulane Uni-versity and LCMC Health employ 8,600 and 6,100 workers and are the
Table 2. 12-Month Average Nonfarm Payroll Jobs in the New Orleans HMA, by Sector
12 Months EndingAbsolute Change
Percent ChangeSeptember
2014September
2015
Total nonfarm payroll jobs 563,200 563,700 500 0.1Goods-producing sectors 70,700 66,400 – 4,300 – 6.1
Notes: Numbers may not add to totals because of rounding. Based on 12-month averages through September 2014 and September 2015.Source: U.S. Bureau of Labor Statistics
Table 3. Major Employers in the New Orleans HMA
Name of Employer Nonfarm Payroll Sector Number of Employees
Ochsner Health System Education & health services 14,500Tulane University Education & health services 8,600LCMC Health Education & health services 6,100United States Postal Service Government 4,000East Jefferson General Hospital Education & health services 3,650The University of New Orleans Government 3,000Caesars Entertainment Corporation Leisure & hospitality 2,400Acme Truck Line, Inc. Transportation & utilities 2,100New Orleans Police Department Government 2,100St. Tammany Parish Sheriff’s Office Government 2,000
Note: Excludes local school districts. Sources: Local Chambers of Commerce; employers
Economic Conditions Continued
Ne
w O
rle
an
s, L
A •
CO
MP
RE
HE
NS
IVE
HO
US
ING
MA
RK
ET
AN
ALY
SIS
6
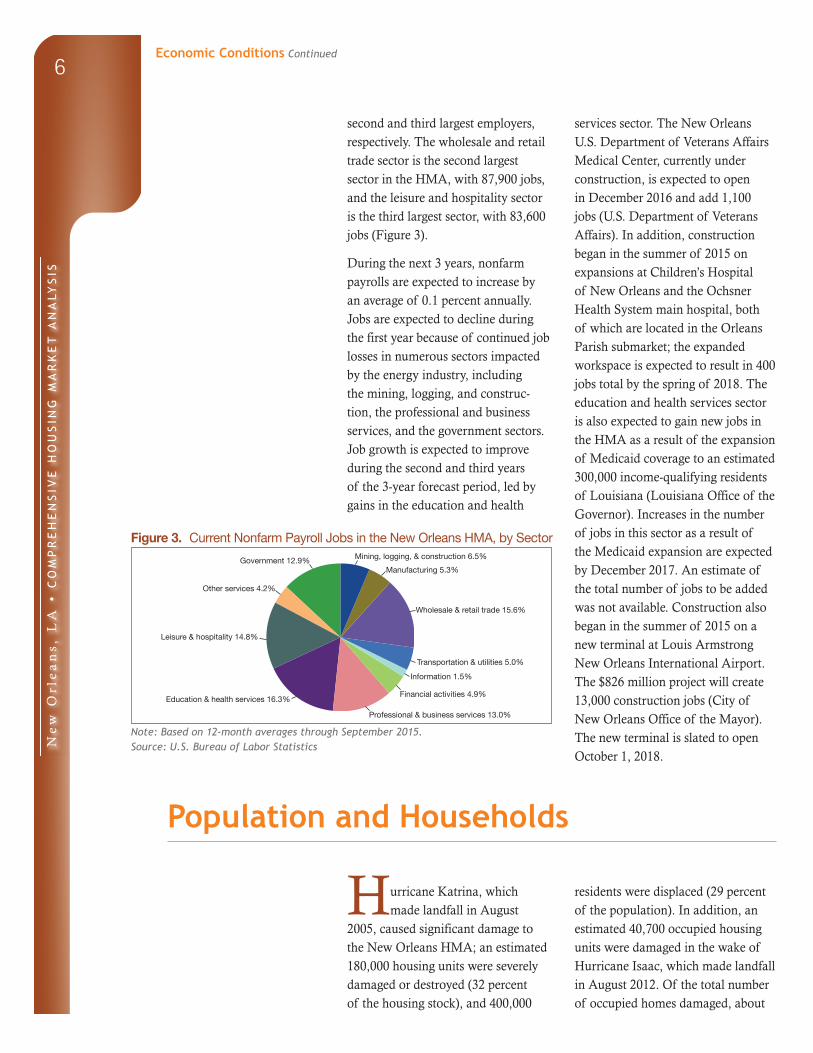
second and third largest employers, respectively. The wholesale and retail trade sector is the second largest sector in the HMA, with 87,900 jobs, and the leisure and hospitality sector is the third largest sector, with 83,600 jobs (Figure 3).
During the next 3 years, nonfarm payrolls are expected to increase by an average of 0.1 percent annually. Jobs are expected to decline during the first year because of continued job losses in numerous sectors impacted by the energy industry, including the mining, logging, and construc-tion, the professional and business services, and the government sectors. Job growth is expected to improve during the second and third years of the 3-year forecast period, led by gains in the education and health
services sector. The New Orleans U.S. Department of Veterans Affairs Medical Center, currently under construction, is expected to open in December 2016 and add 1,100 jobs (U.S. Department of Veterans Affairs). In addition, construction began in the summer of 2015 on expansions at Children’s Hospital of New Orleans and the Ochsner Health System main hospital, both of which are located in the Orleans Parish submarket; the expanded workspace is expected to result in 400 jobs total by the spring of 2018. The education and health services sector is also expected to gain new jobs in the HMA as a result of the expansion of Medicaid coverage to an estimated 300,000 income-qualifying residents of Louisiana (Louisiana Office of the Governor). Increases in the number of jobs in this sector as a result of the Medicaid expansion are expected by December 2017. An estimate of the total number of jobs to be added was not available. Construction also began in the summer of 2015 on a new terminal at Louis Armstrong New Orleans International Airport. The $826 million project will create 13,000 construction jobs (City of New Orleans Office of the Mayor). The new terminal is slated to open October 1, 2018.
Figure 3. Current Nonfarm Payroll Jobs in the New Orleans HMA, by Sector
Note: Based on 12-month averages through September 2015.Source: U.S. Bureau of Labor Statistics
Population and Households
Hurricane Katrina, which made landfall in August
2005, caused significant damage to the New Orleans HMA; an estimated 180,000 housing units were severely damaged or destroyed (32 percent of the housing stock), and 400,000
residents were displaced (29 percent of the population). In addition, an estimated 40,700 occupied housing units were damaged in the wake of Hurricane Isaac, which made landfall in August 2012. Of the total number of occupied homes damaged, about
Economic Conditions Continued
Government 12.9%
Other services 4.2%
Leisure & hospitality 14.8%
Education & health services 16.3%
Wholesale & retail trade 15.6%
Manufacturing 5.3%
Mining, logging, & construction 6.5%
Transportation & utilities 5.0%
Financial activities 4.9%
Professional & business services 13.0%
Information 1.5%
Ne
w O
rle
an
s, L
A •
CO
MP
RE
HE
NS
IVE
HO
US
ING
MA
RK
ET
AN
ALY
SIS
7
3,800 homes were seriously damaged or destroyed. The impact from Hurri-cane Isaac was greatest in St. John the Baptist Parish, where one-eighth of all occupied homes in the parish were severely damaged or destroyed. More than 10 years after the Hurricane Katrina disaster, recovery from that widespread destruction continues, along with recovery from Hurricane Isaac.
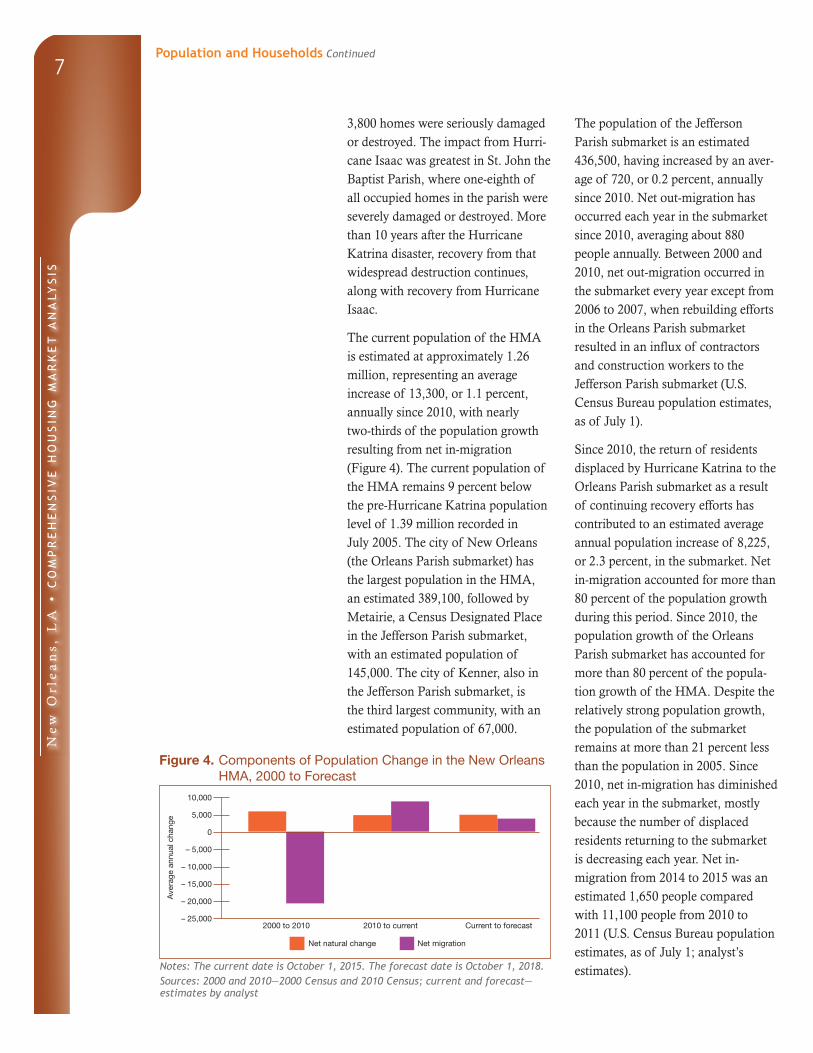
The current population of the HMA is estimated at approximately 1.26 million, representing an average increase of 13,300, or 1.1 percent, annually since 2010, with nearly two-thirds of the population growth resulting from net in-migration (Figure 4). The current population of the HMA remains 9 percent below the pre-Hurricane Katrina population level of 1.39 million recorded in July 2005. The city of New Orleans (the Orleans Parish submarket) has the largest population in the HMA, an estimated 389,100, followed by Metairie, a Census Designated Place in the Jefferson Parish submarket, with an estimated population of 145,000. The city of Kenner, also in the Jefferson Parish submarket, is the third largest community, with an estimated population of 67,000.
The population of the Jefferson Parish submarket is an estimated 436,500, having increased by an aver-age of 720, or 0.2 percent, annually since 2010. Net out-migration has occurred each year in the submarket since 2010, averaging about 880 people annually. Between 2000 and 2010, net out-migration occurred in the submarket every year except from 2006 to 2007, when rebuilding efforts in the Orleans Parish submarket resulted in an influx of contractors and construction workers to the Jefferson Parish submarket (U.S. Census Bureau population estimates, as of July 1).
Since 2010, the return of residents displaced by Hurricane Katrina to the Orleans Parish submarket as a result of continuing recovery efforts has contributed to an estimated average annual population increase of 8,225, or 2.3 percent, in the submarket. Net in-migration accounted for more than 80 percent of the population growth during this period. Since 2010, the population growth of the Orleans Parish submarket has accounted for more than 80 percent of the popula-tion growth of the HMA. Despite the relatively strong population growth, the population of the submarket remains at more than 21 percent less than the population in 2005. Since 2010, net in-migration has diminished each year in the submarket, mostly because the number of displaced residents returning to the submarket is decreasing each year. Net in-migration from 2014 to 2015 was an estimated 1,650 people compared with 11,100 people from 2010 to 2011 (U.S. Census Bureau population estimates, as of July 1; analyst’s estimates).
Figure 4. Components of Population Change in the New Orleans HMA, 2000 to Forecast
Notes: The current date is October 1, 2015. The forecast date is October 1, 2018.Sources: 2000 and 2010—2000 Census and 2010 Census; current and forecast—estimates by analyst
Net natural change Net migration
2000 to 2010 2010 to current Current to forecast
Ave
rage
ann
ual c
hang
e
10,000
5,000
0
– 5,000
– 10,000
– 15,000
– 20,000
– 25,000
Population and Households Continued
Ne
w O
rle
an
s, L
A •
CO
MP
RE
HE
NS
IVE
HO
US
ING
MA
RK
ET
AN
ALY
SIS
8
The current population of the Remainder submarket is estimated at 437,100, representing an increase of 4,300, or 1.0 percent, annually since 2010, with net in-migration comprising 62 percent of the population growth. Of the parishes in the Remainder submarket, St. Tammany Parish recorded the most population growth, increasing by an estimated 2,950 people, or 1.2 percent, to 250,000 people. The city of Slidell, with an estimated popula-tion of 28,000, is the most populous city in the Remainder submarket. Hurricane Katrina recovery efforts in St. Bernard Parish have contributed to an average annual population increase of 1,775 people, or 4.5 percent, to an estimated 45,700 people, or 29 per-cent less than the population in July 2005, before Hurricane Katrina made landfall. Since 2010, the population in Plaquemines, St. Charles, St. James, and St. John the Baptist Parishes has declined by a combined average of 450, or 0.3 percent, annually, to a current population of 141,400. Recovery efforts in these parishes have resulted in the return of nearly all the residents who were displaced by Hurricane Isaac in 2012.
From 2000 to 2005, before Hurricane Katrina, the HMA population increased by an average of 9,275, or 0.7 percent, annually, to nearly 1.39 million. During the same period, population growth occurred in each of the submarkets. The population of the Jefferson Parish submarket recorded only a slight increase of an average of 210, or less than 0.1 percent, annually, to 456,600. During this period, net out-migration occurred in the submarket at an average pace of about 1,900 annually. In the Orleans Parish submarket, the population increased by an average
of 1,825, or 0.4 percent, annually to reach 494,300. Net out-migration occurred in the submarket during this period at an average of 230 people annually. The population of the Remainder submarket recorded an average annual increase of 7,225, or 1.8 percent, to 435,600. More than one-half of the gains that occurred in the HMA during this period were in St. Tammany Parish, where the population increased by an average of 5,050, or 2.5 percent, annually, to 217,400, mostly as a result of an influx of homebuyers from other parishes within the HMA.
After Hurricane Katrina, the HMA population decreased by an estimated 346,200, or 25.0 percent, from 2005 to 2006, to an estimated 1.04 million. The greatest population declines occurred in the Orleans Parish submarket, where damage to homes and businesses was greatest. The population of the submarket decreased during this period by 264,100, or 53.4 percent. Damage in portions of the Jefferson Parish submarket resulted in a population decrease of 30,250, or 6.6 percent. The Remainder submarket population declined by 51,850, or 11.9 percent, during the same period. The adverse impacts caused by Hurricane Katrina were felt most, on a proportional basis, in St. Bernard Parish, where the population decreased from 71,300 in 2005 to 16,550 in 2006, representing a 76.8-percent decline. Homes in Plaquemines Parish were also damaged, causing the population to decline 24.5 percent. St. Charles, St. James, and St. John the Baptist Parishes, in the western portion of the Remainder submarket, were the least impacted by Hurricane Katrina and recorded population growth of 3.5, 2.6, and 4.4 percent, respectively. The
Population and Households Continued
Ne
w O
rle
an
s, L
A •
CO
MP
RE
HE
NS
IVE
HO
US
ING
MA
RK
ET
AN
ALY
SIS
9
population growth in these parishes was partly the result of in-migration of displaced residents from other par-ishes in the HMA. During this period, net in-migration into St. Charles, St. James, and St. John the Baptist Parishes totaled a combined 3,650 people compared with an average net in-migration of 130 residents annually during the previous 5 years. Although homes were also damaged in portions of St. Tammany Parish, the effects were localized in the southern and eastern sections of the parish, and an influx of displaced residents from the Orleans Parish submarket and from St. Bernard Parish to unaffected portions of the parish contributed to a 2.7-percent population increase.
From 2006 to 2010, a considerable rebuilding effort occurred throughout most of the HMA. Repaired and replaced homes, businesses, infrastructure, schools, and hospitals prompted many displaced residents to return to the HMA, resulting in an average population increase of 39,900, or 3.6 percent, annually and returning to about 86 percent of the pre-Hurricane Katrina population level. Gains in population during this period were greatest in the Orleans Parish submarket and in St. Bernard Parish in the Remainder submarket, where the greatest portions of residents were displaced and, consequently, the greatest recovery efforts occurred. In the Orleans Parish submarket, the population increased during this period by an average of 30,300, or 11.3 percent, annually, to 343,800, or about 70 percent of the pre-Hurricane Katrina population level. The population of St. Bernard Parish increased by an average of 5,150, or 22.9 percent, to 35,900, about one-half of the pre-Hurricane Katrina population level. The
population growth in the Remainder submarket overall occurred at an average annual increase of 7,925 people, or 2.0 percent, to a population of 413,500. During the same period, the population of the Jefferson Parish submarket increased moderately, by an average of 1,675, or 0.4 percent, annually, to 432,600. During this period, net out-migration occurred in the submarket at an average pace of more than 350 people annually.
During the next 3 years, the HMA population is expected to increase by an average of 8,675, or 0.7 percent, annually, with net in-migration accounting for nearly 45 percent of the growth. The population growth in the Jefferson Parish submarket is expected to reflect recent trends and average an increase of 600 people, or 0.1 percent, annually. As a result of diminishing recovery efforts and fewer returning displaced residents, the population growth of the Orleans Parish submarket is expected to slow to an average increase of 3,700 people, or 0.9 percent, annually. The population in the Remainder submarket is expected to increase by an estimated 4,400, or 1.0 percent, annually, representing a rate unchanged compared with population growth since 2010.
An estimated 490,700 households are currently in the HMA, represent-ing an increase of an average of 5,050 households, or 1.1 percent, annually since 2010. The Jefferson Parish submarket comprises the greatest portion of households in the HMA, with an estimated 172,350 households, up by 490 households, or 0.3 percent, from 2010. The number of households in the Orleans Parish submarket increased by an average of 3,125, or 2.1 percent, annually, to
Population and Households Continued
Ne
w O
rle
an
s, L
A •
CO
MP
RE
HE
NS
IVE
HO
US
ING
MA
RK
ET
AN
ALY
SIS
10
159,300 households, and the number of households in the Remainder submarket increased by an average of 1,450, or 0.9 percent, annually, to 159,050 households.
From 2000 to 2010, the number of households in the HMA decreased by an average of 4,275, or 0.9 percent, annually, primarily because of hous-ing inventory losses that occurred as a result of damage caused by Hur-ricane Katrina. In the Orleans Parish submarket, the number of households decreased by an average of 4,600, or 2.8 percent, annually. The number of households in the submarket was approximately 73,500 in 2006, representing a 55.0-percent decrease from 163,300 households a year earlier (2006 American Community Survey [ACS]). Reflecting recovery efforts, the number of households in the submarket increased by an estimated average of 18,300 households, or 19.2 percent, annually from 2006 to 2010. The percentage of one-person households in the submarket increased from 31 percent in 2000 to 36 percent in 2010, reflect-ing the effect of damaged schools and infrastructure that Hurricane Katrina caused (U.S. Census Bureau).
In the Jefferson Parish submarket, the number of households declined from 2000 to 2010 by an average of 660, or 0.4 percent, annually. By contrast, the number of households in the Remainder submarket increased by an average of 1,000, or 0.7 percent, annually. Household growth in the Remainder submarket during this period was the result of a significant increase in the number of households in St. Tammany Parish, which aver-aged 1,825, or 2.4 percent, annually. Household growth in St. Tammany Parish during this period reflected an influx of displaced residents after Hurricane Katrina, primarily from the Orleans Parish submarket and from St. Bernard Parish, and a significant increase in appeal to homebuyers from the Orleans Parish and Jefferson Parish submarkets from 2000 through 2006.
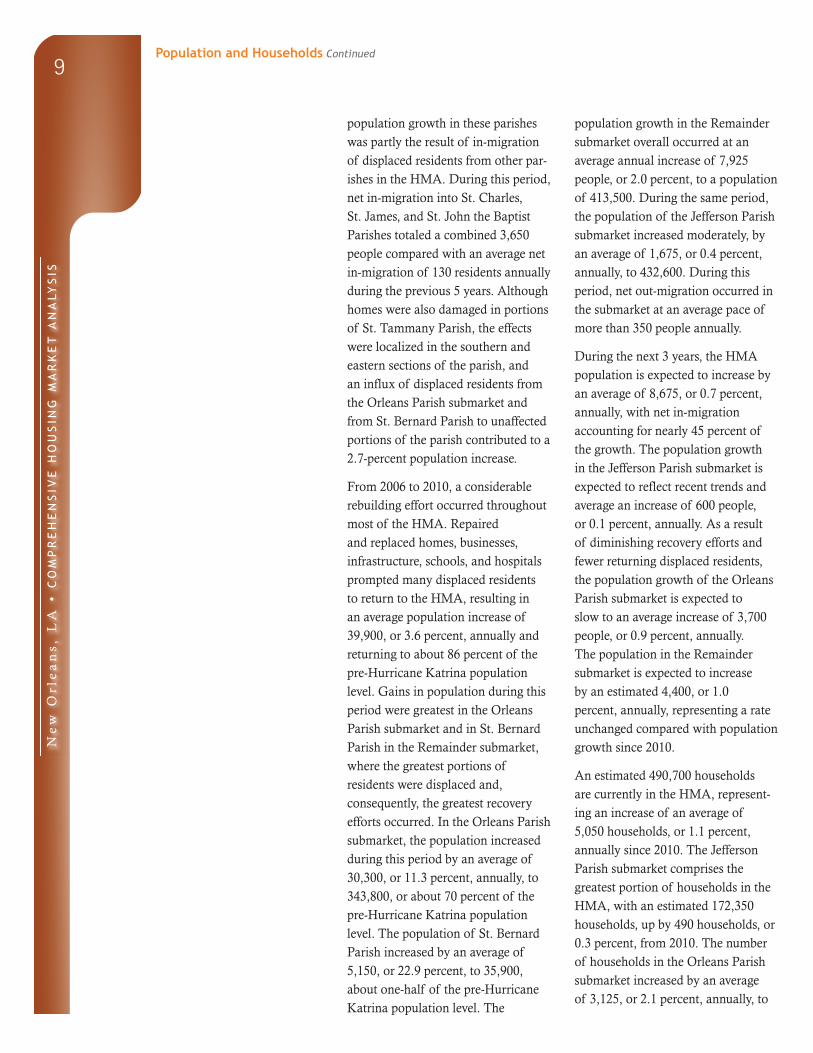
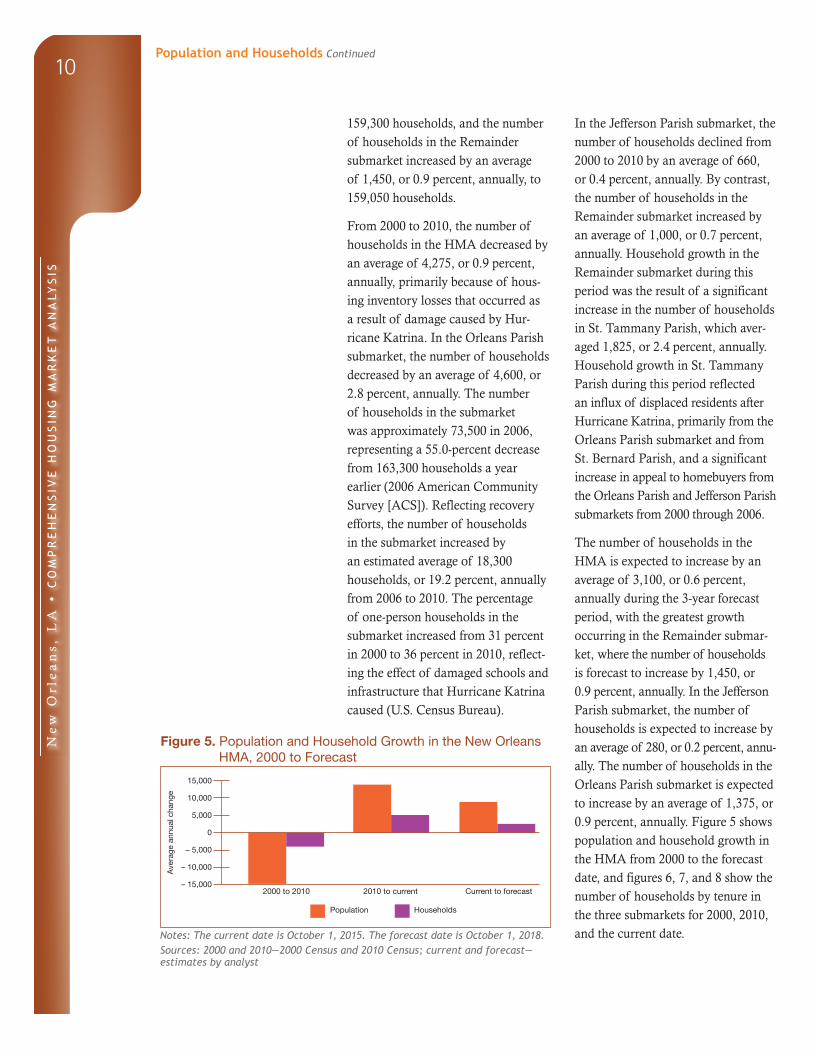
The number of households in the HMA is expected to increase by an average of 3,100, or 0.6 percent, annually during the 3-year forecast period, with the greatest growth occurring in the Remainder submar-ket, where the number of households is forecast to increase by 1,450, or 0.9 percent, annually. In the Jefferson Parish submarket, the number of households is expected to increase by an average of 280, or 0.2 percent, annu-ally. The number of households in the Orleans Parish submarket is expected to increase by an average of 1,375, or 0.9 percent, annually. Figure 5 shows population and household growth in the HMA from 2000 to the forecast date, and figures 6, 7, and 8 show the number of households by tenure in the three submarkets for 2000, 2010, and the current date.
Figure 5. Population and Household Growth in the New Orleans HMA, 2000 to Forecast
Notes: The current date is October 1, 2015. The forecast date is October 1, 2018.Sources: 2000 and 2010—2000 Census and 2010 Census; current and forecast—estimates by analyst
Population and Households Continued
Population Households
2000 to 2010 2010 to current Current to forecast
Ave
rage
ann
ual c
hang
e
15,000
10,000
5,000
0
– 5,000
– 10,000
– 15,000
Ne
w O
rle
an
s, L
A •
CO
MP
RE
HE
NS
IVE
HO
US
ING
MA
RK
ET
AN
ALY
SIS
11
Figure 6. Number of Households by Tenure in the Jefferson Parish Submarket, 2000 to Current
Note: The current date is October 1, 2015.Sources: 2000 and 2010—2000 Census and 2010 Census; current—estimates by analyst
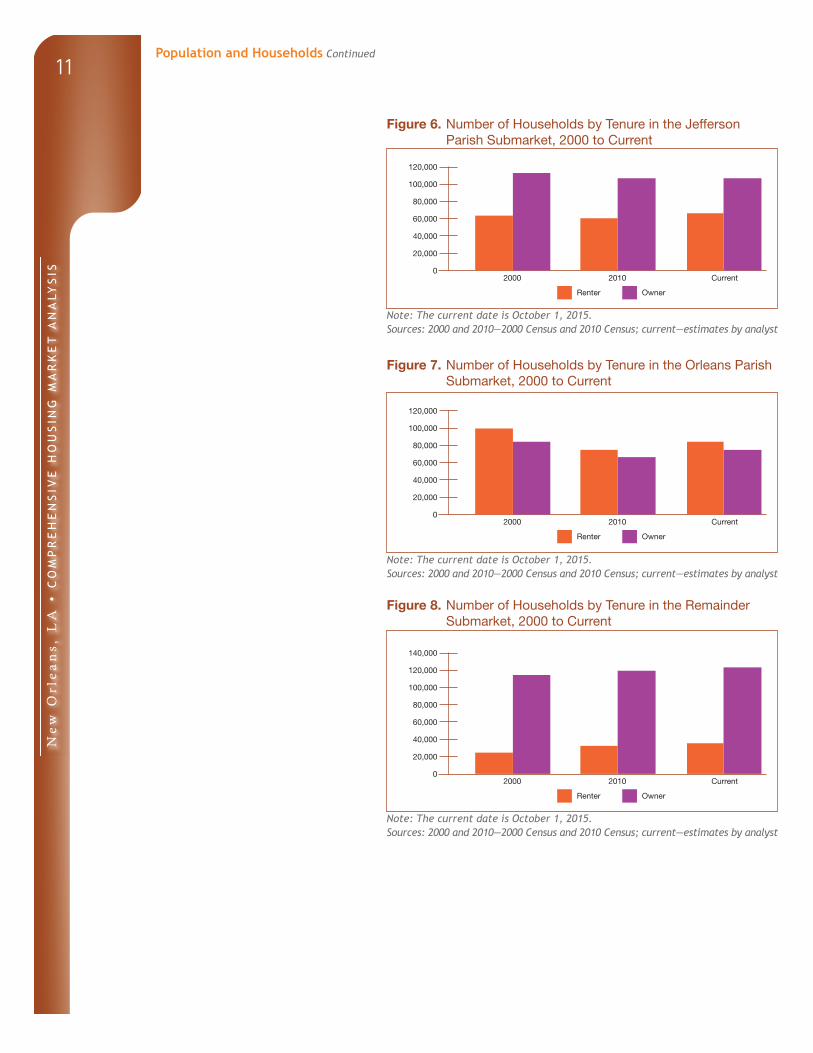
Figure 7. Number of Households by Tenure in the Orleans Parish Submarket, 2000 to Current
Note: The current date is October 1, 2015.Sources: 2000 and 2010—2000 Census and 2010 Census; current—estimates by analyst
Figure 8. Number of Households by Tenure in the Remainder Submarket, 2000 to Current
Note: The current date is October 1, 2015.Sources: 2000 and 2010—2000 Census and 2010 Census; current—estimates by analyst
Population and Households Continued
120,000
100,000
80,000
60,000
40,000
20,000
02000 2010 Current
Renter Owner
120,000
100,000
80,000
60,000
40,000
20,000
02000 2010 Current
Renter Owner
140,000
120,000
100,000
80,000
60,000
40,000
20,000
02000 2010 Current
Renter Owner
Ne
w O
rle
an
s, L
A •
CO
MP
RE
HE
NS
IVE
HO
US
ING
MA
RK
ET
AN
ALY
SIS
12Housing Market Trends
Sales Market—Jefferson Parish Submarket
Hurricane Katrina damaged more than 56,000 owner-occupied homes in the Jefferson Parish submarket in August 2005, which was about one-half of the existing owner-occupied inventory (2005 ACS data). In addition, Hurricane Isaac damaged approximately 9,500 owner-occupied homes in the submarket in August 2012. Virtually all the homes in the submarket that were damaged by these disasters have been repaired, in part, because of numerous government-sponsored programs, including the federally funded program The Road Home. More than $7.58 billion has been awarded in Louisiana since 2006 via The Road Home program, funded by the U.S. Department of Housing and Urban Development (HUD) and administered by the State of Loui-siana, to repair and rebuild homes damaged or destroyed by Hurricanes Katrina and Isaac.
Sales housing market conditions in the submarket are currently slightly tight, with an estimated sales vacancy rate of 1.6 percent, down from 2.2 percent in 2010 (Table DP-2). An estimated 1,700 vacant homes are currently available for sale, reflecting an estimated 3-month supply compared with an estimated 7-month supply in 2010. Contributing to tightening sales housing market conditions since 2010 has been a slowing net out-migration pace and an increased portion of investment-home purchases compared with the portion in the 2000s. The number of homes listed for sale on the Zillow website (unsold inventory) currently totals 1,325 in the submarket, down from 1,350 a year earlier and 1,800 as of April 2010 (Zillow Group). As of September 2015, 5.0 percent of
home loans in the submarket were 90 or more days delinquent, were in foreclosure, or had transitioned into real estate owned (REO) status com-pared with 6.3 percent of mortgages a year earlier and with 8.3 percent in 2010 (CoreLogic, Inc.). The portion of seriously delinquent loans (90 or more days delinquent or in foreclo-sure) and REO properties averaged 2.0 percent of home loans during the early 2000s, before Hurricane Katrina made landfall. As a result of damage caused by Hurricane Katrina, the percentage of seriously delinquent loans and REO properties increased to a rate of 20.2 percent by November 2005 before decreasing to a rate of 3.6 percent by the end of 2007. The portion of seriously delinquent loans and REO properties began to increase during 2008, reflecting the national economic downturn, and continued this trend until reaching a postrecession peak level of 8.6 percent in January 2011. Since early 2011, the percentage of seriously delinquent loans and REO properties has steadily decreased.
During the 12 months ending Sep-tember 2015, new and existing home sales (including single-family homes, townhomes, and condominiums) in the submarket increased by 600 homes, or 10 percent, to 6,450 homes sold compared with the number sold a year earlier, and the average price increased by $9,850, or 6 percent, to $172,800 (CoreLogic, Inc., with adjustments by the analyst). By comparison, home sales increased 2 percent during the 12 months ending September 2014, and the average price decreased 1 percent during the same period. Distressed sales (REO and short sales) have accounted for 23 percent
Ne
w O
rle
an
s, L
A •
CO
MP
RE
HE
NS
IVE
HO
US
ING
MA
RK
ET
AN
ALY
SIS
13
of existing sales since 2010 compared with approximately 4 percent of exist-ing sales during the 2000s (CoreLogic, Inc., with adjustments by the analyst).
From 2000 through 2005, the number of new and existing home sales increased by an average of 660, or 11 percent, annually to 7,850 homes sold. During 2006, home sales peaked at 10,750 homes sold, partly because of increased demand stemming from in-migration of displaced Orleans Parish submarket and St. Bernard Parish residents. From 2007 through 2010, home sales declined by an average of 1,650, or 21 percent, annually to 4,200 homes sold, in part the result of home rebuilding efforts in the Orleans Parish submarket and in St. Bernard Parish, which resulted in competitive home sales prices for prospective homebuyers. Tightened mortgage lending standards leading to an increased preference to rent also contributed to the decline in home sales in the submarket during this period. Adjustable rate mortgages comprised only 1 percent of home loans in the submarket in 2010 compared with nearly 20 percent in 2006 (Metrostudy, A Hanley Wood Company). New and existing home sales increased from 2011 through 2013 by 560, or 12 percent, to 5,900 homes sold. Contributing to increased home sales during this period was a significant increase in investment purchases. Absentee-owner sales, which include primarily investment or second-home purchases, comprised 35 percent of total sales in the submarket during this period, up from 23 percent from 2005 through 2010 (Metrostudy, A Hanley Wood Company). From 2011 through 2013, an estimated one-third of absentee-owner home sales were purchased by rental property investment companies.
The average price for new and exist-ing homes in the submarket increased each year from 2000 through 2007. During this period, the average price for a home increased by an average of $9,400, or 6 percent, annually, to $185,000. New and existing home sale prices decreased from 2008 through 2009 by an average of $9,500, or 5 percent, annually, to $166,000, as a result of decreased home sales demand during the same period. From 2010 through 2013, the average price for new and existing homes continued to decline, with the average price decreasing by an average of $830, or 1 percent, annu-ally, to $162,600. The average home price decreased during this period primarily because of an increased portion of total sales comprising distressed sales, which reached a peak level of 26 percent of total home sales during 2013. Also contributing to the decrease in the average price for new and existing homes from 2010 through 2013 was a decline in the average price of distressed home sales, which decreased by an average of $7,750, or 6 percent, annually, to $108,500. By comparison, the average price for new construction homes and regular resale home sales increased by an average of $1,300, or 1 percent, annually, to $177,300, during the same period.
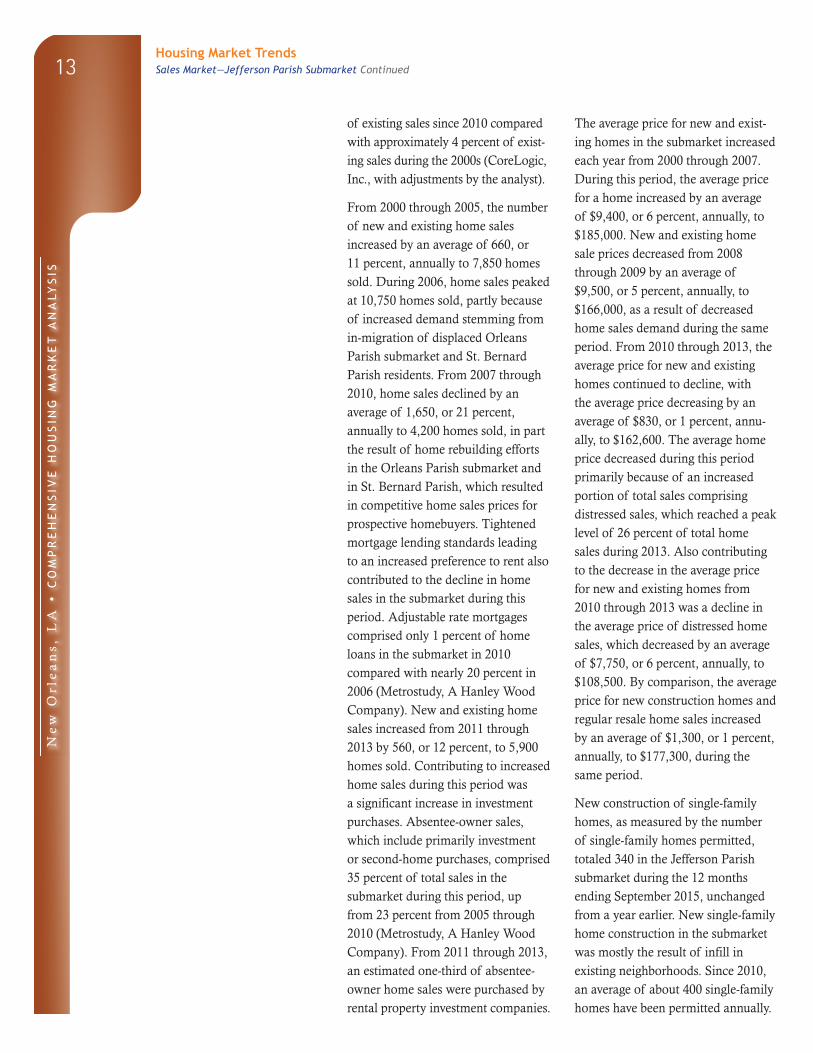
New construction of single-family homes, as measured by the number of single-family homes permitted, totaled 340 in the Jefferson Parish submarket during the 12 months ending September 2015, unchanged from a year earlier. New single-family home construction in the submarket was mostly the result of infill in existing neighborhoods. Since 2010, an average of about 400 single-family homes have been permitted annually.
Housing Market TrendsSales Market—Jefferson Parish Submarket Continued
Ne
w O
rle
an
s, L
A •
CO
MP
RE
HE
NS
IVE
HO
US
ING
MA
RK
ET
AN
ALY
SIS
14
Approximately 20 percent of new home construction in the submarket during this period was the result of replacements of homes destroyed by Hurricane Katrina via The Road
Home program. During the 2000s, home construction peaked from 2007 through 2008, averaging 2,025 homes permitted annually. The Road Home program-related construction accounted for an average of 1,250, or 62 percent, of homes permitted during this period. New home construction was also strong from 2002 through 2004, when an average of 1,100 new homes were permitted annually. Figure 9 shows the number of single-family homes permitted in the submarket.
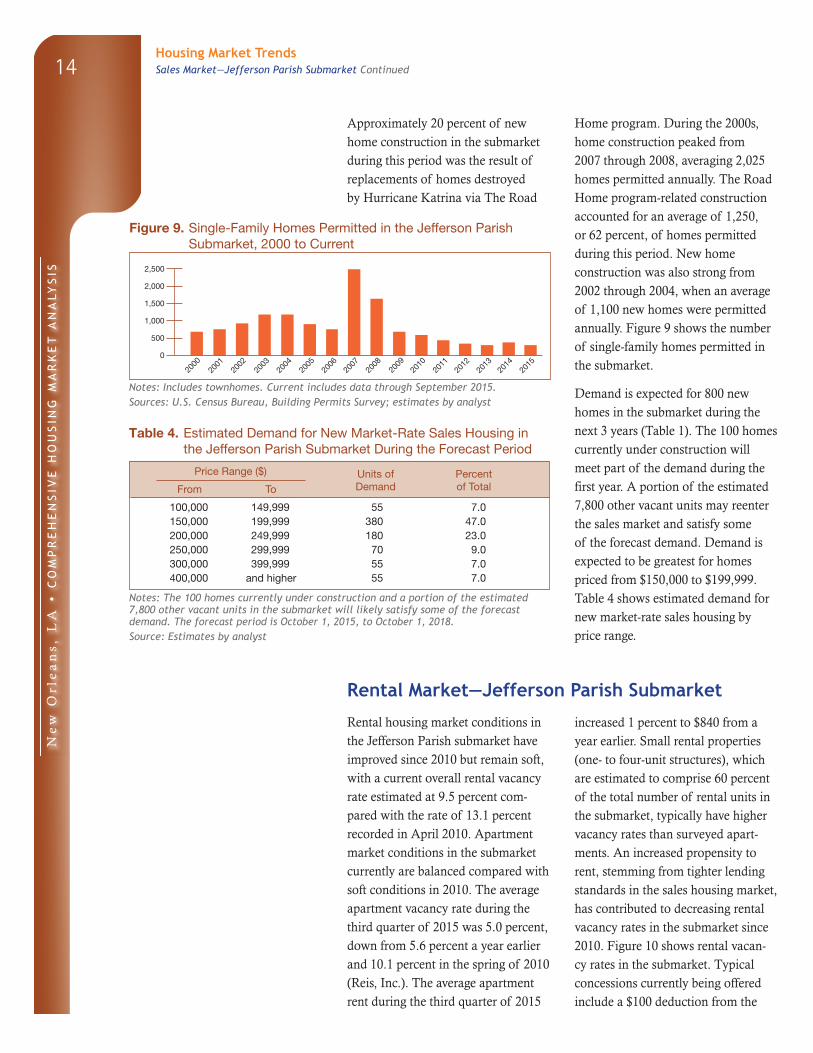
Demand is expected for 800 new homes in the submarket during the next 3 years (Table 1). The 100 homes currently under construction will meet part of the demand during the first year. A portion of the estimated 7,800 other vacant units may reenter the sales market and satisfy some of the forecast demand. Demand is expected to be greatest for homes priced from $150,000 to $199,999. Table 4 shows estimated demand for new market-rate sales housing by price range.
Figure 9. Single-Family Homes Permitted in the Jefferson Parish Submarket, 2000 to Current
Notes: Includes townhomes. Current includes data through September 2015.Sources: U.S. Census Bureau, Building Permits Survey; estimates by analyst
Table 4. Estimated Demand for New Market-Rate Sales Housing in the Jefferson Parish Submarket During the Forecast Period
Price Range ($) Units of PercentFrom To Demand of Total
Notes: The 100 homes currently under construction and a portion of the estimated 7,800 other vacant units in the submarket will likely satisfy some of the forecast demand. The forecast period is October 1, 2015, to October 1, 2018.Source: Estimates by analyst
Rental Market—Jefferson Parish Submarket
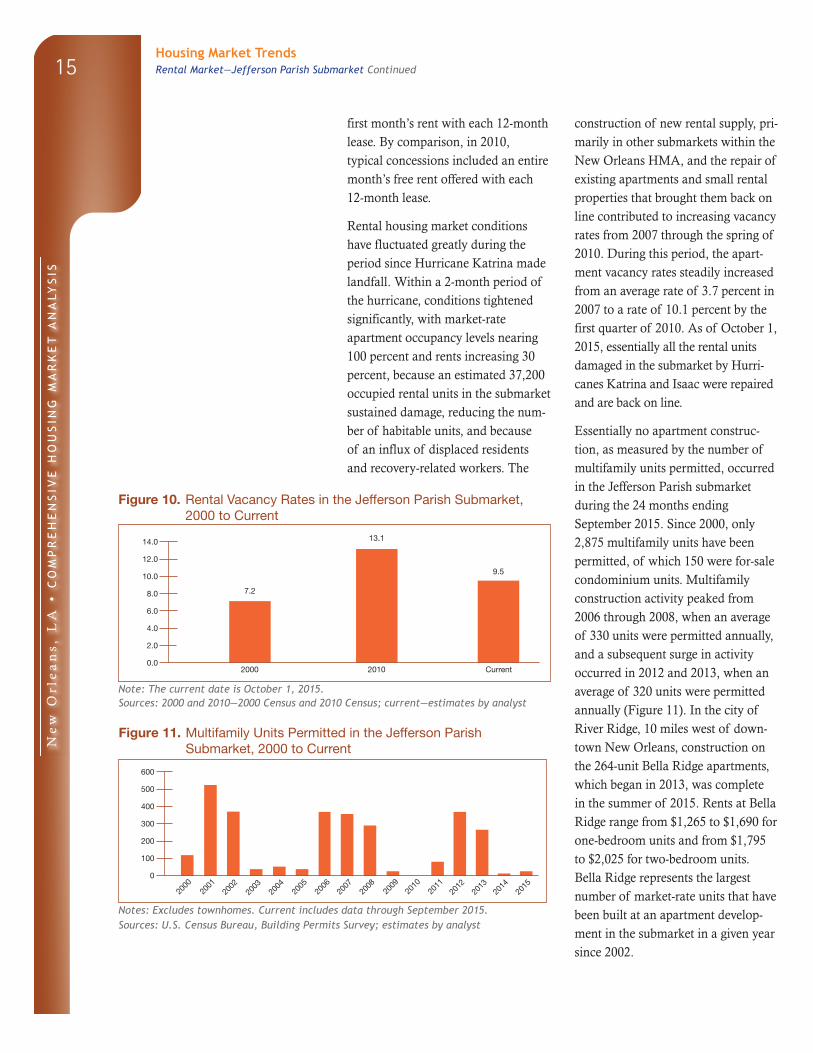
Rental housing market conditions in the Jefferson Parish submarket have improved since 2010 but remain soft, with a current overall rental vacancy rate estimated at 9.5 percent com-pared with the rate of 13.1 percent recorded in April 2010. Apartment market conditions in the submarket currently are balanced compared with soft conditions in 2010. The average apartment vacancy rate during the third quarter of 2015 was 5.0 percent, down from 5.6 percent a year earlier and 10.1 percent in the spring of 2010 (Reis, Inc.). The average apartment rent during the third quarter of 2015
increased 1 percent to $840 from a year earlier. Small rental properties (one- to four-unit structures), which are estimated to comprise 60 percent of the total number of rental units in the submarket, typically have higher vacancy rates than surveyed apart-ments. An increased propensity to rent, stemming from tighter lending standards in the sales housing market, has contributed to decreasing rental vacancy rates in the submarket since 2010. Figure 10 shows rental vacan-cy rates in the submarket. Typical concessions currently being offered include a $100 deduction from the
Housing Market TrendsSales Market—Jefferson Parish Submarket Continued
2000
2001
2002
2003
2004
2005
2006
2,500
2,000
1,500
1,000
500
0
2008
2009
2010
2011
2013
2015
2014
2012
2007
Ne
w O
rle
an
s, L
A •
CO
MP
RE
HE
NS
IVE
HO
US
ING
MA
RK
ET
AN
ALY
SIS
15
first month’s rent with each 12-month lease. By comparison, in 2010, typical concessions included an entire month’s free rent offered with each 12-month lease.
Rental housing market conditions have fluctuated greatly during the period since Hurricane Katrina made landfall. Within a 2-month period of the hurricane, conditions tightened significantly, with market-rate apartment occupancy levels nearing 100 percent and rents increasing 30 percent, because an estimated 37,200 occupied rental units in the submarket sustained damage, reducing the num-ber of habitable units, and because of an influx of displaced residents and recovery-related workers. The
construction of new rental supply, pri-marily in other submarkets within the New Orleans HMA, and the repair of existing apartments and small rental properties that brought them back on line contributed to increasing vacancy rates from 2007 through the spring of 2010. During this period, the apart-ment vacancy rates steadily increased from an average rate of 3.7 percent in 2007 to a rate of 10.1 percent by the first quarter of 2010. As of October 1, 2015, essentially all the rental units damaged in the submarket by Hurri-canes Katrina and Isaac were repaired and are back on line.
Essentially no apartment construc-tion, as measured by the number of multifamily units permitted, occurred in the Jefferson Parish submarket during the 24 months ending September 2015. Since 2000, only 2,875 multifamily units have been permitted, of which 150 were for-sale condominium units. Multifamily construction activity peaked from 2006 through 2008, when an average of 330 units were permitted annually, and a subsequent surge in activity occurred in 2012 and 2013, when an average of 320 units were permitted annually (Figure 11). In the city of River Ridge, 10 miles west of down-town New Orleans, construction on the 264-unit Bella Ridge apartments, which began in 2013, was complete in the summer of 2015. Rents at Bella Ridge range from $1,265 to $1,690 for one-bedroom units and from $1,795 to $2,025 for two-bedroom units. Bella Ridge represents the largest number of market-rate units that have been built at an apartment develop-ment in the submarket in a given year since 2002.
Figure 10. Rental Vacancy Rates in the Jefferson Parish Submarket, 2000 to Current
Note: The current date is October 1, 2015.Sources: 2000 and 2010—2000 Census and 2010 Census; current—estimates by analyst
Figure 11. Multifamily Units Permitted in the Jefferson Parish Submarket, 2000 to Current
Notes: Excludes townhomes. Current includes data through September 2015.Sources: U.S. Census Bureau, Building Permits Survey; estimates by analyst
2000 2010 Current
7.2
13.1
9.5
14.0
12.0
10.0
8.0
6.0
4.0
2.0
0.0
Housing Market TrendsRental Market—Jefferson Parish Submarket Continued
2000
2001
2002
2003
2004
2005
2006
600
500
400
300
200
100
0
2008
2009
2010
2011
2013
2015
2014
2012
2007
Ne
w O
rle
an
s, L
A •
CO
MP
RE
HE
NS
IVE
HO
US
ING
MA
RK
ET
AN
ALY
SIS
16
During the 3-year forecast period, the existing inventory of vacant available units for rent is expected to satisfy all the demand (Table 1). To prevent prolonged soft market conditions, no construction of additional units should be completed during the
forecast period. The construction of additional units should not begin until the third year of the forecast period to meet an anticipated demand for 300 units in the fourth year and 450 units in the fifth year.
Sales Market—Orleans Parish Submarket
The sales housing market in the Orleans Parish submarket has not entirely recovered from the effects of Hurricane Katrina, although it has made great strides. The hurricane damaged more than 66,600 owner-occupied homes in the submarket, which was about 81 percent of the existing owner-occupied inventory (2005 ACS data), of which more than 44,000 homes were severely damaged or completely destroyed. Homeowners have either repaired or rebuilt an estimated 47,000 homes using funds from The Road Home program. Many homes remain uninhabitable and abandoned, however, despite the demolition of more than 30,000 homes since 2005, 7,500 of which have been demolished since 2010. Efforts by the City of New Orleans and the New Orleans Redevelopment Authority to mitigate blight in the submarket are ongoing via numerous homebuyer incentive and neighborhood redevelopment programs. Among the numerous hazards and health risks associated with blight in the submarket are those related to mold. Of homes sampled in the submarket in March 2006, 44 percent showed visible signs of mold (National Institutes of Health, 2008 report).
Sales market conditions in the submarket currently are slightly tight compared with soft conditions in
2010. As of October 1, 2015, the sales vacancy rate was an estimated 1.7 percent (Table DP-3), significantly improved compared with a rate of 4.6 percent in 2010. The number of vacant homes currently available for sale is estimated at 1,250 homes, re-flecting an estimated 3-month supply compared with an estimated 9-month supply in 2010. Strong population growth has contributed to improved sales market conditions since 2010. Unsold inventory in the submarket currently totals 1,050, up from 890 a year earlier but down from 1,600 as of April 2010 (Zillow Group). As of September 2015, 4.7 percent of home loans in the submarket were 90 or more days delinquent, were in foreclosure, or had transitioned into REO status compared with 6.1 percent of mortgage loans a year earlier and with 10.1 percent in 2010 (CoreLogic, Inc.). The portion of seriously delinquent loans and REO properties averaged 4.0 percent of home loans during the early 2000s, before Hurricane Katrina made landfall. As a result of damage caused by Hurricane Katrina, the percentage of seriously delinquent loans and REO properties increased to a rate of 42.2 percent by December 2005 before decreasing to a rate of 6.4 percent by June 2008. The portion of seriously delinquent loans and REO properties began to increase during the latter half of 2008, reflecting the
Housing Market TrendsRental Market—Jefferson Parish Submarket Continued
Ne
w O
rle
an
s, L
A •
CO
MP
RE
HE
NS
IVE
HO
US
ING
MA
RK
ET
AN
ALY
SIS
17
national economic downturn, and continued this trend until reaching a postrecession peak of 10.3 percent in January 2010. Since early 2010, the percentage of seriously delinquent loans and REO properties has steadily decreased.
During the 12-month period ending September 2015, new and existing home sales (including single-family homes, townhomes, and condo-miniums) increased by 160 homes, or more than 3 percent, to 6,000 homes compared with the number sold a year earlier, representing the greatest number of homes sold since the 12 months ending November 2008 (CoreLogic, Inc., with adjustments by the analyst). The average home price increased by $8,850, or 4 percent, to $244,200, during the 12 months end-ing September 2015. Since December 2007, the Home Price Index (HPI) for the submarket has increased an average of 2.3 percent annually (CoreLogic, Inc.). By comparison, the national HPI declined an average of 0.3 percent annually during the same period. Contributing to increased home prices in the submarket since 2007 have been relatively high costs of construction material, additional home rebuilding costs associated with meet-ing new government flood-elevation standards, and increased costs for flood insurance. The number of new home sales more than doubled in the submarket during the 12 months ending September 2015, increasing by 190 homes, or 131 percent, to 330 homes sold. The average price for new homes increased during the 12 months ending September 2015 by $26,150, or 7 percent, to $384,400. Absentee-owner sales accounted for nearly one-half of new home sales during this period compared with less than one-fifth of the sales during the
same period a year earlier (Metro-study, A Hanley Wood Company).
Condominium sales, which historical-ly comprise approximately 7 percent of total home sales in the submarket, increased by 190 units, or nearly 60 percent, to 510, during the 12 months ending September 2015, and the average price increased by $69,400, or 25 percent, to $348,100, during the same period (Metrostudy, A Hanley Wood Company, with adjustments by the analyst). Contributing to the increased average price for condo-miniums were sales at 425 Notre Dame condominiums, an upscale development in the New Orleans central business district (CBD), which was completed in the spring of 2015. As of October 1, 2015, 15 one-, two- and three-bedroom condominiums, ranging from 600 to 2,350 square feet, sold for an average price of $1.30 million at the 42-unit development.
From 2000 through July 2005, new and existing home sales in the sub-market averaged an estimated 3,100 homes sold annually. During the 12 months ending August 2006, approxi-mately 2,400 new and existing homes sold. The relatively fewer home sales during this period reflected significant hurricane damage to existing homes and infrastructure. During the 12 months ending December 2007, home sales increased to 7,450 homes sold as a result of recovery efforts and the subsequent return of displaced residents. Of the total number of homes sold during this period, only 50 were new construction sales. From 2008 through 2012, home sales declined by an average of 650, or 11 percent, annually, to 4,250 homes sold. Factors contributing to the decline in home sales during this period include tightened mortgage
Housing Market TrendsSales Market—Orleans Parish Submarket Continued
Ne
w O
rle
an
s, L
A •
CO
MP
RE
HE
NS
IVE
HO
US
ING
MA
RK
ET
AN
ALY
SIS
18
lending standards and, consequently, an increased preference among residents to rent. Also contributing to a decrease in home sales during this period was a decrease in the number of jobs from mid-2009 through 2010 and moderating population and household growth. New home sales during this period accounted for less than 2 percent of total sales. New and existing home prices increased from 2008 through 2012 by an average of $9,750, or 6 percent, annually, to $199,800.
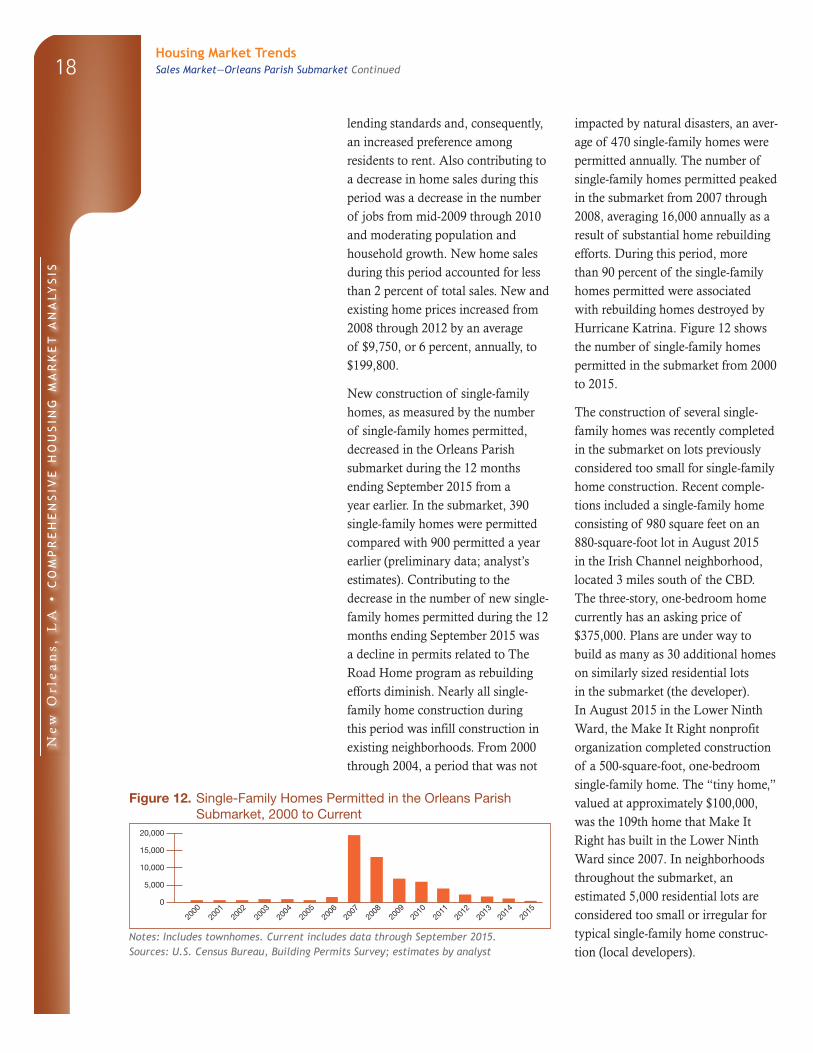
New construction of single-family homes, as measured by the number of single-family homes permitted, decreased in the Orleans Parish submarket during the 12 months ending September 2015 from a year earlier. In the submarket, 390 single-family homes were permitted compared with 900 permitted a year earlier (preliminary data; analyst’s estimates). Contributing to the decrease in the number of new single-family homes permitted during the 12 months ending September 2015 was a decline in permits related to The Road Home program as rebuilding efforts diminish. Nearly all single-family home construction during this period was infill construction in existing neighborhoods. From 2000 through 2004, a period that was not
impacted by natural disasters, an aver-age of 470 single-family homes were permitted annually. The number of single-family homes permitted peaked in the submarket from 2007 through 2008, averaging 16,000 annually as a result of substantial home rebuilding efforts. During this period, more than 90 percent of the single-family homes permitted were associated with rebuilding homes destroyed by Hurricane Katrina. Figure 12 shows the number of single-family homes permitted in the submarket from 2000 to 2015.
The construction of several single-family homes was recently completed in the submarket on lots previously considered too small for single-family home construction. Recent comple-tions included a single-family home consisting of 980 square feet on an 880-square-foot lot in August 2015 in the Irish Channel neighborhood, located 3 miles south of the CBD. The three-story, one-bedroom home currently has an asking price of $375,000. Plans are under way to build as many as 30 additional homes on similarly sized residential lots in the submarket (the developer). In August 2015 in the Lower Ninth Ward, the Make It Right nonprofit organization completed construction of a 500-square-foot, one-bedroom single-family home. The “tiny home,” valued at approximately $100,000, was the 109th home that Make It Right has built in the Lower Ninth Ward since 2007. In neighborhoods throughout the submarket, an estimated 5,000 residential lots are considered too small or irregular for typical single-family home construc-tion (local developers).
Figure 12. Single-Family Homes Permitted in the Orleans Parish Submarket, 2000 to Current
Notes: Includes townhomes. Current includes data through September 2015.Sources: U.S. Census Bureau, Building Permits Survey; estimates by analyst
2000
2001
2002
2003
2004
2005
2006
20,000
15,000
10,000
5,000
0
2008
2009
2010
2011
2013
2015
2014
2012
2007
Housing Market TrendsSales Market—Orleans Parish Submarket Continued
Ne
w O
rle
an
s, L
A •
CO
MP
RE
HE
NS
IVE
HO
US
ING
MA
RK
ET
AN
ALY
SIS
19
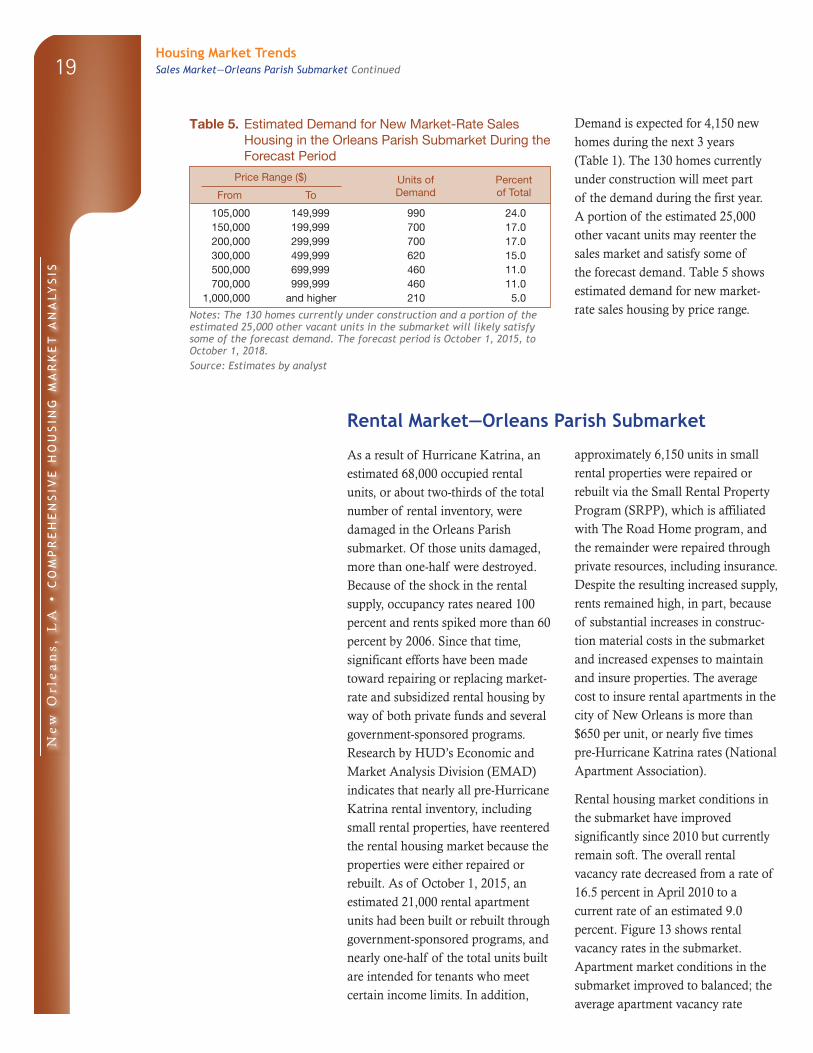
Demand is expected for 4,150 new homes during the next 3 years (Table 1). The 130 homes currently under construction will meet part of the demand during the first year. A portion of the estimated 25,000 other vacant units may reenter the sales market and satisfy some of the forecast demand. Table 5 shows estimated demand for new market-rate sales housing by price range.
Table 5. Estimated Demand for New Market-Rate Sales Housing in the Orleans Parish Submarket During the Forecast Period
Price Range ($) Units of PercentFrom To Demand of Total
Notes: The 130 homes currently under construction and a portion of the estimated 25,000 other vacant units in the submarket will likely satisfy some of the forecast demand. The forecast period is October 1, 2015, to October 1, 2018.Source: Estimates by analyst
Rental Market—Orleans Parish Submarket
As a result of Hurricane Katrina, an estimated 68,000 occupied rental units, or about two-thirds of the total number of rental inventory, were damaged in the Orleans Parish submarket. Of those units damaged, more than one-half were destroyed. Because of the shock in the rental supply, occupancy rates neared 100 percent and rents spiked more than 60 percent by 2006. Since that time, significant efforts have been made toward repairing or replacing market-rate and subsidized rental housing by way of both private funds and several government-sponsored programs. Research by HUD’s Economic and Market Analysis Division (EMAD) indicates that nearly all pre-Hurricane Katrina rental inventory, including small rental properties, have reentered the rental housing market because the properties were either repaired or rebuilt. As of October 1, 2015, an estimated 21,000 rental apartment units had been built or rebuilt through government-sponsored programs, and nearly one-half of the total units built are intended for tenants who meet certain income limits. In addition,
approximately 6,150 units in small rental properties were repaired or rebuilt via the Small Rental Property Program (SRPP), which is affiliated with The Road Home program, and the remainder were repaired through private resources, including insurance. Despite the resulting increased supply, rents remained high, in part, because of substantial increases in construc-tion material costs in the submarket and increased expenses to maintain and insure properties. The average cost to insure rental apartments in the city of New Orleans is more than $650 per unit, or nearly five times pre-Hurricane Katrina rates (National Apartment Association).
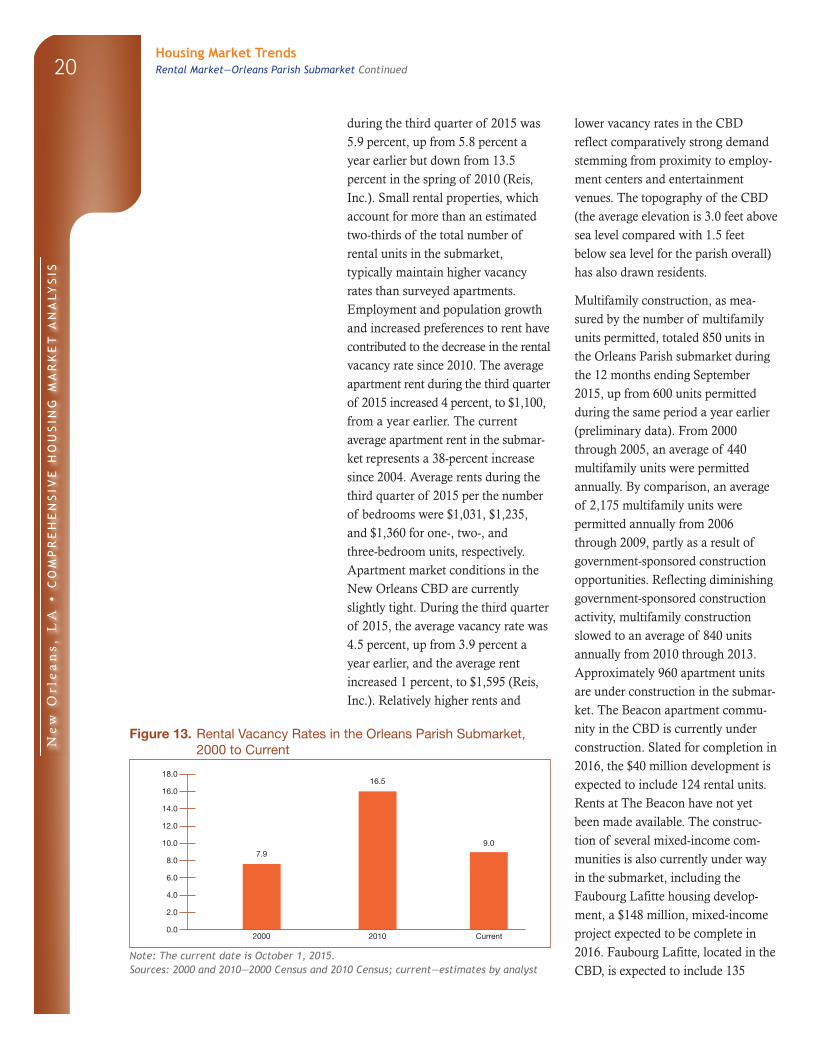
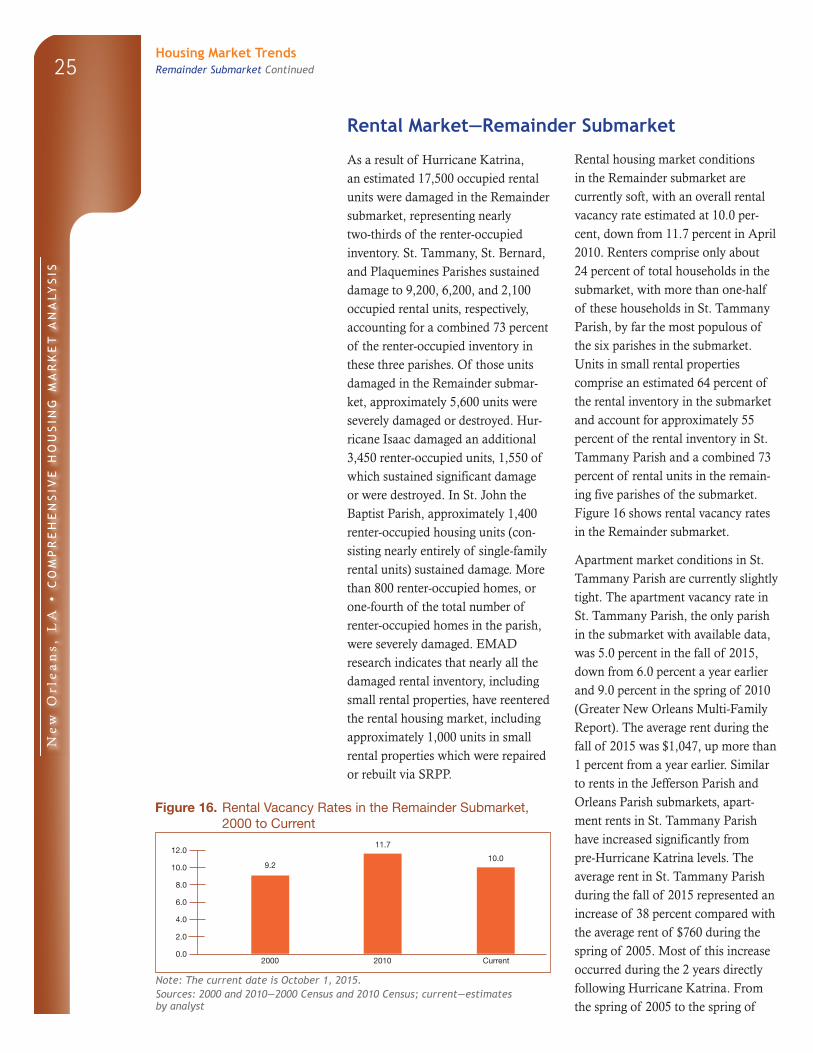
Rental housing market conditions in the submarket have improved significantly since 2010 but currently remain soft. The overall rental vacancy rate decreased from a rate of 16.5 percent in April 2010 to a current rate of an estimated 9.0 percent. Figure 13 shows rental vacancy rates in the submarket. Apartment market conditions in the submarket improved to balanced; the average apartment vacancy rate
Housing Market TrendsSales Market—Orleans Parish Submarket Continued
Ne
w O
rle
an
s, L
A •
CO
MP
RE
HE
NS
IVE
HO
US
ING
MA
RK
ET
AN
ALY
SIS
20
during the third quarter of 2015 was 5.9 percent, up from 5.8 percent a year earlier but down from 13.5 percent in the spring of 2010 (Reis, Inc.). Small rental properties, which account for more than an estimated two-thirds of the total number of rental units in the submarket, typically maintain higher vacancy rates than surveyed apartments. Employment and population growth and increased preferences to rent have contributed to the decrease in the rental vacancy rate since 2010. The average apartment rent during the third quarter of 2015 increased 4 percent, to $1,100, from a year earlier. The current average apartment rent in the submar-ket represents a 38-percent increase since 2004. Average rents during the third quarter of 2015 per the number of bedrooms were $1,031, $1,235, and $1,360 for one-, two-, and three-bedroom units, respectively. Apartment market conditions in the New Orleans CBD are currently slightly tight. During the third quarter of 2015, the average vacancy rate was 4.5 percent, up from 3.9 percent a year earlier, and the average rent increased 1 percent, to $1,595 (Reis, Inc.). Relatively higher rents and
lower vacancy rates in the CBD reflect comparatively strong demand stemming from proximity to employ-ment centers and entertainment venues. The topography of the CBD (the average elevation is 3.0 feet above sea level compared with 1.5 feet below sea level for the parish overall) has also drawn residents.
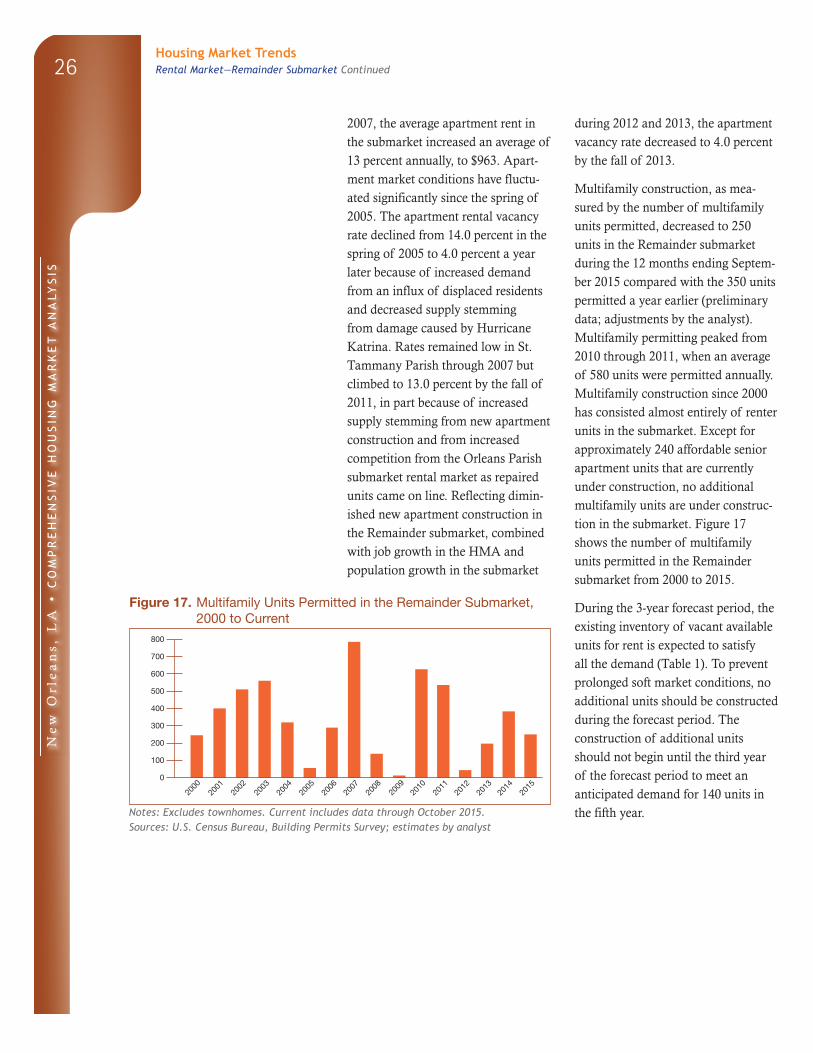
Multifamily construction, as mea-sured by the number of multifamily units permitted, totaled 850 units in the Orleans Parish submarket during the 12 months ending September 2015, up from 600 units permitted during the same period a year earlier (preliminary data). From 2000 through 2005, an average of 440 multifamily units were permitted annually. By comparison, an average of 2,175 multifamily units were permitted annually from 2006 through 2009, partly as a result of government-sponsored construction opportunities. Reflecting diminishing government-sponsored construction activity, multifamily construction slowed to an average of 840 units annually from 2010 through 2013. Approximately 960 apartment units are under construction in the submar-ket. The Beacon apartment commu-nity in the CBD is currently under construction. Slated for completion in 2016, the $40 million development is expected to include 124 rental units. Rents at The Beacon have not yet been made available. The construc-tion of several mixed-income com-munities is also currently under way in the submarket, including the Faubourg Lafitte housing develop-ment, a $148 million, mixed-income project expected to be complete in 2016. Faubourg Lafitte, located in the CBD, is expected to include 135
Figure 13. Rental Vacancy Rates in the Orleans Parish Submarket, 2000 to Current
Note: The current date is October 1, 2015.Sources: 2000 and 2010—2000 Census and 2010 Census; current—estimates by analyst
Housing Market TrendsRental Market—Orleans Parish Submarket Continued
2000 2010 Current
7.9
16.5
9.0
18.0
16.0
14.0
12.0
10.0
8.0
6.0
4.0
2.0
0.0
Ne
w O
rle
an
s, L
A •
CO
MP
RE
HE
NS
IVE
HO
US
ING
MA
RK
ET
AN
ALY
SIS
21
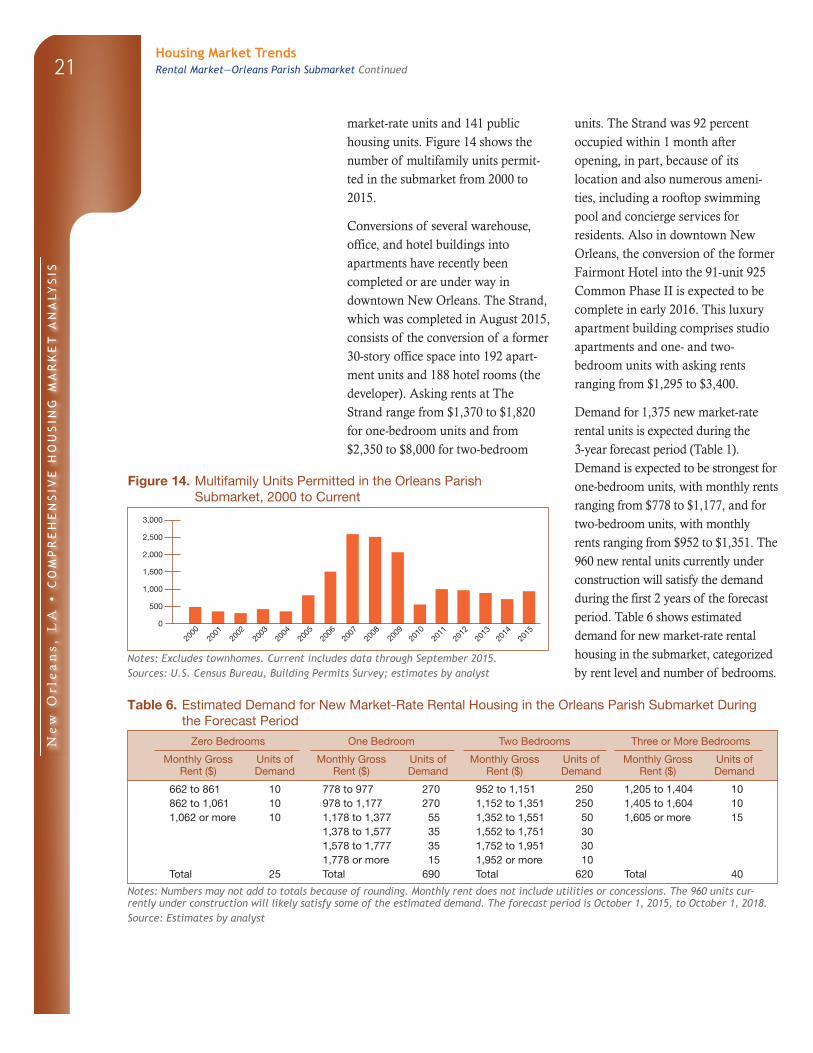
market-rate units and 141 public housing units. Figure 14 shows the number of multifamily units permit-ted in the submarket from 2000 to 2015.
Conversions of several warehouse, office, and hotel buildings into apartments have recently been completed or are under way in downtown New Orleans. The Strand, which was completed in August 2015, consists of the conversion of a former 30-story office space into 192 apart-ment units and 188 hotel rooms (the developer). Asking rents at The Strand range from $1,370 to $1,820 for one-bedroom units and from $2,350 to $8,000 for two-bedroom
units. The Strand was 92 percent occupied within 1 month after opening, in part, because of its location and also numerous ameni-ties, including a rooftop swimming pool and concierge services for residents. Also in downtown New Orleans, the conversion of the former Fairmont Hotel into the 91-unit 925 Common Phase II is expected to be complete in early 2016. This luxury apartment building comprises studio apartments and one- and two-bedroom units with asking rents ranging from $1,295 to $3,400.
Demand for 1,375 new market-rate rental units is expected during the 3-year forecast period (Table 1). Demand is expected to be strongest for one-bedroom units, with monthly rents ranging from $778 to $1,177, and for two-bedroom units, with monthly rents ranging from $952 to $1,351. The 960 new rental units currently under construction will satisfy the demand during the first 2 years of the forecast period. Table 6 shows estimated demand for new market-rate rental housing in the submarket, categorized by rent level and number of bedrooms.
Notes: Excludes townhomes. Current includes data through September 2015.Sources: U.S. Census Bureau, Building Permits Survey; estimates by analyst
Table 6. Estimated Demand for New Market-Rate Rental Housing in the Orleans Parish Submarket During the Forecast Period
Zero Bedrooms One Bedroom Two Bedrooms Three or More Bedrooms
Monthly Gross Rent ($)
Units of Demand
Monthly Gross Rent ($)
Units of Demand
Monthly Gross Rent ($)
Units of Demand
Monthly Gross Rent ($)
Units of Demand
662 to 861 10 778 to 977 270 952 to 1,151 250 1,205 to 1,404 10862 to 1,061 10 978 to 1,177 270 1,152 to 1,351 250 1,405 to 1,604 101,062 or more 10 1,178 to 1,377 55 1,352 to 1,551 50 1,605 or more 15
1,378 to 1,577 35 1,552 to 1,751 301,578 to 1,777 35 1,752 to 1,951 301,778 or more 15 1,952 or more 10
Total 25 Total 690 Total 620 Total 40
Notes: Numbers may not add to totals because of rounding. Monthly rent does not include utilities or concessions. The 960 units cur-rently under construction will likely satisfy some of the estimated demand. The forecast period is October 1, 2015, to October 1, 2018.Source: Estimates by analyst
Figure 14. Multifamily Units Permitted in the Orleans Parish Submarket, 2000 to Current
2000
2001
2002
2003
2004
2005
2006
3,000
2,500
2,000
1,500
1,000
500
0
2008
2009
2010
2011
2013
2015
2014
2012
2007
Housing Market TrendsRental Market—Orleans Parish Submarket Continued
Ne
w O
rle
an
s, L
A •
CO
MP
RE
HE
NS
IVE
HO
US
ING
MA
RK
ET
AN
ALY
SIS
22
Sales Market—Remainder Submarket
The sales housing market in the Remainder submarket has not entirely recovered from the effects of Hur-ricanes Katrina and Isaac. More than 58,700 owner-occupied homes were damaged by Hurricane Katrina, or more than one-half of the existing owner-occupied inventory, of which 14,000 homes were either severely damaged or completely destroyed. Plaquemines and St. Bernard Parishes incurred losses of 2,900 and 9,800 homes, or 41 and 52 percent of owner-occupied units, respectively. A relatively smaller portion of homes sustained severe damage in St. Tammany Parish—approximately 1,200 homes, or 2 percent of owner-occupied homes. In 2012, Hurricane Isaac damaged an additional 15,500 owner-occupied homes in the submar-ket, 1,800 of which were severely damaged or destroyed. The greatest number of severely damaged owner-occupied homes occurred in St. John the Baptist Parish, with 1,200 homes, or 10 percent of owner-occupied units. Approximately 28,400 owner-occupied homes have been rebuilt or repaired in the submarket since 2006 using funds provided by The Road Home program, and most of the remaining damaged homes have been repaired through private funding. The exception is in St. Bernard Parish, where the number of occupied single-family homes remains much less than pre-Hurricane Katrina levels, and only about two-thirds of the homes lost or damaged have been replaced or repaired, in part because many displaced homeowners opted not to return to the parish to rebuild. Efforts to mitigate blight in St. Bernard Parish have included nearly 9,000 government-sponsored demolitions.
The New Orleans Redevelopment Authority sold approximately 2,400 cleared lots via the Lot Next Door program, which provides adjacent property owners the opportunity to purchase lots for uses other than new home construction, and has sched-uled an additional estimated 1,000 lots to be auctioned.
The sales housing market in the submarket is currently balanced, un- changed from 2010. As of October 1, 2015, the sales vacancy rate was an estimated 1.6 percent, down from 2.4 percent in 2010. The number of vacant homes currently available for sale is an estimated 1,975 homes, reflecting an estimated 5-month supply compared with an estimated 6-month supply in 2010. Unsold inventory in the submarket currently totals 2,050, up slightly from 2,000 a year earlier but down from 2,950 as of April 2010 (Zillow Group). As of September 2015, 4.0 percent of home loans in the submarket were 90 or more days delinquent, were in fore-closure, or had transitioned into REO status compared with 4.7 percent of mortgages a year earlier and with 7.5 percent in 2010 (CoreLogic, Inc.). The portion of seriously delinquent loans and REO properties averaged 1.9 percent of home loans during the early 2000s, before Hurricane Katrina made landfall. As a result of damage caused by Hurricane Katrina, the percentage of seriously delinquent loans and REO properties increased to a rate of 19.0 percent by December 2005 before decreasing to a rate of 3.1 percent by August 2007. The portion of seriously delinquent loans and REO properties began to increase by late 2007, reflecting the national economic downturn, and continued
Housing Market Trends Continued
Ne
w O
rle
an
s, L
A •
CO
MP
RE
HE
NS
IVE
HO
US
ING
MA
RK
ET
AN
ALY
SIS
23
this trend until reaching a postreces-sion peak level of 7.8 percent in February 2010. Since March 2010, the percentage of seriously delinquent loans and REO properties has steadily decreased.
During the 12-month period ending September 2015, new and existing home sales (including single-family homes, townhomes, and condomini-ums) decreased by 250 homes, or 4 per-cent, to 5,775 homes sold (CoreLogic, Inc., with adjustments by the analyst), and the average home price increased by $3,900, or 2 percent, to $196,000, during the same period. Contributing to the decline in home sales was a significant decrease in distressed sales, down by 260 homes, or 28 percent, to 670 homes sold. The number of new home sales declined by 75 homes, or 15 percent, to 420 homes sold. The average price for new homes was unchanged, at $227,600. Home sales activity in St. Tammany Parish accounted for 79 percent of home sales in the submarket, whereas the number of owner households in St. Tammany Parish represents only an estimated 58 percent of the owner households in the submarket. St. Bernard and St. Charles Parishes accounted for 9 and 11 percent of total home sales during the 12 months ending September 2015, respectively, and only a combined 1 percent of home sales in the submarket occurred in Plaquemines, St. James, and St. John the Baptist Parishes. Average home sales prices in the submarket currently range from $76,600 in St. Bernard Parish to $248,200 in St. John the Baptist Parish.
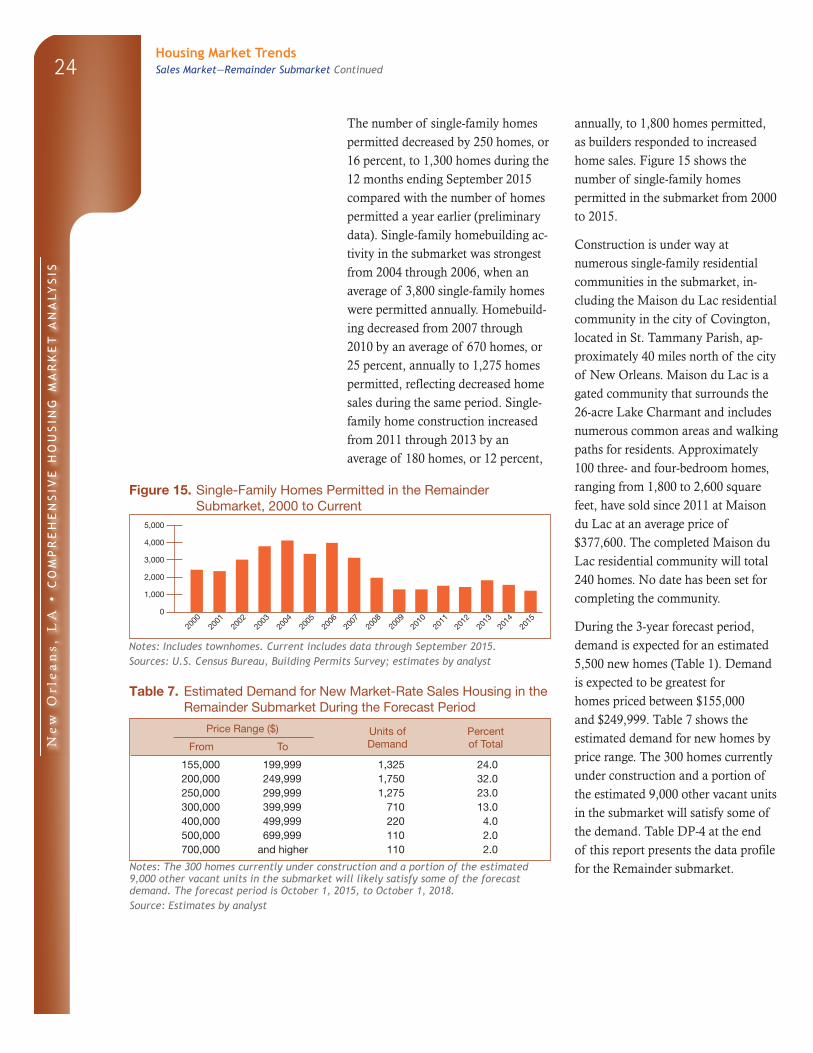
Slightly tight sales market conditions prevailed in the submarket during the first 6 years of the past decade, in part because of the submarket’s
increased suburban appeal drawing homebuyers from the Jefferson Parish and Orleans Parish submarkets. From 2000 through 2006, new and existing home sales increased by an average of 2,000 homes, or 30 percent, annually, to a peak level of 15,200 homes sold, and the average sales price for homes increased by an average of $8,300, or 6 percent, annually, to $179,900. Relatively relaxed mortgage lending standards, combined with population growth, also contributed to increased home sales during this period. Home sales in the submarket declined from 2007 through 2010 by an average of 1,775 homes, or 21 percent, annually, to 5,250 homes sold. During the same period, the average home sales price declined by an average of $850, or less than 1 percent, annually, to $176,200. Declines in sales and the average price were the result of steadily worsening sales market conditions because of a combination of factors, including an increased pro-pensity to rent, tightening mortgage lending standards, and moderating job growth. Increased competition from the Orleans Parish submarket sales market also contributed to the decreasing number of sales in the Remainder submarket, especially in 2007, because construction activities were focused on rebuilding efforts. From 2011 through 2013, home sales increased by an average of 480 homes, or 8 percent, to 6,675 homes sold, mostly because of the expanding economy in the HMA during the same period.
Home builders responded to a de-crease in new home sales demand in the Remainder submarket during the 12 months ending September 2015, resulting in decreased single-family homebuilding activity, as measured by the number of homes permitted.
Housing Market Trends Sales Market—Remainder Submarket Continued
Ne
w O
rle
an
s, L
A •
CO
MP
RE
HE
NS
IVE
HO
US
ING
MA
RK
ET
AN
ALY
SIS
24
The number of single-family homes permitted decreased by 250 homes, or 16 percent, to 1,300 homes during the 12 months ending September 2015 compared with the number of homes permitted a year earlier (preliminary data). Single-family homebuilding ac-tivity in the submarket was strongest from 2004 through 2006, when an average of 3,800 single-family homes were permitted annually. Homebuild-ing decreased from 2007 through 2010 by an average of 670 homes, or 25 percent, annually to 1,275 homes permitted, reflecting decreased home sales during the same period. Single-family home construction increased from 2011 through 2013 by an average of 180 homes, or 12 percent,
annually, to 1,800 homes permitted, as builders responded to increased home sales. Figure 15 shows the number of single-family homes permitted in the submarket from 2000 to 2015.
Construction is under way at numerous single-family residential communities in the submarket, in-cluding the Maison du Lac residential community in the city of Covington, located in St. Tammany Parish, ap-proximately 40 miles north of the city of New Orleans. Maison du Lac is a gated community that surrounds the 26-acre Lake Charmant and includes numerous common areas and walking paths for residents. Approximately 100 three- and four-bedroom homes, ranging from 1,800 to 2,600 square feet, have sold since 2011 at Maison du Lac at an average price of $377,600. The completed Maison du Lac residential community will total 240 homes. No date has been set for completing the community.
During the 3-year forecast period, demand is expected for an estimated 5,500 new homes (Table 1). Demand is expected to be greatest for homes priced between $155,000 and $249,999. Table 7 shows the estimated demand for new homes by price range. The 300 homes currently under construction and a portion of the estimated 9,000 other vacant units in the submarket will satisfy some of the demand. Table DP-4 at the end of this report presents the data profile for the Remainder submarket.
Figure 15. Single-Family Homes Permitted in the Remainder Submarket, 2000 to Current
Notes: Includes townhomes. Current includes data through September 2015.Sources: U.S. Census Bureau, Building Permits Survey; estimates by analyst
Table 7. Estimated Demand for New Market-Rate Sales Housing in the Remainder Submarket During the Forecast Period
Price Range ($) Units of PercentFrom To Demand of Total
Notes: The 300 homes currently under construction and a portion of the estimated 9,000 other vacant units in the submarket will likely satisfy some of the forecast demand. The forecast period is October 1, 2015, to October 1, 2018.Source: Estimates by analyst
Housing Market Trends Sales Market—Remainder Submarket Continued
2000
2001
2002
2003
2004
2005
2006
5,000
4,000
3,000
2,000
1,000
0
2008
2009
2010
2011
2013
2015
2014
2012
2007
Ne
w O
rle
an
s, L
A •
CO
MP
RE
HE
NS
IVE
HO
US
ING
MA
RK
ET
AN
ALY
SIS
25
Rental Market—Remainder Submarket
As a result of Hurricane Katrina, an estimated 17,500 occupied rental units were damaged in the Remainder submarket, representing nearly two-thirds of the renter-occupied inventory. St. Tammany, St. Bernard, and Plaquemines Parishes sustained damage to 9,200, 6,200, and 2,100 occupied rental units, respectively, accounting for a combined 73 percent of the renter-occupied inventory in these three parishes. Of those units damaged in the Remainder submar-ket, approximately 5,600 units were severely damaged or destroyed. Hur-ricane Isaac damaged an additional 3,450 renter-occupied units, 1,550 of which sustained significant damage or were destroyed. In St. John the Baptist Parish, approximately 1,400 renter-occupied housing units (con-sisting nearly entirely of single-family rental units) sustained damage. More than 800 renter-occupied homes, or one-fourth of the total number of renter-occupied homes in the parish, were severely damaged. EMAD research indicates that nearly all the damaged rental inventory, including small rental properties, have reentered the rental housing market, including approximately 1,000 units in small rental properties which were repaired or rebuilt via SRPP.
Rental housing market conditions in the Remainder submarket are currently soft, with an overall rental vacancy rate estimated at 10.0 per-cent, down from 11.7 percent in April 2010. Renters comprise only about 24 percent of total households in the submarket, with more than one-half of these households in St. Tammany Parish, by far the most populous of the six parishes in the submarket. Units in small rental properties comprise an estimated 64 percent of the rental inventory in the submarket and account for approximately 55 percent of the rental inventory in St. Tammany Parish and a combined 73 percent of rental units in the remain-ing five parishes of the submarket. Figure 16 shows rental vacancy rates in the Remainder submarket.
Apartment market conditions in St. Tammany Parish are currently slightly tight. The apartment vacancy rate in St. Tammany Parish, the only parish in the submarket with available data, was 5.0 percent in the fall of 2015, down from 6.0 percent a year earlier and 9.0 percent in the spring of 2010 (Greater New Orleans Multi-Family Report). The average rent during the fall of 2015 was $1,047, up more than 1 percent from a year earlier. Similar to rents in the Jefferson Parish and Orleans Parish submarkets, apart-ment rents in St. Tammany Parish have increased significantly from pre-Hurricane Katrina levels. The average rent in St. Tammany Parish during the fall of 2015 represented an increase of 38 percent compared with the average rent of $760 during the spring of 2005. Most of this increase occurred during the 2 years directly following Hurricane Katrina. From the spring of 2005 to the spring of
Figure 16. Rental Vacancy Rates in the Remainder Submarket, 2000 to Current
Note: The current date is October 1, 2015.Sources: 2000 and 2010—2000 Census and 2010 Census; current—estimates by analyst
2000 2010 Current
9.210.0
11.712.0
10.0
8.0
6.0
4.0
2.0
0.0
Housing Market Trends Remainder Submarket Continued
Ne
w O
rle
an
s, L
A •
CO
MP
RE
HE
NS
IVE
HO
US
ING
MA
RK
ET
AN
ALY
SIS
26
2007, the average apartment rent in the submarket increased an average of 13 percent annually, to $963. Apart-ment market conditions have fluctu-ated significantly since the spring of 2005. The apartment rental vacancy rate declined from 14.0 percent in the spring of 2005 to 4.0 percent a year later because of increased demand from an influx of displaced residents and decreased supply stemming from damage caused by Hurricane Katrina. Rates remained low in St. Tammany Parish through 2007 but climbed to 13.0 percent by the fall of 2011, in part because of increased supply stemming from new apartment construction and from increased competition from the Orleans Parish submarket rental market as repaired units came on line. Reflecting dimin-ished new apartment construction in the Remainder submarket, combined with job growth in the HMA and population growth in the submarket
during 2012 and 2013, the apartment vacancy rate decreased to 4.0 percent by the fall of 2013.
Multifamily construction, as mea-sured by the number of multifamily units permitted, decreased to 250 units in the Remainder submarket during the 12 months ending Septem-ber 2015 compared with the 350 units permitted a year earlier (preliminary data; adjustments by the analyst). Multifamily permitting peaked from 2010 through 2011, when an average of 580 units were permitted annually. Multifamily construction since 2000 has consisted almost entirely of renter units in the submarket. Except for approximately 240 affordable senior apartment units that are currently under construction, no additional multifamily units are under construc-tion in the submarket. Figure 17 shows the number of multifamily units permitted in the Remainder submarket from 2000 to 2015.
During the 3-year forecast period, the existing inventory of vacant available units for rent is expected to satisfy all the demand (Table 1). To prevent prolonged soft market conditions, no additional units should be constructed during the forecast period. The construction of additional units should not begin until the third year of the forecast period to meet an anticipated demand for 140 units in the fifth year.
Figure 17. Multifamily Units Permitted in the Remainder Submarket, 2000 to Current
Notes: Excludes townhomes. Current includes data through October 2015.Sources: U.S. Census Bureau, Building Permits Survey; estimates by analyst
Housing Market Trends Rental Market—Remainder Submarket Continued
2000
2001
2002
2003
2004
2005
2006
800
700
600
500
400
300
200
100
0
2008
2009
2010
2011
2013
2015
2014
2012
2007
Ne
w O
rle
an
s, L
A •
CO
MP
RE
HE
NS
IVE
HO
US
ING
MA
RK
ET
AN
ALY
SIS
27Data Profiles
Table DP-1. New Orleans HMA Data Profile, 2000 to CurrentAverage Annual Change (%)
2000 2010 Current 2000 to 2010 2010 to Current
Total resident employment 604,094 526,508 566,200 – 1.4 1.5
Unemployment rate 5.1% 7.7% 6.4%
Nonfarm payroll jobs 627,300 533,000 563,700 – 1.6 1.2
Total population 1,337,726 1,189,866 1,263,000 – 1.2 1.1
Total households 505,579 462,863 490,700 – 0.9 1.1
Total housing units 556,234 546,694 557,300 – 0.2 0.3
Owner vacancy rate 1.6% 2.8% 1.6%
Rental vacancy rate 7.9% 14.4% 9.4%
Median Family Income NA NA $58,800 NA NA
NA = data not available. Notes: Numbers may not add to totals because of rounding. Employment data represent annual averages for 2000, 2010, and the 12 months through September 2015. Median Family Incomes are for 1999, 2009, and 2014. The current date is October 1, 2015.Sources: U.S. Census Bureau; U.S. Department of Housing and Urban Development; estimates by analyst
Table DP-2. Jefferson Parish Submarket Data Profile, 2000 to Current
Average Annual Change (%)
2000 2010 Current 2000 to 2010 2010 to Current
Total population 455,466 432,552 436,500 – 0.5 0.2
Total households 176,234 169,647 172,350 – 0.4 0.3