COMPREHENSIVE HOUSING MARKET ANALYSIS Baltimore-Columbia-Towson, Maryland As of June 1, 2018 U.S. Department of Housing and Urban Development Office of Policy Development and Research Maryland Chesapeake Bay Carroll Baltimore Harford Anne Arundel Howard Queen Anne’s City of Baltimore Maryland Pennsylvania Virginia Delaware ! ( District of Columbia York Cecil Kent Charles Talbot Adams Fairfax Chester Dorchester Caroline Kent Montgomery Lancaster Frederick Prince George’s Calvert New Castle Sussex Housing Market Area Market Details Economic Conditions ......................... 2 Population and Households ............... 7 Housing Market Trends .................... 10 Data Profiles ..................................... 24 Summary The Baltimore-Columbia-Towson Housing Market Area (hereafter, the Baltimore HMA) consists of the independent city of Baltimore and six counties in Maryland. The HMA is coterminous with the Baltimore-Columbia-Towson Metropolitan Statistical Area (MSA) and is located between Philadelphia and Washington, D.C. For purposes of this analysis, the HMA is divided into three submarkets: (1) the Baltimore City submarket, which is coterminous with the independent city of Baltimore, (2) the Northern Suburbs submarket, which consists of Baltimore, Carroll, and Harford Counties, and (3) the Southern Suburbs submarket, which contains the counties of Anne Arundel, Howard, and Queen Anne’s. Economy Nonfarm payrolls in the Baltimore HMA increased in each of the past 8 years, led by gains in the professional and business services and in the education and health services sectors. During the 12 months ending May 2018, nonfarm payrolls increased by 15,600 jobs, or 1.1 percent, to 1.41 million jobs. During the 12 months ending May 2018, the unemployment rate in the HMA averaged 4.3 percent, down from 4.5 percent a year ago. During the 3-year forecast period, nonfarm payrolls are expected to grow at an average annual pace of 1.1 percent annually. Sales Market The sales market in the HMA is currently balanced with an estimated sales vacancy rate of 1.9 percent, down from 2.1 percent in 2010. During the 12 months ending May 2018, the HMA had a 3.0-month supply of for-sale housing inventory, down from a 3.5-month supply during the previous 12-month period (Metropolitan Regional Information Systems, Inc. monthly reports). During the next 3 years, demand is estimated for 12,425 new homes (Table 1). The 1,530 homes under construction will satisfy a portion of the demand. Rental Market The rental housing market in the HMA is currently slightly soft, with an estimated overall rental vacancy rate of 9.3 percent, up from 8.4 percent in 2010. Conditions in the apartment market are also slightly soft. The apartment vacancy rate was 6.0 percent during the first quarter of 2018, up from 5.8 percent during the first quarter of 2017 (RealPage, Inc.). During the forecast period, demand is estimated for 6,425 new market-rate rental units (Table 1). The 5,625 units under construction will satisfy a portion of this demand.
Transcript
C O M P R E H E N S I V E H O U S I N G M A R K E T A N A L Y S I S
Baltimore-Columbia-Towson, Maryland
As of June 1, 2018U.S. Department of Housing and Urban Development Office of Policy Development and Research
Data Profiles ..................................... 24
Summary
The Baltimore-Columbia-Towson Housing Market Area (hereafter, the Baltimore HMA) consists of the independent city of Baltimore and six counties in Maryland. The HMA is coterminous with the Baltimore-Columbia-Towson Metropolitan Statistical Area (MSA) and is located between Philadelphia and Washington, D.C. For purposes of this analysis, the HMA is divided into three submarkets: (1) the Baltimore City submarket, which is coterminous with the independent city of Baltimore, (2) the Northern Suburbs submarket, which consists of Baltimore, Carroll, and Harford Counties, and (3) the Southern Suburbs submarket, which contains the counties of Anne Arundel, Howard, and Queen Anne’s.
Economy Nonfarm payrolls in the Baltimore HMA increased in each of the past 8 years, led by gains in the professional and business services and in the education and health services sectors. During the 12 months ending May 2018, nonfarm payrolls increased by 15,600 jobs, or 1.1 percent, to 1.41 million jobs. During the 12 months ending May 2018, the unemployment rate in the HMA averaged 4.3 percent, down from 4.5
percent a year ago. During the 3-year forecast period, nonfarm payrolls are expected to grow at an average annual pace of 1.1 percent annually.
Sales MarketThe sales market in the HMA is currently balanced with an estimated sales vacancy rate of 1.9 percent, down from 2.1 percent in 2010. During the 12 months ending May 2018, the HMA had a 3.0-month supply of for-sale housing inventory, down from a 3.5-month supply during the previous 12-month period (Metropolitan Regional Information Systems, Inc. monthly reports). During the next 3 years, demand is estimated for 12,425 new homes (Table 1). The 1,530 homes under
construction will satisfy a portion of the demand.
Rental MarketThe rental housing market in the HMA is currently slightly soft, with an estimated overall rental vacancy rate of 9.3 percent, up from 8.4 percent in 2010. Conditions in the apartment market are also slightly soft. The apartment vacancy rate was 6.0 percent during the first quarter of 2018, up from 5.8 percent during the first quarter of 2017 (RealPage, Inc.). During the forecast period, demand is estimated for 6,425 new market-rate rental units (Table 1). The 5,625 units under construction will satisfy a portion of this demand.
Ba
ltim
ore
-Co
lum
bia
-To
ws
on
, M
D •
CO
MP
RE
HE
NS
IVE
HO
US
ING
MA
RK
ET
AN
ALY
SIS
2
Baltimore-Columbia-Towson HMA
Baltimore City Submarket
Northern Suburbs Submarket
Southern Suburbs Submarket
SalesUnits
RentalUnits
SalesUnits
RentalUnits
SalesUnits
RentalUnits
SalesUnits
RentalUnits
Total demand 12,425 6,425 0 0 5,550 2,625 6,875 3,800
Under construction 1,530 5,625 480 2,300 550 2,025 500 1,300
Table 1. Housing Demand in the Baltimore-Columbia-Towson HMA During the Forecast Period
Economic Conditions
The education and health services sector is the largest
sector in the Baltimore HMA, with nearly one-fifth of total nonfarm payrolls (Figure 1). Additionally, job growth in the sector has been the largest contributor to overall job growth in the HMA since 2001, with payrolls in this sector up 49 percent during the period (Figure 2). From 2001 through 2017, nonfarm payrolls in this sector increased each year by an average of 5,200 jobs, or 2.3 percent. More than 70 percent of the gains were in the healthcare and social assistance industry, which increased by an average of 3,700 jobs, or 2.1 percent, annually. Job growth
in the industry was spread across multiple large employers in the HMA in response to increased demand for healthcare services, which is primarily attributed to more residents having health insurance. From 2005 to 2016, the rate of insured residents in the HMA increased from 87 percent to 94 percent (U.S. Census Bureau, Small Area Health Insurance Estimates). Included in the industry is Johns Hopkins Health System, which is the fifth largest employer in the HMA with 22,300 employees (Table 2). During 2014, the combined economic impact of the Johns Hopkins Health System totaled $4.7 billion in the city of Baltimore and nearly $9.1 billion statewide (The Economic Impact of the Johns Hopkins Health System). During 2012, approximately 700 jobs were added at Johns Hopkins Hospital, which is a part of Johns Hopkins Health System, when a new $1.1 billion expansion of its existing facility was completed. Additional gains in the education and health services sector were in the educational services industry, which increased by an average of 1,400 jobs, or 2.8 percent, annually. Johns Hopkins University, which has
Summary Continued
Notes: Total demand represents estimated production necessary to achieve a balanced market at the end of the forecast period. Units under construction as of June 1, 2018. The forecast period is June 1, 2018, to June 1, 2021.Source: Estimates by analyst
Figure 1. Current Nonfarm Payroll Jobs in the Baltimore-Columbia-Towson HMA, by Sector
Note: Based on 12-month averages through May 2018.Source: U.S. Bureau of Labor Statistics
Government 16.1%
Other services 3.6%
Leisure & hospitality 9.7%
Education & health services 19.8% Professional & business services 16.6%
Wholesale & retail trade 13.6%
Manufacturing 4.0%
Mining, logging, & construction 5.6%
Transportation & utilities 3.9%
Financial activities 5.8%
Information 1.2%
Ba
ltim
ore
-Co
lum
bia
-To
ws
on
, M
D •
CO
MP
RE
HE
NS
IVE
HO
US
ING
MA
RK
ET
AN
ALY
SIS
3Economic Conditions Continued
Job growth has accelerated in recent years in the leisure and hospitality sector, which is primarily attributed to growth in the tourism industry. From 2012 through 2017, nonfarm payrolls in the sector increased by an average of 3,800 jobs, or 3.1 percent, annually. By comparison, from 2001 through 2011, job growth averaged 1,000 jobs, or 0.9 percent, annually. The opening of two new casinos in the HMA partially contributed to the increased rate of growth. Live! Casino and Hotel, which opened in 2012, and Horseshoe Casino Baltimore, which opened in 2014, currently employ approximately 3,500 and 2,150 employees, respectively. Recent additions at Live! Casino and Hotel include approximately 500 jobs created in early 2018 when construction of a new hotel and event center was completed.
a total enrollment of nearly 24,000 students and is the second largest employer in the HMA with 27,100 employees, partially contributed to this job growth. In response to rising enrollment levels, employment at the university increased by an average of approximately 530 annually since 2003.
Figure 2. Sector Growth in the Baltimore-Columbia-Towson HMA, Percentage Change, 2000 to Current
Note: Current is based on 12-month averages through May 2018.Source: U.S. Bureau of Labor Statistics
Total nonfarm payroll jobs
Goods-producing sectors
Mining, logging, & construction
Manufacturing
Service-providing sectors
Wholesale & retail trade
Information
Financial activities
Professional & business services
Education & health services
Government
Other services
Leisure & hospitality
Transportation & utilities
0– 30– 50 5010 20– 10– 40 – 20 30 40
Table 2. Major Employers in the Baltimore-Columbia-Towson HMA
Name of Employer Nonfarm Payroll Sector Number of Employees
Fort George G. Meade Government 53,750Johns Hopkins University Education & health services 27,100Aberdeen Proving Ground Government 22,800University of Maryland
Medical SystemEducation & health services 22,550
Johns Hopkins Health System Education & health services 22,300U.S. Social Security Agency Government 14,350MedStar Health Education & health services 12,400Northrop Grumman Corp. Manufacturing 10,400LifeBridge Health Education & health services 9,950Wal-Mart Stores Inc. Wholesale & retail trade 7,500
Note: Excludes local school districts. Data includes military personnel, who are generally not included in nonfarm payroll survey data. Payroll data at Fort George G. Meade and Aberdeen Proving Ground include private contractors.Source: economy.com; local sources
Ba
ltim
ore
-Co
lum
bia
-To
ws
on
, M
D •
CO
MP
RE
HE
NS
IVE
HO
US
ING
MA
RK
ET
AN
ALY
SIS
4Economic Conditions Continued
which declined by an average of 2,700 jobs, or 3.4 percent, annually.
Nonfarm payrolls declined or were relatively unchanged each year from 2008 through 2010, although job losses during this period were not as severe as the rest of the nation during the Great Recession because of significant gains at Fort George G. Meade and Aberdeen Proving Ground. During the 3-year period, nonfarm payrolls declined by an average of 14,400 jobs, or 1.1 percent, annually. By comparison, nonfarm payrolls nationwide decreased an average of 1.9 percent annually. Losses in the HMA were largest in the wholesale and retail trade and the mining, logging, and construction sectors, which decreased by an average of 6,100 and 5,900 jobs, or 3.1 and 7.4 percent, respectively. Partially offsetting these losses were gains in the education and health services and government sectors, which increased by 5,500 and 3,800 jobs, or 2.4 and 1.7 percent, respectively. Nearly two-thirds of the gains in the government sector were in the federal government subsector, which increased by an average of 2,500 jobs, or 5.7 percent, annually. During the 3-year period, Fort George G. Meade added an average of more than 4,000 jobs annually, while the total number of employees at Aberdeen Proving Ground expanded by approximately 490 annually.
Economic conditions improved each year from 2011 through 2017. Job growth however, was slower than the national rate, which is partially attributed to slow job growth in the wholesale and retail trade sector because of
The federal government subsector has been a significant contributor to the economy of the HMA, especially from 2009 through 2012. During the 4-year period, payrolls in the subsector increased by an average of 2,900 jobs, or 6.3 percent, annually. The job growth was largely attributed to gains at two military bases in the HMA, mainly because of activities related to the 2005 Defense Base Closure and Realignment Commission (BRAC). Total employment at Fort George G. Meade and Aberdeen Proving Ground military bases, which are the first and third largest employers in the HMA with 53,750 and 22,800 employees, respectively, increased by approximately 19,150 and 3,075 employees during the period, respectively. (Although these specific figures include active-duty military personnel, federal employees, and private contractors, active-duty military personnel are not included in general nonfarm payroll data). Employment growth at these facilities, however, has since slowed, resulting in nonfarm payrolls in the subsector declining by an average of 400 jobs, or 0.9 percent, annually since 2013.
Economic conditions in the HMA have fluctuated since 2003 with periods of job gains and losses. From 2003 through 2007, nonfarm payrolls increased by an average of 13,200 jobs, or 1.0 percent, annually. Gains during this period were largest in the education and health services and the professional and business services sectors, which increased by an average of 5,000 and 3,300 jobs, or 2.4 and 1.8 percent, respectively. Partially offsetting these gains, however, were losses in the manufacturing sector,
Ba
ltim
ore
-Co
lum
bia
-To
ws
on
, M
D •
CO
MP
RE
HE
NS
IVE
HO
US
ING
MA
RK
ET
AN
ALY
SIS
5
competition from online retailers. During the 7-year period, nonfarm payrolls in the HMA increased by an average of 17,900 jobs, or 1.3 percent annually, compared with the 1.7-percent average growth rate nationwide. Gains in the HMA were largest in the professional and business services, the education and health services, and the leisure and hospitality sectors, which annually increased by an average of 6,800, 5,300, and 3,500 jobs, or 3.3, 2.1, and 2.8 percent, respectively. In the financial activities sector, payrolls increased by an average of 1,200 jobs, or 1.6 percent, annually. Morgan Stanley opened a new branch in the city of Baltimore in late 2010 and most of the 1,000 employees were hired during 2011 and 2012. In the wholesale and retail trade sector, nonfarm payrolls were up an average of 1,100 jobs, or 0.6 percent, annually, compared with a 1.3-percent average annual growth rate nationwide. Contributing to the slow growth was Mars Super Markets, Inc. closing 13 locations in the HMA, resulting in
more than 1,000 jobs lost.
Job growth continued during the past year, although growth slowed. During the 12 months ending May 2018, nonfarm payrolls increased by 15,600 jobs, or 1.1 percent (Table 3). More than 60 percent of the net gains were in the education and health services sector, which increased by 9,700 jobs, or 3.6 percent. Gains in the sector were strong in both the educational services and healthcare and social assistance industries, which were up by 5,300 and 4,300 jobs, or 8.6 and 2.1 percent, respectively. In the educational services industry, Towson University added approximately 50 faculty members for the 2017–2018 school year in response to rising enrollment totals, while gains in the healthcare and social assistance industry were across multiple employers in response to increasing rates of insured residents. Additional gains were in the financial activities and professional and business services sectors, which increased by 2,000 and 1,800 jobs, or 2.5 and 0.8 percent, respectively. In the financial activities sector, Bank of America Corporation added approximately 300 jobs during 2017 as the company expanded operations at its Baltimore County location.
Additional gains during the 12 months ending May 2018 were in the mining, logging, and construction and the transportation and utilities sectors, which increased by 1,400 and 1,000 jobs, respectively, or 1.8 percent each. In the mining, logging, and construction sector, approximately 550 construction jobs were created
Economic Conditions Continued
Table 3. 12-Month Average Nonfarm Payroll Jobs in the Baltimore-Columbia-Towson HMA, by Sector
12 Months Ending Absolute Change
Percent ChangeMay 2017 May 2018
Total nonfarm payroll jobs 1,390,400 1,406,000 15,600 1.1Goods-producing sectors 133,300 134,600 1,300 1.0
Notes: Numbers may not add to totals because of rounding. Based on 12-month averages through May 2017 and May 2018. Source: U.S. Bureau of Labor Statistics
Ba
ltim
ore
-Co
lum
bia
-To
ws
on
, M
D •
CO
MP
RE
HE
NS
IVE
HO
US
ING
MA
RK
ET
AN
ALY
SIS
6Economic Conditions Continued
as Live! Casino and Hotel built a new hotel and event center. Gains in the transportation and utilities sector were mainly because of Amazon.com, Inc. opening a new fulfillment center in the city of Baltimore in late 2017, resulting in approximately 1,200 new jobs.
During the 12 months ending May 2018, the unemployment rate in the HMA averaged 4.3 percent. The current rate is down from an average rate of 4.5 percent during the 12 months ending May 2017 and 7.7 percent from 2009 through 2012. The current unemployment rate is slightly higher than the statewide and nationwide rates of 4.2 and 4.1 percent, respectively. The current unemployment rates in the Baltimore City, Northern Suburbs, and Southern Suburbs submarkets are 6.1, 4.1, and 3.4 percent, respectively, compared with 6.4, 4.3, and 3.6 percent during the previous 12 months, respectively. Figure 3 shows trends in the labor force, resident employment, and the
Source: U.S. Bureau of Labor Statistics
Figure 3. Trends in Labor Force, Resident Employment, and Unemployment Rate in the Baltimore-Columbia-Towson HMA, 2000 Through 2017
Une
mpl
oym
ent r
ate
Labo
r fo
rce
and
resi
dent
em
ploy
men
t
1,640,000
1,540,000
1,440,000
1,340,000
1,240,000
1,140,000
2000
2002
2004
Labor force Resident employment Unemployment rate
2006
2001
2003
2005
2007
2009
2010
2008
2012
2013
2015
2017
2016
2014
2011
10.0
8.0
6.0
4.0
2.0
0.0
unemployment rate in the HMA from 2000 through 2017.
During the 3-year forecast period, nonfarm payrolls are estimated to increase by an average of 15,400 jobs, or 1.1 percent, annually, and growth is expected to be relatively steady during all 3 years. Gains are expected to be largely concentrated in the service-providing sectors, especially in the education and health services and the professional and business services sectors. Bank of America Corporation is expected to continue to expand its operations in Baltimore County and is projected to add approximately 600 new jobs by 2020. Additionally, Morgan Stanley recently announced plans to expand its workforce in the HMA by 800 employees by 2021. In the education and health services sector, an unspecified number jobs are expected to be created during the next 3 to 5 years as a result of a $469 million renovation and expansion project at Johns Hopkins Bayview Medical Center.
Ba
ltim
ore
-Co
lum
bia
-To
ws
on
, M
D •
CO
MP
RE
HE
NS
IVE
HO
US
ING
MA
RK
ET
AN
ALY
SIS
7
Population and Households
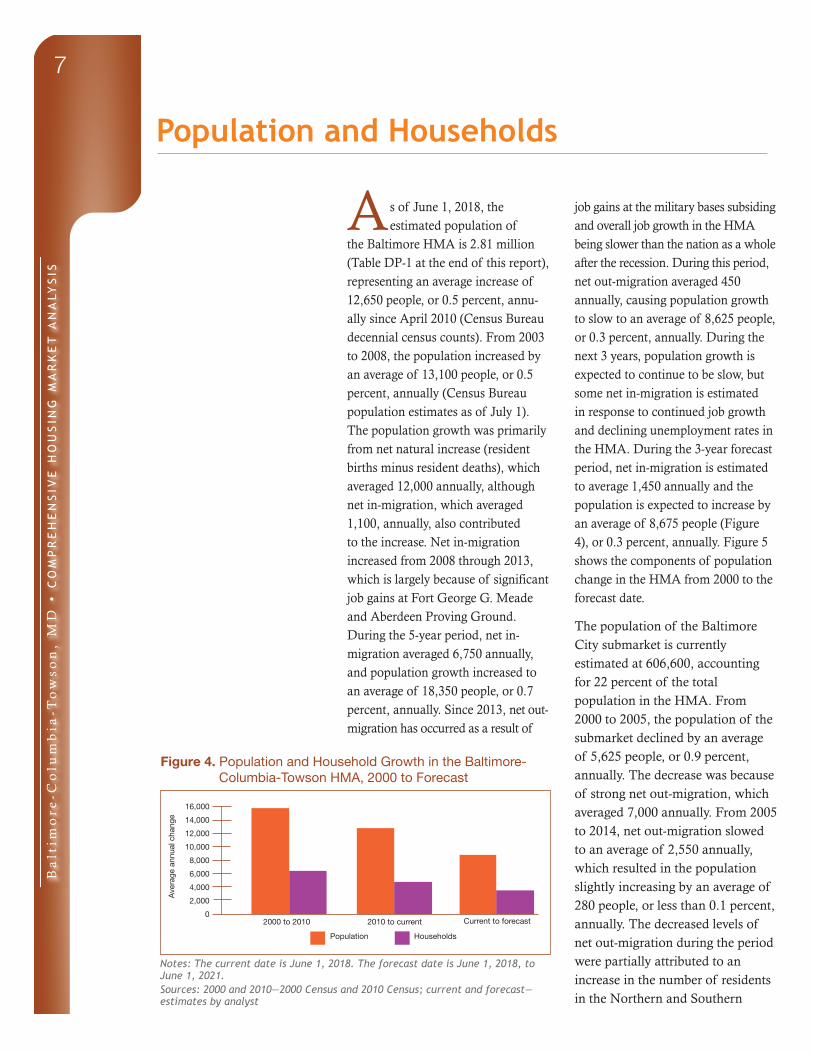
As of June 1, 2018, the estimated population of
the Baltimore HMA is 2.81 million (Table DP-1 at the end of this report), representing an average increase of 12,650 people, or 0.5 percent, annu-ally since April 2010 (Census Bureau decennial census counts). From 2003 to 2008, the population increased by an average of 13,100 people, or 0.5 percent, annually (Census Bureau population estimates as of July 1). The population growth was primarily from net natural increase (resident births minus resident deaths), which averaged 12,000 annually, although net in-migration, which averaged 1,100, annually, also contributed to the increase. Net in-migration increased from 2008 through 2013, which is largely because of significant job gains at Fort George G. Meade and Aberdeen Proving Ground. During the 5-year period, net in-migration averaged 6,750 annually, and population growth increased to an average of 18,350 people, or 0.7 percent, annually. Since 2013, net out-migration has occurred as a result of
job gains at the military bases subsiding and overall job growth in the HMA being slower than the nation as a whole after the recession. During this period, net out-migration averaged 450 annually, causing population growth to slow to an average of 8,625 people, or 0.3 percent, annually. During the next 3 years, population growth is expected to continue to be slow, but some net in-migration is estimated in response to continued job growth and declining unemployment rates in the HMA. During the 3-year forecast period, net in-migration is estimated to average 1,450 annually and the population is expected to increase by an average of 8,675 people (Figure 4), or 0.3 percent, annually. Figure 5 shows the components of population change in the HMA from 2000 to the forecast date.
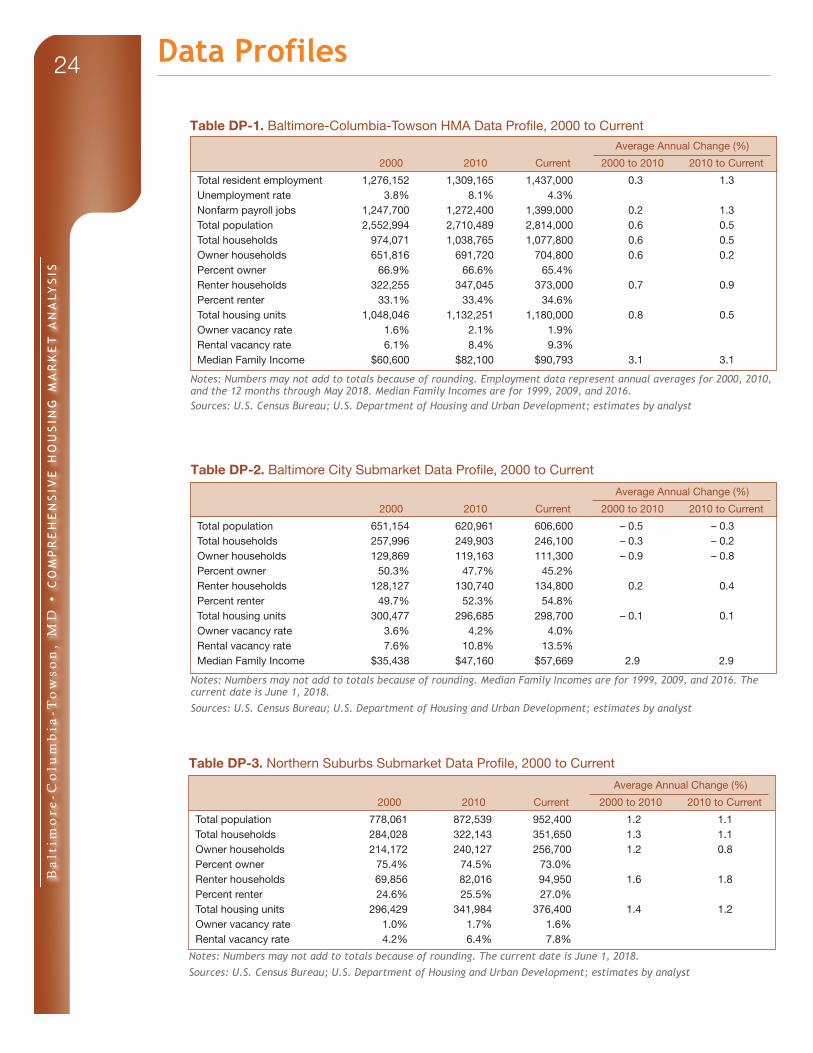
The population of the Baltimore City submarket is currently estimated at 606,600, accounting for 22 percent of the total population in the HMA. From 2000 to 2005, the population of the submarket declined by an average of 5,625 people, or 0.9 percent, annually. The decrease was because of strong net out-migration, which averaged 7,000 annually. From 2005 to 2014, net out-migration slowed to an average of 2,550 annually, which resulted in the population slightly increasing by an average of 280 people, or less than 0.1 percent, annually. The decreased levels of net out-migration during the period were partially attributed to an increase in the number of residents in the Northern and Southern
Figure 4. Population and Household Growth in the Baltimore-Columbia-Towson HMA, 2000 to Forecast
Notes: The current date is June 1, 2018. The forecast date is June 1, 2018, to June 1, 2021. Sources: 2000 and 2010—2000 Census and 2010 Census; current and forecast—estimates by analyst
16,000
14,000
12,000
10,000
8,000
6,000
4,000
2,000
0
Population Households
2000 to 2010 2010 to current Current to forecast
Ave
rage
ann
ual c
hang
e
Ba
ltim
ore
-Co
lum
bia
-To
ws
on
, M
D •
CO
MP
RE
HE
NS
IVE
HO
US
ING
MA
RK
ET
AN
ALY
SIS
8Population and Households Continued
Suburbs submarkets moving into the Baltimore City submarket in response to the redevelopment of the downtown and Inner Harbor portions of the city. Compared with 2000 to 2005, the number of people moving from the two suburban submarkets into the Baltimore City submarket from 2005 to 2014 increased 9 percent (IRS Migration Files). Since 2014, net out-migration increased to an average of 6,350, resulting in the population declining by an average of 4,450 people, or 0.7 percent, annually. The increased net out-migration was partially attributed to a rise in the number of retired residents moving into newly-constructed senior communities in Anne Arundel County. From 2014 to 2016, net out-migration from the Baltimore City submarket into Anne Arundel County increased nearly three-fold, to an average of 420 annually, compared with 2010 to 2014 (IRS Migration Files). During the next 3 years, net out-migration is expected to slow slightly, and the population is estimated to annually decrease by an average of 3,425 people, or 0.6 percent, to 596,300.
The Northern Suburbs submarket is the most populous of the three submarkets, with an estimated current population of 1.26 million, accounting for approximately 45 percent of the total population in the HMA. From 2000 to 2006, the population in the submarket increased by an average of 12,500 people, or 1.1 percent, annually, and growth was largely because of strong net in-migration, which averaged 8,775 annually. From 2006 to 2009, however, net out-migration averaged 830 annually and was partially attributed to residents moving into the Baltimore City submarket and slightly elevated unemployment rates. As a result of the net out-migration during the period, population growth slowed to an average of 3,550 people, or 0.3 percent, annually. Job growth at Aberdeen Proving Ground was a partial contributor to net in-migration returning from 2009 to 2013, averaging 3,525 annually, which caused population growth to increase to an average of 0.6 percent, or by 6,750 people, annually. After job growth at the military base slowed, however,
Figure 5. Components of Population Change in the Baltimore-Columbia-Towson HMA, 2000 to Forecast
Notes: The current date is June 1, 2018. The forecast date is June 1, 2021.Sources: 2000 and 2010—2000 Census and 2010 Census; current and forecast—estimates by analyst
Net natural change Net migration
2000 to 2010 2010 to current Current to forecast
Ave
rage
ann
ual c
hang
e
12,000
10,000
8,000
6,000
4,000
2,000
0
Ba
ltim
ore
-Co
lum
bia
-To
ws
on
, M
D •
CO
MP
RE
HE
NS
IVE
HO
US
ING
MA
RK
ET
AN
ALY
SIS
9Population and Households Continued
net in-migration has declined to an average of 900 annually since 2013 resulting in the population increasing at the slower rate of 0.3 percent, or by 3,350 people, annually. During the next 3 years, net in-migration is estimated to average 1,400 annually, and the population of the submarket is anticipated to increase by an average of 3,000 people, or 0.2 percent, to 1.27 million.
Population growth in the Southern Suburbs submarket has been strong and consistent during the past 10 years, which is attributed to strong job growth at Fort George G. Meade and the desirability of the submarket area because of its proximity to Washington, D.C. The submarket is also a bedroom community for the Washington-Arlington-Alexandria, DC-VA-MD-WV Metropolitan Statistical Area (MSA) with nearly one-fourth of all working residents in the submarket commuting into the MSA for work (2012–2016 5-year American Community Survey [ACS] estimates). The current estimated population of the submarket is 952,400, accounting for more than
one-third of the total population in the HMA. Since 2008, the population of the submarket has increased by an average of 10,250 people, or 1.1 percent, annually. Population growth was from a combination of net in-migration, which averaged 5,350 annually, and net natural increase, which averaged 4,900 annually. By comparison, from 2003 to 2008, the population increased by an average of 7,225 people, or 0.9 percent, annually. The slower population growth during the period was largely because of lower levels of net in-migration, which averaged 1,675. During the next 3 years, net in-migration is expected to continue at a relatively steady pace, and the population is estimated to annually increase by an average of 8,900 people, or 0.9 percent, to 979,100, and net in-migration will account for approximately 55 percent of this growth.
Household growth trends in the HMA and each submarket have been similar to population growth trends. Since 2010, the number of households in the HMA has increased by an average of 4,775 households, or 0.5 percent, annually. Household growth slowed slightly compared with 2000 to 2010, when the number of households increased by an average of 6,475, or 0.6 percent. In the Baltimore City submarket, the number of households decreased by an average of 470, or 0.2 percent, since 2010, compared with an average decline of 810 households, or 0.3 percent, annually from 2000 to 2010. In the Southern Suburbs and Northern Suburbs submarkets, the number of households annually increased by an average of 3,625 and 1,625,
Note: The current date is June 1, 2018.Sources: 2000 and 2010—2000 Census and 2010 Census; current—estimates by analyst
Figure 6. Number of Households by Tenure in the Baltimore City Submarket, 2000 to Current
140,000
120,000
100,000
80,000
60,000
40,000
20,000
02000 2010 Current
Renter Owner
Ba
ltim
ore
-Co
lum
bia
-To
ws
on
, M
D •
CO
MP
RE
HE
NS
IVE
HO
US
ING
MA
RK
ET
AN
ALY
SIS
10Population and Households Continued
or 1.1 and 0.3 percent since 2010, respectively. Household growth slowed in both submarkets because of decreased rates of population growth.
From 2000 to 2010, households in the submarkets annually increased by an average of 3,800 and 3,475 households, or 1.3 and 0.8 percent, respectively. Figures 6, 7, and 8 show the number of households by tenure in each submarket from 2000 to the current date.
During the 3-year forecast period, the number of households is expected to continue to decline in the Baltimore City submarket because of strong net out-migration, and household growth is expected to slow in the Southern Suburbs and Northern Suburbs submarkets because of lower levels of net in-migration. During the next 3 years, the number of households in the HMA is expected to increase by an average of 3,400, or 0.3 percent, annually, reaching 1.09 million households. In the Baltimore City submarket, the number of households is estimated to decline by an average of 1,125, or 0.5 percent, annually, to 242,700 households. In the Southern Suburbs and Northern Suburbs submarkets, the number of households is anticipated to annually increase by an average of 3,250 and 1,125, or 0.9 and 0.2 percent, to 361,400 and 483,400 households, respectively.
Housing Market Trends
Sales Market—Baltimore City Submarket
The sales housing market in the Baltimore City submarket is currently slightly soft. The current vacancy rate is estimated at 4.0 percent, down slightly compared with 4.2 percent in April 2010 (Table DP-2 at the end of this report). Sales market conditions were soft from 2000 through 2010
because of net out-migration each year and a high percentage of new residents entering the city choosing to rent instead of own. Since 2010, vacancy rates have continued to be elevated, but conditions have transitioned from soft to slightly soft because of declining levels of the
Note: The current date is June 1, 2018.Sources: 2000 and 2010—2000 Census and 2010 Census; current—estimates by analyst
Figure 7. Number of Households by Tenure in the Northern Suburbs Submarket, 2000 to Current
350,000
300,000
250,000
200,000
150,000
100,000
50,000
02000 2010 Current
Renter Owner
Note: The current date is June 1, 2018.Sources: 2000 and 2010—2000 Census and 2010 Census; current—estimates by analyst
Figure 8. Number of Households by Tenure in the Southern Suburbs Submarket, 2000 to Current
300,000
250,000
200,000
150,000
100,000
50,000
02000 2010 Current
Renter Owner
Ba
ltim
ore
-Co
lum
bia
-To
ws
on
, M
D •
CO
MP
RE
HE
NS
IVE
HO
US
ING
MA
RK
ET
AN
ALY
SIS
11Housing Market Trends Sales Market—Baltimore City Submarket Continued
number of homes for sale. During the 12 months ending May 2018, the submarket had 3.9 months of available housing inventory, down from 4.2 months during the previous 12-month period and the previous peak of 12.4 months of inventory during 2008 (Metropolitan Regional Information Systems, Inc. monthly reports [MRIS]).
Sales of new and existing single-family homes and townhomes in the submarket (more than 98 percent of which were existing sales) increased during the past 6 years in response to steadily improving economic conditions. During the 12 months ending May 2018, approximately 8,425 new and existing single-family homes and townhomes sold in the submarket, representing an increase of 310 homes, or 4 percent, from the 12 months ending May 2017 (MRIS). Home sales increased an average of 12 percent annually during the past 6 years, and the current level of sales is up 76 percent compared with the average of 4,800 homes sold annually from 2009 through 2012. The current level of sales is 16 percent below the average of 10,050 homes sold annually from 2004 through 2006, when the sales market was strongest.
Conditions in the condominium market in the submarket improved at a strong pace during the past 9 years. Additionally, sales growth of condominiums during the period outpaced the rate of increase of single-family home and townhome sales, which is attributed to stronger demand for owner units in the Inner Harbor and downtown portions of the submarket, where condominiums are more prevalent. In the two zip codes that comprise the main portions of the downtown and Inner
Harbor sections of the city, more than one-third of all owner-occupied units were in structures with two or more units, compared with only 6 percent of all owner-occupied units in the remainder of the city (2012–2016 5-year ACS estimates). During the 12 months ending May 2018, approximately 600 new and existing condominiums sold in the submarket, up by 90 units, or 17 percent, compared with the same period a year earlier (MRIS). Condominium sales increased an average of 10 percent annually during the past 9 years, and the current level of sales is at an all-time high.
During the 12 months ending May 2018, the average sales price of new and existing single-family homes and townhomes was relatively unchanged, at $166,300. By comparison, the average sales price increased an average of 5 percent annually during the previous 6 years in response to rapidly increasing sales activity, and the current average price is up 34 percent compared with the 10-year low price of $124,100 during 2011. The average sales price of condominiums during the 12 months ending May 2018 increased 2 percent, to $295,500, compared with the previous 12-month period. The current average sales price is up 61 percent compared with the average price of $183,300 during 2011 and is approaching the all-time high price of $307,400 during 2008.
The rate of seriously delinquent loans (loans that are 90 or more days delinquent or in foreclosure) and real estate owned (REO) properties in the Baltimore City submarket has historically been the highest of the three submarkets in the HMA, which is primarily because of the elevated
Ba
ltim
ore
-Co
lum
bia
-To
ws
on
, M
D •
CO
MP
RE
HE
NS
IVE
HO
US
ING
MA
RK
ET
AN
ALY
SIS
12
unemployment rate in the city. In April 2018, 5.1 percent of home loans in the submarket were seriously delinquent or had transitioned into REO status, down from 6.3 percent in April 2017 and a peak of 13.5 percent in January 2013 (CoreLogic, Inc.). The current rate is higher than both the statewide and nationwide rates of 2.7 and 2.1 percent, respectively. REO sales have made up a relatively large portion of all home sales since 2008, and these low-priced REO home sales have caused the overall average sales price to increase at a relatively slow pace. Since 2008, approximately 19 percent of all home sales were REO sales, up from 4 percent of all home sales from 2005 through 2007.
Single-family homebuilding activity, as measured by the number of single-family homes and townhomes permitted, has historically been very limited in the submarket because of a lack of developable land in the downtown and Inner Harbor portions of the city, where periods of net in-migration have occurred in the past. Homebuilding activity in the submarket was strongest from 2000 through 2006, when an average of 300 homes were permitted annually (Figure 9). Construction activity
declined to an average of 150 homes permitted annually from 2007 through 2013 because of lower levels of home sales. In response to increasing sales activity, however, single-family construction activity from 2014 through 2017 increased to an average of 250 homes permitted annually. During the 12 months ending May 2018, approximately 140 single-family homes were permitted, down 39 percent compared with the 230 homes permitted during the previous 12-month period (preliminary data); the decline was, in part, because of increased net out-migration in recent years. Construction of condominium units has been limited during the past 8 years, which is attributed to a higher demand for rental units in the submarket. Since 2011, an average of 65 condominium units were permitted annually, down compared with the 270 units permitted annually from 2005 through 2010.
Because developable land is limited in the Baltimore City submarket, new construction of owner housing units is mainly limited to smaller townhome developments and condominiums. Alta47 is a 47-unit townhome community in the Locust Point neighborhood and was completed in 2017. Prices for these three- and four-bedroom townhomes start at approximately $500,000 and $535,000, respectively. Skyview, a 50-unit townhome community, was completed in 2017. Prices for these new townhome units range from $330,000 to $434,000 for the three-bedroom homes and $382,700 to $425,000 for the four-bedroom homes. In the condominium market, the 62-unit Four Seasons Private Residences, which is located in the Inner Harbor area, was completed in 2017, and prices for these two-, and
Figure 9. Single-Family Homes Permitted in the Baltimore City Submarket, 2000 to Current
2000
2001
2002
2003
2004
2005
2006
700
600
500
400
300
200
100
0
2008
2009
2010
2011
2013
2018
2017
2016
2015
2014
2012
2007
Notes: Includes townhomes. Current includes data through May 2018.Sources: U.S. Census Bureau, Building Permits Survey; estimates by analyst
Housing Market Trends Sales Market—Baltimore City Submarket Continued
Ba
ltim
ore
-Co
lum
bia
-To
ws
on
, M
D •
CO
MP
RE
HE
NS
IVE
HO
US
ING
MA
RK
ET
AN
ALY
SIS
13Housing Market Trends Sales Market—Baltimore City Submarket Continued
Rental Market—Baltimore City Submarket
The rental housing market, including apartment units and single-family rental homes, in the Baltimore City submarket is currently soft. In 2016, 60 percent of all rental units were in structures with four or fewer units, relatively unchanged compared with 2010 (ACS 1-year data). The overall rental vacancy rate is estimated at 13.5 percent, up from 10.8 percent in 2010 (Figure 10). Rental market conditions were balanced in 2000 but transitioned to soft by 2005 because of strong net out-migration. Conditions slowly transitioned from soft to slightly soft from 2006 through 2014, which is mostly attributed to decreased levels of net out-migration and more young professionals moving into the city. Increased net out-migration and high levels of apartment construction activity, however, have caused conditions to become soft.
Conditions in the apartment market are slightly soft compared with balanced conditions in 2010. During the first quarter of 2018, the apartment vacancy rate was 6.8 percent (RealPage, Inc.). The current rate is up from 6.2 percent during the first quarter of 2017 and a recent low of 3.6 percent during the first quarter of 2012. Recent vacancy rates were elevated throughout the submarket, in part, because of strong net out-migration. During the first quarter of 2018, apartment vacancy rates ranged from 6.1 percent in the Baltimore City East RealPage, Inc.-defined market area to 7.8 percent in in the Baltimore City West market area. During the first quarter of 2018, the average asking rent in the submarket was $1,205, relatively unchanged compared with the first quarter of 2017. Rents were highest in the Downtown Baltimore market area but declined during the past year in response to increasing vacancy rates. During the first quarter of 2018, the average asking rent in the Downtown Baltimore market area, which includes the Inner Harbor, was $1,537, down 3 percent compared with the same period a year earlier.
Multifamily building activity, as measured by the number of units permitted, has been strong since 2016. From 2000 through 2005, an average of 790 multifamily units were permitted annually (Figure 11).
three-bedroom condominium units start at $2.1 million and $5.0 million, respectively.
At this time, no additional homes should to be constructed in the
submarket to avoid soft market conditions. No demand is estimated for new homes in any of the next 3 years because of strong net out-migration.
Note: The current date is June 1, 2018.Sources: 2000 and 2010—2000 Census and 2010 Census; current—estimates by analyst
Figure 10. Rental Vacancy Rates in the Baltimore City Submarket, 2000 to Current
2000 2010 Current
7.6
10.8
13.514.0
12.0
10.0
8.0
6.0
4.0
2.0
0.0
Ba
ltim
ore
-Co
lum
bia
-To
ws
on
, M
D •
CO
MP
RE
HE
NS
IVE
HO
US
ING
MA
RK
ET
AN
ALY
SIS
14
Building activity from 2006 through 2015 increased to an average of 1,025 units permitted annually, which is largely attributed to higher demand for new apartment units, especially in the downtown portion of the city, because of more people with a higher preference for renting moving into the submarket. In response to newly-constructed apartment units being absorbed at a steady pace, construction activity significantly rose during 2016 and 2017, to an average of 2,750 units permitted annually. During the 12 months ending May 2018, approximately 380 multifamily units were permitted, down approximately 55 percent compared with the number of units permitted during the 12 months ending May 2017 (preliminary data). Since 2011, approximately 4 percent of all multifamily units permitted have been for condominiums, down from 17 percent from 2000 through 2010 (analyst’s estimate).
Recent construction activity in the submarket has been mainly in the Inner Harbor or downtown area because of higher demand for units in this portion of the city. Recent
activity includes the 299-unit Hanover Cross Street, which is located in the Federal Hill neighborhood and was completed in April 2018. Rents for these newly-constructed studio, one-bedroom, and two-bedroom units start at $1,600, $1,725, and $2,200, respectively. In the Inner Harbor area, 414 Light Street, which is a 394-unit apartment community, was completed in May 2018. Rents range from $1,875 to $2,125 for the studio units, from $1,825 to $2,925 for the one-bedroom units, and from $3,300 to $4,450 for the two-bedroom units. In the northern portion of the city, construction recently began at The Woodberry, which will have a mix of 284 one-, two-, and three-bedroom apartments once completed by mid-2019.
The submarket is home to nine colleges and universities that house students. The total enrollment at these schools is approximately 53,750, of which, approximately one-fourth are housed in on-campus dormitories. Of the remaining students, an estimated 80 percent reside within the submarket, and student households account for approximately 7 percent of all renter households. During 2013, construction of a new 240-bed dormitory was completed at Maryland Institute College of Art.
At this time, no additional market-rate rental units should to be constructed in the submarket to avoid prolonged soft market conditions. No demand is estimated for new market-rate rental units in any of the next 3 years because of strong net out-migration.
Housing Market Trends Rental Market—Baltimore City Submarket Continued
Figure 11. Multifamily Units Permitted in the Baltimore City Submarket, 2000 to Current
2000
2001
2002
2003
2004
2005
2006
3,000
2,750
2,500
2,250
2,000
1,750
1,500
1,250
1,000
750
500
250
0
2008
2009
2010
2011
2013
2018
2017
2016
2015
2014
2012
2007
Notes: Excludes townhomes. Current includes data through May 2018.Sources: U.S. Census Bureau, Building Permits Survey; estimates by analyst
Ba
ltim
ore
-Co
lum
bia
-To
ws
on
, M
D •
CO
MP
RE
HE
NS
IVE
HO
US
ING
MA
RK
ET
AN
ALY
SIS
15
Sales Market—Northern Suburbs Submarket
The sales housing market in the Northern Suburbs submarket is currently balanced. The current vacancy rate is estimated at 1.5 percent, down slightly compared with 1.7 percent in April 2010 (Table DP-3 at the end of this report). During the 12-months ending May 2018, the submarket had 2.6 months of available housing inventory, down from 3.2 months during the previous 12-month period (MRIS). Sales market conditions in the submarket were balanced from 2000 through 2006 but transitioned to soft from 2007 through 2009 because of net out-migration resulting from more residents choosing to reside in the Baltimore City submarket and job losses during 2008 and 2009. Conditions transitioned into balance from 2010 through 2016 because of net in-migration, improving economic conditions, and limited construction activity and have remained balanced since.
During the 12 months ending May 2018, approximately 15,150 new and existing single-family homes and townhomes sold, relatively unchanged compared with the 12 months ending May 2017 (MRIS). By comparison, home sales increased an average of 12 percent annually from 2012 through 2016, and the current level of sales is up 67 percent compared with the average of 9,075 homes sold annually from 2008 through 2011. Sales activity is down 8 percent from the average of 16,550 homes sold annually during 2004 and 2005, when net in-migration was strongest.
New and existing condominium sales increased during the past 7 years, and the current level of sales is at a peak level. During the 12 months ending
May 2018, approximately 1,575 condominiums sold, representing an increase of 40 units, or 2 percent, compared with the previous 12-month period. Sales activity increased an average of 9 percent annually during the past 7 years, and the current level of sales is up 81 percent compared with the 870 condominiums sold annually during 2010 and 2011.
The average sales prices of new and existing single-family homes and townhomes and condominiums have increased during the past 6 years. The rates of growth, however, have been slow, which is attributed to higher-price new homes for sale comprising a smaller portion of all home sales while lower-priced REO sales became a larger portion of sales. Since 2013, new home sales were approximately 7 percent of all home sales in the submarket (CoreLogic, Inc. with adjustments by analyst). By comparison, from 2005 through 2008, when average sales prices were at peak levels, new home sales accounted for 12 percent of all home sales in the submarket. REO sales, on the other hand, were approximately 12 percent of all home sales since 2013, compared with 2 percent of sales from 2005 through 2008. During the 12 months ending May 2018, the average sales price of new and existing single-family homes increased 5 percent to $297,500, while the average sales price of condominiums was relatively unchanged at $187,800 (MRIS). Average sales prices of these homes increased an average of 2 and 1 percent annually, respectively during the past 6 years. The current average sales price of single-family homes and townhomes is up 14 percent
Ba
ltim
ore
-Co
lum
bia
-To
ws
on
, M
D •
CO
MP
RE
HE
NS
IVE
HO
US
ING
MA
RK
ET
AN
ALY
SIS
16
compared with the average sales price of $260,100 during 2010 and 2011, but down 4 percent compared with the $309,900 average price from 2005 through 2008. For condominiums, the current price is up 9 percent compared with the average price of $172,100 during 2011 and 2012 but is down 11 percent compared with the average sales price of $210,800 from 2005 through 2008.
The rate of seriously delinquent loans and REO properties in the submarket is similar to the statewide rate. In April 2018, 2.9 percent of home loans in the submarket were seriously delinquent or had transitioned into REO status, down from 3.5 percent in April 2017 and a peak of 7.7 percent in January 2013 (CoreLogic, Inc.).
Single-family homebuilding slightly increased during the past 6 years. Recent construction levels, however, are well below those from the early-to-mid 2000s, when the sales market was strongest. From 2000 through 2007, an average of 4,200 homes were permitted annually (Figure 12). In response to declining levels of home sales, construction activity declined to an average of 1,275 homes permitted annually from 2008 through 2011. Steadily improving sales market
conditions in the submarket, however, led to construction activity slightly increasing to an average of 1,675 homes permitted annually from 2012 through 2017. During the 12 months ending May 2018, approximately 2,150 single-family homes were permitted, up 30 percent compared with the 1,650 homes permitted during the previous 12-month period (preliminary data).
Recent construction activity includes The Preserve at Windlass Run, which is located in Baltimore County. More than two-thirds of the 424 planned single-family homes and townhomes have been completed since 2015, with the remaining homes to be completed as they are sold. Prices of these newly-constructed townhomes and single-family homes start at $275,000 and $415,000, respectively. In Harford County, fewer than 20 percent of the 85 planned single-family homes have been completed at Overlook at Scenic Manor, which is located in the city of Havre de Grace, with the remaining homes expected to be built as they are sold. Prices for these four bedroom, two-and-a-half bathroom homes range from $350,000 to $386,000. During the 3-year forecast period, demand is estimated for 5,550 new single-family homes, townhomes, and condominiums in the submarket (Table 1). The 550 homes currently under construction will satisfy some of the demand. Demand is expected to slightly increase in each of the 3 years of the forecast period because of increasing net in-migration and steadily improving economic conditions. New home prices in the submarket are expected to start at $225,000 and approximately 55 percent of the demand is estimated to be for homes priced from $300,000 to $499,999 (Table 4).
Figure 12. Single-Family Homes Permitted in the Northern Suburbs Submarket, 2000 to Current
2000
2001
2002
2003
2004
2005
2006
6,000
5,000
4,000
3,000
2,000
1,000
0
2008
2009
2010
2011
2013
2018
2017
2016
2015
2014
2012
2007
Notes: Includes townhomes. Current includes data through May 2018.Sources: U.S. Census Bureau, Building Permits Survey; estimates by analyst
Housing Market Trends Sales Market—Northern Suburbs Submarket Continued
Ba
ltim
ore
-Co
lum
bia
-To
ws
on
, M
D •
CO
MP
RE
HE
NS
IVE
HO
US
ING
MA
RK
ET
AN
ALY
SIS
17
Table 4. Estimated Demand for New Market-Rate Sales Housing in the Northern Suburbs Submarket During the Forecast Period
Price Range ($) Units of PercentFrom To Demand of Total
Notes: Numbers may not add to totals because of rounding. Monthly rent does not include utilities or concessions. The 550 homes currently under construction in the submarket will likely satisfy some of the forecast demand. The forecast period is June 1, 2018, to June 1, 2021.Source: Estimates by analyst
Rental Market—Northern Suburbs Submarket
The rental housing market, including apartment units and single-family rental homes, in the Northern Suburbs submarket is currently balanced. In 2016, 44 percent of all rental units were in structures with four or fewer units, relatively unchanged compared with 2010 (ACS 1-year data). The overall rental vacancy rate is estimated at 6.2 percent, down from 7.2 percent in 2010 (Figure 13). Rental market conditions were balanced from 2000 through 2005 but transitioned to slightly soft from 2006 through 2009 because of net out-migration. Conditions transitioned back into balance from 2010 through 2013 because of strong net in-migration
and limited apartment construction activity and have remained balanced since.
Conditions in the apartment market are also balanced, and vacancy rates have declined since 2009 because of limited apartment construction activity. During the first quarter of 2018, the apartment vacancy rate was 5.7 percent (RealPage, Inc.). The current rate is up slightly from 5.5 percent during the first quarter of 2017 but down from the previous high of 7.4 percent during the first quarter of 2009. During the first quarter of 2018, the average asking rent in the submarket was $1,101, up 3 percent compared with the first quarter of 2017. Rents were highest in the Towson/Hunt Valley market area, which is partially attributed to recent apartment construction near Towson University, which tends to command higher rents due to the desirability of the area because of an abundance of nearby dining and entertainment options. During the first quarter of 2018, the average asking rent in the market area was $1,313, up 1 percent compared with the same period a year earlier.
Note: The current date is June 1, 2018.Sources: 2000 and 2010—2000 Census and 2010 Census; current—estimates by analyst
Figure 13. Rental Vacancy Rates in the Northern Suburbs Submarket, 2000 to Current
2000 2010 Current
5.6
7.2
6.2
8.0
7.0
6.0
5.0
4.0
3.0
2.0
1.0
0.0
Housing Market Trends Sales Market—Northern Suburbs Submarket Continued
Ba
ltim
ore
-Co
lum
bia
-To
ws
on
, M
D •
CO
MP
RE
HE
NS
IVE
HO
US
ING
MA
RK
ET
AN
ALY
SIS
18
Multifamily construction activity has been slightly elevated since 2013, but recent levels are well below those from the early-to-mid 2000s, when net in-migration into the submarket was strongest. From 2000 through 2005, an average of 1,250 multifamily units were permitted annually (Figure 14). In response to net out-migration and slow absorption of newly-constructed apartment units, building activity slowed to an average of 680 units permitted annually from 2006 through 2012. Declining apartment vacancy rates, however, caused building activity to slightly increase to an average of 920 units permitted annually from 2013 through 2017. During the 12 months ending May 2018, approximately 650 multifamily units were permitted, down 40 percent compared with the number of units permitted during the 12 months ending May 2017 (preliminary data). Since 2012, approximately 5 percent of all multifamily units permitted have been for condominiums, down from 9 percent from 2000 through 2011 (analyst’s estimate).
Recent apartment construction activity in the submarket has been
strongest in communities with significant retail and entertainment options available within walking distance. Recent activity includes the 356-unit Overlook at Franklin Square, which is located in Baltimore County and was completed in late 2017. Rents for these newly-completed one-, two-, and three-bedroom apartment units start at $1,325, $1,550, and $2,025, respectively. In Towson, Baltimore County, three apartment communities with approximately 430 units total were completed during 2017 near Towson Town Center, which is close to Towson University. The largest of these apartment communities was The Southerly, which has 175 units with rents for one-, two-, and three-bedroom units starting at $1,500, $1,750, and $2,700, respectively. Recent construction in Harford County includes the 192-unit Residences at Summerlin, which is located in the city of Aberdeen and was completed in late 2017. Rents for these one-, two-, and three-bedroom apartments start at $1,300, $1,350, and $1,550, respectively.
The submarket is home to three colleges and universities that house students. The total enrollment at these schools is approximately 34,400, of which, more than one-third are housed in on-campus dormitories. Of the remaining students, an estimated 95 percent reside within the submarket, and student households account for approximately 5 percent of all renter households in the submarket. At Towson University, a former hotel is currently being converted to a new 200-bed dormitory, which is expected to be completed by fall 2018.
During the 3-year forecast period, demand is expected for 2,625 new
Figure 14. Multifamily Units Permitted in the Northern Suburbs Submarket, 2000 to Current
2000
2001
2002
2003
2004
2005
2006
2,000
1,800
1,600
1,400
1,200
1,000
800
600
400
200
0
2008
2009
2010
2011
2013
2018
2017
2016
2015
2014
2012
2007
Notes: Excludes townhomes. Current includes data through May 2018.Sources: U.S. Census Bureau, Building Permits Survey; estimates by analyst
Housing Market Trends Rental Market—Northern Suburbs Submarket Continued
Ba
ltim
ore
-Co
lum
bia
-To
ws
on
, M
D •
CO
MP
RE
HE
NS
IVE
HO
US
ING
MA
RK
ET
AN
ALY
SIS
19
market-rate rental units (Table 1). The 2,025 units under construction will satisfy a portion of the demand. Demand is expected to be relatively steady throughout the forecast period, but new supply should not be targeted to become available until the third
year of the forecast period because the units under construction will satisfy all demand during the first and second years. Table 5 shows the estimated demand by rent level and number of bedrooms for new market-rate rental housing in the submarket.
Notes: Numbers may not add to totals because of rounding. Monthly rent does not include utilities or concessions. The 2,025 units currently under construction will likely satisfy some of the estimated. The forecast period is June 1, 2018, to June 1, 2021.Source: Estimates by analyst
Table 5. Estimated Demand for New Market-Rate Rental Housing in the Northern Suburbs During the Forecast Period
Zero Bedrooms One Bedroom Two Bedrooms Three or More Bedrooms
Monthly Rent ($)
Units of Demand
Monthly Rent ($)
Units of Demand
Monthly Rent ($)
Units of Demand
Monthly Rent ($)
Units of Demand
1,200 to 1,399 65 1,300 to 1,499 630 1,350 to 1,699 330 1,550 to 1,899 201,400 to 1,599 50 1,500 to 1,699 310 1,700 to 1,899 650 1,900 to 2,099 351,600 or more 15 1,700 or more 100 1,900 or more 330 2,100 to 2,299 50
2,300 or more 25Total 130 Total 1,050 Total 1,300 Total 130
The sales housing market in the Southern Suburbs submarket is currently balanced. The current vacancy rate is estimated at 1.6 percent, down slightly compared with 1.7 percent in April 2010 (Table DP-4 at the end of this report). During the 12-months ending May 2018, the submarket had 2.9 months of available housing inventory, down from 3.3 months during the previous 12-month period (MRIS). Conditions in the submarket were slightly tight from 2000 through 2004 because of strong net in-migration. Net in-migration continued from 2005 through 2008, but at a slightly slower pace, resulting in conditions transitioning to slightly soft. Strong net in-migration, which was primarily because of job growth at Fort George G. Meade, led to conditions being brought into balance from 2009 through 2013, and conditions have remained balanced since.
Sales of new and existing single-family homes and townhomes slightly declined during the past year, which is partially attributed to slower economic growth. During the 12 months ending May 2018, approximately 12,000 new and existing homes sold, representing a decrease of 320 homes, or 3 percent, from the 12 months ending May 2017 (MRIS). Despite the recent decrease, the current level of sales is up 73 percent compared with the 6,925 homes sold during 2011 because sales activity increased an average of 12 percent annually from 2012 through 2016. During the 12 months ending May 2018, the average sales price of new and existing single-family homes and townhomes increased 4 percent to $431,200. The average sales price in the submarket is higher than the other submarkets in the HMA, in part, because of the submarket’s proximity to the
Sales Market—Southern Suburbs Submarket
Housing Market Trends Rental Market—Northern Suburbs Submarket Continued
Ba
ltim
ore
-Co
lum
bia
-To
ws
on
, M
D •
CO
MP
RE
HE
NS
IVE
HO
US
ING
MA
RK
ET
AN
ALY
SIS
20
Washington-Arlington-Alexandria, DC-VA-MD-WV Metropolitan Statistical Area. The average sales price in the submarket has also increased faster than in the other submarkets in the HMA, which is partially attributed to low-priced REO sales comprising a smaller portion of all home sales in the HMA. Since 2008, approximately 8 percent of all home sales were REO sales, up from 1 percent of all sales from 2005 through 2007 (CoreLogic, Inc. with adjustments by the analyst).
Condominium sales during the past year accounted for nearly 15 percent of all sales in the submarket, which was the highest of the three submarkets in the HMA. During the 12 months ending May 2018, approximately 2,100 condominiums sold, up by 40 units, or 2 percent, compared with the same period a year earlier (MRIS). The number of condominiums sold increased in each of the past 7 years, up an average of 11 percent annually, and number of condominium units sold during the past year is more than double the 1,000 units sold during 2011. During the 12 months ending May 2018, the average sales price of new and
existing condominium units increased 1 percent, to $262,200. The average sales price increased an average of 2 percent annually during the past 3 years, compared with an average 3-percent annual decline during the same 12-month periods from 2009 through 2015.
The rate of seriously delinquent loans and REO properties in the submarket is the lowest in the HMA and currently below the statewide and nationwide rates. Rates in the submarket also did not reach the same peaks as the other two submarkets, which is partially attributed to strong job growth at Fort George G. Meade during the recession. In April 2018, 1.6 percent of home loans in the submarket were seriously delinquent or had transitioned into REO status, down from 2.0 percent in April 2017 and a peak of 5.6 percent in August 2012 (CoreLogic, Inc.).
Single family homebuilding activity has been strong during the past 5 years. Construction activity averaged 3,425 homes permitted from 2000 through 2007 but decreased to an average of 1,900 homes permitted annually from 2008 through 2012 in response to lower levels of sales activity (Figure 15). From 2013 through 2017, building activity increased to an average of 2,825 homes permitted annually, which is partially attributed to construction of new active-adult retirement communities in Anne Arundel County. During the 12 months ending May 2018, approximately 2,975 single-family homes were permitted, relatively unchanged compared with the number of homes permitted during the previous 12-month period (preliminary data).
Figure 15. Single-Family Homes Permitted in the Southern Suburbs Submarket, 2000 to Current
2000
2001
2002
2003
2004
2005
2006
5,000
4,000
3,000
2,000
1,000
0
2008
2009
2010
2011
2013
2018
2017
2016
2015
2014
2012
2007
Notes: Includes townhomes. Current includes data through May 2018.Sources: U.S. Census Bureau, Building Permits Survey; estimates by analyst
Housing Market Trends Sales Market—Southern Suburbs Submarket Continued
Ba
ltim
ore
-Co
lum
bia
-To
ws
on
, M
D •
CO
MP
RE
HE
NS
IVE
HO
US
ING
MA
RK
ET
AN
ALY
SIS
21
Recent construction activity has mainly been concentrated in Anne Arundel County because of an abundance of developable land relative to the other two counties in the submarket. Construction continues at Two Rivers, which is a planned community that will have a mix of family and age-restricted homes in Odenton, Anne Arundel County. More than 15 percent of the 2,000 planned single-family homes and townhomes have been completed since 2015 with the rest of the homes expected to be completed during the next 5 to 10 years. Prices range from
$392,900 to $615,000 for the age-restricted homes and from $650,000 to $700,000 for the homes with no age restrictions. In Howard County, recent construction activity includes Morris Place, a 200-unit townhome community located in the community of Elkridge. All units were completed between 2015 and 2018, and prices of the newly-constructed three- and four-bedroom homes range from $305,800 to $512,100.
During the 3-year forecast period, demand is estimated for 6,875 new single-family homes, townhomes, and condominiums in the submarket (Table 1). The 500 homes currently under construction will satisfy some of the demand. Demand is expected to slightly increase in each of the 3 years of the forecast period because of increasing net in-migration and steadily improving economic conditions. New home prices in the submarket are expected to start at $200,000 and nearly two-thirds of the demand is estimated to be for homes priced from $300,000 to $599,999 (Table 6).
Table 6. Estimated Demand for New Market-Rate Sales Housing in the Southern Suburbs During the Forecast Period
Price Range ($) Units of PercentFrom To Demand of Total
Notes: Numbers may not add to totals because of rounding. The 500 homes currently under construction in the submarket will likely satisfy some of the forecast demand. The forecast period is June 1, 2018, to June 1, 2021.Source: Estimates by analyst
Rental Market—Southern Suburbs Submarket
The rental housing market, including apartment units and single-family rental homes, in the Southern Suburbs submarket is currently slightly soft. During the 5-year period from 2012 to 2016, 45 percent of all rental units were in structures with four or fewer units, relatively unchanged compared with the previous 5-year period (2012–2016 ACS 5-year data). The overall rental vacancy rate is estimated at 7.8 percent, up from 6.4 percent in 2010 (Figure 16). Rental market conditions were slightly tight from 2000 through
2004 but transitioned to slightly soft from 2005 through 2008 because of low levels of net in-migration. Conditions again transitioned to slightly tight from 2009 through 2012 because of elevated levels of net in-migration. Since 2013, however, conditions have softened and vacancy rates have risen, which is largely attributed to increased apartment construction activity despite lower levels of net in-migration.
Conditions in the apartment market are slightly soft compared with balanced conditions in 2010. During
Housing Market Trends Sales Market—Southern Suburbs Submarket Continued
Ba
ltim
ore
-Co
lum
bia
-To
ws
on
, M
D •
CO
MP
RE
HE
NS
IVE
HO
US
ING
MA
RK
ET
AN
ALY
SIS
22
the first quarter of 2018, the apartment vacancy rate was 6.1 percent (RealPage, Inc.). The current rate was unchanged compared with the first quarter of 2017, but up from the 4.3-percent rate during the first quarter of 2010. The average asking rent during the first quarter of 2018 declined 1 percent, to $1,233, compared with the first quarter of 2017, which is attributed to high vacancy rates at newly-constructed apartments that are still in lease-up.
Multifamily building activity is down slightly since 2017 after construction levels were strong during the previous 6 years. From 2000 through 2009, an
average of 1,025 multifamily units were permitted annually (Figure 17). Construction activity increased to an average of 1,700 units permitted annually from 2010 through 2016 in response to tightening apartment market conditions. Building activity, however, declined to 860 units permitted during 2017, which is partially attributed to elevated apartment vacancy rates. During the 12 months ending May 2018, approximately 1,175 multifamily units were permitted, up 29 percent compared with the number of units permitted during the 12 months ending May 2017 (preliminary data). Since 2011, approximately 5 percent of all multifamily units permitted have been for condominiums, down from 22 percent from 2000 through 2010 (estimate by analyst).
Recent construction activity in the submarket has primarily been concentrated in Anne Arundel and Howard Counties because of stronger in-migration to these areas. The Vine apartment community, which contains 283 units and is located in the city of Laurel in Howard County, was completed in early 2018. Rents range from $1,725 to $1,950 for one-bedroom units, $2,175 to $2,675 for two-bedroom units, and $2,750 to $2,925 for three-bedroom units.
Note: The current date is June 1, 2018.Sources: 2000 and 2010—2000 Census and 2010 Census; current—estimates by analyst
Figure 16. Rental Vacancy Rates in the Southern Suburbs Submarket, 2000 to Current
2000 2010 Current
4.2
6.4
7.88.0
7.0
6.0
5.0
4.0
3.0
2.0
1.0
0.0
Housing Market Trends Rental Market—Southern Suburbs Submarket Continued
Figure 17. Multifamily Units Permitted in the Southern Suburbs Submarket, 2000 to Current
2000
2001
2002
2003
2004
2005
2006
2,500
2,250
2,000
1,750
1,500
1,250
1,000
750
500
250
0
2008
2009
2010
2011
2013
2018
2017
2016
2015
2014
2012
2007
Notes: Excludes townhomes. Current includes data through May 2018.Sources: U.S. Census Bureau, Building Permits Survey; estimates by analyst
Ba
ltim
ore
-Co
lum
bia
-To
ws
on
, M
D •
CO
MP
RE
HE
NS
IVE
HO
US
ING
MA
RK
ET
AN
ALY
SIS
23
Construction is under way at the 344-unit Verde II at Howard Square, which is expected to be completed in mid-2019. The community will be in the community of Elkridge, Howard County, and will add to the existing 300-unit first phase of the community that was completed in 2013. In Anne Arundel County, recent construction includes 416 units at The Residences at Annapolis Junction, which is in the community in Annapolis Junction and was completed in mid-2017 with rents for studio, one-bedroom, and two-bedroom units starting at $1,400, $1,550, and $2,225, respectively.
During the 3-year forecast period, demand is expected for 3,800 new market-rate rental units (Table 1). The 1,300 units under construction will satisfy a portion of the demand. Demand is expected to be relatively steady throughout the forecast period, but new supply should be targeted to come online during the second and third years of the forecast period because the units under construction will satisfy all demand during the first year. Table 7 shows the estimated demand by rent level and number of bedrooms for new market-rate rental housing in the submarket.
Notes: Numbers may not add to totals because of rounding. Monthly rent does not include utilities or concessions. The 1,300 units currently under construction will likely satisfy some of the estimated demand.Source: Estimates by analyst
Table 7. Estimated Demand for New Market-Rate Rental Housing in the Southern Suburbs During the Forecast Period
Zero Bedrooms One Bedroom Two Bedrooms Three or More Bedrooms
Monthly Rent ($)
Units of Demand
Monthly Rent ($)
Units of Demand
Monthly Rent ($)
Units of Demand
Monthly Rent ($)
Units of Demand
1,200 to 1,399 20 1,300 to 1,499 170 1,550 to 1,799 340 1,800 to 1,999 301,400 to 1,599 110 1,500 to 1,699 770 1,800 to 1,999 510 2,000 to 2,199 401,600 or more 55 1,700 to 1,899 600 2,000 to 2,199 340 2,200 to 2,399 50
1,900 or more 170 2,200 to 2,399 260 2,400 to 2,599 402,400 to 2,599 170 2,600 to 2,799 202,600 or more 85 2,800 or more 20
Total 190 Total 1,700 Total 1,700 Total 190
Housing Market Trends Rental Market—Southern Suburbs Submarket Continued
Ba
ltim
ore
-Co
lum
bia
-To
ws
on
, M
D •
CO
MP
RE
HE
NS
IVE
HO
US
ING
MA
RK
ET
AN
ALY
SIS
24 Data Profiles
Notes: Numbers may not add to totals because of rounding. Employment data represent annual averages for 2000, 2010, and the 12 months through May 2018. Median Family Incomes are for 1999, 2009, and 2016. Sources: U.S. Census Bureau; U.S. Department of Housing and Urban Development; estimates by analyst
Table DP-1. Baltimore-Columbia-Towson HMA Data Profile, 2000 to CurrentAverage Annual Change (%)
Notes: Numbers may not add to totals because of rounding. Median Family Incomes are for 1999, 2009, and 2016. The current date is June 1, 2018.Sources: U.S. Census Bureau; U.S. Department of Housing and Urban Development; estimates by analyst
Table DP-3. Northern Suburbs Submarket Data Profile, 2000 to Current
Notes: Numbers may not add to totals because of rounding. The current date is June 1, 2018. Sources: U.S. Census Bureau; U.S. Department of Housing and Urban Development; estimates by analyst
Ba
ltim
ore
-Co
lum
bia
-To
ws
on
, M
D •
CO
MP
RE
HE
NS
IVE
HO
US
ING
MA
RK
ET
AN
ALY
SIS
25
Table DP-4. Southern Suburbs Submarket Data Profile, 2000 to Current
Notes: Numbers may not add to totals because of rounding. The current date is June 1, 2018. Sources: U.S. Census Bureau; U.S. Department of Housing and Urban Development; estimates by analyst
Data Profiles Continued
Ba
ltim
ore
-Co
lum
bia
-To
ws
on
, M
D •
CO
MP
RE
HE
NS
IVE
HO
US
ING
MA
RK
ET
AN
ALY
SIS
26
Data Definitions and Sources
2000: 4/1/2000—U.S. Decennial Census
2010: 4/1/2010—U.S. Decennial Census
Current date: 6/1/2018—Estimates by the
analyst
Forecast period: 6/1/2018–6/1/2021—Estimates
by the analyst
The metropolitan statistical definition noted
in this report is based upon the delineations
established by the Office of Management and
Budget (OMB) in the OMB Bulletin dated
February 28, 2013.
Demand: The demand estimates in the analysis
are not a forecast of building activity. They are
the estimates of the total housing production
needed to achieve a balanced market at the end
of the 3-year forecast period given conditions on
the as-of date of the analysis, growth, losses, and
excess vacancies. The estimates do not account
for units currently under construction or units in
the development pipeline.
Other Vacant Units: In this analysis conducted
by the U.S. Department of Housing and Urban
Development (HUD), other vacant units include
all vacant units that are not available for sale or
for rent. The term therefore includes units rented