Comprehensive quantitative analysis of central carbon and amino-acid metabolism in Saccharomyces cerevisiae under multiple conditions by targeted proteomics Roeland Costenoble 1,5 , Paola Picotti 1,5, *, Lukas Reiter 1,2 , Robert Stallmach 1 , Matthias Heinemann 1,3 , Uwe Sauer 1 and Ruedi Aebersold 1,4 1 Department of Biology, Institute of Molecular Systems Biology, ETH Zurich, Zurich, Switzerland, 2 Institute of Molecular Biology & PhD program in Molecular Life Sciences, University of Zurich, Zurich, Switzerland, 3 Molecular Systems Biology, Groningen Biomolecular Sciences and Biotechnology Institute, University of Groningen, Groningen, The Netherlands and 4 Faculty of Science, University of Zurich, Zurich, Switzerland 5 These authors contributed equally to this work * Corresponding author. Institute of Molecular Systems Biology, ETH Zurich, Zurich ch8093, Switzerland. Tel.: þ 41 44 633 1071; Fax: þ 41 44 633 1051; E-mail: [email protected]Received 30.8.10; accepted 26.11.10 Decades of biochemical research have identified most of the enzymes that catalyze metabolic reactions in the yeast Saccharomyces cerevisiae. The adaptation of metabolism to changing nutritional conditions, in contrast, is much less well understood. As an important stepping stone toward such understanding, we exploit the power of proteomics assays based on selected reaction monitoring (SRM) mass spectrometry to quantify abundance changes of the 228 proteins that constitute the central carbon and amino-acid metabolic network in the yeast Saccharomyces cerevisiae, at five different metabolic steady states. Overall, 90% of the targeted proteins, including families of isoenzymes, were consistently detected and quantified in each sample, generating a proteomic data set that represents a nutritionally perturbed biological system at high reproduci- bility. The data set is near comprehensive because we detect 95–99% of all proteins that are required under a given condition. Interpreted through flux balance modeling, the data indicate that S. cerevisiae retains proteins not necessarily used in a particular environment. Further, the data suggest differential functionality for several metabolic isoenzymes. Molecular Systems Biology 7: 464; published online1 February 2011; doi:10.1038/msb.2010.122 Subject Categories: proteomics Keywords: metabolism; S. cerevisiae; SRM; targeted proteomics This is an open-access article distributed under the terms of the Creative Commons Attribution Noncommercial Share Alike 3.0 Unported License, which allows readers to alter, transform, or build upon the article and then distribute the resulting work under the same or similar license to this one. The work must be attributed back to the original author and commercial use is not permitted without specific permission. Introduction Systems biology aims at the comprehensive description of biological systems and ultimately at predicting the behavior of the system from the dynamic and quantitative interactions of its constituting components (Kitano, 2002b; Sauer et al, 2007). Among the cellular systems, metabolism is unique because the topology of the network is almost completely known (Duarte et al, 2007; Feist et al, 2009). Specifically, most of the reactions, the catalyzing enzymes, the enzyme-encoding genes and the converted metabolites are known. While we can also monitor the integrated network operation in the form of metabolite fluxes (Sauer, 2006), we do not yet understand how the behavior of the system emerges from the interaction of the system’s components. To establish this link, mathematical models are needed (Kitano, 2002a; Aldridge et al, 2006), whose development in turn requires computational tools (Heinemann and Sauer, 2010) and quantitative, comprehen- sive data on the response of network components to external and internal stimuli (Sauer et al, 2007). A genome-scale stoichiometric model of the metabolic reaction network in yeast (Kuepfer et al, 2005) that was recently updated through a community consensus (Herrga ˚rd et al, 2008) is arguably one of the topologically most complete biological systems. In this model, 177 stoichiometrically distinct metabolic reactions—catalyzed by 210 enzymes, including isoenzymes—represent central carbon and amino- acid metabolism. A particular feature of this metabolic system is the large number of isoenzymes; i.e., distinct proteins that catalyze identical reactions and often exhibit a high degree of Molecular Systems Biology 7; Article number 464; doi:10.1038/msb.2010.122 Citation: Molecular Systems Biology 7:464 & 2011 EMBO and Macmillan Publishers Limited All rights reserved 1744-4292/11 www.molecularsystemsbiology.com & 2011 EMBO and Macmillan Publishers Limited Molecular Systems Biology 2011 1
Transcript
Comprehensive quantitative analysis of central carbonand amino-acid metabolism in Saccharomycescerevisiae under multiple conditions by targetedproteomics
1 Department of Biology, Institute of Molecular Systems Biology, ETH Zurich, Zurich, Switzerland, 2 Institute of Molecular Biology & PhD program in Molecular LifeSciences, University of Zurich, Zurich, Switzerland, 3 Molecular Systems Biology, Groningen Biomolecular Sciences and Biotechnology Institute, University ofGroningen, Groningen, The Netherlands and 4 Faculty of Science, University of Zurich, Zurich, Switzerland5 These authors contributed equally to this work* Corresponding author. Institute of Molecular Systems Biology, ETH Zurich, Zurich ch8093, Switzerland. Tel.: þ 41 44 633 1071; Fax: þ 41 44 633 1051;E-mail: [email protected]
Received 30.8.10; accepted 26.11.10
Decades of biochemical research have identified most of the enzymes that catalyze metabolicreactions in the yeast Saccharomyces cerevisiae. The adaptation of metabolism to changingnutritional conditions, in contrast, is much less well understood. As an important stepping stonetoward such understanding, we exploit the power of proteomics assays based on selected reactionmonitoring (SRM) mass spectrometry to quantify abundance changes of the 228 proteins thatconstitute the central carbon and amino-acid metabolic network in the yeast Saccharomycescerevisiae, at five different metabolic steady states. Overall, 90% of the targeted proteins, includingfamilies of isoenzymes, were consistently detected and quantified in each sample, generating aproteomic data set that represents a nutritionally perturbed biological system at high reproduci-bility. The data set is near comprehensive because we detect 95–99% of all proteins that are requiredunder a given condition. Interpreted through flux balance modeling, the data indicate thatS. cerevisiae retains proteins not necessarily used in a particular environment. Further, the datasuggest differential functionality for several metabolic isoenzymes.Molecular Systems Biology 7: 464; published online 1 February 2011; doi:10.1038/msb.2010.122Subject Categories: proteomicsKeywords: metabolism; S. cerevisiae; SRM; targeted proteomics
This is an open-access article distributed under the terms of the Creative Commons AttributionNoncommercial Share Alike 3.0 Unported License, which allows readers to alter, transform, or build uponthe article and thendistribute the resultingwork under the sameorsimilar license to thisone. Thework mustbe attributed back to the original author and commercial use is not permitted without specific permission.
Introduction
Systems biology aims at the comprehensive description ofbiological systems and ultimately at predicting the behaviorof the system from the dynamic and quantitative interactionsof its constituting components (Kitano, 2002b; Sauer et al,2007). Among the cellular systems, metabolism is uniquebecause the topology of the network is almost completelyknown (Duarte et al, 2007; Feist et al, 2009). Specifically, mostof the reactions, the catalyzing enzymes, the enzyme-encodinggenes and the converted metabolites are known. While we canalso monitor the integrated network operation in the form ofmetabolite fluxes (Sauer, 2006), we do not yet understand howthe behavior of the system emerges from the interaction of thesystem’s components. To establish this link, mathematical
models are needed (Kitano, 2002a; Aldridge et al, 2006),whose development in turn requires computational tools(Heinemann and Sauer, 2010) and quantitative, comprehen-sive data on the response of network components to externaland internal stimuli (Sauer et al, 2007).
A genome-scale stoichiometric model of the metabolicreaction network in yeast (Kuepfer et al, 2005) that wasrecently updated through a community consensus (Herrgardet al, 2008) is arguably one of the topologically most completebiological systems. In this model, 177 stoichiometricallydistinct metabolic reactions—catalyzed by 210 enzymes,including isoenzymes—represent central carbon and amino-acid metabolism. A particular feature of this metabolic systemis the large number of isoenzymes; i.e., distinct proteins thatcatalyze identical reactions and often exhibit a high degree of
Molecular Systems Biology 7; Article number 464; doi:10.1038/msb.2010.122Citation: Molecular Systems Biology 7:464& 2011 EMBO and Macmillan Publishers Limited All rights reserved 1744-4292/11www.molecularsystemsbiology.com
& 2011 EMBO and Macmillan Publishers Limited Molecular Systems Biology 2011 1
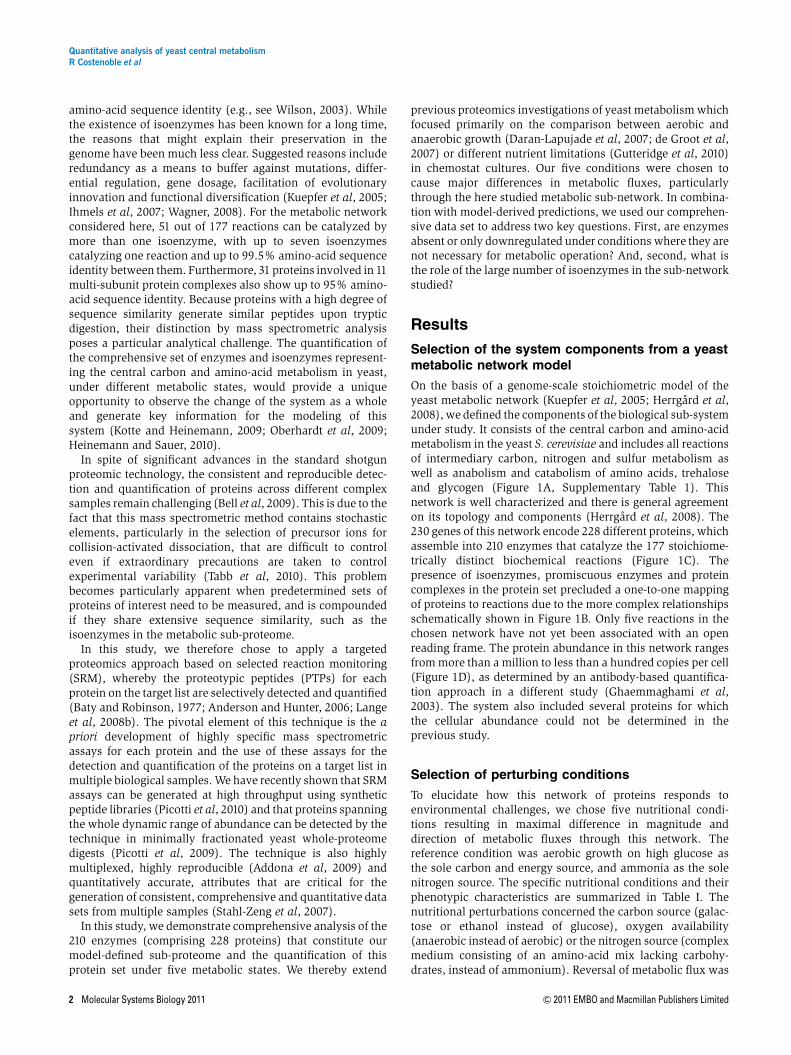
amino-acid sequence identity (e.g., see Wilson, 2003). Whilethe existence of isoenzymes has been known for a long time,the reasons that might explain their preservation in thegenome have been much less clear. Suggested reasons includeredundancy as a means to buffer against mutations, differ-ential regulation, gene dosage, facilitation of evolutionaryinnovation and functional diversification (Kuepfer et al, 2005;Ihmels et al, 2007; Wagner, 2008). For the metabolic networkconsidered here, 51 out of 177 reactions can be catalyzed bymore than one isoenzyme, with up to seven isoenzymescatalyzing one reaction and up to 99.5% amino-acid sequenceidentity between them. Furthermore, 31 proteins involved in 11multi-subunit protein complexes also show up to 95% amino-acid sequence identity. Because proteins with a high degree ofsequence similarity generate similar peptides upon trypticdigestion, their distinction by mass spectrometric analysisposes a particular analytical challenge. The quantification ofthe comprehensive set of enzymes and isoenzymes represent-ing the central carbon and amino-acid metabolism in yeast,under different metabolic states, would provide a uniqueopportunity to observe the change of the system as a wholeand generate key information for the modeling of thissystem (Kotte and Heinemann, 2009; Oberhardt et al, 2009;Heinemann and Sauer, 2010).
In spite of significant advances in the standard shotgunproteomic technology, the consistent and reproducible detec-tion and quantification of proteins across different complexsamples remain challenging (Bell et al, 2009). This is due to thefact that this mass spectrometric method contains stochasticelements, particularly in the selection of precursor ions forcollision-activated dissociation, that are difficult to controleven if extraordinary precautions are taken to controlexperimental variability (Tabb et al, 2010). This problembecomes particularly apparent when predetermined sets ofproteins of interest need to be measured, and is compoundedif they share extensive sequence similarity, such as theisoenzymes in the metabolic sub-proteome.
In this study, we therefore chose to apply a targetedproteomics approach based on selected reaction monitoring(SRM), whereby the proteotypic peptides (PTPs) for eachprotein on the target list are selectively detected and quantified(Baty and Robinson, 1977; Anderson and Hunter, 2006; Langeet al, 2008b). The pivotal element of this technique is the apriori development of highly specific mass spectrometricassays for each protein and the use of these assays for thedetection and quantification of the proteins on a target list inmultiple biological samples. We have recently shown that SRMassays can be generated at high throughput using syntheticpeptide libraries (Picotti et al, 2010) and that proteins spanningthe whole dynamic range of abundance can be detected by thetechnique in minimally fractionated yeast whole-proteomedigests (Picotti et al, 2009). The technique is also highlymultiplexed, highly reproducible (Addona et al, 2009) andquantitatively accurate, attributes that are critical for thegeneration of consistent, comprehensive and quantitative datasets from multiple samples (Stahl-Zeng et al, 2007).
In this study, we demonstrate comprehensive analysis of the210 enzymes (comprising 228 proteins) that constitute ourmodel-defined sub-proteome and the quantification of thisprotein set under five metabolic states. We thereby extend
previous proteomics investigations of yeast metabolism whichfocused primarily on the comparison between aerobic andanaerobic growth (Daran-Lapujade et al, 2007; de Groot et al,2007) or different nutrient limitations (Gutteridge et al, 2010)in chemostat cultures. Our five conditions were chosen tocause major differences in metabolic fluxes, particularlythrough the here studied metabolic sub-network. In combina-tion with model-derived predictions, we used our comprehen-sive data set to address two key questions. First, are enzymesabsent or only downregulated under conditions where they arenot necessary for metabolic operation? And, second, what isthe role of the large number of isoenzymes in the sub-networkstudied?
Results
Selection of the system components from a yeastmetabolic network model
On the basis of a genome-scale stoichiometric model of theyeast metabolic network (Kuepfer et al, 2005; Herrgard et al,2008), we defined the components of the biological sub-systemunder study. It consists of the central carbon and amino-acidmetabolism in the yeast S. cerevisiae and includes all reactionsof intermediary carbon, nitrogen and sulfur metabolism aswell as anabolism and catabolism of amino acids, trehaloseand glycogen (Figure 1A, Supplementary Table 1). Thisnetwork is well characterized and there is general agreementon its topology and components (Herrgard et al, 2008). The230 genes of this network encode 228 different proteins, whichassemble into 210 enzymes that catalyze the 177 stoichiome-trically distinct biochemical reactions (Figure 1C). Thepresence of isoenzymes, promiscuous enzymes and proteincomplexes in the protein set precluded a one-to-one mappingof proteins to reactions due to the more complex relationshipsschematically shown in Figure 1B. Only five reactions in thechosen network have not yet been associated with an openreading frame. The protein abundance in this network rangesfrom more than a million to less than a hundred copies per cell(Figure 1D), as determined by an antibody-based quantifica-tion approach in a different study (Ghaemmaghami et al,2003). The system also included several proteins for whichthe cellular abundance could not be determined in theprevious study.
Selection of perturbing conditions
To elucidate how this network of proteins responds toenvironmental challenges, we chose five nutritional condi-tions resulting in maximal difference in magnitude anddirection of metabolic fluxes through this network. Thereference condition was aerobic growth on high glucose asthe sole carbon and energy source, and ammonia as the solenitrogen source. The specific nutritional conditions and theirphenotypic characteristics are summarized in Table I. Thenutritional perturbations concerned the carbon source (galac-tose or ethanol instead of glucose), oxygen availability(anaerobic instead of aerobic) or the nitrogen source (complexmedium consisting of an amino-acid mix lacking carbohy-drates, instead of ammonium). Reversal of metabolic flux was
Quantitative analysis of yeast central metabolismR Costenoble et al
2 Molecular Systems Biology 2011 & 2011 EMBO and Macmillan Publishers Limited
expected for (i) glycolysis and gluconeogenesis in glucose-/galactose-grown versus ethanol-grown cells, and (ii) foramino-acid catabolism and anabolism in complex medium-
grown versus all other cultures. We observed substrateconsumption rates that differed several fold in the selectedculture conditions, with the highest overall rate of metabolism
ProteinsTotal
reactions
Reactionslacking geneassociation
Reactionsperformed byisoenzymes
IsoenzymesProtein
complexes
Proteins engagedin protein
complexes
Number 228 177 5 51 120 11 31
Glucose 6P
Glucose
Fructose 6P
Fructose1,6 bisP
DihydroxyAcetone-P
Glyceraldehyde 3PGlycerol
3P-Glycerate
P-Enolpyruvate
Pyruvate Acetaldehyde
Ethanol
Pyruvate
Acetyl CoA
Oxaloacetate Citrate
Isocitrate
2-Oxoglutarate
Succinate
Fumarate
Malate
Isocitrate
Succinate
Glyoxylate
Acetyl CoA
MalateCitrate
Acetate Oxaloacetate
Ribulose 5P Ribose 5P
Xylulose 5P
Seduheptulose 7P
Erythrose 4P
Glycogen
Trehalose
Fumarate
Glutamine
Alanine
Mitochondria
Cytosol
2-Oxoglutarate
Glutamate
Galactose
EthanolAcetate
Histidine
Phenylalanine
Tyrosine
Glyceraldehyde 3P
Tryptophane
Serine
SerineH2S
Alanine
Threonine
Acetate
Cysteine
Glycine
Glyoxylate
Methionine
SO42–
Asparagine
Aspartate
Aspartate
Lysine
ProlineOrnithine
Glutamate
Arginine
Serine Glycine CO2
Valine
IsoleucineLeucine
Alanine
Urea
Proline
CO2
Glucose + ATP
Glucose-6P + ADP
HXK1 HXK2
Glucokinase Hexokinase 1 Hexokinase 2
TSL1 TPS3
Trehalose-phosphatesynthase
Trehalosesynthase
complex unit TPS3
TPS1BAT1
Branched-chain-amino-acid
aminotransferase
GLK1MAE1
Malic enzymeTrehalosesynthase
complex unit TSL1
Malate+ NADP
CO2+ NADPH + pyruvate
Oxoisocaproate +glutamate
Oxoglutarate + leucine
Oxomethylvalerate +glutamate
Oxoglutarate + isoleucine
Oxoisovalerate +glutamate
Oxoglutarate + valine
UDP-glucose +glucose-6P
UDP + trehalose-6P
Gene
Protein
Reaction
Isoenzymes Promiscuous enzyme Protein complexGeneric enzyme
Num
ber
of m
etab
olic
pro
tein
s
0
No ab
unda
nce
mea
sure
d < 7
7–88–9
9–10
10–11
11–12
12–13
13–14
14–15
15–16
16–17
17–18
18–19
19–20
10
20
30
MeasuredND
Cellular abundance (Log2 copies/cell)
C
D
A
B
Figure 1 The targeted network of central carbon and amino-acid metabolism of S. cerevisiae. (A) Schematic representation of the network. Reactions indicated withred arrows can be catalyzed by isoenzymes and the black dots indicate the number of isoenzymes (Supplementary Table 1). Bold, central carbon metabolism. (B) Fourclasses of gene–protein-reaction relations in the metabolic network. (C) Characteristic numbers for the considered network. (D) Distribution of cellular abundances forthe proteins in central metabolism of S. cerevisiae, as derived from antibody-based expression data (Ghaemmaghami et al, 2003). The left most bar (‘no abundancemeasured’) represents 35 proteins whose abundance could not be determined in that study. ND, not detected in this study.
Quantitative analysis of yeast central metabolismR Costenoble et al
& 2011 EMBO and Macmillan Publishers Limited Molecular Systems Biology 2011 3
on glucose and the lowest on ethanol and in complex medium(Table I). Thus, by the selected conditions the metabolic fluxesthrough the network must also change, presumably leading todifferent abundances and presence of proteins.
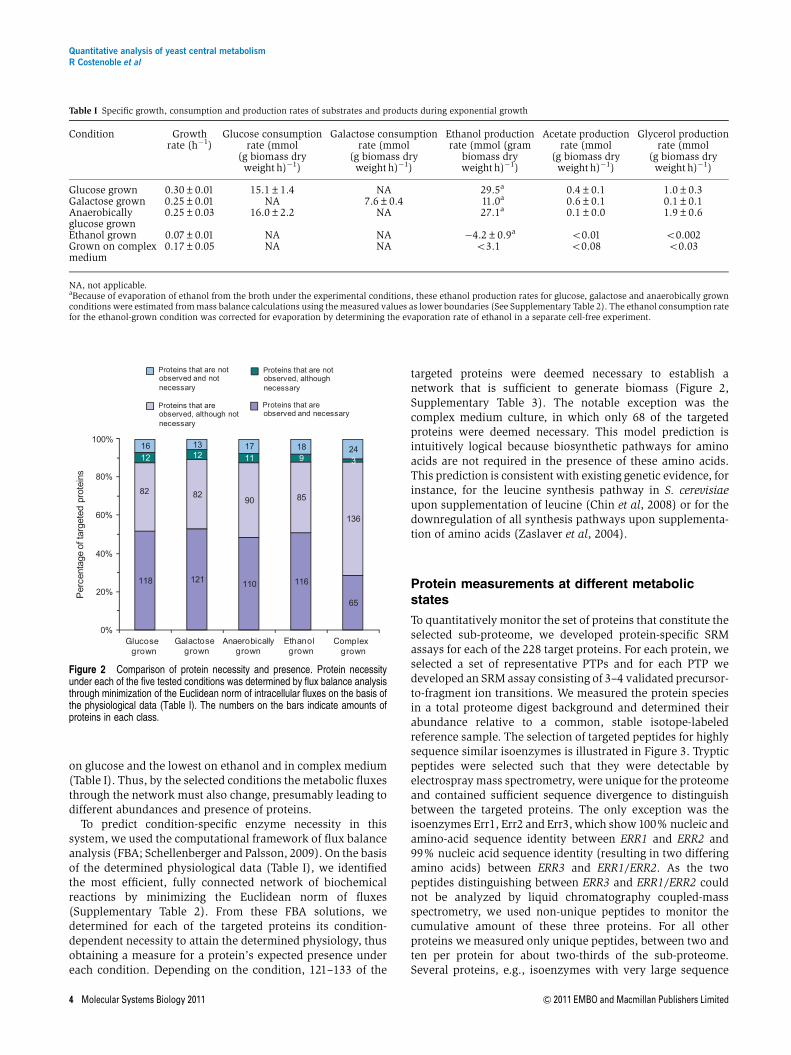
To predict condition-specific enzyme necessity in thissystem, we used the computational framework of flux balanceanalysis (FBA; Schellenberger and Palsson, 2009). On the basisof the determined physiological data (Table I), we identifiedthe most efficient, fully connected network of biochemicalreactions by minimizing the Euclidean norm of fluxes(Supplementary Table 2). From these FBA solutions, wedetermined for each of the targeted proteins its condition-dependent necessity to attain the determined physiology, thusobtaining a measure for a protein’s expected presence undereach condition. Depending on the condition, 121–133 of the
targeted proteins were deemed necessary to establish anetwork that is sufficient to generate biomass (Figure 2,Supplementary Table 3). The notable exception was thecomplex medium culture, in which only 68 of the targetedproteins were deemed necessary. This model prediction isintuitively logical because biosynthetic pathways for aminoacids are not required in the presence of these amino acids.This prediction is consistent with existing genetic evidence, forinstance, for the leucine synthesis pathway in S. cerevisiaeupon supplementation of leucine (Chin et al, 2008) or for thedownregulation of all synthesis pathways upon supplementa-tion of amino acids (Zaslaver et al, 2004).
Protein measurements at different metabolicstates
To quantitatively monitor the set of proteins that constitute theselected sub-proteome, we developed protein-specific SRMassays for each of the 228 target proteins. For each protein, weselected a set of representative PTPs and for each PTP wedeveloped an SRM assay consisting of 3–4 validated precursor-to-fragment ion transitions. We measured the protein speciesin a total proteome digest background and determined theirabundance relative to a common, stable isotope-labeledreference sample. The selection of targeted peptides for highlysequence similar isoenzymes is illustrated in Figure 3. Trypticpeptides were selected such that they were detectable byelectrospray mass spectrometry, were unique for the proteomeand contained sufficient sequence divergence to distinguishbetween the targeted proteins. The only exception was theisoenzymes Err1, Err2 and Err3, which show 100% nucleic andamino-acid sequence identity between ERR1 and ERR2 and99% nucleic acid sequence identity (resulting in two differingamino acids) between ERR3 and ERR1/ERR2. As the twopeptides distinguishing between ERR3 and ERR1/ERR2 couldnot be analyzed by liquid chromatography coupled-massspectrometry, we used non-unique peptides to monitor thecumulative amount of these three proteins. For all otherproteins we measured only unique peptides, between two andten per protein for about two-thirds of the sub-proteome.Several proteins, e.g., isoenzymes with very large sequence
Table I Specific growth, consumption and production rates of substrates and products during exponential growth
Condition Growthrate (h�1)
Glucose consumptionrate (mmol
(g biomass dryweight h)�1)
Galactose consumptionrate (mmol
(g biomass dryweight h)�1)
Ethanol productionrate (mmol (gram
biomass dryweight h)�1)
Acetate productionrate (mmol
(g biomass dryweight h)�1)
Glycerol productionrate (mmol
(g biomass dryweight h)�1)
Glucose grown 0.30±0.01 15.1±1.4 NA 29.5a 0.4±0.1 1.0±0.3Galactose grown 0.25±0.01 NA 7.6±0.4 11.0a 0.6±0.1 0.1±0.1Anaerobicallyglucose grown
0.25±0.03 16.0±2.2 NA 27.1a 0.1±0.0 1.9±0.6
Ethanol grown 0.07±0.01 NA NA �4.2±0.9a o0.01 o0.002Grown on complexmedium
0.17±0.05 NA NA o3.1 o0.08 o0.03
NA, not applicable.aBecause of evaporation of ethanol from the broth under the experimental conditions, these ethanol production rates for glucose, galactose and anaerobically grownconditions were estimated from mass balance calculations using the measured values as lower boundaries (See Supplementary Table 2). The ethanol consumption ratefor the ethanol-grown condition was corrected for evaporation by determining the evaporation rate of ethanol in a separate cell-free experiment.
Figure 2 Comparison of protein necessity and presence. Protein necessityunder each of the five tested conditions was determined by flux balance analysisthrough minimization of the Euclidean norm of intracellular fluxes on the basis ofthe physiological data (Table I). The numbers on the bars indicate amounts ofproteins in each class.
Quantitative analysis of yeast central metabolismR Costenoble et al
4 Molecular Systems Biology 2011 & 2011 EMBO and Macmillan Publishers Limited
overlap (up to 99.5% sequence identity), could be specificallyquantified only via one or few distinguishing peptides. Thedistribution of peptides targeted for each protein is shown inSupplementary Figure 3. The complete set of targeted proteins,the selected PTPs and their respective SRM assays areavailable in Supplementary Table 4 or via the SRMAtlasinterface (www.srmatlas.org; Picotti et al, 2008).
The 228 developed SRM assays were then applied to detectand quantify the proteins in trypsinized extracts of S. cerevisiaecells, harvested during mid-exponential growth under each ofthe five growth conditions from three independent replicateexperiments. A total of B35 000 SRM traces were recorded,and 205 of the 228 targeted proteins (90%) were detectedunder at least one condition. Overall, 199 proteins weredetected under all five conditions (Supplementary Table 3).The 23 proteins that were not detected under any condition arelisted in Supplementary Table 5, including plausible explana-tions for the failure of their detection. Mostly, these undetectedproteins were not necessary under any of the tested metabolicconditions; hence, not expected to be present. Alternatively,potential technical reasons for missing these proteins includelow abundance of the proteins that lack PTPs with good MSproperties or whose PTPs are highly modified or membranelocalization. Variations of the protocols applied here, e.g., theuse of proteases other than trypsin, testing a higher number ofPTPs or adapting the protein extraction procedure to detectmembrane or cell wall proteins might help covering the missedproteins. A small number of proteins were not detected underfour (Gal1, Gal7, Gal10 and Aro9), three (Agx1) or one (Met3)condition(s). The inability to detect these six proteins underthe respective condition was always due to a decrease in thesignal of the best-responding peptide below the noise level,
indicating reduction of the abundance of the respectiveprotein to a very low level or disappearance under thatparticular condition. For these six proteins, the pattern ofthe observed abundance reduction was consistent with theirreported functions in the Saccharomyces Genome Database(www.yeastgenome.org). The 205 detected proteins coveredthe full range of previously reported cellular abundances(Ghaemmaghami et al, 2003), without a bias against low-abundant proteins, and included also proteins whose abun-dance could not be measured in a previous study (Ghaemma-ghami et al, 2003). The lack of an abundance bias in this dataset is further supported by the even spread of the 23 undetectedproteins over all abundance regimes (Figure 1D).
Condition-dependent changes in protein abundance wereexpressed as log2 of the ratio of a protein’s abundance at agiven condition relative to the aerobic glucose-grown condi-tion (see complete quantitative data set in SupplementaryTable 6 and Supplementary Figure 1, including standard errorsand P-values for significance of the abundance change).Globally, the range of protein abundance changes with respectto the glucose-grown culture was drastically broader for thecomplex medium and ethanol-grown yeast (2�5 to 29- and 2�3
to 28-fold change, respectively) than for the anaerobic andgalactose-grown cells (2�3 to 21- and 2�2 to 22-fold change,respectively). For the galactose-grown condition, only thethree proteins involved in the galactose-assimilation pathway(Gal1, Gal7 and Gal10) showed large fold changes (up to 212,see Supplementary Table 6), compared with the moremoderate abundance changes of the other target proteins.The number of proteins that showed significant abundancechanges of at least twofold, either up or downregulated(P-value p0.05, relative to glucose-grown cells), was 145, 96,
VPTVDVSVVDLTVK
TASGNIIPSSTGAAK
VINDAFGIEEGLMTTVHSMTATQK
IDVAVDSTGVFK
VVITAPSSSAPMFVVGVNHTK
LISWYDNEYGYSAR
VVDLIEYVAK
HIIIDGVK
DPANLPWGSLK
IAINGFGR
VLPELQGK
IATYQER
YDSTHGR
HIDAGAK
EATYDQIK
TVDGPSHK
DIEVVAVNDPFISNDYAAYMVK
AAAEGPMK
YTPDK
GTVSHDDK
LALQR
VINDAFGIEEGLMTTVHSLTATQK
DPANLPWGSSNVDIAIDSTGVFK
HIIVDGKLVSWYDNEYGYSTR
VVITAPSSTAPMFVMGVNEEK
VVDLVEHVAK
VAINGFGR
YAGEVSHDDK
ETTYDEIK
AAAEGK
YTSDLK
NVEVVALNDPFISNDYSAYMFK
HIIVDGHK
IATFQER
IALQR
Tdh3
Tdh2
Tdh1
ELDTAQK
165
4270
145
103
53
49
2775
156
633
10
46
52
1760
83
230
LTGMAFR117
802
4947220
0
193
0
39
312
1197
2323
820
0
2911
643
209
6
0
2538
8631
733
Figure 3 Example of proteolytic pattern complexity for isoenzymes. Tryptic peptides for three isoenzymes of glyceraldehyde-3-phosphate dehydrogenase are shownas connected circles. Red circles indicate peptides shared by at least two of the three isoenzymes. Green circles indicate peptides unique to one isoenzyme. Numbersindicate the number of observations of the peptide in the PeptideAtlas database (S. cerevisiae build, 2009).
Quantitative analysis of yeast central metabolismR Costenoble et al
& 2011 EMBO and Macmillan Publishers Limited Molecular Systems Biology 2011 5
46 and 39 for the complex medium, ethanol, galactose andanaerobically grown cultures, respectively (SupplementaryTable 6 and Supplementary Figure 1). Overall, a large fractionof proteins shows significant changes across the differentexperiments, in agreement with our initial choice of conditionsthat introduce drastically different modes of metabolicoperation.
Besides enzymes in the galactose-assimilation pathway,which strongly increase abundance upon growth on galactose,the largest measurable increases in protein abundance (426-fold) were observed for Acs1, Adh2, Icl1, Idp2, Mdh2, Mls1,Pck1 and Tkl2 on ethanol- or complex medium (Supplemen-tary Table 6 and Supplementary Figure 1). Most of theseproteins are gluconeogenic or glyoxylate shunt enzymes,illustrating the importance of these two pathways under thoseconditions. The largest identified abundance decreases (424-fold) were observed on complex medium for Arg3, Gdh1, His4,Met10, Met16, Met6 and Ser3, key enzymes of amino-acidbiosynthesis and sulfate assimilation, which are not requiredin complex medium (Supplementary Table 6, and Supplemen-tary Figure 1).
Presence of non-necessary proteins
On the basis of the FBA simulations, we expected to detect only121–133 of the targeted proteins under the different conditionsif only proteins necessary for that condition would be present.In contrast to these expectations, we detected the vast majorityof the 228 targeted proteins to be present under all conditions(Figure 2, Supplementary Table 3). Only a small fraction of thenon-necessary proteins was indeed not detected. We concludefrom these data that in fact many more proteins are present—at least at a basal level—than that are actually necessary for agiven condition. One potential explanation for the presence ofnon-necessary enzymes is to enable the organism to maintain
growth and realize immediate basal metabolic fluxes evenupon a rapid change to new environmental conditions (Kotteet al, 2010).
We next asked whether the abundances of non-necessaryproteins were lower under conditions where the respectiveproteins were not necessary. To address this question, we firstdefined whether a protein needs to change its status from‘necessary’ to ‘non-necessary’ based on the FBA predictionsbetween the ten possible condition comparisons. In 614 cases,a protein changed its status from ‘necessary’ in one conditionto ‘non-necessary’ in another. In about half of these cases (275cases), the protein’s abundance did not change more thantwofold. In the other half (303 cases, 49%), a status changefrom ‘necessary’ to ‘non-necessary’ was accompanied by an atleast twofold decrease in abundance. In the remaining 36cases, protein abundance increased more than twofold,despite a change from ‘necessary’ to ‘non-necessary’, whichwould be a counterintuitive phenomenon. In the group ofproteins that did not need to change from ‘necessary’ to ‘non-necessary’, the protein abundances changed more thantwofold in only 27% of a total of 1446 cases. This indicatesthat changes in necessity status from ‘necessary’ to ‘non-necessary’ were more frequently accompanied by largeprotein abundance decreases.
Finally, we asked whether there is a relationship betweenthe abundance of a protein and the predicted metabolic fluxthrough the reaction catalyzed by it. For this purpose, weplotted the normalized changes of the FBA predicted fluxes(Supplementary Table 2) as a function of the change in proteinabundance between the condition comparisons (Figure 4).Most flux changes did not require a corresponding change inprotein abundance. Changing the flux from zero in onecondition to some value in another (normalized flux changeof 2 or �2), however, required protein abundance changes inmost cases. This on/off flux control by protein abundance was
Figure 4 Correlation of FBA-calculated normalized flux changes with protein abundance changes for the four condition comparisons. Normalized flux changes werecalculated using the following formula: (flux A�flux B)/((flux Aþ flux B)/2), where ‘flux A’ is the flux calculated for condition A, and ‘flux B’ the flux for the same reactionunder the reference condition. Data are presented for the comparison of the galactose- (green), anaerobically (blue), ethanol- (red) and complex-grown condition (black)with the aerobic glucose-grown condition. The maximum normalized flux change of 2 (or�2) represents a change from zero in one condition to any magnitude. Fluxesinvolving promiscuous enzymes, isoenzymes and protein complexes were excluded from the analysis.
Quantitative analysis of yeast central metabolismR Costenoble et al
6 Molecular Systems Biology 2011 & 2011 EMBO and Macmillan Publishers Limited
the most pronounced for the comparison of growth oncomplex versus glucose medium, where essentially allbiosynthetic amino-acid fluxes are reduced to zero and mostof the catalyzing enzymes are significantly less abundant. Thisimplies that newly required fluxes are predominantly regu-lated by altered protein abundance while flux modulationsare not.
Analysis of isoenzyme abundance patterns
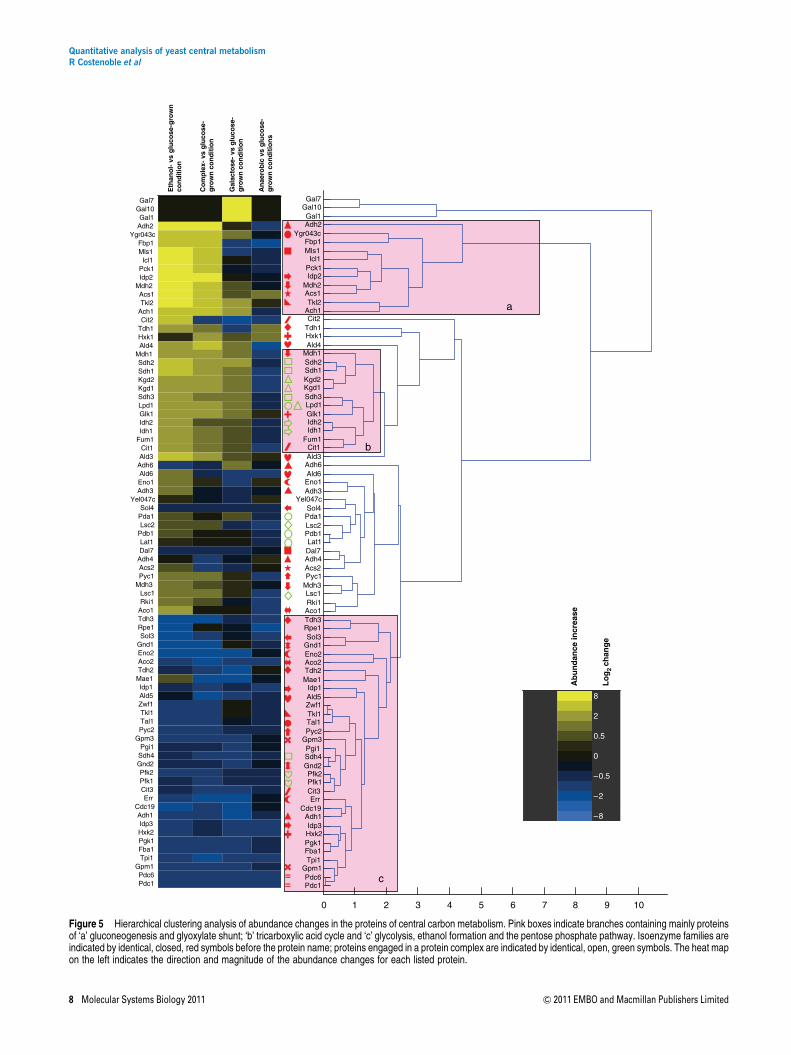
Of the proteins that are not strictly necessary for growth undera given condition, about 40% were isoenzymes of presumablyredundant function. Hence, we asked whether the previouslyproposed functional diversification (Ihmels et al, 2004, 2007)is reflected at the proteome level; i.e., whether isoenzymesexhibit identical or distinct regulation patterns. The data setgenerated in this study is ideal and unique to answer thisquestion because most isoenzymes in the defined networkwere completely covered. We used hierarchical clustering(Eisen et al, 1998) to generate patterns of abundance changefor all detected isoenzymes over all conditions. Specifically, werelate isoenzyme abundance pattern to the major functionalclusters of gluconeogenesis and glyoxylate shunt (Figure 5,block ‘a’), tricarboxylic acid cycle (Figure 5, block ‘b’),and glycolysis and pentose phosphate pathway (Figure 5,block ‘c’).
For central carbon metabolism, the only isoenzymes thatclustered in the same branch next to each other were Pdc1 andPdc6. A high degree of functional similarity was seen for theGpm1/Gpm3 and for the Gnd1/Gnd2 families of isoenzymesbecause the members of each family clustered in proximatebranches. For four families with more than two isoenzymes,always two members clustered close to each other but othermembers did not (Idp1/Idp3 but not Idp2, Tdh2/Tdh3 but notTdh1, Eno2/Err, but not Eno1 and Adh3/Adh4, but not Adh1/Adh2/Adh6; Figure 5). For all other families, all membersclustered in distant branches indicating functional diversifica-tion. Of note, in comparison, subunits of protein complexespreferably clustered in proximate branches with the exceptionof Sdh4 (Figure 5, green open symbols). Sdh4 is the membraneanchor protein of the succinate dehydrogenase proteincomplex (Oyedotun and Lemire, 2004) that includes alsoSdh1, Sdh2 and Sdh3. The divergent pattern of Sdh4,compared with the other members of the complex, might bea protocol artifact related to sub-optimal extraction ofmembrane proteins. Although slightly less distinct than forcentral carbon metabolism, similar observations of distantand proximate clustering were made for isoenzymes andprotein complexes in amino-acid metabolism (SupplementaryFigure 2). These data, therefore, provide evidence forfunctional divergence within most isoenzyme families.
Divergent isoenzyme functions
We next attempted to determine the different functions ofdivergent isoenzymes. This analysis was based on thehypothesis that similar functions should lead to similar proteinabundance patterns, therefore resulting in different patternsfor functionally divergent isoenzymes. The known pattern ofalcohol dehydrogenase isoenzymes Adh1 and Adh2 provide a
case supporting this hypothesis. In agreement with theirdescribed function in the SGD database (www.yeastgenome.org), we found that the major ethanol-consuming isoenzyme(Adh2) clustered with the glyoxylate shunt and gluconeogen-esis proteins, whereas the major ethanol-producing isoenzyme(Adh1) clustered in the glycolytic branch (Figure 5). Theextension of this type of analysis to other isoenzyme familiesindicated new cases of functional diversification.
The first reaction of glucose breakdown can be catalyzed bythree hexokinase isoenzymes. While Hxk2 clustered indeed inthe glycolytic branch, Glk1 clustered with the tricarboxylicacid cycle proteins and Hxk1 clustered with a protein involvedin the synthesis of storage carbohydrates, Glc3 (Supplemen-tary Figure 2), and several other members of the storagepathway can be found in proximate branches (Gsy2, Ugp1,Tsl1, Tps1 and Tps2), supporting the notion that Hxk1 isrelated to storage carbohydrates (Figure 5). Indeed, both Glk1and Hxk1 have been speculated to direct glucose towardglycogen storage rather than the regular glycolytic path(Ihmels et al, 2004), as is the case for Hxk2.
The non-oxidative part of the pentose phosphate pathway,i.e., the transketolases Tkl1 and Tkl2 and the transaldolasesTal1 and Ygr043c (recently renamed to Nqm1 (Hua et al,2008)), where Ygr043c has so far been classified as atransaldolase of unknown function, provide evidence for anentirely novel functional differentiation between isoenzymes.In our data set, Tkl1 and Tal1 cluster, as expected with thepentose phosphate proteins in a glycolytic branch. Theirisoenzymes Tkl2 and Ygr043c, however, clustered with thegluconeogenic proteins, indicating that their function is eitherdirectly in gluconeogenic metabolism or possibly in the supplyof the pentose precursors for amino or nucleic acid synthesisunder conditions where their regular synthesis from glucose 6-phosphate is difficult or insufficient.
Of the two isoenzymes for phospoglucomutase (Pgm1 andPgm2) that catalyze the interconversion of glucose 1-phos-phate and glucose 6-phosphate, Pgm2 clustered with theglycogen breakdown to glucose 1-phosphate enzymes Gph1and Gdb1 (Supplementary Figure 2). The Pgm1 isoenzymeclustered far away with proteins for glycogen and trehalosesynthesis (Ugp1, Gsy2, Glc3, Tps1, Tps2 and Tsl1). Thesedata suggest, therefore, that Pgm1 and Pgm2 have alternativefunctions in synthesis and breakdown of glycogen, respec-tively.
Finally, the isocitrate dehydrogenase isoforms Idp1 and Idp2clustered with the glycolytic and gluconeogenic/glyoxylateshunt proteins, respectively (Figure 5). As the cytosolic,NADP-specific isoform Idp2 is not a part of the glyoxylateshunt, our data suggest a gluconeogenic function in NADPHformation, a redox cofactor required for biosynthesis (Minardand McAlister-Henn, 2005). Idp2-based NADPH formation onnon-fermentable substrates is further supported by lowsimulated fluxes for the oxidative pentose-phosphate pathway(the second source for cytosolic NADPH) under gluconeogen-esis (Supplementary Table 2) and by clustering of Ald6, thethird major source of cytosolic NADPH (Minard and McAlister-Henn, 2005), far away from the gluconeogenic enzymes. Thisconclusion is consistent with idp2 mutant data during growthon acetate (Minard and McAlister-Henn, 2005). Overall, wethus provide evidence for functional diversification of various
Quantitative analysis of yeast central metabolismR Costenoble et al
& 2011 EMBO and Macmillan Publishers Limited Molecular Systems Biology 2011 7
Figure 5 Hierarchical clustering analysis of abundance changes in the proteins of central carbon metabolism. Pink boxes indicate branches containing mainly proteinsof ‘a’ gluconeogenesis and glyoxylate shunt; ‘b’ tricarboxylic acid cycle and ‘c’ glycolysis, ethanol formation and the pentose phosphate pathway. Isoenzyme families areindicated by identical, closed, red symbols before the protein name; proteins engaged in a protein complex are indicated by identical, open, green symbols. The heat mapon the left indicates the direction and magnitude of the abundance changes for each listed protein.
Quantitative analysis of yeast central metabolismR Costenoble et al
8 Molecular Systems Biology 2011 & 2011 EMBO and Macmillan Publishers Limited
isoenzymes and for several cases the data presented heresuggest novel functional roles.
Discussion
In this study, we exploited the power of SRM-based targetedproteomics to consistently and reproducibly detect andquantify a target set of yeast metabolic proteins covering abroad range of abundance levels across several samples andexperiments. From the 228 target protein set, selected from aconsensus stochiometric metabolic model for the centralcarbon and amino-acid metabolism of S. cerevisiae, B90%were successfully identified in minimally one of the samples.This substantially expands the coverage achieved by previousproteomic studies of yeast metabolism. For example, 57, 58and 55% of the here targeted metabolic proteome was coveredby de Groot et al (2007), Gutteridge et al (2010) and Kolkmanet al (2006), respectively and only up to 30% of isoenyzmefamilies could be quantitatively resolved (Kolkman et al, 2006;de Groot et al, 2007; Gutteridge et al, 2010). To score thecomprehensiveness of our proteomics method, we used amodel-based approach to assess which proteins can beexpected to be present. On the basis of this analysis, the datareported here are 95–99% comprehensive. Our inability todetect up to 5% remaining proteins may be explained by otherfactors, such as (i) low abundance and lack of PTPs with goodMS properties, (ii) occurrence of post-translational modifica-tions that decrease or eliminate the signal of the correspondingtarget tryptic peptide or (iii) loss of the protein during thesample preparation steps (e.g., for cell wall or membraneproteins). The detectable proteins were consistently measuredin unfractionated yeast proteome tryptic digests. This is inagreement with our earlier demonstration that proteinsspanning the whole abundance range of the yeast proteomecan be detected by SRM (Picotti et al, 2009) and with thehigh degree of data reproducibility generated by the SRMtechnique demonstrated in a previous multi-center study(Addona et al, 2009).
The applied method consistently quantified the targetprotein set across 15 samples, including biological triplicates,without the problem of missed data points. This number ofconsistently analyzed samples and replicates constitutes animprovement with respect to the lower reproducibility of datagenerated by shotgun proteomic studies. In fact, in manyproteomic studies to date no replicate data sets were reportedand only small numbers of samples were analyzed. This is inlarge part due to the significant effort and cost associated withgenerating comprehensive and quantitative proteomic data,especially where approaches based on in-depth fractionationwere used. Also, the SRM approach allowed here for thequantitative discrimination of proteins with a high sequenceoverlap, such as isoenzymes, allowing us to gain insight intotheir functional diversification. Classical shotgun proteomicmeasurements based on automated peptide sequencing wouldbe biased against the discrimination of isoenzymes, as theirshared peptides are more likely to be high abundant andtherefore preferentially detected. Overall, this study hasresulted in the largest to date SRM-based proteomic data set(4200 proteins quantified across multiple conditions), with
high comprehensiveness for the metabolic network understudy, challenged with a set of nutritional conditions thatimply radically different modes of metabolic operation. Weexpect that this will be a useful blueprint for further developingmathematical models of the yeast metabolism and a valuablebasis for follow-up studies on the function of target (meta-bolic) proteins.
Despite their power in analyzing target proteins acrossseveral samples and replicates, SRM approaches are in theirinfancy and face still considerable technical challenges to theirhigh-throughput application. The first is the need for designingoptimal assays for each target protein. Recently, significantadvances have been realized to speed up and automate thisstep and strategies based on unpurified synthetic peptidesallow for the fast and low-cost development of SRM assays foressentially any protein or proteome of interest (Picotti et al,2010). Another challenge is the analysis of SRM data,which involves the detection and assignment of the relevantpeaks in the raw MS data. Here, this step was carried outmanually, using the most up to date and stringent confidencecriteria (Anderson and Hunter, 2006; Lange et al, 2008a;Picotti et al, 2009; MacLean et al, 2010 see details in theMaterials and methods). However, manual peak assignmentremains tedious and does not allow attributing a falsediscovery rate based on objective criteria to SRM-basedpeptide identifications. To this direction, algorithms arecurrently being developed to automate evaluation of SRMpeak matches and their statistical treatment (Reiter L et al, inpreparation). The last bottleneck is the number of targetproteins that can be concurrently analyzed in a single SRMrun. This is at present significantly lower than that of proteinsidentified in a shotgun proteomics experiment on a high-performance MS (de Godoy et al, 2008) and efforts arecurrently underway by the MS vendors to improve themultiplexing of this technology. For the specific networkunder study, the set of B200 metabolic proteins can bequantified in B4 h of instrument time per sample, measuringmultiple SRM transitions per peptide, multiple peptides perprotein (where available), with light (endogenous) and heavy(internal standard) signals. The data set presented here,consisting of 15 samples, can be acquired in B3 days of massspectrometric measurements.
Remarkably, the total number of metabolic proteinsdetectable, and thus expressed, did not change much betweenthe different metabolic states. Although the identity of thenecessary proteins varies slightly between conditions (Sup-plementary Table 3), yeast cells should be able to grow withroughly 120 proteins in the considered network, yet manymore are always present. Expression of unneeded proteins haslong been known to reduce growth rates and therebypresumably evolutionary fitness (Dekel and Alon, 2005);hence, intuition and genetic evidence (Zaslaver et al, 2004)suggest that enzymes are downregulated under conditionswhen their reactions are not required. Their here demon-strated unexpected persistence might be explained by thelower than expected costs of unneeded protein synthesis afterseveral generations of exponential growth, at least inEscherichia coli (Shachrai et al, 2010). Alternatively, it can bean adaptive strategy for rapid and flexible responses toenvironmental changes (Kotte et al, 2010).
Quantitative analysis of yeast central metabolismR Costenoble et al
& 2011 EMBO and Macmillan Publishers Limited Molecular Systems Biology 2011 9
About 40% of the apparently ‘superfluous’ proteins areisoenzymes. We showed here that differences in abundancechanges among isoenzymes were indicative for differentisoenzyme functionality, consistent with earlier studies basedon transcriptional data (Ihmels et al, 2004). On the basis ofabundance pattern clustering in different functional classes ofmetabolic pathways, many isoenzymes show evidence forfunctional diversification in the presented experiments, whichmight explain their parallel presence in the S. cerevisiaegenome (Kuepfer et al, 2005; Ihmels et al, 2007). As we onlytested a very limited number of conditions, it is our expectationthat also for the isoenzymes that did not show functionaldiversification so far, such evidence could be found underappropriate metabolic setups.
In conclusion, this study shows that quantitative assays forlarge sets of biologically related proteins can be developedand deployed to monitor responses of these proteins to a setof different environmental or genetic conditions, providingdetailed insights in a cell’s physiology. This approach is idealto explore the dynamics of cellular networks, under physio-logical or challenged conditions, also for organisms other thanyeast, and thus has the potential to find broad applications insystems biology, biomedical and pharmaceutical research.
Materials and methods
Yeast culture conditions and protein extraction
All experiments were performed with the prototrophic strainS. cerevisiae FY4 (Winston et al, 1995). Mineral medium (Verduynet al, 1990) was supplemented with 10 g l�1 of the carbon sourcesglucose, galactose or ethanol. Medium for anaerobic cultures wasbuffered with 10 mM KH-Phthalate buffer. Complex medium contained20 g l�1 yeast extract and 40 g l�1 peptone. Cultures were grown in50 ml of respective medium in 500 ml shake flasks at 301C and shakenat 250 r.p.m. Anaerobic cultures were grown in 50 ml of medium in150 ml air-tight serum flasks and shaken at 110 r.p.m. Anaerobicmedium and flasks were flushed with nitrogen gas (certifiedo5 p.p.m.O2) upon closure and during sampling, and were sealed with oxygen-impermeable rubber septa.
For each growth condition, triplicate cultures were inoculated froma single pre-culture, pre-grown on identical medium and conditions.Two ml aliquots were withdrawn at regular intervals and treated asdescribed before for biomass content and HPLC analysis (Heer andSauer, 2008). Aliquots for proteome analysis were withdrawn duringthe late exponential growth phase at high biomass content when cellsstill grew exponentially. From each culture, 36 ml of cell broth wereharvested on ice and centrifuged for 3 min at 41C. Pellets were washedonce with ice-cold washing buffer (20 mM HEPES, pH 7.5, 2 mMEDTA), frozen in liquid nitrogen and stored at �801C until extraction.
15N isotopically labeled yeast cells to be used as internal standardfor protein abundance quantification were derived from a yeastbatch culture that displayed diauxic growth in 2 l minimal mediumwith 5 g l�1 glucose and 15N-labeled ammonium (99% purity 15N2
(NH4)2SO4, Cambridge Isotope Laboratories) as sole nitrogen source.Cells were grown in a fully aerated bioreactor. To gain high coverage ofmetabolic proteins, aliquots from the different phases (growth onglucose, transient phase and growth on ethanol) of this experimentwere mixed.
Proteins were extracted and precipitated as described previously(Picotti et al, 2009). Before precipitation, the total protein concentra-tion in the lysis buffer was calculated based on the average results of aspectrophotometrical BCA (bicinchoninic acid, Perbio Science, Lau-sanne, Switzerland) assay, conducted in triplicate for every sample.A 100mg aliquot of each sample was mixed to an equal amount of15N-isotopically labeled internal protein standard (see above). Trypticdigestion was conducted as described in Picotti et al (2009). Digested
peptide mixtures were cleaned on C18 cartridges (Sep-Pak tC18,Waters) and eluted with 60% (vol/vol) acetonitrile. Samples weredried in a vacuum centrifuge, and solubilized in 0.1% formic acid uponanalysis. All samples reported in this work were processed in parallel.
Design of SRM assays
For each protein targeted in this work, up to ten PTPs for detection andquantification via SRM were selected. Preferentially, detectable PTPswere chosen based on their number of observations in the publiclyaccessible proteomic data repository PeptideAtlas (www.peptideatla-s.org, a large proteomic data repository that contains more than 50 000unique peptides observed in shotgun proteomic experiments (Deutschet al, 2008)). Peptide identifications deriving from isotope-codedaffinity tag experiments were not considered. For proteins with lessthan five PTPs available from PeptideAtlas, additional PTPs amenablefor mass spectrometry analysis were derived by prediction using thepublicly available software PeptideSieve (Mallick et al, 2007;tools.proteomecenter.org, Seattle Proteome Centre). For proteins neverobserved in PeptideAtlas, the five peptides resulting from PeptideSieveprediction were synthesized on a small scale in an unpurified formatusing the SPOT-synthesis technology (JPT Peptide Technologies) andused as a reference to derive the optimal parameters for thecorresponding SRM assays.
For each PTP, three to eight SRM transitions for both the double- andthe triple-charged state were calculated, corresponding to fragmentions of the y-series. Fragment ions with a mass-to-charge ratio (m/z)greater than the precursor ion m/z were prioritized. Fragments withm/z ratios close to the precursor ion m/z (smaller than 5 Th difference)were discarded. This selection process was automated through in-house written software. The selected transitions were used to detectthe peptides by SRM in whole S. cerevisiae protein digests and to triggeracquisition of the full fragment ion spectra of the peptides. For low-abundant PTPs and PTPs predicted by PeptideSieve, full fragment ionspectra were acquired from synthetic peptide preparations. Optimalfragments to be used in the final SRM assays were chosen from the fullfragment ion spectra, acquired on the triple quadrupole massspectrometer (see below).
Mass spectrometry analysis
All peptide samples were analyzed on a hybrid triple quadrupole/iontrap mass spectrometer equipped with a nanoelectrospray ion source(4000QTrap, AB/Sciex). Chromatographic separations of peptideswere performed on a nano-LC system (Tempo, AB/Sciex) coupled to afused silica emitter (length 16 cm, diameter 75mm) packed with aMagic C18 AQ 5mm resin (Michrom BioResources). Peptides wereloaded on the column from a cooled (41C) autosampler (Tempo, AB/Sciex) and chromatographically separated using a linear gradient ofacetonitrile/water at a flow rate of 300 nl min�1. A gradient from 5 to30% acetonitrile in 30 or 60 min was used. In the assay validationphase, the mass spectrometer was operated in MRM mode, triggeringacquisition of a full MS/MS spectrum upon detection of an SRM trace.The set of SRM transitions generated as described above was split intomultiple MS methods and analyzed in several runs. MRM acquisitionwas performed with Q1 and Q3 operated at unit resolution (0.7 m/zhalf maximum peak width). MS/MS spectra were acquired inenhanced product ion mode for the two highest MRM transitions,using the following settings: dynamic fill time, Q1 resolution low, scanspeed 4000 a.m.u. s�1, m/z range 300–1400. Collision energies (CEs)were calculated according to the formulas: CE¼0.044�m/zþ 5.5 andCE¼0.051�m/zþ 0.5 (with m/z being the mass-to-charge ratio ofthe precursor ion) for doubly and triply charged precursor ions,respectively.
Database search and extraction of optimal SRMtransitions
Raw MS/MS .wiff data was converted to .mzXML format with theprogram mzWiff and searched against the yeast SGD database (versiondated 01/26/2006) using Sequest (version 27). A decoy database was
Quantitative analysis of yeast central metabolismR Costenoble et al
10 Molecular Systems Biology 2011 & 2011 EMBO and Macmillan Publishers Limited
generated by randomly reshuffling amino acids in between trypticcleavage sites, and appended to the target database. Precursor masstolerance was set at 2.1 Da. Data were searched with full trypticcleavage and carboxyamidomethylation of cysteine residues as a staticmodification. The search results were validated and assignedprobabilities using the PeptideProphet program implemented in theTrans-Proteomic-Pipeline (Deutsch et al, 2008), with decoy-assistedsemiparametric model and retention-time model enabled, as pre-viously described (Picotti et al, 2008) and filtered to a decoy-estimatedfalse discovery rate of 1%.
For each peptide, the 3 or 4 fragment ions resulting in the highestsignals were selected from the QQQ MS/MS spectra as previouslydescribed (Picotti et al, 2008) as final SRM assay. The correspondingSRM transitions associated with the 15N analog of each peptide werecalculated and measured as internal standard. The final SRM assayswere used to detect and quantify the proteins in total lysates of yeastcells grown under the set of five conditions mentioned above, usingtime-scheduled SRM/MRM acquisition (retention time window, 200–300 s; target scan time, 3.5 s, maximally 950 transitions per run).Blank runs (water, 0.1% formic acid, injected) were performed prior tomost SRM measurements. In these controls, the same SRM methodwas used as in the following (sample) run (e.g, a method in which thesame set of transitions was measured). The complete set of SRM assaysis available in Supplementary Table 4 or via the public SRMAtlasdatabase (www.srmatlas.org; Picotti et al, 2008). The usage of time-scheduled SRM acquisition maximized the throughput and sensitivityof the proteomic analysis (Stahl-Zeng et al, 2007). MS/MS spectra areavailable at https://db.systemsbiology.net/sbeams/cgi/PeptideAtlas/GetPeptideSpectra.
Quantification of protein abundance changes
Peak heights for the transitions associated with the native and15N-labelled peptides were quantified using MultiQuant v.1.1 Beta(Applied Biosystems). To accept validation of a set of SRM traces, wechecked that the retention time at which the MS/MS spectrum wasacquired from the natural or synthetic sources matched that of the SRMpeaks defining the peptide of interest. We also confirmed ‘coelution’and shape similarity of different SRM traces recorded for a givenpeptide. In some dubious cases, we also checked that relativeintensities of SRM traces from different fragments matched thoseobserved in the MS/MS spectrum of the peptide. For relativequantification of each protein across the set of different growthconditions, the ratio between the light and heavy SRM peak height wascalculated and normalized to that obtained for the aerobic glucose-grown sample. Protein abundance changes were expressed as themean log2 ratios out of the different transitions over peptides, proteinand the three replicate cultures per condition±the standard error ofthe mean. Outlier transitions (for instance, shouldered transitiontraces, noisy transitions or with a signal-to-noise ratio smaller thanthree) were not considered in the calculations. A Student’s one samplet-test was performed on the log2 ratios to determine statisticallysignificant changes in protein abundances (Po0.05). For proteins thatwere not detected in all five conditions (i.e., the signal of their best-responding PTP decreased to the noise level in one or several of the fivegrowth conditions), we used the noise levels of the SRM traces toestimate a minimal abundance change compared with a condition withan above-noise signal.
Minimal set of necessary proteins
For determination of the minimal set of necessary proteins undereach of the five growth conditions, FBA (Fell and Small, 1986) wasperformed using an updated version of a previously publishedgenome-scale model of the metabolism of S. cerevisiae (Kuepferet al, 2005; Supplementary Table 7). Measured specific production andconsumption rates (Table I) were used as constraints on the metabolicnetwork, and minimization of the Euclidean norm of fluxes (Blanket al, 2005) was used as objective function. It minimizes the total sumof the squared values of all fluxes in the network. Calculations werecarried out using MATLAB scripts (The MathWorks) and solved usingLINDO numerical solver software package (Lindo Systems). On the
basis of the FBA solution, reactions from the targeted sub-network thathad a value zero were classified as non-necessary, and reactions with avalue were classified as necessary. As necessary reactions do not mapone-to-one to necessary proteins, this was corrected for the presence ofisoenzymes, protein promiscuity and protein complexes, as explainedin Supplementary Table 3.
Hierarchical cluster analysis
The Pearson’s linear correlation coefficients of the log2 of themeasured abundance changes for each protein were calculated withthe log2 of the abundance of this protein under aerobic glucose-grownconditions set to zero. The correlation coefficients were then used tocalculate the Euclidean distances between proteins with whichhierarchical cluster trees were generated using group average asclustering method. All calculations were performed in MATLABsoftware. Protein abundance changes of o20% and protein abun-dance changes with P-values for their significance 40.05 wereassumed to be only marginal changes, and their value was set to zerofor the cluster analysis. Abundance changes for proteins that were notobserved under a particular condition were also set to zero for thatcondition change. The reported minimal abundance changes for theseproteins for conditions where they were observed were then taken asthe value to cluster. Proteins for which now five zero values wereyielded were excluded from the cluster analysis all together.
Supplementary information
Supplementary information is available at the Molecular SystemsBiology website (www.nature.com/msb).
AcknowledgementsWe acknowledge SystemsX.ch for funding (YeastX and PhosphoNetXprojects). PP is the recipient of an intra-european Marie Curiefellowship, LR was supported by a grant from Forschungskredit ofthe University of Zurich. RA is supported by the European ResearchCouncil (Grant # ERC-2008-AdG 233226).
Author contributions: RC, PP, MH, US and RA conceived anddesigned the research. RC, PP, MH, RA and US wrote the paper. RC andPP performed experiments, developed and performed analyses andassays and analyzed data. LR devised statistical and computationalproteomics tools. RS performed SRM data analysis.
Conflict of interestThe authors declare that they have no conflict of interest.
References
Addona TA, Abbatiello SE, Schilling B, Skates SJ, Mani DR, Bunk DM,Spiegelman CH, Zimmerman LJ, Ham AJ, Keshishian H, Hall SC,Allen S, Blackman RK, Borchers CH, Buck C, Cardasis HL, CusackMP, Dodder NG, Gibson BW, Held JM et al (2009) Multi-siteassessment of the precision and reproducibility of multiple reactionmonitoring-based measurements of proteins in plasma. NatBiotechnol 27: 633–641
Aldridge BB, Burke JM, Lauffenburger DA, Sorger PK (2006)Physicochemical modelling of cell signalling pathways. Nat CellBiol 8: 1195–1203
Anderson L, Hunter CL (2006) Quantitative mass spectrometricmultiple reaction monitoring assays for major plasma proteins.Mol Cell Proteomics 5: 573–588
Baty JD, Robinson PR (1977) Single and multiple ion recordingtechniques for the analysis of diphenylhydantoin and its majormetabolite in plasma. Biomed Mass Spectrom 4: 36–41
Quantitative analysis of yeast central metabolismR Costenoble et al
& 2011 EMBO and Macmillan Publishers Limited Molecular Systems Biology 2011 11
Bell AW, Deutsch EW, Au CE, Kearney RE, Beavis R, Sechi S, Nilsson T,Bergeron JJ (2009) A HUPO test sample study reveals commonproblems in mass spectrometry-based proteomics. Nat Methods 6:423–430
Blank L, Kuepfer L, Sauer U (2005) Large-scale 13C-flux analysisreveals mechanistic principles of metabolic network robustness tonull mutations in yeast. Genome Biol 6: R49
Chin CS, Chubukov V, Jolly ER, DeRisi J, Li H (2008) Dynamics anddesign principles of a basic regulatory architecture controllingmetabolic pathways. PLoS Biol 6: e146
Daran-Lapujade P, Rossell S, van Gulik WM, Luttik MA, de Groot MJ,Slijper M, Heck AJ, Daran JM, de Winde JH, Westerhoff HV,Pronk JT, Bakker BM (2007) The fluxes through glycolytic enzymesin Saccharomyces cerevisiae are predominantly regulatedat posttranscriptional levels. Proc Natl Acad Sci USA 104:15753–15758
de Godoy LM, Olsen JV, Cox J, Nielsen ML, Hubner NC, Frohlich F,Walther TC, Mann M (2008) Comprehensive mass-spectrometry-based proteome quantification of haploid versus diploid yeast.Nature 455: 1251–1254
de Groot MJ, Daran-Lapujade P, van Breukelen B, Knijnenburg TA, deHulster EA, Reinders MJ, Pronk JT, Heck AJ, Slijper M (2007)Quantitative proteomics and transcriptomics of anaerobic andaerobic yeast cultures reveals post-transcriptional regulation of keycellular processes. Microbiology 153: 3864–3878
Dekel E, Alon U (2005) Optimality and evolutionary tuning of theexpression level of a protein. Nature 436: 588–592
Deutsch EW, Lam H, Aebersold R (2008) PeptideAtlas: a resource fortarget selection for emerging targeted proteomics workflows.EMBO Rep 9: 429–434
Duarte NC, Becker SA, Jamshidi N, Thiele I, Mo ML, Vo TD, Srivas R,Palsson B (2007) Global reconstruction of the human metabolicnetwork based on genomic and bibliomic data. Proc Natl Acad SciUSA 104: 1777–1782
Eisen MB, Spellman PT, Brown PO, Botstein D (1998) Cluster analysisand display of genome-wide expression patterns. Proc Natl Acad SciUSA 95: 14863–14868
Feist AM, Herrgard MJ, Thiele I, Reed JL, Palsson B (2009)Reconstruction of biochemical networks in microorganisms. NatRev Microbiol 7: 129–143
Fell DA, Small JR (1986) Fat synthesis in adipose tissue. Anexamination of stoichiometric constraints. Biochem J 238: 781–786
Ghaemmaghami S, Huh WK, Bower K, Howson RW, Belle A, DephoureN, O’Shea EK, Weissman JS (2003) Global analysis of proteinexpression in yeast. Nature 425: 737–741
Gutteridge A, Pir P, Castrillo JI, Charles PD, Lilley KS, Oliver SG (2010)Nutrient control of eukaryote cell growth: a systems biology studyin yeast. BMC Biol 8: 68
Heer D, Sauer U (2008) Identification of furfural as a key toxin inlignocellulosic hydrolysates and evolution of a tolerant yeast strain.Microb Biotechnol 1: 497–506
Heinemann M, Sauer U (2010) Systems biology of microbialmetabolism. Curr Opin Microbiol 13: 337–343
Herrgard MJ, Swainston N, Dobson P, Dunn WB, Arga KY, Arvas M,Buthgen N, Borger S, Costenoble R, Heinemann M, Hucka M, LeNovere N, Li P, Liebermeister W, Mo ML, Oliveira AP, Petranovic D,Pettifer S, Simeonidis E, Smallbone K et al (2008) A consensus yeastmetabolic network reconstruction obtained from a communityapproach to systems biology. Nat Biotechnol 26: 1155–1160
Hua H, Hui R, Xu L, Shuilong T, Zhiqiang Z, Liwen N, Maikun T (2008)The crystal structure and identification of NQM1/YGR043C, atransaldolase from Saccharomyces cerevisiae. Proteins 73: 1076–1081
Ihmels J, Collins SR, Schuldiner M, Krogan NJ, Weissman JS (2007)Backup without redundancy: genetic interactions reveal the cost ofduplicate gene loss. Mol Syst Biol 3: 86
Ihmels J, Levy R, Barkai N (2004) Principles of transcriptionalcontrol in the metabolic network of Saccharomyces cerevisiae.Nat Biotechnol 22: 86–92
Kitano H (2002a) Computational systems biology. Nature 420: 206–210
Kitano H (2002b) Systems biology: a brief overview. Science 295:1662–1664
Kolkman A, Daran-Lapujade P, Fullaondo A, Olsthoorn MM, Pronk JT,Slijper M, Heck AJ (2006) Proteome analysis of yeast response tovarious nutrient limitations. Mol Syst Biol 2: 26
Kotte O, Heinemann M (2009) A divide-and-conquer approach toanalyze underdetermined biochemical models. Bioinformatics 25:519–525
Kotte O, Zaugg JB, Heinemann M (2010) Bacterial adaptationthrough distributed sensing of metabolic fluxes. Mol Syst Biol6: 355
Kuepfer L, Sauer U, Blank LM (2005) Metabolic functions ofduplicate genes in Saccharomyces cerevisiae. Genome Res 15:1421–1430
Lange V, Malmstrom JA, Didion J, King NL, Johansson BP, Schafer J,Rameseder J, Wong CH, Deutsch EW, Brusniak MY, Buhlmann P,Bjorck L, Domon B, Aebersold R (2008a) Targeted quantitativeanalysis of Streptococcus pyogenes virulence factors by multiplereaction monitoring. Mol Cell Proteomics 7: 1489–1500
Lange V, Picotti P, Domon B, Aebersold R (2008b) Selected reactionmonitoring for quantitative proteomics: a tutorial. Mol Syst Biol4: 222
MacLean B, Tomazela DM, Shulman N, Chambers M, Finney GL,Frewen B, Kern R, Tabb DL, Liebler DC, MacCoss MJ (2010) Skyline:an open source document editor for creating and analyzing targetedproteomics experiments. Bioinformatics 26: 966–968
Mallick P, Schirle M, Chen SS, Flory MR, Lee H, Martin D, Ranish J,Raught B, Schmitt R, Werner T, Kuster B, Aebersold R (2007)Computational prediction of proteotypic peptides for quantitativeproteomics. Nat Biotechnol 25: 125–131
Minard KI, McAlister-Henn L (2005) Sources of NADPH in yeast varywith carbon source. J Biol Chem 280: 39890–39896
Oberhardt MA, Palsson BO, Papin JA (2009) Applications of genome-scale metabolic reconstructions. Mol Syst Biol 5: 320
Oyedotun KS, Lemire BD (2004) The quaternary structure of theSaccharomyces cerevisiae succinate dehydrogenase: homologymodeling, cofactor docking, and molecular dynamics simulationstudies. J Biol Chem 279: 9424–9431
Picotti P, Bodenmiller B, Mueller LN, Domon B, Aebersold R (2009)Full dynamic range proteome analysis of S. cerevisiae by targetedproteomics. Cell 138: 795–806
Picotti P, Lam H, Campbell D, Deutsch EW, Mirzaei H, Ranish J,Domon B, Aebersold R (2008) A database of mass spectrometricassays for the yeast proteome. Nat Methods 5: 913–914
Picotti P, Rinner O, Stallmach R, Dautel F, Farrah T, Domon B,Wenschuh H, Aebersold R (2010) High-throughput generation ofselected reaction-monitoring assays for proteins and proteomes.Nat Methods 7: 43–46
Sauer U (2006) Metabolic networks in motion: 13C-based flux analysis.Mol Syst Biol 2: 62
Sauer U, Heinemann M, Zamboni N (2007) Genetics: getting closer tothe whole picture. Science 316: 550–551
Schellenberger J, Palsson B (2009) Use of randomized sampling foranalysis of metabolic networks. J Biol Chem 284: 5457–5461
Shachrai I, Zaslaver A, Alon U, Dekel E (2010) Cost of unneededproteins in E. coli is reduced after several generations in exponentialgrowth. Mol Cell 38: 758–767
Stahl-Zeng J, Lange V, Ossola R, Eckhardt K, Krek W, Aebersold R,Domon B (2007) High sensitivity detection of plasma proteins bymultiple reaction monitoring of N-glycosites. Mol Cell Proteomics 6:1809–1817
Tabb DL, Vega-Montoto L, Rudnick PA, Variyath AM, Ham AJ, BunkDM, Kilpatrick LE, Billheimer DD, Blackman RK, Cardasis HL, CarrSA, Clauser KR, Jaffe JD, Kowalski KA, Neubert TA, Regnier FE,Schilling B, Tegeler TJ, Wang M, Wang P et al (2010) Repeatability andreproducibility in proteomic identifications by liquid chromatography-tandem mass spectrometry. J Proteome Res 9: 761–776
Verduyn C, Postma E, Scheffers WA, van Dijken JP (1990)Physiology of Saccharomyces cerevisiae in anaerobic
Quantitative analysis of yeast central metabolismR Costenoble et al
12 Molecular Systems Biology 2011 & 2011 EMBO and Macmillan Publishers Limited
glucose-limited chemostat cultures. J Gen Microbiol 136:395–403
Wagner A (2008) Gene duplications, robustness and evolutionaryinnovations. Bioessays 30: 367–373
Wilson JE (2003) Isozymes of mammalian hexokinase: structure,subcellular localization and metabolic function. J Exp Biol 206:2049–2057
Winston F, Dollard C, Ricupero-Hovasse SL (1995) Construction of aset of convenient Saccharomyces cerevisiae strains that are isogenicto S288C. Yeast 11: 53–55
Zaslaver A, Mayo AE, Rosenberg R, Bashkin P, Sberro H, Tsalyuk M,Surette MG, Alon U (2004) Just-in-time transcription program inmetabolic pathways. Nat Genet 36: 486–491
Molecular Systems Biology is an open-access journalpublished by European Molecular Biology Organiza-
tion and Nature Publishing Group. This work is licensed under aCreative Commons Attribution-Noncommercial-Share Alike 3.0Unported License.
Quantitative analysis of yeast central metabolismR Costenoble et al
& 2011 EMBO and Macmillan Publishers Limited Molecular Systems Biology 2011 13
Reproduced with permission of the copyright owner. Further reproduction prohibited without permission.