Page 1
ORIGINAL RESEARCH
Compression failure in dense non-woven fiber networks
August Brandberg . Artem Kulachenko
Received: 17 January 2020 / Accepted: 6 April 2020 / Published online: 30 April 2020
� The Author(s) 2020
Abstract Investigating the compression properties
of randomly ordered fiber networks experimentally is
difficult which has resulted in ongoing disputes as to
the mechanisms controlling the compression strength
in such materials. In this work, we investigated
compression properties of randomly oriented fiber
networks with a special emphasis on cellulose prod-
ucts such as paperboard. We numerically recon-
structed the conditions of the short span compression
test widely used to quantify the compression strength
of paperboard. We found that the phenomenological
failure mode of such networks is elasto-plastic buck-
ling. The x-shaped failure mode observed in physical
experiments appears when test specimen restraints are
included in the model. The most significant improve-
ments to sheet strength can be obtained by improving
the elastic properties while the strain to failure is
increased most by an improvement of the plastic yield
and hardening properties of individual fibers. Bond
breaks were confirmed to have a smaller influence on
the overall response. Fiber level microscopic buckling
was investigated in depth, providing quantitative
estimates of the fraction of mass likely to buckle at
the microscopic level. The analysis indicated that only
a low to moderate number of load carrying fibers can
be expected to buckle. The inherent strength reserve in
non-ordered fiber networks was investigated by intro-
ducing hinge mechanisms throughout the network,
and the effect was shown to be small for a small to
moderate number of hinges.
Keywords Inhomogeneous material � Finiteelements � Compression strength � Micromechanics
Introduction
Cellulose based packaging materials are strong can-
didates to replace fossil-based materials such as
plastics in societies that wish to reduce their depen-
dence on non-sustainable resources. Cellulose is
abundant, cheap, biodegradable and can be tailored
to fit a range of commercial purposes. However,
cellulose based materials present challenges due to
their micromechanical structure. A sheet is made up of
densely packed fibers with a high degree of anisotropy.
There is no matrix, and all the load is transferred via
points of contact between the fibers. A simple sheet of
paper exhibits material non-linearity in the form of
This work was Funded by The Swedish Research Council,
Grant No. 2015-05282. The computational resources were
provided by the National Infrastructure for Computing (SNIC)
at HPC2N, Umea (Project SNIC2017-1-175).
A. Brandberg (&) � A. KulachenkoDepartment of Engineering Mechanics, KTH Royal
Institute of Technology, Teknikringen 8D,
114 28 Stockholm, Sweden
e-mail: [email protected]
123
Cellulose (2020) 27:6065–6082
https://doi.org/10.1007/s10570-020-03153-2(0123456789().,-volV)( 0123456789().,-volV)
Page 2
plasticity, creep, rate-dependent behavior and inelastic
strains induced by moisture and temperature.
Beginning with Cox’ predictions of fiber network
elastic modulus, analytic, experimental and numerical
methods have been devised to study the tensile
network response (Cox 1952). In a series of papers,
Page explored the connection between papermaking
inputs and product performance, culminating in a
theory for the elastic stiffness and tensile strength
(Page 1969; Seth and Page 1981).
However, packaging mainly fails in pure compres-
sion or failure of the compressed side during bending.
The McKee formula predicts the collapse load of
boxes and is given in Eq. (1) (McKee et al. 1963).
Here, a and b are empirical constants, ECT is the edge
crush strength, Z is the perimeter of the box, and Sb;MD
and Sb;CD are the bending stiffness of the paperboard in
the machine direction (MD) and cross direction (CD)
normalized with respect to the width.
BCT ¼ a � ECTbðffiffiffiffiffiffiffiffiffiffiffiffiffiffiffiffiffiffiffiffiffi
Sb;MDSb;CDp
Þ1�bZ2b�1 ð1Þ
Using the McKee formula with typical fitting
parameter values (b � 0:75) suggests that improve-
ments to the edgewise compression strength is the
most effective way to improve performance (McKee
et al. 1963), which raises the question of what controls
the edgewise compression strength and how it can be
increased. A standard way of measuring the ECT is via
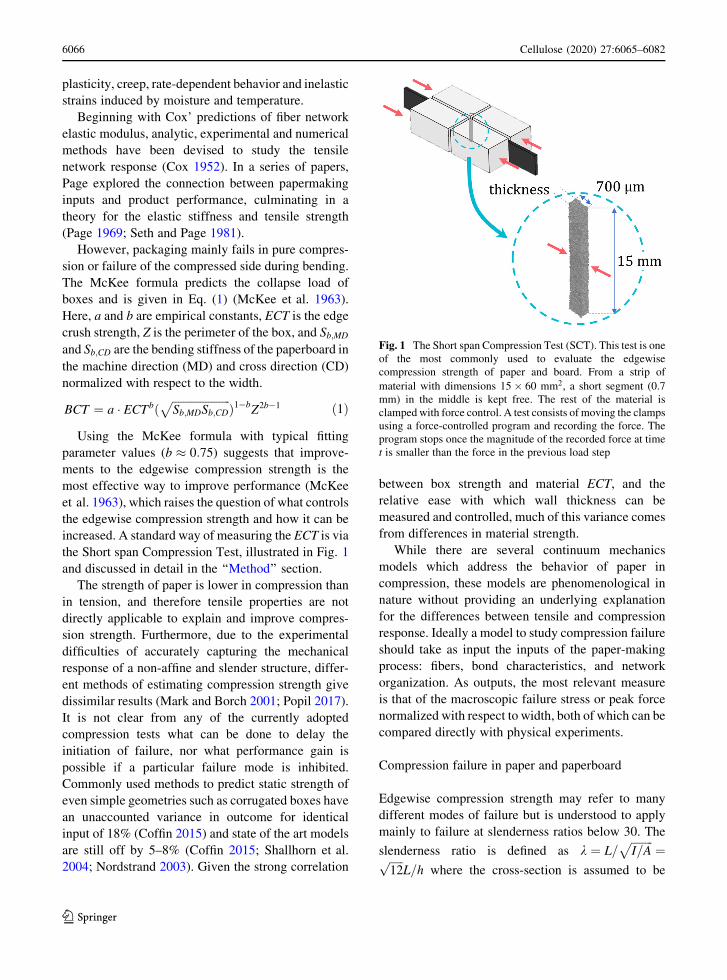
the Short span Compression Test, illustrated in Fig. 1
and discussed in detail in the ‘‘Method’’ section.
The strength of paper is lower in compression than
in tension, and therefore tensile properties are not
directly applicable to explain and improve compres-
sion strength. Furthermore, due to the experimental
difficulties of accurately capturing the mechanical
response of a non-affine and slender structure, differ-
ent methods of estimating compression strength give
dissimilar results (Mark and Borch 2001; Popil 2017).
It is not clear from any of the currently adopted
compression tests what can be done to delay the
initiation of failure, nor what performance gain is
possible if a particular failure mode is inhibited.
Commonly used methods to predict static strength of
even simple geometries such as corrugated boxes have
an unaccounted variance in outcome for identical
input of 18% (Coffin 2015) and state of the art models
are still off by 5–8% (Coffin 2015; Shallhorn et al.
2004; Nordstrand 2003). Given the strong correlation
between box strength and material ECT, and the
relative ease with which wall thickness can be
measured and controlled, much of this variance comes
from differences in material strength.
While there are several continuum mechanics
models which address the behavior of paper in
compression, these models are phenomenological in
nature without providing an underlying explanation
for the differences between tensile and compression
response. Ideally a model to study compression failure
should take as input the inputs of the paper-making
process: fibers, bond characteristics, and network
organization. As outputs, the most relevant measure
is that of the macroscopic failure stress or peak force
normalized with respect to width, both of which can be
compared directly with physical experiments.
Compression failure in paper and paperboard
Edgewise compression strength may refer to many
different modes of failure but is understood to apply
mainly to failure at slenderness ratios below 30. The
slenderness ratio is defined as k ¼ L=ffiffiffiffiffiffiffiffi
I=Ap
¼ffiffiffiffiffi
12p
L=h where the cross-section is assumed to be
Fig. 1 The Short span Compression Test (SCT). This test is one
of the most commonly used to evaluate the edgewise
compression strength of paper and board. From a strip of
material with dimensions 15� 60 mm2, a short segment (0.7
mm) in the middle is kept free. The rest of the material is
clamped with force control. A test consists of moving the clamps
using a force-controlled program and recording the force. The
program stops once the magnitude of the recorded force at time
t is smaller than the force in the previous load step
123
6066 Cellulose (2020) 27:6065–6082
Page 3
rectangular (hence the factor 12), L refers to the free
span length and h to the sheet thickness (Mark and
Borch 2001). Although the ECT value is meant to be
derived from a corrugated board, it is used for thinner
sheets and sheets without fluting as well. The exact
sequence of events that lead to compression failure for
such specimen remains unclear, but the most widely
cited reason is buckling. This explanation comes in
many forms: Elastic buckling, plastic buckling, as well
as combinations of the two (Mark and Borch 2001;
Uesaka and Perkins Jr 1983). It is also employed at all
length scales, ranging from boxes (Grangard 1970), to
box sides (Ristinmaa et al. 2012; McKee et al. 1963)
to sheet laminates (Habeger and Whitsitt 1983) to
individual fibers (Cavlin and Fellers 1975; de Ruvo
et al. 1978) and even individual microfibrils (Ristin-
maa et al. 2012; de Ruvo et al. 1978). Judging from
test samples compressed until collapse and the high
prevalence of buckled structures after the loss of load-
bearing capacity, buckling is either the failure mode or
is induced almost instantly after some other change in
the microstructure. For higher basis weights, Fellers
suggests that shear failure of the fiber wall may be
responsible for the failure of the network (Mark and
Borch 2001).
At the larger length scales the sheet can be idealized
as a set of mutually supporting orthotropic plates, and
the compression strength is correlated well with the
stiffness components C11 and C55 of the assembly of
plates where the indices indicate the component
position in the material stiffness matrix written in
Voigt notation (Habeger and Whitsitt 1983). The
relation holds even when the results are normalized
with respect to density and is amenable to non-
destructive monitoring by ultrasonic stiffness deter-
mination (Habeger and Whitsitt 1983). It is possible to
confirm that an elasto-plastic finite deflection model
using only small strain theory successfully predicts the
compression strength of paper and board using a
commercial finite element solver (Urbanik and Salik-
lis 2003).
A disadvantage of homogenizing properties is that
failure mechanisms stemming from the non-affine
nature of the network are hidden. There are indications
that some failure characteristics stem directly from
meso- and micro-scale variations (Hristopulos and
Uesaka 2004). Some authors argue that in the absence
of buckling instability, plastic deformation of the
fibers will be the dominant damage mechanism and
failure initiator (Mark and Borch 2001). The existence
of plasticity in pulp fibers is still an open question,
with some authors presenting curves which contain
some plastic behavior (Page and El-Hosseiny 1983;
Dumbleton 1971) while others do not (Mark and
Borch 2001). Certainly, single fiber plasticity under
compression loading is an under-explored subject in
the literature. By varying the bond strength inside
networks, it has been shown experimentally and by
simulation that the permanent deformation observed at
high stresses in sheets made of pulp fibers is due to
fiber deformation, not the bonds (Borodulina et al.
2012; Seth and Page 1981).
Sachs and Kuster argue that compression failure of
the network is preceded by delamination of the S1
from the S2 layer inside fibers. Such delamination
leads to a sudden decrease in effective bonding
between fibers inside the network as the S1 layer,
which is the outermost layer of the fiber, does not
contribute significantly to the mechanical perfor-
mance of the fiber. As the bonds release, even a small
amount of additional load cause fibers to buckle,
completing the structural collapse (Sachs and Kuster
1980). The reason buckling takes place directly after
delamination may be the increased span length
between intact bonds. Sachs performed a second study
working with single fibers where the failure sequence
was the same – the whole fiber buckled only after
several other failure modes had developed (Sachs
1986). Fiber buckling is a somewhat diffuse term, and
has been used interchangably with fiber kinking, fiber
plastic hinge formation and even fiber bending. A
good example of how fiber buckling looks can be
found in (Niskanen 2011), p. 86.
In summary, almost every mode of deformation has
been suggested. In this work, the previous contribu-
tions to the field are expanded upon with the help of a
comprehensive modeling framework employing direct
simulation of microscale network constituents at
sample sizes large enough to be industrially relevant.
The principal questions facing the field are
1. What is the minimum set of physical mechanisms
needed to explain the observed behavior of paper
and board in compression? In particular:
• What is the effect of perturbations to the load
bearing capacity of individual fibers?
• What is the sensitivity of network response to
plastic deformation?
123
Cellulose (2020) 27:6065–6082 6067
Page 4
• Is the influence of the number and the strength
of fiber-fiber bonds the same as in tension?
2. How can compression strength be tailored to the
application?
The hypothesis that there are several competing
energy release mechanisms acting at the same load
level is proposed and investigated.
Method
For thin to moderately thick packaging where there is
no fluting, the ECT is typically estimated using the
Short span Compression Test, henceforth SCT. The
test is constructed by cutting samples with the
dimensions 15 � 60 mm2 (width � length). The
sample is clamped with a predefined force, leaving a
0.7 mm free span over which a displacement-con-
trolled compression test is performed. The width of the
sample is chosen to lessen the influence of local
variations and edge effects from the unclamped edges.
The free span length is kept short to prevent buckling.
The test yields a single data point: The maximum load,
typically reported as force per unit width or nominal
stress. In Fig. 1 the geometry is shown schematically.
For the sake of clarity, the sample shown is only 6 mm
wide, rather than 15 mm.
The domain in the free span is modeled using its
microscopic primitives: For paper sheets these are
fibers, bonds, and network affinity. Unlike continuum
properties such as sheet shear strength, these primi-
tives correspond directly to the inputs in the paper-
making process such as pulp quality, bonding
adhesives, the degree of pressing. A typical fiber
may have a length to width ratio of 100, and width to
wall thickness ratio of 10 (Borodulina et al. 2016). For
this reason, simplified kinematic and in turn constitu-
tive relations can be used with little loss of generality.
While the fiber has traditionally been reduced to a truss
element, the Timoshenko beam-column was used
since it is able to capture several deformation modes
inaccessible to the truss formulation while at the same
time providing a description significantly faster than
modeling the fibers using a volumetric approach. Each
fiber is represented by three-noded geometrically non-
linear Timoshenko beam elements (Ibrahimbegovic
1995). The element is geometrically exact and allows
both finite rotations and finite strains. The material law
used is small strain elasto-plasticity with isotropic
hardening, which limits the finite strain effects to
scaling of the inertial properties of the cross-section to
enforce constant element volume.
Each bond between two fibers is represented by a
penalty-based beam-to-beam contact element with
cohesive strength. Using a point-to-point contact
formulation, it is possible to define the effective
mechanical properties of the bond in terms of force-
displacement-delamination energy characteristics.
Such curves can be found in the literature (Fischer
et al. 2012; Magnusson 2016; Magnusson et al. 2013).
The point-wise beam-to-beam formulation with rota-
tional constraints described in (Motamedian and
Kulachenko 2018) is used. Debonding is modeled
using damage based on (Alfano and Crisfield 2001).
The contact stiffness is constant up to a specified
maximum force on the element, followed by a
reduction of the stiffness with a single evolution
parameter D 2 ½0; 1�. Damage is assumed to be
irreversible and unloading after D[ 0 (when damage
has begun) is done linearly with a reduced slope such
that there is no permanent elongation of the contact
element. Upon reloading, the stiffness used during
unloading is used. Compression forces along the
normal of the contact element are assumed not to
cause damage. The tangential forces in the plane
spanned by the two elements in contact are combined
according to Eq. (2), representing the L2-norm of
displacement in the plane formed by the beam tangents
at the contact location.
ut ¼ffiffiffiffiffiffiffiffiffiffiffiffiffiffiffiffiffi
u2t1 þ u2t2
q
ð2Þ
Damage begins when the forces acting on the bond
exceeds a critical level Fc calculated as shown in
Eq. (3) where �Fn is the strength in the normal direction
and �Ft is the strength in the tangential plane,
respectively, and Fn, Ft are the forces in the normal
direction and in the tangential plane.
Fc ¼
ffiffiffiffiffiffiffiffiffiffiffiffiffiffiffiffiffiffiffiffiffiffiffiffiffiffiffiffiffiffiffi
Fn
�Fn
� �2
þ Ft
�Ft
� �2s
ð3Þ
The strength can be written in terms of critical
displacements �un and �ut as the contact stiffness knand kt in the normal and tangential direction are known
prior to damage initiation. A non-dimensional
123
6068 Cellulose (2020) 27:6065–6082
Page 5
effective distance is defined in Eq. (4) where the
critical displacement corresponds to b ¼ 1.
b ¼
ffiffiffiffiffiffiffiffiffiffiffiffiffiffiffiffiffiffiffiffiffiffiffiffiffiffiffiffiffiffi
un
�un
� �2
þ ut
�ut
� �2s
ð4Þ
The damage parameter D is initialized as 0 and is
updated only if b� 1 and the value at the current time
step is larger than that in the previous one, bt [ bt�1
by Eq. (5). The parameter ucn in Eq. (5) denotes the
distance at which the contact is traction free and
completely debonded. The second term in the equation
scales D to the range of displacements over which
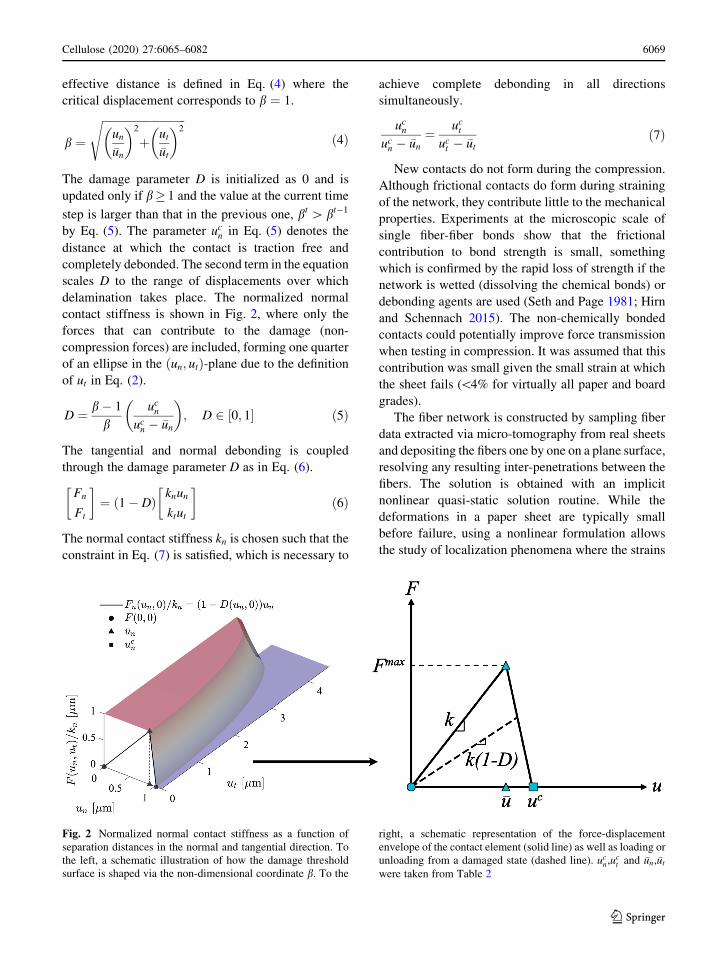
delamination takes place. The normalized normal
contact stiffness is shown in Fig. 2, where only the
forces that can contribute to the damage (non-
compression forces) are included, forming one quarter
of an ellipse in the ðun; utÞ-plane due to the definition
of ut in Eq. (2).
D ¼ b� 1
bucn
ucn � �un
� �
; D 2 ½0; 1� ð5Þ
The tangential and normal debonding is coupled
through the damage parameter D as in Eq. (6).
Fn
Ft
� �
¼ ð1� DÞknun
ktut
� �
ð6Þ
The normal contact stiffness kn is chosen such that the
constraint in Eq. (7) is satisfied, which is necessary to
achieve complete debonding in all directions
simultaneously.
ucnucn � �un
¼ uctuct � �ut
ð7Þ
New contacts do not form during the compression.
Although frictional contacts do form during straining
of the network, they contribute little to the mechanical
properties. Experiments at the microscopic scale of
single fiber-fiber bonds show that the frictional
contribution to bond strength is small, something
which is confirmed by the rapid loss of strength if the
network is wetted (dissolving the chemical bonds) or
debonding agents are used (Seth and Page 1981; Hirn
and Schennach 2015). The non-chemically bonded
contacts could potentially improve force transmission
when testing in compression. It was assumed that this
contribution was small given the small strain at which
the sheet fails (\4% for virtually all paper and board
grades).
The fiber network is constructed by sampling fiber
data extracted via micro-tomography from real sheets
and depositing the fibers one by one on a plane surface,
resolving any resulting inter-penetrations between the
fibers. The solution is obtained with an implicit
nonlinear quasi-static solution routine. While the
deformations in a paper sheet are typically small
before failure, using a nonlinear formulation allows
the study of localization phenomena where the strains
Fig. 2 Normalized normal contact stiffness as a function of
separation distances in the normal and tangential direction. To
the left, a schematic illustration of how the damage threshold
surface is shaped via the non-dimensional coordinate b. To the
right, a schematic representation of the force-displacement
envelope of the contact element (solid line) as well as loading or
unloading from a damaged state (dashed line). ucn,uct and �un,�ut
were taken from Table 2
123
Cellulose (2020) 27:6065–6082 6069
Page 6
in small regions may become significantly larger than
the macroscopic mean, which is common in many
fiber networks (Hagman and Nygards 2012; Deogekar
and Picu 2018). In comparison to recent and similar
computational developments (Deogekar and Picu
2018; Zhang et al. 2018; Lavrykov et al. 2012;
Berkache et al. 2017; Silberstein et al. 2012), the
main differences of the method presented are
1. Denser and larger networks are addressed, large
enough to be relevant for product design tradi-
tional cellulose pulp fibers.
2. The network is fully three-dimensional, which is
central for the distribution and density of bonds.
3. The presented contribution attempts to critically
examine claims which have been made repeat-
edly, but which cannot be easily proved with
physical experiments.
Fiber characteristics
The characteristics necessary to model a Timoshenko
beam are Young’s modulus, shear modulus, length,
width, wall thickness (if the fiber lumen is not
collapsed), and height. The Timoshenko beam formu-
lation described in (Ibrahimbegovic 1995) is used
together with the fiber data in Table 1. The geometric
dimensions of the fibers have the mean and standard
deviation estimated from the observed data, while the
material data is uniformly distributed around the mean
value such that e.g. Ef �UðhEf i � 0:5; hEf i � 1:5Þwhere hi denotes the mean value of .
The fiber material properties are based on testing in
tension. The properties in compression are not known
at the level of single fibers because of the difficulties in
testing fibers in compression. One method of measur-
ing compression strength of single fibers is the elastica
loop (Sinclair 1950). This method has not been used
successfully on wood pulp fibers, presumably due to
their short length. Although some fibers tested in this
way have shown radically lower compression strength
[aramid fiber (Greenwood and Rose 1974), polyviny-
lalcohol and high-performance polyethylene fibers
(Peijs et al. 1995)] the most representative model
fiber, flax, was shown to have a compression strength
equal to about 80% of the tensile strength (Bos et al.
2002).
Bond characteristics
The bond parameters given in Table 2 were used. The
data was taken from samples tested in tension and is
further described in (Borodulina et al. 2012).
The values are within the ranges expected from
experimental works (Fischer et al. 2012; Magnusson
2016; Magnusson et al. 2013), in which the fiber
bonds were tested and the load combination acting in
the bond area was estimated using inverse procedures
using physical models. Although the uniqueness of
such estimations cannot be guaranteed, this is prob-
ably the only way to quantify the bond strength
currently. As we specify the debonding criteria in
terms of forces, we were not affected by the inaccu-
racy in estimating the bonded area. We did not include
Table 1 The fiber properties used, obtained through a fiber
characterization tool
Mean SD
Fiber length 0.998 0.812 mm
Fiber width 24.2 9.05 lm
Fiber wall thickness 1.80 1.81 lm
Width-to-height ratio 2.59 0.17 –
Fiber real over projected length 1.06 0.046 –
Young’s modulus Ef 30 8.66 GPa
Shear modulus G 10 2.88 GPa
Yield stress ry 200 0 MPa
Tangent modulus H 10 0 GPa
The data acquisition is described in (Borodulina et al. 2016).
The mean and standard deviation values are calculated on
sample populations
Table 2 The bond properties used
Normal stiffness 2780 Nm�1
Tangent stiffness 2780 Nm�1
Shear strength 10,000 lN
Normal strength 2500 lN
Tangent separation distance 1.03 lm
Normal separation distance 4.14 lm
The data was obtained by fitting the numerical model against
experimental data for samples tested in tension and is described
in (Borodulina et al. 2012). The values are within the ranges
expected from experimental works (Fischer et al. 2012;
Magnusson 2016; Magnusson et al. 2013)
123
6070 Cellulose (2020) 27:6065–6082
Page 7
the moments acting in the point-wise contact in the
debonding criteria, which can be an additional
enhancement (Deogekar et al. 2019).
Network generation
Many methods of network generation exist, e.g.
(Deogekar and Picu 2018; Bronkhorst 2003; Lavrykov
et al. 2012). The method used is described in (Mota-
median and Kulachenko 2018) in which fibers are
deposited on an initially empty surface, incrementally
forming a network through random generation and
placement of fibers. This method is similar to the
physical process of making handsheets. In industrial
manufacture, additional effects stemming from the
high velocity of deposition must be considered. Due to
the stochastic nature of the process, mesoscale clusters
of sparser and denser areas appear in the network. The
deposition process is two-sided which creates rela-
tively symmetric through-thickness density profiles.
The network characteristics used in most of the
figures, unless otherwise stated were a grammage of
300 g m�2 and a sheet thickness of 0.49 mm. The
elastic modulus was probed in tension using larger
sections of the same network, and was 2:5 0:1 GPa.
As this article does not address the effect of changes in
fiber orientation, only in-plane isotropic sheets were
created.
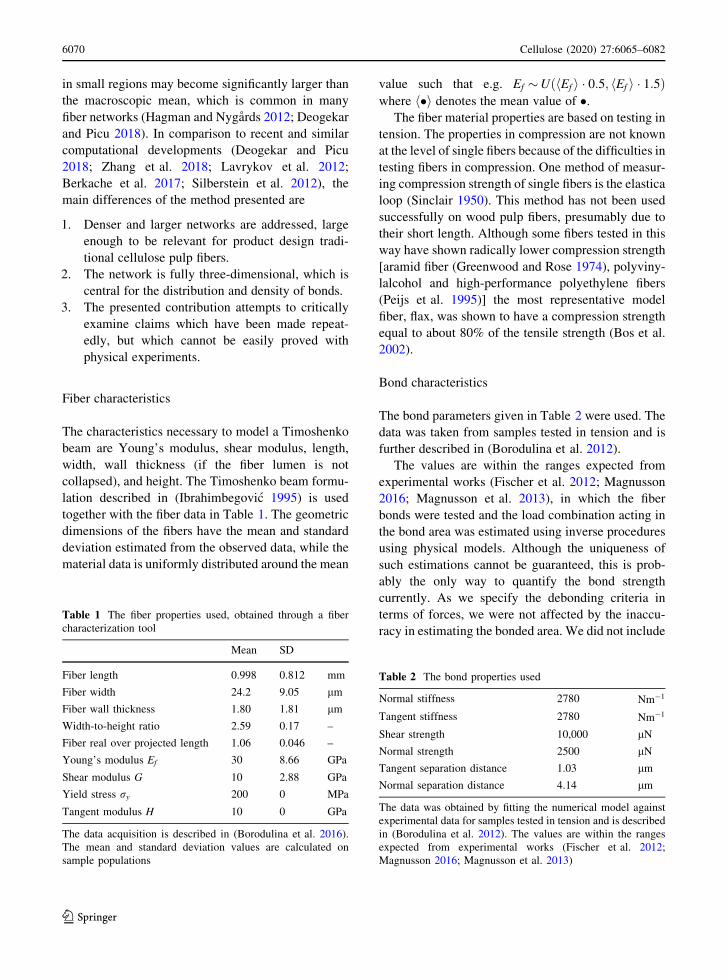
Enforced boundary conditions
Most of the conditions tested do not explicitly model
the clamps. Instead, the following procedure is
applied:
1. A network with dimensions at 12 � 12 � Sheet
Thickness mm3 is generated. The network consists
of elements connected in series to form fibers.
2. The network is centered such that the middle of
the network is at the middle of the SCT free span
domain.
3. The elements which lie outside the free span
domain are removed.
4. The elements which cross the boundary of the free
span domain are edited, by moving the end-node
which is outside of the domain to the boundary of
the domain. The mid-node coordinate is adjusted
such that the mid-node remains in the middle of
the element.
Since the SCT has large amounts of material inside the
clamps on either side and the free span is shorter than
the average fiber length there is a significant number of
fibers crossing the free span. Rather than eliminate
them, they are truncated at both ends. In the end, the
network on which loads are applied contains the free
span domain. On the boundary of the free span domain
are located 1 node of each element which originally
passed through the boundary. The boundary condi-
tions, which are displacement based, are applied on the
nodes located on the boundary of the free span
domain. The nodes on the boundary of the free span
domain are subjected to enforced displacements which
are 0 for all degrees of freedom except the degree of
freedom along � (which coincides with the direction
of the clamp motion in the real test) on one side of the
test. Slippage, which is common in the physical
experiment owing to the difficulty of restraining the
sample without crushing it, is neglected here. Here, an
enforced displacement equal to 5% (for tensile tests)
or �5% strain (hence 0:05 � ð0:7mmÞ ¼ 0:035
mm is applied. Typically this value is not reached, as
the simulation is terminated if softening relative the
peak force exceeds 5%. The enforced boundary
conditions are shown schematically in Fig. 3, on the
left.
When a section of the clamped volume is explicitly
included in the model, the same procedure as above is
performed except the generated volume is 0.175 mm
larger on both sides of the free span domain along the
x-axis. The same boundary conditions are applied on
the boundary of the domain, now containing both the
free span and the modeled section of the clamps.
Furthermore, displacement of all nodes inside the
clamped domains in the z-direction (out-of-plane) is
entirely prohibited as indicated in Fig. 3, on the right.
Pre- and postprocessing
The preparation of results was performed using
(MATLAB 2018) and visualized using Gramm (Morel
2018). The pre- and post-processing of models was
done using (ANSYS 2015).
Results
A mesh study was performed, and a mean element
length of 54 lm was chosen as the results did not
123
Cellulose (2020) 27:6065–6082 6071
Page 8
change upon further refinement. Furthermore, the
computational size of the model was minimized by
performing a response study where the width of the
sample was progressively decreased from the SCT
standard of 15 mm to the point where the response
began to deviate from the result when using the full
width. A width of 6 mm was found to be
representative.
The size of the model was 0.7 � 6 � Sheet
Thickness mm3, which corresponds to 40% of the
volume in the free span in the SCT. Thematerial inside
the clamps was not modeled unless where explicitly
stated (e.g. Fig. 6). When the material inside the
clamps was modeled, the volume modeled was 0.175
� 6 � Sheet Thickness mm3 on each side, which is
0.2% of the volume inside the clamps in a physical
test. However, the reason the clamped volume is so
large is to make the test sample easy to handle and
allow the clamps to immobilize the test piece with
limited damage to the material due to crushing. By
assigning numerical boundary conditions slippage at
the clamps is entirely prevented, making it unneces-
sary to explicitly model such a large volume. The main
factor investigated when modeling the clamps is
whether the geometry-change induced by the force-
controlled pressing of the clamps in itself is enough to
alter the failure mode as compared to when idealized
restraints are used.
Throughout the presentation and discussion of
results, compression failure will be taken to mean
the point in the force–displacement or engineering
stress-engineering strain diagram where the largest
negative value of force or stress is recorded. One
softening branch per parameter combination is also
presented. The accuracy of this softening branch
should be considered low. The onset of the post-peak
response is shown with a dotted line. The quantitative
condition was that the stress should have decreased in
magnitude by 5% relative the peak. The post-peak
behavior was the most computationally intensive due
to deteriorated convergence rate. In some instances,
the entire stress–strain curve is shown. Caution should
be exercised when comparing the strain values with
values obtained using physical experiments, as some
slippage is often inevitable in physical testing. Hence,
the strain reported here will tend to be less than the
strain measured if the correction for slippage is
imperfect.
Fig. 3 Enforced boundary
conditions for models
without the clamped
material (left) and with the
clamped material (right),
respectively
123
6072 Cellulose (2020) 27:6065–6082
Page 9
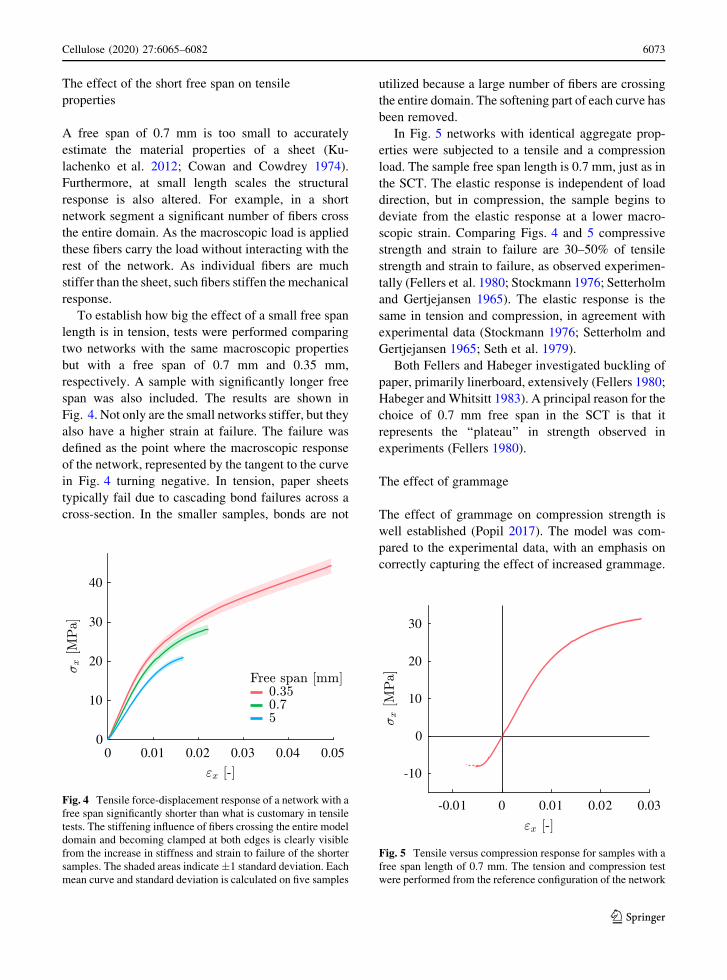
The effect of the short free span on tensile
properties
A free span of 0.7 mm is too small to accurately
estimate the material properties of a sheet (Ku-
lachenko et al. 2012; Cowan and Cowdrey 1974).
Furthermore, at small length scales the structural
response is also altered. For example, in a short
network segment a significant number of fibers cross
the entire domain. As the macroscopic load is applied
these fibers carry the load without interacting with the
rest of the network. As individual fibers are much
stiffer than the sheet, such fibers stiffen the mechanical
response.
To establish how big the effect of a small free span
length is in tension, tests were performed comparing
two networks with the same macroscopic properties
but with a free span of 0.7 mm and 0.35 mm,
respectively. A sample with significantly longer free
span was also included. The results are shown in
Fig. 4. Not only are the small networks stiffer, but they
also have a higher strain at failure. The failure was
defined as the point where the macroscopic response
of the network, represented by the tangent to the curve
in Fig. 4 turning negative. In tension, paper sheets
typically fail due to cascading bond failures across a
cross-section. In the smaller samples, bonds are not
utilized because a large number of fibers are crossing
the entire domain. The softening part of each curve has
been removed.
In Fig. 5 networks with identical aggregate prop-
erties were subjected to a tensile and a compression
load. The sample free span length is 0.7 mm, just as in
the SCT. The elastic response is independent of load
direction, but in compression, the sample begins to
deviate from the elastic response at a lower macro-
scopic strain. Comparing Figs. 4 and 5 compressive
strength and strain to failure are 30–50% of tensile
strength and strain to failure, as observed experimen-
tally (Fellers et al. 1980; Stockmann 1976; Setterholm
and Gertjejansen 1965). The elastic response is the
same in tension and compression, in agreement with
experimental data (Stockmann 1976; Setterholm and
Gertjejansen 1965; Seth et al. 1979).
Both Fellers and Habeger investigated buckling of
paper, primarily linerboard, extensively (Fellers 1980;
Habeger andWhitsitt 1983). A principal reason for the
choice of 0.7 mm free span in the SCT is that it
represents the ‘‘plateau’’ in strength observed in
experiments (Fellers 1980).
The effect of grammage
The effect of grammage on compression strength is
well established (Popil 2017). The model was com-
pared to the experimental data, with an emphasis on
correctly capturing the effect of increased grammage.
0 0.01 0.02 0.03 0.04 0.050
10
20
30
40
Fig. 4 Tensile force-displacement response of a network with a
free span significantly shorter than what is customary in tensile
tests. The stiffening influence of fibers crossing the entire model
domain and becoming clamped at both edges is clearly visible
from the increase in stiffness and strain to failure of the shorter
samples. The shaded areas indicate1 standard deviation. Each
mean curve and standard deviation is calculated on five samples
-0.01 0 0.01 0.02 0.03
-10
0
10
20
30
Fig. 5 Tensile versus compression response for samples with a
free span length of 0.7 mm. The tension and compression test
were performed from the reference configuration of the network
123
Cellulose (2020) 27:6065–6082 6073
Page 10
The result is shown in Fig. 6. No fitting was performed
as the data reported in the experimental data sets is
insufficient to uniquely determine a set of parameters.
The response is more similar to the RCT than the SCT,
indicating that the chosen parameter combination is
somewhat more compliant than the sheets tested
experimentally. However, the data is within the
bounds of what can be expected. Sheets with a
grammage below 80 gm�2 are not tested in compres-
sion, as there is no commonly accepted test protocol. If
the compression strength is normalized with respect to
grammage our data and the SCT data would form a
horizontal line, independent of the basis weight. Such
a constant relationship between compression strength
and mass is an indication that what is measured can be
regarded as a material property.
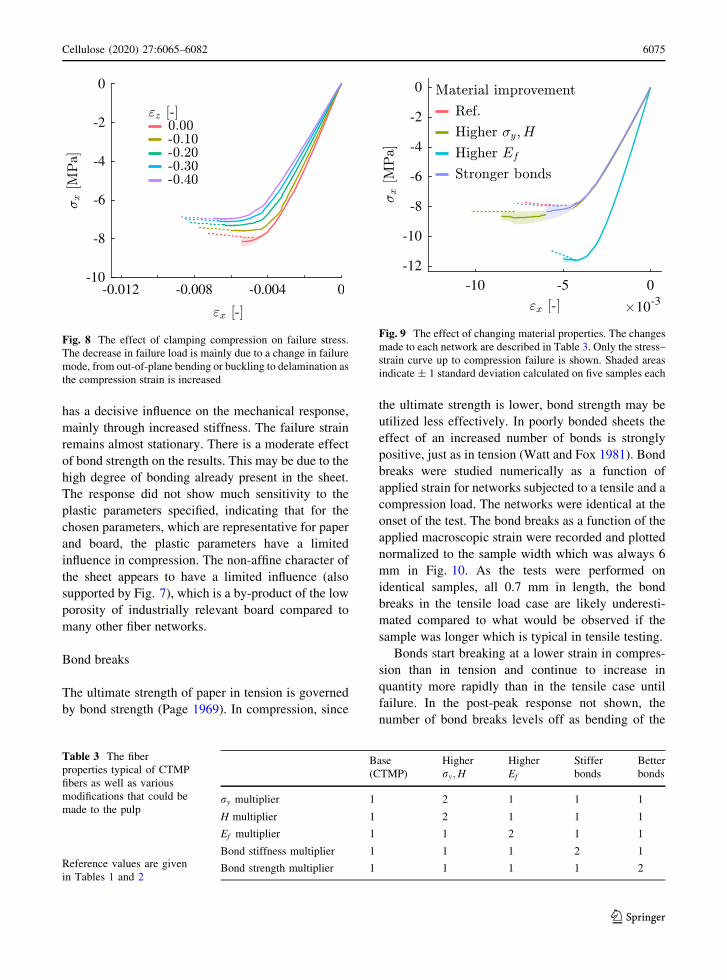
The effect of clamping the specimen during testing
Due to the orthotropy of many fibrous composites,
where the out-of-plane stiffness is much lower than the
in-plane elastic properties, even moderate clamping
pressure can lead to large out of plane compression
strains. Such strains may cause the sample to fail at a
lower load and may also promote certain failure
modes, such as delamination failure. Typical strains
were estimated and imposed by combining the ISO-
standard for SCT (Standard 2013) with the out-of-
plane strain-stress data from (Stenberg and Fellers
2002). In these tests the clamping causes significant
delamination, as shown in Fig. 7. The loss of
compression strength is shown in Fig. 8.
The effect of fiber quality
Using the same networks (meaning that the geometry
obtained from the network deposition process was
reused, eliminating the sample to sample variance
inherent to destructive testing and allowing an exact
comparison of response dependent only on the change
in constitutive parameters), the effect of changing the
material properties of the fibers was examined. This
can be seen as a proxy for the fiber structural integrity
and pulp type. Four sets of material data were tested
and are given in Table 3. The fibers in the reference
case, used elsewhere in this article, have mechanical
properties representative of chemo-thermomechanical
pulp. By screening or using different pulp varieties, it
is possible to improve both the average elastic
modulus of the fibers and the plastic properties, which
correlate with the degree of fiber level damage.
Finally, a test where only the bonding properties have
been improved is performed by scaling the bond
strength by a factor 2. Bond strength is often improved
through the use of additives, such as starch, whereas
bond stiffness is strongly affected by lumen configu-
ration, and thus may be improved through increased
wet pressing.
The force-displacement response in Fig. 9 as
expected highlights the fiber elastic modulus which
0 100 200 300 400
2
4
6
8
Fig. 6 The effect of grammage on the compression strength of
the sheet determined by the Ring Crush Test (RCT) and the
Short span Compression Test (SCT). The experimental data are
taken from (Popil 2017). The model response is not fitted to the
experimental data
Fig. 7 The effect of clamping compression on the failure mode.
In the top picture no clamping is introduced, resulting in a
uniform deformation consisting mostly of bending. In the
bottom picture, ez ¼ �0:40 clamping strain in the ZD results in
the failure mode shifting, with clearly visible delaminated parts
123
6074 Cellulose (2020) 27:6065–6082
Page 11
has a decisive influence on the mechanical response,
mainly through increased stiffness. The failure strain
remains almost stationary. There is a moderate effect
of bond strength on the results. This may be due to the
high degree of bonding already present in the sheet.
The response did not show much sensitivity to the
plastic parameters specified, indicating that for the
chosen parameters, which are representative for paper
and board, the plastic parameters have a limited
influence in compression. The non-affine character of
the sheet appears to have a limited influence (also
supported by Fig. 7), which is a by-product of the low
porosity of industrially relevant board compared to
many other fiber networks.
Bond breaks
The ultimate strength of paper in tension is governed
by bond strength (Page 1969). In compression, since
the ultimate strength is lower, bond strength may be
utilized less effectively. In poorly bonded sheets the
effect of an increased number of bonds is strongly
positive, just as in tension (Watt and Fox 1981). Bond
breaks were studied numerically as a function of
applied strain for networks subjected to a tensile and a
compression load. The networks were identical at the
onset of the test. The bond breaks as a function of the
applied macroscopic strain were recorded and plotted
normalized to the sample width which was always 6
mm in Fig. 10. As the tests were performed on
identical samples, all 0.7 mm in length, the bond
breaks in the tensile load case are likely underesti-
mated compared to what would be observed if the
sample was longer which is typical in tensile testing.
Bonds start breaking at a lower strain in compres-
sion than in tension and continue to increase in
quantity more rapidly than in the tensile case until
failure. In the post-peak response not shown, the
number of bond breaks levels off as bending of the
Fig. 8 The effect of clamping compression on failure stress.
The decrease in failure load is mainly due to a change in failure
mode, from out-of-plane bending or buckling to delamination as
the compression strain is increased
Table 3 The fiber
properties typical of CTMP
fibers as well as various
modifications that could be
made to the pulp
Reference values are given
in Tables 1 and 2
Base Higher Higher Stiffer Better
(CTMP) ry;H Ef bonds bonds
ry multiplier 1 2 1 1 1
H multiplier 1 2 1 1 1
Ef multiplier 1 1 2 1 1
Bond stiffness multiplier 1 1 1 2 1
Bond strength multiplier 1 1 1 1 2
Fig. 9 The effect of changing material properties. The changes
made to each network are described in Table 3. Only the stress–
strain curve up to compression failure is shown. Shaded areas
indicate ± 1 standard deviation calculated on five samples each
123
Cellulose (2020) 27:6065–6082 6075
Page 12
sample takes over as the dominant deformation mode.
The implications of this result are that while the
number of bonds may be important, it is primarily the
most stressed bonds that affect the compression
strength. No localization of bond breaks was detected
in any of the tests performed. Such localization is a
central aspect of tensile failure, but seems not to occur
in compression.
Fiber buckling
The results presented so far have not explicitly
addressed the potential of fiber segments to buckle,
although the numerical scheme employed is in prin-
ciple able to resolve geometric buckling. To include
fiber buckling as a deformation mode in the model, it is
necessary to make additional assumptions beyond
what has been needed up to this point. To fully
characterize the mechanical response during and after
buckling, a model needs as input
– the load at which buckling occurs (determination
of Pcrit),
– the factors that influence the onset of buckling
(parametric dependency on e.g. Young’s modulus,
second area moment of inertia, free span length),
and
– a description of the post-buckled response of the
fiber segment.
There are no reported studies which contain such
information for pulp fibers. In this article, modeling is
substituted in place of experimental data. Buckling is
assumed to take place over the free span of the fiber
between bonded sites. The buckling onset is modeled
by pin-pin column buckling with has the critical load
given by Eq. (8) where ET is the tangent modulus, I is
the second area moment of inertia and L is the free
span length. We did not track of the stress state of each
Gauss point when extracting ET . Once a single Gauss
point yielded, the cross-section was regarded as
yielded and ET appropriately lowered. This approach
is equivalent to the Shanley elasto-plastic buckling
model.
Pcrit ¼p2ETI
L2ð8Þ
The free spans L in the network at the peak load were
calculated, taking into account that some bonds had
already delaminated at that point. Any fiber which was
bonded in only one place was omitted from the
analysis, as it would not transmit mechanical load. The
free span can be calculated in two ways, as shown in
Fig. 11. The method which accounts for fiber width
was used, averaging the free spans l1 and l2.
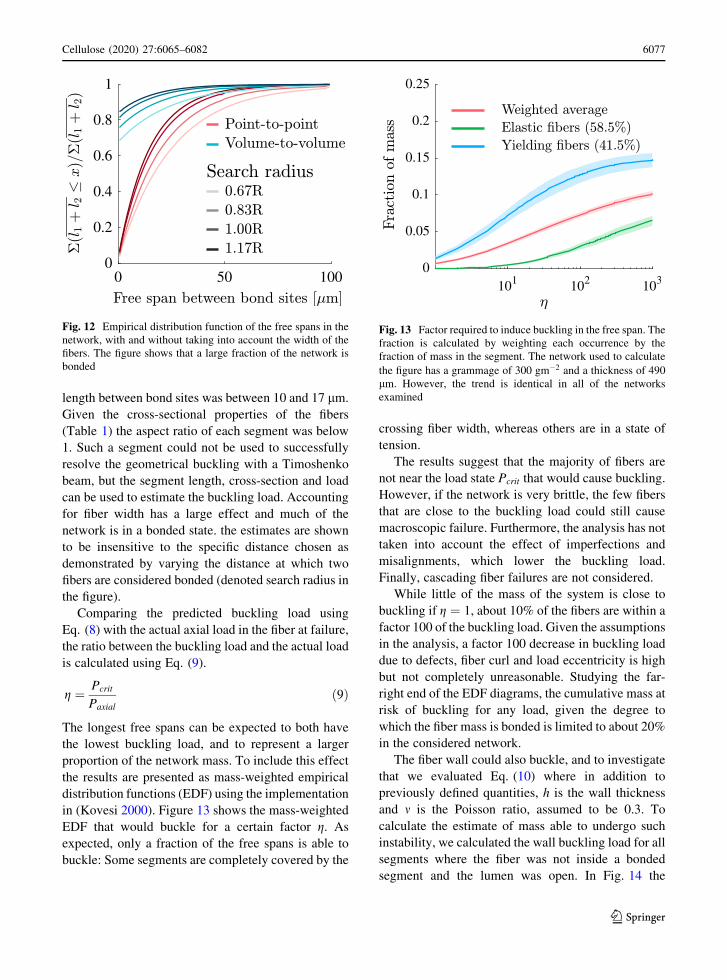
The distribution of free span lengths is given in
Fig. 12. Depending on the search radius used in the
contact detection algorithm, the median segment
Fig. 10 Bond failures per mm width of the sample in tension
and compression, respectively. A compression load causes more
bonds to break at a low degree of loading, but due to the
development of other deformation mechanisms (mainly bend-
ing) as the test progresses, the number of bonds broken at
compression failure stress is significantly lower than what is
observed in tension
L
l1
l2
Fig. 11 Ways of estimating the free span between fiber bonds.
One method is to use the distance from centerline to centerline,
which results in the distance denoted with L. The alternative
method used in this article employs the distance from fiber hull
to fiber hull, which results in a strictly smaller free span, but is
more physically realistic as the fibers are volumetric entities, as
are the bonds
123
6076 Cellulose (2020) 27:6065–6082
Page 13
length between bond sites was between 10 and 17 lm.
Given the cross-sectional properties of the fibers
(Table 1) the aspect ratio of each segment was below
1. Such a segment could not be used to successfully
resolve the geometrical buckling with a Timoshenko
beam, but the segment length, cross-section and load
can be used to estimate the buckling load. Accounting
for fiber width has a large effect and much of the
network is in a bonded state. the estimates are shown
to be insensitive to the specific distance chosen as
demonstrated by varying the distance at which two
fibers are considered bonded (denoted search radius in
the figure).
Comparing the predicted buckling load using
Eq. (8) with the actual axial load in the fiber at failure,
the ratio between the buckling load and the actual load
is calculated using Eq. (9).
g ¼ Pcrit
Paxial
ð9Þ
The longest free spans can be expected to both have
the lowest buckling load, and to represent a larger
proportion of the network mass. To include this effect
the results are presented as mass-weighted empirical
distribution functions (EDF) using the implementation
in (Kovesi 2000). Figure 13 shows the mass-weighted
EDF that would buckle for a certain factor g. As
expected, only a fraction of the free spans is able to
buckle: Some segments are completely covered by the
crossing fiber width, whereas others are in a state of
tension.
The results suggest that the majority of fibers are
not near the load state Pcrit that would cause buckling.
However, if the network is very brittle, the few fibers
that are close to the buckling load could still cause
macroscopic failure. Furthermore, the analysis has not
taken into account the effect of imperfections and
misalignments, which lower the buckling load.
Finally, cascading fiber failures are not considered.
While little of the mass of the system is close to
buckling if g ¼ 1, about 10% of the fibers are within a
factor 100 of the buckling load. Given the assumptions
in the analysis, a factor 100 decrease in buckling load
due to defects, fiber curl and load eccentricity is high
but not completely unreasonable. Studying the far-
right end of the EDF diagrams, the cumulative mass at
risk of buckling for any load, given the degree to
which the fiber mass is bonded is limited to about 20%
in the considered network.
The fiber wall could also buckle, and to investigate
that we evaluated Eq. (10) where in addition to
previously defined quantities, h is the wall thickness
and m is the Poisson ratio, assumed to be 0.3. To
calculate the estimate of mass able to undergo such
instability, we calculated the wall buckling load for all
segments where the fiber was not inside a bonded
segment and the lumen was open. In Fig. 14 the
Fig. 12 Empirical distribution function of the free spans in the
network, with and without taking into account the width of the
fibers. The figure shows that a large fraction of the network is
bonded
Fig. 13 Factor required to induce buckling in the free span. The
fraction is calculated by weighting each occurrence by the
fraction of mass in the segment. The network used to calculate
the figure has a grammage of 300 gm�2 and a thickness of 490
lm. However, the trend is identical in all of the networks
examined
123
Cellulose (2020) 27:6065–6082 6077
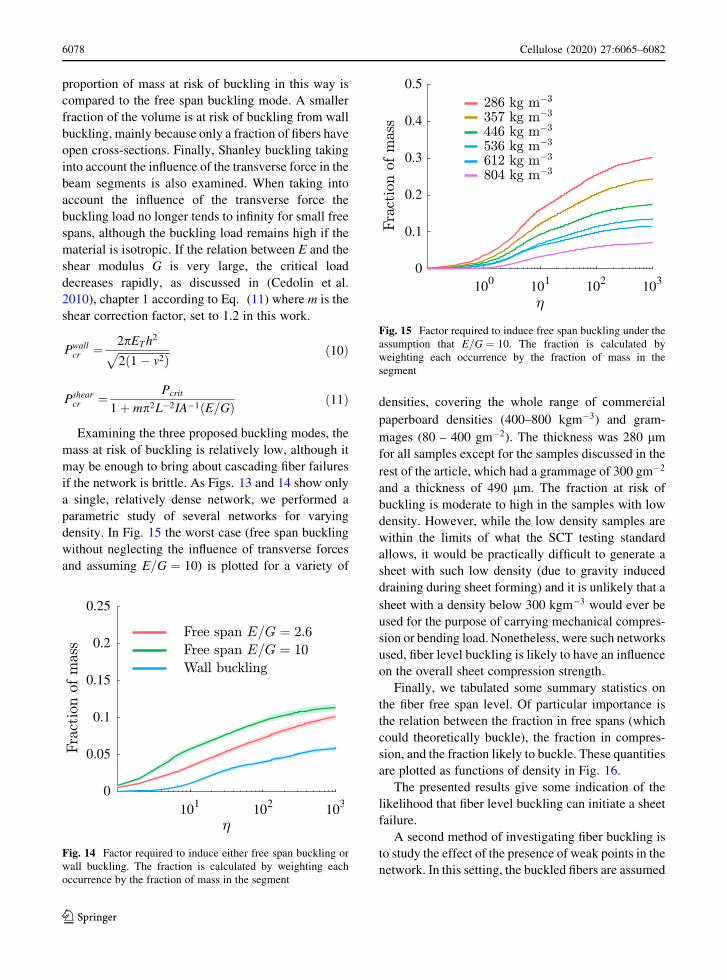
Page 14
proportion of mass at risk of buckling in this way is
compared to the free span buckling mode. A smaller
fraction of the volume is at risk of buckling from wall
buckling, mainly because only a fraction of fibers have
open cross-sections. Finally, Shanley buckling taking
into account the influence of the transverse force in the
beam segments is also examined. When taking into
account the influence of the transverse force the
buckling load no longer tends to infinity for small free
spans, although the buckling load remains high if the
material is isotropic. If the relation between E and the
shear modulus G is very large, the critical load
decreases rapidly, as discussed in (Cedolin et al.
2010), chapter 1 according to Eq. (11) where m is the
shear correction factor, set to 1.2 in this work.
Pwallcr ¼ 2pETh
2
ffiffiffiffiffiffiffiffiffiffiffiffiffiffiffiffiffiffiffi
2ð1� m2Þp ð10Þ
Pshearcr ¼ Pcrit
1þ mp2L�2IA�1ðE=GÞ ð11Þ
Examining the three proposed buckling modes, the
mass at risk of buckling is relatively low, although it
may be enough to bring about cascading fiber failures
if the network is brittle. As Figs. 13 and 14 show only
a single, relatively dense network, we performed a
parametric study of several networks for varying
density. In Fig. 15 the worst case (free span buckling
without neglecting the influence of transverse forces
and assuming E=G ¼ 10) is plotted for a variety of
densities, covering the whole range of commercial
paperboard densities (400–800 kgm�3) and gram-
mages (80 – 400 gm�2). The thickness was 280 lmfor all samples except for the samples discussed in the
rest of the article, which had a grammage of 300 gm�2
and a thickness of 490 lm. The fraction at risk of
buckling is moderate to high in the samples with low
density. However, while the low density samples are
within the limits of what the SCT testing standard
allows, it would be practically difficult to generate a
sheet with such low density (due to gravity induced
draining during sheet forming) and it is unlikely that a
sheet with a density below 300 kgm�3 would ever be
used for the purpose of carrying mechanical compres-
sion or bending load. Nonetheless, were such networks
used, fiber level buckling is likely to have an influence
on the overall sheet compression strength.
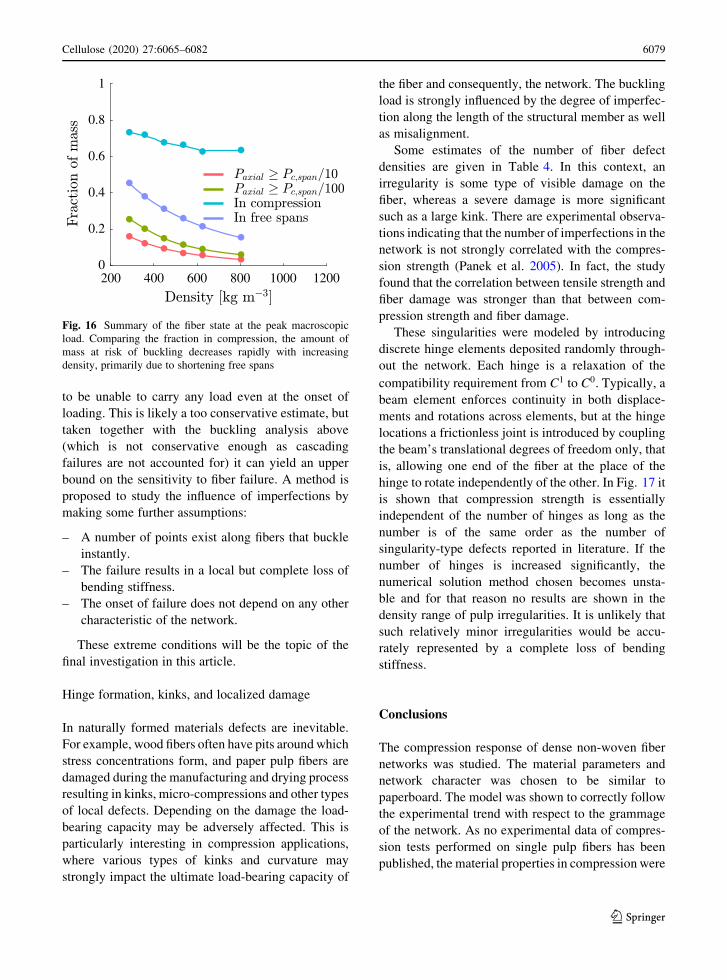
Finally, we tabulated some summary statistics on
the fiber free span level. Of particular importance is
the relation between the fraction in free spans (which
could theoretically buckle), the fraction in compres-
sion, and the fraction likely to buckle. These quantities
are plotted as functions of density in Fig. 16.
The presented results give some indication of the
likelihood that fiber level buckling can initiate a sheet
failure.
A second method of investigating fiber buckling is
to study the effect of the presence of weak points in the
network. In this setting, the buckled fibers are assumed
Fig. 14 Factor required to induce either free span buckling or
wall buckling. The fraction is calculated by weighting each
occurrence by the fraction of mass in the segment
Fig. 15 Factor required to induce free span buckling under the
assumption that E=G ¼ 10. The fraction is calculated by
weighting each occurrence by the fraction of mass in the
segment
123
6078 Cellulose (2020) 27:6065–6082
Page 15
to be unable to carry any load even at the onset of
loading. This is likely a too conservative estimate, but
taken together with the buckling analysis above
(which is not conservative enough as cascading
failures are not accounted for) it can yield an upper
bound on the sensitivity to fiber failure. A method is
proposed to study the influence of imperfections by
making some further assumptions:
– A number of points exist along fibers that buckle
instantly.
– The failure results in a local but complete loss of
bending stiffness.
– The onset of failure does not depend on any other
characteristic of the network.
These extreme conditions will be the topic of the
final investigation in this article.
Hinge formation, kinks, and localized damage
In naturally formed materials defects are inevitable.
For example, wood fibers often have pits around which
stress concentrations form, and paper pulp fibers are
damaged during the manufacturing and drying process
resulting in kinks, micro-compressions and other types
of local defects. Depending on the damage the load-
bearing capacity may be adversely affected. This is
particularly interesting in compression applications,
where various types of kinks and curvature may
strongly impact the ultimate load-bearing capacity of
the fiber and consequently, the network. The buckling
load is strongly influenced by the degree of imperfec-
tion along the length of the structural member as well
as misalignment.
Some estimates of the number of fiber defect
densities are given in Table 4. In this context, an
irregularity is some type of visible damage on the
fiber, whereas a severe damage is more significant
such as a large kink. There are experimental observa-
tions indicating that the number of imperfections in the
network is not strongly correlated with the compres-
sion strength (Panek et al. 2005). In fact, the study
found that the correlation between tensile strength and
fiber damage was stronger than that between com-
pression strength and fiber damage.
These singularities were modeled by introducing
discrete hinge elements deposited randomly through-
out the network. Each hinge is a relaxation of the
compatibility requirement from C1 to C0. Typically, a
beam element enforces continuity in both displace-
ments and rotations across elements, but at the hinge
locations a frictionless joint is introduced by coupling
the beam’s translational degrees of freedom only, that
is, allowing one end of the fiber at the place of the
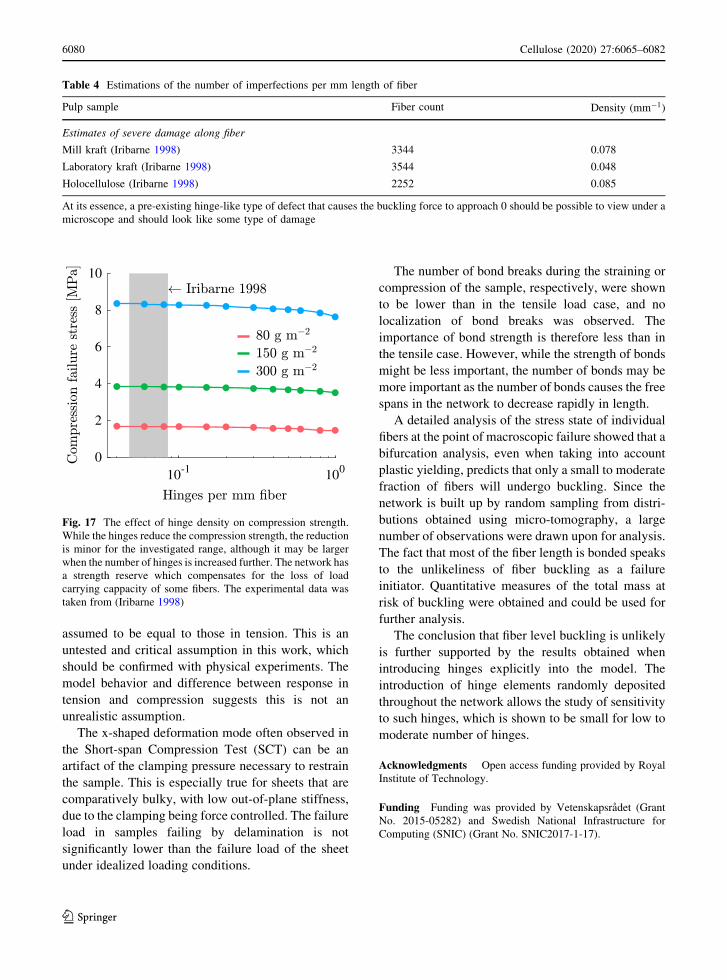
hinge to rotate independently of the other. In Fig. 17 it
is shown that compression strength is essentially
independent of the number of hinges as long as the
number is of the same order as the number of
singularity-type defects reported in literature. If the
number of hinges is increased significantly, the
numerical solution method chosen becomes unsta-
ble and for that reason no results are shown in the
density range of pulp irregularities. It is unlikely that
such relatively minor irregularities would be accu-
rately represented by a complete loss of bending
stiffness.
Conclusions
The compression response of dense non-woven fiber
networks was studied. The material parameters and
network character was chosen to be similar to
paperboard. The model was shown to correctly follow
the experimental trend with respect to the grammage
of the network. As no experimental data of compres-
sion tests performed on single pulp fibers has been
published, the material properties in compression were
Fig. 16 Summary of the fiber state at the peak macroscopic
load. Comparing the fraction in compression, the amount of
mass at risk of buckling decreases rapidly with increasing
density, primarily due to shortening free spans
123
Cellulose (2020) 27:6065–6082 6079
Page 16
assumed to be equal to those in tension. This is an
untested and critical assumption in this work, which
should be confirmed with physical experiments. The
model behavior and difference between response in
tension and compression suggests this is not an
unrealistic assumption.
The x-shaped deformation mode often observed in
the Short-span Compression Test (SCT) can be an
artifact of the clamping pressure necessary to restrain
the sample. This is especially true for sheets that are
comparatively bulky, with low out-of-plane stiffness,
due to the clamping being force controlled. The failure
load in samples failing by delamination is not
significantly lower than the failure load of the sheet
under idealized loading conditions.
The number of bond breaks during the straining or
compression of the sample, respectively, were shown
to be lower than in the tensile load case, and no
localization of bond breaks was observed. The
importance of bond strength is therefore less than in
the tensile case. However, while the strength of bonds
might be less important, the number of bonds may be
more important as the number of bonds causes the free
spans in the network to decrease rapidly in length.
A detailed analysis of the stress state of individual
fibers at the point of macroscopic failure showed that a
bifurcation analysis, even when taking into account
plastic yielding, predicts that only a small to moderate
fraction of fibers will undergo buckling. Since the
network is built up by random sampling from distri-
butions obtained using micro-tomography, a large
number of observations were drawn upon for analysis.
The fact that most of the fiber length is bonded speaks
to the unlikeliness of fiber buckling as a failure
initiator. Quantitative measures of the total mass at
risk of buckling were obtained and could be used for
further analysis.
The conclusion that fiber level buckling is unlikely
is further supported by the results obtained when
introducing hinges explicitly into the model. The
introduction of hinge elements randomly deposited
throughout the network allows the study of sensitivity
to such hinges, which is shown to be small for low to
moderate number of hinges.
Acknowledgments Open access funding provided by Royal
Institute of Technology.
Funding Funding was provided by Vetenskapsradet (Grant
No. 2015-05282) and Swedish National Infrastructure for
Computing (SNIC) (Grant No. SNIC2017-1-17).
Table 4 Estimations of the number of imperfections per mm length of fiber
Pulp sample Fiber count Density (mm�1)
Estimates of severe damage along fiber
Mill kraft (Iribarne 1998) 3344 0.078
Laboratory kraft (Iribarne 1998) 3544 0.048
Holocellulose (Iribarne 1998) 2252 0.085
At its essence, a pre-existing hinge-like type of defect that causes the buckling force to approach 0 should be possible to view under a
microscope and should look like some type of damage
Fig. 17 The effect of hinge density on compression strength.
While the hinges reduce the compression strength, the reduction
is minor for the investigated range, although it may be larger
when the number of hinges is increased further. The network has
a strength reserve which compensates for the loss of load
carrying cappacity of some fibers. The experimental data was
taken from (Iribarne 1998)
123
6080 Cellulose (2020) 27:6065–6082
Page 17
Compliance with ethical standards
Conflicts of interest The authors declare that they have no
conflict of interest.
Open Access This article is licensed under a Creative Com-
mons Attribution 4.0 International License, which permits use,
sharing, adaptation, distribution and reproduction in any med-
ium or format, as long as you give appropriate credit to the
original author(s) and the source, provide a link to the Creative
Commons licence, and indicate if changes were made. The
images or other third party material in this article are included in
the article’s Creative Commons licence, unless indicated
otherwise in a credit line to the material. If material is not
included in the article’s Creative Commons licence and your
intended use is not permitted by statutory regulation or exceeds
the permitted use, you will need to obtain permission directly
from the copyright holder. To view a copy of this licence, visit
http://creativecommons.org/licenses/by/4.0/.
References
Alfano G, Crisfield MA (2001) Finite element interface models
for the delamination analysis of laminated composites:
mechanical and computational issues. Int J Numer Meth-
ods Eng 50(7):1701–1736. https://doi.org/10.1002/nme.93
ANSYS (2015) version 15.0. ANSYS
Berkache K, Deogekar S, Goda I, Picu R, Ganghoffer JF (2017)
Construction of second gradient continuum models for
random fibrous networks and analysis of size effects.
Compos Struct 181:347–357. https://doi.org/10.1016/j.
compstruct.2017.08.078
Borodulina S, Kulachenko A, Nygards M, Galland S (2012)
Stress-strain curve of paper revisited. Nordic Pulp Pap Res
J 27(2):318–328. https://doi.org/10.3183/npprj-2012-27-
02-p318-328
Borodulina S, Kulachenko A, Wernersson EL, Hendriks CLL
(2016) Extracting fiber and network connectivity data
using microtomography images of paper. Nordic Pulp Pap
Res J 31(3):469–478. https://doi.org/10.3183/npprj-2016-
31-03-p469-478
Bos HL, Oever MJAVD, Peters OCJJ (2002) Tensile and
compressive properties of flax fibres for natural fibre
reinforced composites. J Mater Sci 37(8):1683–1692.
https://doi.org/10.1023/a:1014925621252
Bronkhorst C (2003) Modelling paper as a two-dimensional
elastic–plastic stochastic network. Int J Solids Struct
40(20):5441–5454. https://doi.org/10.1016/s0020-
7683(03)00281-6
Cavlin S, Fellers C (1975) A new method for measuring the
edgewise compression properties of paper. Svensk Pap-
perstidning 9:329–332
Cedolin L et al (2010) Stability of structures: elastic, inelastic,
fracture and damage theories. World Scientific, Singapore
Coffin DW (2015) Some observations towards improved pre-
dictive models for box compression strength. Tappi
14(8):537–545
Cowan W, Cowdrey E (1974) Evaluation of paper strength
components by short-span tensile analysis. Tappi
57(2):90–93
Cox HL (1952) The elasticity and strength of paper and other
fibrous materials. Br J Appl Phys 3(3):72–79. https://doi.
org/10.1088/0508-3443/3/3/302
de Ruvo A, Fellers C, Engman C (1978) The influence of raw
material and design on the mechanical performance of
boxboard. Svensk Papperstidning 18:557–566
Deogekar S, Picu R (2018) On the strength of random fiber
networks. J Mech Phys Solids 116:1–16. https://doi.org/10.
1016/j.jmps.2018.03.026
Deogekar S, Islam M, Picu R (2019) Parameters controlling the
strength of stochastic fibrous materials. Int J Solids Struct
168:194–202. https://doi.org/10.1016/j.ijsolstr.2019.03.
033
Dumbleton DP (1971) Longitudinal compression of individual
pulp fibers. Ph,D. thesis, Georgia Institute of Technology
Fellers C (1980) The significance of structure on the compres-
sion behaviour of paper. Thesis, KTH Royal Institute of
Technology
Fellers C, Elfstrom J, Htun M (1980) Edgewise compression
properties. A comparison of handsheets made from pulps
of various yields [lignans, cellulose]. Tappi 63(6):109–112
Fischer WJ, Hirn U, Bauer W, Schennach R (2012) Testing of
individual fiber-fiber joints under biaxial load and simul-
taneous analysis of deformation. Nordic Pulp Pap Res J
27(2):237–244. https://doi.org/10.3183/npprj-2012-27-02-
p237-244
Grangard H (1970) Compression of board cartons: Part, com-
pression of panels and corners. Svensk Papperstidning
73(16):487–492
Greenwood JH, Rose PG (1974) Compressive behaviour of
kevlar 49 fibres and composites. J Mater Sci
9(11):1809–1814. https://doi.org/10.1007/bf00541750
Habeger CC, Whitsitt WJ (1983) A mathematical model of
compressive strength in paperboard. Fibre Sci Technol
19(3):215–239. https://doi.org/10.1016/0015-
0568(83)90004-0
Hagman A, Nygards M (2012) Investigation of sample-size
effects on in-plane tensile testing of paperboard. Nordic
Pulp Pap Res J 27(2):295–304. https://doi.org/10.3183/
npprj-2012-27-02-p295-304
Hirn U, Schennach R (2015) Comprehensive analysis of indi-
vidual pulp fiber bonds quantifies the mechanisms of fiber
bonding in paper. Sci Rep. https://doi.org/10.1038/
srep10503
Hristopulos DT, Uesaka T (2004) Structural disorder effects on
the tensile strength distribution of heterogeneous brittle
materials with emphasis on fiber networks. Phys Rev B
70(6):064108. https://doi.org/10.1103/physrevb.70.
064108
Ibrahimbegovic A (1995) On finite element implementation of
geometrically nonlinear reissners beam theory: three-di-
mensional curved beam elements. Comput Methods Appl
Mech Eng 122(1–2):11–26. https://doi.org/10.1016/0045-
7825(95)00724-f
Iribarne J (1998) Strength loss in kraft pulping. Ph.D. thesis,
State University of New York
123
Cellulose (2020) 27:6065–6082 6081
Page 18
Kovesi PD (2000)MATLAB and Octave functions for computer
vision and image processing. http://www.peterkovesi.com/
matlabfns/. Accessed 1 Nov 2018
Kulachenko A, Denoyelle T, Galland S, Lindstrom SB (2012)
Elastic properties of cellulose nanopaper. Cellulose
19(3):793–807. https://doi.org/10.1007/s10570-012-9685-
5
Lavrykov S, Ramarao BV, Lindstrom SB, Singh KM (2012) 3d
network simulations of paper structure. Nordic Pulp Pap
Res J 27(2):256–263. https://doi.org/10.3183/npprj-2012-
27-02-p256-263
Magnusson MS (2016) Investigation of interfibre joint failure
and how to tailor their properties for paper strength. Nordic
Pulp Pap Res J 31(1):109–122. https://doi.org/10.3183/
npprj-2016-31-01-p109-122
Magnusson M, Zhang X, Ostlund S (2013) Experimental eval-
uation of the interfibre joint strength of papermaking fibres
in terms of manufacturing parameters and in two different
loading directions. Exp Mech 53(9):1621–1634. https://
doi.org/10.1007/s11340-013-9757-y
Mark RE, Borch J (2001) Handbook of physical testing of paper,
vol 1. CRC Press, New York
MATLAB (2018) version 9.4.0.813654 (R2018a). The Math-
Works Inc., Natick, Massachusetts
McKee R, Gander J, Wachuta J (1963) Compression strength
formula for corrugated boxes. Paperboard Packag
48(8):149–159
Morel P (2018) Gramm: grammar of graphics plotting in matlab.
J Open Sour Softw 3(23):568. https://doi.org/10.21105/
joss.00568
Motamedian HR, Kulachenko A (2018) Rotational constraint
between beams in 3-d space. Mech Sci 9(2):373–387.
https://doi.org/10.5194/ms-9-373-2018
Niskanen K (ed) (2011) Mechanics of paper products. Walter de
GmbH Gruyter, Berlin
Nordstrand T (2003) Basic testing and strength design of cor-
rugated board and containers. Thesis. Lund University,
Lund
Page DH (1969) A theory for the tensile strength of paper. Tappi
52(4):674–681
Page DH, El-Hosseiny F (1983) mechanical properties of single
wood pulp fibres. vi. fibril angle and the shape of the stress-
strain curve. Pulp and Paper Canada
Panek J, Fellers C, Haraldsson T, Mohlin UB (2005) Effect of
fibre shape and fibre distortions on creep properties of kraft
paper in constant and cyclic humidity. Fund Res Symp
Camb 2:777–796
Peijs T, van Vught R, Govaert L (1995) Mechanical properties
of poly(vinyl alcohol) fibres and composites. Composites
26(2):83–90. https://doi.org/10.1016/0010-
4361(95)90407-q
Popil RE (2017) Physical testing of paper. Smithers Pira
Ristinmaa M, Ottosen NS, Korin C (2012) Analytical prediction
of package collapse loads: basic considerations. Nordic
Pulp Pap Res J 27(4):806–813. https://doi.org/10.3183/
npprj-2012-27-04-p806-813
Sachs IB (1986) Microscopic observations during longitudinal
compression loading of single pulp fibers. Tappi 7:98–102
Sachs IB, Kuster TA (1980) Edgewise compression failure
mechanism of linerboard observed in a dynamic mode.
Tappi 63(10):69–73
Seth R, Page DH (1981) The stress–strain curve of paper. Role
Fund Res Pap Making 1:421–452
Seth R, Soszynski R, Page DH (1979) Intrinsic edgewise com-
pressive strength of paper: the effect of some papermaking
variables. Tappi 62(12):97–99
Setterholm V, Gertjejansen R (1965) Method for measuring the
edgewise compressive properties of paper. Tappi
48(5):308–313
Shallhorn P, Ju S, Gurnagul N (2004) A model for short-span
compressive strength of paperboard. Nordic Pulp Pap Res J
19(2):130–134. https://doi.org/10.3183/npprj-2004-19-02-
p130-134
Silberstein MN, Pai CL, Rutledge GC, Boyce MC (2012)
Elastic–plastic behavior of non-woven fibrous mats.
J Mech Phys Solids 60(2):295–318. https://doi.org/10.
1016/j.jmps.2011.10.007
Sinclair D (1950) A bending method for measurement of the
tensile strength and Young’s modulus of glass fibers.
J Appl Phys 21(5):380–386. https://doi.org/10.1063/1.
1699670
Standard I (2013) Papper och kartong - kompressionsstyrka -
prov med kort inspanningslangd (iso 9895:2008, idt)-ss-iso
9895:2009
Stenberg N, Fellers C (2002) Out-of-plane poisson’s ratios of
paper and paperboard. Nordic Pulp Pap Res J
17(4):387–394. https://doi.org/10.3183/npprj-2002-17-04-
p387-394
Stockmann VE (1976) Measurement of intrinsic compressive
strength of paper. Tappi 59(7):93–97
Uesaka T, Perkins Jr R (1983) Edgewise compressive strength
of paper board as an instability phenomenon. Svensk
Papperstidning 191–197
Urbanik T, Saliklis E (2003) Finite element corroboration of
buckling phenomena observed in corrugated boxes. Wood
Fiber Sci 35(3):322–333
Watt JA, Fox TS (1981) Compression failure morphology of
linerboard. Project 2695-20, report one: a progress report to
the fourdrinier kraft board group of the american paper
institute. Technical report
Zhang M, Chen Y, Pen Chiang F, Gouma PI, Wang L (2018)
Modeling the large deformation and microstructure evo-
lution of nonwoven polymer fiber networks. J Appl Mech
86(1):011010. https://doi.org/10.1115/1.4041677
Publisher’s Note Springer Nature remains neutral with
regard to jurisdictional claims in published maps and
institutional affiliations.
123
6082 Cellulose (2020) 27:6065–6082