COMPRESSION RESPONSE AND MODELING OF INTERPENETRATING PHASE COMPOSITES AND FOAM-FILLED HONEYCOMBS Except where reference is made to the work of others, the work described in this thesis is my own or was done in collaboration with my advisory committee. This thesis does not include proprietary or classified information. Rahul Jhaver Certificate of Approval: Jeffrey C. Suhling Hareesh V. Tippur, Chair Quina Professor Professor Mechanical Engineering Mechanical Engineering Robert L. Jackson George T. Flowers Assistant Professor Dean Mechanical Engineering Graduate School
Transcript
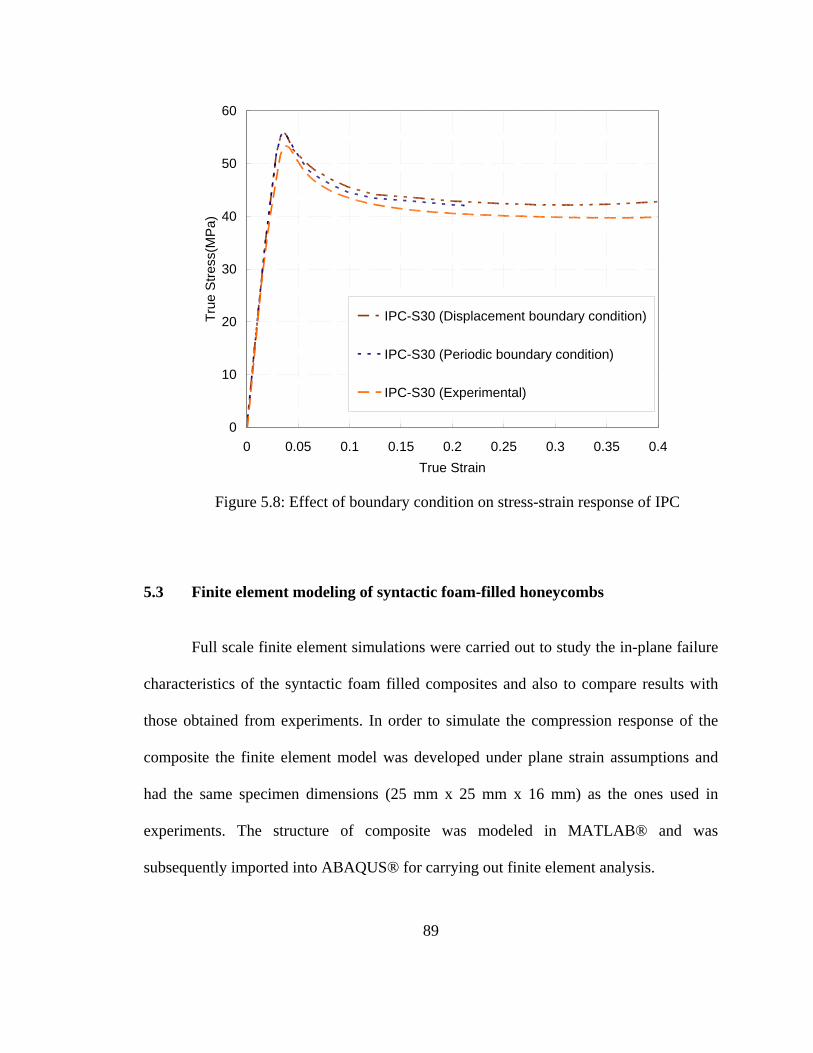
COMPRESSION RESPONSE AND MODELING OF
INTERPENETRATING PHASE COMPOSITES
AND FOAM-FILLED HONEYCOMBS
Except where reference is made to the work of others, the work described in this thesis is my own or was done in collaboration with my advisory committee. This thesis does not
include proprietary or classified information.
Rahul Jhaver Certificate of Approval: Jeffrey C. Suhling Hareesh V. Tippur, Chair Quina Professor Professor Mechanical Engineering Mechanical Engineering Robert L. Jackson George T. Flowers Assistant Professor Dean Mechanical Engineering Graduate School
COMPRESSION RESPONSE AND MODELING OF
INTERPENETRATING PHASE COMPOSITES
AND FOAM-FILLED HONEYCOMBS
Rahul Jhaver
A Thesis
Submitted to
the Graduate Faculty of
Auburn University
in Partial Fulfillment of the
Requirements for the
Degree of
Master of Science
Auburn, Alabama August 10, 2009
iii
COMPRESSION RESPONSE AND MODELING OF
INTERPENETRATING PHASE COMPOSITES
AND FOAM-FILLED HONEYCOMBS
Rahul Jhaver
Permission is granted to Auburn University to make copies of this thesis at its discretion, upon request of individuals or institutions and at their expense. The author reserves all
publication rights.
______________________________ Signature of Author
______________________________ Date of Graduation
iv
VITA
Rahul Jhaver was born in Nagpur, India in 1985. He obtained his Bachelor’s degree
in Mechanical Engineering from Anna University, Chennai, India in 2006 with first class.
He started pursuing his Master of Science degree in Mechanical Engineering at Auburn
University in August 2006. Since his enrollment in the M.S program, he has also worked
as a Graduate Research Assistant, conducting research on the failure behavior of
interpenetrating phase composites. He also worked as a Graduate Teaching Assistant for
the undergraduate course of Mechanics of Materials at the mechanical engineering
department
v
THESIS ABSTRACT
COMPRESSION RESPONSE AND MODELING OF
INTERPENETRATING PHASE COMPOSITES
AND FOAM-FILLED HONEYCOMBS
Rahul Jhaver
Master of Science, August 10, 2009 (B.E., Anna University, 2006)
163 Typed Pages
Directed by Hareesh V. Tippur
Although multiphase materials with discrete, dispersed and/or embedded phases in a
matrix have been evolving over the years, there are limitations in terms of the degree of
concentration of the secondary phase that can be dispersed into the primary phase.
Nature has addressed this by adopting a 3D interpenetrating network of phases as evident
in skeletal tissues and some tree trunk microstructures. This observation has inspired a
relatively new category of materials called Interpenetrating Phase Composites (IPC).
Thus in an IPC constituent phases are interconnected three-dimensionally and
topologically throughout the microstructure. Consequently, each phase of an IPC
contributes its property to the overall macro scale characteristics while adding
mechanical constraint synergistically.
In this thesis, the feasibility of processing a lightweight interpenetrating phase
composite (IPC) made of aluminum and syntactic polymer foams is demonstrated.
vi
A syntactic foam-filled aluminum honeycomb composite is also examined as a 2D
variant of the IPC. Pressureless infiltration of uncured syntactic epoxy foam into an
open-cell aluminum preform or a honeycomb structure is used for producing the
composite systems. The compression characteristics of these novel materials relative to
syntactic foams are studied. Different varieties of IPC foam and foam-filled honeycombs
are prepared by varying the volume fraction of microballoons in the syntactic epoxy foam
while keeping the volume fraction of the metallic network the same. Two variations of
IPC foam are produced by using the aluminum preform in ‘as-received’ condition and
after coating it with silane to increase adhesion between the metallic network and
polymer foam. Uniaxial compression tests are then carried out on syntactic foam and
foam-filled composites. The IPC foam and foam-filled honeycomb samples show
enhancement in elastic modulus, yield stress and plateau stress when compared to the
show significant improvements in these properties. The silane treated IPC foam
consistently shows about 50% higher energy absorption relative to the corresponding
syntactic foam. The maximum increase in the energy absorption for syntactic foam-filled
honeycomb composite is found to be approximately 48%.
A unit-cell based 3D elastic-plastic finite element model is developed to predict the
stress-strain response of the IPC foam. A space filling Kelvin cell (tetrakaidecahedron) is
used to represent the microstructure of the IPC. In case of foam-filled honeycombs, 2D
elastic-plastic analyses on 8 x 8 array of cells are carried out. Measurements are used to
validate compression behavior of both IPC and foam-filled honeycomb models up to 40%
strain. The measured elastic moduli of the syntactic foam and foam-filled composites
are also compared with a few existing micromechanics models.
vii
ACKNOWLEDGEMENTS
In the first place, I would like to express my deepest and sincere gratitude to my
advisor, Dr. Hareesh V. Tippur for his unflagging support, guidance, motivation and also
introducing me to new concepts throughout this research work. Thanks are due to my
thesis committee members Dr. Jeffrey Suhling and Dr. Robert Jackson for reviewing this
work. I would like to thank my research group, Kailash, Chandru, Dong and Vinod for
useful discussions and enjoyable moments in the lab. Thanks are also due to Madhu and
Taylor, former students of our group for there suggestions and ideas during this research
work. Thanks to Mr. Roy Howard in Materials Science Department for his help with the
Scanning Electron Microscope. The financial support of this research by the U.S. Army
Research Office (grants # W911NF-04-10257 and W911NF-08-1-0285) awarded to Dr.
Hareesh Tippur is gratefully acknowledged
Finally, I would like to thank all my friends and colleagues for their support and
encouragement at all times during my stay at auburn. I owe my most sincere gratitude
and gratefulness to my parents and brother for their enduring love and immense moral
support. They have been a constant source of inspiration and motivation. I dedicate this
work to them.
viii
Style manual or journal used Discrete Mathematics (together with the style
known as “auphd”). Bibliography follows van Leunen’s A Handbook for Scholars.
Computer software used The document preparation package Microsoft Word
2003. Microsoft Excel 2003 was used for preparing the graphs.
ix
TABLE OF CONTENTS
LIST OF FIGURES .......................................................................................................... xii LIST OF TABLES .......................................................................................................... xvii 1. INTRODUCTION .........................................................................................................1 1.1 Cellular solids: An overview ................................................................................1 1.2 Advantages of foam-filled cellular solids .............................................................4 1.3 Interpenetrating phase composites(IPC) ...............................................................5 1.4 Literature review ...................................................................................................8 1.5 Objectives ...........................................................................................................12 1.5 Organization of the thesis ................................................................................ 13 2. MATERIAL PREPARATION AND CHARACTERIZATION .................................15 2.1 Material description ............................................................................................15 2.1.1 Syntactic foam ........................................................................................16 2.1.2 Aluminum foam ......................................................................................17 2.1.3 Aluminum honeycomb............................................................................19 2.2 Material preparation ............................................................................................20 2.2.1 Mold preparation .....................................................................................21 2.2.2 Syntactic foam ........................................................................................22 2.2.3 Interpenetrating aluminum-syntactic foam composite ............................23 2.2.4 Syntactic foam-filled aluminum honeycomb composite ........................25 2.3 Microstructural characterization .........................................................................26 2.3.1 Syntactic foam ........................................................................................26 2.3.2 Interpenetrating aluminum-syntactic foam composite ............................27 2.3.3 Syntactic foam-filled aluminum honeycomb composite ........................28 3. COMPRESSION CHARACTERISTICS OF SYNTACTIC FOAM ..........................30 3.1 Experimental setup..............................................................................................30 3.2 Effect of specimen aspect ratio ...........................................................................32 3.3 Effect of volume fraction of microballoons ........................................................34 3.4 Energy absorption characteristics of syntactic foam ..........................................38 3.5 Effect of lubricant on stress-strain response of syntactic foam ..........................41
x
4. COMPRESSION CHARACTERISTICS OF SYNTACTIC FOAM-FILLED COMPOSITES ............................................................................................................45 4.1 Compression characteristics of IPC foam ...........................................................46 4.1.1 Effect of volume fraction of microballoons ............................................49 4.1.2 Energy absorption characteristics of IPC ................................................54 4.2 Compression characteristics of syntactic foam-filled honeycombs ....................57 4.2.1 Effect of volume fraction of microballoons ............................................57 4.2.2 Effect of direction of compression ..........................................................64 4.2.3 Energy absorption characteristics of syntactic foam-filled honeycomb .67 5. FINITE ELEMENT MODELING OF SYNTACTIC FOAM-FILLED COMPOSITES .............................................................................................................72 5.1 Material model ....................................................................................................73 5.2 Finite element modeling of IPC foam .................................................................75 5.2.1 Development of unit cell model ..............................................................75 5.2.2 FEA model description ...........................................................................77 5.2.3 Results .....................................................................................................80 5.2.4 Effect of boundary conditions .................................................................85 5.3 Finite element modeling of syntactic foam-filled honeycombs ..........................89 5.3.1 FEA model description ...........................................................................90 5.3.2 Results .....................................................................................................95 6. MICROMECHANICS BASED ELASTIC MODULUS PREDICTION ..................100 6.1 Micromechanics model for elastic modulus prediction ....................................101 6.1.1 Hashin-Shtrikman model ......................................................................101 6.1.2 Tuchinskii model ..................................................................................102 6.1.3 Ravichandran model .............................................................................103 6.2 Modulus prediction for syntactic foams ...........................................................105 6.3 Modulus prediction for IPC ..............................................................................108 6.4 Modulus prediction for syntactic foam-filled honeycomb ................................110 7. CONCLUSIONS........................................................................................................112 7.1 Conclusions .......................................................................................................112 7.2 Future work .......................................................................................................116 BIBLIOGRAPHY ............................................................................................................118
xi
APPENDICES .................................................................................................................122 A. EFFECT OF CELL STRUCTURE ON ELASTIC-PLASTIC RESPONSE OF FOAM-FILLED COMPOSITES ................................................................123 A.1 Introduction ...........................................................................................123 A.2 The approach: Voronoi tesselations ......................................................124 A.3 Irregularity parameter ...........................................................................125 A.4 FEA model description .........................................................................127 A.5 Effect of cell irregularity on stress-strain response of composites .......128 A.6 Effect of relative density on stress-strain response of composites .......130 B. MATLAB CODES............................................................................................132
xii
LIST OF FIGURES
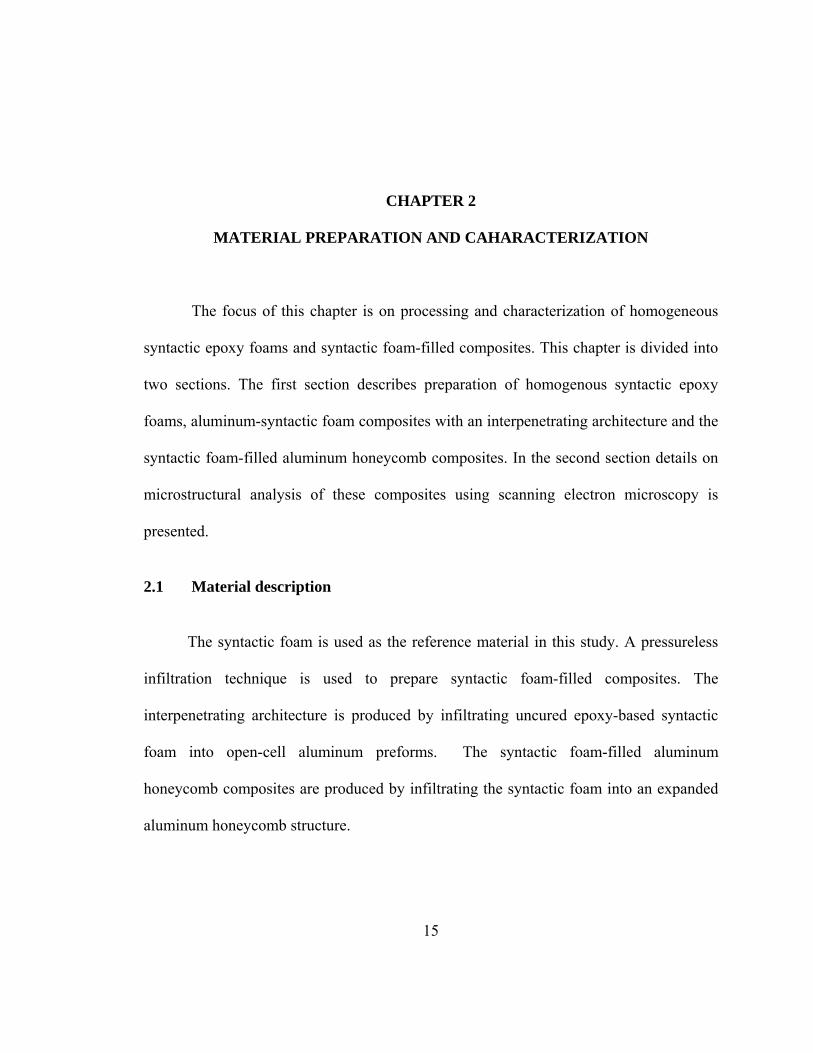
Figure 1.1: Stress-Stain curve for an elastic solid and foam made from the same solid [1] ..................................................................................................2 Figure 1.2: (a) aluminum honeycomb sandwich construction, (b) aluminum foam sandwich ........................................................................3 Figure 1.3: Examples of foam-filled cellular structures - (a) Interpenetrating aluminum-syntactic foam composite,(b) syntactic foam-filled aluminum honeycomb ....................................................................................4 Figure 1.4: (a) Interpenetrating phase composite, (b) Traditional composite ...................6 Figure 1.5: Schematic of a molecular scale IPN composite with two polymer chains .....7 Figure 2.1: Micrograph of microballoons .......................................................................17 Figure 2.2: Applications of foams [21] ...........................................................................18 Figure 2.3: Aluminum honeycomb cell structure ...........................................................19 Figure 2.4: Mold fabrication process ..............................................................................21 Figure 2.5: Preparation of syntactic foam .......................................................................22 Figure 2.6: Preparation of interpenetrating phase composite (IPC) ................................24 Figure 2.7: Preparation of syntactic foam-filled aluminum honeycomb composite .................................................................................26 Figure 2.8: Micrograph of epoxy syntactic foam with 30% Vf
of hollow glass microballoons ....................................................................27 Figure 2.9: (a) Cross-section of a lightweight IPC foam cylinder with open-cell Aluminum preform (9% relative density) infiltrated with epoxy-based syntactic foam. (b) Micrograph of the IPC foam showing the constituents. ....................................................................28
xiii
Figure 2.10: Syntactic foam-filled aluminum honeycomb composite ..............................28 Figure 3.1: Experimental setup for compression tests ....................................................31 Figure 3.2: Syntactic foam sample with coating of graphite powder .............................32 Figure 3.3: Stress-strain curves of syntactic foam with 20% volume fraction for two different aspect ratios .............................................................................33 Figure 3.4: Stress-strain curves of syntactic foam with 20% volume fraction for three Samples having L/D=0.74 ...........................................................................34 Figure 3.5: Stress-Strain curves of syntactic foam (SF) with different volume fraction (20, 30, and 40) of microballoons .................................................................35 Figure 3.6: SEM images of a deformed syntactic foam sample with 30% Vf of microballoons (a) at a strain of ~10%, (b) at a strain of ~60%, (c) higher magnification image showing fractured surface of microballoon Highlighted by dotted line in (b) (The sample is compressed in the vertical direction) ...............................................................................................37 Figure 3.7: Comparison of energy absorption (up to 50% strain) for syntactic foams samples: (a) per unit volume (b) per unit mass .............................................40 Figure 3.8: Stress-strain curves of syntactic foam with 20% volume fraction for different lubricants .......................................................................................41 Figure 3.9: Sequence of deformed configurations of SF-20 during compression experiments at a strain of: (a) 0%, (b) 4%, (c) 10%, (d) 24%, (e) 31%, (f) 43%, (g) 52 %, (h) 64% ................................................................................43 Figure 3.10: Deformed SF-20 sample ..............................................................................44 Figure 4.1: Compression response of IPC foam: (a) uncoated (b) silane coated. (Data for three specimens are shown for IPC-S20 case to show experimental repeatability.) ..............................................................................................47 Figure 4.2: SEM images of (a) silane coated IPC foam at a strain of 10%, (b) silane coated IPC foam at a strain of 58%, (c) uncoated IPC foam at a strain of 14%. (Compression is in the horizontal direction in (a) and in the vertical direction in (b) and (c). .................................................................................48 Figure 4.3: Compression response of unfilled Aluminum foam used in this work [21] .49
xiv
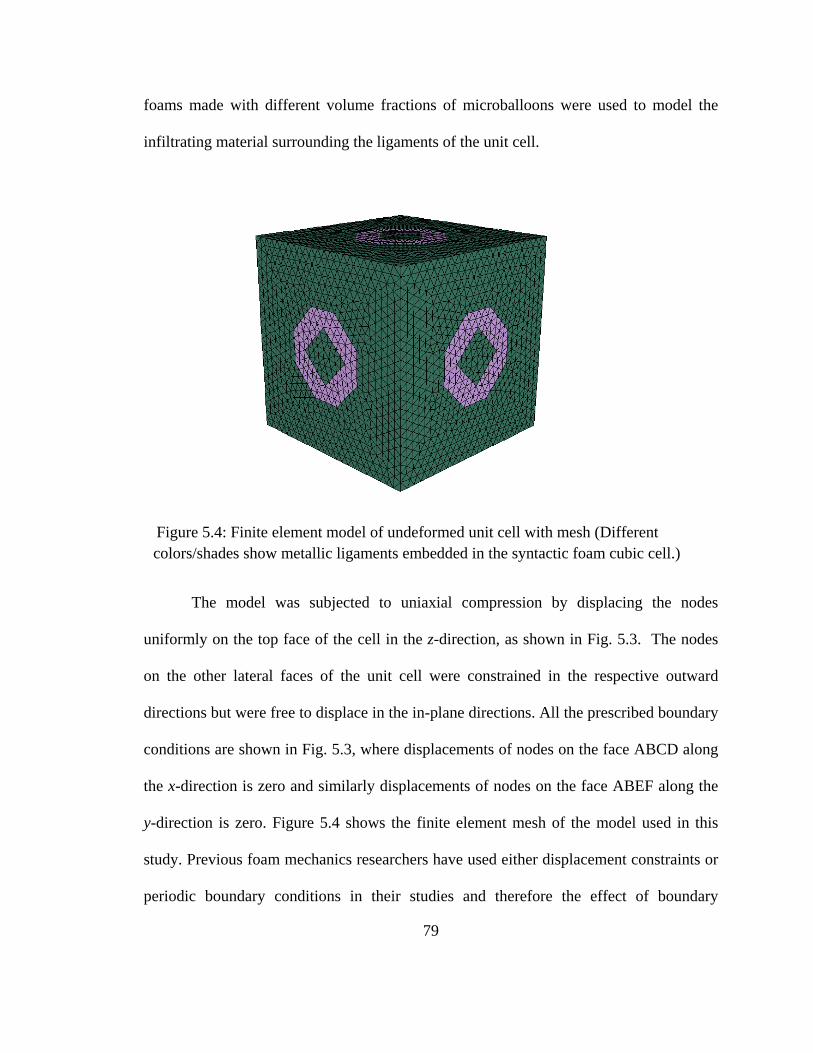
Figure 4.4: Comparison of stress-strain response of syntactic foam, IPC foam with uncoated preform and IPC foam with silane coated preform for (a) 20% volume fraction, (b) 30% volume fraction, (c) 40% volume fraction of microballoons ................................................................................................51 Figure 4.5: Comparison of energy absorption (up to 50% strain) for syntactic foams and IPC foam samples: (a) per unit volume (b) per unit mass ......................56 Figure 4.6: Compression response of syntactic foam-filled honeycomb composite. compression along (a) L-direction, (b) W-direction ....................................58 Figure 4.7: Deformation sequence for a SFH-30 sample at a applied strain of of (1):0%, (2):3.2%, (3):5.8%, (4):8.8%, (5):12.6%, (6):16%, (7):24.6%, (8):30.2%, (9):36%, (10):42% ..............................................................61 Figure 4.8: Compression response of SFH-20 with uncoated honeycomb preform and silane coated preform ............................................................................63 Figure 4.9: Comparison of stress-strain response of syntactic foam, Syntactic foam- filled honeycomb for (a) 20% volume fraction, (b) 30% volume fraction, (c) 40% volume fraction of microballoons ...................................................66 Figure 4.10: Comparison of energy absorption (up to 50% strain) for syntactic foams and Syntactic foam-filled honeycomb samples: (a) per unit volume (b) per unit mass ..........................................................69 Figure 4.11: Comparison of energy absorption (up to 50% strain) for syntactic foams, IPC foam and syntactic foam-filled honeycomb samples .............................70 Figure 5.1: Schematic of a unit cell model of Kelvin cell (Color rendition is for clarity only) ...............................................................76 Figure 5.2: Finite element model development: (a) Idealization of IPC foam structure using Kelvin cells (b) Unit cell model used to represent aluminum-syntactic foam IPC. .........................................................77 Figure 5.3: Finite element model of undeformed unit cell with boundary conditions used while simulating the uniaxial compression of IPC foam ......................78 Figure 5.4: Finite element model of undeformed unit cell with mesh (Different colors/shades show metallic ligaments embedded in the syntactic foam cubic cell.) ............................................................................79
Figure 5.5: Comparison of numerical and experimental results for IPC foam with (a) 20% volume fraction, (b) 30% volume fraction, (c) 40% volume fraction of microballoons .................................................82 Figure 5.6: Finite element results for unit cell model for IPC-S30 at 40% strain. (a) Deformed and undeformed unit cell with von-Mises stress contours (b) Deformed unit cell with equivalent plastic strain contours (c) Deformed unit cell with displacement contours in the u3 (uz) ...............84 Figure 5.7: Periodic finite element mesh on a pair of opposite faces ..............................87 Figure 5.8: Effect of boundary condition on stress-strain response of IPC .....................89 Figure 5.9: Geometry of honeycomb specimen used in analysis ....................................90 Figure 5.10: Loads and boundary conditions used during the analysis .............................93 Figure 5.11: (a) Finite element mesh of the model (b) enlarged view showing finite element mesh of the composite .....................................................................94 Figure 5.12: Sequence of deformation at applied strain of (1): 1.8%, (2):5.4%, (3): 8.2%, (4): 14.6%, (5):32.8%, (6)40% ....................................................96 Figure 5.13: Comparison of numerical and experimental results for Syntactic foam-filled honeycomb composites (a) 20% volume fraction, (b) 30% volume fraction, (c) 40% volume fraction of microballoons ..........98 Figure 6.1: Schematic representation of phase geometry for a Tuchinskii model [13] 103 Figure 6.2: Schematic representation of cell geometry for a Ravichandran model [13]104 Figure 6.3: Variation of measured young’s moduli with microballoon volume fraction .........................................................................................105 Figure 6.4: Comparison between predicted and measured values of elastic modulus for syntactic foams. (a) Hashin-Shtrikman and Ravichandran bounds, (b) Tuchiniskii bounds ................................................................................107
Figure A.1: (a) Set of random points, (b) Voronoi diagram for that set of points .........124
Figure A.3: Effect of cell irregularity on stress-strain response of the composite .........128
xv
xvi
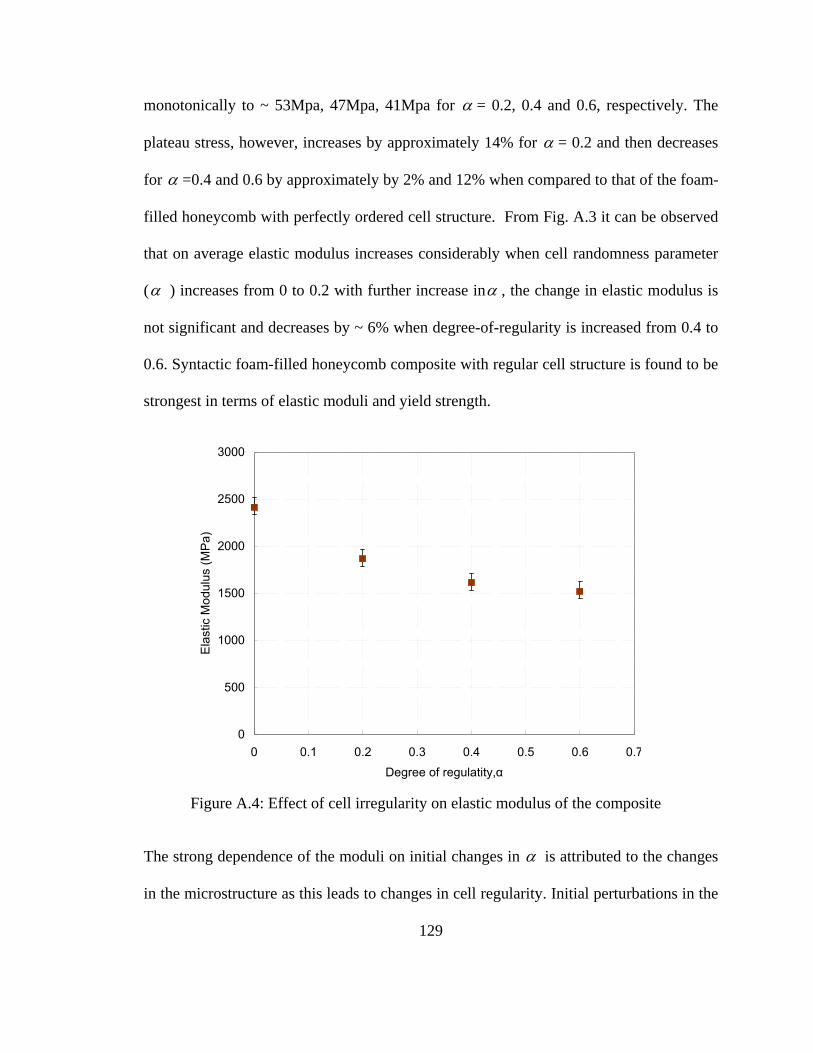
Figure A.4: Effect of cell irregularity on elastic modulus of the composite ..................129
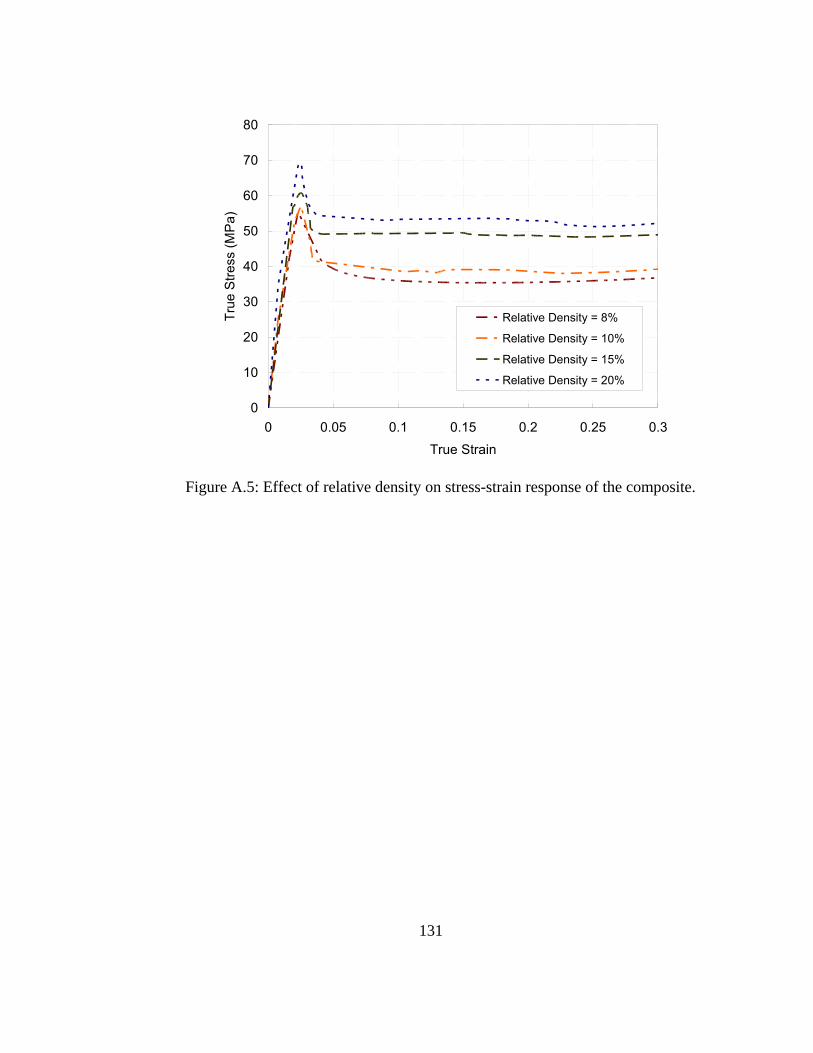
Figure A.5: Effect of relative density on stress-strain response of the composite .........131
xvii
LIST OF TABLES
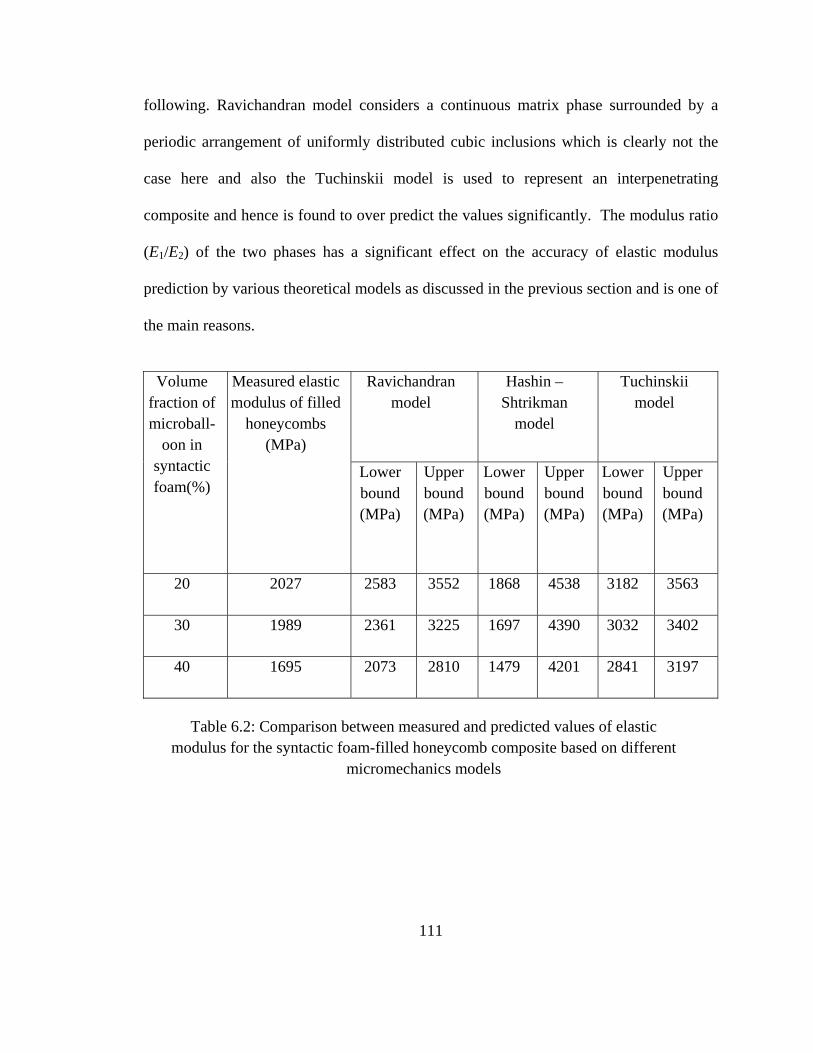
Table 2.1: Properties of constituents .............................................................................23 Table 3.1: Properties of syntactic foam .........................................................................36 Table 4.1: Properties of IPC Foam (20, 30, 40 designation denotes Vf of microballoons in the syntactic foam) ............................................................53 Table 4.2: Properties of syntactic foam-filled honeycomb composite (20, 30, 40 designation denotes Vf of microballoons in the syntactic foam.) .................62 Table 5.1: Comparison of finite element results with experiments (based on true stress- strain data) ..................................................................83 Table 6.1: Comparison between measured and predicted values of elastic modulus for the IPC foam based on different micromechanics models ...............................................................109 Table 6.2: Comparison between measured and predicted values of elastic modulus for the syntactic foam-filled honeycomb composite based on different micromechanics models ................................................111
1
CHAPTER 1
INTRODUCTION
1.1 Cellular solids: An overview
Cellular materials are drawing a great deal of attention in view of their attractive
engineering properties. They are lightweight and stiff and have very good energy-
absorbing characteristics making them excellent candidates for structural applications.
They also have attractive thermal characteristics (often used to cool electronic equipment
and as heat exchangers in engines). A typical cellular solid is made up of an
interconnected network of solid struts which form the edges of cells in case of two-
dimensional honeycomb structures and faces of cells in case of three-dimensional foams.
The cell geometry is the one that characterizes the overall mechanical behavior of cellular
material. Such materials are common in nature; wood, cancellous bone and coral are a
few examples. Honeycomb-like materials, made up of parallel, prismatic cells, are used
for lightweight aerospace structural components. Polymer and glass foams have low
thermal conductivity and hence have been used as insulating material in applications
ranging from disposable coffee cups to material for booster rocket of the space shuttle.
Cellular solids have also been effectively used as packaging materials to absorb shock.
2
The cellular structure of these materials enables them to undergo large compressive
strains while holding the peak force to a minimum when compared with a monolithic
solid from which it is made. The energy in these materials is dissipated primarily through
cell wall bending, buckling and collapse but the stress is generally limited by an extended
plateau region of the stress-strain curve as seen in Fig1.1.
By choosing the right cell wall material and relative density, the foam can be
tailored to give an optimum combination of properties for a given packaging application.
Foams and honeycombs are also commonly used as core materials in sandwich
construction. The purpose of a core in a composite laminate is to increase the flexural
stiffness of a structure by effectively 'thickening' it with a low-density core material. In
fig.1.2 an example of a lightweight and high strength sandwich construction using
aluminum honeycomb and foam as core material is shown. The partially torn off face
sheet in Fig.1.2(b) reveals the bonding between foam and sheet in Fig.1.2(a). The use of
Figure 1.1: Stress-Stain curve for an elastic solid and foam made from the same solid [1]
3
foams as core material can provide a dramatic increase in stiffness for very little
additional weight. Recent advances in material processing methods to mold complex
geometries allow greater design flexibility of structural parts. Foamed polystyrene and
polyvinyl chloride are extensively used for floating structures and as flotation devices in
boats. Aluminum foam is also extensively used in automotive, aerospace, marine,
railway, civil engineering and medical industries due to high stiffness-to-weight ratio,
vibration damping capacity and non-inflammability characteristics. Foam-filled columns
or sandwich panels have replaced conventional dense metal used in rotating printing rolls
and in rapidly moving platforms in order to reduce their inertia and damp out vibrations.
All these uses exploit the special combination of properties offered by cellular solids,
properties which are ultimately a derivative of their cellular structure [1].
Figure 2.9: (a) Cross-section of a lightweight IPC foam cylinder with open-cell aluminum preform (9% relative density) infiltrated with epoxy-based syntactic foam. (b) Micrograph of the IPC foam showing the constituents.
The photographed image of a machined syntactic foam-filled aluminum honeycomb
composite containing 30% volume fraction of microballoons is shown in the Fig. 2.10.
The microstructure shows good bonding between the aluminum honeycomb network and
the syntactic foam phases also there are no visible cracks on the surface.
30
CHAPTER 3
COMPRESSION CHARACTERISTICS OF SYNTACTIC FOAM
The energy absorption characteristics of epoxy-based syntactic foams are
presented in this chapter. The effect of volume fraction of microballoons on the stress-
strain response of syntactic foams is also discussed. Compression tests were carried out
on syntactic foam samples with 20%, 30% and 40% volume fraction of microballoons.
The effect of specimen aspect ratio and lubrication of platen/specimen interface on the
stress-strain response of foams is also noted.
3.1 Experimental setup
A series of compression tests were carried out on syntactic foam and syntactic
foam-filled composite specimens at room temperature using a MTS universal testing
machine. The photograph of the set up is shown in Fig.3.1. The testing machine was
fitted with a 100 kN load cell. The tests were performed according to ASTM standard
D-695 for plastics. The specimen to be tested was placed between the two compression
platens of the testing machine. The top platen was moved at a constant rate as determined
by the prescribed crosshead speed during tests and the bottom platen was fixed. A cross-
head speed of 1.25 mm/min was used during the tests. Dry graphite powder was used as
the lubricant between the two platens and the specimen surfaces to minimize friction.
31
A photograph of syntactic foam sample with a coating of dry graphite powder on its
surface is shown in Fig 3.2.
Movable Platen
Fixed Platen
Figure 3.1: Experimental setup for compression tests
32
3.2 Effect of specimen aspect ratio
The aspect ratio of the sample could influence the material response in
compression tests. A large aspect ratio (say, > 2) has the draw back of susceptibility to
bending and buckling deformation modes. On the other hand, a low aspect ratio (< 0.5)
could affect the measured response due to a combination of specimen edge effects and
frictional effects. In light of this, uniaxial compression tests were performed on syntactic
foam samples of two different specimen length (L) to diameter (D) ratios – 0.74 and 0.85.
(The aspect ratio was altered by changing the length of the specimen while keeping the
specimen diameter unchanged.)
The measured engineering stress-strain responses for syntactic foam specimens
with 20% microballoon volume fraction and the two aspect ratios are shown in Fig. 3.3. It
is interesting to note that unlike conventional cellular structures and honeycombs, macro
scale stress-strain responses for syntactic foams tend to be rather smooth due to
microscopic porosity. The two curves overlap on each other and are in close agreement.
The values of elastic modulus in each case is 1594 ± 50 MPa and yield stress is 55.7 ± 2
Figure 3.2: Syntactic foam sample with coating of graphite powder
33
MPa. The results being nearly the same for both the cases, the effect of the two L/D ratios
is insignificant and hence in all subsequent tests a L/D ratio of 0.74 was used. A similar
observation has been made by Song, et al., [26] who note that increasing the L/D ratio to
2 resulted in a lower compressive strength of the syntactic epoxy foams by ~4.5%. They
attributed this reduction to size-dependent defect distribution in their specimens. For this
reason L/D <1 was used during this study. A detailed study of the effect of aspect ratio on
the failure behavior and compressive properties of syntactic foam has also been reported
by Gupta, et al., [27].
Next, the repeatability of compressive stress-strain responses of syntactic foam
samples was studied. In Fig. 3.4, engineering stress-strain curves for three different
0
20
40
60
80
100
120
140
160
0 0.1 0.2 0.3 0.4 0.5 0.6 0.7Strain
Stre
ss(M
Pa)
L/D = 0.85
L/D = 0.74
Figure 3.3: Stress-strain curves of syntactic foam with 20% volume fraction for two different aspect ratios
34
samples having aspect ratio (L/D) of 0.74 made from 20% volume fraction of
microballoons in epoxy resin is shown. The stress-strain responses essentially follow
each other and very good repeatability is evident from the figure.
3.3 Effect of volume fraction of microballoons
The influence of volume fraction (Vf) of microballoons on stress-strain response
of syntactic foam was also studied. A few representative stress-strain responses for three
Vf - 20%, 30% and 40% - are shown in Fig. 3.5. In these curves a linear elastic response
is seen initially. The compressive stress decreases with increasing strain as evident from
the softening response following yield stress. This is followed by a plateau of nearly
constant stress where progressive crushing of microballoons occurs. Further increase in
0
20
40
60
80
100
120
140
160
180
0 0.1 0.2 0.3 0.4 0.5 0.6 0.7Strain
Stre
ss (M
Pa)
Sample-1Sample-2Sample-3
Figure 3.4: Stress-strain curves of syntactic foam with 20% volume fraction for three samples having L/D =0.74
35
load results in densification seen as the region of monotonically rising stress, consistent
with the observations reported in the previous works [26-28] on syntactic foams. These
responses are similar to the compression response of structural foams in general.
An increase in the volume fraction of microballoons resulted in a reduction of
elastic modulus as well as the compressive strength (see, Table 3.1). The elastic modulus
and compressive strength decreased from 1595 MPa and 55.7 MPa, respectively for 20%
volume fraction case to 1260 MPa and 36.7 MPa for 40% volume fraction case. The
foam samples SF-20 (designation implies syntactic foam with 20% Vf of microballoons),
SF-30 (Vf = 30%) and SF-40 (Vf = 40%) show a linear elastic response up to strains of
approximately 0.028, 0.031, 0.039, respectively.
0
20
40
60
80
100
120
140
160
180
0 0.1 0.2 0.3 0.4 0.5 0.6 0.7 0.8Strain
Stre
ss (M
Pa)
SF-20SF-30SF-40
Figure 3.5: Stress-Strain curves of syntactic foam (SF) with different volume fraction (20, 30, and 40) of microballoons.
36
The plateau stress values in the three cases are 42 MPa, 33 MPa and 27 MPa for SF-20,
SF-30 and SF-40, respectively. That is, the plateau stress decreases with increasing
volume fraction of microballons and is consistent with the trends reported by Kim, et al.,
[28]. The onset of densification for the three cases is in the strain range of 0.3-0.5 with
the lower value corresponding to the lower volume fraction of microballoons. Beyond
this strain, stress increases with increasing strain. All specimens showed formation of
inclined cracks at advanced stages of deformation suggesting shear localization. This is
consistent with previously published results [27, 29] for syntactic foams.
In order to explain the failure behavior of syntactic foams, deformed specimens
were sectioned and microscopically examined at a few select strain levels. Figure 3.6
shows SEM images of a syntactic foam sample (with 30% volume fraction of
microballoons). In these, the direction of compression is along the vertical axis. In Fig.
3.6(a) and (b) micrographs of deformed specimens at 10% and 60% strain are shown. In
Fig. 3.6(c) an enlarged view of an isolated crushed microballoon, highlighted in Fig.
Foam designation
Volume fraction of microballoons
(%)
Density
(kg/m3)
Compressive strength
(MPa)
Elastic modulus
(MPa)
SF-20 20 931 ±4 55.7 ±2.2 1594.7 ±35
SF-30 30 821 ±6 46.3 ±1.4 1447.6 ±28
SF-40 40 701 ±4 36.7 ±1.8 1260.5 ±42
Table 3.1: Properties of Syntactic foam
37
3.6(b), is shown. It can be clearly seen from the images that the initial softening response
is due to the onset of crushing of microballoons. A good interfacial bonding between
microballoons and matrix has produced clearly visible fragments of crushed microballoon
adhering to the surrounding matrix.
Figure 3.6: SEM images of a deformed syntactic foam sample with 30% Vf ofmicroballoons (a) at a strain of ~10%, (b) at a strain of ~60%, (c) higher magnificationimage showing fractured surface of microballoon highlighted by dotted line in (b). (Thesample is compressed in the vertical direction)
(c
)
(a) (b)
Shards of glass
(c)
38
This suggests that interfacial debonding between microballoons and matrix is not a major
contributor in the observed global material response shown in Fig. 3.5. A bias in the
direction of fractured microballoons at lower levels of deformation can be seen in Fig.
3.6(a). With further deformation of the sample, microballoons fracture completely,
leading to densification response seen in stress-strain curves. Failure of microballoons
along inclined planes (relative to the loading direction) also indicates shear localization.
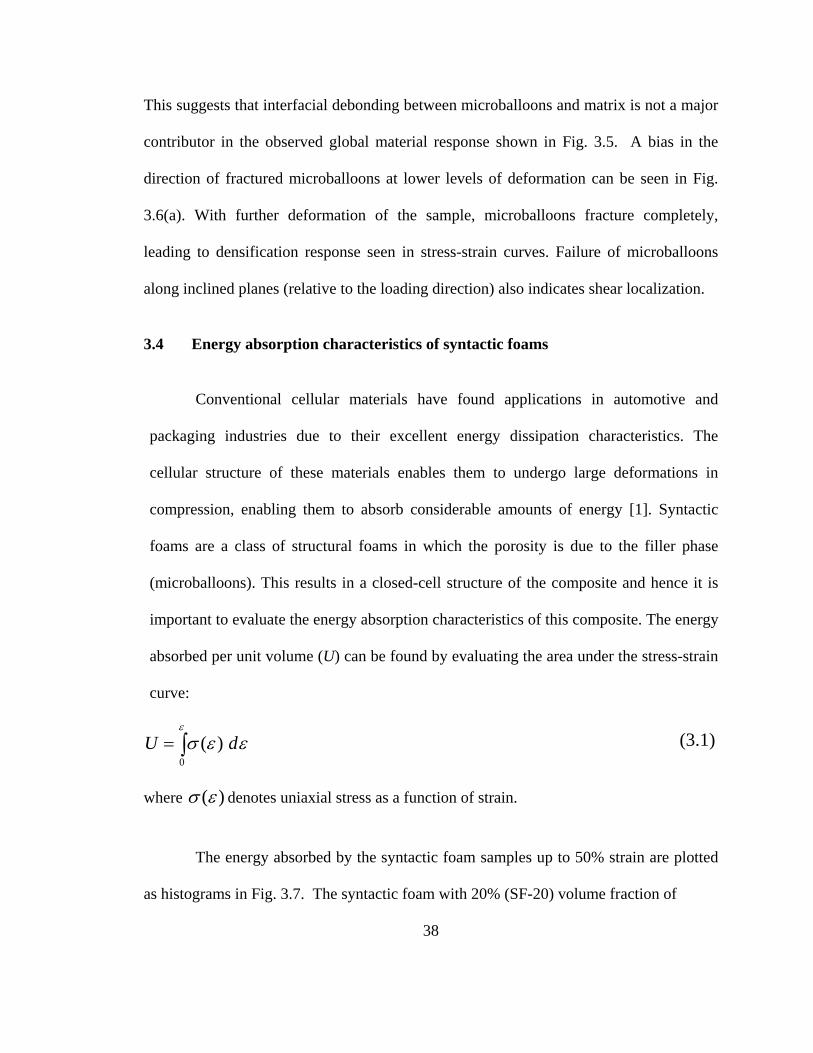
3.4 Energy absorption characteristics of syntactic foams
Conventional cellular materials have found applications in automotive and
packaging industries due to their excellent energy dissipation characteristics. The
cellular structure of these materials enables them to undergo large deformations in
compression, enabling them to absorb considerable amounts of energy [1]. Syntactic
foams are a class of structural foams in which the porosity is due to the filler phase
(microballoons). This results in a closed-cell structure of the composite and hence it is
important to evaluate the energy absorption characteristics of this composite. The energy
absorbed per unit volume (U) can be found by evaluating the area under the stress-strain
curve:
0( ) U d
ε
σ ε ε= ∫
where ( )σ ε denotes uniaxial stress as a function of strain.
The energy absorbed by the syntactic foam samples up to 50% strain are plotted
as histograms in Fig. 3.7. The syntactic foam with 20% (SF-20) volume fraction of
(3.1)
39
microballoons is found to have the highest value of energy absorption when compared to
30% (SF-30) and 40% (SF-40) cases, in that order. The energy absorbed per unit volume
increases by 61% for the syntactic foam with 20% volume fraction of microballoons
when compared to the corresponding syntactic foam sample with 40% volume fraction
of microballoons. This also shows that with increasing volume fraction of microballoons
in syntactic foam, there is a steep increase in the value of energy absorbed per unit
volume. The energy absorbed per unit mass is also plotted in Fig. 3.7(b). From the plots it
can be seen that with increasing volume fraction of microballoons there is a relatively
smaller decrease in this value and is nearly constant for all the volume fractions, varying
between 0.026-0.022 MJ/kg.
40
Figure 3.7: Comparison of energy absorption (up to 50% strain) for syntactic foams samples: (a) per unit volume (b) per unit mass.
0
0.005
0.01
0.015
0.02
0.025
0.03
20% 30% 40%
Volume Fraction of Microballoon in Syntactic foam
Ene
rgy
abso
rbed
per
uni
t mas
s (M
J/K
g)
0
5
10
15
20
25
30
20% 30% 40%
Volume Fraction of Microballoon in Syntactic foam
Ene
rgy
abso
rbed
per
uni
t Vol
ume
(MJ/
m^3
)
(a)
(b)
41
3.5 Effect of lubricant on the stress-strain response of syntactic foam
Dry graphite powder was used as lubricant for most part of this study. Some
experiments were also carried out by using grease as a lubricant. The stress-strain
response of syntactic foam with 20% volume fraction of microballoons obtained using
grease and powdered graphite as lubricant are plotted in Fig.3.8 . Figure 3.9 shows a
sequence of photographs for a syntactic foam sample with 20% volume fraction of
microballoons using grease as the lubricant between the platens and specimen surfaces.
Figure 3.8: Stress-strain curves of syntactic foam with 20% volume fraction for different lubricants
0
20
40
60
80
100
120
140
160
180
0 0.1 0.2 0.3 0.4 0.5 0.6 0.7Strain
Stre
ss(M
Pa)
Grease
GraphitePowder
42
(a) (b) (c)
(d) (e)
20 mm
43
Figure 3.9: Sequence of deformed configurations of SF-20 during compression experiments at a strain of: (a) 0%, (b) 4%, (c) 10%, (d) 24%, (e) 31%, (f) 43%, (g) 52 %, (h) 64%
(f) (g)
(h)
44
From Fig.3.8 it can be clearly seen that the overall response of the syntactic foam
sample is the same for both the cases. However, with the use of graphite powder as a
lubricant a slight barreling at the edges of the sample was seen. A deformed sample from
this experiment is shown in Fig. 3.10. Dark material on the upper (and lower) circular
faces are due to graphite solid lubricant powder. From Figs 3.9(h) and 3.10 it can be seen
that failure in all these specimens involved the formation of inclined cracks at ~45o to the
loading direction suggesting shear type of failure.
Figure 3.10: Deformed SF-20 sample
45
CHAPTER 4
COMPRESSION CHARACTERISTICS OF
SYNTACTIC FOAM-FILLED COMPOSITES
In this chapter, the compression response and energy absorption characteristics of
syntactic foam-filled composites are described. The first part of this chapter presents
experimental results for syntactic foam-based interpenetrating phase composites (IPC). In
the second part experimental results for epoxy syntactic foam-filled aluminum
honeycombs are discussed. The samples are tested in uniaxial compression and failure
responses are examined relative to those for conventional syntactic foams with
corresponding volume fraction of microballoons. Also, possible explanations for the
differences are provided with the aid of microstructural analysis.
Two variants of foam-filled composites are produced. In the first case an open-
cell aluminum preform or an aluminum honeycomb is used in ‘as-received’ condition. In
the second case, the preform or the honeycomb is treated with silane to enhance the
adhesion between the polymer foam and metal ligaments. The effect of silane coating on
the overall response of the foam-filled composites is also examined.
46
4.1 Compression characteristics of IPC foam
Figure 4.1 shows typical stress-strain curves for different IPC foam samples.
These plots correspond to samples made of aluminum preforms infiltrated with syntactic
foam containing 20%, 30% and 40% volume fractions of microballoons. Figure 4.1(a)
shows responses for IPC foam samples when the aluminum preform was used in
uncoated condition whereas plots in Fig. 4.1(b) are for IPC foam counterparts with silane
treated preforms. In Fig. 4.1(b) three results for one particular type of IPC foam (20%
syntactic foam with silane treated preform) are shown to demonstrate a high degree of
repeatability of these tests.
The overall compression response of IPC foams has similarities with the ones
obtained for pure syntactic foam specimens (described in the previous chapter). These
plots (Fig. 4.1) also show three distinct regions, typical of foam behavior. Initially there is
a linear elastic response. The stress plateau region following the onset of nonlinearity is
characterized by progressive bending of aluminum ligaments of the IPC foam. This in
turn results in crushing of microballoons present in between the metallic ligaments.The
SEM images of silane coated IPC foam (with 30% volume fraction of microballoons and
sample compressed in the horizontal direction) shown in Fig. 4.2 supports this
observation. With further increase in load, the stress increases more rapidly (compared to
pure syntactic foam counterparts). This can be explained by the micrograph in Fig. 4.2(b)
(compression is along the vertical direction) where compaction of crushed microballoons
and deformation of aluminum preform is clearly evident.
47
0
20
40
60
80
100
120
140
160
180
0 0.1 0.2 0.3 0.4 0.5 0.6 0.7Strain
Stre
ss (M
pa)
IPC-S20 -1IPC-S20 -2IPC-S20 -3IPC-S30IPC-S40
(b)
Figure 4.1: Compression response of IPC foam: (a) uncoated (b) silane coated. (Data for three specimens are shown for IPC-S20 case to show experimental repeatability.)
0
20
40
60
80
100
120
140
160
0 0.1 0.2 0.3 0.4 0.5 0.6 0.7
Strain
Stre
ss (M
pa)
IPC-20IPC-30IPC-40
(a)
48
Figure 4.2: SEM images of (a) silane coated IPC foam at a strain of 10%, (b) silane coated IPC foam at a strain of 58%, (c) uncoated IPC foam at a strain of 14%. (Compression is in the horizontal direction in (a) and in the vertical direction in (b) and (c).
(a)
(b)
(c)
49
The behavior is dependent on many factors with the density (dependent on the volume
fraction of the microballoons in the current IPC foam) of the composite being the most
important. The SEM image in Fig. 4.2(c) is that of uncoated IPC foam compressed to
about 14% strain. It clearly reveals the effect of weaker adhesion between the metal and
polymer phases as evident from an isolated debond highlighted in the micrograph. Such
debonds are generally absent even at relatively high strain levels when silane coated
preform is used (see Fig. 4.2(b)).
4.1.1 Effect of volume fraction of microballoons
For comparison, the compression response of an unfilled aluminum preform [21]
is shown in Fig. 4.3. It has an elastic modulus of ~93 MPa (Young’s modulus of bulk
aluminum is 70 GPa) and a plateau stress of ~2.5 MPa without any noticeable softening
at the onset of cell collapse .
0
5
10
15
20
25
30
35
40
45
0 0.2 0.4 0.6 0.8 1
Strain
Stre
ss (M
Pa)
Figure 4.3:Compression response of unfilled aluminum foam used in this work [21]
50
This is unlike the response of syntactic foam samples (see, Fig. 3.4) which have a
noticeable softening at the onset of nonlinearity.
When responses of pure syntactic and IPC foams with the same volume fraction
of microballoons (Fig.4.4) are compared, IPC foams show an increase in the plateau
stress by as much as 15-20 MPa (depending upon the volume fraction of the
microballoons in the infiltrated syntactic foam), much higher than that expected from the
aluminum preform. Synergistic mechanical constraint between the aluminum ligaments
of the preform and pockets of infused syntactic foam are responsible for this favorable
response. That is, aluminum ligaments are laterally supported by the syntactic foam
pockets preventing them from premature bending/buckling as in an unfilled preform. On
the flip side, pockets of syntactic foam are reinforced by the metallic ligaments against an
early collapse of microballoons.
0
20
40
60
80
100
120
140
160
0 0.1 0.2 0.3 0.4 0.5 0.6 0.7
Strain
Stre
ss(M
Pa)
SF-20IPC-20IPC-S20
(a)
51
0
20
40
60
80
100
120
140
160
0 0.1 0.2 0.3 0.4 0.5 0.6 0.7 0.8Strain
Stre
ss (M
Pa)
SF-40IPC-40IPC-S40
(c)
Figure 4.4: Comparison of stress-strain response of syntactic foam, IPC foam with uncoated preform and IPC foam with silane coated preform for (a) 20% volume fraction, (b) 30% volume fraction, (c) 40% volume fraction of microballoons
0
20
40
60
80
100
120
140
160
180
0 0.1 0.2 0.3 0.4 0.5 0.6 0.7 0.8Strain
Stre
ss(M
Pa)
SF-30
IPC-30
IPC-S30
(b)
52
Another interesting comparison between the responses of IPC foam with silane coated
and uncoated aluminum ligaments can be made from Figs. 4.4(a), (b) and (c). The
characteristics such as yield stress, plateau stress and compaction response all seem to
favor silane coated IPC foam over uncoated IPC foam and the pure syntactic foam, in that
order. This is largely attributed to the reduction of microscopic debonds between
aluminum ligaments and syntactic foam as deformation progresses in case of coated IPC
foam.
The elastic modulus of the composite was determined using the initial linear
portion of the measured stress-strain curves. The elastic modulus and the upper yield
stress for IPC foam made from uncoated and coated aluminum preforms are quantified in
Table 4.1 and are found to monotonically decrease with increasing volume fraction of
microballons in the syntactic foam. This behavior is consistent with the corresponding
values of pure syntactic foam (see, Table 3.1). From Table 4.1 it can also be noted that
the elastic modulus and yield stress of IPC foam with silane coating is higher when
compared to the corresponding uncoated preform for all volume fractions of
microballoons in syntactic foam. As noted earlier, the increase in elastic modulus and
compressive strength of silane coated preform can be attributed to improved wettability,
which in turn enhances adhesion between the metal and polymer phases. The IPC foam
is also found to have improved the mechanical properties when compared with those for
the respective syntactic foams.
In Figs. 4.4(a)-(c), data for syntactic foam and the corresponding IPC foam
samples with uncoated and silane coated preforms is examined comparatively for 20%,
53
Table 4.1: Properties of IPC Foam (20, 30, 40 designation denotes Vf of microballoons in the syntactic foam)
30% and 40% volume fraction of microballoons. There is a substantial increase in all the
relevant characteristics of IPC foam samples when compared to that for pure syntactic
foam samples. The increase in the elastic modulus for IPC foam with silane coated
preform was found to be about 33%, 28%, 35% for the composites IPC-S20, IPC-S30,
IPC-S40, respectively, when compared to the corresponding pure syntactic foam. (The
corresponding increases are nearly constant after factoring into account experimental
scatter in the data.) The relative increase in the compressive strengths for the three
composites were 21.2%, 19.7%, 24.8%, respectively, relative to the corresponding
syntactic foam samples.
IPC foam with uncoated preform IPC foam with silane coated preform
IPC designation
Density
(kg/m3)
Compressive Strength
(MPa)
Elastic Modulus
(MPa)
IPC designation
Density
(kg/m3)
Compressive Strength
(MPa)
Elastic Modulus
(MPa)
IPC-20 1008
±12
59.9 ±
2.5
1821
± 17
IPC-S20 1036
±13
67.5 ±
2.3
2123
± 32
IPC-30 937
± 8
50.5 ±
1.8
1573
± 12
IPC-S30 954
± 12
55.4 ±
3.6
1852
± 27
IPC-40 861
±12
41.5 ±
2.6
1442
± 28
IPC-S40 879
± 18
45.8 ±
1.9
1702
± 26
54
From Fig. 4.4 it can also be seen that treating the preforms with silane results in an
increase in plateau stress for the same three IPC foams when compared to the
corresponding uncoated versions IPC-20, IPC-30 and IPC-40, respectively. Also the
percentage increase is a maximum for IPC-S20 which is approximately 14% and it
decreases with increasing volume fraction of microballoons to a value of about 8% for
IPC-S40. That is, there is diminishing return in terms of compression characteristics due
to silane treatment as volume fraction of microballoons increase In the composite.
4.1.2 Energy absorption characteristics of IPC
Conventional cellular materials have found applications in automotive and
packaging industries due to their superior energy dissipation characteristics. The cellular
structure of these materials enables them to undergo large deformations in compression,
enabling them to absorb considerable amounts of energy [1]. The energy absorbed per
unit volume (U) can be found by evaluating the area under the stress-strain curve
0( ) U d
ε
σ ε ε= ∫ (4.1)
where ( )σ ε denotes uniaxial stress as a function of strain.
The energy absorbed up to 50% strain is plotted as histograms in Fig. 4.5. The
syntactic foam with 20% (SF-20) volume fraction of microballoons is found to have the
highest value of energy absorption when compared to 30% (SF-30) and 40% (SF-40)
cases, in that order. Similar trend can also be seen for IPC foams with silane coated and
uncoated aluminum preforms. Approximately 50% increase in the absorbed energy per
55
unit volume of silane coated IPC foam samples relative to the conventional syntactic
foams is evident from Fig. 4.5(a). Specifically, 48%, 53% and 49% increase in the
absorbed energy per unit volume for IPC-S20, IPC-S30 and IPC-S40 relative to the
conventional syntactic foam samples SF-20, SF-30 and SF-40, respectively, is indicative
of the potential of IPC foams for energy dissipation applications. On the other hand, for
IPC foam samples with an uncoated preform, the absorbed energy was modestly lower
and was found to be 31%, 37%, 40% for IPC-20, IPC-30 and IPC-40 relative to SF-20,
SF-30, and SF-40, respectively. The presence of aluminum preform increases the overall
weight of the composite and hence specific energy absorption (energy absorbed per unit
mass) was also calculated. From Fig. 4.5(b), the increase in the value of energy
absorption per unit mass for IPC-S20 is found to be about 33% when compared to the
corresponding syntactic foam case (SF-20). This value decreases to about 28% and 23%
for IPC-S30 and IPC-S40 when compared to syntactic foam cases SF-30 and SF-40,
respectively. This also shows that with increasing volume fraction of microballoons in
syntactic foam, the percentage increase in the value of specific energy absorption
reduces.
From the stress-strain plots shown in Fig. 4.4 for various volume fractions of
microballoons in syntactic foam, it can be seen that coating the aluminum preform with
silane results in improved compression characteristics of the IPC foam resulting in higher
values of compressive strength and elastic modulus relative to the uncoated IPC foam.
There is also an increase in energy absorption per unit mass of IPC foam with silane
coated aluminum preform when compared to the uncoated preform.
56
Figure 4.5: Comparison of energy absorption (up to 50% strain) for syntactic foams and IPC foam samples: (a) per unit volume (b) per unit mass.
0
5
1 0
1 5
2 0
2 5
3 0
3 5
4 0
2 0 % 3 0 % 4 0 %
V o lum e F ra c t io n o f M ic ro ba llo o ns in S y n ta c t ic fo a m
Ener
gy a
bsor
bed
per u
nit v
olum
e (M
J/ m
^3)
S y n ta c t ic F o a m
U nc o a te d IP C
S ila ne C o a te d IP C
(a)
0
0 . 0 0 5
0 . 0 1
0 . 0 1 5
0 . 0 2
0 . 0 2 5
0 . 0 3
0 . 0 3 5
0 . 0 4
2 0 % 3 0 % 4 0 %
V o lu m e F r a c t i o n o f M i c r o b a llo o n i n S y n t a c t i c f o a m
Ene
rgy
abso
rbed
per
uni
t mas
s (M
J/K
g)
S y n t a c t i c F o a mU n c o a t e d I P CS i la n e C o a t e d I P C
(b)
57
4.2 Compression characteristics of syntactic foam-filled honeycombs
Many commercial honeycombs are made by expanding strip-glued sheets. As a
result each cell has two cell walls of double wall thickness (Fig.2.3). The doubling of this
pair of cell walls results in the anisotropic mechanical response of honeycomb. That is,
the overall response differs based on whether it is loaded in the L (longitudinal) or W
(width) direction.
4.2.1 Effect of volume fraction of microballoons
The compression response of the foam-filled honeycomb composite containing 20%,
30% and 40% volume fractions of microballoons is shown in Fig. 4.6. In Figs. 4.6(a) and
(b) the stress-strain responses when compressed in the L and W directions, respectively,
are shown. From these plots, it can be seen that the compression responses of these two
are similar to that of IPC foams in terms of the presence of three distinct regions. The
linear elastic region is followed by a plateau of nearly constant stress and a densification
region of steeply rising stress. Each region is associated with a different mechanism of
deformation identified by photographing the foam-filled honeycomb composites during
loading. The compressive behavior can be explained with the help of Fig. 4.7 where the
sequence of specimen deformation for the case of syntactic foam with 30% volume
fraction of microballoons is shown. Upon loading, following an elastic region, the cell
walls of the aluminum honeycomb network undergo bending which in turn leads to the
onset of crushing of microballoons present in that cell. With further increase in load the
deformation starts to localize in a narrow zone of cells near the centre of the specimen.
58
Figure 4.6: Compression response of syntactic foam-filled honeycomb composite. compression along (a) L-direction, (b) W-direction
0
20
40
60
80
100
120
140
0 0.1 0.2 0.3 0.4 0.5 0.6 0.7
Strain
Stre
ss(M
Pa)
SFH-20
SFH-30
SFH-40
0
20
40
60
80
100
120
140
0 0.1 0.2 0.3 0.4 0.5 0.6 0.7Strain
Stre
ss(M
Pa)
SFH-20
SFH-30
SFH-40
(a)
(b)
59
In this regime, individual cells undergo deformation in a shear dominant mode. At this
stage the sample deforms at a relatively constant stress as strain increases resulting in a
stress plateau region characterized by progressive collapse of cells. The deformation then
spreads from the centre outwards towards the free edges of the specimen. Once this
pattern develops, crushing spreads from the collapsed zone to the neighboring cells which
leads to a complete collapse of the cells at a relatively faster rate. Upon completion of
cell collapse, densification begins as seen by the region with a steeply rising stress.
From Figs. 4.6(a) and (b) it can be seen that an increase in volume fraction of
microballoon leads to a decrease in yield strength, elastic modulus and plateau stress. The
onset of densification occurs at much lower strain values when the volume fraction of
microballoons in the syntactic foam is low. These trends are consistent with that
observed in case of syntactic foam and IPC foam samples. Also, these results show that
the elastic response of syntactic foam-filled honeycomb composite is nearly identical in
the two directions. (This is unlike the orthotropic response of unfilled honeycombs in the
L- and W - directions, as reported in [30].) Elastic modulus and plateau stress for foam-
filled honeycomb composite compressed along L and W directions is reported in Table
4.2. The elastic modulus of the composite is found to decrease from 2027 MPa for the
sample with 20% volume fraction of microballoons to 1695 MPa for the one with 40%
volume fraction of microballoons.
60
1 2
3 4
5 6
61
Figure 4.7: Deformation sequence for a SFH-30 sample at a applied strain of (1):0%, (2):3.2%, (3):5.8%, (4):8.8%, (5):12.6%, (6):16%, (7):24.6%, (8):30.2%, (9):36%, (10):42%
7
8
9
10
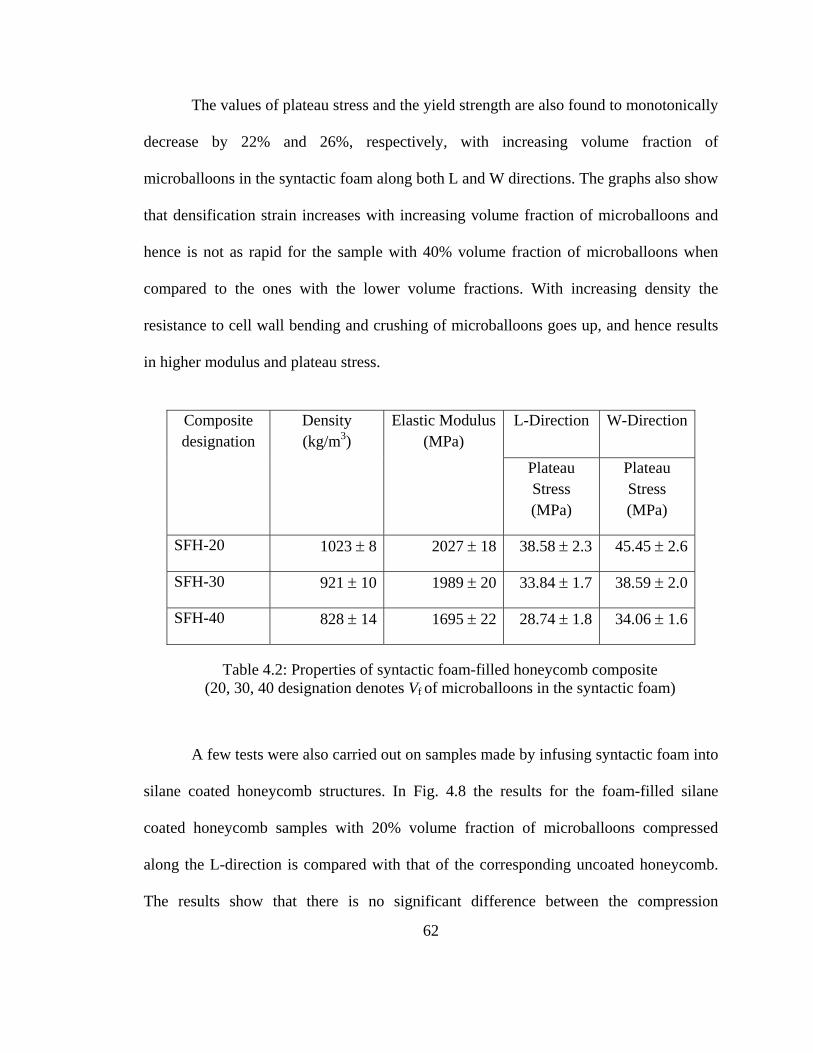
62
The values of plateau stress and the yield strength are also found to monotonically
decrease by 22% and 26%, respectively, with increasing volume fraction of
microballoons in the syntactic foam along both L and W directions. The graphs also show
that densification strain increases with increasing volume fraction of microballoons and
hence is not as rapid for the sample with 40% volume fraction of microballoons when
compared to the ones with the lower volume fractions. With increasing density the
resistance to cell wall bending and crushing of microballoons goes up, and hence results
in higher modulus and plateau stress.
A few tests were also carried out on samples made by infusing syntactic foam into
silane coated honeycomb structures. In Fig. 4.8 the results for the foam-filled silane
coated honeycomb samples with 20% volume fraction of microballoons compressed
along the L-direction is compared with that of the corresponding uncoated honeycomb.
The results show that there is no significant difference between the compression
Composite designation
Density (kg/m3)
Elastic Modulus (MPa)
L-Direction W-Direction
Plateau Stress (MPa)
Plateau Stress (MPa)
SFH-20 1023 ± 8 2027 ± 18 38.58 ± 2.3 45.45 ± 2.6
SFH-30 921 ± 10 1989 ± 20 33.84 ± 1.7 38.59 ± 2.0
SFH-40 828 ± 14 1695 ± 22 28.74 ± 1.8 34.06 ± 1.6
Table 4.2: Properties of syntactic foam-filled honeycomb composite (20, 30, 40 designation denotes Vf of microballoons in the syntactic foam)
63
responses of the two cases and this can be explained with the help of Fig. 4.7 where the
sequence of deformation of the foam-filled composite with uncoated honeycomb preform
is shown. From this figure it can be clearly seen that a good bonding between the metal
(aluminum) and the polymer (syntactic foam) phase leads to the formation of shear bands
that propagate within the sample as it continues to deform with increasing load. Also, the
sample does not show any significant oozing out of syntactic foam in the out-of-plane
direction which further supports this observation. The formation of surface cracks at
higher loads shows that because of good bonding between the individual phases these
cracks are able to propagate through the specimen.
0
20
40
60
80
100
120
140
160
0 0.1 0.2 0.3 0.4 0.5 0.6 0.7Strain
Stre
ss(M
Pa)
Uncoated Preform
Silane Coated Preform
Figure 4.8: Compression response of SFH-20 with uncoated honeycomb preform and silane coated preform
64
4.2.2 Effect of direction of compression
Unlike the open-cell metallic foams used for making IPC samples, the compressive
response of honeycomb structures depends on whether it is compressed along the L- or
W-direction. The compression response of syntactic foam and syntactic foam-filled
honeycomb composites with the same volume fraction of microballoons is compared in
Fig. 4.9. The graphs show that foam-filled honeycomb composites have the same elastic
modulus and approximately the same yield stress in both the directions of compression.
That is, the linear elastic response is essentially isotropic and the deviations in the two
responses occur only at very large strains in the post yielding region. For a particular
volume fraction of microballoons, the foam-filled honeycomb is found to have a higher
plateau stress for W-direction compression when compared to the one in the L-direction
and the percentage increase is 17.8%, 14.0% and 18.5% for 20%, 30% and 40% volume
fraction of microballoons in syntactic foam, respectively. The difference in the plateau
stresses can be attributed to the non-uniform deformation and propagation of a shear band
of deformed cells through the sample when it is compressed in L- or W- directions. From
Fig. 4.9(a) it can be seen that the syntactic foam has a modestly higher yield stress when
compared to the syntactic foam-filled honeycomb with 20% volume fraction of
microballoons. However, this trend shifts with increasing volume fraction of
microballoons and the yield stress of the syntactic foam-filled honeycomb increases by
~6 MPa when compared to the syntactic foam with 40% volume fraction of
microballoons. The increase in the volume fraction of microballoons in the foam also
leads to significant improvements in the yield stress and plateau stress of the foam-filled
65
honeycombs when compared to the syntactic foam. Hence the syntactic foam-filled
honeycomb with 40% volume fraction of microballoons has maximum improvement in
its properties when compared to the other two volume fractions. The introduction of
aluminum honeycomb web into the syntactic foam prevents the microballoons from an
early collapse. This aspect is strongly manifested in the response of the syntactic foam
containing 40% volume fraction of microballoons. That is, the syntactic foam-filled
honeycomb with 40% volume fraction of microballoon in syntactic foam shows
significant improvements in compression response along both L- and W- directions when
compared to the corresponding syntactic foam sample.
(a)
0
20
40
60
80
100
120
140
160
180
0 0.1 0.2 0.3 0.4 0.5 0.6 0.7 0.8Strain
Stre
ss(M
Pa)
SFH-20 (W direction)
SFH-20 (L direction)
SF-20
66
Figure 4.9: Comparison of stress-strain response of syntactic foam, Syntactic foam-filled honeycomb for (a) 20% volume fraction, (b) 30% volume fraction, (c) 40% volume fraction of microballoons
0
20
40
60
80
100
120
140
160
0 0.1 0.2 0.3 0.4 0.5 0.6 0.7Strain
Stre
ss(M
Pa)
SFH-40 (W direction)SFH-40 (L direction)SF-40
(c)
(b)
0
20
40
60
80
100
120
140
160
0 0.1 0.2 0.3 0.4 0.5 0.6 0.7Strain
Stre
ss(M
Pa)
SFH-30 (W direction)
SFH-30 (L direction)
SF-30
67
4.2.3 Energy absorption characteristics of syntactic foam-filled honeycomb
The energy absorbed by the syntactic foam and the syntactic foam-filled
honeycombs up to 50% strain is plotted as histograms in Fig. 4.10. The histograms show
foam-filled honeycombs to have enhanced energy absorption characteristics when
compared to the corresponding syntactic foam samples made with the same volume
fraction of microballoons. The foam-filled honeycomb composite with 20% volume
fraction of microballoons, SFH-20, is found to have the highest value of energy
absorption when compared to SFH-30 and SFH-40 samples. From Fig. 4.9 it can be seen
that foam-filled honeycombs have higher values of plateau stress for the W-direction
compression when compared to the L-direction compression. They show 15.1%, 16.4%
and 19.5% increase in energy absorption per unit volume of SFH-20, SFH-30 and SFH-
40 honeycombs, respectively, when compressed in the W-direction compared to the
corresponding values for the L-direction. Foam-filled honeycomb with 20% volume
fraction of microballoons (SFH-20) has 24% improvement in energy absorption per unit
volume when compared to the corresponding syntactic foam sample and this value
increases to 34% and 52% for syntactic foam-filled honeycomb composite with 30%
(SFH-30) and 40% volume fraction of microballoons, respectively, when compared to the
corresponding syntactic foam samples (foam-filled honeycombs are compressed along
the W-direction).
The energy absorbed per unit mass is also evaluated and is plotted in Fig. 4.10(b).
From this figure it can be seen that syntactic foam-filled honeycombs compressed along
the L-direction show a relatively small improvement in the energy absorption when
68
compared to the corresponding pure foam samples. This value, however, increases for
foam-filled honeycomb composites compressed along the W-direction and the percentage
increase is approximately 17%, 20% and 28% for SFH-20, SFH-30 and SFH-40 when
compared to the corresponding pure foam samples. The graph also shows that the foam-
filled honeycombs with 30% volume fraction of microballoons (SFH-30) and the one
with 40% volume fraction of microballoons (SFH-40) have a relatively small difference
in their values of energy absorption per unit mass and is ~ 0. 8 KJ/Kg for the L-direction
and ~0. 21 KJ/kg for the W-direction.
0
5
10
15
20
25
30
35
20% 30% 40%
Volume Fraction of Microballoon in Syntactic foam
Ene
rgy
Abs
orbe
d pe
r uni
t Vol
ume
(MJ/
m^3
)
Syntactic Foam
SFH (L-Direction)
SFH (W-Direction)
(a)
69
Another comparison can be made from Figs. 4.5 and 4.10. From these it can be
seen that the IPC foam has higher values of energy absorption per unit mass and per unit
volume when compared to the corresponding syntactic foam-filled honeycomb
composites, which clearly shows that the interpenetrating architecture of the
interpenetrating phase composite enhances the compression response of the syntactic
foam by a greater margin. The energy absorption per unit mass for the syntactic foam and
syntactic foam-filled composites is plotted for comparison purposes in Fig.4.11, where it
can be seen that the IPC foam with 20% volume fraction of microballoons has
0
0.005
0.01
0.015
0.02
0.025
0.03
0.035
0.04
20% 30% 40%
Volume Fraction of Microballoon in Syntactic foam
Ene
rgy
Abs
orbe
d pe
r uni
t mas
s (M
J/K
g)Syntactic Foam
SFH (L-Direction)
SFH (W-Direction)
(b)
Figure 4.10: Comparison of energy absorption (up to 50% strain) for syntactic foams and Syntactic foam-filled honeycomb samples: (a) per unit volume (b) per unit mass.
70
0
0.005
0.01
0.015
0.02
0.025
0.03
0.035
0.04
20% 30% 40%
Volume Fraction of Microballoon in Syntactic foam
Ene
rgy
abso
rbed
per
uni
t mas
s (M
J/K
g)
Syntactic Foam
Silane Coated IPC
SFH (W-Direction)
approximately 15% higher energy absorption when compared to the syntactic foam-filled
honeycomb composite. This value is ~6% for the case of 30% volume fraction of
microballoons.
Also, this trend is found to be consistent for the case of 40% volume fraction of
microballoons but the percentage increase is found to be relatively less ~2%. In fig.4.11
the energy absorption characteristics of syntactic foam-filled honeycomb composite when
it is compression along W-direction is considered for comparison with IPC. It should be
noted that foam-filled honeycomb composite has a significantly lower value of energy
absorption when it is compressed along the L-direction and hence was not considered for
comparison purposes with IPC in the above figure. The IPC samples consistently have ~
Figure 4.11: Comparison of energy absorption (up to 50% strain) for syntactic foams, IPC foam and syntactic foam-filled honeycomb samples
71
50% higher energy absorption per unit volume and~33% higher energy absorption per
unit mass for various volume fraction of microballoons which is also not the case with
syntactic foam-filled honeycombs which have ~24%, ~34% and ~48% higher energy
absorption per unit volume for SFH-20, SFH-30 and SFH-40 samples respectively when
compressed along the W-direction. The maximum increase in the energy absorption per
unit mass for the foam-filled honeycombs is found to be ~26% for SFH-40 sample when
it is compressed along the W-direction and this value is also found to be lower when
compared to the IPC samples.
72
CHAPTER 5
FINITE ELEMENT MODELING OF
SYNTACTIC FOAM-FILLED COMPOSITES
This chapter describes modeling and simulation of the compressive behavior of
syntactic foam-filled composites. The finite element models for Interpenetrating Phase
Composite (IPC) foam composites and syntactic foam-filled honeycomb composites are
developed in SOLIDEDGE® and MATLAB® software environments, respectively.
These models were then imported into ABAQUS/Standard structural analysis software to
carry out finite element analyses. A rate independent plasticity model based on associated
plastic flow rule and von-Mises yield criterion with isotropic hardening was used to
model plasticity of both aluminum and syntactic foam phases of the composite. The
overall stress-strain relations of the two types of composites were determined using
measured stress–strain responses for the individual phases.
In the first part of this chapter details on the development of a Kelvin cell-based
finite element model capable of capturing the salient features of the experimental
observations is presented for IPC foam. The numerical results of this unit cell based 3-D
elasto-plastic finite element analysis are compared with experimentally obtained true
stress-strain curves. The second part of this chapter describes computational modeling of
syntactic foam-filled honeycomb composites.
73
Finite element analysis was used to simulate experiments performed on syntactic foam-
filled honeycomb composite. Once the simulations were validated by the experimental
data, additional insight on the in-plane mechanical behavior of foam-filled honeycomb
composites was sought.
5.1 Material model
A rate independent plasticity model in ABAQUS® was used to model plastic
behavior of both aluminum and syntactic foam phases. Most materials of engineering
interest initially respond elastically. Within the elastic regime, deformation is fully
recoverable upon removal of load. When the stress exceeds the yield value, the
deformation is no longer fully recoverable when load is removed. Plasticity theories
model mechanical response of materials as they undergo such non-recoverable
deformations. These theories, although developed primarily to model ductile behavior of
metals, they are also shown to be effective for modeling inelastic behavior of soils,
concrete, rock, ice, crushable foams, as well. These materials behave in very different
ways. For example, large values of hydrostatic pressure cause very little inelastic
deformation in metals whereas even small hydrostatic pressures can cause significant,
non-recoverable volume changes in soils. Nonetheless, the fundamental concepts of
plasticity theories being sufficiently general, models based on these concepts have been
developed successfully for a wide range of materials.
74
Most of the plasticity models are based on “incremental” theories in which strain
rate is decomposed into an elastic part and a plastic (inelastic) part. The incremental
plasticity models are usually formulated in terms of
• Yield surface, which generalizes the concept of yield load into a test function that
can be used to determine if the material responds purely elastically at a particular
state of stress, temperature, etc.
• Flow rule, which defines the inelastic deformation that occurs if the material point
is no longer responding purely elastically, and
• Evolution laws that define hardening - the way in which the yield and/or flow
definitions change as inelastic deformation occurs.
The experimental test data is converted into true stress and logarithmic plastic
strain using Eqns. 5.1 and 5.2 which are then used as the input for the plasticity model:
( )1nom nomtrueσ σ ε= + (5.1)
( )ln ln 1pl truenom E
σε ε= + − (5.2)
In this work, the plasticity model based on associated plastic flow and von Mises
yield criterion with isotropic hardening was used to model plasticity of both metallic and
syntactic foam phases. The Mises yield surface was used to define isotropic yielding. In
the associated plastic flow rule the direction of flow was the same as the direction of the
outward normal to the yield surface and in isotropic hardening the yield surface is
75
assumed to maintain its shape, while its size increases or decreases as plastic straining
occurs . The isotropic hardening means that the yield function is written as
where 0σ is the equivalent (uniaxial) stress,
plε is the work equivalent plastic strain, and
is temperature.
5.2 Finite element modeling of IPC foam
In order to model stress-strain characteristics of IPC foams finite element method
was utilized and the results were validated by those obtained from experiments discussed
earlier. To understand the mechanical behavior of the IPC foam on hand, it would be
appropriate to consider models with randomly interpenetrating 3-D structures, similar to
the one studied experimentally. However, in view of practical considerations of
modeling the complexities of the metallic preform and syntactic foam, a unit cell based
analysis was carried out.
5.2.1 Development of unit cell model
Previous structural foam researchers [31-33] have successfully used space filling
Kelvin cells [34] to represent an open-cell microstructure. These investigators have
demonstrated the ability of these cells used in conjunction with the finite element method
to capture the behavior of open-cell foams. A Kelvin cell is a tetrakaidecahedron, a 14-
sided polyhedron comprised of six squares and eight hexagonal faces. In the present
0( ) ( , ) plf σ σ ε θ= (5.3)
76
work, the initial modeling of a Kelvin cell was done using SOLIDEDGE®. Figure 5.1
shows the Kelvin cell that is used to represent the aluminum foam in this work. The
actual cross-section of aluminum ligaments of the perform/scaffold used in experiments
was close to a triangular shape and hence was approximated as an equilateral triangle in
the simulations for simplicity.
The space inside and outside this cell was filled with syntactic foam, assumed to be a
macroscopically homogeneous and isotropic solid medium for modeling purposes. This
results in an interpenetrating structure, representative of the IPC foam on hand. The unit
cell model used to represent the IPC foam is shown in Fig. 5.2. All the ligaments of the
Kelvin cell have the same length (L) and the cell height in this case is h = L.
Figure 5.1: Schematic of a unit cell model of Kelvin cell. (Color rendition is for clarity only)
2 2
77
The cross sectional area of ligaments was decided such that the overall volume fraction of
the aluminum foam in the IPC is approximately 9%, same as that of the preform used in
the experiments.
5.2.2 FEA model description
Finite element analyses were carried out using ABAQUS/Standard structural
analysis software. A four node tetrahedron element (element type C3D4) in ABAQUS
with linear interpolation was used to discretize the unit cell. The model had a total of
86865 elements and 16111 nodes. A mesh convergence study was performed using
different element sizes (average sizes - 0.0825mm, 0.152mm and 0.325mm) and it was
found that the element size of 0.152 mm was sufficient for achieving good convergence,
and hence was used in all the simulations. The elastic constants of aluminum and the
Figure 5.2: Finite element model development: (a) Idealization of IPC foam structureusing Kelvin cells (b) Unit cell model used to represent aluminum-syntactic foam IPC.
(a)
(b)
Aluminum ligaments
syntactic foam
78
respective syntactic foam (from experiments) were assigned to the two phases of the IPC
foam.
The plasticity model described in the previous section was used to model
plasticity of both metallic and syntactic foam phases. Since the applied strains were
greater than the elastic limit (~ 40% in this work), geometrical nonlinearity was also
incorporated into the analysis. The stress-strain response of aluminum Al-6101 (Young’s
modulus = 69 GPa, ν = 0.35, yield stress = 172 MPa at 0.2% strain and ultimate stress =
200 MPa (at 15% strain) based on Alcoa Inc. datasheet) was assigned to all the elements
representing the metallic ligaments. The measured stress-strain responses for syntactic
Figure 5.3: Finite element model of undeformed unit cell with boundary conditions used while simulating the uniaxial compression of IPC foam.
uz = constant
ux= 0
uy= 0
B
C
D
F
E
A
79
foams made with different volume fractions of microballoons were used to model the
infiltrating material surrounding the ligaments of the unit cell.
The model was subjected to uniaxial compression by displacing the nodes
uniformly on the top face of the cell in the z-direction, as shown in Fig. 5.3. The nodes
on the other lateral faces of the unit cell were constrained in the respective outward
directions but were free to displace in the in-plane directions. All the prescribed boundary
conditions are shown in Fig. 5.3, where displacements of nodes on the face ABCD along
the x-direction is zero and similarly displacements of nodes on the face ABEF along the
y-direction is zero. Figure 5.4 shows the finite element mesh of the model used in this
study. Previous foam mechanics researchers have used either displacement constraints or
periodic boundary conditions in their studies and therefore the effect of boundary
Figure 5.4: Finite element model of undeformed unit cell with mesh (Different colors/shades show metallic ligaments embedded in the syntactic foam cubic cell.)
80
condition on the stress-strain response of the IPC foam is also discussed in the next
section.
5.2.3 Results
The uniaxial compressive behaviors of IPC foam with different volume fractions
of microballoons (20%, 30% and 40%) in syntactic foam were simulated and the results
were compared with the corresponding ones from experiments. In Fig. 5.5, the finite
element results for IPC foam with 20%, 30% and 40% volume fraction of microballoons
in syntactic foam are compared with experimentally obtained true stress-strain responses.
It should be noted that results from the simulation are compared with that for the silane
coated IPC samples due to the idealization of perfect bonding between the two phases in
case of the finite element analysis. The measured stress-strain response of the
corresponding syntactic foam samples with the same volume fraction of microballoons is
also shown for comparison. It can be seen that the simulations indeed capture the
measured IPC foam behavior very well. In the post-yield regime, the simulations seem to
slightly over predict the measurements attributed primarily to the idealization of uniform
and defect free bonding between aluminum and syntactic foam phases. The assumption
of uniform cross-sectional area for all ligaments throughout the unit cell could be an
additional contributor to this over prediction. From Fig. 5.5 it can also be seen that the
simulations seem to predict more accurate results for the IPC with 20% volume fraction
of microballoons when compared to IPC with 30% and 40% volume fraction of
microballoons. This could be due to the fact that syntactic foam is modeled as an
81
isotropic and homogeneous material during the finite element analysis. The results also
clearly show that the Kelvin cell model successfully captures the overall behavior of the
IPC composite. Table 5.1 lists the values of elastic modulus, compressive strength and
plateau stress of the IPC foam obtained from finite element simulations for all the three
cases. Again, from the results it is evident that the predictions are slightly higher in all
Figure 5.5: Comparison of numerical and experimental results for IPC foam with (a) 20% volume fraction, (b) 30% volume fraction, (c) 40% volume fraction of microballoons
83
A few representative results from finite element simulations for IPC-S30 case are shown
in Figs. 5.6(a)-(c). In Fig. 5.6(a), von-Mises stress contours are depicted on the unit cell
and on an interior planar section denoted by A-B at an imposed strain of 40%. As
expected, the ligaments experience higher stresses compared to the surrounding syntactic
foam. From the contours of equivalent plastic strain (Fig. 5.6(b)) it can be seen that the
strain levels are higher for the syntactic foam when compared to that in the aluminum
phase as syntactic foam has lower yield strength when compared to the preform
ligaments. Further, non-uniformity of strains through the cross-section of the unit cell is
clearly evident.
IPC Designation
Finite Element Results Experimental Results
Elastic Modulus
(MPa)
Compressive Strength
(MPa)
Plateau Stress
(MPa)
Elastic Modulus
(MPa)
Compressive Strength
(MPa)
Plateau Stress
(MPa)
IPC-S20 2204 67.8 52.0 2109 64.2 50.8
IPC-S30 1938 55.8 41.9 1843 53.2 40.2
IPC-S40 1792 47.9 33.7 1689 45.0 31.7
Table 5.1: Comparison of finite element results with experiments (based on true stress- strain data)
84
Figure 5.6: Finite element results for unit cell model for IPC-S30 at 40% strain. (a) Deformed and undeformed unit cell with von-Mises stress contours (b) Deformed unit cell with equivalent plastic strain contours (c) Deformed unit cell with displacement contours in the u3 (uz)
A
BB
A
A
B
A
B
B
A A
B
Deformed
Undeformed
(b)
(a)
(c)
85
In Fig. 5.6(c), displacement contours in the direction of the imposed strain (uz) is shown.
The presence of aluminum ligaments in the unit cell clearly perturbs the uniformity of
displacements as evident from the contours on and within the cell. A Kelvin cell based
3D elasto-plastic finite element model is developed by adopting unit cell analysis
approach to examine the feasibility of predicting both the elastic and plastic
characteristics of the IPC foam. This analysis is aimed at validating the case of silane
treated preform where adhesion between the ligaments and foam can be assumed to be
relatively strong. The numerical model based on measured compression response of the
corresponding syntactic foam and aluminum is able to successfully capture the overall
IPC foam behavior.
5.2.4 Effect of boundary conditions
Many researches [35-37] have used spatially periodic boundary conditions to
study the mechanical behavior of cellular solids in view of the periodicity of their
microstructures. Thus periodic boundary conditions are also used in the current unit cell
analysis and the effect of boundary condition on the stress-strain response of the IPC
foam was studied. In the current work, the periodic boundary conditions were applied
according to the procedure described in Ref. [37]. The three pairs of opposite bounding
faces of the cell were represented as ( 1 2,i iR R∂ ∂ ) i = 1, 2, 3.
86
1 2 1 2 ref refi i i iu u u u− = −
The boundary conditions corresponding to an average strain for a periodic cell can
then be expressed as
where 1 2( , )i iu u is the displacement of points on each pair of faces denoted by
( 1 2,i iR R∂ ∂ ) and 1 2( , )ref refi iu u are displacements of conjugate points on opposite sides
chosen as reference points.
A finite element mesh on the two opposite faces of the unit cell is shown in Fig.
5.7 where 1refiu and 2
refiu are the displacements of the corresponding matching nodes. In
the current analysis the aluminum ligaments are modeled using a symmetric Kelvin cell
described above and thus each pair of opposite bounding faces of the cell have the same
in-plane displacements. In order for a unit cell to be periodic, all outer faces must fulfill a
periodicity condition. That is, every node on the outer face must have an equivalent node
on the corresponding opposite (negative) outer face. As long as periodicity conditions can
be formulated for a given cell, then the same cell can be used to represent the
microstructure. In Fig. 5.7, two opposite sides of the same pair of the model are shown.
From this figure it can be clearly seen that for every node on one face there is a
corresponding matching node on the other face of the model. The mesh of the finite
element model thus generated had a matching node for each pair of surfaces. This
periodic mesh had reduced integration hexahedral elements type C3D8 in ABAQUS® on
the outer faces of the model while four node tetrahedron element (element type C3D4) in
ABAQUS® with linear interpolation in the inner regions of the unit cell. The model had
(5.4)
87
Figure 5.7: Periodic finite element mesh on a pair of opposite faces.
D
A
C
B
A’ B’
C’
D’
1refiu
2refiu .
.
88
a total of 94887 elements. The initial meshing of the model was done using commercially
available HYPERMESH® software and the model was then imported into ABAQUS®
for carrying out the finite element simulations. In ABAQUS®, the periodic boundary
conditions were implemented by using the EQUATION option, where equations were
formed to tie equivalent points on the opposite faces of the cell. All the remaining
parameters of the analysis are the same as that was used previously. Due to the number of
constraints generated by the use of equations to implement the periodic boundary
conditions the computational time increased drastically and hence this analysis was
carried out for applied strain of approximately 20%.
In Fig. 5.8 the results from this finite element simulation and that obtained in the
previous section (displacement boundary condition) are plotted for comparison. It can be
seen that periodic boundary conditions capture the experimental behavior more closely
when compared to the more restrictive zero outward displacement boundary conditions.
This comparison plot also shows that for applied strains greater than 5% there is a notable
difference between the responses predicted by the two approaches. The displacement
boundary conditions restrain the normal displacements and thus are found to over predict
the stress-strain response when compared to the periodic boundary conditions which
couple the displacements of matching nodes on each pair of the surface to imitate an
infinitely large material bulk.
89
5.3 Finite element modeling of syntactic foam-filled honeycombs
Full scale finite element simulations were carried out to study the in-plane failure
characteristics of the syntactic foam filled composites and also to compare results with
those obtained from experiments. In order to simulate the compression response of the
composite the finite element model was developed under plane strain assumptions and
had the same specimen dimensions (25 mm x 25 mm x 16 mm) as the ones used in
experiments. The structure of composite was modeled in MATLAB® and was
subsequently imported into ABAQUS® for carrying out finite element analysis.
0
10
20
30
40
50
60
0 0.05 0.1 0.15 0.2 0.25 0.3 0.35 0.4True Strain
True
Stre
ss(M
Pa)
IPC-S30 (Displacement boundary condition)
IPC-S30 (Periodic boundary condition)
IPC-S30 (Experimental)
Figure 5.8: Effect of boundary condition on stress-strain response of IPC
90
5.3.1 FEA model description
The geometry for the finite element model of syntactic foam-filled honeycomb
composite was generated using an array of hexagonal cells in MATLAB®. First, an array
of 8 x 8 hexagonal cells was generated such that each cell had a cell size of 3.25 mm (or,
1/8th of an inch) (Fig.5.9). Next, the aluminum honeycomb structure was generated such
that the area fraction of the aluminum honeycomb was 8% since the relative density of
the aluminum honeycomb used in the experimental study was ~8%.
The honeycomb sheets used in this work were manufactured using an expansion process
and thus each cell had the two vertical walls of double the thickness when compared to
the other (inclined) sides of the cell. Therefore, a regular honeycomb structure with
Figure 5.9: Geometry of honeycomb specimen used in analysis
Aluminum Ligament
Syntactic Foam
91
double wall thickness in vertical direction was generated to represent the aluminum
honeycomb structure. The relative density of the honeycombs was estimated by dividing
the area of the cell walls by the total area of a unit cell. The material inside these cells
was assumed to be filled with syntactic foam, thus resulting in the structure of the
syntactic foam-filled honeycomb composite.
The honeycomb sheet used for the preparation of foam-filled honeycomb composite (Al
5052-H39) is the same as that was experimentally tested and numerically modeled by
Papka et al [38]. These authors have developed finite element models to simulate the
crushing of this honeycomb sheet by assuming the stress-stain response of aluminum as a
bilinear function with a post-yield modulus of E/100, E being the elastic modulus.
Accordingly, in the current study the elastic-plastic behavior of aluminum was modeled
in same way as described in Ref. [38]. The measured stress-strain responses for syntactic
foams containing different volume fractions of microballoons were used to model the
material surrounding the aluminum ligaments. The material model described in Section
5.1 was once again used to model the plastic behavior of syntactic foam. The platen of
the testing machine was modeled as a rigid surface by specifying its value of elastic
modulus to be approximately 100 times that of aluminum. MATLAB® was used to
construct the model which was then imported into ABAQUS® finite element software
for analysis purposes. Adaptive automatic stabilization scheme available in
ABAQUS/Standard can be used to solve unstable static problems involving geometric or
material nonlinearity and thus is also used in the current analysis [39]. This scheme is
used for stabilizing unstable quasi-static problems through the automatic addition of
92
volume-proportional damping to the model. In the current work the default value of the
dissipated energy fraction (2 x 10⁻⁴) was used for the calculation of the damping factor. In
the adaptive automatic stabilization scheme the value of the damping factor can vary
spatially and with time and depends on the ratio of energy dissipated by viscous damping
to the total strain energy of the model. It has a default value of 0.05 and was used in the
current work. A contact pair was defined between the top and bottom surfaces of the
specimen that were in contact with the platen surface. The platen surface was chosen as
the master surface and the specimen surface that was in contact with the platen surface
was chosen as the slave surface. The normal behavior of these contact pairs was modeled
using a hard contact relationship which minimizes the penetration of the slave surface
into the master surface. In this relationship, any contact pressure can be transmitted
between the surfaces when they are in contact and the surfaces separate if the contact
pressure reduces to zero. The tangential behavior was assumed to be frictionless. Figure
5.10 shows boundary conditions used in the model. In order to simulate the experiments
uniaxial compression was carried out carried out by applying uniform vertical
displacements to the top platen, as shown in Fig. 5.10. The applied strain was increased
from 0 to 40%.
93
A representative finite element mesh used in the simulations is shown in Fig.
5.11. A mesh convergence study was carried out to ensure the mesh refinement in the
composite structure. The number of elements used in the finite element model for this
study was varied (11140, 14354 and 16760 elements) and it was found that the model
with 16760 elements successfully captured the overall behavior of the composite. The
model was discretized using generalized plane strain elements and a typical finite element
mesh consisted of 16,760 linear interpolation quadrilateral and triangular elements.
Figure 5.10: Loads and boundary conditions used during the analysis
Syntactic foam-filled honeycomb composite
Rigid Platens
94
(a)
Figure 5.11: (a) Finite element mesh of the model (b) enlarged view showing finite element mesh of the composite
(b)
95
5.3.2 Results
Figure 5.12 shows the deformation stages of a foam-filled honeycomb composite with
30% volume fraction of microballoons which is compressed along the L-direction and the
stress-strain response of this composite is shown in Fig. 5.13(b). Uniform vertical
displacement is applied to the top platen while the bottom one is fixed. This results in
crushing of the sample placed in between the platens. At relatively low strains uniform
deformation of the sample can be seen. As strain increases the deformations start to
localize in a narrow band of cells in a dominant shear mode at ~45o to the loading
direction, as in Fig. 5.12(c). This mode of deformation then leads to the formation of
multiple shear bands that act as failure planes. At applied strain of ~15% these shear
bands coalesce and deformation starts spreading to the neighboring cells and the
specimen begins to deform in an unsymmetric manner as in Fig. 5.12(d). The
deformation process also seems to be highly localized, as observed in experiments. By
the end of Fig. 5.12(e) the deformation propagates to the neighboring cells with much
greater compressive deformation of the material near the top half as compared to the
bottom half of the specimen. This mode of failure then continues with certain cells
heavily deforming in an unsymmetric manner while some cells remain relatively
undeformed. The final configuration which is at an applied strain of 40% clearly reveals
shear bands that have dominated the deformation process in syntactic foam-filled
aluminum honeycomb composite.
96
Figure 5.12: Sequence of deformation at applied strain of (1): 1.8%, (2):5.4%, (3): 8.2%, (4): 14.6%, (5):32.8%, (6)40%
5 6
43
1 2
97
The deviations between the sequence of events observed during experiments and
as seen in the numerical simulation can be attributed to manufacturing imperfections, and
anomolies in cell sizes of real sample. That is, the honeycomb with a smaller cell size
will have an additional amount of adhesive that will affect the mechanical response. The
expansion process through which the honeycombs are manufactured introduces changes
in material properties and also leaves behind residual stresses as identified in Ref. [40].
The idealized cell geometry assumed in the finite element model does not actually exist
in the honeycomb structure where the cell geometry and the cell size differ on a
microscopic level. As the sequence of collapse largely depends on the cell geometry and
is one of the main reasons for the observed deviations.
0
10
20
30
40
50
60
0 0.05 0.1 0.15 0.2 0.25 0.3 0.35 0.4True Strain
True
Stre
ss (M
Pa)
SFH-20 (FEM Result)
SFH-20 (Experiemental)
(a)
98
Figure 5.13: Comparison of numerical and experimental results for Syntactic foam-filled honeycomb composites (a) 20% volume fraction, (b) 30% volume fraction, (c) 40% volume fraction of microballoons
0
5
10
15
20
25
30
35
40
45
50
0 0.05 0.1 0.15 0.2 0.25 0.3 0.35 0.4True Strain
True
Stre
ss (M
Pa)
SFH-40 (FEM Result)
SFH-40 (Experiemental)
(c)
0
10
20
30
40
50
60
0 0.05 0.1 0.15 0.2 0.25 0.3 0.35 0.4True Strain
True
Stre
ss (M
Pa)
SFH-30 (FEM Result)
SFH-30 (Experiemental)
(b)
99
In Fig. 5.13 the finite element results for syntactic foam-filled honeycomb
composite with 20%, 30% and 40% volume fraction of microballoons are compared with
the experimentally obtained true stress-strain curves. From the graphs it is evident that
the computational model captures the overall stress-strain response of the composite quite
well even though there are some differences in the sequence of deformation between that
observed during experiments and that predicted by finite element analysis. The values of
elastic modulus and plateau stress predicted by the finite element model are found to be
in good agreement with that from experiments. From Fig. 5.13 it can be clearly seen that
the numerical model successfully captures the stress-strain response of the syntactic
foam-filled honeycomb composite having varying volume fraction of microballoons. The
deviations between the two responses especially in the post yield regime can be attributed
to the reasons as discussed above.
100
CHAPTER 6
MICROMECHANICS BASED ELASTIC MODULUS PREDICTION
In this chapter, the feasibility of predicting the elastic modulus of syntactic foams
and syntactic foam-filled composites is discussed. This is done by evaluating
measurements relative to the micromechanics models reported in the literature. Several
models have been developed to predict the elastic properties of composites based on
known properties of the constituents, typically the matrix and the filler. The mixing laws
used to estimate elastic moduli of such composites can be grouped into two categories. In
the first category, the composite structure is an assembly of discontinuous and random
inclusions which cannot be modeled using a unit cell based analysis. In the second
category, the composite structure is usually modeled by a repeating geometry and the
rule-of-mixtures based on isostress and isostrain approximations.
Effective mechanical properties of two phase particulate composites have been
under investigation for many years and several micromechanical models have been
developed to predict the elastic properties [41-44]. These models are based on the
assumption that tractions and displacements are continuous (or the individual phases are
assumed to be ideally bonded) at the interface between matrix and filler phases and the
composite is assumed to be homogenous and isotropic on a macroscopic scale.
101
In the current work, a few models are used to predict the effective elastic properties of
syntactic foams, IPC foams and foam-filled honeycombs and compare them with
measurements.
6.1 Micromechanics model for elastic modulus prediction
In this section some of the micromechanics models that are used for estimating
the elastic modulus of foam-filled composites are reviewed.
6.1.1 Hashin-Shtrikman model
This model is based on the minimum energy principle to predict the upper and
lower bounds of elastic modulus of a composite [41]. For a two phase mixture
comprising of matrix and spherical fillers, the upper bounds of bulk (K) and shear moduli
(G) can be represented as,
21
1
2 1 1 1
1 3- 3 4
UBc
VK K VK K K G
= ++
+
21
1 1 1
2 1 1 1 1
1 6( 2 )- 5 (3 4 )
UBc
VG G K G VG G G K G
= ++
++
where V is the volume fraction of the constituents and subscripts 1 and 2 represent the
stiff and compliant phases, respectively. The lower bounds of bulk and shear modulus
can be calculated by switching the subscripts in the above equations.
(6.1)
(6.2)
102
The elastic modulus is then computed using the relation,
93
KGEK G
=+
where the upper and lower bulk modulus (K) and shear modulus (G) values are
substituted to get the respective bounds on the elastic modulus.
6.1.2 Tuchinskii model
This model can be used to predict the upper and lower bounds of the elastic
modulus for the composite with an interpenetrating skeletal structure [42]. In this model
the composite is modeled by a repeating hollow cubic skeletal structure (ligaments
aligned along the edges of the cube) of height (H), which represents the first phase. The
cavity of this skeleton is filled with a second cubic phase of height (h) as shown in
fig.6.1. The upper and lower bounds on the elastic modulus of the composite are given by
equations,
12 2 22 2
1 1
-1
1-
(1- ) (1- ) (2 - )
UBc
c cE EE Ec c c c cE E
⎡ ⎤⎢ ⎥⎢ ⎥= +⎢ ⎥⎛ ⎞ ⎛ ⎞
+ +⎢ ⎥⎜ ⎟ ⎜ ⎟⎝ ⎠ ⎝ ⎠⎣ ⎦
2
2 2 121
1 2
1
2 (1- )(1- )
(1- )
LBc
E c cEEE E c c
E Ec cE
⎡ ⎤⎛ ⎞⎢ ⎥⎜ ⎟⎛ ⎞ ⎝ ⎠⎢ ⎥= + +⎜ ⎟⎢ ⎥⎛ ⎞⎝ ⎠ +⎢ ⎥⎜ ⎟
⎝ ⎠⎣ ⎦
(6.3)
(6.4)
(6.5)
103
22 (3 - 2 )f c c=
where UBcE and LB
cE are the upper and lower bounds for elastic modulus of the
composite, respectively, Ei is the Young’s modulus of the ith phase, f2 is the volume
fraction of phase 2 and c is a geometric parameter (c = h/H). The value of c in Eqs. (6.4)
and (6.5) are obtained by solving Eq. (6.6).
6.1.3 Ravichandran Model
This model considers a continuous matrix phase surrounded by a periodic
arrangement of uniformly distributed cubic inclusions. The repeating cell structure is
characterized by inclusion size (v) and the size of the matrix material (w) as shown in
fig.6.2. Here a unit cell based description of the material microstructure along with
isostress and isostrain configurations (rule-of-mixtures) is used to derive expressions for
the upper and lower bounds of elastic modulus of a two phase composite [43]. The two
bounds of elastic moduli are given by,
(6.6)
Figure 6.1: Schematic representation of phase geometry for a Tuchinskii model [13]
Phase 2
Phase 1
104
2 2 2
3
[ (1 ) ](1 )
( - ) (1 )p m m m
p m m
Uc
E E E c E cE
E E c E c+ + − +
=+ +
22 2
2
( )(1 )( )(1 )
p m m m p mLc
p m
cE E E c E E EE
cE E c+ + − +
=+ +
where UcE and L
cE are the upper and lower bounds of elastic modulus of the composite,
respectively. In the above, Ep and Em denote elastic modulus of the inclusion and matrix
phases and c is a non-dimensional parameter given by,
1/31 - 1
p
cV⎛ ⎞
= ⎜ ⎟⎜ ⎟⎝ ⎠
where pV is the volume fraction of the inclusion phase.
(6.7)
(6.8)
(6.9)
Figure 6.2: Schematic representation of cell geometry for a Ravichandran model [13]
105
0
0.2
0.4
0.6
0.8
1
1.2
0 0.1 0.2 0.3 0.4 0.5Volume fraction ,Vp
Ec / E
m
Experimental (Present)
Experimental Ref.[45]
6.2 Modulus prediction for syntactic foams
The microballoons used in this work have an extremely small wall thickness
(relative to the diameter) and hence the mixture can be modeled reasonably well as a
porous material. In order to check the feasibility of predicting the elastic modulus of
syntactic foam by modeling the mixture as a porous material, the results from the
experiments were compared with those published in ref.[45] where a homogenization
technique is used to take into account the presence of void space inside the filler and wall
thickness of the filler particles. In Fig. 6.3 the experimental data from the current study
and the ones tabulated in ref.[45] are used to plot normalized Young’s modulus of the
mixture as a function of microballoon volume fraction.
Figure 6.3: Variation of measured young’s moduli with microballoon volume fraction
106
The Young’s modulus at a particular volume fraction is normalized by the ones
for the neat matrix material. (The normalization was carried out because the matrix
material used in Ref. [45] is polyester whereas the current work employs epoxy.) From
the figure it can be seen that both sets of data have similar trends and the values are also
found to be in good agreement with each other. A high degree of accuracy can be noted
between the values predicted using the theoretical models and experimental
measurements. Based on the above evidence, the role of microballoon wall in very low-
density (or, very small microballoon wall thickness) mixtures in question is indeed
negligible.
In order to predict the elastic properties of syntactic foams by approximating the
mixture as a porous material, the values of bulk modulus and shear modulus of the filler
phase are set equal to zero in equations used for determining the upper and lower bounds
of elastic modulus. The comparison between micromechanics prediction and
experimental measurements are shown in Fig. 6.4. From the plots, it is evident that the
Hashin-Shtrikman and Ravichandran bounds seem to agree modestly with the measured
modulus values at higher volume fractions but deviate significantly, by as much as 39%,
at lower volume fractions. Further, the lower bounds of both these models are found to
over predict the elastic modulus consistently. Interestingly, the Tuchiniskii model which
describes a co-continuous (interpenetrating) phase microstructure provides a better
estimate of the elastic modulus of the syntactic foam over the entire range of
compositions investigated. The lower bound of this model is found to be in close
agreement with measured modulus values over the entire range of compositions.
107
Figure 6.4: Comparison between predicted and measured values of elastic modulus for syntactic foams. (a) Hashin-Shtrikman and Ravichandran bounds, (b) Tuchiniskii bounds
0
500
1000
1500
2000
2500
3000
3500
0 0.1 0.2 0.3 0.4 0.5 0.6Volume fraction of Particle,Vp
5. Clark, D.R., 1992. Interpenetrating phase composites. Journal of the American
Ceramic Society 75(4), 739-759. 6. Breslin, M.C., Ringnalda, J., Xu, L., Fuller, M., Seeger, J., Daehn, G.S., Otani, T.,
Fraser, H.L., 1995. Processing, microstructure and properties of co-continuous alumina-aluminum composites. Journal of Materials Science and Engineering – A195, 113-119.
Elastic and plastic behavior of a co-continuous alumina/aluminum composite . Acta Materalia 44(1), 249-261.
8. Imagawa, A., Qui, T.C., 1995. Structure-property relationship of polymer blends with
co-continuous structures prepared by photo-cross-linking .Macromolecules 28(24), 8388-8394.
9. Skirl, S., Hoffman, M., Bowman, K., Wiederhorn, S., Rodel, J., 1998. Thermal
expansion behavior and microstrain of Al203/Al composites with interpenetrating networks . Acta Materalia 46(7), 2493-2499.
119
10. Veenstra, H., Verkooijen, P.C.J., Van lent, B.J.J., Dam, J.V., De boer, A.P., Nijhof, A.P.H.J., 2000. On the mechanical properties of co-continuous polymer blends: Experimental and modeling. Polymer 41, 1817-1826.
11. Wegner, L.D., and Gibson, L.J., 2000. The mechanical behavior of interpenetrating
Strength and fracture toughness of interpenetrating graphite/aluminium composites produced by the indirect squeeze casting process. Materials Science and engineering –A386, 61-67.
13. Moon,R.J.,Tilbrook,M., Hoffman,M., 2005. Al-Al2O3 composites with
14. Mayer, H., Papakyriacou, M., 2006. Fatigue behavior of graphite and interpenetrating
graphite-aluminum composite up to 109 load cycles . Carbon 44, 1801-1807. 15. Yu, L., Xiao-lu, G., 2006.Compressive behavior and energy absorption of metal
porous polymer composite with interpenetrating network structure. Transactions of Nonferrous Metals Society of China 16, s439-s443.
16. Kim, J., Kwon, Y., Lomovsky, O., Korchagin, M., Mali, V., Dudina, D., 2006. A
interpenetrating phase composites. Composites Science and Technology 65, 1711-1718
18. Del Rio, E., Nash, J., Williams, J., Breslin, M., Daehn, G., 2007. Co-continuous
composites for high-temperature applications. Materials Science & Engineering-A 463, 115-121.
19. Shutov F.A., 1991.Syntactic polymer foams. In: Klempner D, Frisch KC, editors. Handbook of polymeric foams and foam technology. New York: Hanser Publishers. 20. Kirugulige, M. S., Kitey, R., and Tippur, H. V., 2005. Dynamic Fracture Behavior of Model Sandwich Structures with Functionally Graded Core: A Feasibility Study, Composites Science and Technology, 65, 1052-1068 . 21. Material Datasheet .ERG Materials and Aerospace Corporation, USA. 22. Material Datasheet .Hexcel Corporation, USA.
120
23. Wegner, L.D., Gibson, L.J., 2001. The mechanical behaviour of interpenetrating phase composites- III: resin-impregnated porous stainless steel. International Journal
of Mechanical Sciences 43, 1061–1072. 24. Mattern, A., Huchler, B., Staudenecker, D., Oberacker, R., Nagel, A., Hoffmann,
M.J., 2004. Preparation of interpenetrating ceramic–metal composites. Journal of the European ceramic society 24, 3399–3408.
25. Saravanan, R.A., Surappa, M.K., 2000. Fabrication and characterisation of pure
magnesium-30 vol.% SiCP particle composite. Materials Science and Engineering- A 276, 108–116.
26. Song, B., Chen, W., Frew, D.J., 2004. Dynamic compressive response and failure
behavior of an Epoxy Syntactic foam. Journal of Composite Materials 38(11), 915-936.
27. Gupta, N., Kishore, Woldsenbet, E., Sankaran, S., 2001. Studies on Compressive
Failure features in Syntactic foam Material. Journal of Materials Science 36 (18), 4485-4491.
28. Kim, H.S., Plubrai, P., 2004. Manufacturing and Failure mechanisms of Syntactic
foam under compression. Composites Part A: Applied Science and Manufacturing 35(9), 1009-1015.
29. Gupta, N., Woldesenbet, E., Kishore., 2002. Compressive Fracture Features of
Part I: Morphology and elastic properties. International Journal of Solids and Structures 42, 1355–1379.
32. Gong, L., Kyriakides, S., Triantafyllidis, N., 2005. On the stability of Kelvin cell
foams under compressive loads. Journal of the Mechanics and Physics of Solids 53, 771–794.
33. Luxner, M.H., Stampfl, J., Pettermann, H.E., 2007. Numerical simulations of 3D
open cell structures – influence of structural irregularities on elasto-plasticity and deformation localization . International Journal of Solids and Structures 44, 2990–3003.
121
34. Thomson, W. (Lord Kelvin), 1887. On the division of space with minimal partitional
area. Philos. Mag. 24 (5th series), 503–514. 35. Li, K., Gao, X., Subhash, G., 2005. Effects of cell shape and cell wall thickness
variations on the elastic properties of two-dimensional cellular solids. International Journal of Solids and Structures 42, 1777-1795.
36. Laroussi, M., Sab, K., Alaoui, A., 2002. Foam mechanics: nonlinear response of an
elastic 3D-periodic microstructure. International Journal of Solids and Structures 39, 3599-3623.
37. Gong, L., Kyriakides, S., Jang, W., 2005. Compressive response of open-cell foams.
Part I: Morphology and elastic properties. International Journal of Solids and Structures 42, 1355-1379.
38. Papka, S., Kyriakides, S., 1998. Experiments and full-scale numerical simulations of
in-plane crushing of a honeycomb. Acta Materialia 46, 2765-2776. 39. ABAQUS™ User’s Manual (Version 6.7). ABAQUS Inc., Providence, RI 40. Papka, S., Kyriakides, S., 1994. In-plane compressive response and crushing of
honeycomb. Journal of the Mechanics and Physics of Solids 42, 1499-1532 41. Hashin, Z., Shtrikman, S., 1963. A variational approach to the theory of the elastic
behaviour of multiphase materials. Journal of the Mechanics and Physics of Solids 11, 127–140.
42. Tuchinskii, L.I, 1983.Elastic Constants of Pseudoalloys with a Skeletal Structure.
Poroshk. Metall., 7 [247] 85 (Translated in Powder Metallurgy and Metal Ceramics, 1983), 588-595.
43. Ravichandran, K.S., 1994. Elastic properties of two-phase composites. Journal of the
American Ceramic Society 77, 1178–1184. 44. Hashin, Z., 1983. Analysis of composite materials. Journal of Applied Mechanics 50,
481–505. 45. Bardella, L., Genna, F., 2001. On the elastic behavior of syntactic foams .
International Journal of Solids and Structures 38, 7235-7260.
122
APPENDICES
123
APPENDIX A
EFFECT OF CELL STRUCTURE ON
ELASTIC-PLASTIC RESPONSE OF FOAM-FILLED COMPOSITES
A.1 Introduction
Modeling of 2D cellular solids is generally based on idealized unit cells
representing microstructural features of an average cell in a real material. A significant
limitation of the unit-cell modeling approach is that it does not account for the natural
variations in a typical microstructure. In this context, the objective of this work is to
investigate how irregularity of cells affects the elasto-plastic response of syntactic foam-
filled aluminum honeycomb composites under uniaxial compression. Although several
methods have been developed to consider the effects of microstructural variability on
mechanical properties of foams, the method based Voronoi tessellations has gained
popularity in recent years. Accordingly, a 2D Voronoi tessellation technique in
conjunction with finite element analysis was used to generate cell structures with
randomly varying irregularities. The resulting microstructure is subsequently used to
study the microstructure-compression response for syntactic foam-filled aluminum
honeycomb composite.
124
A.2 The approach: Voronoi tesselations
A Voronoi diagram is based on the principle of partitioning the space with n
points such that for each site every point in the region around that site is closer to that site
than to any other site.
Figure A.1: (a) Set of random points, (b) Voronoi diagram for that set of points
(a)
(b)
125
Random 2D models were constructed for the syntactic foam-filled aluminum honeycomb
composite using this technique. A set of 30 random points is shown in fig. A.1(a) and the
voronoi diagram of this set is generated using voronoi command in MATLAB® is
shown in fig.A.1(b). Finite element analysis is then performed on the conceived Voronoi
structure to predict the compression response of the corresponding syntactic foam-filled
aluminum honeycomb composite.
A.3 Irregularity parameter
A regular hexagonal honeycomb, composed of identical cells having six sides and
vertex angles of 120°, is a fully ordered 2D Voronoi tessellation. This basic pattern was
used to create the structure for the foam-filled honeycombs described in Chapter 5. The
random microstructure of this composite can be described by a 2D Voronoi diagram,
which consists of a number of convex polygons. The first step towards creating a random
microstructure is to generate an array of 20 x 20 fully ordered hexagonal cells. Next, a
random number set with a uniform distribution in the range [0:1] is generated and the
coordinates of each of the points of the voronoi diagram are then perturbed using a set of
random numbers to achieve varying degrees of irregularity. A unique set of random
numbers can also be generated every time to vary the randomness. In the second step,
Voronoi diagram is constructed such that the area fraction of the (aluminum) honeycomb
is ~8%. The relative density of the honeycombs is estimated by dividing the area of the
cell walls by the total area of a unit cell. Here, we define an irregularity parameterα that
is used to quantify the degree-of-irregularity (DOI) of a 2D Voronoi tessellation as,
126
( )l sA Aα = −
where, lA and sA are the area of the largest and the smallest cell in a particular random
Syntactic foam-filled honeycomb composite with a regular hexagonal honeycomb
structure is obtained when α = 0, and the composite with a completely irregular
honeycomb structure are defined when α = 1. Figure A.1 shows syntactic foam-filled
honeycomb samples with different degrees of cell shape irregularity. Each sample
includes 324 complete cells. These models were first generated in MATLAB® and finite
element analysis were performed using ABAQUS® structural analysis software.
A.4 FEA model description
Finite element analyses were carried out to obtain the stress-strain relations for
syntactic foam-filled honeycombs with 30% volume fraction of microballoons having
cell shape irregularities using ABAQUS/Standard. A rate independent plasticity model,
described in Chapter 5, based on associated plastic flow rule and von-Mises yield
criterion with isotropic hardening was used to model plasticity of both aluminum and
syntactic foam phases of the composite. The measured stress-strain response for syntactic
foam with 30% volume fractions of microballoons was used to model the infused
material around the ligaments of the aluminum honeycomb. The properties of Al 5052-
H39 were assigned to regions representing ligaments of the aluminum honeycomb
structure. The other parameters used in the analyses were the same as described in
Section 5.3.1 of Chapter 5.
128
A.5 Effect of cell irregularity on stress-strain response of composites
Finite element analyses were carried out on syntactic foam-filled honeycomb
composites with varying degree of cell shape regularity and the effect of cell structure
randomness on the stress-strain response of the composites was studied. The results of the
finite element simulations are plotted in Fig. A.3. It shows that with an increase in DOI
results in a decrease in the elastic modulus. It also affects the overall stress-strain
response of the composites in general and inelastic characteristics in particular.
The yield stress of syntactic foam-filled honeycomb decreases with increase in the
irregularity of cell shapes and thus the syntactic foam-filled honeycomb with a perfectly
ordered cell structure has the highest value of yield stress (55.4 MPa) and this decreases
Figure A.3: Effect of cell irregularity on stress-strain response of the composite
0
10
20
30
40
50
60
0 0.05 0.1 0.15 0.2 0.25 0.3 0.35 0.4True Strain
True
Stre
ss (M
Pa)
Irregularity parameter,α =0
Irregularity parameter,α =0.2
Irregularity parameter,α =0.4
Irregularity parameter,α =0.6
129
monotonically to ~ 53Mpa, 47Mpa, 41Mpa for α = 0.2, 0.4 and 0.6, respectively. The
plateau stress, however, increases by approximately 14% for α = 0.2 and then decreases
for α =0.4 and 0.6 by approximately by 2% and 12% when compared to that of the foam-
filled honeycomb with perfectly ordered cell structure. From Fig. A.3 it can be observed
that on average elastic modulus increases considerably when cell randomness parameter
(α ) increases from 0 to 0.2 with further increase inα , the change in elastic modulus is
not significant and decreases by ~ 6% when degree-of-regularity is increased from 0.4 to
0.6. Syntactic foam-filled honeycomb composite with regular cell structure is found to be
strongest in terms of elastic moduli and yield strength.
The strong dependence of the moduli on initial changes in α is attributed to the changes
in the microstructure as this leads to changes in cell regularity. Initial perturbations in the
0
500
1000
1500
2000
2500
3000
0 0.1 0.2 0.3 0.4 0.5 0.6 0.7Degree of regulatity,α
Ela
stic
Mod
ulus
(MP
a)
Figure A.4: Effect of cell irregularity on elastic modulus of the composite
130
shape of regular hexagonal cell structure leads to presence of irregular hexagonal cells in
the microstructure, as shown in Fig. A.1(b). The stiffness of each of these irregular
hexagons is significantly less than that of a regular hexagon, thereby leading to a
significant decrease in the elastic modulus of the foam-filled honeycomb with perturbed
cell shapes when compared to that with a regular cell shape.
A.6 Effect of relative density on stress-strain response of composites
Finite element models of foam-filled honeycomb composite with different relative
densities of the (aluminum) honeycomb were generated by changing the cell wall
thickness. As before, the model consisted of 324 regular hexagonal cells. The analyses
were limited to models having low relative densities ( )0.2ρ ≤ . The results are shown in
Fig. A.5. The compression responses indicate that the elastic modulus, plateau stress and
yield stress decrease with increasing relative density. With increase in the relative density
there is decrease in the area of the cell and hence the area fraction of syntactic foam is
also less and this results in a stiffer response of the composite. The plateau stress
increases from 35MPa for a relative density of 8% to 53MPa for 20% relative density.
The yield stress and the elastic modulus are also found to be increasing monotonically by
26% and 31% respectively. The stress-strain response of composite is found to be fairly
consistent with the changes in the relative density of the aluminum honeycomb sheet.
131
0
10
20
30
40
50
60
70
80
0 0.05 0.1 0.15 0.2 0.25 0.3True Strain
True
Stre
ss (M
Pa)
Relative Density = 8%
Relative Density = 10%
Relative Density = 15%
Relative Density = 20%
Figure A.5: Effect of relative density on stress-strain response of the composite.
132
APPENDIX B
MATLAB CODES
(1) This code is used to generate numerical model for syntactic foam-filled honeycomb composite %--------------------------------------------------------------------- This program is used to create cell array (8x8) with a cell size of 1/8 inch %--------------------------------------------------------------------- clear all; close all; clc; %--------------------------------------------------------------------- This is to generate a hexagonal grid %--------------------------------------------------------------------- pos = hextop(10,10); pos1=pos'; x=pos1(:,1); % x-ccordinate of center points of cells y=pos1(:,2); % y-ccordinate of center points of cells figure(1); %--------------------------------------------------------------------- Construct a voronoi diagram %--------------------------------------------------------------------- h=voronoi(x,y,[]); [vx,vy] = voronoi(x,y,[]); % Vertices of voronoi edges so that "plot(VX,VY,'-',X,Y,'.')" plots cell axis equal; [cord,c]=voronoin([x(:) y(:)]); conn=zeros(length(c),6); % assign zero to the unassigned Index for i=1:length(c), temp=c{i}; for j=1:length(c{i}) conn(i,j)=temp(j); end end close all; nen=6; nodes=length(cord); %defining the coordinates of the nodes (stored in cord) elems=length(conn); % defining the no. of nodes in each cell (6)
133
%--------------------------------------------------------------------- Checking for 0 and 1 in the cell array and deleting that array %--------------------------------------------------------------------- icount=1; for i=1:length(conn), count=0; for j=1:6, if (and(conn(i,j)~=0,conn(i,j)~=1)) count=count+1; end if count==6, connect(icount,:)=conn(i,:); % connect consists of cells whose index are not 0 and 1 icount=icount+1; end end end % Assigning the x and y values as the first and second column of the cord array xo=cord(:,1); yo=cord(:,2); % To get the Actual cell size(8x8 in 1 inch) x1=2.98823*xo; y1=3.51932*yo; xo=x1; yo=y1; cord(:,1)=x1; cord(:,2)=y1; % Matrix z with xo and yo d=[1:length(xo)]; s=d'; zo=[s xo yo]; z=zo'; %--------------------------------------------------------------------- Creating the input file for writing the data %--------------------------------------------------------------------- fid = fopen('box1_nodep.py', 'wt'); fprintf(fid,'from abaqus import *\n'); fprintf(fid,'from abaqusConstants import *\n'); fprintf(fid,'myModel=mdb.Model(name=''Model-1'')\n'); fprintf(fid,'import part, material, section, assembly, step, interaction \n'); fprintf(fid,'import regionToolset, displayGroupMdbToolset as dgm, mesh, load, job \n'); % For ploting and calculating the area of cells for i=1:length(connect) for j=1:nen k=connect(i,j); xxo(j)=xo(k); yyo(j)=yo(k);
134
end xxo(nen+1)=xxo(1); yyo(nen+1)=yyo(1); hold on; plot(xxo,yyo,'-'); B(i)=polyarea(xxo,yyo); end % For Collecting values along xmin n=1; for i=1:length(cord) if and(cord(i,1)<3.05,cord(i,1)>0); if(cord(i,2)>2.04); x2(n)=cord(i,1); y2(n)=cord(i,2); n=n+1; end end end % plot(x2,y2,'+'); % For Collecting values along ymax n=1; for i=1:length(cord) if and(cord(i,2)>25.3,cord(i,1)<26.5); if (cord(i,1)>2); x3(n)=cord(i,1); y3(n)=cord(i,2); n=n+1; end end end % plot(x3,y3,'.'); % For Collecting values along xmax n=1; for i=1:length(cord) if and (cord(i,1)>25.3,cord(i,1)<27); if and(cord(i,2)<25,cord(i,2)>1); x4(n)=cord(i,1); y4(n)=cord(i,2); n=n+1; end end end % plot(x4,y4,'+'); % For Collecting values along ymin n=1; for i=1:length(cord) if and (cord(i,2)>1,cord(i,2)<2.1); if (cord(i,1)>2.8);
135
x5(n)=cord(i,1); y5(n)=cord(i,2); n=n+1; end end end %plot(x5,y5); % For defining xmin values m2=[x2; y2]; m2= m2'; m21=sortrows(m2,2); mx2=m21(:,1); my2=m21(:,2); plot(mx2,my2); hold on; %For defining ymax values m3=[x3;y3]; m3=m3'; m31 = sortrows(m3,1); mx3=m31(:,1); my3=m31(:,2); plot(mx3,my3); %For defining xmax values m4=[x4;y4]; m4=m4'; m41 = sortrows(m4,2); mx4=m41(:,1); my4=m41(:,2); plot(mx4,my4); %For defining ymax values m5=[x5;y5]; m5=m5'; m51 = sortrows(m5,1); mx5=m51(:,1); my5=m51(:,2); plot(mx5,my5); % Scaling the values xmin=min(x1); xmax=max(x1); ymin=min(y1); ymax=max(y1); xint=(xmax-xmin)/10; yint=(ymax-ymin)/10; xl=xmin-xint; xu=xmax+xint; yl=ymin-yint; yu=ymax+yint; axis equal; axis([xl xu yl yu]); % To create the inner cell for i=1:length(connect) for j=1:6,
136
xs(i,j) = cord(connect(i,j),1); ys(i,j) = cord(connect(i,j),2); end for j=1:6 xavg=mean(xs(i,:)); yavg=mean(ys(i,:)); xn(i,j) = xs(i,j)-xavg; yn(i,j) = ys(i,j)-yavg; xn1(i,j) = xn(i,j).*0.95; yn1(i,j) = yn(i,j).*0.95; xn2(i,j) = xn1(i,j)+xavg; yn2(i,j) = yn1(i,j)+yavg; end end for i=1:length(connect) for j=1:nen xxo1(j)=xn2(i,j); yyo1(j)=yn2(i,j); end xxo1(nen+1)=xxo1(1); yyo1(nen+1)=yyo1(1); hold on; plot(xxo1,yyo1,'-'); A(i)=polyarea(xxo1,yyo1); end %--------------------------------------------------------------------- Writing the data for ABAQUS input file %--------------------------------------------------------------------- k=1000; % For reading the points of the lines for i=1:length(xn2), k=k+1; fprintf(fid,'mySketch%d = myModel.Sketch (name=''HexShape%d'',sheetSize=200)\n',k,k); for j=1:6, if (j~=6) fprintf(fid, 'mySketch%d.Line(point1=( %6f, %6f),point2=( %6f, %6f ))\n',k, xn2(i,j), yn2(i,j), xn2(i,j+1), yn2(i,j+1)); else fprintf(fid, 'mySketch%d.Line(point1=( %6f, %6f),point2=( %6f, %6f ))\n',k, xn2(i,j), yn2(i,j), xn2(i,1), yn2(i,1)); end end % For defining Areas for the cells fprintf(fid,'myHex%d = myModel.Part(name=''h%d'',dimensionality=TWO_D_PLANAR,\n',k,k); fprintf(fid,'type=DEFORMABLE_BODY)\n'); fprintf(fid,'myHex%d.BaseShell(sketch=mySketch%d)\n',k,k); end
137
% Define remaining area % To define the area of the cells k=k+1; fprintf(fid,'mySketch%d = myModel.Sketch(name=''HexShape%d'',sheetSize=200.)\n',k,k); for i=1:length(xn2), for j=1:6, if (j~=6) fprintf(fid, 'mySketch%d.Line(point1=( %6f, %6f),point2=( %6f, %6f ))\n',k, xn2(i,j), yn2(i,j), xn2(i,j+1), yn2(i,j+1)); else fprintf(fid, 'mySketch%d.Line(point1=( %6f, %6f),point2=( %6f, %6f ))\n',k, xn2(i,j), yn2(i,j), xn2(i,1), yn2(i,1)); end end end % For defining the boundary and the area of inner cells for i=1:length(mx2) j=1; if (i<length(mx2)) fprintf(fid, 'mySketch%d.Line(point1=( %6f, %6f),point2=( %6f, %6f ))\n',k, mx2(i,j), my2(i,j), mx2(i+1,j), my2(i+1,j)); else if (i==length(mx2)) end end end for i=1:length(mx3) j=1; if (i<length(mx3)) fprintf(fid, 'mySketch%d.Line(point1=( %6f, %6f),point2=( %6f, %6f ))\n',k, mx3(i,j), my3(i,j), mx3(i+1,j), my3(i+1,j)); else if (i==length(mx3)) end end end for i=1:length(mx4) j=1; if (i<length(mx4)) fprintf(fid, 'mySketch%d.Line(point1=( %6f, %6f),point2=( %6f, %6f ))\n',k, mx4(i,j), my4(i,j), mx4(i+1,j), my4(i+1,j)); else if (i==length(mx4)) end end end for i=1:length(mx5) j=1; if (i<length(mx5)) fprintf(fid, 'mySketch%d.Line(point1=( %6f, %6f),point2=( %6f, %6f ))\n',k, mx5(i,j), my5(i,j), mx5(i+1,j), my5(i+1,j)); else if (i==length(mx5)) end end end
138
fprintf(fid,'myHex%d = myModel.Part( name=''h%d'',dimensionality=TWO_D_PLANAR,\n',k,k); fprintf(fid,' type=DEFORMABLE_BODY)\n'); fprintf(fid,'myHex%d.BaseShell(sketch=mySketch%d)\n',k,k); % For reading the points of the lines of one cell(outer cell) for i=1, k=k+1; fprintf(fid,'mySketch%d = myModel.Sketch(name=''HexShape%d'',sheetSize=200.)\n',k,k); for j=1:6, if (j~=6) fprintf(fid, 'mySketch%d.Line(point1=( %6f, %6f),point2=( %6f, %6f ))\n',k, cord(connect(i,j),1), cord(connect(i,j),2), cord(connect(i,j+1),1), cord(connect(i,j+1),2)); else fprintf(fid, 'mySketch%d.Line(point1=( %6f, %6f),point2=( %6f, %6f ))\n',k, cord(connect(i,j),1), cord(connect(i,j),2), cord(connect(i,1),1), cord(connect(i,1),2)); end end % For defining Areas for the cell fprintf(fid,'myHex%d = myModel.Part(name=''h%d'',dimensionality=TWO_D_PLANAR,\n',k,k); fprintf(fid,' type=DEFORMABLE_BODY)\n'); fprintf(fid,'myHex%d.BaseShell(sketch=mySketch%d)\n',k,k); end % To define the inner and outer cell as a set % For reading the points of the lines of one cell (outer cell) for i=1, k=k+1; fprintf(fid,'mySketch%d = myModel.Sketch(name=''HexShape%d'',sheetSize=200.)\n',k,k); for j=1:6, if (j~=6) fprintf(fid, 'mySketch%d.Line(point1=( %6f, %6f),point2=( %6f, %6f ))\n',k, cord(connect(i,j),1), cord(connect(i,j),2), cord(connect(i,j+1),1), cord(connect(i,j+1),2)); else fprintf(fid, 'mySketch%d.Line(point1=( %6f, %6f),point2=( %6f, %6f ))\n',k, cord(connect(i,j),1), cord(connect(i,j),2), cord(connect(i,1),1), cord(connect(i,1),2)); end end end %For reading the points of the lines of one cell(inner cell) for i=1, for j=1:6, if (j~=6) fprintf(fid, 'mySketch%d.Line(point1=( %6f, %6f),point2=( %6f, %6f ))\n',k, xn2(i,j), yn2(i,j), xn2(i,j+1), yn2(i,j+1)); else
139
fprintf(fid, 'mySketch%d.Line(point1=( %6f, %6f),point2=( %6f, %6f ))\n',k, xn2(i,j), yn2(i,j), xn2(i,1), yn2(i,1)); end end end % For Assembly fprintf(fid,'a1 = mdb.models[''Model-1''].rootAssembly\n'); fprintf(fid,'a1.DatumCsysByDefault(CARTESIAN)\n'); for i=1001:k fprintf(fid,'a1 = mdb.models[''Model-1''].rootAssembly \n'); fprintf(fid,'p = mdb.models[''Model-1''].parts[''h%d'']\n',i); fprintf(fid,'a1.Instance(name=''h%d'', part=p, dependent=ON)\n',i); fprintf(fid,'a1.Instance(name=''h%d'', part=p)\n',i); end fprintf(fid,'session.viewports[''Viewport: 1''].setValues(displayedObject=a1)\n'); fclose(fid);
140
(2) This code is used to generate voronoi model %--------------------------------------------------------------------- %Program generates the voronoi model for 20x20 cell array %--------------------------------------------------------------------- clear all; close all; clc; %--------------------------------------------------------------------- This is to generate a hexagonal grid %--------------------------------------------------------------------- pos = hextop(20,20); pos1=pos'; x=pos1(:,1); % x-ccordinate of center points of cells y=pos1(:,2); % y-ccordinate of center points of cells figure(1); h=voronoi(x,y,[]); [vx,vy] = voronoi(x,y,[]); % Vertices of voronoi edges so that "plot(VX,VY,'-',X,Y,'.')" plots cell axis equal; [cord,c]=voronoin([x(:) y(:)]); conn=zeros(length(c),6); % assign zero to the unassigned Index for i=1:length(c), temp=c{i}; for j=1:length(c{i}) conn(i,j)=temp(j); end end close all; nen=6; nodes=length(cord); %defining the coordinates of the nodes (stored in cord) elems=length(conn); % defining the no. of nodes in each cell (6) %--------------------------------------------------------------------- Checking for 0 and 1 in the cell array and deleting that array %--------------------------------------------------------------------- icount=1; for i=1:length(conn), count=0; for j=1:6, if (and(conn(i,j)~=0,conn(i,j)~=1)) count=count+1; end if count==6, connect(icount,:)=conn(i,:); % connect consists of cells whose index are not 0 and 1 icount=icount+1; end end end
141
% Assigning the x and y values as the first and second column of the cord array xo=cord(:,1); yo=cord(:,2); % Matrix z with xo and yo d=[1:length(xo)]; s=d'; zo=[s xo yo]; z=zo'; %--------------------------------------------------------------------- Creating the input file for writing the data %--------------------------------------------------------------------- fid = fopen('connect_pert.py', 'wt'); fprintf(fid,'from abaqus import *\n'); fprintf(fid,'from abaqusConstants import *\n'); fprintf(fid,'myModel=mdb.Model(name=''Model-1'')\n'); %--------------------------------------------------------------------- To perturb the nodes %--------------------------------------------------------------------- rand('state',10); % use different states to get a unique random number set every time x7=rand(1,length(cord)); y7=rand(1,length(cord)); x8=x7*0.3; y8=y7*0.3; x8=x8'; y8=y8'; % Not perturbing the side nodes for i=1:length(cord) if (cord(i,2)<=0.5774) y9(i)=cord(i,2); x9(i)=cord(i,1); elseif or(cord(i,1)==0.5,cord(i,1)==1) x9(i)=cord(i,1); y9(i)=cord(i,2); elseif or(cord(i,1)==18.5,cord(i,1)==19) x9(i) = cord(i,1); y9(i)= cord(i,2); elseif (cord(i,2)>=15.8771) y9(i)= cord(i,2); x9(i)= cord(i,1); else x9(i)=x8(i)+xo(i); y9(i)=y8(i)+yo(i); end end
142
%---------------------------------------------------------------------To assign values after perturbation %--------------------------------------------------------------------- x9=x9'; y9=y9'; cord1(:,1)=x9; cord1(:,2)=y9; % For Collecting values along xmin n=1; for i=1:length(cord) if and(cord(i,1)<1.1,cord(i,1)>0); if(cord(i,2)>0.289); x2(n)=cord(i,1); y2(n)=cord(i,2); n=n+1; end end end % For Collecting values along ymax n=1; for i=1:length(cord) if and(cord(i,2)>15.80,cord(i,1)<18.6); if (cord(i,1)>0.8); x3(n)=cord(i,1); y3(n)=cord(i,2); n=n+1; end end end % For Collecting values along xmax n=1; for i=1:length(cord) if and (cord(i,1)>18,cord(i,1)<19.1); if and(cord(i,2)<16,cord(i,2)>0.29); x4(n)=cord(i,1); y4(n)=cord(i,2); n=n+1; end end end % For Collecting values along ymin n=1; for i=1:length(cord) if and (cord(i,2)>0.28,cord(i,2)<0.58); if (cord(i,1)>0.5); x5(n)=cord(i,1); y5(n)=cord(i,2); n=n+1; end end end
143
%For defining xmin values m2=[x2; y2]; m2= m2'; m21=sortrows(m2,2); mx2=m21(:,1); my2=m21(:,2); plot(mx2,my2); hold on; %For defining ymax values m3=[x3;y3]; m3=m3'; m31 = sortrows(m3,1); mx3=m31(:,1); my3=m31(:,2); plot(mx3,my3); %For defining xmax values m4=[x4;y4]; m4=m4'; m41 = sortrows(m4,2); mx4=m41(:,1); my4=m41(:,2); plot(mx4,my4); %For defining ymax values m5=[x5;y5]; m5=m5'; m51 = sortrows(m5,1); mx5=m51(:,1); my5=m51(:,2); plot(mx5,my5); % scaling the values xmin=min(x); xmax=max(x); ymin=min(y); ymax=max(y); xint=(xmax-xmin)/10; yint=(ymax-ymin)/10; xl=xmin-xint; xu=xmax+xint; yl=ymin-yint; yu=ymax+yint; axis equal; axis([xl xu yl yu]); %For perturbing the outer cells to get the inner area for i=1:length(connect) for j=1:6, xs(i,j) = cord1(connect(i,j),1); ys(i,j) = cord1(connect(i,j),2); end for j=1:6 xavg=mean(xs(i,:)); yavg=mean(ys(i,:)); xn(i,j) = xs(i,j)-xavg;
144
yn(i,j) = ys(i,j)-yavg; xn1(i,j) = xn(i,j).*0.93; yn1(i,j) = yn(i,j).*0.93; xn2(i,j) = xn1(i,j)+xavg; yn2(i,j) = yn1(i,j)+yavg; end end % Plotting the inner cells after creating the cells for i=1:length(connect) for j=1:nen xxo1(j)=xn2(i,j); yyo1(j)=yn2(i,j); end xxo1(nen+1)=xxo1(1); yyo1(nen+1)=yyo1(1); hold on; plot(xxo1,yyo1,'-'); A(i)=polyarea(xxo1,yyo1); end %--------------------------------------------------------------------- Writing the data for ABAQUS input file %--------------------------------------------------------------------- k=1000; % for reading the points of the lines for i=1:length(xn2), k=k+1; fprintf(fid,'mySketch%d = myModel.Sketch(name=''HexShape%d'',sheetSize=200.)\n',k,k); for j=1:6, if (j~=6) fprintf(fid, 'mySketch%d.Line(point1=( %6f, %6f),point2=( %6f, %6f ))\n',k, xn2(i,j), yn2(i,j), xn2(i,j+1), yn2(i,j+1)); else fprintf(fid, 'mySketch%d.Line(point1=( %6f, %6f),point2=( %6f, %6f ))\n',k, xn2(i,j), yn2(i,j), xn2(i,1), yn2(i,1)); end end % For defining Areas for the cells fprintf(fid,'myHex%d = myModel.Part(name=''h%d'',dimensionality=TWO_D_PLANAR,\n',k,k); fprintf(fid,' type=DEFORMABLE_BODY)\n'); fprintf(fid,'myHex%d.BaseShell(sketch=mySketch%d)\n',k,k); end % Define remaining area % To define the area of the cells k=k+1; fprintf(fid,'mySketch%d = myModel.Sketch(name=''HexShape%d'',sheetSize=200.)\n',k,k);
145
for i=1:length(xn2), for j=1:6, if (j~=6) fprintf(fid, 'mySketch%d.Line(point1=( %6f, %6f),point2=( %6f, %6f ))\n',k, xn2(i,j), yn2(i,j), xn2(i,j+1), yn2(i,j+1)); else fprintf(fid, 'mySketch%d.Line(point1=( %6f, %6f),point2=( %6f, %6f ))\n',k, xn2(i,j), yn2(i,j), xn2(i,1), yn2(i,1)); end end end % For defining the boundary and the area of inner cells for i=1:length(mx2) j=1; if (i<length(mx2)) fprintf(fid, 'mySketch%d.Line(point1=( %6f, %6f),point2=( %6f, %6f ))\n',k, mx2(i,j), my2(i,j), mx2(i+1,j), my2(i+1,j)); else if (i==length(mx2)) end end end for i=1:length(mx3) j=1; if (i<length(mx3)) fprintf(fid, 'mySketch%d.Line(point1=( %6f, %6f),point2=( %6f, %6f ))\n',k, mx3(i,j), my3(i,j), mx3(i+1,j), my3(i+1,j)); else if (i==length(mx3)) end end end for i=1:length(mx4) j=1; if (i<length(mx4)) fprintf(fid, 'mySketch%d.Line(point1=( %6f, %6f),point2=( %6f, %6f ))\n',k, mx4(i,j), my4(i,j), mx4(i+1,j), my4(i+1,j)); else if (i==length(mx4)) end end end for i=1:length(mx5) j=1; if (i<length(mx5)) fprintf(fid, 'mySketch%d.Line(point1=( %6f, %6f),point2=( %6f, %6f ))\n',k, mx5(i,j), my5(i,j), mx5(i+1,j), my5(i+1,j)); else if (i==length(mx5)) end end end
146
fprintf(fid,'myHex%d = myModel.Part(name=''h%d'',dimensionality=TWO_D_PLANAR,\n',k,k); fprintf(fid,' type=DEFORMABLE_BODY)\n'); fprintf(fid,'myHex%d.BaseShell(sketch=mySketch%d)\n',k,k); % For reading the points of the lines of one cell(outer cell) for i=1, k=k+1; fprintf(fid,'mySketch%d = myModel.Sketch(name=''HexShape%d'',sheetSize=200.)\n',k,k); for j=1:6, if (j~=6) fprintf(fid, 'mySketch%d.Line(point1=( %6f, %6f),point2=( %6f, %6f ))\n',k, cord(connect(i,j),1), cord(connect(i,j),2), cord(connect(i,j+1),1), cord(connect(i,j+1),2)); else fprintf(fid, 'mySketch%d.Line(point1=( %6f, %6f),point2=( %6f, %6f ))\n',k, cord(connect(i,j),1), cord(connect(i,j),2), cord(connect(i,1),1), cord(connect(i,1),2)); end end % For defining Areas for the cell fprintf(fid,'myHex%d = myModel.Part(name=''h%d'',dimensionality=TWO_D_PLANAR,\n',k,k); fprintf(fid,' type=DEFORMABLE_BODY)\n'); fprintf(fid,'myHex%d.BaseShell(sketch=mySketch%d)\n',k,k); end % For Assembly fprintf(fid,'a1 = mdb.models[''Model-1''].rootAssembly\n'); fprintf(fid,'a1.DatumCsysByDefault(CARTESIAN)\n'); for i=1001:k fprintf(fid,'a1 = mdb.models[''Model-1''].rootAssembly \n'); fprintf(fid,'p = mdb.models[''Model-1''].parts[''h%d'']\n',i); fprintf(fid,'a1.Instance(name=''h%d'', part=p, dependent=ON)\n',i); fprintf(fid,'a1.Instance(name=''h%d'', part=p)\n',i); end fprintf(fid,'session.viewports[''Viewport: 1''].setValues(displayedObject=a1)\n'); fclose(fid);