Compressive behaviour of dry joints in refractory ceramic masonry K. Andreev *1 , S. Sinnema 1 , A. Rekik 2 , S. Allaoui 2 , E. Blond 2 , A. Gasser 2 1 – Ceramics Research Centre, Tata Steel R&D, PO Box 10000, 1970CA IJmuiden, The Netherlands 2 – PRISME (EA 4229, University of Orléans), Polytech’Orléans, 8 rue Léonard de Vinci, 45072 Orléans Cedex 2, France * - Corresponding author – Kirill ANDREEV, T +31(0)251-491705, Fax +31(0)251-470489, [email protected]Keywords: Masonry, Dry joint behaviour, Optical measurements, Finite element modelling, Refractory materials, Thermo-mechanics Abstract To support optimisation of refractory masonry structures compressibility of dry joints of magnesia-carbon and magnesia-chromite bricks have been investigated. Laboratory scale tests and finite element modelling have been performed. Measurements done in wide temperature range have shown that the exponential form of the joint closure curve results from gradual closure of initially non parallel surfaces. The stress needed to close the joint was found to be proportional to the material stiffness. Temperature influences the joint closure by changing the stiffness of material and by reducing the initial joint gap due to thermal expansion. 1.0 Introduction Refractory ceramic linings of high temperature furnaces are often built with bricks. Brick chemical composition and geometry are selected regarding the service conditions and the lining structure [1]. Due to the conditions of constrained thermal expansion high compressive stresses often develop in the bricks [2]. In many furnaces, including the blast furnace and the converter of the steel industry, bricks are laid on a dry joint, without usage of mortar. Most investigations on the mechanics of masonry consider civil structures with mortared joints [3-5]. Behaviour of the dry joints, especially in the refractory masonry, is less investigated. It is known that under compression the stiffness of the refractory lining will decrease with increasing amount of joints [6]. At room temperature the dry joint closure has been measured for alumino-silicate refractory bricks. Optical technique was used for the purpose. The ability of the dry joint to reduce compressive stresses was attributed to imperfect initial contact due to the roughness of the brick faces [7]. The quantitative knowledge of joint effects is an essential design parameter. As an example one can regard the superposition of the stress reducing effect of the joint and of expansion release inserts. The latter are introduced in form of card-board plates in several joints of the masonry wall to allow free expansion when the card-board burns up [2]. If the combined effect of the joints and the inserts is too high the lining is not tight enough. In the cyclic operation combining regular heating and cooling, and in some cases featuring rotational movement, loose lining can lose its stability and collapse. On another hand, too tight lining may fail under high compressive stresses.
Transcript
Compressive behaviour of dry joints in refractory ceramic masonry
K. Andreev *1, S. Sinnema1, A. Rekik2, S. Allaoui2, E. Blond2, A. Gasser2
1 – Ceramics Research Centre, Tata Steel R&D, PO Box 10000, 1970CA IJmuiden, The Netherlands 2 – PRISME (EA 4229, University of Orléans), Polytech’Orléans, 8 rue Léonard de Vinci, 45072 Orléans Cedex 2, France * - Corresponding author – Kirill ANDREEV, T +31(0)251-491705, Fax +31(0)251-470489, [email protected] Keywords: Masonry, Dry joint behaviour, Optical measurements, Finite
element modelling, Refractory materials, Thermo-mechanics Abstract To support optimisation of refractory masonry structures compressibility of dry joints of magnesia-carbon and magnesia-chromite bricks have been investigated. Laboratory scale tests and finite element modelling have been performed. Measurements done in wide temperature range have shown that the exponential form of the joint closure curve results from gradual closure of initially non parallel surfaces. The stress needed to close the joint was found to be proportional to the material stiffness. Temperature influences the joint closure by changing the stiffness of material and by reducing the initial joint gap due to thermal expansion. 1.0 Introduction
Refractory ceramic linings of high temperature furnaces are often built with bricks. Brick chemical composition and geometry are selected regarding the service conditions and the lining structure [1]. Due to the conditions of constrained thermal expansion high compressive stresses often develop in the bricks [2]. In many furnaces, including the blast furnace and the converter of the steel industry, bricks are laid on a dry joint, without usage of mortar. Most investigations on the mechanics of masonry consider civil structures with mortared joints [3-5]. Behaviour of the dry joints, especially in the refractory masonry, is less investigated. It is known that under compression the stiffness of the refractory lining will decrease with increasing amount of joints [6]. At room temperature the dry joint closure has been measured for alumino-silicate refractory bricks. Optical technique was used for the purpose. The ability of the dry joint to reduce compressive stresses was attributed to imperfect initial contact due to the roughness of the brick faces [7]. The quantitative knowledge of joint effects is an essential design parameter. As an example one can regard the superposition of the stress reducing effect of the joint and of expansion release inserts. The latter are introduced in form of card-board plates in several joints of the masonry wall to allow free expansion when the card-board burns up [2]. If the combined effect of the joints and the inserts is too high the lining is not tight enough. In the cyclic operation combining regular heating and cooling, and in some cases featuring rotational movement, loose lining can lose its stability and collapse. On another hand, too tight lining may fail under high compressive stresses.
This paper investigates the compressive closure of dry joints in two classes of refractory bricks – magnesia carbon and magnesia chromite bricks. Regarding the service conditions of the bricks the measurements were performed in wide temperature range. The process of joint closure was measured indirectly by compressing samples with and without joints. At room temperature, also direct optical measurements were performed. FEM computer analysis was used to interpret the measurement results. The general aim of the investigation was to obtain data on the compressive joint closure behaviour to get a better insight into the masonry stress state and the joint condition during the service cycle of the furnace. 2.0 Analysed materials.
In this study two types of refractories that are most frequently used in the linings without mortar are investigated. Magnesia-Carbon bricks are predominantly used in converters and electric arc furnaces (fig. 1). Magnesia-chromite bricks, because of their high thermal shock resistance, are used in many applications, including vacuum degassers. The refractory bricks belong to the material class of heterogeneous disordered materials. Their microstructure and mechanical behaviour resemble those of civil concrete and geo-materials. Under compression the bricks show initial linear-elastic response followed by micro-crack formation and flattening of the stress-strain curve. The failure is often followed by strain-softening. The material stiffness and strength is strongly temperature dependant. At higher temperatures visco-plasticity dominates the material response to the compressive loads [2]. Commercially available bricks were used in the investigation (Table 1). The bricks are produced from natural raw materials. The microstructure of Magnesia-Carbon material consists of bigger grains (1-5 mm) of magnesia and graphite in the matrix of fine magnesia grains and pores. The bricks are pressed with liquid phenolic resin acting as a binding agent. The bricks are not fired. The resin transitions determine the material behaviour in the intermediate temperature range (fig. 2). At higher temperatures increased viscosity and re-crystallisation plays role [8-9]. In fig. 2 Young’s modulus is obtained from the compressive stress-strain curves between 30 and 70% of the material strength (maximal stress registered on the loading curve). In the magnesia-chromite bricks both bigger grains and the matrix are produced from chromite ore with addition of MgO [10]. The grains are produced by electrical melting of the ore. The bricks are pressed and sintered at
temperatures above 1500 C. The latter fact explains the absence of strong non-linear temperature effects (fig. 2). The reduced strength and stiffness seen at higher temperatures is due to the mis-match of thermal expansion and melting of low temperature phases, formed by silica and iron oxides. 3.0 Analysis methods and equipments.
The process of joint closure was measured indirectly by compressing in the universal testing frame samples with and without joints. In addition, direct
optical measurements were performed at room temperature to validate the results of the indirect method and to investigate the local behaviour of the dry joint. 3.1 Indirect method The universal mechanical test frame Zwick/Roell Z250 is used to perform the compressive tests. The Magnesia-Chromite samples were tested in the air. To prevent high temperature oxidation of Magnesia-Carbon samples, those were immersed during the test in a bath of coke particles. For high temperature tests
the heat-up rate is 5 C/min. The conditioning at the test temperature is 1 h. The furnace condition accuracy is +/- 0,5% of the current temperature. The compression is performed with constant displacement rate of 0.002 mm/sec. The used rates of heat-up and displacement represent average service conditions and are standard for high temperature tests of refractories [1]. Sample displacement during the test is measured by the machine cross head travel, corrected for the machine own displacements. The measurement results are validated by the finger extensometer measurements. The resolution of the
former and latter systems are +/- 0,5% of the displacement and 0,1 m, respectively. In the indirect method the compressibility of the joint is determined from the force-displacement curves of the whole sample (fig. 3). Two types of cylindrical samples are tested. The sample without the joint is a one piece sample with the height of 100 mm. The sample with the joint consists of two stacked pieces. The height of each piece is 50 mm. For all samples the diameter is 50 mm. The samples are drilled from industrial bricks with dimensions 700x100x120 mm3 and 250x150x80 mm3 for Magnesia-Carbon and Magnesia-Chromite, resp. The joint faces are formed by the original surfaces of the industrial bricks. Only brick surfaces orthogonal to the direction of the brick pressing are tested. The sample surfaces that contact the pistons of the testing machine are plan-parallel polished with the accuracy of +/- 0,05 mm. The polishing machine is Strassentest 305. The joint closure is calculated at a given stress level as the displacement difference between average curves representing samples with and without a joint (fig. 4):
intint
1
int
1
int
int
jowithoutjowith
n
i
jowithout
m
i
jowith
jon
d
m
d
d
(1)
The parameters m and n represent the number of tested samples. This formula is adapted for elastic linear materials, which is not completely the case here (in particular for bricks at high temperature). But some numerical simulations with elastic-plastic behaviour have shown that this formula gives a good approximation of the joint behaviour. It is also confirmed by the direct method measurement (see below). At least 3 tests are performed to obtain average force-displacement curves for each sample group. Higher joint displacements mean a more compactable joint.
3.2 Direct method Compression tests on two stacked Magnesia-Carbon bricks were performed at atmospheric conditions on a mechanical test frame Instron 4507 with a load cell of 200kN (fig.5). The load accuracy is about ±0.2% of the reached load. The samples are cut from industrial bricks to dimensions of 100x50x50 mm3 and the faces are not polished. The compression tests are performed with constant displacement rate of 0.02 mm/min. In order to avoid a tangential slip of the specimens, rubber layers have been inserted between the brick specimens and the compressive device parts (upper and lower). Digital Image Correlation (DIC) [11-12] is used to measure the displacements of the bricks and the dry joint. This method can determine the displacement and the strain of a specimen under load between two states by using images. For this it is necessary to take a picture of the initial state of the object to analyse and pictures of the deformed states. Here a CCD camera, with a resolution of 1380x1024 pixels, is used to take pictures. A digital image is essentially a two-dimensional array of intensity values which can be discretized into small subsets. Image correlation works by matching small square subsets of an undeformed image to locations in the image of the surface after deformation (fig. 6) by means of a series of mathematical mapping and cross correlation functions. For this technique to work well a grey scale random pattern is needed on the surface of the specimen. In our case, the natural pattern of the bricks is enough to produce a suitable pattern. To recognize this pattern mathematically, the intensity of each pixel in the reference and deformed images can be traced and the displacement vector can be determined. However, it would be extremely difficult to distinguish every single pixel on the image. Therefore, the ideal subset size should contain several clear features but it is often a compromise between resolution and accuracy. As a general rule, larger subset sizes will increase the accuracy whereas a smaller subset will increase the resolution but realistically the size of a subset is determined by the quality of the image and speckle pattern. The accuracy of the DIC reaches 0.01 pixels which represents in our case a resolution of 0.001 mm on the displacement. The interest of the DIC method is that it makes it possible to obtain the local material behaviour (fig. 5) which illustrates an example of a studied area. For this aim, a rectangular region of interest is selected on the specimen picture and divided into small subsets. In order to evaluate the joint behaviour, the grid must be put in place on the joint and must have only a small overlap onto the bricks. For that, the grid steps have been optimized before using the DIC analysis on joints. 4.0 Analysis results A good example of the joint closure curve obtained by indirect method is “the machined joint” curve (fig. 4.a). The curve has exponential form. In the beginning intensive joint displacements develop at relatively low stresses. The joint compacts and the contacting faces must be gradually approaching each other. With progressive loading, reaction to the compaction increases. At a certain stress level the joint appears to be closed completely as the closure
curve aligns itself parallel to the compressive stress axis. For the machined joint, the full closure is achieved with the joint displacement of little more than 0.04 mm. The machined joint was produced by plan parallel polishing not only the sample sides facing the pistons, but also those forming the test joint. The measured joint closure displacement agrees well with the polishing machine accuracy of 0.05 mm. The full closure of the joint has not been achieved for all test conditions. Both for MCh (Magnesia-Chromite) and for MaC (Magnesia-Carbon), the closure displacement of natural (not machined) joints at room temperature had to be obtained by extrapolation of the test curves. For both materials the full closure is expected to happen at joint compaction of approximately 0.3 mm. This happens under stresses that are approximately 70-80 % of the brick strength. Temperature seems to have strong influence on the joint closure. The heating-up increases the resistance to joint closure and reduces the full closure displacement. Thermal expansion is the most probable explanation of the effect. Thermal displacement corresponding to a specimen height of 100 mm
represents approximately 1 mm per 1000 C of temperature growth (fig. 2).
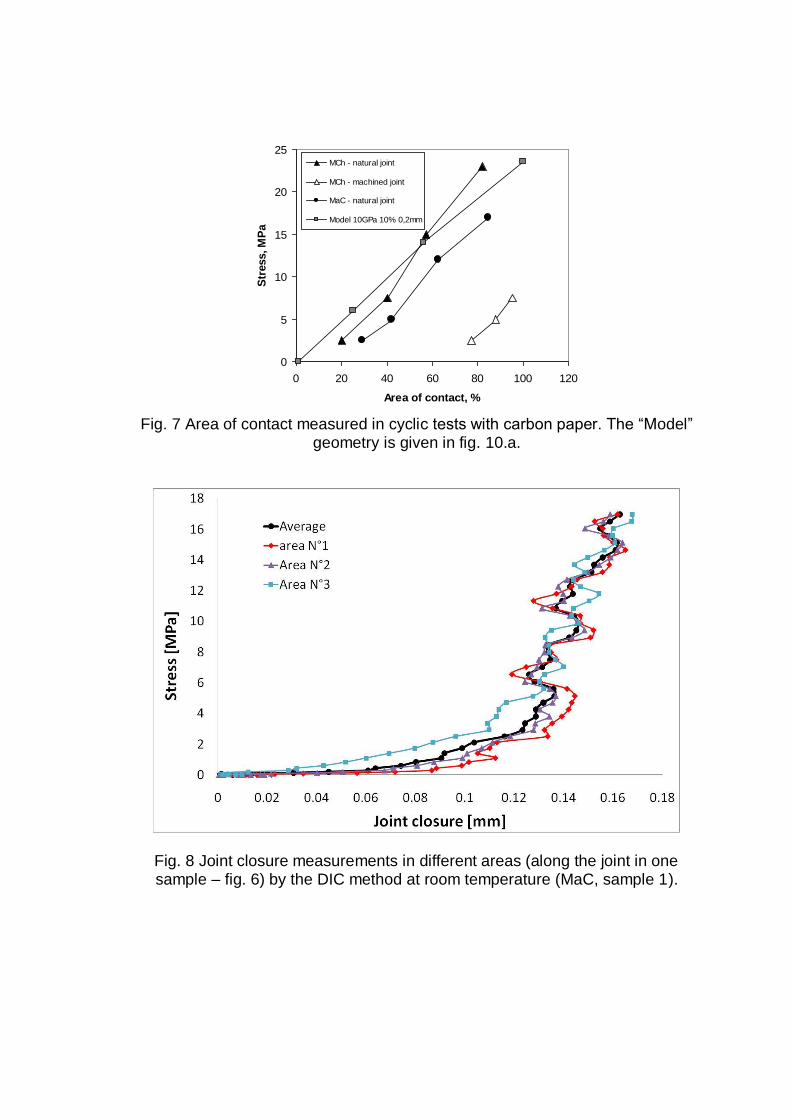
Even temperature increase of 300 C is enough to produce thermal displacement equal to the full joint closure displacement measured at room temperature. Of course not all of the sample thermal growth is directed into the joint, but even a part of it is able to significantly reduce the joint closure displacements. The “flattening” that is seen in some exponential curves at higher compressive stresses is difficult to explain by the joint closure alone. The curve “flattening” and it’s deviation from the exponential form happens at 1400 ºC when both materials have lowest stiffness and are known to develop some visco-plasticity. Uneven contact in the joints will result in areas of increased stresses. These can cause local material (plastic) failure, which can result in additional joint displacements and flattening of the curve. To confirm this mechanism and to get a more systematic overview of the joint closure process a series of FEM calculations were performed. The results are discussed in the next section. The observed joint closure displacements must be caused by imperfect contact in the joint at the beginning of the compression test. Bad contact may result from natural roughness of the contacting surfaces or from the fact that the contacting surfaces are not perfectly plan parallel. To see the reason of poor initial contact the compression tests were performed with carbon paper placed in the joint. The paper is used in dental practice to mark contacting surfaces. Repetitive loading-unloading cycles were performed. In each new loading higher compression was applied. After each unloading the markings left by the paper were registered (fig. 7). The first cycle performed to the stress of 3 MPa showed that the surfaces contact only at one side of the joint surface. The contact area was only 20 and 30 % of the total joint area for MaC and MCh samples, respectively. At the same time the sample with machined joint had initial contact area of some 80 %. Loading cycles caused gradual expansion of the contact surface. The experiment showed that the non-plan parallelism of the contacting surfaces is the main cause of the joint closure displacements.
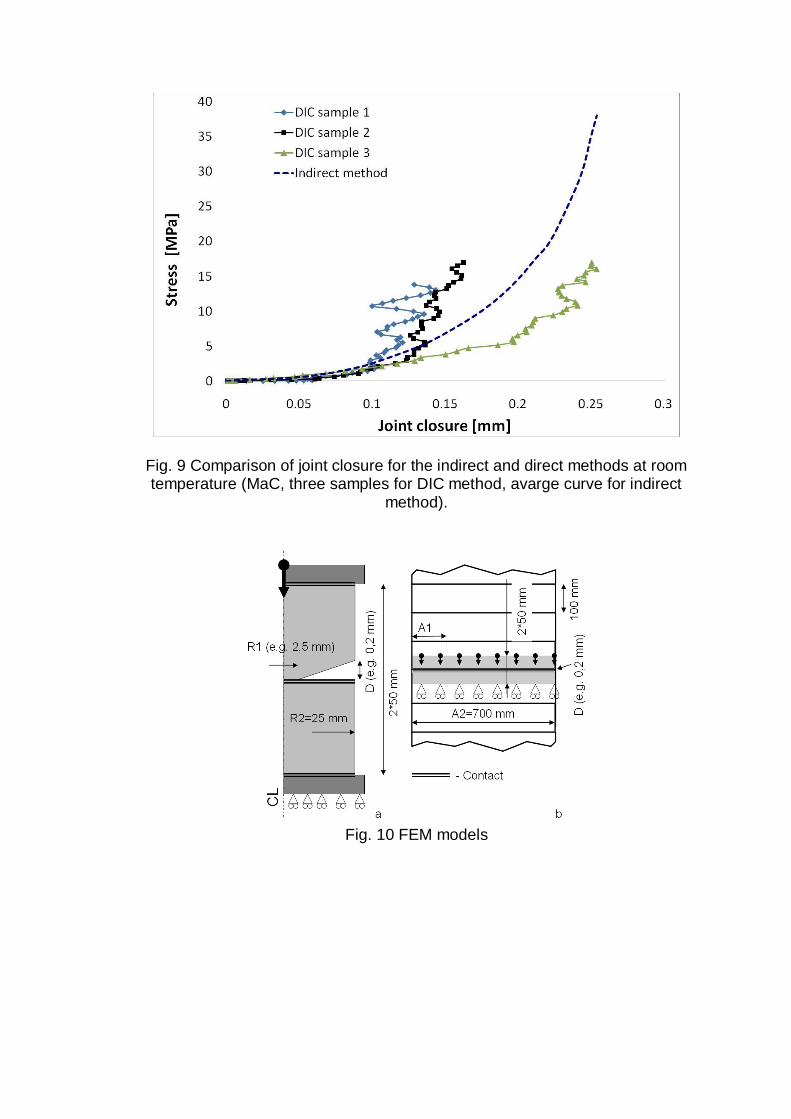
The influence of the roughness is negligible since the asperity size is much smaller than the joint closure displacements caused by imperfect brick shape. DIC analysis determines the local closure of the joint along the brick length. An example of three measurements taken at different locations of a MaC joint is presented in figure 8. We note that the measure can be different according to the place where it was made, but in this case the dispersion remains correct. The fluctuation of the obtained data is due to the pattern size which is function of the microstructure size of the Magnesia-Carbon material. Fig. 9 shows a comparison of the joint closure measurements obtained by direct and indirect methods. Note that for the direct method the results showed were obtained by making the average of the local measurements over the entire length of the joint. The two methods show a good result correlation. Due to roughness, shape variation and non parallelism of faces, the joint thickness is not constant. This phenomenon is highlighted by the local measurements obtained on three samples but which show a result dispersion which remains acceptable. 4.1 FEM Models FEM analysis was used to study the influence of the joint geometry and material stiffness on the process of joint closure. Commercially available software ANSYS [13] was used. Axi-symmetric model (fig. 10a) simulated the joint closure tests performed in the laboratory. The model was meshed with 8-node quadrilateral elements. The element size was 1 mm. Contact between different parts of the model was enabled by layers of linear contact elements (targets and contactors) introduced on the parts edges. The model featured parts of refractory material (light grey in fig. 10.a, 11.c) and parts simulating the pistons of the test machine (dark gray). The compression was modelled by displacing the top edge of the “upper piston”. The lower edge of the “lower piston” was fixed in the axial direction. The axis of axi-symmetry corresponded with the left edge of the model. This model cannot reproduce completely the progressive joint closure from one side to another observed in the tests because its closure goes from the centre to the edge. But this last phenomena can occur in the reality (due to geometrical distortions, the bricks may contact not only at the ends, but also in the centre). So this model can give information of the influence of the different parameters. The joint closure curve was obtained by indirect method from stress-displacement curves from numerical samples with and without the joint. In the numerical tests the values of the initial contact area (A) and of the initial joint gap (D) corresponded to those measured in the laboratory tests. In the axi-symmetric model the area of the initial contact was defined by the radius R1. In most of the numerical tests linear-elastic material behaviour was modelled. The Poisson’s ratio was 0.1 in all models. Stiffness of the elements simulating the pistons was 10 times higher than that of refractories elements. First of all, the numerical tests were used to confirm the hypothesis that the full joint closure occurs when the joint closure curve becomes parallel to the ordinate of the displacement-stress graphs. In fig. 7 and fig. 11a area of contact
and joint closure curves for the numerical sample of R1=10%, D=0.2mm and E=10 GPa are given. In fig. 11a, 100% of contact for “model” sample is reached at approximately 25 MPa. This corresponds to the stress level when the “linear-elastic” curve becomes plan-parallel to the ordinate in fig. 7. Young’s modulus of the material determines the stress when the joint is closed (fig. 11.a). The higher is the material stiffness the higher is the stress needed to close the joint. The joint closure displacement did not depend on the material stiffness. The relations between individual parameters of joint geometry and the closure displacement could be established (fig. 11.b). For samples with equal initial contact area, bigger joint gaps had higher values of the joint closure displacement. Increasing of the initial contact area reduced the joint closure distance. Samples of high initial contact area had stiffer joint closure curves, that is joint closure occurred at higher stresses. To investigate the “flattening” phenomenon of some joint displacement curves bi-linear kinematic hardening model with associated flow [13] was used. The von Mises failure stress was set as 45 MPa, which is approximately equal to the uniaxial compressive strength of material MaC at room temperature. The curve resulting from this numeric sample (marked as “elastic-plastic” in fig. 11.a) resembled the laboratory joint closure curves with curve “flattening”. At low joint closure displacements no plastic effects were seen in the area of the joint (fig. 11.c), and the curve of elastic-plastic material was identical to the linear elastic material curve (fig. 11.a d=0,05 mm). The curves start deviating at displacements above 0,007 mm, at the same moment (fig. 11.c d=0,12 mm) plastic strain was seen to develop at the contacting edges. The “flattening” of the joint closure curve indeed results from local failure of the material. The failure happens due to stress concentration in the areas near the closing joint. The joint closure displacement was found to be equal to the average initial joint thickness (fig. 12). The average joint thickness was calculated analytically from the initial joint geometry. For samples with various initial contact areas and initial joint gaps the average initial joint thickness (DD) was calculated as
21001
DADD
(2)
dzdrrDD
l R
Rr
.)2(0
2
1
/ 2
2R (3)
The formula (2) was used for square joint faces (fig. 10.b). The formula (3) was used for the cylindrical samples (fig. 10.a). In these formulas A is the area of initial contact in [%], D is the initial joint opening, R2 is sample radius, R1 is the radius of the initial contact area. The parameter l is the joint opening in different locations in the joint. 5.0 Joints in furnaces In the laboratory tests it was found that the non-plan parallelism of the contacting surfaces is the major source of the joint compressibility. The same effects will be taking place in the furnace linings. The bricks that the furnace linings are made of always have a degree of shape distortion. The distortions can take form of non-planar surfaces, banana shaped bricks and deviations
from the standard brick thickness. To up-scale the results obtained on the laboratory size samples FEM model representing converter bricks with a joint was created (fig. 10.b). In the figure the model is represented by the gray areas. It simulated contact between two symmetrical brick halves. The model was meshed with plane-strain 8-node quadrilateral elements; with the edge of 2 mm. Compression was simulated by displacing the nodes on the top edge of the upper brick half. Several numerical tests with various joint parameters (initial contact, gap width) were performed (e.g. fig. 11.a). The correlation between the joint closure displacement and the analytical average joint thickness DD was found to be the same for big bricks as for the laboratory scale samples (fig. 12). Due to this the estimation of the joint closure displacement in the furnace lining becomes relatively straight forward. For engineering calculations the average joint thickness can be obtained from the standards of the lining quality control. E.g., for the converter lining the joint gaps between the bricks are expected to be less than 0.5 mm. For more a sophisticated analysis one would need to account for the stress of joint closure and the temperature effects. As it seems from the above results the two latter effects are determined by a complex interaction between various geometrical parameters and the complex material behaviour. New advanced numerical algorithms are needed to enable the representation of such an interaction in an FEM model. The presence of the joint is able to significantly reduce the compressive stresses in the refractory brick (fig. 13). In the lining with 100 mm thick bricks presence of joints of 0.2 mm is able to reduce the compressive stresses by some 10 MPa. 6.0 Conclusions With the aim to increase the knowledge concerning the dry joint closing phenomenon at high temperature and to enrich the data available on this topic, the dry joint closure in refractory bricks under compression was investigated. The analysis was conducted using the laboratory scale samples and FEM models. Exponential joint closure curves were obtained for samples of two types of refractory bricks in the wide temperature range. To understand the shape of these curves and to study the influence of the joint geometry (initial contact area, initial joint gap) and the material stiffness, a finite element model of the joint was built. The gradual nature of the joint closure with growing closing force was found to be due to the closure of initially non-plan-parallel faces of the joint. The roughness of the brick surface is a second order parameter. The total joint closure displacement was found to be dependant to the initial joint geometry - joint gap and the area of the initial contact. A direct relation between the total joint displacement and an average joint thickness was found. The stress needed to close the joint was found to be proportional to the material stiffness. Modelling the brick material with elastic-plastic behaviour has allowed obtaining joint closure curves similar to laboratory tests with curve “flattening”. This result underlines the role played by the local material failure near the joint edge. Temperature influences the joint closure in two ways. Firstly, the temperature influences material stiffness. Secondly, thermal expansion seems to be responsible for lower joint closure displacements detected when high and room temperature test results were compared.
Regarding the complex nature of thermo-mechanical interactions between different factors of influence in the process of joint closure, new advanced numerical algorithms are needed to enable accurate representation of refractory masonry behaviour in a FEM model of a structure. To reach this goal, non linear homogenization techniques dedicated to such applications are being developed [7]. The results have practical importance for the brick shape quality control and will be used for development of refractory masonry structures of improved durability. Acknowledgments
The authors are thankful to Tata Steel and FIRE (Federation for International Refractory Research and Education) for the financial support of this work. We would also like to thank our colleague Dr. Doug Haynes for proofreading the manuscript. References
[1] Shinohara Y. Refractories handbook. Tokyo: Japanese Association of Refractories; 1998. [2] Schacht Ch. Refractory linings: thermo-mechanical design and applications. New York: Marcel Dekker Inc; 1995. [3] Mebarki A, Bui QH, Ami Saada R. A simplified mechanical model to assess the bearing capacity of masonry walls: Theory and experimental validation. J Construction and Building Materials Feb 2009; Vol 23, Issue 2:1109-17. [4] Vasconcelos G, Lourenço PB. Experimental characterization of stone masonry in shear and compression. J Construction and Building Materials Nov 2009; Vol. 23, Issue 11:3337-45. [5] Castro Olivera DV. Experimental and Numerical analysis of blocky masonry structures under cyclic loading. PhD thesis, University of Minho; 2003. [6] Nguyen TMH, Blond E, Gasser A, Prietl T. Mechanical homogenisation of masonry wall without mortar. European Journal of Mechanics - A/Solids May-June 2009; Vol 28, Issue 3:535-44. [7] Gasser A, Terny-Rebeyrotte K, Boisse P. Modelling of joint effects on refractory lining behaviour. J. Materials: Design and Applications, Part L, 2004, Vol. 218, Issue 1: 19-28. [8] Baudson H, Debucquoy F, Huger M. Ultrasonic Measurements of Young’s Modulus MgO-C Refractories at High Temperature. J of E Cer Soc 1999; 19:1895-901. [9] De la Torre AG, Valle FJ, De Aza AH. Direct mineralogical composition of a MgO-C refractory material obtained by Rietveld methodology. J of E Cer Soc 2006; 26:2587-92. [10] Gotod K, Lee WE. The “Direct bond” in magnesia chromite and magnesia spinel refractories. J of Am Cer Soc July 1995; Vol. 78, Issue 7:1753-60. [11] Sutton, M., Wolters, W. J., Peters, W. H., Ranson, W. F. and McNeill, S. R. Determination of displacements using an improved digital correlation method, Image & Vision Computing, 1983, Vol. 1-3: 133-139. [12] Vacher, P., Dumoulin, S. and Arrieux, R. Determination of the forming limit diagram from local measurement using digital image analysis., I.J. Forming Processes, 1999, Vol. 2, Issue 3-4: 395-408. [13] ANSYS 11.0, User’s manual.
> Dry joint closure in magnesia-carbon and magnesia-chromite refractory masonry. > FEM models, direct optical and indirect compressive test in wide temperature range. > Exponential joint closure curves due to non-parallelism of the joint faces. > Joint closure displacements are reduced with increasing temperature. > Direct relation between total joint displacement and average joint width.
Fig. 1 Electric arc furnace to melt steel scrap, the wall is lined with numerous Magnesia-Carbon bricks. Fig. 2 Dilatometry and static compressive E-modulus as a function of temperature. Table 1 Chemical composition and basic physical properties of the materials used for the investigation.
Material MaC MCh
Type Magnesia-Carbon
Magnesia-Chromite
Density, g/cm3 2.93 3.35 Open porosity, % 10 12 MgO, % 98 52 Cr2O3, % - 27 CaO, % 1 - Fe2O3, % 0.5 10 Al2O3, % - 10 SiO2, % 0.5 1 Total C, % 14 - Fig. 3 Compressive stress-strain curves of MaC used to calculate joint closure – room temperature. Fig. 4 Joint closure curves calculated by indirect method (a) MCh, (b) MaC. “MJ” – machined joint. Fig. 5 Optical measurement of the joint closure during a two brick compression test (MaC).
Fig. 6 Illustration of the DIC principle Fig. 7 Area of contact measured in cyclic tests with carbon paper. The “Model” geometry is given in fig. 10.a. “Mod” – model. Fig. 8 Joint closure measurements in different areas (along the joint in one sample – fig. 6) by the DIC method at room temperature (MaC, sample 1).
Fig. 9 Comparison of joint closure for the indirect and direct methods at room temperature (MaC, three samples for DIC method, average curve for indirect method). Fig. 10 FEM models Fig. 11 Joint closure results obtained by FEM models (a) effect of material
behaviour for model with initial contact area R1=0.1*R2, initial gap D=0.2 mm, (b) effect of the joint geometry - linear elastic behaviour stiffness is E = 10 GPa, (c) plastic strains in the sample “10 GPa elastic-plastic”. All numerical samples have the geometry shown in fig. 10a. Only the “0.7m brick” has the geometry of fig. 10b. Fig. 12 Correlation between the average joint thicknesses calculated analytically and the joint closure displacements obtained from FEM models. Fig. 13 Effect of compressive joint closure on the compressive stresses in the lining predicted by FEM model of a brick, A=10%, D=0.2mm, the model is shown in fig. 10b.
Fig. 1 Electric arc furnace to melt steel scrap, the wall is lined with MgO-C
bricks. (or Fig. 1 Vacuum de-gasser used for secondary steel making processes.)
0
5
10
15
20
25
30
35
0 250 500 750 1000 1250 1500
Temperature [*C]
Yo
un
g's
mo
du
lus [
GP
a]
0
0,2
0,4
0,6
0,8
1
1,2
1,4
1,6
1,8
2
Dilata
tio
n, [%
]
MCh
MaC
dil MCh
dil MaC
Fig. 2 Dilatometry and static compressive E-modulus as a function of
temperature.
Table 1 Chemical composition and basic physical properties of the materials used for the investigation.
Material MaC MCh
Type Magnesia-Carbon Magnesia-Chromite
Density, g/cm3 2.93 3.35
Open porosity, % 10 12
MgO, % 98 52
Cr2O3, % - 27
CaO, % 1 -
Fe2O3, % 0.5 10
Al2O3, % - 10
SiO2, % 0.5 1
Total C, % 14 -
0
5
10
15
20
25
30
35
40
45
0,000 0,001 0,002 0,003 0,004 0,005 0,006 0,007
Strain [-]
Str
es
s [
MP
a]
Samples w ithout joint
Samples w ith joint
Fig. 3 Compressive stress-strain curves of MaC used to calculate joint closure
– room temperature.
0
5
10
15
20
25
30
35
40
0 0,05 0,1 0,15 0,2 0,25 0,3 0,35 0,4 0,45 0,5
Joint closure [mm]
Str
es
s [
MP
a]
20*C
300*C
1200*C
1400*C
20 *C machined joint
a
0
5
10
15
20
25
30
35
40
0 0,05 0,1 0,15 0,2 0,25 0,3 0,35 0,4
Joint closure, [mm]
Str
ess, [M
pa]
20*C
300*C
1250*C
1400*C
b Fig. 4 Joint closure curves calculated by indirect method (a) MCh, (b) MaC
Dry joint
Bricks Studied area
Fig. 5 Optical measurement of the joint closure during a two brick compression test (MaC).
State 1 Initial state State 2
Fig. 6 Illustration of the DIC principle
0
5
10
15
20
25
0 20 40 60 80 100 120
Area of contact, %
Str
ess, M
Pa
MCh - natural joint
MCh - machined joint
MaC - natural joint
Model 10GPa 10% 0,2mm
Fig. 7 Area of contact measured in cyclic tests with carbon paper. The “Model”
geometry is given in fig. 10.a.
Fig. 8 Joint closure measurements in different areas (along the joint in one sample – fig. 6) by the DIC method at room temperature (MaC, sample 1).
Fig. 9 Comparison of joint closure for the indirect and direct methods at room temperature (MaC, three samples for DIC method, avarge curve for indirect
method).
Fig. 10 FEM models
0
10
20
30
40
50
60
0,00 0,05 0,10 0,15 0,20 0,25
Joint closure [mm]
Str
es
s [
MP
a]
25 GPa lin-elastic
17 GPa lin-elstic
10 GPa lin-elastic
10 GP elastic-plastic
10 GPa 0,7m long brick
a
0
5
10
15
20
25
30
35
40
45
50
0,00 0,05 0,10 0,15 0,20 0,25 0,30
Joint closure [mm]
Str
es
s [
MP
a]
0,2mm 60%
0,2mm 30%
0,2mm 10%
0,3mm 10%
0,4 mm 10%
b Fig. 11 Joint closure curves obtained from FEM models (a) effect of material
behaviour for model with initial contact area R1=10%, initial gap D=0.2 mm, (b) effect of the joint geometry - linear elastic behaviour stiffness is E = 10 GPa. All numerical samples have the geometry shown in fig. 10a. Only the “0.7m long
brick” has the geometry of fig. 10b.
0,00
0,05
0,10
0,15
0,20
0,25
0,30
0,00 0,05 0,10 0,15 0,20 0,25 0,30
Analythical joint [mm]
Jo
int
dis
pla
ce
me
nt
[mm
]
Lab sample
Converter brick
Fig. 12 Correlation between the average joint thickness calculated analytically
and the joint closure displacements obtained from FEM models.
0
10
20
30
40
50
60
70
0,00 0,10 0,20 0,30 0,40 0,50 0,60 0,70
Strain, [%]
Axia
l co
mp
ressiv
e s
tress, [M
Pa]
10% 0,2mm
100% initial contact
Fig. 13 Effect of compressive joint closure on the stresses in the lining
predicted by FEM model of a brick, A=10%, D=0.2mm, the model is shown in fig. 10b.


![Compressive strength of masonry constructed with high ... · walls (ABNT NBR 8949[5]) or be estimated as 70% of the characteristic strength of the masonry prism, f pk, or 85% of the](https://static.documents.pub/doc/80x56/5be746d109d3f27e3c8c2f94/compressive-strength-of-masonry-constructed-with-high-walls-abnt-nbr-89495.jpg)


