54
Computation vis-à-vis Physics: A Framework VIA 2020 Forum, July 10 & 11, 2008 Ralph K. Cavin, III, Victor V. Zhirnov & Sadasivan Shankar (Intel)
Computation vis-à-vis Physics: A Framework
VIA 2020 Forum, July 10 & 11, 2008Ralph K. Cavin, III, Victor V. Zhirnov & Sadasivan Shankar (Intel)
2
Outline
Relations between maximum computational performance and device physics
Correlations between computer performance and technology capabilityVon Neumann threshold
Binary switch abstractionGeneric floorplan and energeticsConnected Binary SwitchesFloorspace, Timing and Energy for Communication between Binary Switches
‘Minimal’ Turing MachineSystem scaling limitsEnergetics and efficiency
3
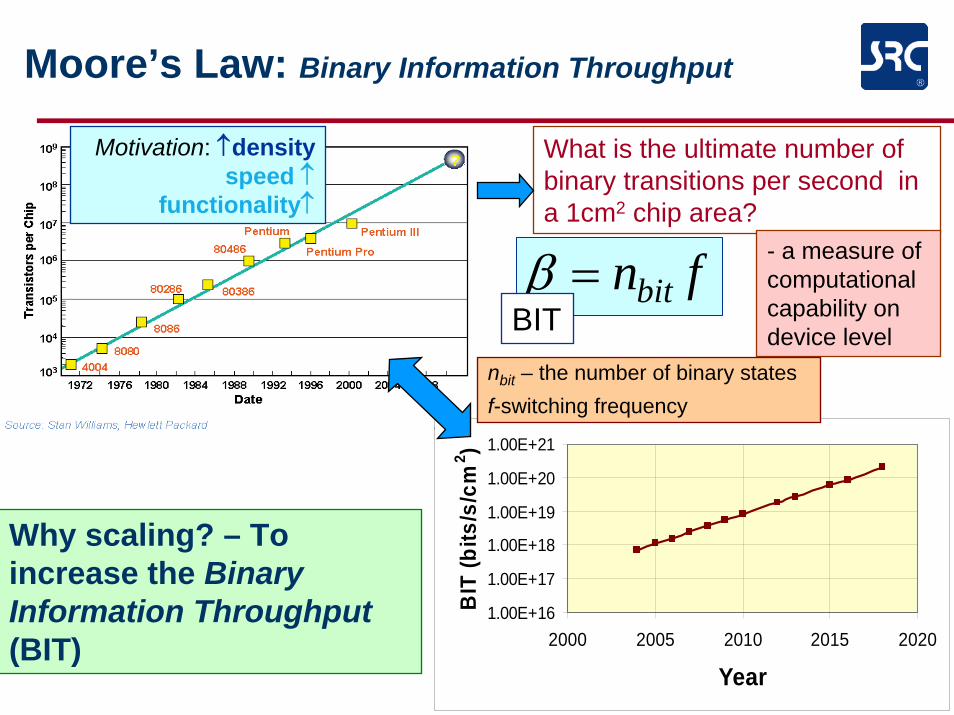
Moore’s Law: Binary Information Throughput
Motivation: ↑densityspeed ↑
functionality↑
What is the ultimate number of binary transitions per second in a 1cm2 chip area?
- a measure of computational capability on device level
Why scaling? – To increase the Binary Information Throughput(BIT)
1.00E+16
1.00E+17
1.00E+18
1.00E+19
1.00E+20
1.00E+21
2000 2005 2010 2015 2020
Year
BIT
(bits
/s/c
m2 )
fnbit=β
nbit – the number of binary states f-switching frequency
BIT
4
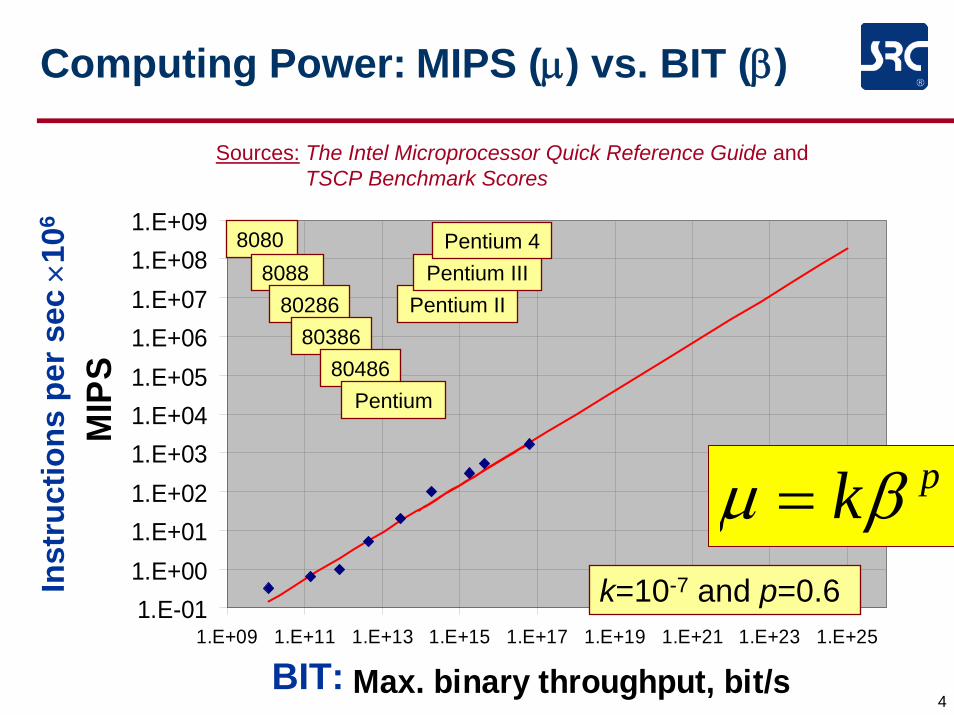
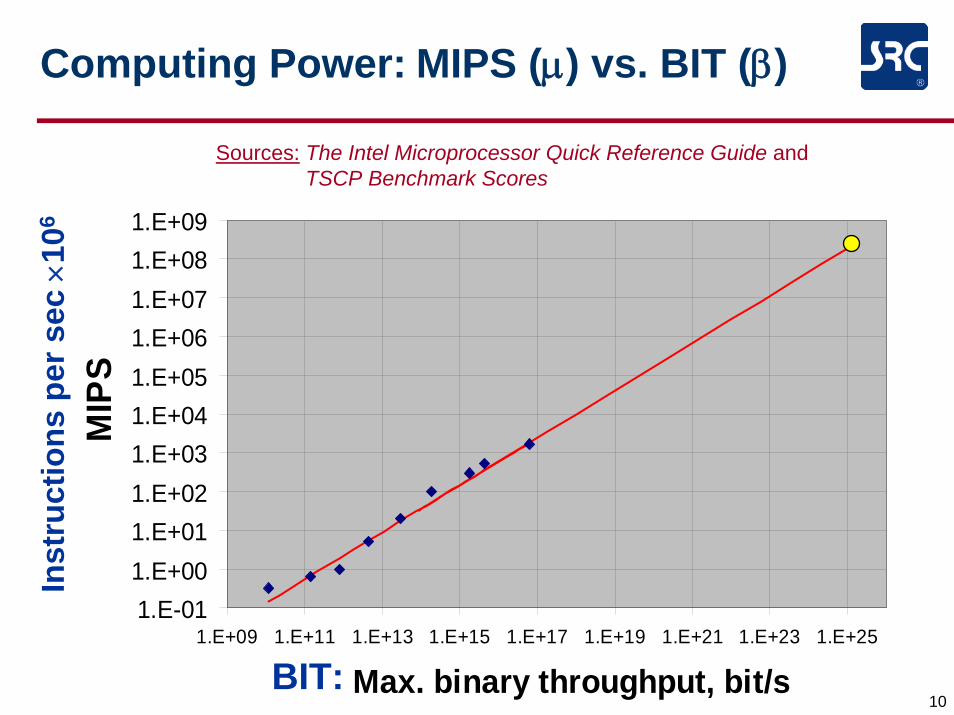
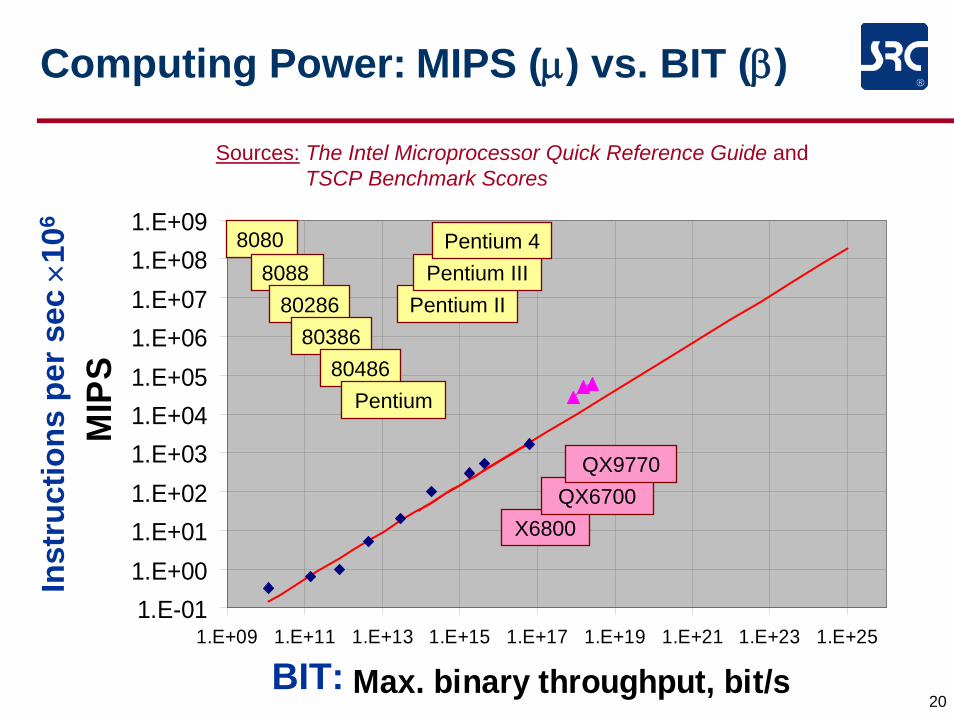
Computing Power: MIPS (μ) vs. BIT (β)
1.E-011.E+001.E+011.E+021.E+031.E+041.E+051.E+061.E+071.E+081.E+09
1.E+09 1.E+11 1.E+13 1.E+15 1.E+17 1.E+19 1.E+21 1.E+23 1.E+25
Max. binary throughput, bit/s
MIP
SSources: The Intel Microprocessor Quick Reference Guide and
TSCP Benchmark Scores
Inst
ruct
ions
per
sec
×10
6
BIT:
80808088
8028680386
80486Pentium
Pentium IIPentium III
Pentium 4
pkμ β=k=10-7 and p=0.6
5
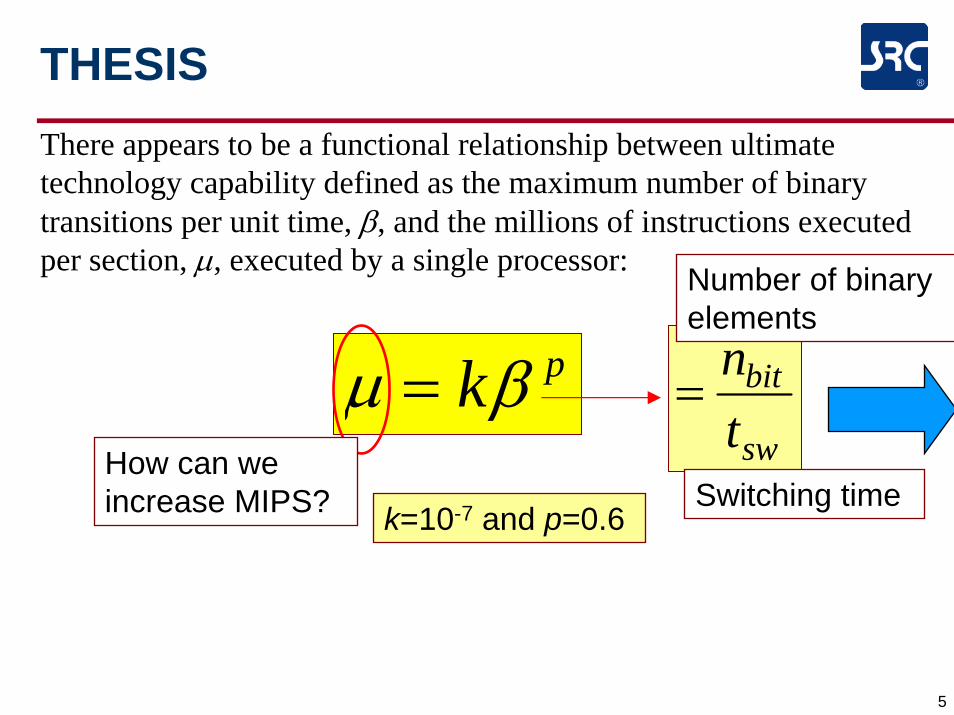
THESISThere appears to be a functional relationship between ultimate technology capability defined as the maximum number of binary transitions per unit time, β, and the millions of instructions executed per section, μ, executed by a single processor:
pkμ β=
k=10-7 and p=0.6
How can we increase MIPS?
sw
bit
tn
=
Number of binary elements
Switching time
6
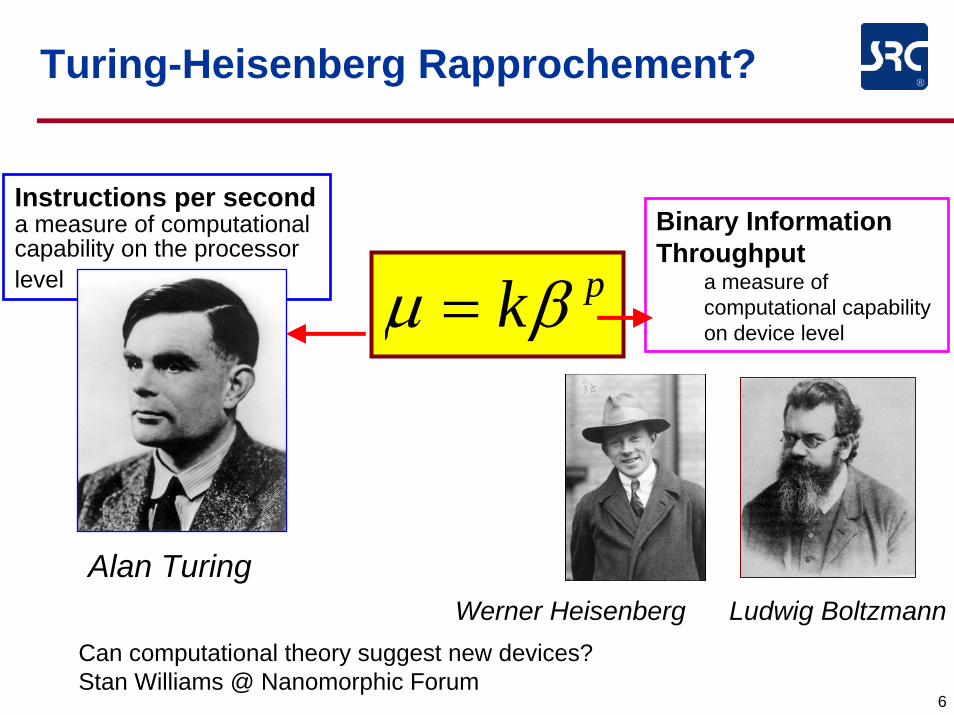
Turing-Heisenberg Rapprochement?
pkμ β=Binary Information Throughput
a measure of computational capability on device level
Instructions per seconda measure of computational capability on the processor level
Alan TuringWerner Heisenberg Ludwig Boltzmann
Can computational theory suggest new devices? Stan Williams @ Nanomorphic Forum
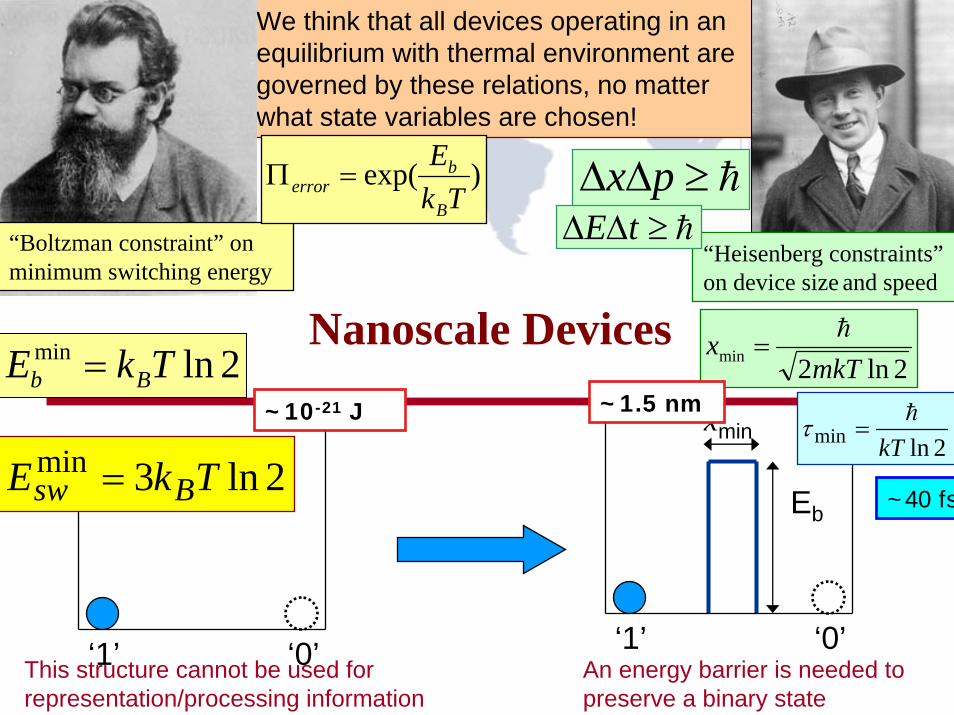
Nanoscale Devices
‘1’ ‘0’ ‘1’ ‘0’
Eb
This structure cannot be used for representation/processing information
An energy barrier is needed to preserve a binary state
xmin
We think that all devices operating in an equilibrium with thermal environment are governed by these relations, no matter what state variables are chosen!
2lnmin kTh
=τ
“Boltzman constraint” on minimum switching energy
2lnmin TkE Bb =
“Heisenberg constraints”on device size and speed
2ln2min mkTx h
=
h≥ΔΔ px)exp(Tk
E
B
berror =Π
h≥ΔΔ tE
2ln3min TkE Bsw =
~10-21 J ~1.5 nm
~40 fs
8
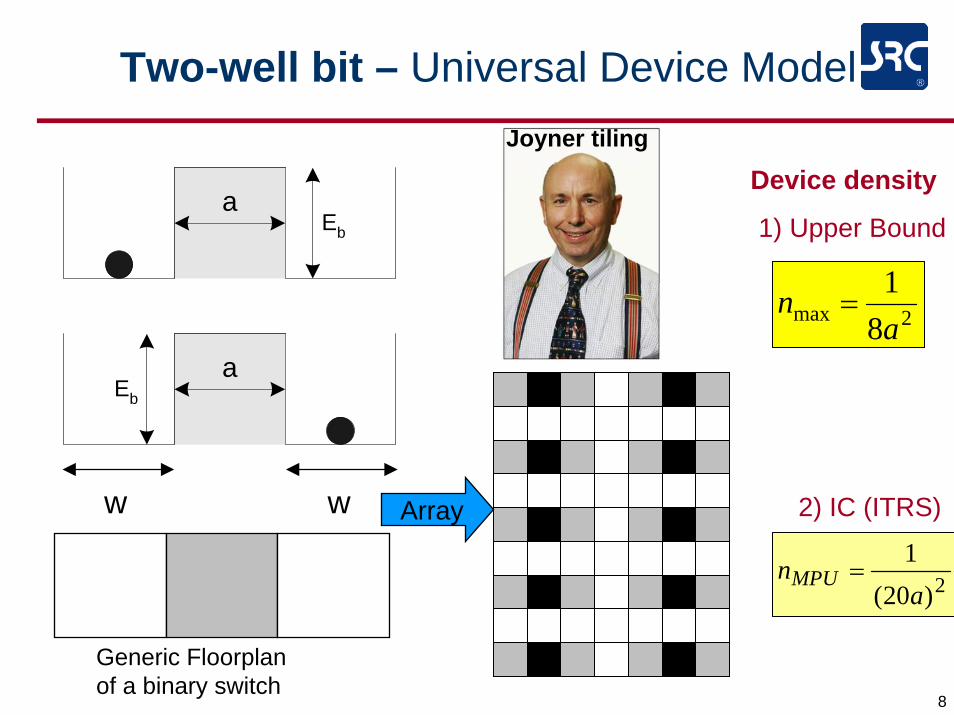
Two-well bit – Universal Device Model
a
a
Eb
Eb
w w
Generic Floorplanof a binary switch
Array
2max 81a
n =
2)20(1a
nMPU =
Device density
1) Upper Bound
2) IC (ITRS)
Joyner tiling
9
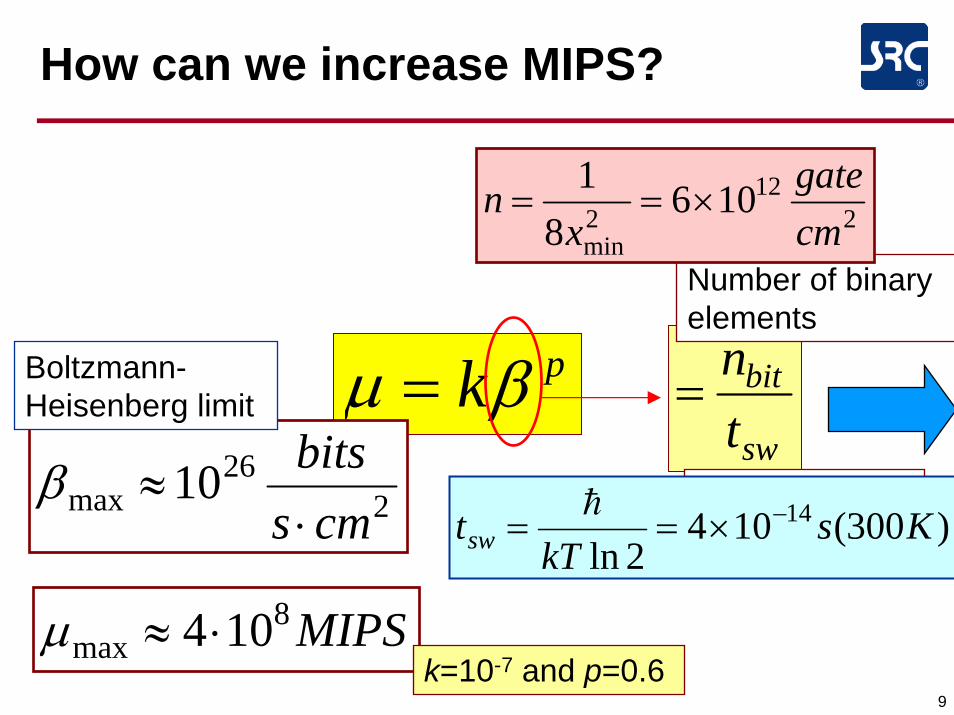
How can we increase MIPS?
pkμ β=sw
bit
tn
=
Number of binary elements
Switching time
212
2min
1068
1cmgate
xn ×==
)300(1042ln
14 KskT
tsw−×==
h226
max 10cms
bits⋅
≈β
MIPS8max 104 ⋅≈μ
Boltzmann-Heisenberg limit
k=10-7 and p=0.6
10
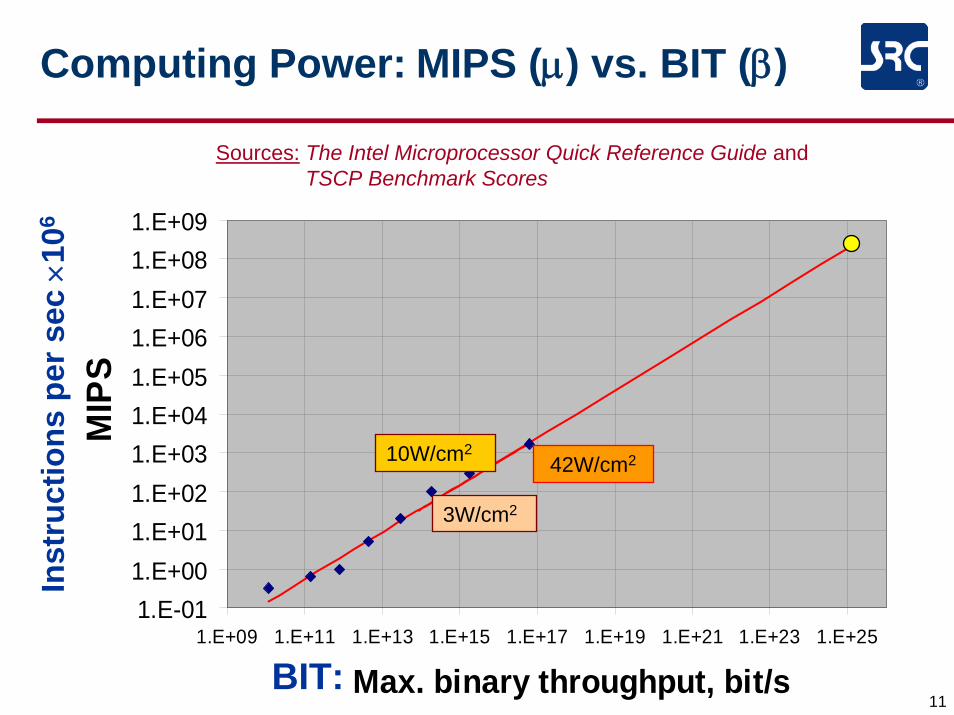
Computing Power: MIPS (μ) vs. BIT (β)
1.E-011.E+001.E+011.E+021.E+031.E+041.E+051.E+061.E+071.E+081.E+09
1.E+09 1.E+11 1.E+13 1.E+15 1.E+17 1.E+19 1.E+21 1.E+23 1.E+25
Max. binary throughput, bit/s
MIP
SSources: The Intel Microprocessor Quick Reference Guide and
TSCP Benchmark Scores
Inst
ruct
ions
per
sec
×10
6
BIT:
11
Computing Power: MIPS (μ) vs. BIT (β)
1.E-011.E+001.E+011.E+021.E+031.E+041.E+051.E+061.E+071.E+081.E+09
1.E+09 1.E+11 1.E+13 1.E+15 1.E+17 1.E+19 1.E+21 1.E+23 1.E+25
Max. binary throughput, bit/s
MIP
SSources: The Intel Microprocessor Quick Reference Guide and
TSCP Benchmark Scores
Inst
ruct
ions
per
sec
×10
6
BIT:
3W/cm2
10W/cm242W/cm2
12
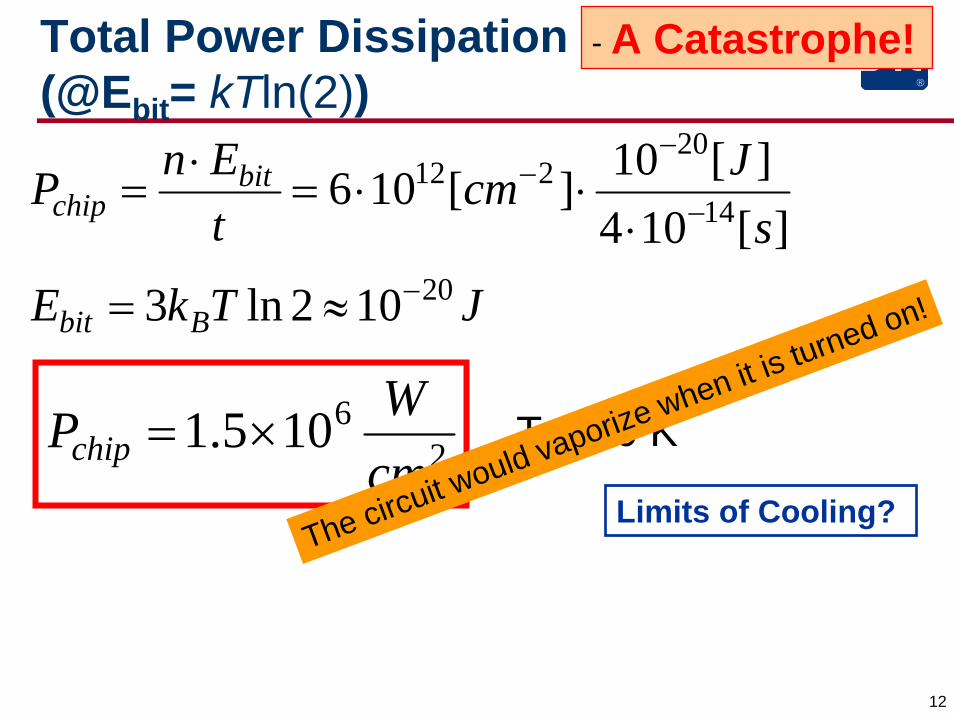
Total Power Dissipation (@Ebit= kTln(2))
26105.1
cmWPchip ×= T=300 K
The circuit would vaporize when it is turned on!JTkE
sJcm
tEnP
Bbit
bitchip
20
14
20212
102ln3
][104][10][106
−
−
−−
≈=
⋅⋅⋅=
⋅=
- A Catastrophe!
Limits of Cooling?
13
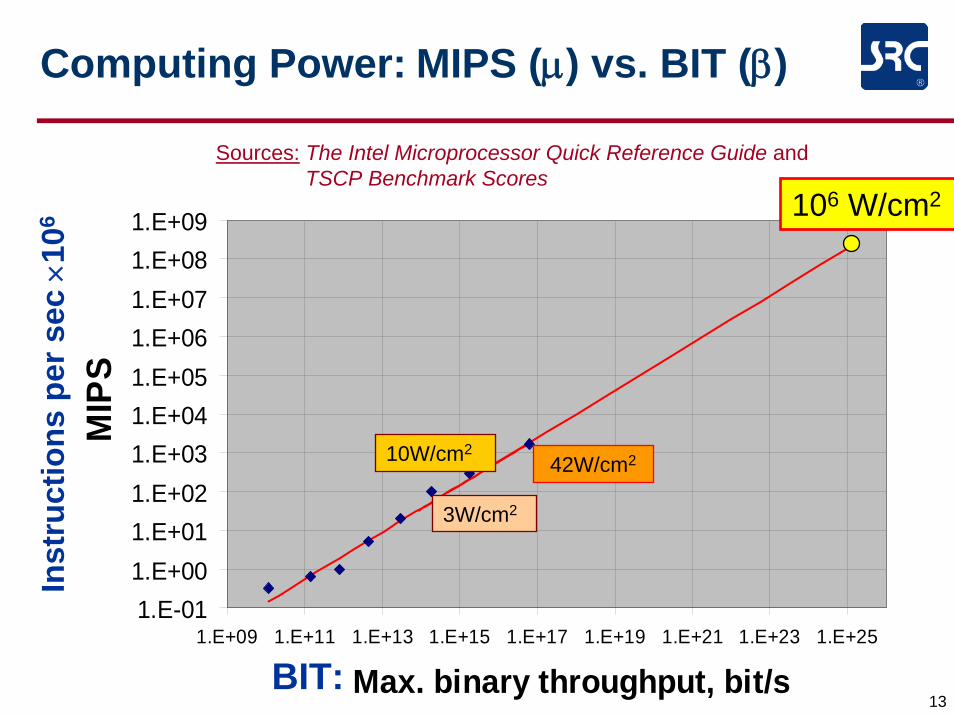
Computing Power: MIPS (μ) vs. BIT (β)
1.E-011.E+001.E+011.E+021.E+031.E+041.E+051.E+061.E+071.E+081.E+09
1.E+09 1.E+11 1.E+13 1.E+15 1.E+17 1.E+19 1.E+21 1.E+23 1.E+25
Max. binary throughput, bit/s
MIP
S
106 W/cm2
Sources: The Intel Microprocessor Quick Reference Guide and TSCP Benchmark Scores
Inst
ruct
ions
per
sec
×10
6
BIT:
3W/cm2
10W/cm242W/cm2

14
Energy Costs of Computation: Energy Consumed and Heat generated
bitbitsw
bit EEtnP ⋅=⋅= β
Since each binary transition requires energy Ebit, the total power dissipation growth is in proportional to the information throughput:
We don’t know how to remove that much heat!!
A universal relation for information
processing devices
( )βμ f=
BITMIPS
Can we change f ?
2lnmin TkE Bb =
)exp(Tk
E
B
berror =Π

Biological Computation?
‘Computers Are Like Brains? Don’t They Wish’The Wall Street Journal, July 9 2008
16
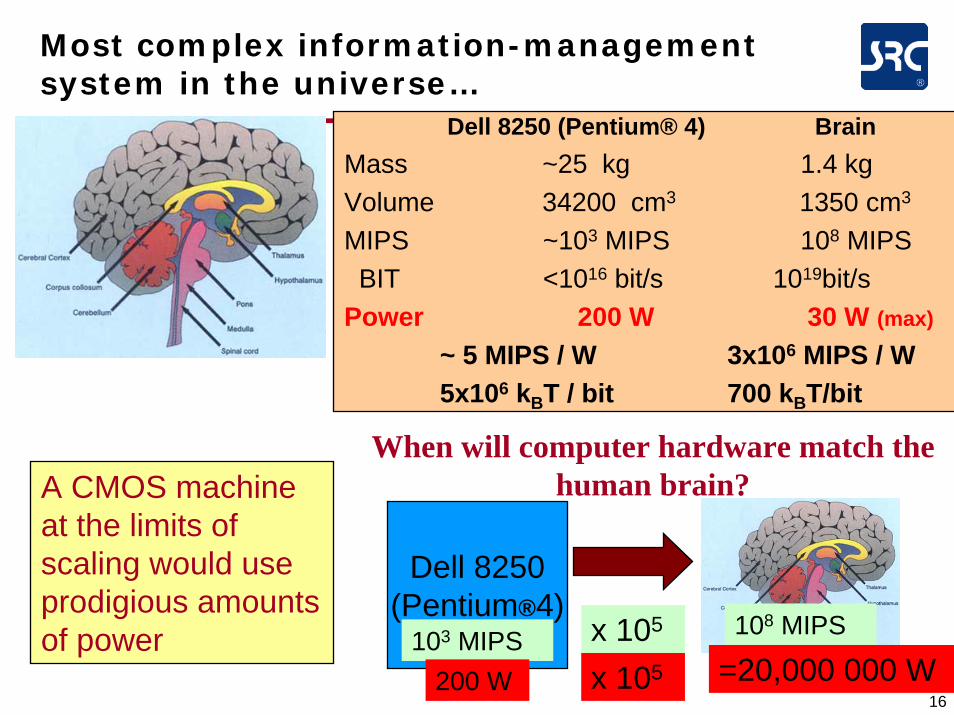
Most complex information-management system in the universe…
Dell 8250 (Pentium® 4) BrainMass ~25 kg 1.4 kg Volume 34200 cm3 1350 cm3
MIPS ~103 MIPS 108 MIPSBIT <1016 bit/s 1019bit/s
Power 200 W 30 W (max)
~ 5 MIPS / W 3x10⁶ MIPS / W5x106 kBT / bit 700 kBT/bit
x 105
x 105
Dell 8250(Pentium®4)
103 MIPS
When will computer hardware match the human brain?
108 MIPS
200 W =20,000 000 W
A CMOS machine at the limits of scaling would use prodigious amounts of power

17
Computing Power: MIPS (μ) vs. BIT (β)
1.E-011.E+001.E+011.E+021.E+031.E+041.E+051.E+061.E+071.E+081.E+09
1.E+09 1.E+11 1.E+13 1.E+15 1.E+17 1.E+19 1.E+21 1.E+23 1.E+25
Max. binary throughput, bit/s
MIP
S
Brain1019 bit/s108 MIPS30 W
106 W/cm2
Sources: The Intel Microprocessor Quick Reference Guide and TSCP Benchmark Scores
Inst
ruct
ions
per
sec
×10
6
BIT:
3W/cm2
10W/cm242W/cm2
Chip Multiprocessors
Ralph K. Cavin III and Victor V. Zhirnov
Semiconductor Research Corporation
IEEE/ACM International Symposium on Nanoscale Architectures
San Jose, CA, October 21-22, 2007
19
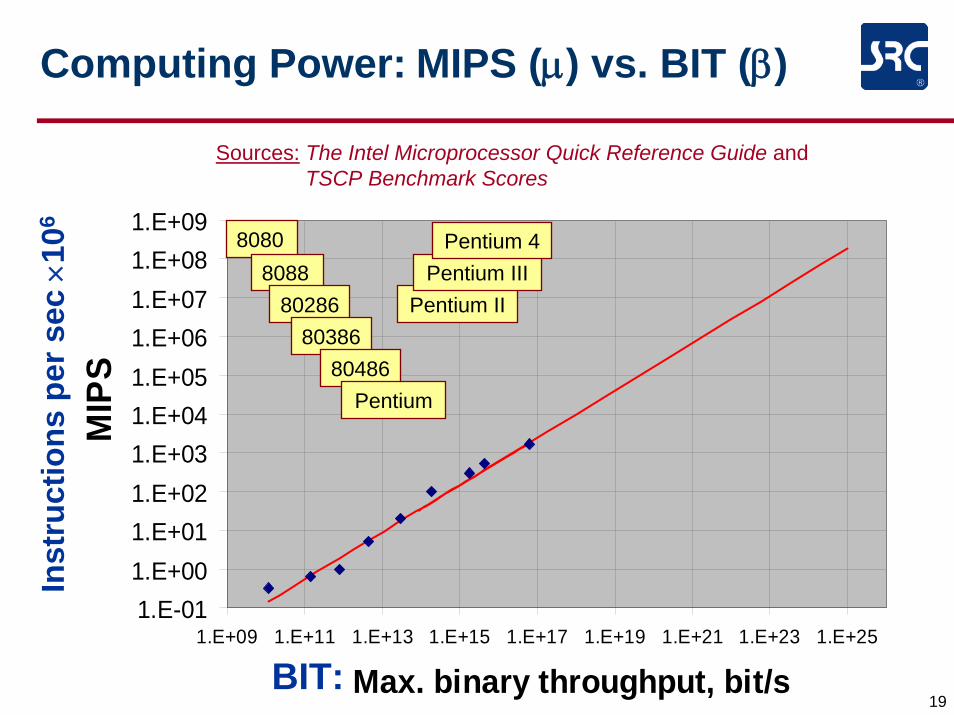
Computing Power: MIPS (μ) vs. BIT (β)
1.E-011.E+001.E+011.E+021.E+031.E+041.E+051.E+061.E+071.E+081.E+09
1.E+09 1.E+11 1.E+13 1.E+15 1.E+17 1.E+19 1.E+21 1.E+23 1.E+25
Max. binary throughput, bit/s
MIP
SSources: The Intel Microprocessor Quick Reference Guide and
TSCP Benchmark Scores
Inst
ruct
ions
per
sec
×10
6
BIT:
80808088
8028680386
80486Pentium
Pentium IIPentium III
Pentium 4
20
Computing Power: MIPS (μ) vs. BIT (β)
1.E-011.E+001.E+011.E+021.E+031.E+041.E+051.E+061.E+071.E+081.E+09
1.E+09 1.E+11 1.E+13 1.E+15 1.E+17 1.E+19 1.E+21 1.E+23 1.E+25
Max. binary throughput, bit/s
MIP
SSources: The Intel Microprocessor Quick Reference Guide and
TSCP Benchmark Scores
Inst
ruct
ions
per
sec
×10
6
BIT:
80808088
8028680386
80486Pentium
Pentium IIPentium III
Pentium 4
X6800QX6700
QX9770
21
Multi-Core Architectures
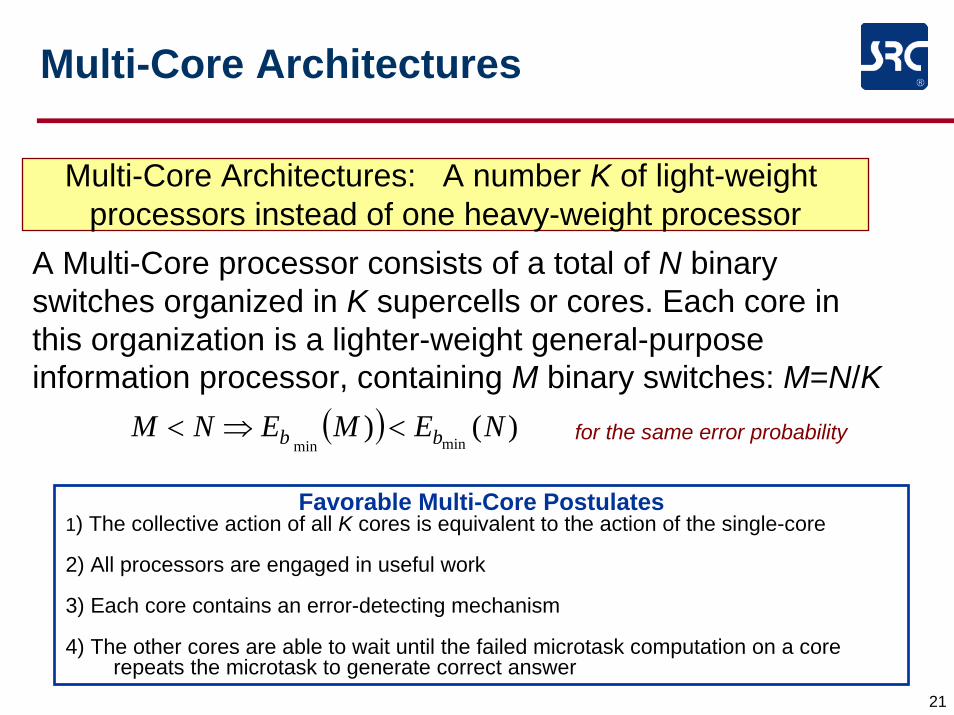
Multi-Core Architectures: A number K of light-weight processors instead of one heavy-weight processor
Favorable Multi-Core Postulates1) The collective action of all K cores is equivalent to the action of the single-core
2) All processors are engaged in useful work
3) Each core contains an error-detecting mechanism
4) The other cores are able to wait until the failed microtask computation on a core repeats the microtask to generate correct answer
A Multi-Core processor consists of a total of N binary switches organized in K supercells or cores. Each core in this organization is a lighter-weight general-purpose information processor, containing M binary switches: M=N/K
( ) )()minmin
NEMENM bb <⇒< for the same error probability
22
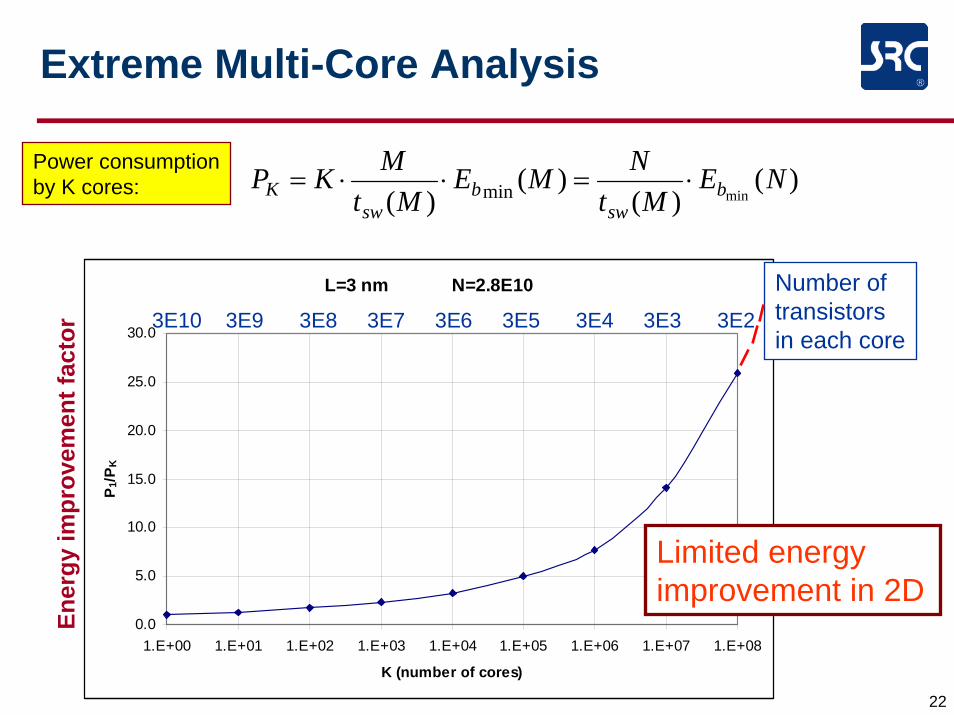
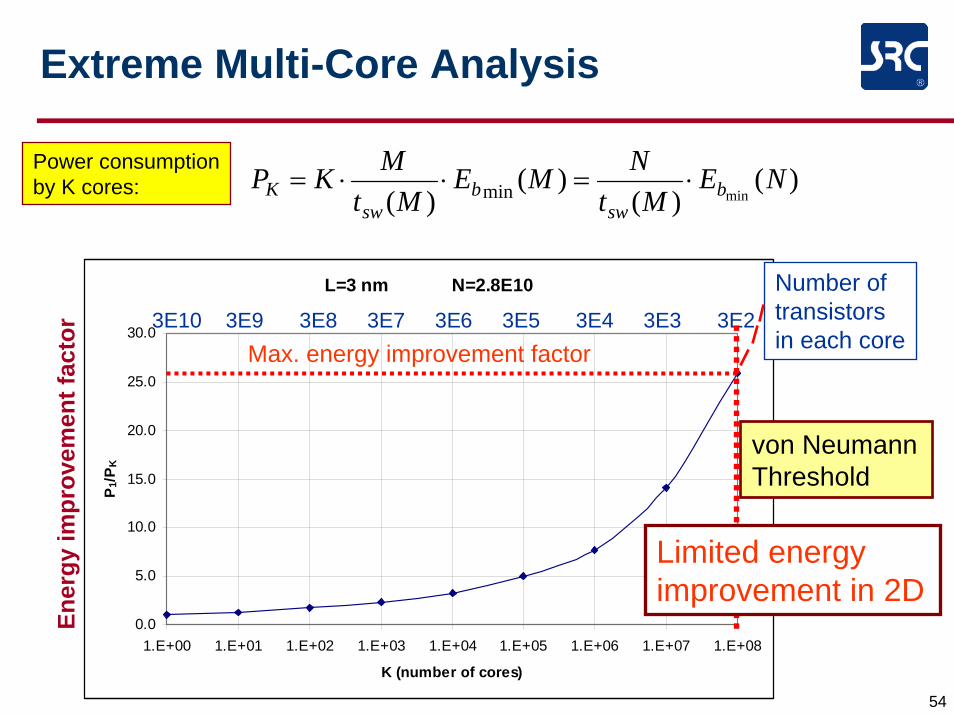
Extreme Multi-Core Analysis
L=3 nm N=2.8E10
0.0
5.0
10.0
15.0
20.0
25.0
30.0
1.E+00 1.E+01 1.E+02 1.E+03 1.E+04 1.E+05 1.E+06 1.E+07 1.E+08
K (number of cores)
P 1/P
K
Ener
gy im
prov
emen
t fac
tor
)()(
)()( minmin NE
MtNME
MtMKP b
swb
swK ⋅=⋅⋅=
3E10 3E9 3E8 3E7 3E6 3E5 3E4 3E3 3E2
Number of transistors in each core
Power consumption by K cores:
Limited energy improvement in 2D
23
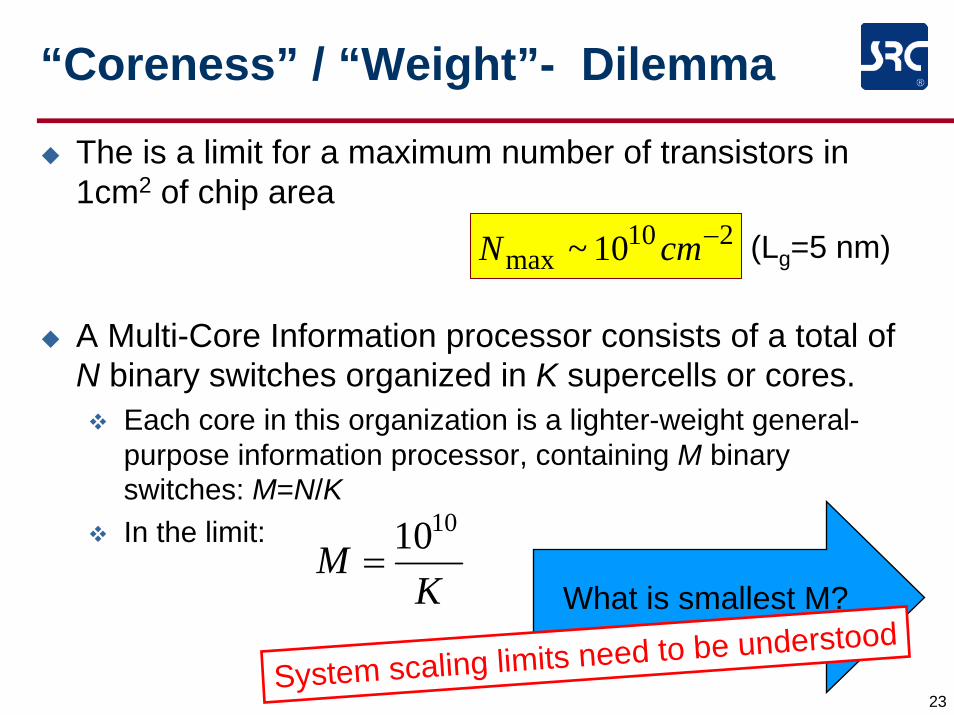
“Coreness” / “Weight”- Dilemma
The is a limit for a maximum number of transistors in 1cm2 of chip area
A Multi-Core Information processor consists of a total of N binary switches organized in K supercells or cores.
Each core in this organization is a lighter-weight general-purpose information processor, containing M binary switches: M=N/KIn the limit:
210max 10~ −cmN
KM
1010=
What is smallest M?
System scaling limits need to be understood
(Lg=5 nm)
24
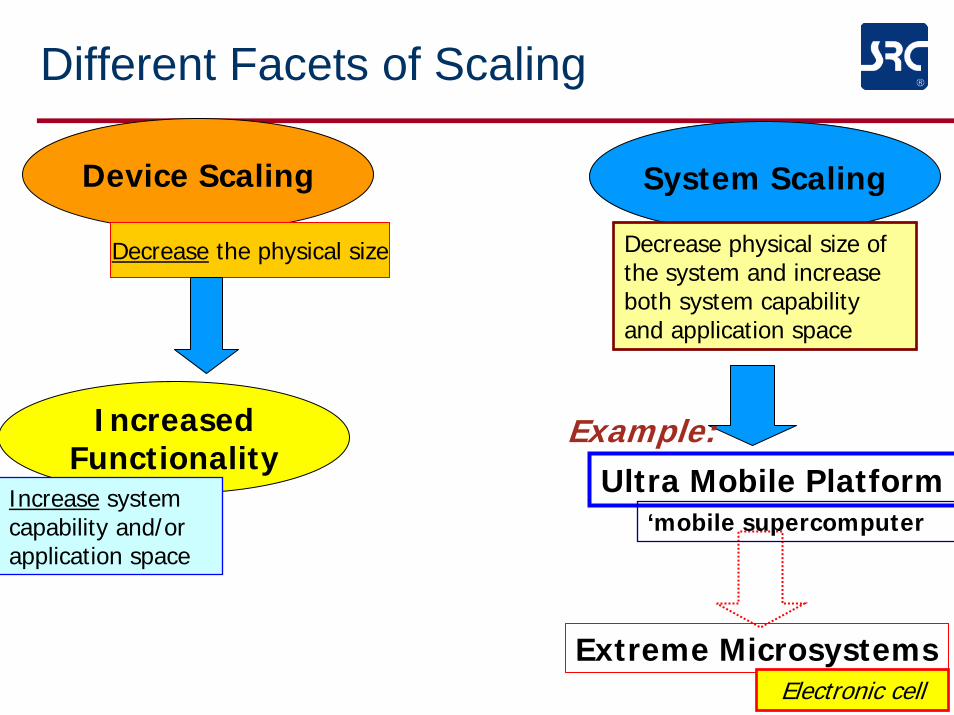
Different Facets of Scaling
Device Scaling
Decrease the physical size
Extreme MicrosystemsElectronic cell
System Scaling
Decrease physical size of the system and increase both system capability and application space
Ultra Mobile PlatformExample:Increased
FunctionalityIncrease system capability and/or application space
‘mobile supercomputer
25
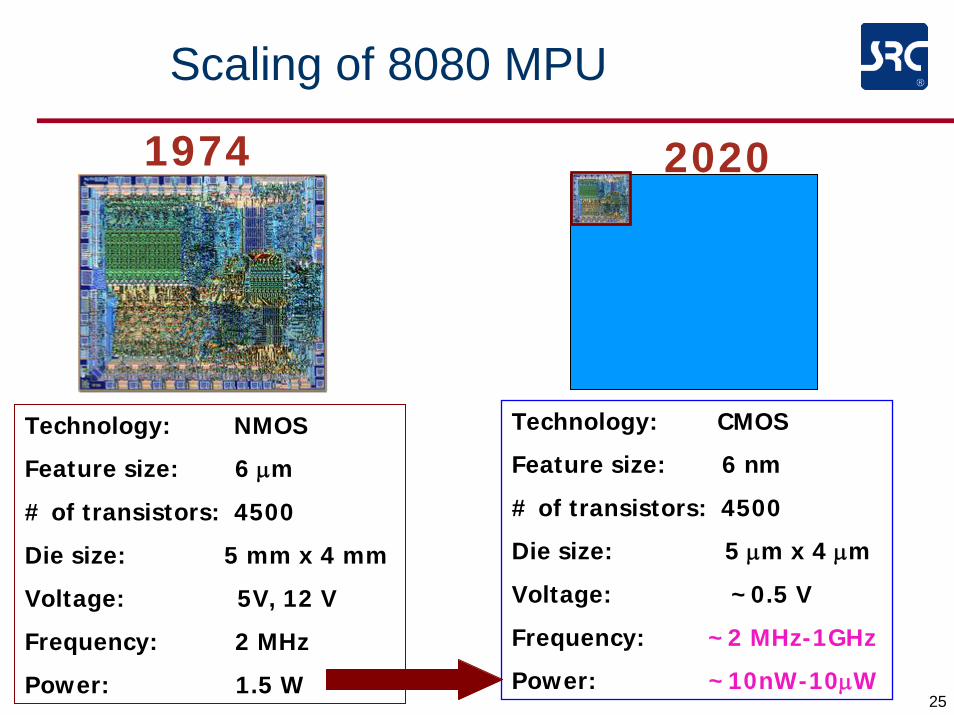
Scaling of 8080 MPU
Technology: NMOS
Feature size: 6 μm
# of transistors: 4500
Die size: 5 mm x 4 mm
Voltage: 5V, 12 V
Frequency: 2 MHz
Power: 1.5 W
Technology: CMOS
Feature size: 6 nm
# of transistors: 4500
Die size: 5 μm x 4 μm
Voltage: ~0.5 V
Frequency: ~2 MHz-1GHz
Power: ~10nW-10μW
1974 2020
26
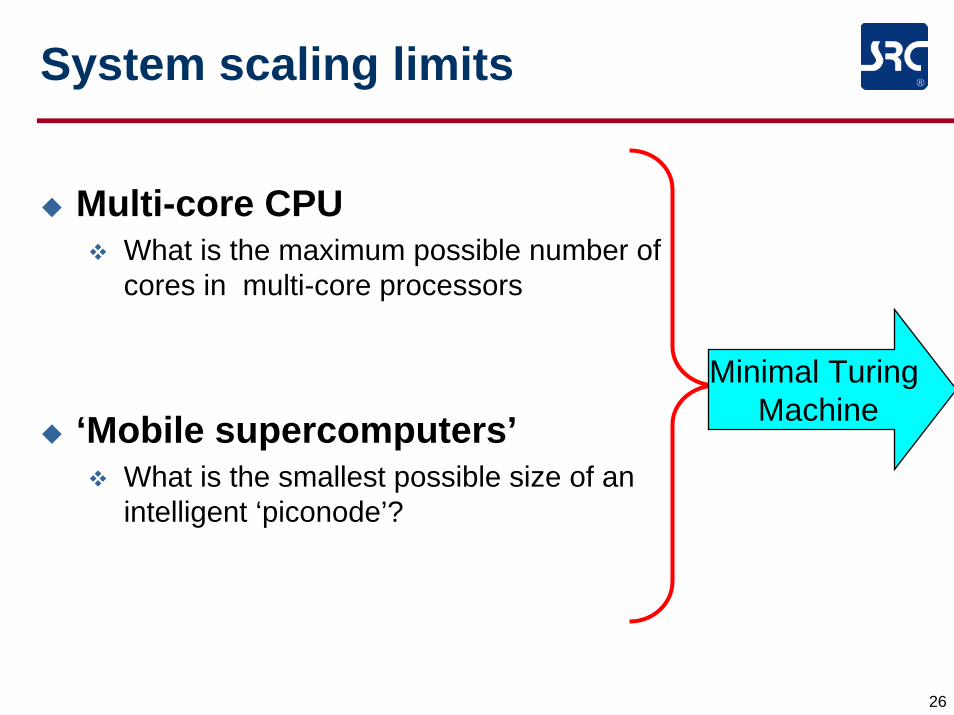
System scaling limits
Multi-core CPUWhat is the maximum possible number of cores in multi-core processors
‘Mobile supercomputers’What is the smallest possible size of an intelligent ‘piconode’?
Minimal Turing Machine
27
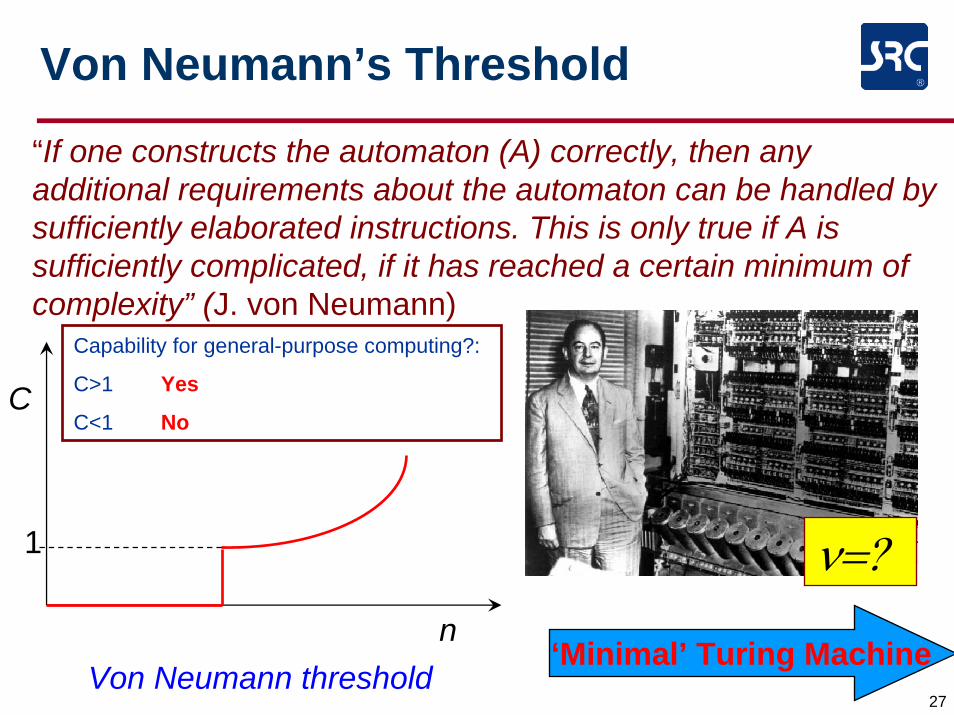
Von Neumann’s Threshold
“If one constructs the automaton (A) correctly, then any additional requirements about the automaton can be handled by sufficiently elaborated instructions. This is only true if A is sufficiently complicated, if it has reached a certain minimum ofcomplexity” (J. von Neumann)
‘Minimal’ Turing Machine
C
n
ν=?
Von Neumann threshold
Capability for general-purpose computing?:
C>1 Yes
C<1 No
1
28
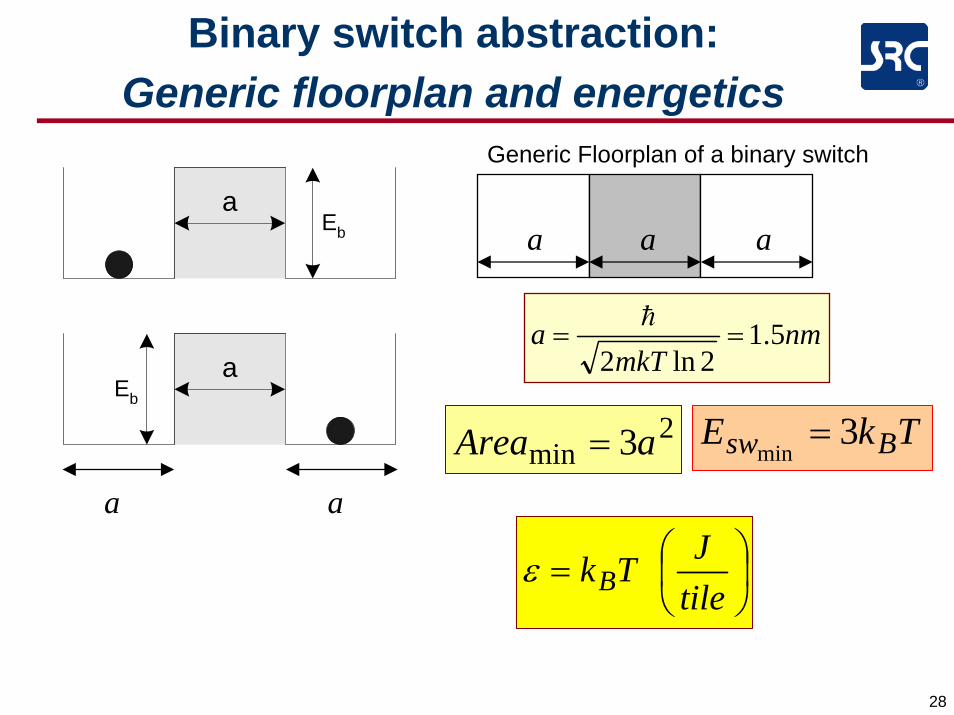
Binary switch abstraction: Generic floorplan and energetics
a
a
Eb
Eb
a a
Generic Floorplan of a binary switch
2min 3aArea = TkE Bsw 3
min=
⎟⎠⎞
⎜⎝⎛=
tileJTkBε
a a a
nmmkT
a 5.12ln2
==h
29
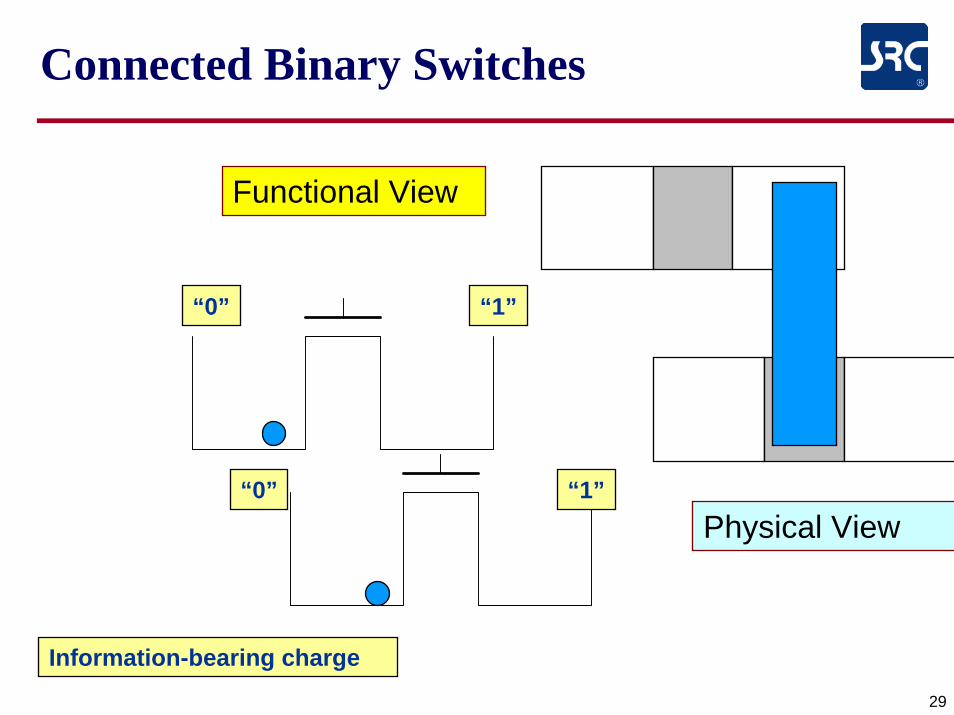
Connected Binary Switches
“0” “1”
Information-bearing charge
“0” “1”
Functional View
Physical View
30
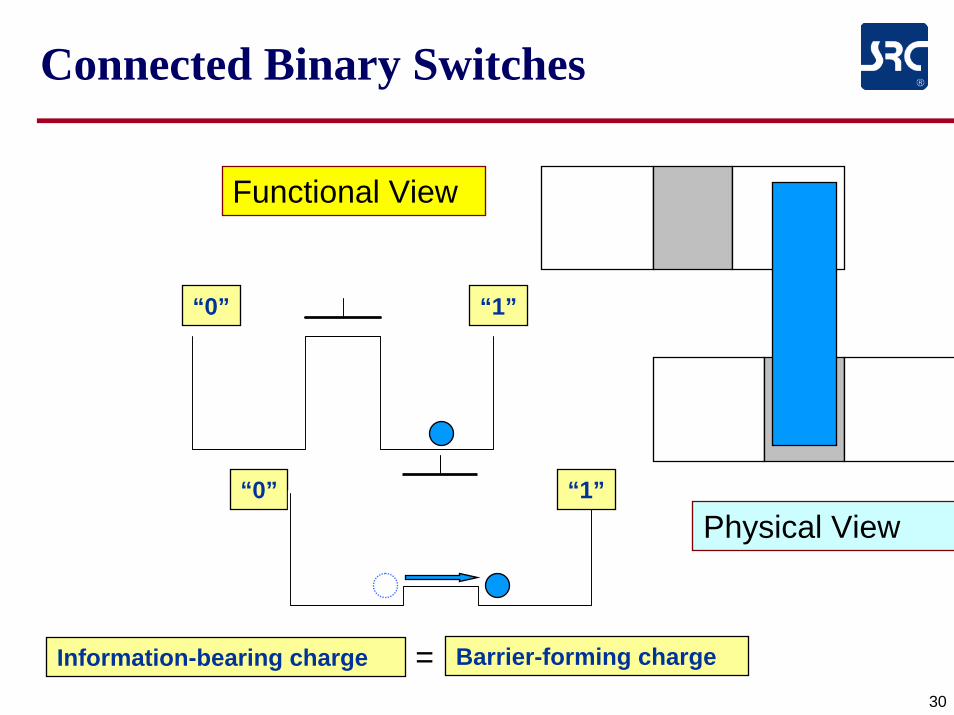
Connected Binary Switches
“0” “1”
Information-bearing charge
“0” “1”
Barrier-forming charge=
Functional View
Physical View
31
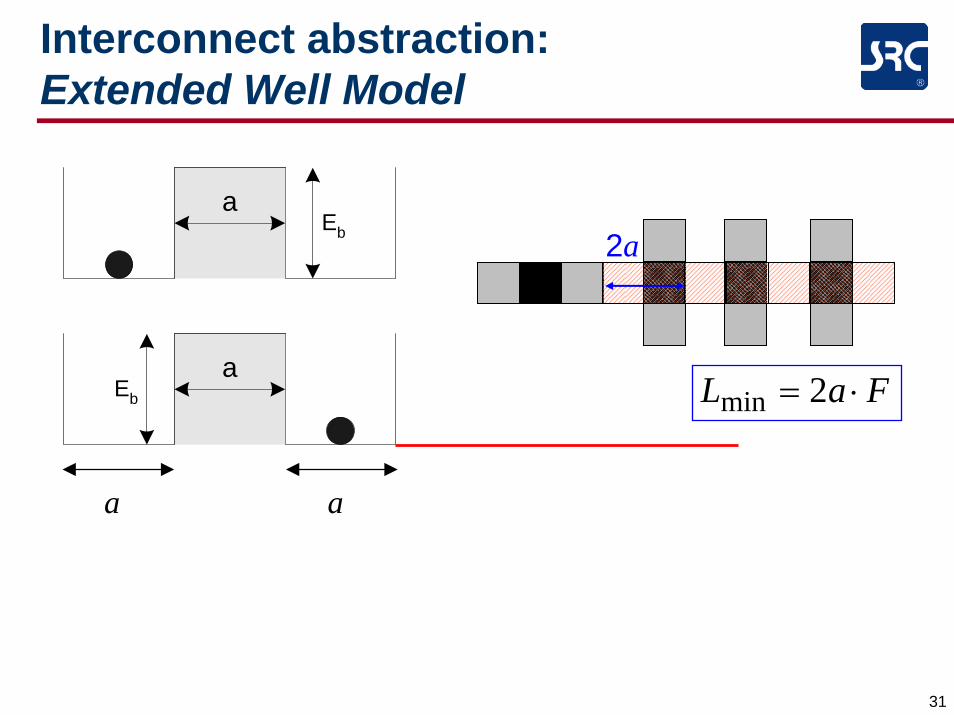
a
a
Eb
Eb
a a
Interconnect abstraction: Extended Well Model
2a
FaL ⋅= 2min
32
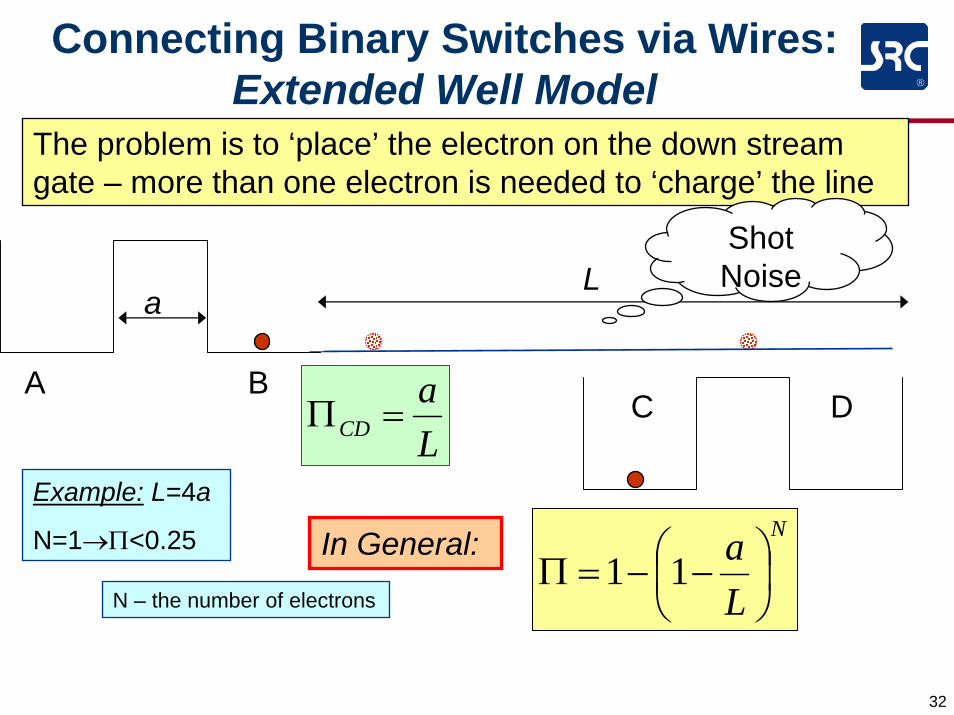
Connecting Binary Switches via Wires: Extended Well Model
La
CD =ΠA B
C D
La
N – the number of electrons
Example: L=4a
N=1→Π<0.25 In General: N
La
⎟⎠⎞
⎜⎝⎛ −−=Π 11
The problem is to ‘place’ the electron on the down stream gate – more than one electron is needed to ‘charge’ the line
Shot Noise
33
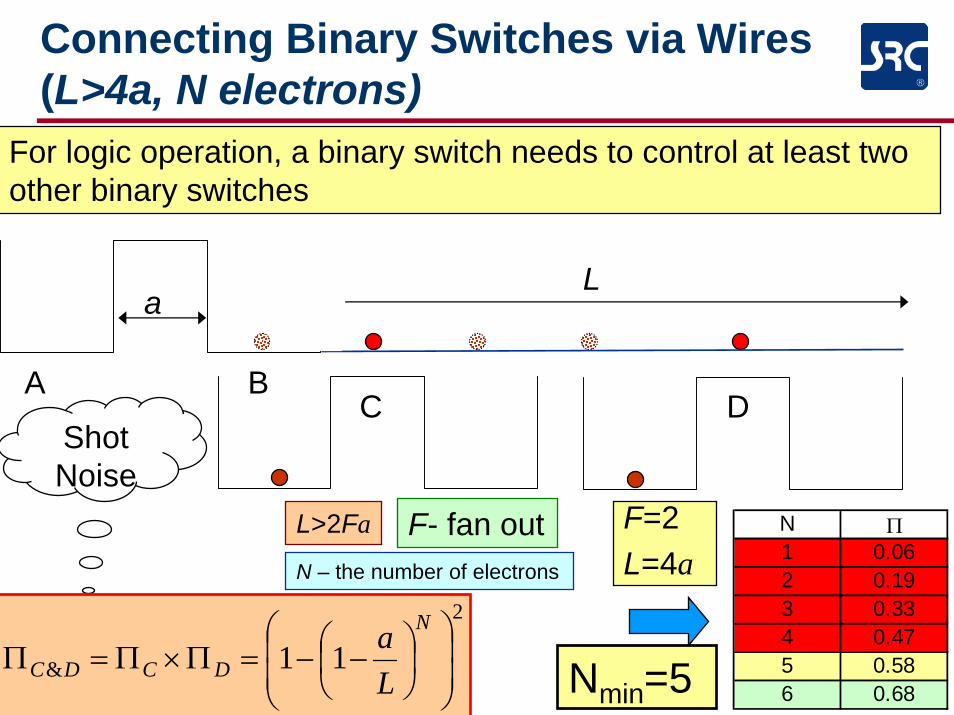
Connecting Binary Switches via Wires (L>4a, N electrons)
For logic operation, a binary switch needs to control at least two other binary switches
A BC D
La
L>2Fa F- fan out F=2 L=4aN – the number of electrons
N Π1 0.062 0.193 0.334 0.475 0.586 0.68Nmin=5
Shot Noise
2
& 11 ⎟⎟⎠
⎞⎜⎜⎝
⎛⎟⎠⎞
⎜⎝⎛ −−=Π×Π=Π
N
DCDC La

34
Minimum number of electrons in interconnect line for communication and fan-out
FN
La
⎟⎟
⎠
⎞
⎜⎜
⎝
⎛⎟⎠⎞
⎜⎝⎛ −−=Π 11
FN
k ⎟⎟
⎠
⎞
⎜⎜
⎝
⎛⎟⎠⎞
⎜⎝⎛ −−=
11121
⎟⎠⎞
⎜⎝⎛ −
⎟⎠
⎞⎜⎝
⎛−
=
k
NF
11ln
211ln
05
101520253035404550
0 5 10 15 20
k (number of tiles)
N
FO1
FO2
FO3FO4FO5
FO6
21
=Π
kaL
=
N - number of electrons F – fan-out k – number of tiles
35
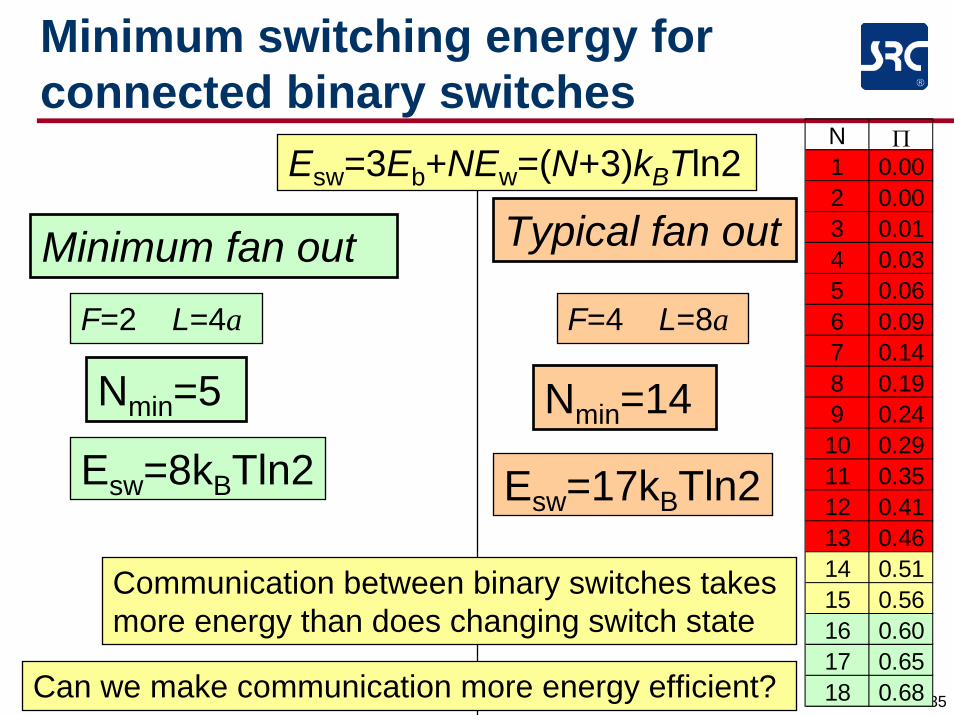
Minimum switching energy for connected binary switches
F=2 L=4a
Nmin=5
Esw=3Eb+NEw=(N+3)kBTln2
Esw=8kBTln2
F=4 L=8a
Minimum fan out Typical fan out
N Π1 0.002 0.003 0.014 0.035 0.066 0.097 0.148 0.199 0.2410 0.2911 0.3512 0.4113 0.4614 0.5115 0.5616 0.6017 0.6518 0.68
Nmin=14
Esw=17kBTln2
Communication between binary switches takes more energy than does changing switch state
Can we make communication more energy efficient?

36
Energy per interconnect tile
0
0.5
1
1.5
2
0 50 100
k (# of tiles)
k BT/
tile
0
0.5
1
1.5
2
0 1 2 3 4 5
F
kBT
/tile
Long interconnect limit
Minimum interconnect limit
FO1
FO2
FO3
FO4
tileTkB18.1=ε
tileTkB33.1=ε
ε ~ kBT/tile

37
Floorspace Expenses of Communication between Binary Switches
Assumption: For each of 3 tiles of Binary Switch and for a fan-out of three, we need at least:
One contacting interconnect tile (3 total) and one connecting interconnect tile (3 total)
Total 6 inteconnect tiles per binary switch
aL 6~intA typical interconnect length distribution for MPU (J. Meindl) n, cm-2
1.E+02 4.11.E+04 6.41.E+06 8.31.E+08 9.71.E+10 10.5
gLnL )(
Reality check:
38
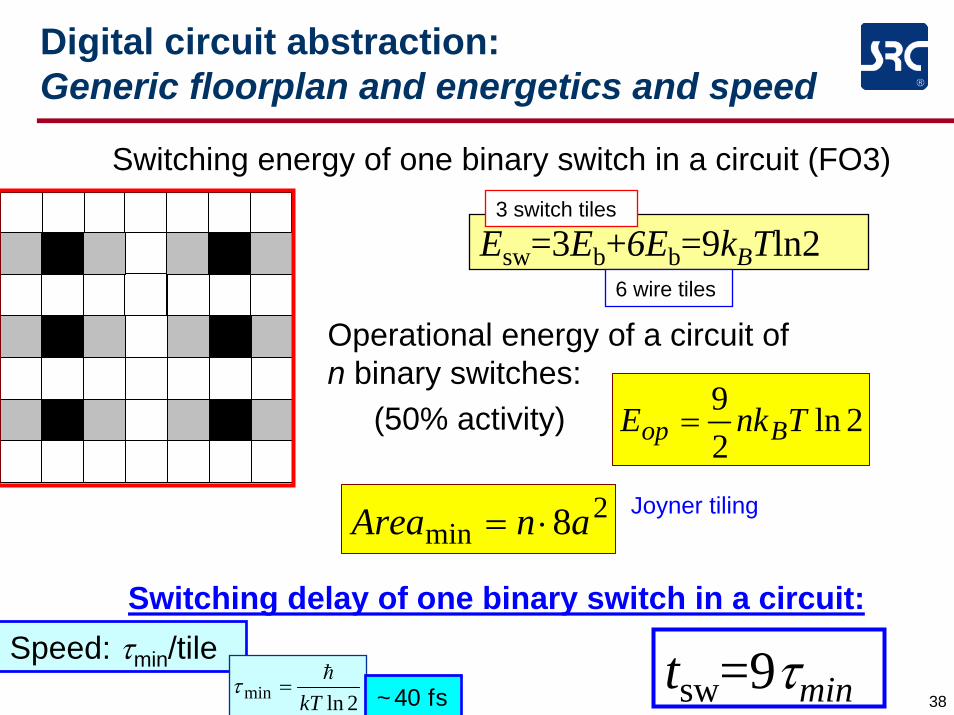
Digital circuit abstraction: Generic floorplan and energetics and speed
Esw=3Eb+6Eb=9kBTln2
Operational energy of a circuit of n binary switches:
Switching energy of one binary switch in a circuit (FO3)3 switch tiles
6 wire tiles
2min 8anArea ⋅= Joyner tiling
2ln29 TnkE Bop =
Speed: τmin/tile2lnmin kT
h=τ ~40 fs
Switching delay of one binary switch in a circuit:
tsw=9τmin
(50% activity)
39
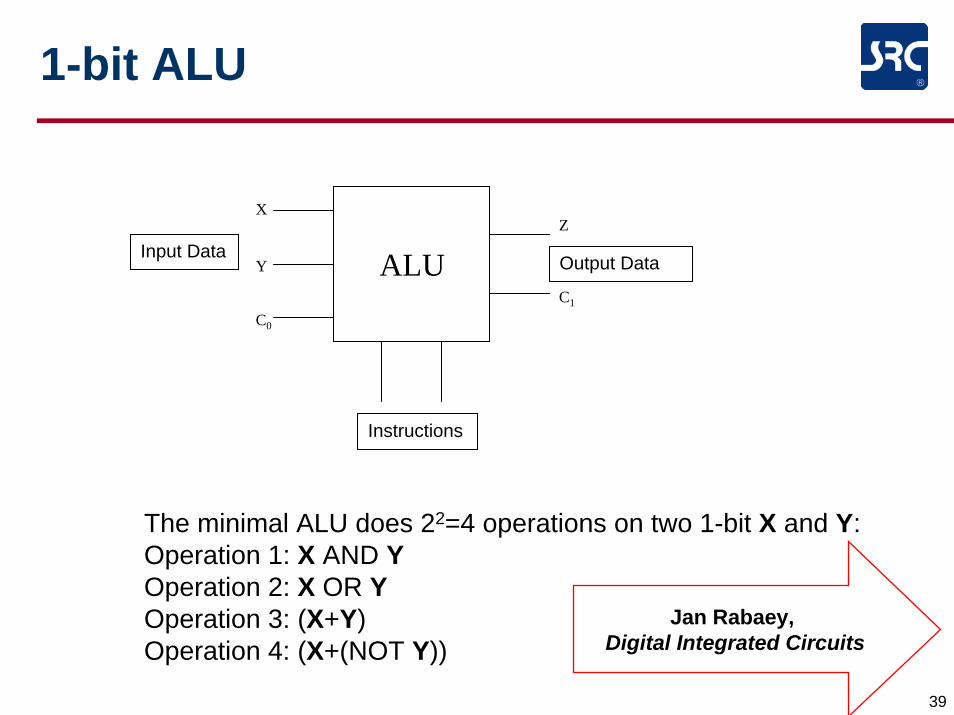
1-bit ALU
ALUInput Data Output Data
Instructions
X
Y
C0
Z
C1
The minimal ALU does 22=4 operations on two 1-bit X and Y:Operation 1: X AND YOperation 2: X OR YOperation 3: (X+Y)Operation 4: (X+(NOT Y))
Jan Rabaey, Digital Integrated Circuits
40
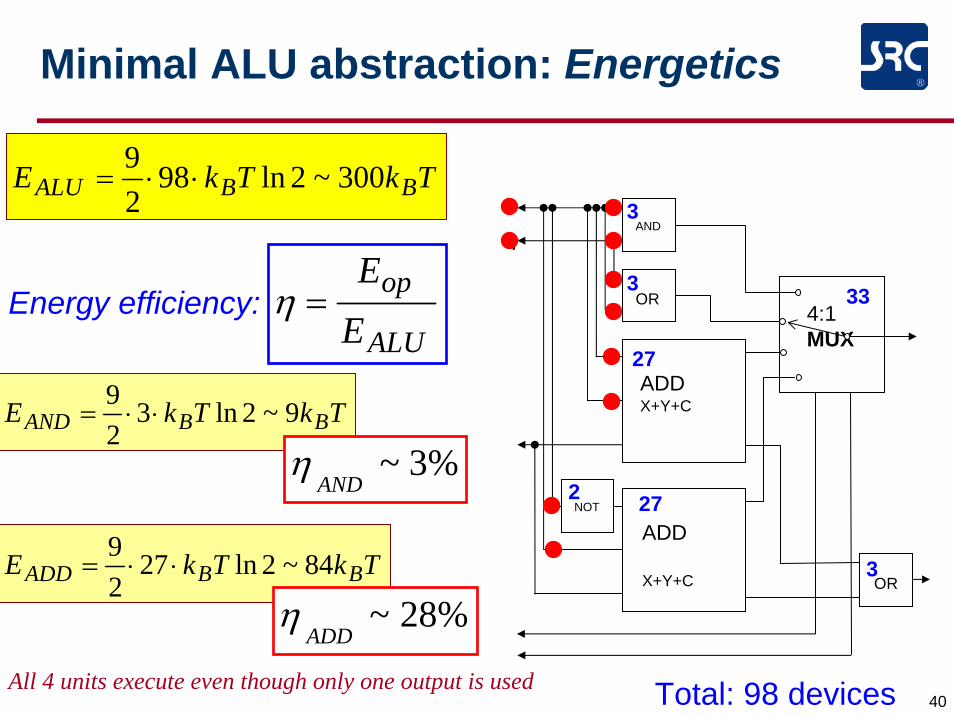
Minimal ALU abstraction: Energetics
AND
OR
OR
ADDX+Y+C
4:1 MUX
NOT
Y
ADD
X+Y+C
Total: 98 devices
Energy efficiency:ALU
op
EE
=η
TkTkE BBALU 300~2ln9829
⋅⋅=
TkTkE BBAND 9~2ln329
⋅⋅=
TkTkE BBADD 84~2ln2729
⋅⋅=
%3~AND
η
%28~ADD
η
3
3
27
272
33
3
All 4 units execute even though only one output is used
41
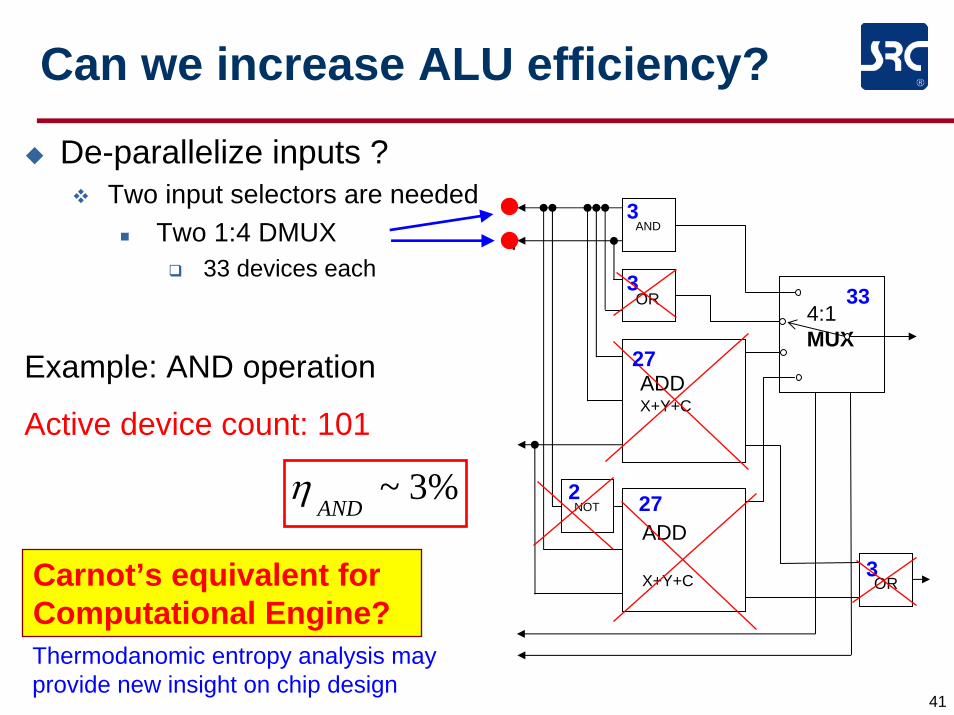
Can we increase ALU efficiency?
De-parallelize inputs ?Two input selectors are needed
Two 1:4 DMUX33 devices each
AND
OR
OR
ADDX+Y+C
4:1 MUX
NOT
Y
ADD
X+Y+C
3
3
27
272
33
3
Example: AND operation
Active device count: 101
%3~AND
η
Carnot’s equivalent for Computational Engine?Thermodanomic entropy analysis may provide new insight on chip design
42
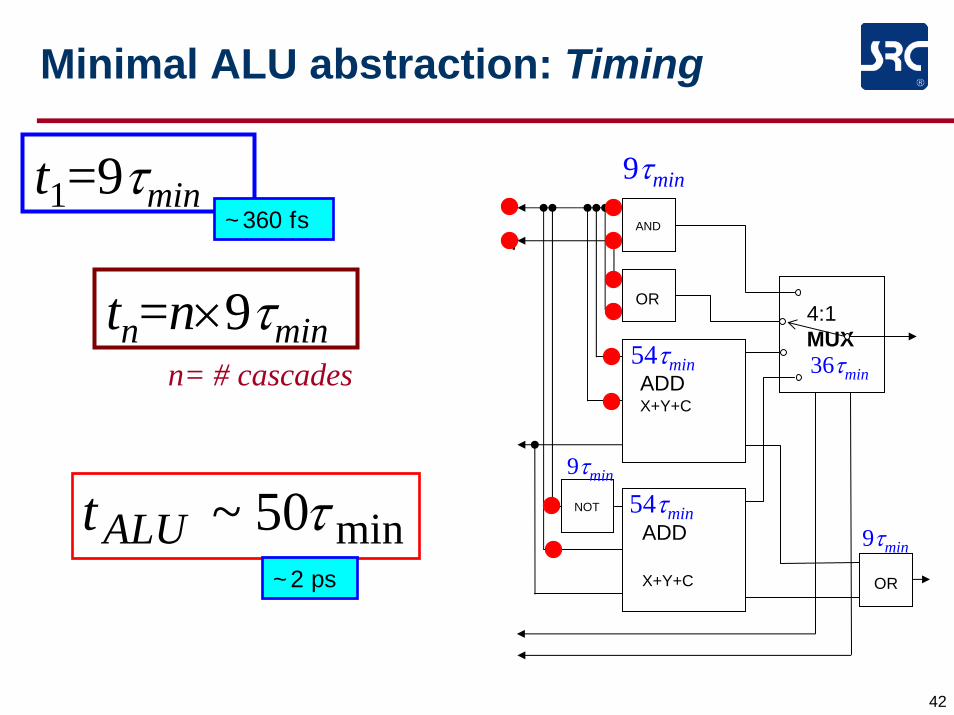
Minimal ALU abstraction: Timing
AND
OR
OR
ADDX+Y+C
4:1 MUX
NOT
Y
ADD
X+Y+C
t1=9τmin9τmin
54τmin
9τmin
36τmin
9τmin
54τmin
tn=n×9τmin
min50~ τALUt~2 ps
~360 fs
n= # cascades
43
X
ALUY
C0
Z
C1
I1 I2
S1
S2
S3
S4
S5
S6
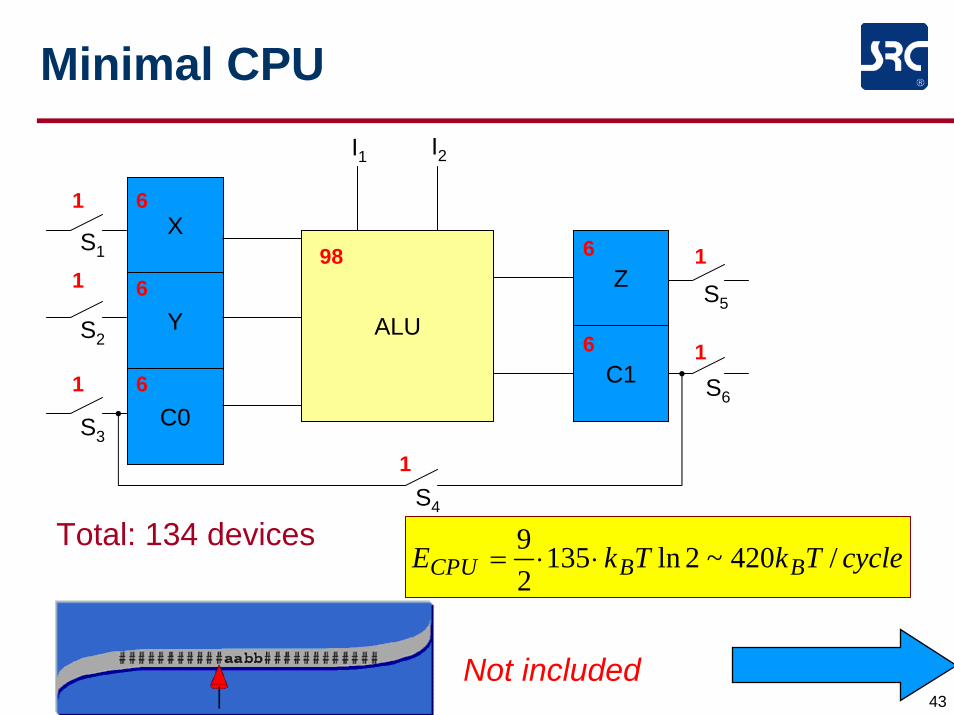
Minimal CPU
98
6
6
6
6
6
1
1
1
1
1
1
Total: 134 devicescycleTkTkE BBCPU /420~2ln135
29
⋅⋅=
Not included
44
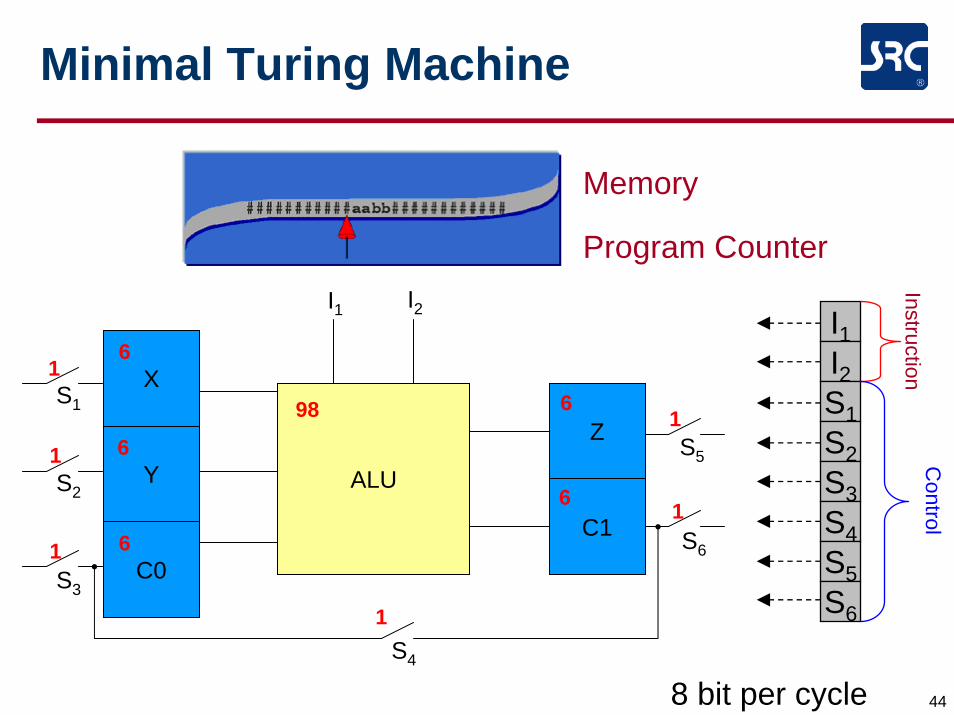
Minimal Turing Machine
6
Memory
Program Counter
I1I2S1S2S3S4S5S6
InstructionC
ontrol
8 bit per cycle
1
1
1C1
I1 I2
S1
S2
S3
S4
S5
S6
X
ALUY
C0
Z
6
1
1
1
6
6
6
6
98
45
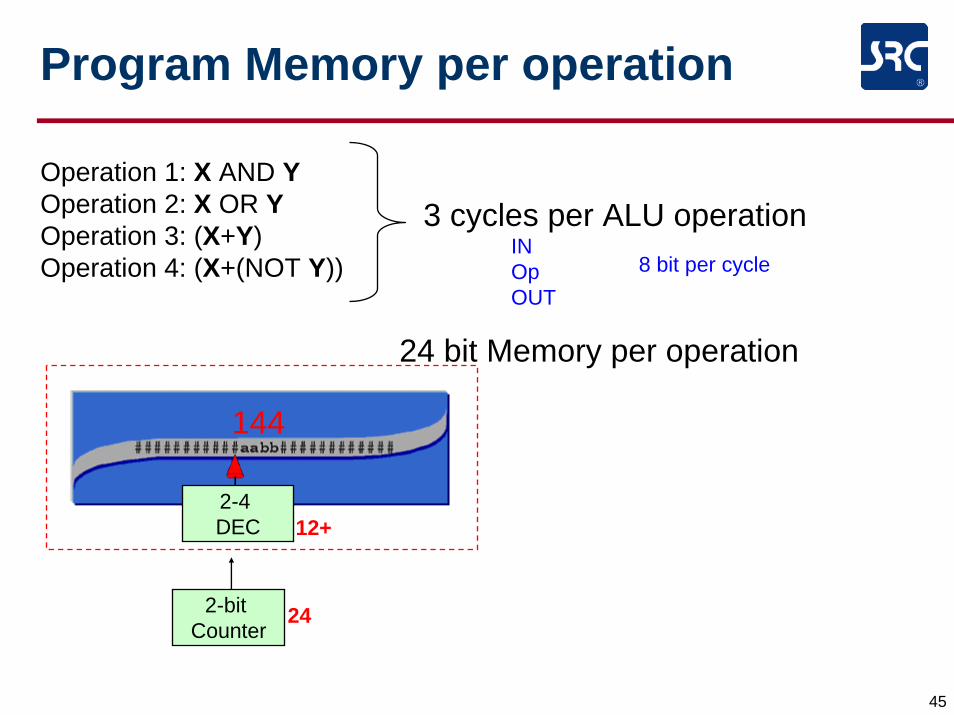
Program Memory per operation
Operation 1: X AND YOperation 2: X OR YOperation 3: (X+Y)Operation 4: (X+(NOT Y))
3 cycles per ALU operationINOpOUT
8 bit per cycle
24 bit Memory per operation
2-bit Counter
24
2-4 DEC 12+
144
46
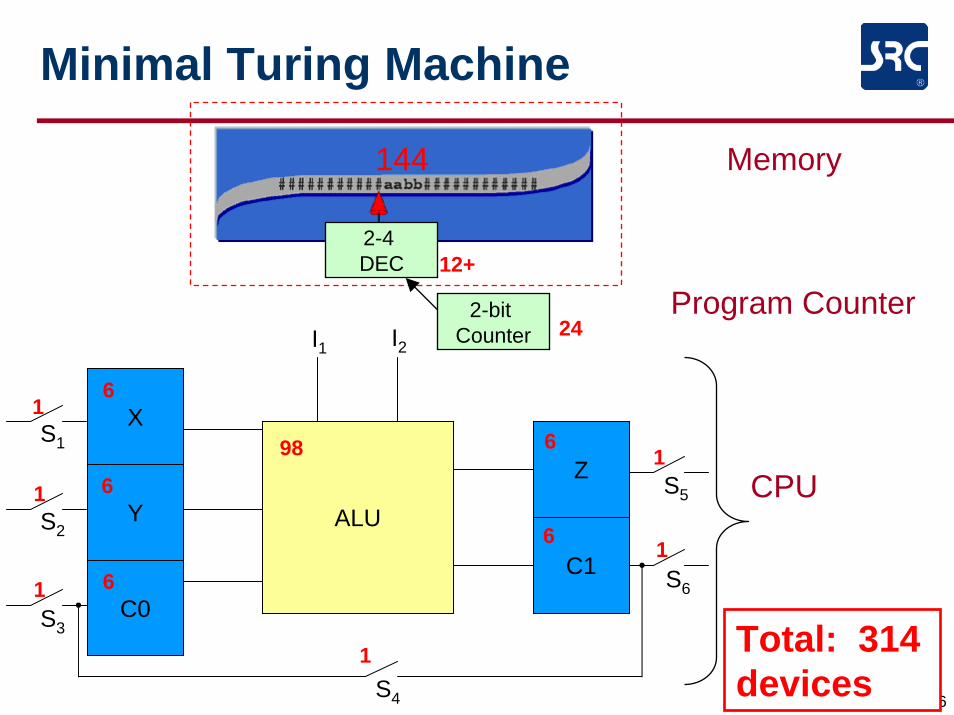
Minimal Turing Machine
Memory
Program Counter
2-4 DEC 12+
144
2-bit Counter
CPU
1
1
1C1
I1 I2
S1
S2
S3
S4
S5
S6
X
ALUY
C0
Z
6
1
1
1
6
6
6
6
98
24
Total: 314devices

47
Turing Machine Implementation: Generic floorplan and energetics
Operational energy of the Minimal Turing Machine
aaaaanArea 5050250083148 222min ×=≈⋅=⋅=Joyner tiling:
cycleJcycleTkTnkE BBop
18104/9802ln29 −⋅=≈=
amin= 1.5 nm
nmnmArea 7575min ×=
Per full CPU operation:
operationJ
cycleJEop
1718 101043 −− ≈⋅⋅=
n=314Von Neumann threshold:
48
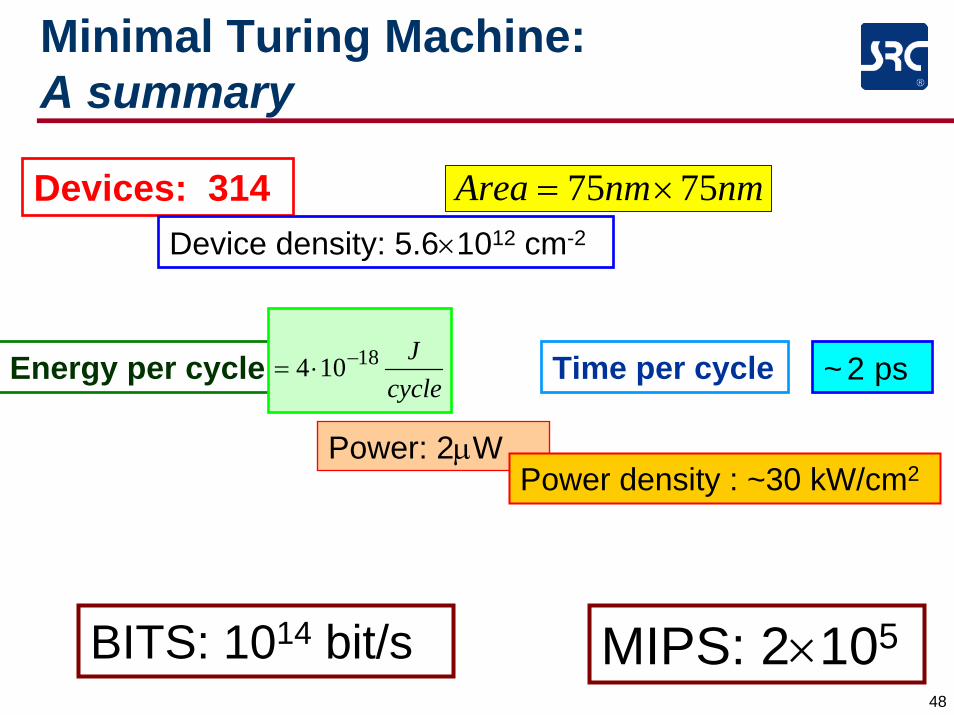
Minimal Turing Machine: A summary
Energy per cyclecycle
J18104 −⋅=
nmnmArea 7575 ×=Devices: 314Device density: 5.6×1012 cm-2
Time per cycle ~2 ps
Power: 2μWPower density : ~30 kW/cm2
BITS: 1014 bit/s MIPS: 2×10⁵

49
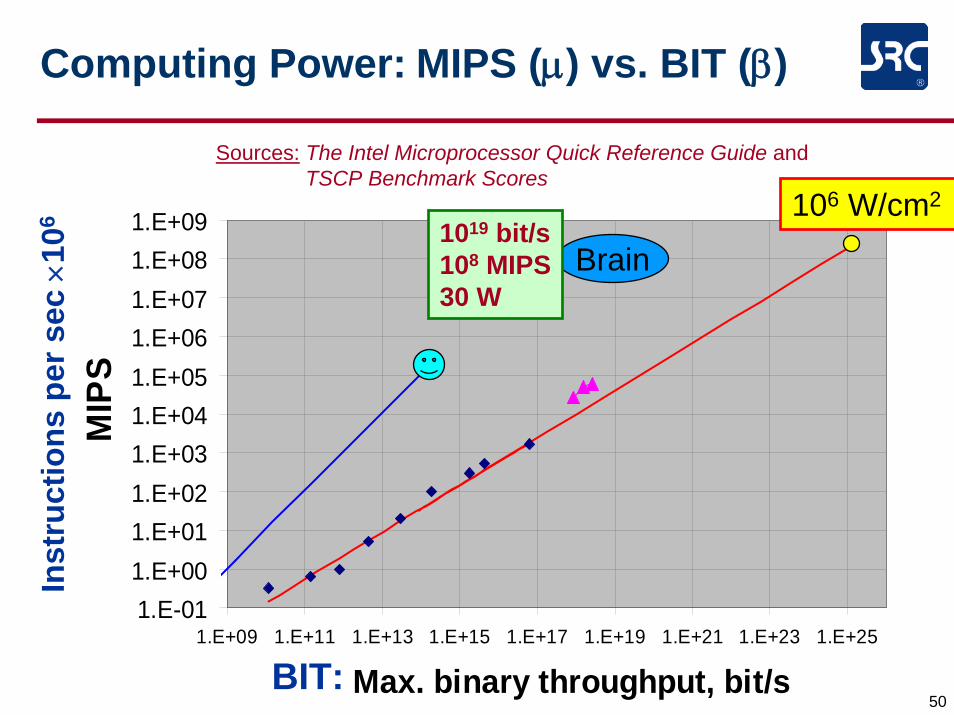
Computing Power: MIPS (μ) vs. BIT (β)
1.E-011.E+001.E+011.E+021.E+031.E+041.E+051.E+061.E+071.E+081.E+09
1.E+09 1.E+11 1.E+13 1.E+15 1.E+17 1.E+19 1.E+21 1.E+23 1.E+25
Max. binary throughput, bit/s
MIP
S
Brain1019 bit/s108 MIPS30 W
106 W/cm2
Sources: The Intel Microprocessor Quick Reference Guide and TSCP Benchmark Scores
Inst
ruct
ions
per
sec
×10
6
BIT:
50
Computing Power: MIPS (μ) vs. BIT (β)
1.E-011.E+001.E+011.E+021.E+031.E+041.E+051.E+061.E+071.E+081.E+09
1.E+09 1.E+11 1.E+13 1.E+15 1.E+17 1.E+19 1.E+21 1.E+23 1.E+25
Max. binary throughput, bit/s
MIP
S
Brain1019 bit/s108 MIPS30 W
106 W/cm2
Sources: The Intel Microprocessor Quick Reference Guide and TSCP Benchmark Scores
Inst
ruct
ions
per
sec
×10
6
BIT:
51
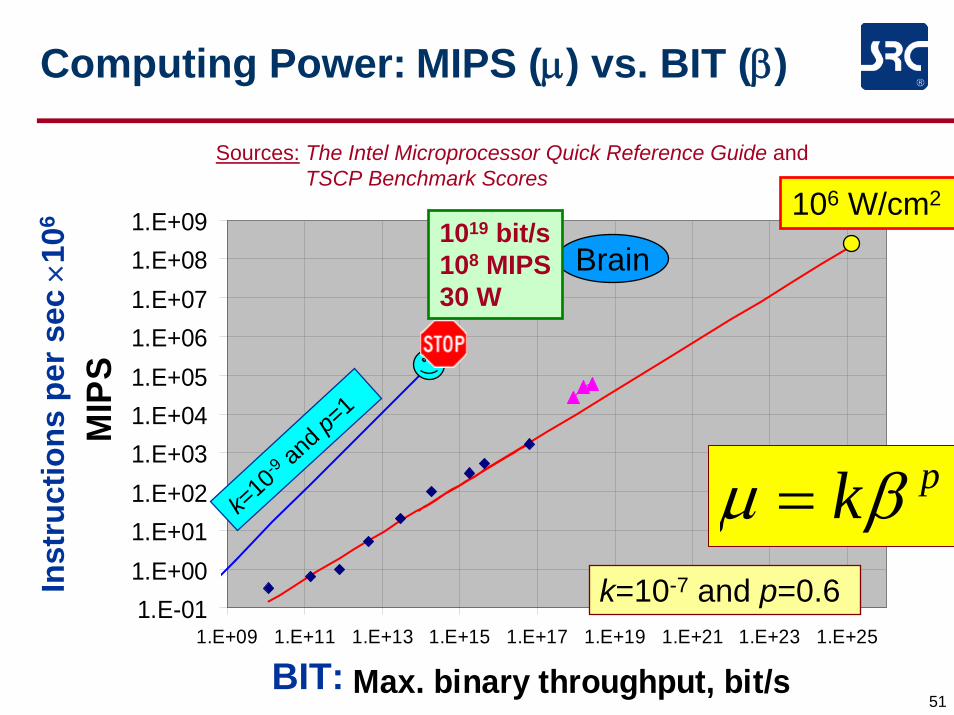
Computing Power: MIPS (μ) vs. BIT (β)
1.E-011.E+001.E+011.E+021.E+031.E+041.E+051.E+061.E+071.E+081.E+09
1.E+09 1.E+11 1.E+13 1.E+15 1.E+17 1.E+19 1.E+21 1.E+23 1.E+25
Max. binary throughput, bit/s
MIP
S
Brain1019 bit/s108 MIPS30 W
106 W/cm2
Sources: The Intel Microprocessor Quick Reference Guide and TSCP Benchmark Scores
Inst
ruct
ions
per
sec
×10
6
BIT:
pkμ β=k=10-7 and p=0.6
k=10
-9 and p
=1
52
SummaryThe Minimal Turing Machine lies on the different performance trajectories from conventional computers
It has slope to meet brain performance
More detailed physics based analysis is neededSystem thermodynamics of computation
Carnot’s equivalent for Computational Engine?
Lessons from Biological Computation?
Candidates for beyond-CMOS nano-electronics should be evaluated in the context of system scaling
e.g. spintronic minimal Turing Machine?

Back-up
54
Extreme Multi-Core Analysis
L=3 nm N=2.8E10
0.0
5.0
10.0
15.0
20.0
25.0
30.0
1.E+00 1.E+01 1.E+02 1.E+03 1.E+04 1.E+05 1.E+06 1.E+07 1.E+08
K (number of cores)
P 1/P
K
Ener
gy im
prov
emen
t fac
tor
)()(
)()( minmin NE
MtNME
MtMKP b
swb
swK ⋅=⋅⋅=
3E10 3E9 3E8 3E7 3E6 3E5 3E4 3E3 3E2
Number of transistors in each core
Power consumption by K cores:
von Neumann Threshold
Max. energy improvement factor
Limited energy improvement in 2D


