Page 1
Computational Advances in Structure Based Drug Design with
Applications to HIV-1 Reverse Transcriptase
Robert Christopher Rizzo
YALE UNIVERSITY
2001
copyright 2001
by
Robert Christopher Rizzo
Page 2
Abstract
Computational Advances in Structure Based Drug Design with Applications to HIV-1
Reverse Transcriptase
Robert Christopher Rizzo
2001
Computational advances in structure based drug design are presented which
emphasize the development of protocols and methodology used in force-field
parameterization, scoring function development, structure prediction and validation, and
docking.
Force-field parameters have been developed for amines primarily by fitting to
experimental data for pure liquids and to hydrogen−bond strengths from gas-phase ab
initio calculations. The parameters were used to compute relative free energies of
hydration using free energy perturbation calculations in Monte Carlo simulations
(MC/FEP). The results are in excellent agreement with experimental data, in contrast to
numerous prior computational reports. MC simulations for the pure liquids of thirteen
additional amines demonstrated the transferability of the force field.
The interactions and energetics associated with the binding of 20 HEPT and 20
nevirapine non-nucleoside inhibitors of HIV-1 reverse transcriptase (RT) have been
explored in an effort to establish simulation protocols and methods that can be used in the
development of more effective anti-HIV drugs. Each inhibitor was modeled in the bound
Page 3
and unbound states via MC statistical mechanics methods. A viable regression equation
was obtained using only four descriptors to correlate the 40 experimental activities with a
r2 of 0.75 and cross-validated q2 of 0.69. The MC results revealed three physically
reasonable parameters that control the binding affinities.
Molecular docking and simulation methods have been used to generate a model of
the FDA-approved inhibitor Sustiva bound to HIVRT. The docking protocol was
validated with known NNRTI complexes. MC/FEP simulations confirmed that the
predicted structures yield correct results for the effects of the Y181C and V106A
mutations on the activity of Sustiva, nevirapine, MKC-442, and 9-Cl TIBO. A
subsequently reported crystallographic complex of Sustiva with HIVRT fully confirmed
the prediction.
Docking studies that include cluster analysis are presented in an effort to reduce
the number of candidate conformers that need to be docked for very flexible ligands.
Despite a limited conformational search, clustering based on a rmsd value of 2.5 Å
dramatically reduced the total number of clusters yet still retained at least one cluster
representative with a conformation similar to the experimental bound-like conformation
for the majority of systems tested.
Page 4
Computational Advances in Structure Based Drug Design with Applications to HIV-1
Reverse Transcriptase
A Dissertation
Presented to the Faculty of the Graduate School
of
Yale University
in Candidacy for the Degree of
Doctor of Philosophy
by
Robert Christopher Rizzo
Dissertation Director: William L. Jorgensen
May 2001
Page 5
Acknowledgements
I would like to express my sincere thanks to Professor William L. Jorgensen for
allowing me to pursue graduate studies in his laboratory. I will always be deeply
indebted to him for his encouragement that I think and act as an independent scientist, for
suggesting interesting and challenging projects, and for keeping me focused with timely
and insightful advice.
I would like to thank the members of my thesis committee, Professors Martin
Saunders and Donald Crothers for many helpful suggestions and comments throughout
my entire graduate career. Special thanks go to Dr. Julian Tirado-Rives for his patience
and day-to-day help.
At Villanova university I would like to thank Dr. Joseph W. Bausch, Dr. Morgan
Besson, and especially Dr. José de la Vega for going above and beyond the call of duty in
helping me prepare for graduate school. I am also very grateful to Dr. Juan G. Alvarez at
the Harvard Medical School for his early encouragement that I pursue an undergraduate
degree in Chemistry.
Thanks to Dr. Dongchul Lim for incorporating software suggestions into his
ChemEdit program that facilitated inhibitor Z-matrix generation in Chapter Three.
Thanks also to Dr. Albert C. Pierce for computational assistance in fitting torsion
parameters (Chapter Two), to Dr. Melissa L. Plount Price for help with docking
calculations (Chapter Four), and to Dr. De-Ping Wang who performed free energy
perturbations (Chapter Four) and additions to the MATADOR program (Chapter 5).
Thanks to Matt Repasky for much assistance with PERL programming and to Dennis
iv
Page 6
Ostrovsky. I would also like to thank Dr. Marilyn B. Kroeger Smith and Professor
Richard H. Smith for their collaborations and helpful discussions and to Jayaraman
Chandrasekhar. Thanks to Marina Udier and Mark Wilson for proofreading this
dissertation.
I would like to acknowledge all the members of the Jorgensen lab past and present
with whom I have worked. The acceptance I have felt from this diverse group will be
fondly remembered and it has been a privilege to interact with so many talented people.
A special thanks to Patricia Morales for her day-to day help.
Thanks to Bob Jordan, Tim Reeder, David Lenat, Hashim Al-Hashimi, and Mark
Wilson for constant love and emotional support. In particular, Mark the Genius who puts
up with me on a daily basis.
I can't express into words the love and encouragement I have received from my
family and from my fiancée and best friend Elizabeth. I dedicate this thesis to my parents
Frank Joseph and Mary Lou Rizzo.
v
Page 7
Table of Contents
List of Figures................................................................................................................. viii
List of Tables. ................................................................................................................. xiii
Preface................................................................................................................................ 1
Chapter One ...................................................................................................................... 4
Structure Based Methods for Computational Drug Design ................................................ 4
Introduction................................................................................................................. 4
Monte Carlo and Molecular Dynamics Methods........................................................ 5
Potential Energy.......................................................................................................... 8
Pure Liquid Properties. ............................................................................................. 10
Free Energy Perturbations......................................................................................... 11
Linear Response and Extended Linear Response Methods. ..................................... 16
Chapter Two.................................................................................................................... 19
OPLS All-Atom Model for Amines: Resolution of the Amine Hydration Problem ....... 19
Background. .............................................................................................................. 19
Previous Simulation Studies. .................................................................................... 20
Computational Details. ............................................................................................. 23
Results and Discussion. ............................................................................................ 29
Conclusion. ............................................................................................................... 56
Chapter 3 ......................................................................................................................... 58
Estimation of Binding Affinities for HEPT and Nevirapine Analogs with HIV-1 Reverse
Transcriptase via Monte Carlo Simulations...................................................................... 58
Background. .............................................................................................................. 58
Computational Details. ............................................................................................. 65
vi
Page 8
Results and Discussion. ............................................................................................ 78
Conclusion. ............................................................................................................... 93
Chapter 4 ......................................................................................................................... 95
Validation of a Model for the Complex of HIV-1 Reverse Transcriptase with Sustiva
through Computation of Resistance Profiles .................................................................... 95
Background. .............................................................................................................. 95
Results and Discussion. .......................................................................................... 102
Conclusion. ............................................................................................................. 110
Chapter 5 ....................................................................................................................... 111
Docking Aided by Cluster Analysis: Protocol Development and Validation Studies... 111
Background. ............................................................................................................ 111
Computational Details. ........................................................................................... 116
Results..................................................................................................................... 120
Conclusion. ............................................................................................................. 141
Cited References............................................................................................................ 142
vii
Page 9
List of Figures.
Figure 0. 1. HIV infection estimates from the World Health Organization and the Joint
United Nations Programme on HIV/AIDS. ................................................................ 1
Figure 0. 2. AIDS and death from AIDS estimates from the Centers for Disease Control
and Prevention. ........................................................................................................... 3
Figure 1. 1. The Metropolis Monte Carlo sampling method. Figure adapted from
reference 7................................................................................................................... 6
Figure 1. 2. Thermodynamic cycle used to determine the relative free energy of
hydration (∆∆Ghyd) between two molecules A and B. .............................................. 13
Figure 1. 3. Thermodynamic cycle used to determine the relative free energy of binding
(∆∆Gb) between two molecules A and B to a protein P............................................ 14
Figure 1. 4. Thermodynamic cycle used to determine the relative fold resistance (∆∆GFR)
between two molecules A and B, a wild-type protein (PWT), and mutant protein
(PMUT)........................................................................................................................ 15
Figure 2. 1. Thermodynamic cycle used to determine the relative free energy of
hydration (∆∆Ghyd) between methylamine and ammonia. ........................................ 27
Figure 2. 2. Gas-phase interaction energies and enthalpies (kcal/mol) of amines with
potassium ion. Calculated results are from the OPLS-AA force field, and the
experimental enthalpies are from reference 55. ........................................................ 37
Figure 2. 3. N−N radial distribution functions for liquid amines from Monte Carlo
simulations with the OPLS-AA force field. X-ray results for ammonia are at +4 °C
from reference 74. Successive curves are offset 3.0 units along the y-axis. ............. 41
Figure 2. 4. Plots of ∆G (kcal/mol) vs. λ in the gas phase, water, and chloroform from
free energy perturbation calculations with the OPLS-AA force field: methylamine
ammonia............................................................................................................... 44
viii
Page 10
Figure 2. 5. Plots of ∆G (kcal/mol) vs. λ in the gas phase, water, and chloroform from
free energy perturbation calculations with the OPLS-AA force field: dimethylamine
methylamine......................................................................................................... 45
Figure 2. 6. Plots of ∆G (kcal/mol) vs. λ in the gas phase, water, and chloroform from
free energy perturbation calculations with the OPLS-AA force field: trimethylamine
dimethylamine...................................................................................................... 46
Figure 2. 7. N−HW (amine N−water H) radial distribution functions in TIP4P water from
MC simulations with the OPLS-AA force field. ...................................................... 48
Figure 2. 8. H(N)−OW (amino H−water O) radial distribution functions in TIP4P water
from MC simulations with the OPLS-AA force field............................................... 49
Figure 2. 9. Solute−solvent (amine−water) energy pair distributions from MC
simulations with the OPLS-AA force field. The y-axis records the number of water
molecules per kcal/mol, which interact with the amine solute with the interaction
energy given on the x-axis. ....................................................................................... 51
Figure 3. 1. Cartoon representation of an HIV particle. Reverse transcriptase (RT)
converts viral RNA to viral DNA for subsequent incorporation into the host cell
genome. ..................................................................................................................... 59
Figure 3. 2. Schematic diagram showing the different binding sites for nucleoside
(NRTI) and non-nucleoside (NNRTI) HIV reverse transcriptase (HIVRT) inhibitors.
The apo coordinates in green on the left are from reference 86. The NRTI/HIVRT
complex in cyan (top) showing the NRTI binding site in red and the viral nucleic
acid site in magenta is from reference 87. The NNRTI/HIVRT complex in cyan
(bottom) showing the NNRTI binding site in red is from reference 88.................... 60
Figure 3. 3. Schematic representation of a binding event showing different environments
for HIVRT inhibitors. Small arrows depict potential interactions of a drug with
water (unbound state) or water and protein (bound state). ....................................... 66
Figure 3. 4. HIVRT binding site model surrounded by a 22 Å cap of water. Blue
residues sampled in the MC simulations, red residues rigid, green residues not used.
Crystal structure coordinates, pdb entry 1rt1, from reference 88. ............................ 67
ix
Page 11
Figure 3. 5. No steric clash is observed between HIVRT side-chain Tyr181A and the i-Pr
group of MKC−442 in the modeled structure using the “down” conformation, which
is only reported for the parent HEPT. ....................................................................... 70
Figure 3. 6. Experimental conformation of Tyr181A for 16 HIVRT non-nucleoside
inhibitor complexes: nevirapine (green), HEPT(magenta), BHAP (grey), α−APA
(red), TIBO (yellow), and carboxanylide (cyan) analogs. The complexes were
aligned by minimizing the rmsd between Cα carbons at residues Leu100A,
Lys103A, Tyr181A, and Val106A. See text for pdb references.............................. 71
Figure 3. 7. Annealing protocol showing heating, equilibration, and averaging portions
used in the MC simulations for the unbound inhibitors............................................ 74
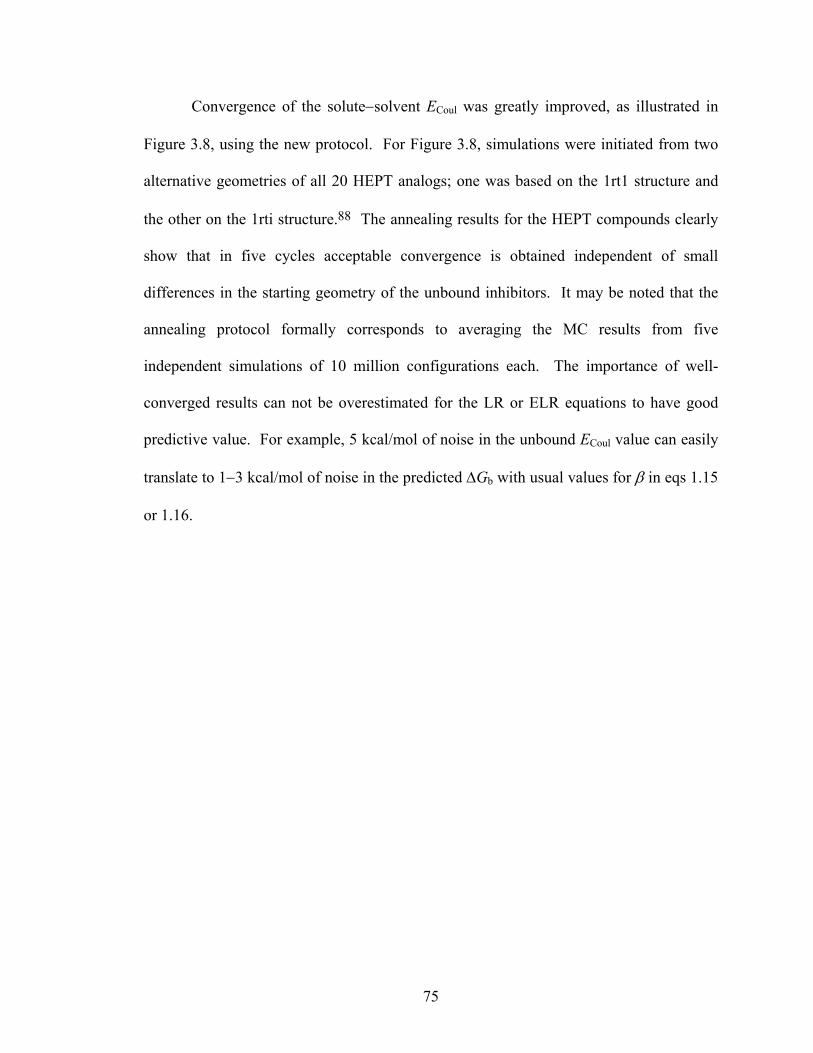
Figure 3. 8. Convergence of the inhibitor-water Coulombic energy for the HEPT data set
after 10 million (1 cycle) and 50 million (5 cycles) configurations of averaging using
the annealing protocol. Each inhibitor was simulated twice starting from one of two
different conformations obtained from a minimization in either the 1rt1 or 1rti
crystal structure. ........................................................................................................ 76
Figure 3. 9. Predicted binding affinities (∆Gcalcd) using eq 3.3 vs. experimental activities
(∆Gexptl) for 20 HEPT and 20 nevirapine analogs with HIVRT. .............................. 82
Figure 3. 10. Plot of ∆G (kcal/mol) vs. λ for the perturbation of N,N-dimethylacetamide
to N-methylacetamide. The non-bonded parameters and geometries were scaled
using the coupling coordinate λ. ............................................................................... 85
Figure 3. 11. Two water molecules (orange) are displaced by compound H07 (green, Et
analog) that are observed in simulations of compound H08 (magenta, Me analog)
with HIVRT. ............................................................................................................. 87
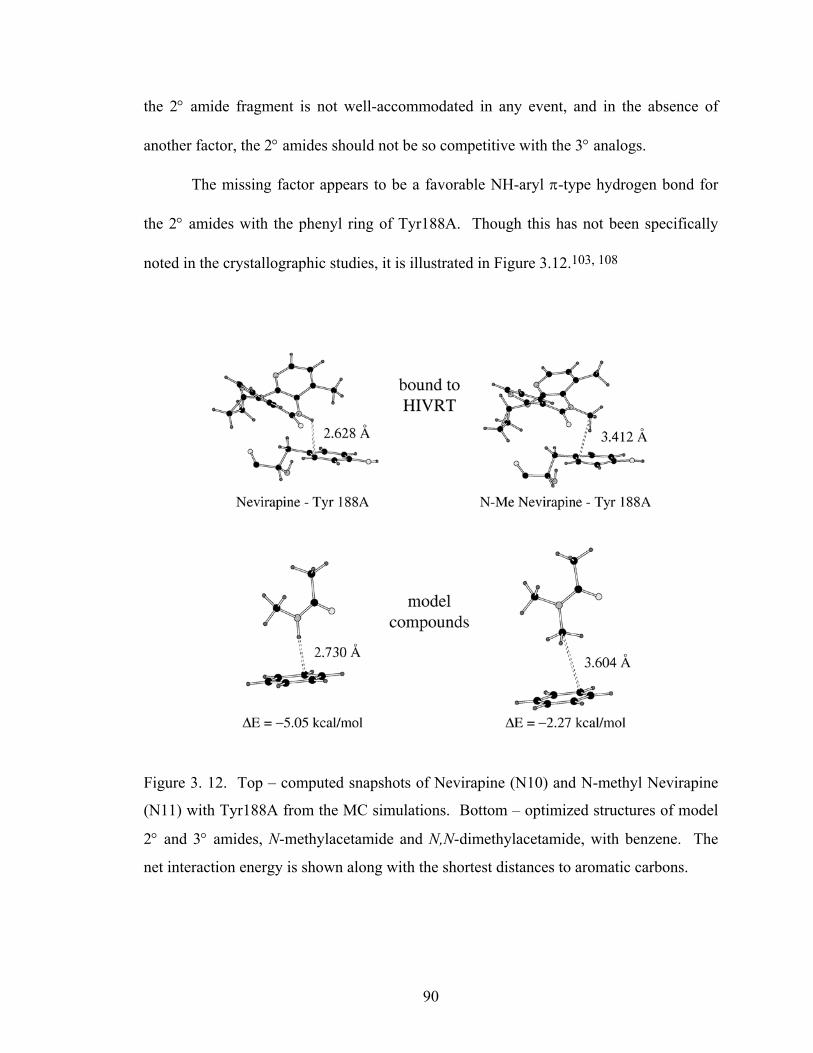
Figure 3. 12. Top – computed snapshots of Nevirapine (N10) and N-methyl Nevirapine
(N11) with Tyr188A from the MC simulations. Bottom – optimized structures of
model 2° and 3° amides, N-methylacetamide and N,N-dimethylacetamide, with
benzene. The net interaction energy is shown along with the shortest distances to
aromatic carbons. ...................................................................................................... 90
Figure 3. 13. A water-mediated hydrogen bond is consistently observed between N01 (Et
analog) and Lys101A that is not observed in the MC simulations of N13 (t-Bu
analog) with HIVRT. ................................................................................................ 93
x
Page 12
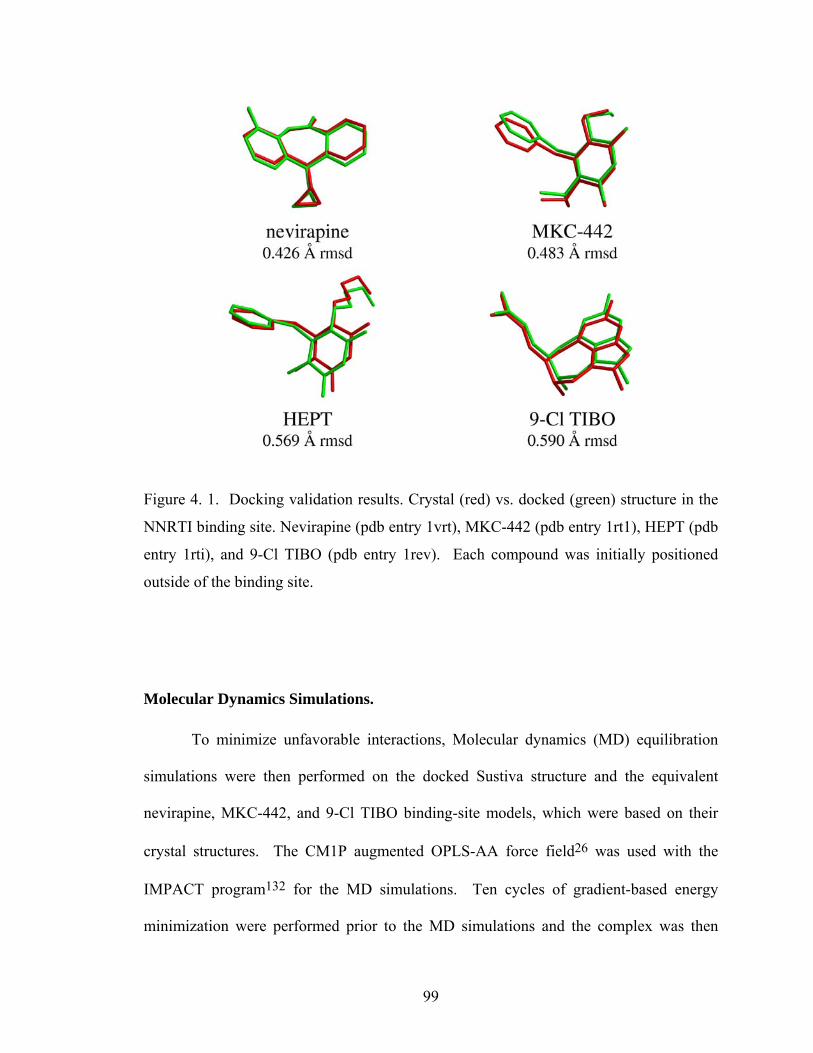
Figure 4. 1. Docking validation results. Crystal (red) vs. docked (green) structure in the
NNRTI binding site. Nevirapine (pdb entry 1vrt), MKC-442 (pdb entry 1rt1), HEPT
(pdb entry 1rti), and 9-Cl TIBO (pdb entry 1rev). Each compound was initially
positioned outside of the binding site. ...................................................................... 99
Figure 4. 2. Orientation of the four NNRTIs in the HIVRT binding site. (A) Best docked
structure of Sustiva. (B) Nevirapine from pdb entry 1vrt. (C) MKC-442 from pdb
entry 1rt1. (D) 9-Cl TIBO from pdb entry 1rev...................................................... 102
Figure 4. 3. Left − butterfly shapes adopted by Sustiva (red) and nevirapine (green).
Right − the same overlay in CPK colors................................................................. 103
Figure 4. 4. Top − overlays of the binding-site positions of nevirapine, MKC-442, and 9-
Cl TIBO (red) with Sustiva (green). Bottom − the same overlays in CPK colors. 104
Figure 4. 5. Predicted vs. experimental binding mode for Sustiva (rmsd = 0.73 Å). Cα
carbons aligned at Leu 100, Lys101, Val 106, Tyr181, and Tyr 188. Experimental
structure from reference 135. .................................................................................. 105
Figure 4. 6. Thermodynamic cycle used to compute relative fold resistance values. In
this example the wild-type side-chain Tyr (magenta) is perturbed to the mutant side
chain Cys in the presence of Drug A (solid red) and Drug B (checkered red) while
bound to a protein (green). Relative fold resistance (∆∆G) = ∆GB – ∆GA = ∆GMUT –
∆GWT. ...................................................................................................................... 106
Figure 4. 7. Principal point mutations that confer resistance to non-nucleoside HIV-1 RT
inhibitors. The protein is shown as a ribbon trace in green, the mutation sites in red,
and the non-nucleoside binding site in blue. Crystal structure coordinates, pdb entry
1rt1, from reference 88............................................................................................ 108
Figure 5. 1. Clustering protocol for reducing the number of conformers generated from
conformational searches using rmsd geometric similarity...................................... 115
Figure 5. 2. Three lowest energy solutions from rigid docking calculations for trypsin
system 1PPH. The experimental binding mode is shown in magenta and three
docking solutions are shown in green. .................................................................... 121
xi
Page 13
Figure 5. 3. Number of correctly docked structures shown in green from 10 block runs of
1000 Tabu cycles each. ........................................................................................... 125
Figure 5. 4. Example of a shallow and solvent exposed binding site vs. an enclosed
buried binding site................................................................................................... 125
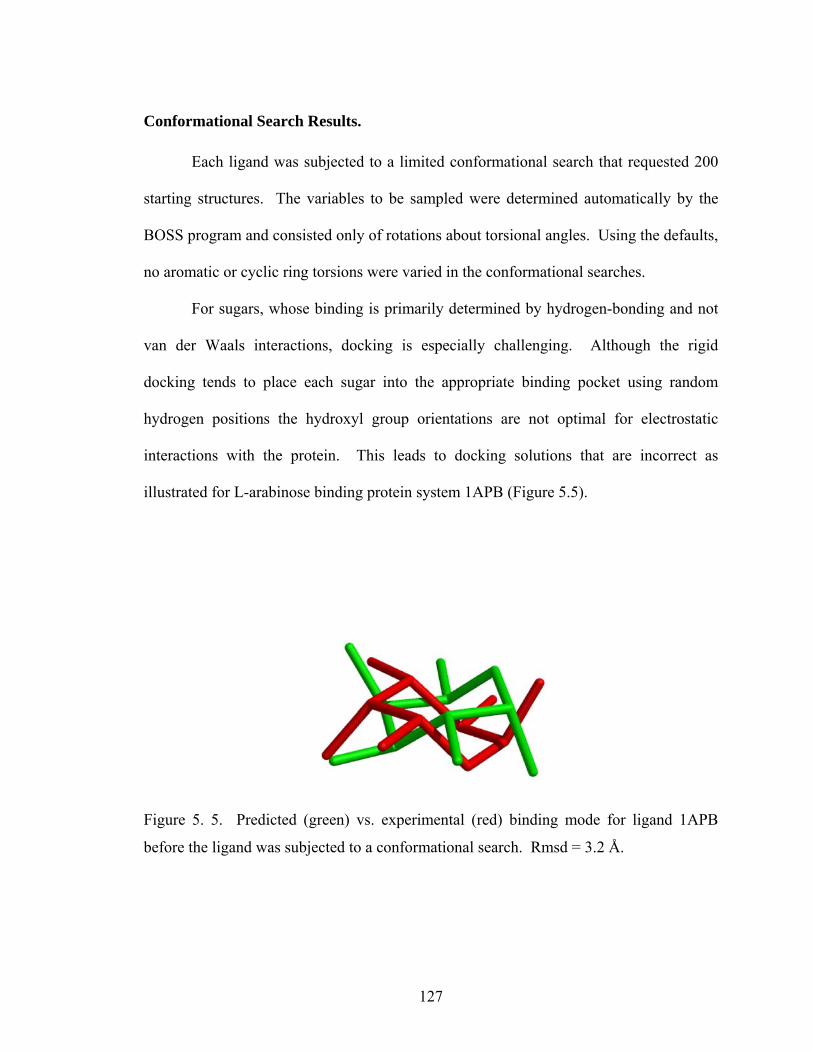
Figure 5. 5. Predicted (green) vs. experimental (red) binding mode for ligand 1APB
before the ligand was subjected to a conformational search. Rmsd = 3.2 Å. ........ 127
Figure 5. 6. Conformational search results for unbound ligand 1APB. The conformers
are overlaid to emphasize the 11 different hydroxyl group rotamers. .................... 129
Figure 5. 7. Lowest energy complex obtained for system 1APB after docking using the
11 conformers obtained from the conformational search. The heavy atom rmsd is
0.67 Å from the crystal structure shown in green. .................................................. 129
Figure 5. 8. Crystal structure conformation (spoke representation) overlaid with best
match conformer (ball and stick representation) from the conformational searches
for ligands 1AE8, 1AJV, 1BMM, and 1DWC........................................................ 130
Figure 5. 9. Crystal structure conformation (spoke representation) overlaid with best
match conformer (ball and stick representation) from the conformational searches
for ligands 1GNO, 1HDT, 1HPV, and 1HSG......................................................... 131
Figure 5. 10. A histogram representation of how similarity values affect the number of
clusters for the 26 most flexible ligands. ................................................................ 136
Figure 5. 11. A visual representation of clustering. The first 4 clusters are shown for
ligand 1HPX and were obtained using a rmsd similarity value of 2.0 Å................ 137
Figure 5. 12. Representative cluster survivors (ball and stick representation) overlaid
with crystal structure conformation (spoke representation).................................... 140
xii
Page 14
List of Tables.
Table 2. 1. Previously Calculated Relative Free Energies of Hydration (kcal/mol) for
Amines. ..................................................................................................................... 22
Table 2. 2. OPLS-AA Bond Stretching Parameters......................................................... 30
Table 2. 3. OPLS-AA Angle Bending Parameters. ......................................................... 30
Table 2. 4. OPLS-AA Fourier Coefficients (kcal/mol).................................................... 32
Table 2. 5. OPLS-AA Non-Bonded Parameters. ............................................................. 34
Table 2. 6. Comparison of Hydrogen-Bond Interaction Energies ( kcal/mol) for Amines.
................................................................................................................................... 36
Table 2. 7. Computed Densities and Heats of Vaporization from Pure Liquid
Simulations. .............................................................................................................. 38
Table 2. 8. Relative Free Energies (kcal/mol) of Hydration (water), Solvation
(chloroform), and Transfer (water → chloroform), and ∆log P for Amines at 25 °C.
................................................................................................................................... 43
Table 2. 9. Linear Response Components (kcal/mol) for Amines in Water.................... 54
Table 3. 1. Inhibition of HIV-1 RT by HEPT Analogs. .................................................. 63
Table 3. 2. Inhibition of HIV-1 RT by Nevirapine Analogs............................................ 64
Table 3. 3. Individual Contributions to the Total Computed Free Energies of Binding for
HEPT Analogs with HIV-1 RT................................................................................. 79
Table 3. 4. Individual Contributions to the Total Computed Free Energies of Binding for
Nevirapine Analogs with HIV-1 RT......................................................................... 80
Table 4. 1. Relative Free Energies of Binding (∆GFR) Estimated from Fold Resistance
(FR) Values. .............................................................................................................. 96
Table 4. 2. Relative Fold Resistance Energies (∆∆G) in kcal/mol for HIV-1 RT
Mutations Normalized to Sustiva............................................................................ 107
xiii
Page 15
Table 5. 1. Protein-ligand Complexes Used in this Study ............................................. 113
Table 5. 2. The Percent of Structures Correctly Docked using the Ligand Crystal
Structure Conformation. ......................................................................................... 122
Table 5. 3. Intermolecular Energies and rmsd Results from Rigid Docking Calculations
for Ligands 1AE8 and 1AAQ. ................................................................................ 124
Table 5. 4. Average CPU Timings for System 1AJV. ................................................... 126
Table 5. 5. Energy Difference Between the Bound-like Conformer and the Lowest
Energy Conformer Found in the Conformational Searches for Eight Different
Ligands.................................................................................................................... 132
Table 5. 6. Cluster Analysis Results. Each Column Tabulates the Number of Rotatable
bonds (Nrot), the Number of Conformers (Nconf) found in the Limited
Conformational Search, and Number of Clusters for 10 different rmsd Similarity
Tolerance Values.. .................................................................................................. 134
Table 5. 7. The Number of Cluster Representatives with an rmsd <= 2.0 Å from the
Ligand Crystal Conformation. Five Cluster Tolerances are Shown. ..................... 139
xiv
Page 16
Preface.
The number of people now infected with the human immunodeficiency virus
(HIV), the etiological agent that causes acquired immunodeficiency syndrome (AIDS), is
50% higher than what was predicted only a decade ago by the Joint United Nations
Programme on AIDS (UNAIDS) and the World Health Organization (WHO).1 Sub-
Saharan Africa is so disproportionately affected by HIV/AIDS that it is difficult for those
of us in less affected areas to comprehend the magnitude of the epidemic (Figure 0.1).
Although the huge populations of India and China have so far experienced minimal HIV
transmission, recent statistics indicate an exponential growth of HIV infection in the
Russian Federation; complacency towards HIV is a continued risk for all nations.2 It
should be noted that most HIV infections worldwide are transmitted through heterosexual
sex or through intravenous drug use.
Figure 0. 1. HIV infection estimates from the World Health Organization and the Joint
United Nations Programme on HIV/AIDS.
1
Page 17
Retroviruses like HIV have evolved to exist as a swarm of virions in which some
viral proteins have slightly different amino acid sequences (mutations) over the largest
population (wild-type) group.3, 4 Because of the variable nature of certain antigenic HIV
coat proteins the immune response is unable to clear all HIV particles from the
bloodstream (passive evasion). 5 HIV can also escape immune surveillance by directly
targeting, infecting, and killing immune response cells (active evasion). AIDS can result
when too many immune cells have been destroyed and opportunistic infections take hold.
Despite these setbacks, substantial progress has been made in reducing the
amount of measurable HIV present in an infected individual. The declining death rates
from HIV/AIDS in the United States (Figure 0.2) and other developed countries can be
attributed in part to aggressive anti-retroviral chemotherapies targeting two proteins
essential for completion of the viral life cycle. HIV reverse transcriptase (HIVRT) is
responsible for copying the viral RNA genome so the virus can replicate, and HIV
protease (HIVPR) processes immature protein strands into complete viral proteins.
Unfortunately, since genetic mutations affect all HIV enzymes, a compound designed to
inhibit wild-type HIVRT, for example, is a less effective inhibitor of mutant HIVRT.
The end result is that the virus is never completely eliminated from the body. To date,
anti-retroviral compounds targeting HIV represent treatment options for postponing
AIDS and are not a cure.
2
Page 18
Figure 0. 2. AIDS and death from AIDS estimates from the Centers for Disease Control
and Prevention.
In the United States and elsewhere, government and private funding in the basic
research towards the study of HIV/AIDS has resulted in HIV (and the associated viral
proteins) being the most examined disease causing virus to date. This has resulted in an
abundance of structural information about HIV that can be used as a starting point for
structure based methods towards the design of improved anti-HIV drugs. In this thesis,
computational advances in structure based drug design, with emphasis on the
development of protocols and methodology, are presented with applications to HIV-1
reverse transcriptase.
3
Page 19
Chapter One
Structure Based Methods for Computational Drug Design
Introduction.
Structure based methods which include computational chemistry are at the
forefront of modern day rational drug design. The modeling of biological systems at the
atomic level can yield thermodynamic and structural information that compliment
experimental methods. If, for example, a better physical understanding of how drugs
interact with their targets can emerge from such studies it is hoped that more effective
chemotherapeutics can be designed. The computational chemist and molecular modeler
often wants to understand why a given drug binds better to its target than does another,
and the prediction of binding affinity is of particular importance. Although binding
affinity is only part of the process in drug discovery, strong binding to the therapeutic
target is important for any drug candidate. Increasing the affinity of a compound for its
target may lead to a reduced dose size that may in turn lower toxicity/side effect
problems associated with all drugs.
Usually, Cartesian coordinates typically used as a starting point for structure
based computer simulations are obtained from X-ray crystallography and nuclear
magnetic resonance (NMR) experiments. However, structure prediction methods can be
used to compute the binding mode of a novel compound using a receptors of known
structure (docking), or used to generate a target model of unknown structure using
information from related proteins (homology modeling). The drug target is often a
protein in which some therapeutic benefit will result if the normal enzymatic function of
4
Page 20
the protein can be reduced i.e., inhibited. Although the targets themselves may be quite
large many enzyme inhibitors are small organic molecules.
Molecular mechanics is the technique most often used by
computational/theoretical chemists to model biological systems in the condensed phase
(includes solvent). This thesis describes ongoing advancements in molecular mechanics
force-field parameterization (Chapter Two), in protocol and simulation method
development for modeling protein−ligand binding (Chapter Three), in structure
prediction as well as determination of binding affinity differences for inhibitors with
mutant proteins (Chapter Four), and docking (Chapter 5). The simulation methods and
protocols described in this thesis are completely general and may be applied to any
protein−ligand system provided that some initial structural information about the drug
target is known and in which the binding of the ligand to the protein is non-covalent.
Monte Carlo and Molecular Dynamics Methods.
Monte Carlo. Most of the simulation results in this thesis have been obtained
via molecular mechanics simulation which employ Monte Carlo (MC) statistical
mechanics sampling methods as first introduced by Metropolis and coworkers.6
Metropolis et al. devised a scheme in which thermodynamic averages of desirable
properties could be computed by focusing only on choosing configurations of a system
which will have a Boltzmann weighted distribution of energies rather than trying to
evaluate all possible states of a system. New configurations of a state can be obtained,
for example, by varying the internal degrees of freedom such as bond lengths, bond
angles, or dihedral angles, or through rigid body rotations and translations or volume
5
Page 21
changes. During the course of the simulation, if a new configuration is generated that has
an energy less than the previously evaluated configuration (∆E < 0) the MC move is
always accepted (Figure 1.1). If the new configuration has an energy greater than the
previous configuration (∆E > 0) then the move is accepted having Boltzmann probability
exp(−∆E/RT). This is achieved by generating a random number ξ (between 0 and 1) and
accepting uphill moves with ξ > exp(−∆E/RT) but rejecting moves with ξ <
exp(−∆E/RT).
Figure 1. 1. The Metropolis Monte Carlo sampling method. Figure adapted from
reference 7.
6
Page 22
The algorithm forces the chain of configurations that are generated to be low in
energy. The lower energy states of a system are usually the most important since they are
expected to be the most populated and will contribute the most towards any average
thermodynamic property. Statistical uncertainties (±1σ) in the computed properties are
obtained through the batch means procedure (eq 1.1) where m is the number of batches
and θi is the average of property θ in the i-th batch.8
∑ −−=m
ii mm )1(/)( 22 θθσ (1. 1)
Molecular Dynamics. Molecular dynamics (MD) methods rely on Newton's
equations of motion, which relate how forces influence position and velocity over time
according to eq 1.2.7 Here, Fi is a force acting on a particle i of mass mi with acceleration
ai.
iii amF = (1. 2)
Force is the negative gradient of the potential energy (Etot), acceleration is the second
derivative of the atomic position with respect to time (t), and velocity (v) is the first
derivative of the atomic position with respect to time. From these relationships the key
differential equation to be solved for MD methods is shown for one particle i along one
coordinate x, eq 1.3.
7
Page 23
2
2
tot)(
)(dt
trdmrE i
ii
rr
=∇− (1. 3)
The Verlet algorithm is the most widely used method to compute the coordinates for a
new time step although other methods exist for evolution of eq 1.3.7 The Verlet method
uses the current set of coordinates and accelerations at time t and the previous set of
coordinates at time (t − δt) to compute the new coordinates (r) at a new time (t + δt) as
shown in eq 1.4.9
)()()(2)( 2 tatttrtrttr +−−=+ δδ (1. 4)
It should be noted that time averaged properties obtained via a MD simulation
should be the same (within standard error) as ensemble averaged properties from a MC
simulation (the ergodic principle), provided each simulation utilized the same potential
energy function and all results have fully converged.7
Potential Energy.
Regardless of the simulation method (MC or MD) classical potential energy
expressions (force fields) are normally used to evaluate the total energy of the system.10
The most standard form of the function consists of harmonic bond-stretching and angle-
bending terms, a truncated Fourier series for torsional energetics, and Coulomb and
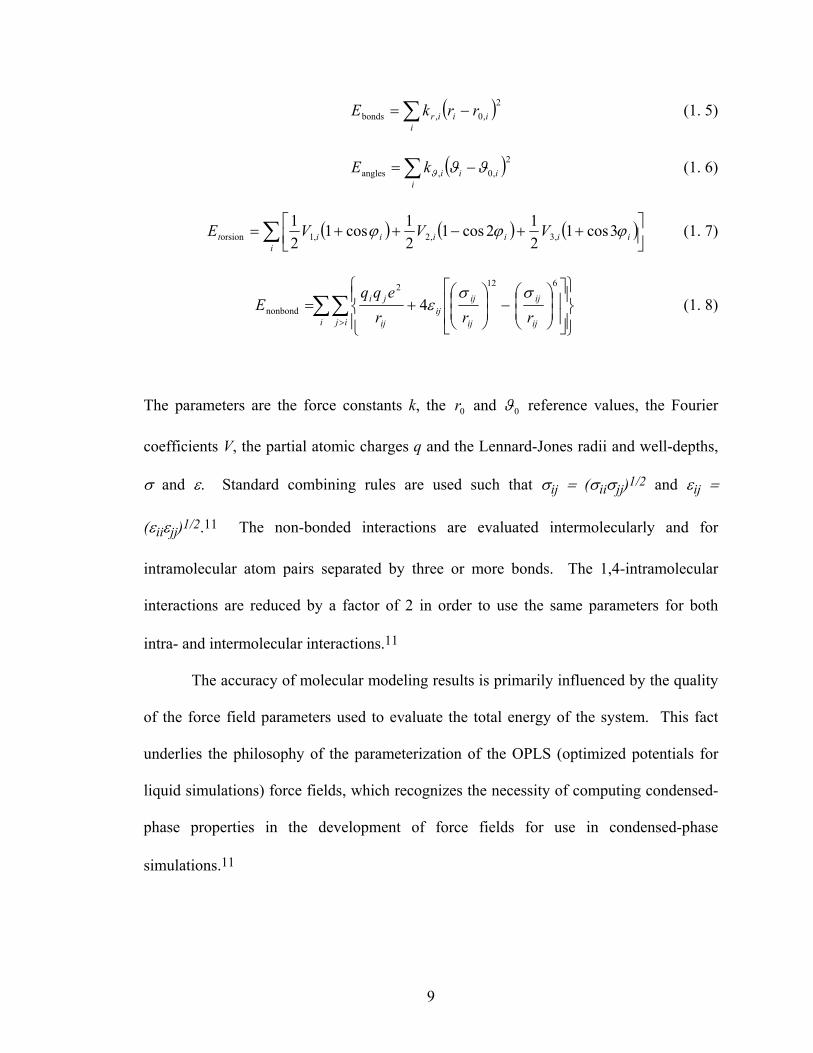
Lennard-Jones terms for the nonbonded interactions, eqs 1.5−1.8.11
8
Page 24
( )2,0,bonds ∑ −=
iiiir rrkE (1. 5)
( )2,0,angles ∑ −=
iiiikE ϑϑϑ (1. 6)
( ) ( ) (∑ ⎥⎦⎤
⎢⎣⎡ ++−++=
iiiiiiit VVVE ϕϕϕ 3cos1
212cos1
21cos1
21
,3,2,1orsion ) (1. 7)
∑∑> ⎪⎭
⎪⎬⎫
⎪⎩
⎪⎨⎧
⎥⎥
⎦
⎤
⎢⎢
⎣
⎡
⎟⎟⎠
⎞⎜⎜⎝
⎛−⎟
⎟⎠
⎞⎜⎜⎝
⎛+=
i ij ij
ij
ij
ijij
ij
ji
rrreqq
E6122
nonbond 4σσ
ε (1. 8)
The parameters are the force constants k, the and 0r 0ϑ reference values, the Fourier
coefficients V, the partial atomic charges q and the Lennard-Jones radii and well-depths,
σ and ε. Standard combining rules are used such that σij = (σiiσjj)1/2 and εij =
(εiiεjj)1/2.11 The non-bonded interactions are evaluated intermolecularly and for
intramolecular atom pairs separated by three or more bonds. The 1,4-intramolecular
interactions are reduced by a factor of 2 in order to use the same parameters for both
intra- and intermolecular interactions.11
The accuracy of molecular modeling results is primarily influenced by the quality
of the force field parameters used to evaluate the total energy of the system. This fact
underlies the philosophy of the parameterization of the OPLS (optimized potentials for
liquid simulations) force fields, which recognizes the necessity of computing condensed-
phase properties in the development of force fields for use in condensed-phase
simulations.11
9
Page 25
Pure Liquid Properties.
Frequently, pure liquid simulation results are used to guide force-field
parameterization. The parameters are adjusted to achieve maximal agreement with
experiment. This helps to insure that the simulation results are accurate and
interpretations based on the results more meaningful. The density and heats of
vaporization are the two key thermodynamic properties that can be readily computed
from the simulation results and compared with experiment. The density is computed
from the molecular weight of the compound and the average molecular volume. The
molecular volume is obtained by dividing the average size of the simulation cell by the
number of molecules used in the pure liquid simulation. The heat of vaporization for
flexible molecules requires a separate gas-phase simulation in addition to the pure liquid
simulation and can be computed from the simulation results using eq 1.9.
RTEEHHH +−=∆−∆=∆ )liquid()gas( totintraliquidgasvap (1. 9)
Here, Eintra(gas) is the average intramolecular energy in the gas-phase, and Etot(liquid) is
the total potential energy of the liquid consisting of both the average intramolecular
energy of the liquid Eintra(liquid) and the average intermolecular energy of the liquid
Einter(liquid). The PV-work term in the enthalpy is equal to RT for the ideal gas and it is
negligible for the liquid.
Pure liquids are usually simulated in the NPT ensemble (constant number of
particles, pressure, and temperature) which most closely approximates normal
experimental conditions and employ periodic boundary conditions as introduced by
10
Page 26
Metropolis et al.6 Simulation results for 17 amine compounds (aliphatic, cyclic, and
aromatic molecules) using cubic cells of 267 molecules each is presented in Chapter
Two. A recent review detailing MC simulations for pure liquids has been published.8
Free Energy Perturbations.
Free energy perturbation (FEP) methodology as first introduced by Zwanzig12 is
generally regarded as the most accurate method for the computation of free energy for a
variety of thermodynamic properties. The free energy change between two systems A to
B is computed according to eq 1.10, where kb is Boltzmann's constant, T is the
temperature, E is the total potential energy for the full system with A or B, and the
averaging is performed for system A.12
( ) ( )[ ]AbABbAB /explnBA∆ TkEETkGGG −−−=−=→ (1. 10)
Although the Zwanzig equation is exact, in practice the perturbation must be small or
convergence of the free energy is slow. Convergence of eq 1.10 is usually promoted in
two ways (1) molecules A and B are usually quite similar, i.e., related analogs that differ
minimally in functionality and (2) a coupling parameter λ is introduced to allow gradual
interconversion of the potential functions and geometries, ξ, of A and B (eq 1.11).
( ) AB 1)( ζλλζλζ −+= (1. 11)
11
Page 27
Several incremental mutations are performed between λ = 0 (A) and λ = 1 (B). A
typical ∆λ is ±0.05, which requires 10 separate simulations (windows) for the full
mutation using double-wide sampling.13 Frequently however, smaller ∆λ values are used
near the end points of the mutations, where the free energy changes are often largest or
noisiest. Plots of ∆G vs. λ can be monitored to asses the convergence of the FEP by
looking for a smooth free energy profile that changes little with increased averaging.
In practice, a relative rather than absolute free energy is most often computed due
to convergence and standard state issues. Since free energy is a state function, and by
definition path independent, a thermodynamic cycle can be constructed for many types
thermodynamic quantities which allow for a comparison between theory and experiment,
as presented below.
12
Page 28
Hydration Free Energy.
The relative free energy of hydration between two molecules A and B can be
determined from the thermodynamic cycle in Figure 1.2.13, 14 In Figure 1.2, ∆Ggas is
evaluated here through a Monte Carlo/Free Energy Perturbation simulation by mutation
of A to B in isolation, and ∆Gwater is obtained by an equivalent mutation in the presence
of explicit water molecules. Note that ∆Ghyd(A and B) are the experimental free energies
of hydration for molecules A and B that are related to the theoretically determined values
by eq 1.12.
(A)∆(B)∆∆∆∆∆ hydhydgaswaterhyd GGGGG −=−= (1. 12)
Figure 1. 2. Thermodynamic cycle used to determine the relative free energy of
hydration (∆∆Ghyd) between two molecules A and B.
13
Page 29
Binding Free Energy.
A thermodynamic cycle can be constructed to determine the relative free energy
of binding (∆∆Gb) between two ligands A and B as shown in Figure 1.3. Here, ligand A
is converted to B free in solution (unbound state) to yield ∆Gunbound(A→B) and
complexed with the protein (bound state) to give ∆Gbound(A→B). Each ligand will have
an affinity for the protein P which is reflected in the experimental free energy of binding
∆Gb(A and B) values, corresponding to the two horizontal legs of the thermodynamic
cycle. As before, the quantities are related and a theoretical prediction can be related to
experiment via eq 1.13.
(A)∆(B)∆)BA(∆)BA(∆)BA(∆∆ bbunboundboundb GGGGG −=→−→=→ (1. 13)
Figure 1. 3. Thermodynamic cycle used to determine the relative free energy of binding
(∆∆Gb) between two molecules A and B to a protein P.
14
Page 30
Relative Fold Resistance.
A thermodynamic cycle has been devised and used to compute a relative fold
resistance energy as shown in Figure 1.4 which leads to eq 1.14.
ABWTMUT ∆∆∆∆B)(A∆∆ GGGGG −=−=→ (1. 14)
Here, fold resistance (FR) is the ratio of mutant (MUT) activity to wild-type (WT)
activity and quantifies the loss in binding affinity for a compound due to a particular
mutation in the target enzyme. FR can be converted to a free energy via ∆G = RT ln FR.
The quantities are related with ∆∆G being the experimentally observable difference in the
fold resistance values given by RT ln FRB – RT ln FRA and is equivalent to the difference
in the simulations results ∆GMUT − ∆GWT.
Figure 1. 4. Thermodynamic cycle used to determine the relative fold resistance (∆∆GFR)
between two molecules A and B, a wild-type protein (PWT), and mutant protein (PMUT).
15
Page 31
Linear Response and Extended Linear Response Methods.
A more approximate method for the estimation of free energies of binding ∆Gb is
based on linear response (LR) theory, as introduced by Åqvist and coworkers (eq 1.15).15
This approach is considerably faster than standard FEP simulations because no
intermediate transformation process is required to calculate the binding affinity.15 Only
the endpoints (states A and B) of the binding free energy thermodynamic cycle are
simulated which typically results in CPU savings by at least a factor of 10.
Coulvdwb ∆∆∆ EβEαG += (1. 15)
Here, signifies an ensemble average of the difference (bound − unbound) in
interaction energies (∆E) of the inhibitor−solvent plus inhibitor−protein interaction
energies in the bound state and of the inhibitor−solvent interaction energies in the
unbound state.15 The two energy terms represent the differences in average van der
Waals (Lennard-Jones) and electrostatic (Coulombic) contributions, respectively, which
are normally calculated using a molecular mechanics force field and either MD or MC
simulations. The Coulombic energy differences were originally scaled by a factor β =
0.50, while the coefficient α was determined by fitting the simulation results to known
experimental binding affinities.15
Jorgensen et al. introduced an extension of the LR approach for the calculations of
free energies of solvation, which corresponds to eq 1.16 for computing free energies of
binding.16, 17 In this extended linear response (ELR) approach, both coefficients, α and
16
Page 32
β, are allowed to vary, and a third term representing the solvent accessible surface area
(SASA) of the solute is included, and scaled by a coefficient γ. The rationale for the
SASA term is that it provides a means to account for possible positive free energies of
hydration caused by the penalty for solute cavity formation in water.16, 17
∆SASA∆∆∆ Coulvdwb γEβEαG ++= (1. 16)
Encouraged by prior MD/LR15, 18-22 and MC/ELR23-25 binding studies, we endeavored
to treat larger data sets to see if good correlations to experiment could still be obtained.
Recently, Duffy and Jorgensen have correlated results from aqueous MC simulations
with solvation properties for more than 200 diverse organic compounds.26 The
descriptors were expanded from those in eq 1.16 to include, for example, hydrogen-bond
counts and the hydrophobic, hydrophilic and aromatic components of the solvent-
accessible surface area. A multivariate fitting approach was used which corresponds to
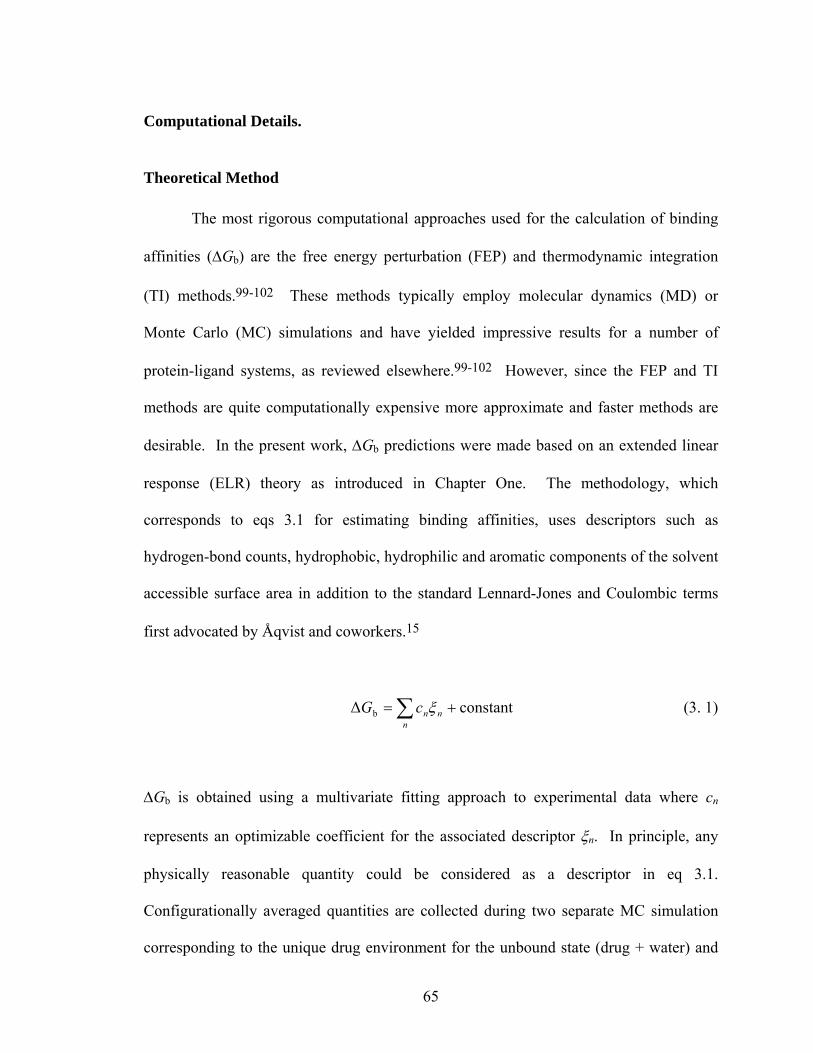
eq 1.17 for computing binding affinities.
constant∆ b += ∑n
nnξcG (1. 17)
Here, cn represents an optimizable coefficient for the associated descriptor ξn. In
principle, any physically reasonable quantity could be considered as a descriptor.
Specifically relevant to protein-ligand binding was the success in predictions of log P
(octanol/water) for 200 solutes. Only four descriptors were needed to yield a correlation
17
Page 33
with r2 = 0.91 and a rms error of 0.53.26 Given the potential parallel between solute
octanol/water partitioning and ligand protein/water partitioning, we sought to consider
alternative descriptors too for protein-ligand binding using a data set comprising of 40
non-nucleoside inhibitors of HIV-1 reverse transcriptase, as presented in Chapter 3.
It should be emphasized that the ELR method relies on using experimental data,
in conjunction with a set of descriptors obtained via computer simulations, to derive a
regression equation. However, once a reasonable, cross-validated regression equation is
derived, no additional experimental data is needed in order to make activity predictions
for novel compounds. Simulations for the bound and unbound states are all that is
needed to make activity predictions for any new compound. Ideally, a universal
regression equation (scoring function) may emerge through additional studies.
18
Page 34
Chapter Two
OPLS All-Atom Model for Amines: Resolution of the Amine Hydration
Problem
Background.
One particularly notable area where classical force fields have failed is in the
calculation of free energies of hydration for both amines and amides.27, 28 Specifically,
calculated free energies of hydration (∆Ghyd) have not been in agreement with observed
experimental trends for the amine series,29, 30 ammonia, methylamine, dimethylamine,
and trimethylamine, and for the amide series,31 acetamide (ACT), N-methylacetamide
(NMA), and N,N-dimethylacetamide (DMA). Experimentally, these molecules show
counterintuitive hydration behavior with increasing methyl substitution.27, 28 That is,
one might expect that replacement of an amino hydrogen by a seemingly hydrophobic
methyl group would lead to an unfavorable (positive) contribution to the free energy of
hydration. In fact, the experimental data for ammonia and methylamine reveal the
opposite trend with a ∆∆Ghyd of –0.26 kcal/mol.29, 30 Subsequent methylations do
decrease the hydrophilic character with a ∆∆Ghyd (methylamine → dimethylamine) of
+0.27 kcal/mol and a ∆∆Ghyd (dimethylamine → trimethylamine) of +1.06 kcal/mol.
Furthermore, amides exhibit a similar sequence with a favorable relative free energy of
hydration ∆∆Ghyd (ACT → NMA) of –0.40 kcal/mol for the first methylation, and an
unfavorable ∆∆Ghyd (NMA → DMA) of +1.53 kcal/mol for the second methylation.31 A
19
Page 35
general consensus does not exist concerning the physical basis of these anomalous
hydration trends.
Previous Simulation Studies.
Given the biological importance of the amide and amine functional groups,
numerous computer simulations have been performed in an effort to study the anomalous
hydration patterns. For focusing on the amines, computational studies have employed
standard classical potential energy functions and polarizable potential functions in MD
simulations with explicit solvent molecules, and self-consistent reaction field (SCRF)
methods.27, 28, 32-37 However, all of the MD and most of the SCRF calculations have
yielded serious discrepancies with the experimental data (Table 2. 1).
Early studies by Rao and Singh32 used MD/FEP calculations with an all-atom
AMBER force field to obtain the results for the amine series in Table 2. 1, column A.
Although the computed relative free energies obtained for the first and third methylations
are close to the experimental values, the second methylation yielded a ∆∆G of 1.93
kcal/mol, much higher than the experimental result of 0.27 kcal/mol. This study also
suffered from large hysteresis in the computed van der Waals (Lennard-Jones)
component of the free energy change and short simulation times. Kollman and
coworkers also used MD/FEP methods and found significant disagreement between
calculated and experimental values for the amines using both the pairwise-additive
AMBER 4.0 potentials27 and a fully polarizable model33 (Table 2. 1, columns B and C).
The simulations consistently revealed increasingly positive ∆∆Gs with increasing methyl
substitution. Likewise, Ding et al.28 used MD/FEP methods to calculate ∆∆Ghyd for the
20
Page 36
amine series with and without polarization (Table 2. 1, columns D and E). The errors are
again large; although polarization seems to provide some improvement, the error for the
methylamine to dimethylamine transformation is still greater than 2 kcal/mol.
Subsequently, Marten et al.34 tried SCRF calculations with a polarizable
quantum-mechanical solute and a dielectric continuum representation of the solvent.
Despite the more sophisticated treatment of the solute, the computed relative free
energies of hydration obtained were essentially constant at 1.5−1.8 kcal/mol, once again
in significant disagreement with the experimental data (Table 2. 1, column F). These
researchers were able to reproduce the observed hydration results only by including a
hydrogen-bond correction term to fit the experimental data.34 Barone et al. have recently
noted the sensitivity of SCRF results to the choice of atomic radii.36 Notably, Marten et
al.34 also reported hydrogen-bond strengths for the amines with a water molecule as both
donor and acceptor using two force fields (OPLS* and AMBER*) and ab initio
LMP2/cc-pVTZ(-f) calculations. The authors concluded that hydrogen-bonding
interactions are improperly modeled by the force fields. In particular, the amines are too
good as hydrogen-bond donors and the nearly constant acceptor strength is not
reproduced with the force fields. It should be noted that OPLS parameters have only
been reported previously for primary amines.11, 14 The OPLS* parameters used in the
MacroModel program and other "OPLS" parameters28 for secondary and tertiary amines
were not developed in our laboratory.
21
Page 37
Table 2. 1. Previously Calculated Relative Free Energies of Hydration (kcal/mol) for
Amines.
perturbation
FEPa
A
FEPb
B
polariz.
FEPc
C
FEPd
D
polariz.
FEPd
E
SCRF
GVBe
F exptlf
ammonia →
methylamine −0.07 ± 0.13 0.62 ± 0.05 0.38 ± 0.06 1.13 ± 0.19 0.3 ± 0.5 1.8 −0.26
methylamine →
dimethylamine 1.93 ± 0.08 1.62 ± 0.01 1.32 ± 0.03 3.16 ± 0.25 2.5 ± 0.6 1.8 0.27
dimethylamine →
trimethylamine 1.17 ± 0.06 2.34 ± 0.02 2.90 ± 0.09 2.29 ± 0.32 0.6 ± 0.6 1.5 1.06
aReference 32. bReference 27. cReference 33. dReference 28. eReference 34. fReferences 29 and 30.
Because of the success in reproducing experimental free energies of hydration
using FEP methods for numerous organic molecules,38, 39 the discrepancy between
theory and experiment for the amines is troublesome. In addition, the widespread interest
in structure-based drug design necessitates accurate models for amines since they are
very common components in drugs. In this paper, OPLS-AA (all-atom) parameters are
reported for ammonia and for primary, secondary, and tertiary amines. As usual, the
development has considered molecular structures, conformational energetics, hydrogen
bonding, pure liquid properties, and relative free energies of hydration. The number of
new parameters is kept to a minimum. The parameter set was developed for ammonia,
methylamine, dimethylamine, and trimethylamine. Subsequent testing covered a variety
of additional primary, secondary, and tertiary amines including cyclic and aromatic
amines. Simulations in chloroform were also carried out for the four key amines in order
22
Page 38
to test the suitability of the parameters in less polar environments. This permitted
computation of relative free energies of transfer and comparison with experimental
partition coefficients, log P.
Computational Details.
Force Field Parameterization.
The standard form of the classical potential energy function used in this study has
been presented in Chapter 1. Bond-stretching and angle-bending parameters were
initially assigned from the OPLS-AA parameter set,11 which includes many entries from
the AMBER all-atom force field.40 Each atom has an associated AMBER atom type that
is used to designate the parameters for atom pairs (bond stretching) or atom triplets (angle
bending). The AMBER atom types used here are NT (amine nitrogen), H (hydrogen on
nitrogen), CT (aliphatic carbon), HC (hydrogen on aliphatic carbon), CA (aromatic
carbon), and HA (hydrogen on aromatic carbon). The present work then focused on the
development of the Fourier coefficients, partial charges, and Lennard-Jones parameters.
Parameterization is an iterative process. First, a Z-matrix was constructed for
each amine, and initial parameters were assigned on the basis of the published values for
primary amines.11 Replacement of amino hydrogens by OPLS-AA methyl groups
yielded trial partial charges for secondary and tertiary amines, and initial parameters for
ammonia were taken from the work of Gao et al.41 Gas-phase energy minimizations
were then performed with the BOSS program42 with the use of these parameters. The
geometries obtained were compared with those from experiments and from ab initio
23
Page 39
optimizations at the RHF/6-31G* level. This provided a basis for adjusting the
parameters for bond stretching and angle bending. The ab initio calculations were
performed with Gaussian 95.43 The procedure for determination of missing Fourier
coefficients has been described.11 Briefly, an energy scan was performed for examples
of the missing torsions with RHF/6-31G* calculations. A full geometry optimization was
done at each point with the exception of the chosen dihedral angle. Similarly, the same
energy scans were carried out using the force field with the BOSS program and with the
Fourier coefficients for the missing torsion set to zero. Then, the relative energies from
the scans are used as input to the Simplex-based fitting program, Fitpar,44 to determine
the Fourier coefficients that minimize the differences between the RHF/6-31G* and
force-field results. The initial Fourier coefficients often require refitting when the atomic
charges and Lennard-Jones parameters are subsequently adjusted.
The observation of Marten et al.34 concerning the flawed representation of
hydrogen bonding of amines with water guided our early assignments of the partial
charges for amines. The charges for H(N), N, and C were adjusted to reproduce the
LMP2 interactions energies for each complex of the four prototypical amines with a
water molecule.34 For comparison, we also computed the corresponding interaction
energies at the RHF/6-31G* level. In each case, all degrees of freedom were optimized.
However, it was necessary to constrain the hydrogen bonds to be linear for the RHF/6-
31G* calculations in which water was the hydrogen-bond acceptor, to avoid
rearrangements.
When satisfactory agreement with molecular structures, torsional energy scans,
and hydrogen-bond strengths was obtained, MC simulations for the four pure liquids
24
Page 40
were performed. Some adjustments of the partial charges and Lennard-Jones parameters
were made so that calculated properties for the pure liquid amines agreed well with
experiment. In general, the computed heats of vaporization are most affected by the
choice of partial charges, while densities are particularly sensitive to the Lennard-Jones
radii. Since our efforts were guided by consideration of multiple types of experimental
and ab initio data, the final parameter set reflects a compromise. If satisfactory results
had not been obtained with the OPLS-AA model, we would have considered
augmentation with an extra interaction site in a lone-pair position on nitrogen. This
turned out not to be necessary. We did not expect that explicit polarization would be
needed in view of the prior successes with so many other organic liquids and water.11, 45
Pure Liquid Simulations.
The Metropolis Monte Carlo simulations6 were performed with the BOSS
program on Silicon Graphics workstations or a multiprocessor Pentium cluster running
Linux. All molecules were fully flexible, which necessitates that MC simulations be
performed for both the ideal gas and liquid in order to compute heats of vaporization,
∆Hvap. The calculations were executed in the NPT ensemble at 1 atm and at either the
normal boiling point of the liquid or at 25 °C. Gas-phase simulations consisted of 3
million configurations of equilibration, followed by 3 million configurations of
averaging. For the pure liquids, periodic boundary conditions were employed with cubic
cells of 267 molecules. The equilibrated box sizes ranged from approximately 22 × 22 ×
22 Å for ammonia to 40 × 40 × 40 Å for triethylamine. Intermolecular non-bonded
interactions were truncated at 11 Å, based roughly on the center-of-mass of each
25
Page 41
molecule, and quadratically feathered to zero over the last 0.5 Å. For nonaqueous
solvents, a standard correction is made for Lennard-Jones interactions neglected beyond
the cutoff.8 Each liquid was first equilibrated for 12 million configurations and the
averaging occurred over an additional 12 million configurations, which were run in
batches of 500,000 configurations. Overall, the computed densities, heats of
vaporization, radial distribution functions, energy distributions and conformational
properties are very well converged with MC simulations of this length. By adjusting the
allowed ranges for rigid-body rotations, translations, and dihedral angle movement,
acceptance ratios of between 40% for aliphatic amines and 18−20% for cyclic and
aromatics amines were obtained for new configurations. The ranges for bond stretching
and angle bending are set automatically by the BOSS program on the basis of the force
constants and temperature.
It should be noted that more than one set of non-bonded parameters may yield
calculated densities and heats of vaporization in close agreement with experiment. For
ammonia, 25 pure liquid simulations were run using different non-bonded parameter sets.
Six of these yielded a calculated density and heat of vaporization within 3% of the
experimental values. Only parameter sets for ammonia were further considered if they
also yielded reasonable hydrogen-bond energetics with water and a qualitatively correct
free energy of hydration relative to methylamine. Otherwise, free energies of hydration
were not considered in the parameterization.
26
Page 42
Free Energy Perturbations.
As an example, the relative free energies of hydration for methylamine and
ammonia can be determined from the thermodynamic cycle in Figure 2.1, which leads to
eq 2.1.13, 14
)NHCH()NH( 23hyd3hydgaswatehyd GGGGG r ∆−∆=∆−∆=∆∆ (2. 1)
Figure 2. 1. Thermodynamic cycle used to determine the relative free energy of
hydration (∆∆Ghyd) between methylamine and ammonia.
∆Ggas is evaluated here through MC/FEP simulations by mutation of methylamine to
ammonia in isolation, and ∆Gwater is obtained by an equivalent mutation in the presence
27
Page 43
of explicit water molecules. Their difference can then be compared to the difference in
experimental free energies of hydration.
All of the present free energy perturbations consisted of mutating a methyl group
to a hydrogen atom. The three methyl hydrogens are mutated to dummy atoms, which
have zero for q, σ, and ε, and the methyl carbon is mutated to the appropriate secondary,
primary, or ammonia hydrogen, H(NT). For these fully flexible systems, we retain the
CT−HC force constants for the H(NT)-dummy pairs, but reduce the r0 to 0.3 Å. For the
angle bending, we retain only one angle to the dummy atom with nonzero parameters.
This combination keeps the dummy atom in a reasonable position without placing any
constraint on the final structure, that is, the same total energy is obtained from an energy
minimization with or without the dummy atom.46
The use of flexible geometries for the solutes requires computation of ∆Ggas in
Figure 2.1. In this case, the MC simulation for each window consisted of 3 million
configurations of equilibration followed by 3 million configurations of averaging. The
ranges for dihedral-angle changes were adjusted so that ca. 40% acceptance for new
configurations was achieved. Convergence was monitored by plotting the results for
∆Ggas vs. λ, which showed little change after 1 million configurations of averaging.
The FEP calculations in water were performed for a single solute in a periodic
cube with 500 TIP4P water molecules.47 Both solute−solvent and solvent−solvent
cutoffs were at 10.0 Å based roughly on the separations of amine nitrogens and water
oxygens. Each window consisted of 6 million configurations of equilibration, followed
by 8 million configurations of averaging. Negligible differences in the computed free
energy changes occurred after 5 million configurations of averaging. Similarly, as in the
28
Page 44
pure liquid simulations, adjustment of the allowed ranges for rigid body rotations,
translations, and dihedral angle movements yielded acceptance rates of 30−50% for new
configurations. The simulation protocol in chloroform was the same except that the
number of chloroform molecules was 267 and the solvent−solvent, and solute−solvent
cutoffs were extended to 12.0 Å. The potential functions for chloroform are the OPLS 4-
site model.14
Results and Discussion.
Force Field Parameters.
The final OPLS-AA parameters for amines are reported in Tables 2.2−2.5. The
bond-stretching and angle-bending parameters (Tables 2.2 and 2.3) are mostly from prior
work.11 Missing combinations of atom types for aromatic amines, for example, the
CA−NT bond-stretching and CA−NT−H, CA−CA−N, and CA−NT−CT angle-bending
parameters, were extrapolated from related types and adjusted to yield good accord with
RHF/6-31G* optimized geometries. As before,11 the molecular structures from OPLS-
AA optimizations are essentially identical to RHF/6-31G* results; for bond lengths and
bond angles involving nitrogen, the average deviations are 0.01 Å and 1.5°. Furthermore,
the average differences between the computed results and experimental data are 0.02 Å
for bond lengths and 2° for bond angles.
29
Page 45
Table 2. 2. OPLS-AA Bond Stretching Parameters.
bond kb (kcal mol-1 Å-2) r0 (Å)
H−NT 434.0 1.010
CA−NT 481.0 1.340
CT−NT 382.0 1.448
CA−HA 367.0 1.080
CT−HC 340.0 1.090
CT−CT 268.0 1.529
CA−CA 469.0 1.400
Table 2. 3. OPLS-AA Angle Bending Parameters.
angle kθ (kcal mol-1 rad-2) θ0 (deg)
CT−NT−H 35.00 109.50
H−NT−H 43.60 106.40
CA−NT−H 35.00 111.00
CA−CA−NT 70.00 120.10
CA−NT−CT 50.00 109.50
CA−CA−HA 35.00 120.00
CA−CA−CA 63.00 120.00
CT−CT−HC 37.50 110.70
CT−CT−CT 58.35 112.70
HC−CT−HC 33.00 107.80
CT−CT−NT 56.20 109.47
CT−NT−CT 51.80 107.20
HC−CT−NT 35.00 109.50
30
Page 46
The torsional parameters are listed in Table 2.4. The parameters for primary
amines and hydrocarbons were reported previously and are provided for completeness.11
Additional torsional parameters were developed in this work for the HC−CT−NT−CT and
CT−NT−CT−CT combinations in aliphatic amines and for the CA−CA−NT−H and
CA−CA−NT−CT torsions in anilines. The OPLS-AA parameters reproduce all tested
RHF/6-31G* torsional-energy profiles with an average difference of less than 0.1
kcal/mol for methylamine (HCNH), ethylamine (CCNH, HCCN), propylamine (CCNH,
CCCN), dimethylamine (HCNC), diethylamine (CCNC), trimethylamine (HCNC), and
triethylamine (CCNC).
It was found that cyclic aliphatic amines required unique CT−CT−NT−H and
CT−NT−CT−CT torsional terms in order to obtain close agreement with ab initio results
for equatorial vs. axial disposition of hydrogens or methyl groups on nitrogen in cyclic
amines.
N NR
Requatorial axial
With the reported parameters, there is reasonable accord among the computed
results; for example, for piperidine and N-methylpyrrolidine the equatorial conformers
are preferred by 0.82 and 2.61 kcal/mol with the force field, 0.82 and 3.68 kcal/mol with
RHF/6-31G*//RHF/6-31G*, and 0.36 and 3.44 kcal/mol with B3LYP/6-31G*//RHF/6-
31
Page 47
31G*. For piperidine, higher-level ab initio calculations give values of 0.6−0.9 kcal/mol
and experimental results are 0.2−0.5 kcal/mol.48-50
Table 2. 4. OPLS-AA Fourier Coefficients (kcal/mol).
amine type dihedral angle V1 V2 V3
aliphatic HC−CT−NT−H 0.000 0.000 0.400
aliphatic HC−CT−CT−NT −1.013 −0.709 0.473
aliphatic CT−CT−NT−H −0.190 −0.417 0.418
aliphatic CT−CT−CT−NT 2.392 −0.674 0.550
aliphatic CT−NT−CT−CT 0.416 −0.128 0.695
aliphatic HC−CT−NT−CT 0.000 0.000 0.560
aliphatic HC−CT−CT−HC 0.000 0.000 0.318
aliphatic HC−CT−CT−CT 0.000 0.000 0.366
aliphatic CT−CT−CT−CT 1.740 −0.157 0.279
four-member cyclic CT−CT−NT−H 0.000 4.000 0.000
five-member cyclic CT−CT−NT−H 0.200 −0.417 0.418
six-member cyclic CT−CT−NT−H 0.819 −0.417 0.418
exocyclic methyl group CT−NT−CT−CT 1.536 −0.128 0.695
aromatic CA−CA−NT−H 0.000 2.030 0.000
aromatic CA−CA−NT−CT −7.582 3.431 3.198
aromatic (improper) Z−CA−X−Y 0.000 2.200 0.000
aromatic X−CA−CA−Y 0.000 7.250 0.000
The torsional parameters, which were developed for a monosubstituted functional
group, are then also used for polysubstituted cases. Although this is generally successful,
N,N-dimethylaniline initially seemed problematic. Although nearly exact agreement was
obtained between the OPLS-AA and RHF/6-31G* dihedral-angle energy profiles for both
aniline and N-methylaniline, the RHF/6-31G* torsion scan for the tertiary analog yields a
32
Page 48
rotational barrier of 0.6 kcal/mol, while the force field gives a barrier of 2.2 kcal/mol.
These values are lower than the barriers of ca. 3.7 kcal/mol for aniline and N-
methylaniline from both OPLS-AA and RHF/6-31G*. Estimates from experimental
sources have not converged, but are in the 3−6 kcal/mol range for all three anilines.51 To
investigate the possibility that electron correlation may be important, the dimethylaniline
scan was repeated with B3LYP/6-31G* optimizations. This did yield a higher barrier,
3.5 kcal/mol, and the reported CA−CA−NT−CT parameters have been retained for both
secondary and tertiary anilines.
The non-bonded parameters for amines are listed in Table 2.5. The pattern of
partial charges was largely determined by reproduction of the hydrogen-bond strengths
(vide infra). The partial negative charge on nitrogen becomes more positive by
0.12−0.15 e for each added methyl group, and the charge on the amine hydrogen
becomes more positive by 0.02 e on going from ammonia to primary and then secondary
amines. The charge for hydrogens on α-carbons was fixed at 0.06 e and this then
determined from neutrality the required charges on the α-carbons. The same charges are
used for anilines with neutrality determining the charge for ipso carbons. Thus, only the
charges on N and H(N) were effectively varied and the results form simple patterns. The
charge on nitrogen in ammonia, −1.020 e, ended up only slightly different from Gao's
value of −1.026 e,41 which may reflect the change to a flexible geometry.
33
Page 49
Table 2. 5. OPLS-AA Non-Bonded Parameters.
atom type atom or group q (e−) σ (Å) ε (kcal/mol)
NT ammonia −1.02 3.42 0.170
NT 1º amine −0.90 3.30 0.170
NT 2º amine −0.78 3.30 0.170
NT 3º amine −0.63 3.30 0.170
H(NT) ammonia 0.34 0.00 0.000
H(NT) 1º amine 0.36 0.00 0.000
H(NT) 2º amine 0.38 0.00 0.000
HC(CT) for CT directly bonded to NT 0.06 2.50 0.015
HC alkanes 0.06 2.50 0.030
CT(NT) 1º amine CH3 group 0.00 3.50 0.066
CT(NT) 2º amine CH3 group 0.02 3.50 0.066
CT(NT) 3º amine CH3 group 0.03 3.50 0.066
CT(NT) 1º amine CH2 group 0.06 3.50 0.066
CT(NT) 2º amine CH2 group 0.08 3.50 0.066
CT(NT) 3º amine CH2 group 0.09 3.50 0.066
CA(NT) 1º amine ipso carbon 0.18 3.55 0.070
CA(NT) 2º amine ipso carbon 0.20 3.55 0.070
CA(NT) 3º amine ipso carbon 0.21 3.55 0.070
34
Page 50
The Lennard-Jones parameters in Table 2.5 remained unchanged from the original
OPLS-AA parameter set11 with minor exceptions. For ammonia, the Lennard-Jones σ
needed adjustment to obtain satisfactory agreement with both the experimental density
and heat of vaporization of the pure liquid. Otherwise, the Lennard-Jones parameters for
nitrogens in all amines are the same with σ = 3.30 Å and ε = 0.17 kcal/mol, whereas 3.25
Å and 0.17 kcal/mol had previously been used for primary amines.11 The σ and ε for
amine hydrogens are zero, as always for hydrogens attached to heteroatoms.11 And, for
hydrogens on α-carbons, the reduced ε of 0.015 kcal/mol has been used vs. 0.030 for
alkanes. The same reduced ε is used for α hydrogens in aldehydes, ketones, esters, and
nitro compounds.11 All parameters for more remote alkyl and aromatic carbons and
hydrogens have the standard OPLS-AA values.11 Thus, it turns out that there is little
new in Table 2.5 beyond the choice of charges for N and H(N) in amines.
Gas-Phase Interaction Energies.
The hydrogen-bond strengths for the amine−water complexes from the OPLS*,
AMBER*, and ab initio LMP2 calculations of Marten et al.34 are listed in Table 2.6
along with the present RHF/6-31G* and OPLS-AA results. It is expected that the LMP2
results are highly accurate,52, 53 so they provide the target patterns for the force fields.
Qualitatively, the LMP2 and RHF/6-31G* results show the same trends, a nearly constant
interaction energy around −6 kcal/mol for water as the hydrogen-bond donor and a
significantly weaker interaction of −2 to −3 kcal/mol for water as the hydrogen-bond
acceptor. The incorrect orderings from the MacroModel calculations are well remedied
by the OPLS-AA results. The hydrogen bonds are uniformly 20−30% stronger with the
35
Page 51
OPLS-AA force field than from the LMP2 calculations. Such enhancement of
intermolecular interactions is needed for reproduction of, for example, heats of
vaporization with the fixed charge models.11, 47 This presumably compensates for the
lack of explicit polarization. As an additional check of the robustness of the force field,
enthalpies of interaction were computed from normal mode calculations for ammonia,
methylamine, dimethylamine, and trimethylamine with potassium ion using Åqvist's K+
parameters.54 Excellent agreement with gas-phase experimental data55 was obtained, as
shown in Figure 2.2.
Table 2. 6. Comparison of Hydrogen-Bond Interaction Energies ( kcal/mol) for Amines.
previously reporteda this study
molecule OPLS*b AMBER*b LMP2 RHFc OPLS-AA
Water as a H-Bond Donor
ammonia –7.5 –9.7 –5.5 –6.6 –6.5
methylamine –7.0 –7.6 –5.9 –6.5 –7.4
dimethylamine –6.3 –5.4 –6.1 –6.3 –7.8
trimethylamine –5.1 –3.0 –6.1 –5.9 –7.5
Water as a H-Bond Acceptor
ammonia –4.2 –6.1 –2.2 –2.9 –3.1
methylamine –4.4 –7.3 –2.3 –2.7 –3.6
dimethylamine –4.6 –8.4 –2.4 –2.7 –3.8
aReference 34. bAsterisk denotes MacroModel version. cRHF/6-31G*//RHF/6-31G* optimizations with
water fixed: r(OH) = 0.9572 Å and <HOH = 104.52°. For water as hydrogen-bond donor, six intermolecular
degrees of freedom were optimized. For water as hydrogen-bond acceptor, the H-bond was constrained to be
linear.
36
Page 52
Figure 2. 2. Gas-phase interaction energies and enthalpies (kcal/mol) of amines with
potassium ion. Calculated results are from the OPLS-AA force field, and the
experimental enthalpies are from reference 55.
Pure Liquid Results.
The OPLS-AA parameters for ammonia, methylamine, dimethylamine, and
trimethylamine were developed in conjunction with computation of their liquid densities
and heats of vaporization. These are considered to be the key properties since they reflect
both the size of the molecules and the average intermolecular interactions. The
transferability of the parameters was tested through subsequent MC simulations for the
pure liquids of ethylamine, propylamine, diethylamine, triethylamine, aziridine, azetidine,
pyrrolidine, 1-methylpyrrolidine, piperidine, 1-methylpiperidine, aniline, N-
37
Page 53
methylaniline, and N,N-dimethylaniline. The results are shown in Table 2.7. In all cases,
excellent agreement with experimental densities was obtained with an average unsigned
error of 1%. The heats of vaporization obtained from the MC simulations for the gases
and liquids are also in good agreement with the experimental data in Table 2.7; the
average unsigned error is less than 3%.
Table 2. 7. Computed Densities and Heats of Vaporization from Pure Liquid
Simulations.
density (g/cm3) ∆Hvap (kcal/mol)
liquid T (°C) calcd exptl calcd exptl
ammonia −33.35 0.697 ± 0.001 0.682a 5.42 ± 0.008 5.58a methylamine −6.30 0.698 ± 0.002 0.694b 6.22 ± 0.018 6.17c ethylamine 16.50 0.705 ± 0.002 0.687d 6.95 ± 0.023 6.70e propylamine 25.00 0.717 ± 0.001 0.711f 7.80 ± 0.030 7.47g dimethylamine 6.88 0.658 ± 0.002 0.671d 6.22 ± 0.024 6.33h diethylamine 25.00 0.709 ± 0.001 0.699I 7.84 ± 0.021 7.48g trimethylamine 2.87 0.660 ± 0.001 0.653d 5.32 ± 0.021 5.48j triethylamine 25.00 0.722 ± 0.001 0.723d 8.61 ± 0.028 8.33g aziridine 25.00 0.802 ± 0.001 0.831k 8.20 ± 0.020 8.09l azetidine 25.00 0.820 ± 0.001 0.841m 7.77 ± 0.020 8.17l pyrrolidine 25.00 0.860 ± 0.001 0.854n 9.33 ± 0.024 8.95l 1-methylpyrrolidine 25.00 0.807 ± 0.001 0.799o 7.95 ± 0.022 7.94l piperidine (equatorial) 25.00 0.870 ± 0.001 0.857p 10.71 ± 0.036 9.39l piperidine (axial) 25.00 0.861 ± 0.001 0.857p 8.66 ± 0.028 9.39l 1-methylpiperidine 25.00 0.821 ± 0.001 0.816o 8.81 ± 0.026 8.55l aniline 25.00 1.036 ± 0.001 1.017q 12.78 ± 0.038 12.60r N-methylaniline 25.00 0.975 ± 0.001 0.984q 12.66 ± 0.040 12.70r N,N-dimethylaniline 25.00 0.937 ± 0.001 0.953q 11.68 ± 0.027 11.90r aReference 56. bReference 57. cReference 58. dExtrapolated from reference 59. eReference 60. fReference 61. gReference 62. hReference 63. IReference 59. jReference 64. kReference 65. lReference 66. mReference 67. nReference 68. oReference 69, exptl at 20 °C, simulation at 25 °C. pReference 70. qReference 71. rReference 72.
Piperidine is an interesting case. The pure liquid simulations were normally
started using the lowest-energy conformation for all molecules as determined from the
38
Page 54
gas-phase energy minimizations with the new force field. While acyclic aliphatic and
aromatic amines pose no sampling problems with respect to the intramolecular degrees of
freedom, cyclic aliphatic compounds tend to stay in the original ring conformation, since
ring flipping or inversion barriers are ca. 6 kcal/mol. Although, as mentioned above, the
force field favors equatorial piperidine by 0.8 kcal/mol over the axial form in the gas
phase, pure liquid simulations were run, starting from both conformers, for all piperidine
molecules in the liquid. At the ends of the runs, no molecules had changed conformation
in the equatorial liquid, while only three of the initially axial molecules were equatorial.
The results in Table 2.7 show that the calculated densities for the axial and equatorial
liquids are nearly the same and both are very close to the experimental value of 0.857
g/cm3. However, the calculated heat of vaporization is higher than the experimental
value by 1.3 kcal/mol for the equatorial liquid, while it is too low by 0.7 kcal/mol for the
axial liquid. In both cases the gas is taken as equatorial. The comparison between theory
and experiment suggests that piperidine in the pure liquid is a mixture of equatorial and
axial. The exact mixture could be pursued with a modified MC sampling procedure that
can achieve the equilibrium, although the acceptance rate may be low. On the
experimental side, the conformational preference for piperidine has been the subject of
lively debate.49, 50 The conclusion from numerous spectrocopic measurements is that
piperidine is equatorial in the gas phase and in non-polar solvents, but that it is mostly
axial in alcohol solvents. The possibility of a mixture for the neat liquid near 25 °C
seems reasonable. It may also be noted that for 1-methylpiperidine, the computed and
experimental results in Table 2.7 show the usual level of accord. In this case, the
evidence is that the equatorial form is dominant in all media.49, 50
39
Page 55
Radial distribution functions (rdfs) provide a measure of the local structure in
liquids and coordination numbers can be obtained by the integration of their peaks.8 The
N−N rdfs for the four prototypical amines are presented in Figure 2.3. The loss of
hydrogen bonding for trimethylamine is clearly apparent in the lack of a peak near 3 Å.
Estimates of the numbers of hydrogen bonds per molecule are more readily obtained
from integration of the first peak in the N−H(N) rdfs, which reveal sharper first peaks
with minima near 2.5 Å (not shown). Integration to that point yields average numbers of
hydrogen bonds of 2.56 for ammonia at −33 °C, 1.96 for methylamine at −6 °C, and 1.11
for dimethylamine at 7 °C. The latter figure is consistent with the expected hydrogen-
bonded chains, while more branching is apparent for ammonia and methylamine. The
numerical result for liquid ammonia is similar to the findings from prior simulation,41, 73
while hydrogen-bonding results have not been reported previously for the other amines.
Furthermore, integration of the ammonia N−N rdf from the pure liquid simulations out to
the first minimum at ca. 4.85 Å encompasses 11.5 neighbors. For comparison, the X-ray
results of Narten at +4 °C yield 12.0 neighbors from integration of the N−N rdf to the
minimum at 5.0 Å.74
40
Page 56
Figure 2. 3. N−N radial distribution functions for liquid amines from Monte Carlo
simulations with the OPLS-AA force field. X-ray results for ammonia are at +4 °C from
reference 74. Successive curves are offset 3.0 units along the y-axis.
41
Page 57
Free Energies of Hydration.
Results from the MC/FEP simulations for the relative free energies of hydration
of the four prototypical amines are recorded in Table 2.8. The calculated values are in
excellent agreement with experiment. Methylamine is the most hydrophilic and the large
increments upon increasing methylation obtained previously (Table 2. 1) have been
appropriately ameliorated. Plots of ∆G vs. λ are shown for the perturbations in the gas
phase, water, and chloroform for the three interconversions in Figures 2.4−2.6. The
smoothness of the free energy profiles, which were obtained using a ∆λ of 0.05 for most
windows, attests to the high precision that can be obtained for such MC/FEP calculations
with the BOSS program.
42
Page 58
Table 2. 8. Relative Free Energies (kcal/mol) of Hydration (water), Solvation (chloroform), and Transfer (water → chloroform),
and ∆log P for Amines at 25 °C.
∆∆Ghyd (water) ∆∆Gsolv (CHCl3) ∆∆Gtrans ∆log Pa
perturbation (A → B) calcd exptlb calcd exptlc calcdd exptle calcd exptle
methylamine → ammonia 0.11 ± 0.20 0.26 1.10 ± 0.10 0.8 0.99 ± 0.22 0.49 0.73 ± 0.22 0.36
dimethylamine → methylamine −0.10 ± 0.18 −0.27 0.99 ± 0.14 0.5 1.09 ± 0.23 0.79 0.80 ± 0.23 0.58
trimethylamine → dimethylamine −1.53 ± 0.15 −1.06 0.82 ± 0.16 0.2 2.35 ± 0.22 1.27 1.73 ± 0.22 0.93
a∆log P = log PA − log PB. bReferences 29 and 30. cReference 75. d∆∆Gtrans(calcd) = ∆∆Gsolv(calcd) - ∆∆Ghyd(calcd). eFrom
Masterfile Database, Pomona College Medchem Project & BioByte Corp., Claremont, CA, 1994.
43
Page 59
Figure 2. 4. Plots of ∆G (kcal/mol) vs. λ in the gas phase, water, and chloroform from
free energy perturbation calculations with the OPLS-AA force field: methylamine
ammonia
44
Page 60
Figure 2. 5. Plots of ∆G (kcal/mol) vs. λ in the gas phase, water, and chloroform from
free energy perturbation calculations with the OPLS-AA force field: dimethylamine
methylamine
45
Page 61
Figure 2. 6. Plots of ∆G (kcal/mol) vs. λ in the gas phase, water, and chloroform from
free energy perturbation calculations with the OPLS-AA force field: trimethylamine
dimethylamine.
46
Page 62
Rdfs and energy pair distributions for the four prototypical amines in water were
analyzed to clarify the variations in hydrogen bonding and free energies of hydration.
The first peaks in the N−HW rdfs (amine N−water H) are well resolved in Figure 2.7 and
integration to the minima at 2.5 Å yields estimates of the number of N−HW hydrogen
bonds: 1.23 for ammonia, 1.20 for methylamine, 1.05 for dimethylamine, and 1.09 for
trimethylamine. Thus, not surprisingly, each amine is accepting roughly one hydrogen
bond from a water molecule. Hydrogen-bond donation is characterized by the H(N)−OW
rdfs in Figure 2.8; the first peak can be assigned to hydrogen bonds with the amine
hydrogens, while the larger second peak near 3.5 Å arises from the oxygen of the water
that is donating a hydrogen bond to the nitrogen. The first peaks are not as sharp and
well-defined as in the N−HW rdfs since amines are significantly better hydrogen-bond
acceptors than donors (Table 2.6). Integration to the first minimum near 2.5 Å in the
H(N)−OW rdfs yields estimated numbers of hydrogen bonds of 1.31 for methylamine and
0.82 for dimethylamine. For ammonia, the first peak has become a shoulder, but
integration to the same limit yields an estimate of 1.38 hydrogen bonds. Combining the
results for both types of interactions yields estimates of the total number of hydrogen
bonds with water of 2.61 for ammonia, 2.51 for methylamine, 1.87 for dimethylamine,
and 1.09 for trimethylamine. If the hydrogen bonds had similar strengths, these
decreasing numbers of hydrogen bonds could lead to the erroneous order of increasing
hydrophobicity with increasing methylation.
47
Page 63
Figure 2. 7. N−HW (amine N−water H) radial distribution functions in TIP4P water from
MC simulations with the OPLS-AA force field.
48
Page 64
Figure 2. 8. H(N)−OW (amino H−water O) radial distribution functions in TIP4P water
from MC simulations with the OPLS-AA force field.
49
Page 65
However, variations in the hydrogen-bond strengths are apparent in the energy
pair distributions in Figure 2.9. Hydrogen bonds are reflected in the low-energy bands in
such plots. Integration to the well-defined minima near −3.5 kcal/mol yields the
following numbers for hydrogen bonds: 1.00 for ammonia, 1.11 for methylamine, 1.18
for dimethylamine, and 1.04 for trimethylamine. Clearly, this is the peak for the
hydrogen-bond donating water molecule. Moreover, the average strength of this
interaction increases with increasing methylation until it levels off for dimethylamine and
trimethylamine in Figure 2.9. The hydrogen-bond accepting waters have weaker
interactions that are in the −2.0 to −3.5 kcal/mol region and their number naturally
declines with replacement of amino hydrogens by methyl groups. Thus, qualitatively two
opposing effects can be inferred: increased contribution from hydrogen-bond acceptance
and diminished contribution from the weaker hydrogen-bond donation with increasing
methylation. With thanks to the availability of the ab initio LMP2 results (Table 2.6), the
proper balance of hydrogen-bond strengths is achieved with the OPLS-AA force field and
leads to the correct order of free energies of hydration. If, for example, the amines are
too good as hydrogen-bond donors, as with AMBER*, then the latter effect dominates
and hydrophobicity will increase incrementally with increasing methylation.
50
Page 66
Figure 2. 9. Solute−solvent (amine−water) energy pair distributions from MC
simulations with the OPLS-AA force field. The y-axis records the number of water
molecules per kcal/mol, which interact with the amine solute with the interaction energy
given on the x-axis.
51
Page 67
The concern over the disagreement between prior computation and experiment for
amine hydration has also been emphasized in a recent paper by Miklavc.76 It was argued
that the errors could be explained by inadequate sampling of the torsional motion for the
amines in the aqueous FEP calculations, which would lead to an R ln 3 underestimate in
∆S for each methyl rotor. That is, the FEP calculations in water would only sample one
of the three equivalent rotameric states for conversion of a hydrogen into a methyl group,
while all three conformational states would be sampled in a gas-phase FEP calculation.
Thus, the gain in the number of states would be missed in water. This is not correct,
since the three equivalent rotational states for each methyl group in amines and other
organic molecules are fully sampled in any MD or MC simulations of normal length.
Actually, the real problem is that FEP calculations would yield the same free energy
change for conversion of a hydrogen to a methyl group in which the methyl group rotated
freely or was locked in one conformational well by poor sampling or by a modified
torsional potential. The ∆G contribution from a change in number of conformational
states, m and n, for two systems A and B only becomes apparent through full
characterization of all available conformational states of A and B and their relative free
energies (eq 2.2), as discussed elsewhere.77, 78
⎥⎦
⎤⎢⎣
⎡−−−=→∆ ∑ ∑
m
i
n
jji RTGRTGRTG )/exp(/)/exp(ln)BA( AB (2. 2)
Another View: Energy Components from Linear Response. We have used linear
response methods (Chapter One) to estimate free energies of hydration from the results
52
Page 68
with eq 2.3 where Evdw and ECoul are the van der Waals (Lennard-Jones) and electrostatic
(Coulombic) energy components of the total solute−water interaction energy, SASA is
the solute's solvent-accessible surface area using a probe radius of 1.4 Å for water, and α,
β, and γ are empirical parameters.16, 17
SASACoulvdwhyd γEβEαG ++=∆ (2. 3)
The earlier studies have been expanded with results for 44 diverse organic solutes in
water including the four prototypical amines, all modeled using the OPLS-AA force field
in MC simulations with 500 TIP4P water molecule.79 The optimized parameters are α =
0.410, β = 0.463, and γ = 0.0193 kcal/mol-Å2. The fit yields an average unsigned error of
0.74 kcal/mol for the 44 predicted free energies of hydration in comparison to the
experimental data, which cover a 13 kcal/mol range.
Notably, the predicted ∆Ghyd values for the amine series nicely parallel the
experimental data, as summarized in Table 2.9. The results show that the Lennard-Jones
interactions become more favorable and the surface-area term (penalty for cavity
formation) becomes more unfavorable with increasing methylation. In fact, the
variations of these two components are almost exactly compensating, and the pattern in
total free energies of hydration parallels the changes in the Coulombic solute−water
interactions. This again emphasizes the importance of the hydrogen-bond strengths. It
also supports the above analysis that the trend in free energies of hydration can be
attributed to the opposition of better hydrogen-bond acceptance and poorer hydrogen-
53
Page 69
bond donation with increasing methylation of the amines. The optimal point happens to
occur for methylamine.
Table 2. 9. Linear Response Components (kcal/mol) for Amines in Water.
amine ∆Gvdw ∆GCoul ∆GSASA
calcd
∆Ghyd
exptla
∆Ghyd
ammonia +0.41 −6.41 2.66 −3.34 −4.31
methylamine −0.46 −6.87 3.49 −3.84 −4.57
dimethylamine −1.26 −6.50 4.23 −3.53 −4.30
trimethylamine −2.32 −5.05 4.96 −2.41 −3.24
∆∆Gvdw ∆∆GCoul ∆∆GSASA
calcd
∆∆Ghyd
exptl
∆∆Ghyd
ammonia 0.00 0.00 0.00 0.00 0.00
methylamine −0.87 −0.46 0.83 −0.50 −0.26
dimethylamine −1.67 −0.09 1.57 −0.19 +0.01
trimethylamine −2.73 +1.36 2.30 +0.93 +1.07
aReferences 29 and 30.
54
Page 70
Free Energies of Transfer and ∆log P Results.
As a further test of the transferability of the OPLS-AA parameters, FEP
calculations were also performed for the amine series in chloroform (Table 2.8). The free
energy of transfer of a solute i between water and chloroform is related to its partition
coefficient (Pi) via eq 2.4.
)()(log3.2)( hydsolvtrans iGiGPRTiG i ∆−∆=−=∆ (2. 4)
Computation of relative free energies of solvation in both solvents then allows direct
comparison with experimentally determined log P values by eq 2.5.14
)log(log3.2)BA()BA()BA( BAhydsolvtrans PPRTGGG −=→∆∆−→∆∆=→∆∆ (2. 5)
In Table 2.8, the MC/FEP results are in good accord with the experimental relative free
energies of solvation in chloroform. In this case the free energy of solvation becomes
steadily more favorable, though by a diminishing amount, with increasing methylation.
Combination with the computed results in water then leads to reasonable agreement
between the simulation results and experiment for the relative log P values. Thus, the
present MC simulations with the OPLS-AA force field reproduce the expected order of
free energies of hydration in a non-polar solvent as well as the unusual order in water.
Previously, Dunn and Nagy performed MC/FEP simulations for the conversion of
methylamine to dimethylamine in water and chloroform.80 A relative log P of 2.5 was
55
Page 71
obtained, which is too large in comparison with the experimental value of 0.6 or the 0.8
obtained here. The problem comes mostly from the methylamine to dimethylamine
perturbation in water, which gave a ∆G of 2.90 kcal/mol vs. the experimental value of 0.3
kcal/mol.80 McDonald et al. computed free energies of solvation in chloroform for
methylamine, dimethylamine, and trimethylamine, using MC/FEP simulations with
OPLS Lennard-Jones parameters, but with RHF/6-31G* CHELPG charges.17 The
computed ∆∆Gsolv values in chloroform were 1.3 and 1.1 kcal/mol for the dimethylamine
to methylamine and trimethylamine to dimethylamine conversions, respectively, which
agree with the experimental data by ca. 0.3 kcal/mol less well than the present results
(Table 2.8).
Conclusion.
Previous computational efforts on amine hydration have employed models with
standard pairwise additive interaction potentials,27, 28, 32 explicit polarization,28, 33 and
quantum mechanical SCRF calculation.34-37 Although all studies with explicit solvent
molecules and most SCRF models failed to mirror the experimental trends in free
energies of hydration, the work presented in this chapter has shown that a simple,
classical force field, which is parameterized to reproduce experimental properties of pure
liquids (Table 2.7) as well as ab initio hydrogen-bond strengths (Table 2.6), can solve the
amine hydration problem (Table 2.8). There is no need for models with more complex
functional forms including explicit polarization. The present parameterization of the
critical non-bonded terms involved few unique parameters and features simple charge
increments upon increasing methylation in the amine series (Table 2.5). The results of
56
Page 72
the Monte Carlo simulations also led to the explanation of the observed variation in free
energies of hydration through two competing trends, increased contribution from
hydrogen-bond acceptance and diminished contribution from hydrogen-bond donation
with increasing methylation of the amines.
In further testing, the present force field was shown to yield excellent results for
properties of thirteen additional liquid amines (Table 2.7). The transferability of the
parameters to less polar solvents such as chloroform was also demonstrated by
computation of relative log P values in reasonable agreement with experiment (Table
2.8). In view of the very common occurrence of amines in chemotherapeutics, the
availability of a force field with such broad, documented success for a wide range of
properties in different media is most important for computer-aided drug design. Errors in
partitioning between water and low-dielectric media may be expected to adversely affect
predictions on protein-ligand binding as well as QSAR analyses.
57
Page 73
Chapter 3
Estimation of Binding Affinities for HEPT and Nevirapine Analogs with
HIV-1 Reverse Transcriptase via Monte Carlo Simulations
Background.
The human immunodeficiency virus (HIV), which has been identified as the
causative agent of acquired immunodeficiency syndrome (AIDS),81 infected about
14,500 people each day in 2000.1 The World Health Organization and the Joint United
Nations Programme on HIV/AIDS estimate that 21.8 million persons have died from the
disease, 36.1 million people are currently infected with HIV, and over 95% of new
infections are in developing countries (Figure 0.1).1 The need for potent, safe, and
inexpensive chemotherapeutics is clear, and the therapies must also be effective against
mutant strains of HIV which arise from and circumvent existing anti-HIV treatments.82
One of the key enzymes packaged within the HIV virion capsid is a reverse
transcriptase (RT) that plays an essential role in the replication of the virus (Figure
3.1).81, 83, 84 Consequently, HIVRT has emerged as a prime target for the development
of drugs for HIV/AIDS therapy.81, 82 The HIVRT protein has both RNA dependent
DNA polymerase and RNaseH activities that are required for the conversion of genomic
viral RNA to DNA; this viral DNA is subsequently incorporated into the host cell
genome.81, 83, 85 Inhibitors of HIVRT fall into two main classes (Figure 3.2):82, 85 (1)
Nucleoside inhibitors (NRTIs) are compounds that mimic normal nucleoside substrates
58
Page 74
but lack the 3′−OH group required for DNA chain elongation. NRTIs compete with
native nucleosides and effectively stall polymerase activity by becoming incorporated
into the growing DNA strand thereby causing premature chain termination.82, 85 (2)
Non-nucleoside inhibitors (NNRTIs) are molecules that bind to a region of HIVRT
located near the polymerase catalytic site.85 The binding event alters the conformation of
critical residues and thereby inhibits the ability of the enzyme to perform normal RT
functions.82
Figure 3. 1. Cartoon representation of an HIV particle. Reverse transcriptase (RT)
converts viral RNA to viral DNA for subsequent incorporation into the host cell genome.
59
Page 75
Figure 3. 2. Schematic diagram showing the different binding sites for nucleoside
(NRTI) and non-nucleoside (NNRTI) HIV reverse transcriptase (HIVRT) inhibitors. The
apo coordinates in green on the left are from reference 86. The NRTI/HIVRT complex in
cyan (top) showing the NRTI binding site in red and the viral nucleic acid site in magenta
is from reference 87. The NNRTI/HIVRT complex in cyan (bottom) showing the NNRTI
binding site in red is from reference 88.
60
Page 76
Although both NRTIs and NNRTIs dramatically decrease viral load in most
infected persons on initiation of antiviral therapy, resistance to the chemotherapeutics
invariably develops.85 After the onset of infection, the virus replicates quickly within the
host and a genetically related swarm (quasispecies) of virions is soon established.3, 4
This viral pool of variants arises rapidly mainly due to the low fidelity of HIVRT, which
has been estimated to yield from 5−10 errors per HIV genome per round of replication.89,
90 Since as many as 109 virions are produced each day,91 resistance to both nucleoside
and non-nucleoside drugs quickly develops.82 Since resistance arises in response to the
chemotherapy, structurally unique inhibitors are needed that can challenge the swarm of
virions in different ways. The use of combinations of NRTIs, NNRTIs, and HIV protease
inhibitors is currently the best method for controlling HIV infection.92, 93 However, it is
also desirable to have multiple inhibitors within a class since their unique modes of
binding can lead to different resistance profiles. The present study has used computer
simulations in an effort to develop protocols and methods that can be used in the design
of improved anti-HIV drugs. In particular, computations have been carried out for the
binding affinities of 40 analogs of the NNRTIs, HEPT and nevirapine (Tables 3.1 and
3.2). Nevirapine was the first FDA-approved NNRTI and the HEPT analog, MKC-442,
is in clinical trials.
61
Page 77
HN
NO
O
O
N
HN
NN
O
MKC-442 nevirapine
HN
NOR2
O
R3
R1
N
N
NN
OR1
R2
R3
HEPT analogs nevirapine analogs
Specific goals of the research are twofold: (1) the estimation of binding affinities
in the context of structure based drug design using available experimental data and (2)
understanding the variations in binding affinities through interpretation of energetic and
structural results from simulations.
62
Page 78
Table 3. 1. Inhibition of HIV-1 RT by HEPT Analogs.
HN
NOR2
O
R3
R1
No. R1 R2 R3 EC50 ca. ∆Gexptl H01 Me CH2OCH2CH2OH SPh 7.0a −7.32 H02 Me CH2OCH2CH2CH3 SPh 3.6a −7.73 H03 Me CH2OCH2CH3 SPh 0.33a −9.20 H04 Me CH2OCH3 SPh 2.1a −8.06 H05 Me CH2OCH2Ph SPh 0.088a −10.01 H06 i-Pr CH2OCH2Ph SPh 0.0027a −12.16 H07 Me Et SPh 2.2a −8.03 H08 Me Me SPh > 150.0a > −5.43 H09 Et CH2OCH2CH3 SPh 0.019a −10.96 H10 i-Pr CH2OCH2CH3 SPh 0.012a −11.24 H11 i-Pr CH2OCH2CH3 CH2Ph 0.004b −11.89 H12 c-Pr CH2OCH2CH3 SPh 0.1a −9.93 H13 Me CH2OCH2CH2OH CH2Ph 23.0c −6.52 H14 Me CH2OCH2CH2OH OPh 85.0c −5.78 H15 Me CH2OCH2CH2OH SPh-3,5 di-Me 0.26d −9.35 H16 Et CH2OCH2CH2OH SPh-3,5 di-Me 0.013d −11.19 H17 i-Pr CH2OCH2CH2OH SPh-3,5 di-Me 0.0027d −12.16 H18 Et CH2OCH2Ph SPh 0.0059a −11.68 H19 Me H SPh > 250.0a > −5.11 H20 Me Bu SPh 1.2a −8.40 aReference 94. bReference 95. cReference 96. dReference 97. H01 is parent HEPT, H11 is MKC-442. EC50 in µM at 37 ºC. Estimated experimental binding energies ∆Gexptl ≈ RT ln (EC50) in kcal/mol.
63
Page 79
Table 3. 2. Inhibition of HIV-1 RT by Nevirapine Analogs.
N
N
NN
OR1
R2
R3
1
No. R1 R2 R3 IC50a ca. ∆Gexptl N01 Me Et H 0.125 −9.42 N02 Me Et 2-Me 0.17 −9.24 N03 Me Et 2-Cl 0.15 −9.31 N04 Me Et 3-Me 0.76 −8.35 N05 Me Et 3-Cl > 1.0 > −8.19 N06 Me Et 4-Me 1.9 −7.81 N07 H Et H 0.44 −8.67 N08 H Et 4-Me 0.035 −10.17 N09 H Et 4-Cl 0.095 −9.58 N10 H c-Pr 4-Me 0.084 −9.65 N11 Me c-Pr 4-Me > 1.0 > −8.19 N12 Me Pr H 0.45 −8.66 N13 Me t-Bu H 11.0 −6.77 N14 Me COCH3 H 15.3 −6.57 N15 Me Et 4-Et 0.11 -9.49 N16 Me CH2SCH3 H 0.85 −8.28 N17 H c-Pr 4-CH2OH 3.0 −7.54 N18 H c-Pr 4-CN 1.25 −8.05 N19 Me CH2CH2F H 2.9 −7.56 N20 H c-Pr H 0.45 −8.66 aReference 98. N10 is Nevirapine. IC50 in µM at 25 ºC. Estimated experimental binding energies ∆Gexptl ≈ RT ln (IC50) in kcal/mol.
64
Page 80
Computational Details.
Theoretical Method
The most rigorous computational approaches used for the calculation of binding
affinities (∆Gb) are the free energy perturbation (FEP) and thermodynamic integration
(TI) methods.99-102 These methods typically employ molecular dynamics (MD) or
Monte Carlo (MC) simulations and have yielded impressive results for a number of
protein-ligand systems, as reviewed elsewhere.99-102 However, since the FEP and TI
methods are quite computationally expensive more approximate and faster methods are
desirable. In the present work, ∆Gb predictions were made based on an extended linear
response (ELR) theory as introduced in Chapter One. The methodology, which
corresponds to eqs 3.1 for estimating binding affinities, uses descriptors such as
hydrogen-bond counts, hydrophobic, hydrophilic and aromatic components of the solvent
accessible surface area in addition to the standard Lennard-Jones and Coulombic terms
first advocated by Åqvist and coworkers.15
∑ +=n
nncG constant∆ b ξ (3. 1)
∆Gb is obtained using a multivariate fitting approach to experimental data where cn
represents an optimizable coefficient for the associated descriptor ξn. In principle, any
physically reasonable quantity could be considered as a descriptor in eq 3.1.
Configurationally averaged quantities are collected during two separate MC simulation
corresponding to the unique drug environment for the unbound state (drug + water) and
65
Page 81
bound state (drug + water + protein) and the difference (bound − unbound) for each
descriptor is computed (Figure 3.3).
Figure 3. 3. Schematic representation of a binding event showing different environments
for HIVRT inhibitors. Small arrows depict potential interactions of a drug with water
(unbound state) or water and protein (bound state).
66
Page 82
System Setup.
Given the large size of HIVRT, simulations of the entire protein-ligand complex
are currently impractical. Therefore, a model of the NNRTI binding site was constructed
which incorporated only nearby residues (Figure 3.4). Using the initial crystal structure
coordinates for MKC-442 bound to HIVRT (pdb entry 1rt1),88 a representative model
was constructed by including only those residues within ca. 15 Å of atom C6 of the
HEPT uracil core.
Figure 3. 4. HIVRT binding site model surrounded by a 22 Å cap of water. Blue
residues sampled in the MC simulations, red residues rigid, green residues not used.
Crystal structure coordinates, pdb entry 1rt1, from reference 88.
67
Page 83
To avoid excessive fragmentation of the protein backbone, a few additional amino acids
were included. Hydrogen atoms were added, and clipped residues were then capped with
acetyl and methylamine groups. Residues with all atoms outside a 10 Å sphere from C6
were kept rigid during the MC simulations. The final system size was 123 protein
residues plus the inhibitor. Specifically, the rigid residues are 91-94A, 109-110A, 161-
178A, 184-185A, 192-197A, 199-205A, 222-224A, 230-232A, 240-242A, 316-317A,
320-321A, 343-349A, 381-383A, 134-135B, 137B, and 140B. The flexible residues are
95-108A, 179-183A, 186-191A, 198A, 225-229A, 233-239A, 318-319A, 136B, and
138B. To impose overall charge neutrality for the system,18 all but one of the rigid Asp,
Lys, Glu, and Arg residues were made neutral. The tautomeric states of His residues in
the binding site were assigned by visual inspection. A residue-based cutoff at 9 Å was
used for the solute−solvent and intrasolute non-bonded interactions. The water−water
cutoff was also at 9 Å, based on the O−O separation. The nevirapine analogs were
treated similarly starting from the coordinates of the X-ray structure of nevirapine bound
to HIVRT (pdb entry 1vrt).103
The initial Cartesian coordinates for each HEPT or nevirapine analog were
generated by analogy to the conformations in the crystal structures of HIVRT with MKC-
44288 and nevirapine103 using the XChemEdit program.104, 105 The Z-matrix
connectivity was then graphically assigned, and the results saved both as a PEPZ
database,106 and a Gaussian95 input file.43 The OPLS-AA force field11, 107 was used for
the systems except the partial charges for the inhibitors were determined using the
ChelpG procedure at the HF/6-31G* level.43 Any missing OPLS-AA torsional
parameters were assigned by analogy to existing ones with the exception of two new
68
Page 84
torsions, which were fit to results of dihedral angle energy scans at the HF/6-31G* level
for the model compounds methyl benzyl ether and thioanisole, as previously described.11
The OPLS-AA parameters have been developed to reproduce accurately molecular
geometries, torsional energetics, free energies of hydration, enthalpies of vaporization,
and liquid densities for a wide-range of model compounds.11
Crystal Structure Choice.
H01 (the parent HEPT) and analog H11 (MKC-442) differ in potency by about
4.6 kcal/mol (Table 3.1); a possible explanation has been suggested by Hopkins et al.
based on an interpretation of crystallographic evidence.88 A difference of ca. 100° in the
χ1 dihedral angle for Tyr181A was found between the structures for H01 (pdb 1rti) and
H11 (pdb 1rt1).88 It was suggested that H11 (R1 = i-Pr) is a more potent compound than
H01 (R1 = Me) because the larger group at R1 sterically forces Tyr181A "up".88 A
favorable aromatic π-stacking interaction can then occur between Tyr181A and the
phenyl ring in the R3 substituent (Table 3.1).88 We believe that this interpretation is
flawed for the following two reasons: (1) No steric clashes are visually apparent when
H11 is docked into the H01 crystal structure (Figure 3.5), and conjugate gradient energy
minimizations reveal no energetically unfavorable steric interactions between the i-Pr
group of H11 when Tyr181A is "down" as in the parent HEPT (H01) structure. This
suggests that unfavorable steric interaction are not responsible for the "up"
conformational preference observed in the MKC-442 crystal structure.
69
Page 85
Figure 3. 5. No steric clash is observed between HIVRT side-chain Tyr181A and the i-Pr
group of MKC−442 in the modeled structure using the “down” conformation, which is
only reported for the parent HEPT.
(2) More importantly, an overlay of 16 experimental HIVRT/NNRTI crystal structures all
show Tyr181A to be in the same "up" conformation with the lone exception of the
structure for the parent HEPT (Figure 3.6). The 16 experimental structures include six
different inhibitor cores. In fact, the NNRTIs based on nevirapine (green; 3hvt, 1rth,
1vrt),103, 108 HEPT (magenta; 1rt1, 1rt2, 1rti),88 α−APA (red; 1hni, 1vru),103, 109 TIBO
(yellow; 1hnv, 1tvr, 1rev),110, 111 BHAP (grey; 1klm),112 and carboxanylide (cyan; 1rt4,
1rt5, 1rt6, 1rt7)113 could potentially allow Tyr181A to adopt the "down" conformation
given that no steric clashes would result, yet this is not reported. It should be noted that a
change in χ1 for Tyr181A of ca. 100° would be a rare event in computer simulations of
the present lengths and was not observed. Therefore, given the consistency in which
70
Page 86
Tyr181A is observed to be in the "up" conformation (Figure 3.6), pdb entry 1rt188 was
chosen as the starting point for all simulations of HEPT analogs.
Figure 3. 6. Experimental conformation of Tyr181A for 16 HIVRT non-nucleoside
inhibitor complexes: nevirapine (green), HEPT(magenta), BHAP (grey), α−APA (red),
TIBO (yellow), and carboxanylide (cyan) analogs. The complexes were aligned by
minimizing the rmsd between Cα carbons at residues Leu100A, Lys103A, Tyr181A, and
Val106A. See text for pdb references.
71
Page 87
Monte Carlo Simulations.
Each protein−inhibitor complex was subjected to 50 steps of conjugate gradient
energy minimization, using a distant-dependent dielectric constant of 4 (ε = 4r), to relax
the crystal structure with the force field prior to the MC simulations. For the MC
simulations, a 22 Å water cap was used containing 851 (bound) and 1485 (unbound)
TIP4P water molecules.47 All HIVRT side chains with an atom within ca. 10 Å from the
defined center of the water cap were sampled, the protein backbone was fixed, and each
inhibitor was fully flexible. Bond lengths for the protein remained fixed after the initial
energy minimizations. A protein residue−inhibitor list, which was kept constant during
the entire simulation, was determined for each complex during the initial solvent
equilibration stage of the simulation. A MC move for a side chain was attempted every
10 configurations, while a move for the inhibitor was attempted every 56 configurations.
All remaining moves were for solvent molecules. Solvent−solvent neighbor lists were
also used, and the maximum number of internal coordinates to be varied for an attempted
move was limited to 30. All MC simulations and energy minimizations were performed
with the MCPRO program.114 The computations were executed on a PC cluster with ca.
70 processors running Linux. The complete processing of one inhibitor (bound and
unbound) requires 2.5 days using one 800 MHz PentiumIII processor. Thus, ca. 300
inhibitors could be processed in one week on a PC cluster with 100 top-end processors.
72
Page 88
Bound Simulations.
Each MC simulation for a protein−inhibitor complex consisted of 1 million
configurations of solvent-only equilibration, 10 million configurations of full
equilibration, and 10 million configurations of averaging. In general, convergence of the
results for complexes is less problematic than for the simulations of the inhibitors alone
in water. This probably results from the facts that in the simulations of the complexes the
ligands are more conformationally restricted than in pure water, and about one-half as
many water molecules are used for the complexes than for the unbound inhibitors.
Unbound Simulations Using an Annealing Protocol.
Initial results for the inhibitors alone in water revealed that the solute−water
Coulombic interaction energy showed the slowest convergence among the descriptors
and that it was not well converged with MC simulations of the same length as for the
complexes. Surprisingly, the same average energies were not obtained when the
simulations were initiated from two similar yet distinct geometries. After additional
testing, an annealing protocol (Figure 3.7) was developed to enhance the convergence.
Each unbound MC simulation consisted of 1 million configurations of solvent-only
equilibration at the experimental temperature of 37 °C or 25 °C. Then, 5 million
configurations of equilibration ensued in which only the water and the dihedral angles of
the inhibitor were sampled. The MC acceptance rate for the inhibitor was also increased
through a local heating option in MCPRO with the temperature specified to be 727 °C
(1000 K) for the attempted moves of the inhibitor. This was followed by an additional 5
million configurations of full equilibration at the normal temperature, followed by 10
73
Page 89
million configurations of averaging. The latter three processes were then repeated for a
total of five cycles (Figure 3.7). The local heating is applied only to the inhibitor and no
bonds or angles are sampled during this stage. The focus is on increased conformational
sampling for the inhibitor. Since local heating is only specified for the inhibitor, the bulk
water structure is largely unaffected during the heating phase, and the dihedral-only
sampling ensures that bond lengths and angles do not have to be cooled upon
reequilibration.
Figure 3. 7. Annealing protocol showing heating, equilibration, and averaging portions
used in the MC simulations for the unbound inhibitors.
74
Page 90
Convergence of the solute−solvent ECoul was greatly improved, as illustrated in
Figure 3.8, using the new protocol. For Figure 3.8, simulations were initiated from two
alternative geometries of all 20 HEPT analogs; one was based on the 1rt1 structure and
the other on the 1rti structure.88 The annealing results for the HEPT compounds clearly
show that in five cycles acceptable convergence is obtained independent of small
differences in the starting geometry of the unbound inhibitors. It may be noted that the
annealing protocol formally corresponds to averaging the MC results from five
independent simulations of 10 million configurations each. The importance of well-
converged results can not be overestimated for the LR or ELR equations to have good
predictive value. For example, 5 kcal/mol of noise in the unbound ECoul value can easily
translate to 1−3 kcal/mol of noise in the predicted ∆Gb with usual values for β in eqs 1.15
or 1.16.
75
Page 91
Figure 3. 8. Convergence of the inhibitor-water Coulombic energy for the HEPT data set
after 10 million (1 cycle) and 50 million (5 cycles) configurations of averaging using the
annealing protocol. Each inhibitor was simulated twice starting from one of two different
conformations obtained from a minimization in either the 1rt1 or 1rti crystal structure.
Free Energy Perturbations.
To help in interpreting the results for nevirapine analogs, a FEP calculation was
performed to determine the difference in free energy of hydration (∆∆Ghyd) between
model 3° and 2° amides. Specifically, N,N-dimethylacetamide (DMA) was converted to
N-methylacetamide (NMA) using well-established methods.99 No internal degrees of
freedom were sampled, so ∆∆Ghyd could be computed simply by performing one
mutation in water.13, 99 The FEP calculations were performed for the solute in a periodic
76
Page 92
cube containing 500 TIP4P water molecules. Both solute−solvent and solvent−solvent
cutoffs were at 10 Å based on the separations of amide nitrogens and water oxygens.
Each of the 10 windows consisted of 6 million configurations of equilibration, followed
by an additional 5 million configurations of averaging. The potential functions for the
amides were the same as for the HEPT and nevirapine inhibitors, OPLS-AA with HF/6-
31G* ChelpG atomic charges.
Experimental Activities.
The experimental EC50 activities at 37 °C reported for the HEPT series94-97 and
the IC50 values at 25 °C for nevirapine analogs98 were converted into approximate free
energies of binding (∆Gexptl) by eq 3.2 as listed in Tables 3.1 and 3.2. Although not
formally equivalent, relative activities should correspond to relative free energies of
binding for closely related series of inhibitors.115
)ln(∆ exptl ActivityRTG ≈ (3. 2)
To correlate both data sets simultaneously, an offset might be necessary, though it turned
out not to be needed. Measured activities from the same laboratory116 indicate that
nevirapine (N10) is more potent than the parent HEPT (H01) by ca. 2.8 kcal/mol in
general agreement with the difference of 2.3 kcal/mol from the data in Tables 3.1 and 3.2.
In another study,117 MKC-442 (H11) was reported to be more potent than nevirapine
(N10) by about 1.0 kcal/mol, while the data in Tables 3.1 and 3.2 imply 2.2 kcal/mol.
77
Page 93
The experimental HEPT activities span a range of 7.1 kcal/mol, which is twice as large as
the range for the nevirapine analogs (Tables 3.1 and 3.2). Uncertainties were not
reported for the experimental data, but they are typically at least 0.5 kcal/mol.
Results and Discussion.
Regression Equations.
Correlations were derived using the statistical software package JMP.118 Eq 3.3
shows the best four-descriptor equation obtained by fitting the experimental activities of
the 40 compounds using the generic regression, eq 3.1.
( ) 6.48.2∆0085.0
30.0∆94.0∆
area
totalcalcd
+−°−
++−=
amide2PHOB
EXX-LJHBG (3. 3)
∆HBtotal is the change in the total number of hydrogen bonds for the inhibitor; a hydrogen
bond is defined here by a distance of less than 2.5 Å between an N, O, or S atom and a
hydrogen attached to a heteroatom.26 EXX-LJ is the ligand−protein Lennard-Jones
interaction energy, ∆PHOBarea is the change in hydrophobic SASA upon binding, and 2°-
amide is an indicator variable (1 or 0) for compounds with or without a 2° amide
functional group. The contributions for each term are recorded in Tables 3.3 and 3.4.
78
Page 94
Table 3. 3. Individual Contributions to the Total Computed Free Energies of Binding
for HEPT Analogs with HIV-1 RT.
No.
∆Gexptl
total
total
∆HBtotal
∆Gcalcd
EXX-LJ ∆PHOBarea
2°-amide
H01 −7.32a −7.33 3.24 −13.70 −1.47 0.00
H02 −7.73a −10.05 2.24 −14.93 −1.96 0.00
H03 −9.20a −9.62 2.05 −14.39 −1.87 0.00
H04 −8.06a −7.65 2.29 −13.04 −1.48 0.00
H05 −10.01a −10.11 1.67 −15.41 −0.96 0.00
H06 −12.16a −11.89 1.88 −16.79 −1.56 0.00
H07 −8.03a −8.04 1.46 −12.69 −1.39 0.00
H08 −5.43a −6.75 1.64 −11.89 −1.09 0.00
H09 −10.96a −9.92 2.23 −14.59 −2.15 0.00
H10 −11.24a −10.30 2.18 −14.68 −2.39 0.00
H11 −11.89b −10.07 2.34 −14.61 −2.39 0.00
H12 −9.93a −10.47 1.99 −14.87 −2.18 0.00
H13 −6.58c −6.59 3.17 −12.77 −1.58 0.00
H14 −5.78c −6.83 3.48 −13.32 −1.58 0.00
H15 −9.35d −9.82 3.24 −14.79 −2.86 0.00
H16 −11.19d −10.94 2.96 −15.29 −3.19 0.00
H17 −12.16d −11.20 3.10 −15.60 −3.28 0.00
H18 −11.68a −11.30 1.46 −16.05 −1.29 0.00
H19 −5.11a −4.86 1.68 −10.56 −0.58 0.00
H20 −8.40a −10.07 1.62 −14.35 −1.93 0.00
aReference 94. bReference 95. cReference 96. dReference 97. ∆Gexptl ≈ RT ln (Activity). ∆Gcalcd
obtained from eq 3.3. Energies in kcal/mol.
79
Page 95
Table 3. 4. Individual Contributions to the Total Computed Free Energies of Binding
for Nevirapine Analogs with HIV-1 RT.
No.
∆Gexptla
total
total
∆HBtotal
∆Gcalcd
EXX-LJ ∆PHOBarea
2°-amide
N01 −9.42 −7.78 2.08 −12.85 −1.60 0.00
N02 −9.24 −9.05 2.15 −13.47 −2.32 0.00
N03 −9.31 −8.16 2.44 −13.62 −1.57 0.00
N04 −8.35 −8.93 2.08 −13.32 −2.28 0.00
N05 −8.19 −7.87 2.54 −13.46 −1.54 0.00
N06 −7.81 −8.53 2.23 −13.28 −2.07 0.00
N07 −8.67 −7.76 3.58 −12.19 −0.91 −2.82
N08 −10.17 −9.32 3.71 −13.26 −1.54 −2.82
N09 −9.58 −8.42 3.92 −13.15 −0.97 −2.82
N10 −9.65 −9.98 3.60 −13.62 −1.73 −2.82
N11 −8.19 −8.72 2.67 −13.87 −2.10 0.00
N12 −8.66 −8.30 2.24 −13.37 −1.77 0.00
N13 −6.77 −7.86 2.77 −13.38 −1.84 0.00
N14 −6.57 −6.41 3.36 −13.21 −1.15 0.00
N15 −9.49 −10.56 3.22 −13.67 −1.88 −2.82
N16 −8.28 −8.09 2.57 −13.74 −1.52 0.00
N17 −7.54 −8.05 5.53 −13.85 −1.50 −2.82
N18 −8.05 −8.99 4.32 −13.81 −1.27 −2.82
N19 −7.55 −7.04 2.85 −13.17 −1.31 0.00
N20 −8.66 −8.75 3.42 −12.95 −0.99 −2.82
aReference 98. ∆Gexptl ≈ RT ln (Activity). ∆Gcalcd obtained from eq 3.3. Energies in kcal/mol.
80
Page 96
For the 40 compounds, the correlation coefficient r2 of 0.75 reflects good accord
between theory and experiment (Figure 3.9). Cross validation by the leave-one-out
procedure yields a q2 of 0.69 and implies reasonable predictive power for compounds not
included in the original data set. The computed activities show a rmsd of 0.94 kcal/mol
in comparison with experiment and an average unsigned error of only 0.69 kcal/mol. The
uncertainties in the experimental data and in the convergence of the MC results are
estimated to be at this level. All of the descriptors in eq 3.3 are significant. Probability >
F ratios (regression model mean square/error mean square) are small: ∆HBtotal (0.0005),
EXX-LJ (<0.0001), ∆PHOBarea (0.0037), and 2°-amide (<0.0001). This implies that the
probability of a greater F value occurring by chance is low. No systematic deviation in
the predicted ∆Gcalcd values was found; the computed residuals show random scatter.
81
Page 97
Figure 3. 9. Predicted binding affinities (∆Gcalcd) using eq 3.3 vs. experimental activities
(∆Gexptl) for 20 HEPT and 20 nevirapine analogs with HIVRT.
The four descriptors in eq 3.3 make physical sense: (1) ∆HBtotal is always
negative; water is the best hydrogen-bonding medium, so there is an inevitable loss in
number of hydrogen bonds for an inhibitor upon binding. The coefficient implies that the
loss of each hydrogen bond costs 0.94 kcal/mol in free energy of binding. (2) The EXX-
LJ term implies that a good geometrical fit between the ligand and the protein is also
important. Favorable packing contributions to binding are contained in this term as well
as any unfavorable steric interactions. The change in ligand−water Lennard-Jones energy
(∆ESX-LJ) is highly correlated with EXX-LJ (greater loss in ∆ESX-LJ corresponds with
82
Page 98
greater gain in EXX-LJ), so its inclusion does not improve the regression. (3) The
∆PHOBarea term is also negative; SASA for a ligand is always lost upon binding. The
associated coefficient is positive so that the removal of hydrophobic surface area upon
binding is favorable for the free energy, which simply reflects the hydrophobic effect. (4)
Finally, as described in the next section, a 2°-amide indicator is needed to account for
deficiencies in the partial charges.
The separate data sets yield modified optimal fits. For the HEPT analogs alone,
an r2 of 0.83 is obtained with eq 3.4.
6.5∆0112.031.0∆00.1∆ areatotalcalcd +++−= PHOBEXX-LJHBG (3. 4)
All descriptors in eq 3.3 are still significant except no 2° amides are present for HEPT
analogs so this descriptor is eliminated. For the nevirapine data set alone, however, only
the ∆HBtotal and 2°-amide descriptors are significant. A fit with these two descriptors
plus a constant yields an r2 of 0.58 (eq 3.5). In this case, the lower r2 may reflect
challenges associated with the compressed range of the experimental activities in
comparison with the data for the HEPT series.
2.1144.2∆10.1∆ totalcalcd −−°−−= amide2HBG (3. 5)
Binding affinity fits with the traditional ELR approach (eq 1.16) were also made
for comparison. A reasonable r2 of 0.56 and rmsd of 1.24 kcal/mol are obtained with eq
1.16 augmented by the 2°-amide indicator and a constant. Nevertheless, eq 3.3 is clearly
83
Page 99
superior with the same number of descriptors. It may be noted that eq 3.3 does not
include a term that obviously reflects differences in flexibility for the inhibitors. A
rotatable-bond count was considered, but was not found to be statistically significant.
For more diverse sets of ligands, it is likely that such a term may be needed to reflect the
entropic penalty for loss of conformational freedom upon binding.119
2°-Amide Indicator.
During the fitting, it was discovered that acceptable correlations could not be
obtained for the nevirapine analogs unless an indicator variable was included for 2°
amides. Suspecting that the use of the 6-31G* ChelpG charges was overestimating
hydration differences in the unbound state, the FEP calculation was performed for the
model 3° → 2° amide conversion of DMA → NMA in water (Figure 3.10). The
computed ∆∆Ghyd of –2.47 ± 0.24 kcal/mol is too negative by 1 kcal/mol in comparison
with the experimental value of –1.53 kcal/mol.31 By analogy, nevirapine analogs with 2°
amides would be expected to be too well hydrated in the unbound state and thus pay an
artificially high desolvation penalty for binding. Thus the indicator coefficient of −2.8 in
eq 3.3 has the correct sign, though the magnitude is larger than from the simple model, as
clarified below.
84
Page 100
Figure 3. 10. Plot of ∆G (kcal/mol) vs. λ for the perturbation of N,N-dimethylacetamide
to N-methylacetamide. The non-bonded parameters and geometries were scaled using the
coupling coordinate λ.
It should be noted that obtaining correct relative free energies of hydration for
amines and amides has been a long-standing problem in the computational community.27,
28, 33, 34, 120 Successful parameters for 1°, 2°, and 3° aliphatic, cyclic, and aromatic
amines have now been reported,120 and parallel improvements for amides have recently
been achieved.121
Analysis of Binding Trends – HEPT Series.
Eq 3.3 presents a straightforward framework for understanding the trends in the
observed activities. For the HEPT analogs in Table 3.3, the ranges for the free energy
85
Page 101
contributions from the hydrogen-bond loss, protein−inhibitor Lennard-Jones energy, and
burial of hydrophobic surface area are 1.9, 6.2, and 2.7 kcal/mol, respectively. There is
variation in the R2 side chain (Table 3.1) and the side chains with no oxygen atoms (H07,
H08, H19, and H20) show smaller desolvation penalties (Table 3.3). In the simulations
of the complexes, R2 is in a channel that contains some water and the terminal hydroxyl
in, for example, H01 is involved in hydrogen bonds with water or the backbone carbonyl
of Leu 234A. So, the range of desolvation penalties is not as great as might have been
expected. The larger analogs then benefit from more favorable Lennard-Jones
interactions (H05, H06, H16, H17, H18), which is the dominant discriminator. The
HEPT derivatives with R3 as 3,5-dimethyl-thiophenyl (H15, H16, H17) or with isopropyl
groups at R1 (H06, H10, H11, H17) get an additional boost for burial of more
hydrophobic surface area than their less substituted analogs. The factors combine such
that H06, H17, and H18 are observed and predicted to be in the most active group. Some
comments can also be made on specific pairs of inhibitors with small structural, but large
activity differences.
H08 vs. H07. The HEPT analogs H08 (R2 = Me) and H07 (R2 = Et) differ only by a Me
group yet have an experimental activity difference ∆∆Gexptl, of more than 2.6 kcal/mol
(Table 3.1). The computed relative free energy of binding (∆∆Gcalcd) is 1.3 kcal/mol, in
qualitative agreement with experiment. In Table 3.3, the computed free energy penalties
for lost hydrogen bonds (∆HBtotal) are similar, 1.46 kcal/mol for H07 and 1.64 kcal/mol
for H08. However, the larger Et group of H07 improves the hydrocarbon packing in the
86
Page 102
binding pocket (Figure 3.11) and yields a more favorable EXX-LJ contribution by about
0.8 kcal/mol over H08.
Figure 3. 11. Two water molecules (orange) are displaced by compound H07 (green, Et
analog) that are observed in simulations of compound H08 (magenta, Me analog) with
HIVRT.
Additional benefit for H07 comes from the burial of more hydrophobic surface area (−1.4
kcal/mol) than for H08 (−1.1 kcal/mol). Given the structure in Figure 3.11, these results
for the descriptors are reasonable. In addition, two water molecules are displaced from
the binding pocket upon expansion of the methyl group in H08 to ethyl in H07 (Figure
3.11). In general, this should be an entropically favorable process since the bound water
molecules likely gain translational and rotational freedom upon transfer into the bulk
solvent.119 The free energy gain for displacing one bound water molecule has been
estimated to be as high as 2 kcal/mol at 300 K.122 In contrast, homologation of H03 to
H02, though reported to diminish activity (Table 3.1), is also predicted to enhance
87
Page 103
activity (Table 3.3). A steric problem is not found for H02 here, which is consistent with
the observed accommodation of the even larger benzyloxy group for H05.
H14 vs. H01. H14 (R3 = OPh) and the parent HEPT, H01 (R3 = SPh) only differ in the
atom linking the phenyl ring to the uracil core, yet H01 is more potent than H14 by 1.5
kcal/mol (Table 3.1). The computed results are again in qualitative accord with the
difference diminished to 0.5 kcal/mol. Examination of the components in Table 3.3
shows that H14 has a computed ∆G(∆HBtotal) of 3.48 kcal/mol compared to 3.24 for H01.
Though an ether oxygen is expected to be better hydrated in the unbound state than a
thioether sulfur, these atoms are hindered in the bisaryl analogs H01 and H14, so there is
only a small differential. However, the more favorable ∆G(EXX-LJ) contribution for H01
(–13.70) compared to H14 (–13.32) makes sense given that sulfur is more polarizable
than oxygen and has a larger Lennard-Jones ε (0.25 vs. 0.14 kcal/mol).11 Finally, the
∆G(∆PHOBarea) values are essentially the same for H01 (–1.47 kcal/mol) and H14 (−1.58
kcal/mol) reflecting similar burial of hydrophobic surface area. Thus, the greater activity
of the sulfur analog H01 is predicted to come primarily from better van der Waals
interactions with some help from a smaller desolvation penalty.
88
Page 104
Analysis of Binding Trends – Nevirapine Series.
For the nevirapine series, the energy ranges are 3.5, 1.7, and 1.4 kcal/mol for the
desolvation penalty, protein−inhibitor Lennard-Jones interactions, and burial of
hydrophobic surface area contributions (Table 3.4). The compressed ranges are
consistent with the smaller variation in activities (Figure 3.9). The small ranges for the
latter two effects are also consistent with the diminished differences in total size and
hydrophobic surface area; i.e., the ranges of SASA and FOSA values are 468−530 and
115−275 Å2 for the nevirapines and 448−648 and 66−409 Å2 for the HEPT analogs. The
dominant term then becomes desolvation and the 2° amide indication. Thus, the
inhibitors with more polar side chains are less active, i.e., N14, N17, and N18 (Table
3.2).
However, the experimental results for the 2° vs. 3° amide analogs are
interestingly mixed: N08 and N10, are experimentally more active than their 3°
homologs; N06 and N11, by more than a factor of 10 (Table 3.2), while the 2° N07 is
reported to be less active than its 3° derivative N01 by a factor of 3.5, and another pair
with R2 = Et and R3 = 2, 3-dimethyl is reported to have the 3° compound more active
than the 2° by a factor of 2.98 In the crystal structure for nevirapine (N10) with
HIVRT,103 there are water molecules hydrogen-bonded to both pyridine nitrogens and
the amide carbonyl, though there is no hydrogen bond for the amide NH. The simulation
results typically have one water molecule hydrogen-bonded to a pyridine nitrogen, but
there is no water molecule within hydrogen bonding range of the amide carbonyl. Thus,
89
Page 105
the 2° amide fragment is not well-accommodated in any event, and in the absence of
another factor, the 2° amides should not be so competitive with the 3° analogs.
The missing factor appears to be a favorable NH-aryl π-type hydrogen bond for
the 2° amides with the phenyl ring of Tyr188A. Though this has not been specifically
noted in the crystallographic studies, it is illustrated in Figure 3.12.103, 108
Figure 3. 12. Top – computed snapshots of Nevirapine (N10) and N-methyl Nevirapine
(N11) with Tyr188A from the MC simulations. Bottom – optimized structures of model
2° and 3° amides, N-methylacetamide and N,N-dimethylacetamide, with benzene. The
net interaction energy is shown along with the shortest distances to aromatic carbons.
90
Page 106
The structures are shown for N10 and N11 with Tyr188 from the last configuration of
both MC runs, which is representative. For comparison, the optimal structures and
interaction energies using the OPLS-AA force field for the complexes of the model
amides, cis-NMA and DMA, with benzene are also shown. The shortest distance
between the amide NH and an aromatic carbon is only 0.26 Å longer for N10 than cis-
NMA and a comparably attractive interaction is indicated. The longer distance is
reasonable since the optimized NMA-benzene structure is effectively at a temperature of
0 K; it may also be noted that the interaction energy for trans-NMA with benzene is
somewhat more attractive, −5.55 kcal/mol. For DMA and benzene, the π-type hydrogen
bond is lost and the attraction drops nearly 3 kcal/mol. The shortest distance between the
N-methyl carbon and a ring carbon of Tyr188 is now 3.4 Å, which is 0.2 Å shorter than in
the optimal DMA-benzene complex. In the crystal structure for N10 with HIVRT,103 the
shortest distance between the amide N (coordinates are not given for the H) and the
Tyr188 ring carbons is 3.54 Å for CD2, while the corresponding distance for the
computed structure in Figure 3.12 is 3.24 Å. Thus, we propose that the binding of the 2°
amides in the nevirapine series benefits significantly from a π-type hydrogen bond with
Tyr188. This factor coupled with the overestimate of the desolvation energy of 2°
amides is responsible for the magnitude and significance of the 2°-amide indicator in eq
3.3. Such strong π-type hydrogen bonds could be included in the hydrogen bond counts
in the future. In support of this analysis, it is known that the Y188C mutant of HIVRT is
100 to 1000-fold less sensitive to nevirapine (N10) that the wild-type protein.123 The
decrease in activity for 3° analogs such as N11 should not be as severe, but this has not
been studied to our knowledge.
91
Page 107
One final point for the nevirapines is that N13 (R2 = t-Bu) is observed to have low
activity (Table 3.2). This is the only compound in this series with a tertiary substituent at
R2, and not surprisingly, the hydration of the proximal pyridine nitrogens is affected. The
effect is actually not great for N13 unbound in water; it is computed to accept an average
of 3.0 hydrogen bonds from water, which is just a little less than the 3.2−3.6 for 3°
amides N01−N06. However, in the complex with HIVRT, the bulkier tert-butyl group
displaces the water molecule from the pocket near the pyridine nitrogens. Both the
hydration of a pyridine nitrogen and the backbone of Lys101A are adversely affected.
This is illustrated in Figure 3.13 by contrasting representative configurations from the
MC simulations of the complexes for N13 and N01. The energetic penalty for the net
loss of the hydrogen-bonding with the pyridine nitrogen is about 0.7 kcal/mol in
comparing N13 with N01 in Table 3.4. Eq 3.3 does not obviously reflect the penalty for
the poorer solvation of Lys101A, which may account for N13 being predicted to be too
active by 1 kcal/mol.
92
Page 108
Figure 3. 13. A water-mediated hydrogen bond is consistently observed between N01 (Et
analog) and Lys101A that is not observed in the MC simulations of N13 (t-Bu analog)
with HIVRT.
Conclusion.
The results of the MC simulations presented in this chapter revealed three
physically reasonable parameters that control binding for two series of inhibitors with
HIVRT: loss of hydrogen bonds with the inhibitor upon binding is unfavorable, burying
hydrophobic surface area of the inhibitor is favorable, and a good geometrical match
between the inhibitor and the protein is important. The best regression equation that was
generated (eq 3.3) reveals a strong correlation with experimental activities (Figure 3.9, r2
= 0.75) and the cross-validated q2 of 0.69 implies reasonable predictive power for
compounds not included in the original data set. Given the comparatively large size of
the data set (40 compounds), the results provide strong support for the utility of the ELR
93
Page 109
method. On the technical side, convergence of the results for the unbound inhibitors in
water was carefully investigated and led to the development of an effective annealing
method. Further efforts on improving the efficiency and convergence of both the
unbound and bound simulations are on-going.
The structural details from the Monte Carlo simulations are also valuable in
interpreting trends in the binding and activity data. In particular, a key π-type hydrogen
bond between the 2° amide fragment of nevirapine analogs and the aryl ring of Tyr188A
of HIVRT was identified that explains the otherwise surprising activity of the 2° amides
and the poor activity of nevirapine against the Y188C mutant. Detailed knowledge of the
hydration of the inhibitor and the protein by specific water molecules is also repeatedly
found to be relevant in interpreting binding/activity data.
Finally, given the severity of the HIV/AIDS pandemic,2 the development of
improved, low-cost anti-HIV drugs is critical. The present study has been successful in
advancing the potential for computational methods to participate in achieving this goal.
It has been demonstrated that computer simulations can be used to make predictions of
binding affinities for sizeable data sets in a reasonable time frame. And, the examination
of the associated energetic and structural results can provide bases for understanding
activity differences and for rational drug design.
94
Page 110
Chapter 4
Validation of a Model for the Complex of HIV-1 Reverse Transcriptase
with Sustiva through Computation of Resistance Profiles
Background.
Drug-design efforts to arrest reverse transcription in HIV have led to the FDA
approval of three non-nucleoside reverse transcriptase inhibitors (NNRTIs), nevirapine,
delavaridine, and efavirenz (Sustiva). Additional compounds, including MKC-442, are in
clinical trials (Table 4.1). Because of the low fidelity of HIVRT, the mutation rate in the
encoded proteins including HIVRT is great.89, 90 As a result, all HIVRT inhibitors incur
resistance problems that adversely affect their clinical value.85, 124 A quantitative
measure of a drug's effectiveness against a mutation is given by the fold resistance (FR),
which is the ratio of mutant to wild type activities. Sustiva has been shown to remain
notably active against several common HIVRT point mutations including Val → Ala at
position 106 (V106A) and Tyr → Cys at position 181 (Y181C) (Table 4.1). When this
work was initiated no HIVRT structure with Sustiva had been reported that may help
explain its improved resistance profile. To study Sustiva, we (a) computed a structure for
the Sustiva/HIVRT complex, (b) validated the structure through computations of the
effects of the V106A and Y181C mutations on binding affinities for four drugs, and (c)
obtained structural insights on the improved effectiveness of Sustiva.
95
Page 111
Table 4. 1. Relative Free Energies of Binding (∆GFR) Estimated from Fold Resistance (FR) Values.
NHO
Cl
O
F3C
N N
HN
N
O
NH
N O
O
O
N
N NH
S
Cl
Sustiva Nevirapine MKC-442 9-Cl TIBOFold Resistanceg
Kia IC90b IC50c IC90b EC50f EC50d EC50e IC50c IC50f EC50f
Y181C/WT 0.59 0.11 3.30 2.79 3.49 2.90 5.04 1.64 1.00 2.86V106A/WT
0.54 0.70 2.81 2.88 3.49 2.92 1.20 1.76
2.02L100I/WT 1.09
1.91 1.32 0.98 1.57
1.42
2.96 2.80
Y188C/WT 0.81 3.24 2.29 1.99 K103N/WT 1.11 1.79 1.96 2.26 3.99 2.56aReference 125. bReference 126. cReference 127. dReference 128. eReference 117. fReference 129. gFR = mutant/wild-type activities, ∆GFR = RT ln FR in kcal/mol. The columns show the structure, compound name, the assay type and reference for the FR values, and ∆GFR for several common HIVRT mutations
96
Page 112
Computational Details.
System Setup.
A binding site model for the docking calculations was constructed from the 2.55
Å crystal structure of the MKC-442/HIVRT complex88 with MKC-442 removed
including only those residues within ca. 15 Å of MKC-442. Residues included were 91-
110A, 161-205A, 222-242A, 316-321A, 343-349A, 381-383A, and 134-140B. The final
system contained 123 protein residues with acetyl and methylamine capping groups on
end termini and the inhibitor. Neutralized residues included 110A, 166A, 169A, 172-
173A, 177A, 185A, 194A, 199A, 201A, 203-204A, 223-224A, 320A, 344A and 347A.
Tautomeric states of His residues were assigned by visual inspection. System setups for
the other NNRTI/HIVRT complexes were analogous; however, the coordinates
originated from the X-ray structure of nevirapine (pdb 1vrt),103 HEPT (pdb 1rti),88 or 9-
Cl TIBO (pdb 1rev)111 bound to HIVRT.
Docking.
The MATADOR130 docking program was then used to dock Sustiva in to NNRTI
binding site model. MATADOR uses a Monte Carlo-based Tabu131 search algorithm.
To keep the Tabu search focused on the known NNRTI binding site during the docking
runs, a 50 kcal/mol-Å2 half-harmonic restraining force was applied if the distance
between the ligand and the binding site center was greater than 5 Å. The defined binding
site was roughly centered on the C6 carbon of the MKC-442/HIVRT complex. The Tabu
list was set to be 25 and constructed from unique structures considering energetic as well
97
Page 113
as geometric criteria. In total, 100 Tabu cycles were performed with each Tabu search
generating 100 randomly placed ligand positions around the binding site. The decision to
accept a new structure onto the Tabu lists is made after an intermolecular energy
minimization in Cartesian space and is based on both energetic and geometric criteria.
The protein and ligand were rigid during the docking. The CM1P augmented OPLS-AA
force field26 provided the initial structure of Sustiva; it was also used to determine the
non-bonded energies, which were stored on a spherical grid in order to increase
computational efficiency. The total intermolecular interactions between the ligand and
protein amount to a measure of both steric and electrostatic complimentarity; the lowest
energy structure found during the simulations was taken as the "best" docked system. A
distance-dependent dielectric constant of 4 (ε = 4r) was used for all docking calculations.
Docking Validation.
As simulation controls, MKC-442, nevirapine, 9-Cl TIBO and HEPT88 were also
docked back into their respective binding sites to verify that the docking protocol could
reproduce experimental structures. The lowest-energy structure generated during the
docking runs was taken as the "best" structure and was found in all cases to reproduce
closely the position and orientation observed in the crystal structures; the root-mean-
square-deviations (rmsd) for the non-hydrogen atoms of the four ligands between the X-
ray and docked structures was 0.43−0.60 Å (Figure 4.1). These low rmsd values and the
limited flexibility of Sustiva are favorable for the accuracy of the docking calculations.
98
Page 114
Figure 4. 1. Docking validation results. Crystal (red) vs. docked (green) structure in the
NNRTI binding site. Nevirapine (pdb entry 1vrt), MKC-442 (pdb entry 1rt1), HEPT (pdb
entry 1rti), and 9-Cl TIBO (pdb entry 1rev). Each compound was initially positioned
outside of the binding site.
Molecular Dynamics Simulations.
To minimize unfavorable interactions, Molecular dynamics (MD) equilibration
simulations were then performed on the docked Sustiva structure and the equivalent
nevirapine, MKC-442, and 9-Cl TIBO binding-site models, which were based on their
crystal structures. The CM1P augmented OPLS-AA force field26 was used with the
IMPACT program132 for the MD simulations. Ten cycles of gradient-based energy
minimization were performed prior to the MD simulations and the complex was then
99
Page 115
restrained in the following manner. Protein residues were allowed to move freely within
ca. 10 Å of the binding site (95-107A, 172A, 177-182A, 188-192A, 198A, 227A, 229A,
234-236A, 318-319A, 321A and 135-139B). Movement was restrained for those residues
in a 10-12 Å shell about the binding site, i.e., for residues 94A, 108A, 175-176A, 183A,
187A, 225A, 237-239A, 317A, 320A, 349A, 382-383A, 134B, 140B with harmonic
potentials. All other residues were restrained to their positions after conjugate-gradient
minimization. The Verlet algorithm was used to integrate Newton's equations of motion
using a time step of 0.001 pico-seconds (ps) and constant temperature was maintained
through coupling to a Berendsen temperature bath using a relaxation parameter of 0.2 ps
for the velocity scaling. Bond lengths were fixed by the SHAKE algorithm and a
distance-dependent dielectric constant of 4 (ε = 4r) was used. First, 3 ps of initial
equilibration was performed at 100 K followed by 50 ps of equilibration at 300 K.
Quenching of the structure was performed by reducing the simulation temperature over 6
blocks of 4 ps each starting at 300 K and ending at 50 K. The same MD equilibration
was also performed on the nevirapine, MKC-442, and the 9-Cl TIBO structures, and the
resultant complexes were then used in the MC simulations.
Monte Carlo Simulations.
Monte Carlo free energy perturbation (MC/FEP)99 simulations were then
performed with the MCPRO program114 to compute relative fold resistance energies
(next section) on the Sustiva structure and the equivalent nevirapine, MKC-442, and 9-Cl
TIBO binding-site models after the MD equilibration. Each protein−inhibitor complex
was briefly energy-minimized prior to the MC simulations using a distance-dependent
100
Page 116
dielectric constant of 4 (ε = 4r). The CM1P augmented OPLS-AA force field26 was
used. For the MC simulations, water cap with 22 Å radius was used containing ca. 850
TIP4P water molecules and the system was partitioned into rigid residues (91-94A, 109-
110A, 161-178A, 184-185A, 192-197A, 199-205A, 222-224A, 230-232A, 240-242A,
316-317A, 320-321A, 343-349A, 381-383A, 134-135B, 137B, 140B) and flexible
residues (95-108A, 179-183A, 186-191A, 198A, 225-229A, 233-239A, 318-319A, 136B,
138B). All HIVRT side chains within ca. 10 Å from the center of the water cap were
sampled, the protein backbone was fixed, and each inhibitor was fully flexible. Bond
lengths for the protein remained fixed after the initial energy minimizations and a 9 Å
solvent-solvent, solute-solvent, and intrasolute non-bonded cutoff was used for all MC
simulations. A fixed protein residue-inhibitor list was specified for each simulation and
determined for each complex during the solvent equilibration stage of the simulation. An
attempted move for protein side-chains was requested every 10 configurations, while an
attempted move for the inhibitor was requested every 56 configurations. All remaining
moves were for water molecules. Solvent−solvent neighbor lists were also used, and the
maximum number of internal variables to be sampled for a given attempted move was 30.
Each solvated complex was subjected to 1 million configurations of solvent-only
equilibration, 10 million of equilibration, and 10 million configurations of averaging per
window during the FEP simulations.
101
Page 117
Results and Discussion.
Binding Mode.
The docking calculations placed Sustiva in a reasonable position and orientation
in the binding site in comparison with the crystal structures for the complexes of HIVRT
with MKC-442,88 nevirapine,103 and 9-Cl TIBO111 (Figure 4.2).
Figure 4. 2. Orientation of the four NNRTIs in the HIVRT binding site. (A) Best docked
structure of Sustiva. (B) Nevirapine from pdb entry 1vrt. (C) MKC-442 from pdb entry
1rt1. (D) 9-Cl TIBO from pdb entry 1rev.
102
Page 118
The best docked structure of Sustiva reveals that it makes interactions that are consistent
with those for other NNRTIs and that it overlays well with the “butterfly” shape
associated with nevirapine (Figure 4.3). Unlike nevirapine, hydrogen bonds are present
between Sustiva and the protein backbone at position Lys101 that are similar to those
observed in the crystal structures with 9-Cl TIBO and MKC-442 (Figure 4.2).
Figure 4. 3. Left − butterfly shapes adopted by Sustiva (red) and nevirapine (green).
Right − the same overlay in CPK colors.
Nevirapine makes no formal ligand-protein hydrogen bonds, but it does form a π-type
hydrogen bond between the secondary amide hydrogen and Tyr188133 and water-
mediated hydrogen bonds.103, 133 The cyclopropyl ethynyl group of Sustiva is
positioned towards aromatic residues Tyr181 and Tyr188 in the same fashion as the
methylpyridine fragment of nevirapine, the benzyl ring of MKC-442, and the
dimethylallyl group of 9-Cl TIBO (Figure 4.2). Presumably, these aryl-π interactions all
contribute favorably to binding.85, 124 Superposition based on the HIVRT Cα atoms
shows that these π fragments of the inhibitors coincide spatially in the binding site and
that Sustiva’s π fragment is the smallest (Figure 4.4).
103
Page 119
Figure 4. 4. Top − overlays of the binding-site positions of nevirapine, MKC-442, and 9-
Cl TIBO (red) with Sustiva (green). Bottom − the same overlays in CPK colors.
An alternative binding mode suggested by Maga et al. was based on a simple
alignment of nevirapine and Sustiva in which the amide moiety of both drugs was
superimposed.134 The present docking calculations did not find this orientation.
Furthermore, forced placement of Sustiva in this alternative geometry yielded steric and
electrostatic protein-ligand interaction energies ca. 5 and 15 kcal/mol, respectively, less
favorable than for our docked structure. The alternative orientation is unlikely since the
hydrogen bonds to the backbone of Lys101 would be sacrificed.
A subsequent crystallographic study by Ren et al.135 indeed confirms the
correctness of the Sustiva/HIVRT structure predicted here as shown in Figure 4.5. An
overlay of the experimental and predicted bind modes show the Sustiva compounds in
identical conformations except for a slight change in the rotameric state of the
cyclopropyl ethynyl group which would be expected to rotate freely at room temperature.
104
Page 120
Figure 4. 5. Predicted vs. experimental binding mode for Sustiva (rmsd = 0.73 Å). Cα
carbons aligned at Leu 100, Lys101, Val 106, Tyr181, and Tyr 188. Experimental
structure from reference 135.
Relative Fold Resistance.
A computational experiment was then pursued to help validate the Sustiva model
by predicting relative FR values. Our results should yield the observed experimental
trends, given the proposed Sustiva/HIVRT structure is in fact correct. The methodology,
presented in Chapter One, is a general computational approach to determining the impact
of protein mutations on drug candidates and hinges on the thermodynamic cycle in Figure
4.5.
105
Page 121
Figure 4. 6. Thermodynamic cycle used to compute relative fold resistance values. In
this example the wild-type side-chain Tyr (magenta) is perturbed to the mutant side chain
Cys in the presence of Drug A (solid red) and Drug B (checkered red) while bound to a
protein (green). Relative fold resistance (∆∆G) = ∆GB – ∆GA = ∆GMUT – ∆GWT.
For two inhibitors, A and B, ∆GWT and ∆GMUT are the differences in free energy of
binding for B vs. A with the wild-type and mutant proteins, respectively, while ∆GA and
∆GB are the changes in free energy of binding for A and B with the mutant vs. the wild-
type protein. The FR activity ratios from IC or EC values are expected to parallel
binding constant ratios for similar inhibitors.115 Computationally, one could mutate
either the drug or the protein. However, we have chosen to perform the structurally
simpler mutations of the protein; specifically, Val106 was mutated to Ala, and Tyr181
was mutated to Cys in the presence of the four NNRTIs (Figure 4.5).
106
Page 122
Although there is significant variability in the reported fold resistance data,
presumably due to the use of different assay conditions (Table 4.1), Sustiva, however,
consistently emerges as more tolerant towards the Y181C and V106A mutations than the
other drugs, especially nevirapine and MKC-442. Indeed, the present FEP results do
predict Sustiva to be less affected by both mutations than the other three inhibitors as
shown in Table 4.2. The agreement of the computed free energies with the experimental
results strongly supports the correctness of our docked model and the potential utility of
computing relative FR energies.
Table 4. 2. Relative Fold Resistance Energies (∆∆G) in kcal/mol for HIV-1 RT
Mutations Normalized to Sustiva.
∆∆G for Y181C ∆∆G for V106A
inhibitor calcd exptla calcd exptla
Sustiva 0.00 0.00 0.00 0.00
nevirapine 3.88 ± 0.3 2.20, 2.71, 2.90 3.33 ± 0.4 2.34, 2.27, 2.95
MKC-442 4.70 ± 0.3 2.31, 4.45 0.72 ± 0.5 2.38
9-Cl TIBO 3.01 ± 0.3 1.05, 0.41, 2.27 1.32 ± 0.5 0.66, 1.22, 1.48
aValues derived from Table 4.1.
107
Page 123
Structural Details.
The structural model suggests some factors that render Sustiva less affected by the
Y181C and V106A mutations in comparison with the other compounds. It is well known
that the NNRTI binding site is capable of accommodating structurally diverse inhibitors
and that different inhibitors give rise to strikingly different patterns of resistance
mutations among ca. 15 residues that line the binding site.85, 124 The most common
point mutation sites are depicted schematically in Figure 4.6.
Figure 4. 7. Principal point mutations that confer resistance to non-nucleoside HIV-1 RT
inhibitors. The protein is shown as a ribbon trace in green, the mutation sites in red, and
the non-nucleoside binding site in blue. Crystal structure coordinates, pdb entry 1rt1,
from reference 88.
108
Page 124
In general, this variability implies that the effect of mutations on drug binding needs
assessment on a case by case basis. However, the Y181C mutant arises early and confers
resistance for many NNRTIs. This can be attributed to the loss of favorable aryl/π
interactions, e.g., between the tyrosine and the methylpyridyl and benzyl rings of
nevirapine and MKC-442, and the dimethylallyl group of 9-Cl TIBO (Figure 4.2). Loss
of the interaction between Tyr181 and the smaller, less polarizable cyclopropyl ethynyl
group of Sustiva is expected to be less detrimental.
In the case of V106A, the residue is tucked under the benzene ring of Sustiva and
is in van der Waals’ contact with the trifluoromethyl group. Reduction of these
interactions appears to be partly compensated by better alignment of the NH-O hydrogen
bond with Lys101 when the buttressing effect of the valine side chain is reduced by
conversion to alanine. In the MC simulations, the hydrogen bond between the oxazinone
NH of Sustiva and the carbonyl oxygen of Lys101 is on average 0.1 Å shorter (1.77 vs.
1.85 Å) when residue 106 is Ala rather than Val. The interaction of the valine’s
isopropyl group with the weakly polarizable trifluoromethyl group is also likely less
attractive than the corresponding interactions with the cyclopropyl group of nevirapine
and the isopropyl and ethoxymethyl groups of MKC-442 (Figure 4.2). Thus, it is
reasonable to propose, on the basis of the present structure, that Sustiva’s improved
resistance profile benefits from a combination of less favorable initial interactions with
Tyr181 and Val106 and more favorable hydrogen bonding with Lys101 in the V106A
mutant. Consistently, the L100I mutation is more damaging (Table 4.1) because Leu100
forms a snug lid over the ring systems for all four inhibitors (Figure 4.2). Without
adjustment, the branching at Cβ rather than Cγ would direct the methyl group of Ile100
109
Page 125
directly into the rings. An alternative strategy for improved resistance profiles is to
enhance interactions with immutable residues such as Trp 229.136
Conclusion.
In this chapter, we have presented a molecular model for the important anti-HIV
drug Sustiva bound to HIVRT. The resultant structure reveals that Sustiva overlays well
with the butterfly shape of nevirapine (Figure 4.3) and makes similar contacts with
HIVRT as do other reported NNRTIs including hydrogen bonds with the backbone of
Lys101 (Figure 4.2). The docking protocols and methods have been validated using a
control set of NNRTIs of known orientation in the binding site (Figure 4.1). FEP
methodology for the assessment of relative resistance profiles for drug candidates has
been defined (Figure 4.5). Results from its application to four NNRTIs (Table 4.2) are in
good agreement with the experimental activity trends and provided additional evidence
that the proposed binding mode for Sustiva was correct. Sustiva’s relative insensitivity to
the Y181C and V106A mutants appears to arise from a mix of relatively weaker
interactions with Tyr181 and Val106 and improvement of hydrogen bonding for Ala106.
A comparison between the proposed and experimental 135 Sustiva/HIVRT complexes
fully confirms the correctness of the structure predicted here. These findings highlight
the power of molecular modeling for structure and binding affinity predictions and its
potential for structure-based drug design.
110
Page 126
Chapter 5
Docking Aided by Cluster Analysis: Protocol Development and
Validation Studies
Background.
The docking of ligands into drug targets in order to study intermolecular
interactions at the atomic level is an important part of structure based drug design. The
determination of the binding mode for a novel ligand, for which no experimental
structure of the protein-ligand complex has been reported, is a frequent goal. Although
the target binding site may be known from crystallographic studies of mechanistically
related inhibitors, the number of possible conformations a novel compound could adopt
in the target may be quite large for flexible ligands that contain many rotatable bonds.
The dimensionality of the problem quickly becomes an issue for docking scenarios that
involve thousands of ligands. A balance between accuracy and efficiency is important if
promising drug leads are to be discovered, in a reasonable time frame, using
computational techniques.
We recently reported a prediction of the binding mode of the potent anti-HIV
nonucleoside reverse transcriptase (NNRTI) inhibitor Sustiva obtained through rigid
docking calculations.137 Subsequent experimental work reported a crystallographic
Sustiva/HIVRT complex that fully confirmed the predicted binding mode.135 The
docking protocols had been validated using a test set of four additional NNRTIs by
docking each compound into the HIVRT binding site using the conformation found in the
111
Page 127
crystal. For Sustiva, only one conformer needed to be docked because the molecule has
only one rotatable bond about the cyclopropyl ethynyl group.
NHO
Cl
O
F3C
Sustiva (efavirenz)
Given the success of the earlier Sustiva docking study we endeavored to increase the data
set size and diversity for rigid docking and to devise methods useful for docking
compounds with multiple rotatable bonds. The 44 different protein-ligand complexes
used in this study represent 11 different proteins (Table 5.1). Many of the ligands in this
set are quite flexible, 26 out of the total 44 have ten or more rotatable bonds which
present an enormous challenge for flexible docking computations. In addition, 9 of the
ligands are sugar-like compounds whose binding affinity is expected to be primarily
driven by electrostatic interactions. This requires a proper arrangement of hydroxyl
groups in order for the ligand to interact favorably with the protein.
112
Page 128
Table 5. 1. Protein-ligand Complexes Used in this Study
protein pdba protein pdba protein pdba
α-thrombin 1AE8 HIV protease 1HPS thymidylate synthase 1BID
α-thrombin 1BMM HIV protease 1HPV trypsin 1PPC α-thrombin 1BMN HIV protease 1HPX trypsin 1PPH α-thrombin 1DWB HIV protease 1HSG trypsin 1TNG α-thrombin 1DWC HIV protease 1HTF trypsin 1TNH
α-thrombin 1DWD HIV protease 1HVR trypsin 1TNJ
α-thrombin 1HDT HIV protease 4PHV trypsin 1TNK
ε-thrombin 1ETS L-arabinose BPb 1ABE trypsin 1TNL
ε-thrombin 1ETT L-arabinose BP 1ABF trypsin 3PTB
HIV protease 1AAQ L-arabinose BP 1APB elastase 1ELC
HIV protease 1AJV L-arabinose BP 1BAP histidine BP 1HSL
HIV protease 1AJX L-arabinose BP 5ABP retinol BP 1RBP
HIV protease 1GNO L-arabinose BP 6ABP glucose/galactose BP 2GBP
HIV protease 1HBV L-arabinose BP 7ABP intestinal fatty acid BP 2IFB
HIV protease 1HIH L-arabinose BP 8ABP a1AE8 reference 138, 1BMM reference 139, 1BMN reference 139, 1DWB reference 140, 1DWC reference
140, 1DWD reference 140, 1HDT reference 141, 1ETS reference 142, 1ETT reference 142, 1AAQ reference
143, 1AJV reference 144, 1AJX reference 144, 1GNO 145, 1HBV reference 146, 1HIH reference 147, 1HPS
reference 148, 1HPV reference 149, 1HPX reference 150, 1HSG reference 151, 1HTF reference 152, 1HVR
reference 153, 4PHV reference 154, 1ABE reference 155, 1ABF reference 156, 1APB reference 157, 1BAP
reference 157, 5ABP reference 156, 6ABP reference 158, 7ABP reference 158, 8ABP reference 158, 1BID
reference to be published, 1PPC reference 159, 1PPH reference 159, 1TNG reference 160, 1TNH reference
160, 1TNJ reference 160, 1TNK reference 160, 1TNL reference 160, 3PTB reference 161, 1ELC reference
162, 1HSL reference 163, 1RBP reference 164, 2GBP reference 165, 2IFB reference 166. bbinding protein
(BP)
113
Page 129
The present work is a multi-step approach similar to the divide-and-conquer
strategy recently reported by Wang et al.167 and is divided into three types of
calculations. (1) Using a rigid docking protocol we have docked the 44 different ligands
in Table 5.1 back into their respective crystal structure using the conformation of each
ligand as observed in the crystal. This acts as a control data set; the correct placement in
the crystal structure should be obtained if starting from the correct binding mode
conformation. (2) A limited conformational search was performed for each unbound
ligand in order to generate a number of energy minima conformers of which one or more
may closely resemble the binding mode as observed in the crystal. (3) Cluster analysis,
based on rmsd similarity, was then performed for each ligand using the total set of
conformers generated from the unbound conformational searches. For a given ligand, the
lowest energy member found in each cluster is chosen as the "representative" of that
family. In theory this reduces the total number of conformers that may need to be
docked. Finally, to determine if bound-like conformations are retained after clustering
each cluster representative was then compared with the ligand crystal structure
conformation.
114
Page 130
The clustering method is illustrated graphically in Figure 5.1. The specific goal is
to reduce the number of candidate structures that would need to be docked for a given
molecule in such a way that bound-like conformations are retained. The cluster members
could then to docked into the target where subsequent energy minimizations, molecular
dynamics (MD), or Monte Carlo (MC) simulations could be used as further refinement.
Figure 5. 1. Clustering protocol for reducing the number of conformers generated from
conformational searches using rmsd geometric similarity.
115
Page 131
Computational Details.
System Setup.
Binding site models for the 44 protein-ligand complexes were constructed using
the crystal structure coordinates for each system downloaded from the RCSB data bank
(Table 5.1). For most systems, a truncated binding site is necessary in order to make the
simulations practical. This process was accomplished in a semi-automated way using the
recently developed C program CHOP168 to prepare the input files necessary for the
PEPZ106 program to build the protein-ligand Z-matrices used for the docking and Monte
Carlo extended linear response (MC/ELR) studies being pursued concurrently. For each
system, the center of the binding site was defined based on the geometric center of the
ligand as found in the crystal. All residues having any atom farther than a cut-size
parameter from the ligand (13.0−14.2 Å) were deleted. The program will attempt to
replace some previously deleted residues to avoid excessive fragmentation of the protein
backbone based on user supplied min-gap (four residues), and min-chain (three residues)
parameters. Acetyl and methylamine capping groups are then added to the remaining
clipped residues. All charged residues outside of a user defined variable-size (9 Å)
region were neutralized subject to a target-q parameter that dictates the overall charge of
the system. Neutralization of the outer most residues avoids having charged amino acid
groups at the vacuum/water interface for MC/ELR simulations.18 Default protonation
states were used for the side-chains within the 9 Å variable region. The OPLS-AA force
field was used for the protein part of each system while the CM1A augmented OPLS-AA
force field was used for the inhibitors. The CM1A charges scaled by 1.08 (for neutral
116
Page 132
molecules) was found to yield the lowest overall errors for computed vs. experimental
free energies of hydration (∆∆Ghyd) for 16 test-case molecules in TIP4P water in
comparison with several other scale factors or for CM1P*1.30 charges.169 Fully flexible
ligand Z-matrices were constructed using the AUTOZMAT program170 based the crystal
structure conformation of each compound.
Docking Protocols.
The program MATADOR,130 which uses a MC-based Tabu searching algorithm,
was used for all of the docking calculations. Two key additions to MATADOR have
recently been made. (1) New ligand positions are generated about the current lowest
energy solution using a Gaussian rather than uniform distribution. This process is
continued for each Tabu cycle until a lower energy intermolecular complex is not found
within 50 steps and indicates that a local minimum has been found. This appears to
direct the ligand into a position in the binding pocket corresponding to a local energy
minimum much faster than an intermolecular energy minimization. Once a local
minimum is attained, a new reasonable trial structure is generated and the process repeats
until the requested number of Tabu cycles has been completed. (2) To insure that a
starting intermolecular geometry is sterically reasonable, the overlap is computed
between the ligand and the protein. A three dimensional grid of 40 x 40 x 40 points is
generated around the binding pocket of the protein with each individual grid having 0.8 Å
per side. If a protein atom falls within any grid, that grid and the surrounding 26
neighboring grids (in 3 dimensions) are assigned a value of 1. For each initial structure,
117
Page 133
if any heavy atom of the ligand is placed within a grid having a value 1, the move is
rejected.
As before, the protein and ligand were kept rigid during the docking, the protein
force field was stored on a spherical grid in order to increase computational efficiency,
and a distance-dependent dielectric constant of 4 (ε = 4r) was used in the calculations.
The Tabu list was set to be 25 and constructed from unique structures that considered
energetic as well as geometric criteria. To keep the search focused on the known binding
site during the docking runs a 100 kcal/mol-Å2 half-harmonic restraining force was
applied if the distance between the ligand and the binding site center was greater than 2.5
Å. The non-bonded intermolecular interaction energy between the ligand and protein
was computed for each trial structure and provides a measure of the steric and
electrostatic complementarity. As in the previous Sustiva study, the lowest energy
structure generated was taken as the "best" docked system.137 For docking calculations
of ligands with multiple conformers, the intramolecular energy for the given conformer is
added to the protein-ligand intermolecular energy as a means to assess the relative strain
energy of the conformer.
Conformational Searching and Clustering Analysis
Each unbound ligand was subjected to a limited Monte Carlo conformational
search using the BOSS program171 in order to generate local minima geometries for
subsequent docking calculations. Since only 200 starting structures were requested,
which for very flexible molecules would not be sufficient to determine all of the local
minima, the searches are incomplete. To increase the likelihood that bound-like
118
Page 134
conformations might be found with these limited searches a dielectric constant of 20.0
was used. The internal geometry of a ligand, while bound to a protein, is expected to
posses fewer internal hydrogen-bonds. Larger dielectrics would be expected to provide
electrostatic screening and prevent too many compacted structures in the conformational
searches. The degrees of freedom to be sampled for each molecule were determined
automatically by the program and ranged from 2−28 rotatable bonds.
Even with the limited number of starting structures requested in the
conformational searches, for compounds with many rotatable bonds the number of
conformers generated may be too large for efficient docking. For this reason, cluster
analysis was performed which can group conformers into families that are geometrically
similar. The root-mean-square-deviation (rmsd) was determined for every pairwise
combination of conformers considering only heavy atom coordinates. Starting from the
lowest energy conformer, all conformers with an rmsd less than or equal to some rmsd
tolerance are considered to be part of that cluster and removed from further clustering for
the given rmsd tolerance. In this way, each conformer can only belong to one cluster.
The number of clusters obtained equals the number of total conformers using a rmsd
tolerance of 0.0 Å while increasing the numerical value of the tolerance always reduces
the number of clusters for each compound. The lowest energy member from each cluster
is then considered the cluster "representative".
119
Page 135
Results.
Crystal Structure Docking Validation.
As a first step towards the development of docking protocols each ligand was first
removed from the crystal structure and then docked back in without changing the
conformation of the ligand. Rigid docking calculations were initiated requesting ten MC
blocks of 500 or 1000 Tabu cycles each consisting of 100 ligand trial placements. For
each block a new random seed number was used which leads to a different initial
structure and final results. Each block yields one best solution that can be compared with
the experimental crystal structure. Predicted structures having rmsd values of less than or
equal to 2 Å may be considered in good agreement with the experimental crystal structure
and provide some indication that the structure is geometrically close. Correct, close, and
incorrect docking solutions are illustrated in Figure 5.2 using 3 of the 10 solutions from
the 10 block runs for trypsin system 1PPH. For this particular case, the lowest
intermolecular energy obtained also correlates with the smallest rmsd between the docked
and experimental binding mode.
120
Page 136
Figure 5. 2. Three lowest energy solutions from rigid docking calculations for trypsin
system 1PPH. The experimental binding mode is shown in magenta and three docking
solutions are shown in green.
121
Page 137
Table 5.2 tabulates the percent of structures correctly docked (eq 5.1) and
represents an upper limit for successful docking if one knows a priori the correct bound
conformation of the ligand. Some crystal structure complexes have unfavorable
intermolecular energies before docking, for these cases, it is unlikely that docking will be
successful unless the unfavorable contacts are relieved using energy minimization
techniques or by reducing van der Waals radii for the ligand.
10044
crystal thefrom Å 2.0 dockednumber correct percent ×<=
= (5.1)
Table 5. 2. The Percent of Structures Correctly Docked using the Ligand Crystal
Structure Conformation.
Number of
Tabu Cycles
Number of
Blocks
Total Number of
Trial Structures
% correct
(rmsd <= 2.0 Å)
500 1 5 x 10⁴ 38.6
500 5 25 x 104 72.7
500 10 50 x 104 81.8
1000 1 1 x 10⁵ 54.5
1000 5 5 x 10⁵ 75.0
1000 10 10 x 105 81.8 aRoot mean square deviation (rmsd) of <= 2.0 Å between the predicted and experimental
structure for the data set comprising 44 protein-ligands complexes.
122
Page 138
The percent of structures correctly docked improves the longer the simulations are run.
A large improvement of 34% (38.6 → 72.7) and 21% (54.5 → 75.0) is obtained after 5
rather than 1 blocks for the 550 cycle and 1000 cycle Tabu runs respectively. Increasing
the number of blocks to 10 only improves the success rate by another 7% − 9%.
The docking results appear to converge to the correct solution more quickly for
ligands that have a clearly defined binding site (Table 5.3, Figures 5.3 and 5.4). For
example, the correct solution (rmsd <= 2.0 Å) is found in only 2 of 10 blocks for ligand
1AE8 which has a shallow binding site on the surface of α-thrombin. In contrast, the
correct solution is found 9 times out of 10 for the inhibitor that is more buried in the HIV
protease binding site from system 1AAQ. Table 5.3 tabulates the intermolecular energies
and rmsds solutions with the crystal obtained from each block. In Table 5.3 the lowest
energy solution (bold rows) closely resembles the binding mode of the ligand.
123
Page 139
Table 5. 3. Intermolecular Energies and rmsd Results from Rigid Docking Calculations for Ligands 1AE8 and 1AAQ.
ligand block number rmsd intermolecular energy 1 4.12 −33.04 2 4.26 −32.95 3 4.51 −33.58 4 4.84 −32.93
1AE8 5 4.22 −33.57 6 4.33 −34.33 7 4.28 −33.48 8 4.38 −32.62 9 0.70 −46.20 10 0.99 −34.34
1 1.12 −48.43 2 1.10 −46.08 3 0.75 −49.64 4 0.71 −37.86
1AAQ 5 0.89 −48.11 6 12.19 −39.02 7 0.99 −46.06 8 0.71 −51.05 9 0.75 −51.26 10 1.26 −42.53
Figure 5.3 graphically depicts the solutions in Table 5.3 which were initiated requesting
1000 Tabu cycles. The two types of binding sites, buried vs. solvent-exposed are also
presented in Figure 5.4 for α-thrombin (1AE8, exposed) and HIV protease (1AAQ,
buried).
124
Page 140
Figure 5. 3. Number of correctly docked structures shown in green from 10 block runs of
1000 Tabu cycles each.
Figure 5. 4. Example of a shallow and solvent exposed binding site vs. an enclosed
buried binding site.
125
Page 141
CPU Timings.
The CPU timings for the rigid docking calculation are dependent on the size of
the protein-ligand system. Taking complex 1AJV as an example, the truncated HIV
protease protein contains 142 protein residues out of 199 total and the cyclic sulfamide
inhibitor is considered as 1 residue with 75 (41 heavy) atoms. Note that the binding site
model could have been made smaller for the docking calculations which would have
dramatically decreased the docking times, however, the timing results presented here are
for a typically-sized system suitable for MC/ELR simulations with explicit solvent. The
CPU timings shown in Table 5.4 have been obtained using MATADOR executed on a
733MHz PentiumIII processor running Linux.
Table 5. 4. Average CPU Timings for System 1AJV.
System
Number of
Tabu Cycles
Number of
Blocks
Total Number of
Trial Structures
Avg. CPU time
(minutes)
1AJV 500 1 5 x 10⁴ 5
1AJV 500 5 25 x 104 23
1AJV 500 10 50 x 104 45
1AJV 1000 1 1 x 10⁵ 7
1AJV 1000 5 5 x 10⁵ 34
1AJV 1000 10 10 x 105 67
126
Page 142
Conformational Search Results.
Each ligand was subjected to a limited conformational search that requested 200
starting structures. The variables to be sampled were determined automatically by the
BOSS program and consisted only of rotations about torsional angles. Using the defaults,
no aromatic or cyclic ring torsions were varied in the conformational searches.
For sugars, whose binding is primarily determined by hydrogen-bonding and not
van der Waals interactions, docking is especially challenging. Although the rigid
docking tends to place each sugar into the appropriate binding pocket using random
hydrogen positions the hydroxyl group orientations are not optimal for electrostatic
interactions with the protein. This leads to docking solutions that are incorrect as
illustrated for L-arabinose binding protein system 1APB (Figure 5.5).
Figure 5. 5. Predicted (green) vs. experimental (red) binding mode for ligand 1APB
before the ligand was subjected to a conformational search. Rmsd = 3.2 Å.
127
Page 143
Search results for ligand α-D-fucose, from system 1APB, yielded all the correct
rotameric states for each hydroxyl group and correctly predicted the absence of a third
rotamer for the hydroxyl attached to the anomeric carbon (Figure 5.6). In general, for the
L-arabinose systems in the present data set a small number of conformers is obtained
from the searches. Subsequent docking of each conformer separately resulted in one
conformer having the appropriate hydroxyl pattern for interaction with the protein and
yielded the correct solution for 1APB (Figure 5.7). The correct binding mode was also
obtained using multi-conformer docking for L-arabinose binding protein systems 1ABE,
1ABF, 1BAP, and 6ABP.
128
Page 144
Figure 5. 6. Conformational search results for unbound ligand 1APB. The conformers
are overlaid to emphasize the 11 different hydroxyl group rotamers.
Figure 5. 7. Lowest energy complex obtained for system 1APB after docking using the
11 conformers obtained from the conformational search. The heavy atom rmsd is 0.67 Å
from the crystal structure shown in green.
129
Page 145
Despite the limited number of starting structures requested in the conformational
searches, for most ligands, the search results yield at least one conformer that is similar to
the bound conformation. This is illustrated in Figures 5.8 and 5.9 for eight of the twenty-
six ligands with 10 or more rotatable bonds.
Figure 5. 8. Crystal structure conformation (spoke representation) overlaid with best
match conformer (ball and stick representation) from the conformational searches for
ligands 1AE8, 1AJV, 1BMM, and 1DWC.
130
Page 146
Figure 5. 9. Crystal structure conformation (spoke representation) overlaid with best
match conformer (ball and stick representation) from the conformational searches for
ligands 1GNO, 1HDT, 1HPV, and 1HSG.
131
Page 147
The flexible ligands yielded a large number of conformers although in most cases
the lowest energy structure found (conformer 1) was not the best geometric match with
the crystal. The energy differences between these bound-like conformation from the
conformational search and the lowest energy conformer provides an estimate of relative
strain energy and is tabulated in Table 5.5 for eight representative compounds.
Table 5. 5. Energy Difference Between the Bound-like Conformer and the Lowest Energy Conformer Found in the Conformational Searches for Eight Different Ligands.
ligand ∆E ligand ∆E
1AE8 5.7 kcal/mol 1GNO 8.6 kcal/mol
1AJV 3.6 kcal/mol 1HDT 0.0 kcal/mol
1BMM 12.3 kcal/mol 1HPV 9.6 kcal/mol
1DWC 5.9 kcal/mol 1HSG 2.0 kcal/mol
132
Page 148
Cluster Analysis Results.
In theory, the number of conformers found in an exhaustive and complete
conformational search should be a function of the number of rotatable bonds in the
molecule. Table 5.6 lists the number of dihedral angles sampled in the limited
conformational searches (Nrot) and the resultant number of local minima (Nconf) found
for each molecule out of 200 starting structures using a dielectric constant of 20.0. The
number of rotatable bonds sampled in the searches is 10 or greater for 26 out of the 44
ligands which yield, on average, 164 conformers each. We used cluster analysis in order
to group the conformers, for each system, into families of like geometries. For ligands
that have 10 or less total conformers, or whose conformers geometries only differ
because of hydroxyl group orientations (i.e., sugars) cluster analysis may not be useful
since only heavy atoms are used in the rmsd computations. Table 5.6 shows the number
of clusters obtained for each system for 10 different rmsd similarity cutoff values. Figure
5.10 is a histogram representation of how different rmsd similarity values affect the
clustering results for the 26 most flexible ligands in Table 5.6.
133
Page 149
Table 5. 6. Cluster Analysis Results. Each Column Tabulates the Number of Rotatable bonds (Nrot), the Number of Conformers
(Nconf) found in the Limited Conformational Search, and Number of Clusters for 10 different rmsd Similarity Tolerance Values..
Number of clusters obtained for increasing rmsd (Å) similarity valuesa
protein pdb codeb Nrotc Nconfd
rmsd
1.00
rmsd
1.50
rmsd
2.00
rmsd
2.50
rmsd
2.75
rmsd
3.00
rmsd
3.50
rmsd
4.00
rmsd
4.50
rmsd
5.00
α-thrombin 1AE8 16 186 153 86 30 9 7 4 3 2 2 1α-thrombin 1BMM
17 180 160 106 45 17 11 7 4 3 2 1α-thrombin 1BMN 14 174 127 82 42 15 10 7 3 2 2 1α-thrombin 1DWB 3 2 1 1 1 1 1 1 1 1 1 1α-thrombin 1DWC 13 157 120 66 33 12 9 6 3 2 2 1α-thrombin 1DWD 13 170 162 116 39 15 11 7 4 3 2 1α-thrombin
1HDT
23 187 176 164 108 42 25 16 6 3 3 2
ε-thrombin 1ETS 13 174 160 119 41 14 11 6 3 2 2 1ε-thrombin
1ETT
10 78 58 35 12 4 3 2 2 1 1 1
HIV protease 1AAQ 23 187 182 168 118 48 27 13 6 3 2 2HIV protease 1AJV 12 147 116 40 9 3 2 2 2 1 1 1HIV protease 1AJX 12 125 91 38 11 5 2 2 2 1 1 1HIV protease 1GNO 28 189 177 164 117 49 29 17 9 4 2 2HIV protease 1HBV 18 158 143 121 69 27 16 11 5 4 3 1HIV protease 1HIH 20 178 162 142 94 31 18 13 6 3 2 1HIV protease 1HPS 21 193 190 173 137 62 37 24 11 4 3 2HIV protease 1HPV 15 170 151 109 50 14 9 6 4 2 2 1HIV protease 1HPX 19 180 173 160 114 55 34 19 8 4 2 2HIV protease 1HSG 16 165 152 123 70 25 17 12 6 4 3 2HIV protease 1HTF 16 184 178 150 73 26 18 12 6 3 2 2HIV protease 1HVR 10 126 96 53 20 9 6 5 2 1 1 1HIV protease 4PHV 17 171 162 147 89 36 25 15 8 4 3 2
134
Page 150
Table 5.6 continued
Number of clusters obtained for increasing rmsd (Å) similarity valuesa
protein pdb codeb Nrotc Nconfd rmsd
1.00
rmsd
1.50
rmsd
2.00
rmsd
2.50
rmsd
2.75
rmsd
3.00
rmsd
3.50
rmsd
4.00
rmsd
4.50
rmsd
5.00 L-arabinose BP 1ABE 4 7 1 1 1 1 1 1 1 1 1 1L-arabinose BP
1ABF 4 11 1 1 1 1 1 1 1 1 1 1L-arabinose BP 1APB 4 11 1 1 1 1 1 1 1 1 1 1L-arabinose BP 1BAP 4 7 1 1 1 1 1 1 1 1 1 1L-arabinose BP 5ABP 6 36 1 1 1 1 1 1 1 1 1 1L-arabinose BP 6ABP 4 9 1 1 1 1 1 1 1 1 1 1L-arabinose BP 7ABP 4 12 1 1 1 1 1 1 1 1 1 1L-arabinose BP
8ABP
6 39 1 1 1 1 1 1 1 1 1 1
thymidylate synthase
1BID
5 48 19 5 1 1 1 1 1 1 1 1
trypsin 1PPC 13 165 152 111 42 17 11 7 4 3 2 1trypsin 1PPH 10 112 89 51 15 5 5 4 2 2 1 1trypsin 1TNG 2 2 1 1 1 1 1 1 1 1 1 1trypsin 1TNH 2 1 1 1 1 1 1 1 1 1 1 1trypsin 1TNJ 3 2 1 1 1 1 1 1 1 1 1 1trypsin 1TNK 4 5 3 1 1 1 1 1 1 1 1 1trypsin 1TNL 2 2 1 1 1 1 1 1 1 1 1 1trypsin
3PTB
3 2 1 1 1 1 1 1 1 1 1 1
elastase
1ELC
16 177 159 115 42 16 10 7 5 2 1 1
histidine BP
1HSL
4 5 5 1 1 1 1 1 1 1 1 1
retinol BP
1RBP
10 136 40 14 5 2 2 2 1 1 1 1
glucose/galactose BP 2GBP 6 30 1 1 1 1 1 1 1 1 1 1intestinal fatty acid BP 2IFB 14 188 170 36 8 4 3 2 1 1 1 1 aRmsd similarity values are computed using heavy atoms only. bSee Table 5.1 for pdb references. cNumber of rotatable bonds (Nrot) sampled in the conformational searches. dNumber of conformers (Nconf) obtained from a limited conformational search that requested 200 starting structures.
135
Page 151
Figure 5. 10. A histogram representation of how similarity values affect the number of
clusters for the 26 most flexible ligands.
136
Page 152
The grouping of conformers into clusters of similar geometry is visually represented in
Figure 5.11. Here, the first 4 clusters are shown for ligand 1HPX and were obtained
using a rmsd similarity value of 2.0 Å.
Figure 5. 11. A visual representation of clustering. The first 4 clusters are shown for
ligand 1HPX and were obtained using a rmsd similarity value of 2.0 Å.
137
Page 153
The grouping of conformers into families does reduce the dimensionality of the
problem, however, in any filtering technique correct solutions will almost certainly be
discarded. To determine how many of the cluster representatives are geometrically
similar to the bound crystal structure conformation we computed the number of family
members in each cluster that have an rmsd <= 2.0 Å from the geometry of the ligand in
the crystal for 5 different rmsd tolerance values. In Table 5.7 only compounds with 10
rotatable bonds or more are included (N=26). Here, a value of 0 corresponds to no
cluster member having a bound-like conformation. In principle only 1 bound-like
conformer needs to be retained for the technique to be useful. Clustering based on a rmsd
similarity cutoff of 2.50 appears to dramatically reduce the number of conformers (Table
5.6) yet still retain at least 1 conformer that is close to the crystal structure geometry of
the bound ligand for the majority of systems in Table 5.7. For each rmsd tolerance cutoff
value in Table 5.7 the total number of ligands for which no cluster member is <= 2.0 Å
from the crystal conformation is the No. missed value and indicates that the bound-like
conformation was filtered out. Using smaller rmsd tolerances in the clustering does
increase the likelihood that a bound-like conformations will be retained however the
number of cluster representatives is also increased.
138
Page 154
Table 5. 7. The Number of Cluster Representatives with an rmsd <= 2.0 Å from the
Ligand Crystal Conformation. Five Cluster Tolerances are Shown.
ligand 1.50 Å 2.00 Å 2.50 Å (rmsd to crystal) 2.75 Å 3.00 Å
1AE8 6 2 1 (1.7) 0 0
1BMM 7 4 1 (1.9) 1 0
1BMN 4 3 1 (1.9) 1 1
1DWC 4 2 1 (1.3) 1 1
1DWD 0 0 0 0 0
1HDT 3 1 1 (1.3) 1 1
1ETS 5 4 0 1 1
1ETT 5 1 1 (1.1) 1 1
1AAQ 3 2 0 1 1
1AJV 20 3 1 (1.5) 1 1
1AJX 6 2 0 0 0
1GNO 1 1 1 (1.8) 1 0
1HBV 1 1 1 (2.0) 0 0
1HIH 3 3 1 (1.0) 1 1
1HPS 2 1 1 (2.0) 1 1
1HPV 4 1 1 (0.9) 0 0
1HPX 3 3 1 (1.8) 1 1
1HSG 2 0 0 0 0
1HTF 3 1 1 (1.7) 0 0
1HVR 5 1 1 (1.8) 1 1
4PHV 0 0 0 0 0
1PPC 5 2 1 (1.9) 1 0
1PPH 7 2 0 0 0
1ELC 5 2 1 (1.8) 1 0
1RBP 7 2 1 (0.8) 1 1
2IFB 17 3 1 (1.3) 1 1
No. missed No. missed No. missed No. missed No. missed
2 3 7 9 13
139
Page 155
Figure 5.12 shows the cluster representative that was retained after first pruning
down the total conformer list (Nconf → Nclust) using an rmsd similarity tolerance of 2.5
Å overlaid with the experimental crystal structure for 4 representative compounds in
Table 5.7.
Figure 5. 12. Representative cluster survivors (ball and stick representation) overlaid
with crystal structure conformation (spoke representation).
140
Page 156
Conclusion.
In this chapter we have presented rigid docking results for 44 protein-ligand
complexes, conformational search results for each unbound ligand, and cluster results
based on geometric similarity. An upper limit of 82% was found for the re-docking of
the ligands back into their respective proteins using the ligand conformation of the
crystal. To determine if bound-like geometries of each ligand could be generated for
cases in which the binding geometry of ligand was not known, a limited conformational
search which requested 200 starting structures was performed for each ligand. Despite
the limited searches, bound-like geometries were found among the many local minima
generated, even for very flexible ligands. Clustering analysis has been used to group the
conformational search results into families of like geometry as defined by a rmsd
similarity tolerance value. Clustering based on a rmsd value of 2.5 Å dramatically
reduced the total number of clusters yet still retained at least one cluster representative
with a conformation similar to the experimental bound-like conformation for the majority
of systems. For a given ligand it may be appropriate to vary the rmsd cutoff until the
desired number of clusters is obtained. Although a clustering solution may be
geometrically similar to the bound-like ligand it remains to be seen if these structure can
be docked back into the protein binding sites given that a perfect fit is unlikely. Although
reducing the steric penalty for overlap between the ligand and protein should improve the
percent of cluster survivors that can be successfully docked in, molecular dynamics or
Monte Carlo simulations should be used to refine the candidate structures prior to any
binding affinity estimations using scoring-based functions.
141
Page 157
Cited References.
(1) AIDS epidemic update: December 2000, Joint United Nations Programme on
HIV/AIDS (UNAIDS) and The World Health Organization (WHO).
http://www.unaids.org.
(2) AIDS epidemic update: December 1999, Joint United Nations Programme on
HIV/AIDS (UNAIDS) and The World Health Organization (WHO).
http://www.unaids.org.
(3) Goodenow, M.; Huet, T.; Saurin, W.; Kwok, S.; Sninsky, J.; Wainhobson, S. HIV-1
Isolates Are Rapidly Evolving Quasispecies: Evidence For Viral Mixtures and Preferred
Nucleotide Substitutions. J. Acquir. Immune Defic. Syndr. Hum. Retrovirol. 1989, 2,
344-352.
(4) Eigen, M. On the nature of virus quasispecies. Trends Microbiol. 1996, 4, 216-218.
(5) Harper, D. R. Molecular Virology; Bios Scientific Publishers Ltd: Oxford, 1998.
(6) Metropolis, N.; Rosenbluth, A. W.; Rosenbluth, M., N; Teller, A. H. Equation of
State Calculations by Fast Computing Machines. J. Chem. Phys. 1953, 21, 1087-1092.
(7) Allen, M. P.; Tidlesley, D. J. Computer Simulations of Liquids; Clarendon Press:
Oxford, 1987.
(8) Jorgensen, W. L. Monte Carlo Simulations for Liquids. In Encyclopedia of
Computational Chemistry; Schleyer, P. v. R., Ed.; Wiley: New York, 1998; Vol. 3, pp
1754-1763.
(9) Verlet, L. Computer 'Experiments' on Classical Fluids. I. Thermodynamical
Properties of Lennard-Jones Molecules. Phys. Rev. 1967, 159, 98-103.
142
Page 158
(10) Allinger, N. A. Force Fields: A Brief Introduction. In Encyclopedia of
Computational Chemistry; Schleyer, P. v. R., Ed.; Wiley: New York, 1998; Vol. 2, pp
1013-1015.
(11) Jorgensen, W. L.; Maxwell, D. S.; Tirado-Rives, J. Development and Testing of the
OPLS All-Atom Force Field on Conformational Energetics and Properties of Organic
Liquids. J. Am. Chem. Soc. 1996, 118, 11225-11236.
(12) Zwanzig, R. W. High-Temperature Equation of State by a Perturbation Method. I.
Nonpolar Gases. J. Chem. Phys. 1954, 22, 1420-1426.
(13) Jorgensen, W. L.; Ravimohan, C. Monte Carlo Simulation of Differences in Free
Energies of Hydration. J. Chem. Phys. 1985, 83, 3050-3054.
(14) Jorgensen, W. L.; Briggs, J. M.; Contreras, M. L. Relative Partition-Coefficients For
Organic Solutes From Fluid Simulations. J. Phys. Chem. 1990, 94, 1683-1686.
(15) Åqvist, J.; Medina, C.; Samuelsson, J.-E. A New Method For Predicting Binding
Affinity in Computer-Aided Drug Design. Protein Eng. 1994, 7, 385-391.
(16) Carlson, H. A.; Jorgensen, W. L. An Extended Linear Response Method For
Determining Free Energies of Hydration. J. Phys. Chem. 1995, 99, 10667-10673.
(17) McDonald, N. A.; Carlson, H. A.; Jorgensen, W. L. Free energies of solvation in
chloroform and water from a linear response approach. J. Phys. Org. Chem. 1997, 10,
563-576.
(18) Hansson, T.; Åqvist, J. Estimation of binding free energies for HIV proteinase
inhibitors by molecular dynamics simulations. Protein Eng. 1995, 8, 1137-1144.
(19) Paulsen, M. D.; Ornstein, R. L. Binding free energy calculations for P450cam-
substrate complexes. Protein Eng. 1996, 9, 567-571.
143
Page 159
(20) Hulten, J.; Bonham, N. M.; Nillroth, U.; Hansson, T.; Zuccarello, G.; Bouzide, A.;
Aqvist, J.; Classon, B.; Danielson, U. H.; Karlen, A.; Kvarnstrom, I.; Samuelsson, B.;
Hallberg, A. Cyclic HIV-1 Protease Inhibitors Derived from Mannitol: Synthesis,
Inhibitory Potencies, and Computational Predictions of Binding Affinities. J. Med.
Chem. 1997, 40, 885-897.
(21) Hansson, T.; Marelius, J.; Aqvist, J. Ligand binding affinity prediction by linear
interaction energy methods. J. Comput.-Aided Mol. Des. 1998, 12, 27-35.
(22) Wang, W.; Wang, J.; Kollman, P. A. What Determines the van der Waals
Coefficient beta in the LIE (Linear Interaction Energy) Method to Estimate Binding Free
Energies Using Molecular Dynamics Simulations? Proteins 1999, 34, 395-402.
(23) Jones-Hertzog, D. K.; Jorgensen, W. L. Binding affinities for Sulfonamide Inhibitors
with human Thrombin Using Monte Carlo Simulations with a Linear Response Method.
J. Med. Chem. 1997, 40, 1539-49.
(24) Smith, R. H.; Jorgensen, W. L.; Tirado-Rives, J.; Lamb, M. L.; Janssen, P. A. J.;
Michejda, C. J.; Smith, M. B. K. Prediction of Binding Affinities for TIBO Inhibitors of
HIV-1 Reverse Transcriptase Using Monte Carlo Simulations in a Linear Response
Method. J. Med. Chem. 1998, 41, 5272-5286.
(25) Lamb, M. L.; Tirado-Rives, J.; Jorgensen, W. L. Estimation of the binding affinities
of FKBP12 inhibitors using a linear response method. Bioorg. Med. Chem. 1999, 7, 851-
860.
(26) Duffy, E. M.; Jorgensen, W. L. Prediction of Properties from Simulations: Free
Energies of Solvation in Hexadecane, Octanol, and Water. J. Am. Chem. Soc. 2000, 122,
2878-2888.
144
Page 160
(27) Morgantini, P. Y.; Kollman, P. A. Solvation Free Energies of Amides and Amines:
Disagreement Between Free Energy Calculations and Experiment. J. Am. Chem. Soc.
1995, 117, 6057-6063.
(28) Ding, Y. B.; Bernardo, D. N.; Kroghjespersen, K.; Levy, R. M. Solvation Free
Energies of Small Amides and Amines From Molecular-Dynamics Free Energy
Perturbation Simulations Using Pairwise Additive and Many-Body Polarizable
Potentials. J. Phys. Chem. 1995, 99, 11575-11583.
(29) Ben-Naim, A.; Marcus, Y. Solvation Thermodynamics of Nonionic Solutes. J.
Chem. Phys. 1984, 81, 2016-2027.
(30) Jones, F. M., III; Arnett, E. M. Thermodynamics of Ionization and Solution of
Aliphatic Amines in Water. Prog. Phys. Org. Chem. 1974, 11, 263-322.
(31) Wolfenden, R. Interaction of the Peptide Bond With Solvent Water: A Vapor Phase
Analysis. Biochemistry 1978, 17, 201-204.
(32) Rao, B. G.; Singh, U. C. Hydrophobic Hydration - a Free-Energy Perturbation
Study. J. Am. Chem. Soc. 1989, 111, 3125-3133.
(33) Meng, E. C.; Caldwell, J. W.; Kollman, P. A. Investigating the anomalous solvation
free energies of amines with a polarizable potential. J. Phys. Chem. 1996, 100, 2367-
2371.
(34) Marten, B.; Kim, K.; Cortis, C.; Friesner, R. A.; Murphy, R. B.; Ringnalda, M. N.;
Sitkoff, D.; Honig, B. New model for calculation of solvation free energies: Correction of
self-consistent reaction field continuum dielectric theory for short-range hydrogen-
bonding effects. J. Phys. Chem. 1996, 100, 11775-11788.
145
Page 161
(35) Cramer, C. J.; Truhlar, D. G. Am1-Sm2 and Pm3-Sm3 Parameterized Scf Solvation
Models For Free-Energies in Aqueous-Solution. J. Comput.-Aided Mol. Des. 1992, 6,
629-666.
(36) Barone, V.; Cossi, M.; Tomasi, J. A new definition of cavities for the computation of
solvation free energies by the polarizable continuum model. J. Chem. Phys. 1997, 107,
3210-3221.
(37) Klamt, A.; Jonas, V.; Burger, T.; Lohrenz, J. C. W. Refinement and parametrization
of COSMO-RS. J. Phys. Chem. A 1998, 102, 5074-5085.
(38) Sun, Y. X.; Spellmeyer, D.; Pearlman, D. A.; Kollman, P. Simulation of the
Solvation Free-Energies For Methane, Ethane, and Propane and Corresponding Amino-
Acid Dipeptides - a Critical Test of the Bond-Pmf Correction, a New Set of Hydrocarbon
Parameters, and the Gas-Phase Water Hydrophobicity Scale. J. Am. Chem. Soc. 1992,
114, 6798-6801.
(39) Jorgensen, W. L.; Tirado-Rives, J. Free energies of hydration for organic molecules
from Monte Carlo simulations. Perspect. Drug Discov. Design 1995, 3, 123-138.
(40) Cornell, W. D.; Cieplak, P.; Bayly, C. I.; Gould, I. R.; Merz, K. M.; Ferguson, D.
M.; Spellmeyer, D. C.; Fox, T.; Caldwell, J. W.; Kollman, P. A. A 2nd Generation Force
Field for the Simulation of Proteins, Nucleic Acids, and Organic Molecules. J. Am.
Chem. Soc. 1995, 117, 5179-5197.
(41) Gao, J. L.; Xia, X.; George, T. F. Importance of Bimolecular Interactions in
Developing Empirical Potential Functions For Liquid-Ammonia. J. Phys. Chem. 1993,
97, 9241-9247.
(42) Jorgensen, W. L. BOSS Version 3.8; Yale University: New Haven, CT, 1997.
146
Page 162
(43) Frisch, M. J.; Trucks, G. W.; Schlegel, H. B.; Scuseria, G. E.; Robb, M. A.;
Cheeseman, J. R.; Strain, M. C.; Burant, J. C.; Stratman, R. E.; Petersson, G. A.;
Montgomery, J. A.; Zakrzewski, V. G.; Raghavachari, K.; Ayala, P. Y.; Cui, Q.;
Morokuma, K.; Ortiz, J. V.; Foresman, J. B.; Cioslowski, J.; Stefanov, B. B.; Chen, W.;
Wong, M. W.; Andres, J. L.; Replogle, E. S.; Gomperts, R.; Martin, R. L.; Fox, D. J.;
Keith, T.; Al-Laham, M. A.; Nanayakkara, A.; Challacombe, M.; Peng, C. Y.; Stewart, J.
J. P.; Gonzalez, C.; Head-Gordon, M.; Gill, P. M. W.; Johnson, B. G.; Pople, J. A.
Gaussian 95, Development Version (Revision E.1); Gaussian Inc.: Pittsburgh PA, 1996.
(44) Maxwell, D.; Tirado-Rives, J. Fitpar Version 1.1.1.; Yale University: New Haven,
Connecticut, 1994.
(45) Jorgensen, W. L.; Chandrasekhar, J.; Madura, J. D.; Impey, R. W.; Klein, M. L.
Comparison of simple potential functions for simulating liquid water. J. Chem. Phys.
1983, 79, 926-935.
(46) Severance, D. L.; Essex, J. W.; Jorgensen, W. L. Generalized Alteration of Structure
and Parameters - a New Method For Free-Energy Perturbations in Systems Containing
Flexible Degrees of Freedom. J. Comput. Chem. 1995, 16, 311-327.
(47) Jorgensen, W. L.; Chandrasekhar, J.; Madura, J. D.; Impey, R. W.; Klein, M. L.
Comparison of Simple Potential Functions For Simulating Liquid Water. J. Chem. Phys.
1983, 79, 926-935.
(48) Stamant, A.; Cornell, W. D.; Kollman, P. A. Calculation of Molecular Geometries,
Relative Conformational Energies, Dipole-Moments, and Molecular Electrostatic
Potential Fitted Charges of Small Organic-Molecules of Biochemical Interest By
Density-Functional Theory. J. Comput. Chem. 1995, 16, 1483-1506.
147
Page 163
(49) Lambert, J. B.; Featherman, S. I. Conformational Analysis of Pentamethylene
Heterocycles. Chem. Rev. 1975, 75, 611-626.
(50) Blackburne, I. D.; Katritzky, A. R.; Takeuchi, Y. Conformations of Piperidine and of
Derivatives with Additional Ring Heteroatoms. Accounts Chem. Res. 1975, 8, 300-306.
(51) Anet, F. A. L.; Ghiaci, M. On the Question of the Realtionship of Nitrogen-15
Chemical Shifts to Barriers to C-N Internal Rotation. Dynamic Nuclear Magnetic
Resonance of Urea and Aniline Derivatives. J. Am. Chem. Soc. 1979, 101, 6857-6860.
(52) Murphy, R. B.; Beachy, M. D.; Friesner, R. A.; Ringnalda, M. N. Pseudospectral
Localized Moller-Plesset Methods - Theory and Calculation of Conformational Energies.
J. Chem. Phys. 1995, 103, 1481-1490.
(53) Kim, K. S.; Friesner, R. A. Hydrogen bonding between amino acid backbone and
side chain analogues: A high-level ab initio study. J. Am. Chem. Soc. 1997, 119, 12952-
12961.
(54) Åqvist, J. Ion-Water Interaction Potentials Derived form Free Energy Perturbation
Simulations. J. Phys. Chem. 1990, 94, 8021-8024.
(55) Davidson, W. R.; Kebarle, P. Binding-Energies and Stabilities of Potassium-Ion
Complexes From Studies of Gas-Phase Ion Equilibria K+ + M = K+M. J. Am. Chem.
Soc. 1976, 98, 6133-6138.
(56) Haar, L.; Gallagher, J. S. Thermodynamic Properties of Ammonia. J. Phys. Chem.
Ref. Data 1978, 7, 635-&.
(57) Felsing, W. A.; Thomas, A. R. Vapor Pressures and Other Physical Constants of
Methylamine and Methylamine Solutions. Ind. Eng. Chem. 1929, 21, 1269-1272.
148
Page 164
(58) Aston, J. G.; Siller, C. W.; Messerly, G. H. Heat Capacities and Entropies of Organic
Compounds. III. Methylamine from 11.5 °K. to the Boiling Point. Heat of Vaporization
and Vapor Pressure. The Enropy from Molecular Data. J. Am. Chem. Soc. 1937, 59,
1743-1751.
(59) Swift, E., Jr. The Densities of Some Aliphatic Amines. J. Am. Chem. Soc. 1942, 64,
115-116.
(60) The Properties of Gases and Liquids, 3rd ed.; Reid, R. C., Prausnitz, J. M. and
Sherwood, T. K., Ed.; McGraw-Hill, New York, 1977.
(61) Letcher, T. M. Thermodynamics of aliphatic amine mixtures I. The excess volumes
of mixing for primary, secondary, and tertiary aliphatic amines with benzene and
substituted benzene compounds. J. Chem. Thermodyn. 1972, 5, 159-173.
(62) CRC Handbook of Chemistry and Physics, 72nd ed.; Lide, D. R., Ed.; CRC Press,
Inc., Boca Raton, FL, 1991-1992.
(63) Aston, J. G.; Eidinoff, M. L.; Forster, W. S. The Heat Capacitiy and Entropy, Heats
of Fusion and Vaporization and the Vapor Pressure of Dimethylamine. J. Am. Chem.
Soc. 1939, 61, 1539-1543.
(64) Aston, J. G.; Sagenkahn, M. L.; Szasz, G. J.; Moessen, G. W.; Zuhr, H. F. The Heat
Capacitiy and Entropy, Heats of Fusion and Vaporization and the Vapor Pressure of
Trimethylamine. The Enropy from Spectroscopic and Molecular Data. J. Am. Chem.
Soc. 1944, 66, 1171-1177.
(65) Barb, W. G. The Kinetics and Mechinism of the Polymerization of Ethyleneimine.
J. Chem. Soc. 1955, 2564-2577.
149
Page 165
(66) Cabani, S.; Conti, G.; Lepori, L. Thermodynamic Study on Aqueous Dilute
Solutions of Organic Compounds Part 1. Cyclic Amines. Trans. Faraday Soc. 1971, 67,
1933-1942.
(67) Ruzicka, L.; Salomon, G.; Meyer, K. E. Overview of Cyclic Amine Properties (In
German). Helv. Chim. Acta 1937, 20, 109-128.
(68) Helm, V. R.; Lanum, W. J.; Cook, G. L.; Ball, J. S. Purification and properties of
pyrrole, purrolidine, pyridine, and 2-methylpyridine. J. Am. Chem. Soc. 1958, 62, 858-
861.
(69) Lanum, W. J.; Morris, J. C. Physical Properties of Some Sulfur and Nitrogen
Compounds. J. Chem. Eng. Data 1969, 14, 93-98.
(70) Nakanishi, K.; Wada, H.; Touhara, H. Thermodynamics excess functions of
methanol + piperidine at 298.15 K. J. Chem. Thermodyn. 1975, 7, 1125-1130.
(71) Le Fevre, J. W. A simple relationship between molecular polarisation in solution and
the dielectric constant of the solvent. J. Chem. Soc. 1935, 773-779.
(72) Vriens, G. N.; Hill, A. G. Equilibria of Several Reactions of Aromatic Amines. Ind.
Eng. Chem. 1952, 44, 2732-2735.
(73) Jorgensen, W. L.; Ibrahim, M. Structure and Properties of Liquid Ammonia. J. Am.
Chem. Soc. 1980, 102, 3309-3315.
(74) Narten, A. H. Liquid-Ammonia - Molecular Correlation-Functions From X-Ray-
Diffraction. J. Chem. Phys. 1977, 66, 3117-3120.
(75) Giesen, D. J.; Chambers, C. C.; Cramer, C. J.; Truhlar, D. G. Solvation model for
chloroform based on class IV atomic charges. J. Phys. Chem. B 1997, 101, 2061-2069.
150
Page 166
(76) Miklavc, A. Solvation free energies of small amines: An interpretation thereof and
its general significance. J. Chem. Inf. Comput. Sci. 1998, 38, 269-270.
(77) Straatsma, T. P.; McCammon, J. A. Treatment of Rotational Isomers in Free-Energy
Evaluations - Analysis of the Evaluation of Free-Energy Differences By Molecular-
Dynamics Simulations of Systems With Rotational Isomeric States. J. Chem. Phys.
1989, 90, 3300-3304.
(78) Jorgensen, W. L.; Morales de Tirado, P. I.; Severance, D. L. Monte-Carlo Results
For the Effect of Solvation On the Anomeric Equilibrium For 2-Methoxytetrahydropyran.
J. Am. Chem. Soc. 1994, 116, 2199-2200.
(79) Jorgensen, W. L., To be published.
(80) Dunn, W. J., III; Nagy, P. I. Relative Log-P and Solution Structure For Small
Organic Solutes in the Chloroform Water-System Using Monte-Carlo Methods. J.
Comput. Chem. 1992, 13, 468-477.
(81) Mitsuya, H.; Yarchoan, R.; Broder, S. Molecular Targets For Aids Therapy. Science
1990, 249, 1533-1544.
(82) De Clercq, E. HIV Resistance to Reverse Transcriptase Inhibitors. Biochem.
Pharmacol. 1994, 47, 155-169.
(83) Katz, R. A.; Skalka, A. M. The Retroviral Enzymes. Ann. Rev. Biochem. 1994, 63,
133-173.
(84) Turner, B. G.; Summers, M. F. Structural Biology of HIV. J. Mol. Biol. 1999, 285,
1-32.
(85) Tantillo, C.; Ding, J. P.; Jacobomolina, A.; Nanni, R. G.; Boyer, P. L.; Hughes, S.
H.; Pauwels, R.; Andries, K.; Janssen, P. A. J.; Arnold, E. Locations of Anti-Aids Drug
151
Page 167
Binding Sites and Resistance Mutations in the 3-Dimensional Structure of HIV-1 Reverse
Transcriptase: Implications For Mechanisms of Drug Inhibition and Resistance. J. Mol.
Biol. 1994, 243, 369-387.
(86) Rodgers, D. W.; Gamblin, S. J.; Harris, B. A.; Ray, S.; Culp, J. S.; Hellmig, B.;
Woolf, D. J.; Debouck, C.; Harrison, S. C. The Structure of Unliganded Reverse-
Transcriptase From the Human-Immunodeficiency-Virus Type-1. Proc. Natl. Acad. Sci.
U. S. A. 1995, 92, 1222-1226.
(87) Huang, H.; Chopra, R.; Verdine, G. L.; Harrison, S. C. Structure of a Covalently
Trapped Catalytic Complex of HIV-1 Reverse Transcriptase: Implications for Drug
Resistance. Science 1998, 282, 1669-1674.
(88) Hopkins, A. L.; Ren, J. S.; Esnouf, R. M.; Willcox, B. E.; Jones, E. Y.; Ross, C.;
Miyasaka, T.; Walker, R. T.; Tanaka, H.; Stammers, D. K.; Stuart, D. I. Complexes of
HIV-1 reverse transcriptase with inhibitors of the HEPT series reveal conformational
changes relevant to the design of potent non-nucleoside inhibitors. J. Med. Chem. 1996,
39, 1589-1600.
(89) Preston, B. D.; Poiesz, B. J.; Loeb, L. A. Fidelity of HIV-1 Reverse Transcriptase.
Science 1988, 242, 1168-1171.
(90) Roberts, J. D.; Bebenek, K.; Kunkel, T. A. The Accuracy of Reverse Transcriptase
From HIV-1. Science 1988, 242, 1171-1173.
(91) Perelson, A. S.; Neumann, A. U.; Markowitz, M.; Leonard, J. M.; Ho, D. D. HIV-1
Dynamics in Vivo: Virion Clearance Rate, Infected Cell Life-Span, and Viral Generation
Time. Science 1996, 271, 1582-1586.
152
Page 168
(92) Wilson, E. K. AIDS Conference Highlights Hope of Drug Cocktails, Chemokine
Research. Chem. Eng. News 1996, 74, 42-46.
(93) Cohen, J. AIDS Therapies: The Daunting Challenge of Keeping HIV Suppressed.
Science 1997, 277, 32-33.
(94) Tanaka, H.; Takashima, H.; Ubasawa, M.; Sekiya, K.; Nitta, I.; Baba, M.; Shigeta,
S.; Walker, R. T.; Declercq, E.; Miyasaka, T. Synthesis and Antiviral Activity of Deoxy
Analogs of 1[(2- Hydroxyethoxy)Methyl]-6-(Phenylthio)Thymine (HEPT) As Potent and
Selective Anti-HIV-1 Agents. J. Med. Chem. 1992, 35, 4713-4719.
(95) Tanaka, H.; Takashima, H.; Ubasawa, M.; Sekiya, K.; Inouye, N.; Baba, M.;
Shigeta, S.; Walker, R. T.; Declercq, E.; Miyasaka, T. Synthesis and Antiviral Activity of
6-Benzyl Analogs of 1-[(2- Hydroxyethoxy)Methyl]-6-(Phenylthio)Thymine (HEPT) As
Potent and Selective Anti-HIV-1 Agents. J. Med. Chem. 1995, 38, 2860-2865.
(96) Tanaka, H.; Baba, M.; Hayakawa, H.; Sakamaki, T.; Miyasaka, T.; Ubasawa, M.;
Takashima, H.; Sekiya, K.; Nitta, I.; Shigeta, S.; Walker, R. T.; Balzarini, J.; Declercq, E.
A New Class of HIV-1-Specific 6-Substituted Acyclouridine Derivatives: Synthesis and
Anti-HIV-1 Activity of 5- Substituted or 6-Substituted Analogs of 1-[(2-
Hydroxyethoxy)Methyl]-6-(Phenylthio)Thymine (HEPT). J. Med. Chem. 1991, 34, 349-
357.
(97) Tanaka, H.; Takashima, H.; Ubasawa, M.; Sekiya, K.; Nitta, I.; Baba, M.; Shigeta,
S.; Walker, R. T.; Declercq, E.; Miyasaka, T. Structure-Activity-Relationships of 1-[(2-
Hydroxyethoxy)Methyl]-6-(Phenylthio)Thymine Analogs: Effect of Substitutions At the
C-6 Phenyl Ring and At the C-5 Position On Anti-HIV-1 Activity. J. Med. Chem. 1992,
35, 337-345.
153
Page 169
(98) Hargrave, K. D.; Proudfoot, J. R.; Grozinger, K. G.; Cullen, E.; Kapadia, S. R.;
Patel, U. R.; Fuchs, V. U.; Mauldin, S. C.; Vitous, J.; Behnke, M. L.; Klunder, J. M.; Pal,
K.; Skiles, J. W.; McNeil, D. W.; Rose, J. M.; Chow, G. C.; Skoog, M. T.; Wu, J. C.;
Schmidt, G.; Engel, W. W.; Eberlein, W. G.; Saboe, T. D.; Campbell, S. J.; Rosenthal, A.
S.; Adams, J. Novel Nonnucleoside Inhibitors of HIV-1 Reverse-Transcriptase. 1.
Tricyclic Pyridobenzodiazepinones and Dipyridodiazepinones. J. Med. Chem. 1991, 34,
2231-2241.
(99) Jorgensen, W. L. Free Energy Changes in Solution. In Encyclopedia of
Computational Chemistry; Schleyer, P. v. R., Ed.; Wiley: New York, 1998; Vol. 2, pp
1061-1070.
(100) Lamb, M. L.; Jorgensen, W. L. Computational approaches to molecular
recognition. Curr. Opin. Chem. Biol. 1997, 1, 449-457.
(101) Kollman, P. Free Energy Calculations: Applications to Chemical and Biochemical
Phenomena. Chem. Rev. 1993, 93, 2395-2417.
(102) Jorgensen, W. L. Free Energy Calculations: A Breakthrough for Modeling Organic
Chemistry in Solution. Acc. Chem. Res. 1989, 22, 184-189.
(103) Ren, J.; Esnouf, R.; Garman, E.; Somers, D.; Ross, C.; Kirby, I.; Keeling, J.; Darby,
G.; Jones, Y.; Stuart, D.; et al. High resolution structures of HIV-1 RT from four RT-
inhibitor complexes. Nat. Struct. Biol. 1995, 2, 293-302.
(104) Lim, D. Autozmat Version 1.85; Yale University: New Haven, CT, 1999.
(105) Lim, D.; Jorgensen, W. L. ChemEdit. In Encyclopedia of Computational
Chemistry; Schleyer, P. v. R., Ed.; Wiley: New York, 1998; Vol. 5, pp 3295-3302.
(106) Tirado-Rives, J. PEPZ Version 1.0; Yale University: New Haven, CT, 1997.
154
Page 170
(107) Jorgensen, W. L. BOSS Version 4.1; Yale University: New Haven, CT, 2000.
(108) Smerdon, S. J.; Jager, J.; Wang, J.; Kohlstaedt, L. A.; Chirino, A. J.; Friedman, J.
M.; Rice, P. A.; Steitz, T. A. Structure of the Binding Site for Nonnucleoside Inhibitors
of the Reverse Transcriptase of Human Immunodeficiency Virus Type 1. Proc. Natl.
Acad. Sci. U. S. A. 1994, 91, 3911-3915.
(109) Ding, J.; Das, K.; Tantillo, C.; Zhang, W.; Clark, A. D., Jr.; Jessen, S.; Lu, X.;
Hsiou, Y.; Jacobo-Molina, A.; Andries, K.; et al. Structure of HIV-1 reverse transcriptase
in a complex with the non-nucleoside inhibitor alpha-APA R 95845 at 2.8 Å resolution.
Structure 1995, 3, 365-79.
(110) Das, K.; Ding, J. P.; Hsiou, Y.; Clark, A. D.; Moereels, H.; Koymans, L.; Andries,
K.; Pauwels, R.; Janssen, P. A. J.; Boyer, P. L.; Clark, P.; Smith, R. H.; Smith, M. B. K.;
Michejda, C. J.; Hughes, S. H.; Arnold, E. Crystal structures of 8-Cl and 9-Cl TIBO
complexed with wild- type HIV-1 RT and 8-Cl TIBO complexed with the Tyr181Cys
HIV-1 RT drug-resistant mutant. J. Mol. Biol. 1996, 264, 1085-1100.
(111) Ren, J.; Esnouf, R.; Hopkins, A.; Ross, C.; Jones, Y.; Stammers, D.; Stuart, D. The
structure of HIV-1 reverse transcriptase complexed with 9-chloro-TIBO: lessons for
inhibitor design. Structure 1995, 3, 915-26.
(112) Esnouf, R. M.; Ren, J. S.; Hopkins, A. L.; Ross, C. K.; Jones, E. Y.; Stammers, D.
K.; Stuart, D. I. Unique features in the structure of the complex between HIV-1 reverse
transcriptase and the bis(heteroaryl)piperazine (BHAP) U-90152 explain resistance
mutations for this nonnucleoside inhibitor. Proc. Natl. Acad. Sci. U. S. A. 1997, 94,
3984-3989.
155
Page 171
(113) Ren, J.; Esnouf, R. M.; Hopkins, A. L.; Warren, J.; Balzarini, J.; Stuart, D. I.;
Stammers, D. K. Crystal structures of HIV-1 reverse transcriptase in complex with
carboxanilide derivatives. Biochemistry 1998, 37, 14394-14403.
(114) Jorgensen, W. L. MCPRO Version 1.65; Yale University: New Haven, CT, 2000.
(115) Cheng, Y.; Prusoff, W. H. Relationship Between Inhibition Constant (Ki) and
Concentration of Inhibitor Which Causes 50 Per Cent Inhibition (I50) of an Enzymatic
Reaction. Biochem. Pharmacol. 1973, 22, 3099-3108.
(116) Balzarini, J.; Karlsson, A.; Sardana, V. V.; Emini, E. A.; Camarasa, M. J.;
Declercq, E. Human Immunodeficiency Virus 1 (HIV-1)-Specific Reverse- Transcriptase
(RT) Inhibitors May Suppress the Replication of Specific Drug-Resistant (E138K)RT
HIV-1 Mutants or Select For Highly Resistant (Y181 → C181I) RT HIV-1 Mutants.
Proc. Natl. Acad. Sci. U. S. A. 1994, 91, 6599-6603.
(117) Baba, M.; Shigeta, S.; Yuasa, S.; Takashima, H.; Sekiya, K.; Ubasawa, M.; Tanaka,
H.; Miyasaka, T.; Walker, R. T.; Declercq, E. Preclinical Evaluation of MKC-442, a
Highly Potent and Specific Inhibitor of Human-Immunodeficiency Virus Type 1 In Vitro.
Antimicrob. Agents Chemother. 1994, 38, 688-692.
(118) Sall, J. JMP Version 3; SAS Institute Inc.: Cary, NC, 1995.
(119) Böhm, H.-J.; Klebe, G. What Can We Learn from Molecular Recognition in
Protein-Ligand Complexes for the Design of New Drugs? Angew. Chem.-Int. Edit. Engl.
1996, 35, 2588-2614.
(120) Rizzo, R. C.; Jorgensen, W. L. OPLS All-Atom Model for Amines: Resolution of
the Amine Hydration Problem. J. Am. Chem. Soc. 1999, 121, 4827-4836.
(121) Pearlman, S.; Jorgensen, W. L., Submitted for publication.
156
Page 172
(122) Dunitz, J. D. The Entropic Cost of Bound Water in Crystals and Biomolecules.
Science 1994, 264, 670.
(123) Buckheit, R. W.; Fliakasboltz, V.; Yeagybargo, S.; Weislow, O.; Mayers, D. L.;
Boyer, P. L.; Hughes, S. H.; Pan, B. C.; Chu, S. H.; Bader, J. P. Resistance to 1-[(2-
Hydroxyethoxy)Methyl]-6-(Phenylthio)Thymine Derivatives Is Generated By Mutations
At Multiple Sites in the HIV-1 Reverse-Transcriptase. Virology 1995, 210, 186-193.
(124) De Clercq, E. The role of non-nucleoside reverse transcriptase inhibitors (NNRTIs)
in the therapy of HIV-1 infection. Antiviral Res. 1998, 38, 153-179.
(125) Young, S. D.; Britcher, S. F.; Tran, L. O.; Payne, L. S.; Lumma, W. C.; Lyle, T. A.;
Huff, J. R.; Anderson, P. S.; Olsen, D. B.; Carroll, S. S.; Pettibone, D. J.; Obrien, J. A.;
Ball, R. G.; Balani, S. K.; Lin, J. H.; Chen, I. W.; Schleif, W. A.; Sardana, V. V.; Long,
W. J.; Byrnes, V. W.; Emini, E. A. L-743,726 (Dmp-266) - a Novel, Highly Potent
Nonnucleoside Inhibitor of the Human-Immunodeficiency-Virus Type-1 Reverse-
Transcriptase. Antimicrob. Agents Chemother. 1995, 39, 2602-2605.
(126) Levin, J. NNRTI Update - NNRTI Resistance Report 1998.
http://www.natap.org/reports/NR5-nnrti_update2.resis.htm.
(127) Byrnes, V. W.; Sardana, V. V.; Schleif, W. A.; Condra, J. H.; Waterbury, J. A.;
Wolfgang, J. A.; Long, W. J.; Schneider, C. L.; Schlabach, A. J.; Wolanski, B. S.;
Graham, D. J.; Gotlib, L.; Rhodes, A.; Titus, D. L.; Roth, E.; Blahy, O. M.; Quintero, J.
C.; Staszewski, S.; Emini, E. A. Comprehensive Mutant Enzyme and Viral Variant
Assessment of Human-Immunodeficiency-Virus Type-1 Reverse-Transcriptase
Resistance to Nonnucleoside Inhibitors. Antimicrob. Agents Chemother. 1993, 37, 1576-
1579.
157
Page 173
(128) Balzarini, J.; Baba, M.; Declercq, E. Differential Activities of 1-[(2-
Hydroxyethoxy)Methyl]-6- (Phenylthio)Thymine Derivatives Against Different Human-
Immunodeficiency-Virus Type-1 Mutant Strains. Antimicrob. Agents Chemother. 1995,
39, 998-1002.
(129) Balzarini, J.; Karlsson, A.; Meichsner, C.; Paessens, A.; Riess, G.; Declercq, E.;
Kleim, J. P. Resistance Pattern of Human-Immunodeficiency-Virus Type-1 Reverse-
Transcriptase to Quinoxaline S-2720. J. Virol. 1994, 68, 7986-7992.
(130) Jorgensen, W. L. MATADOR Version 1.0; Yale University: New Haven, CT, 2000.
(131) Baxter, C. A.; Murray, C. W.; Clark, D. E.; Westhead, D. R.; Eldridge, M. D.
Flexible docking using Tabu search and an empirical estimate of binding affinity.
Proteins 1998, 33, 367-382.
(132) Levy, R. M. IMPACT Version c1.00; Schrödinger, Inc.: Jersy City, NJ, 1999.
(133) Rizzo, R. C.; Tirado-Rives, J.; Jorgensen, W. L. Estimation of Binding Affinities
for HEPT and Nevirapine Analogues with HIV-1 Reverse Transcriptase via Monte Carlo
Simulations. J. Am. Chem. Soc. 2001, 44, 145-154.
(134) Maga, G.; Ubiali, D.; Salvetti, R.; Pregnolato, M.; Spadari, S. Selective Interaction
of the Human Immunodeficiency Virus Type 1 Reverse Transcriptase Nonnucleoside
Inhibitor Efavirenz and Its Thio-Substituted Analog with Different Enzyme-Substrate
Complexes. Antimicrob. Agents Chemother. 2000, 44, 1186-1194.
(135) Ren, J.; Milton, J.; Weaver, K. L.; Short, S. A.; Stuart, D. I.; Stammers, D. K.
Structural Basis for the Resilience of Efavirenz (DMP-266) to Drug Resistance Mutations
in HIV-1 Reverse Transcriptase. Structure 2000, 8, 1089-1094.
158
Page 174
(136) Hopkins, A. L.; Ren, J. S.; Tanaka, H.; Baba, M.; Okamato, M.; Stuart, D. I.;
Stammers, D. K. Design of MKC-442 (emivirine) analogues with improved activity
against drug-resistant HIV mutants. J. Med. Chem. 1999, 42, 4500-4505.
(137) Rizzo, R. C.; Wang, D.; Tirado-Rives, J.; Jorgensen, W. L. Validation of a Model
for the Complex of HIV-1 Reverse Transcriptase with Sustiva through Computation of
Resistance Profiles. J. Med. Chem. 2001, 122, 12898-12900.
(138) De Simone, G.; Balliano, G.; Milla, P.; Gallina, C.; Giordano, C.; Tarricone, C.;
Rizzi, M.; Bolognesi, M.; Ascenzi, P. Human alpha-thrombin inhibition by the highly
selective compounds N-ethoxycarbonyl-D-Phe-Pro-alpha-azaLys p-nitrophenyl ester and
N-carbobenzoxy-Pro-alpha-azaLys p-nitrophenyl ester: a kinetic, thermodynamic and X-
ray crystallographic study. 1997, 269, 558-69.
(139) Malley, M. F.; Tabernero, L.; Chang, C. Y.; Ohringer, S. L.; Roberts, D. G.; Das,
J.; Sack, J. S. Crystallographic determination of the structures of human alpha-thrombin
complexed with BMS-186282 and BMS-189090. 1996, 5, 221-8.
(140) Banner, D. W.; Hadvary, P. Crystallographic analysis at 3.0-A resolution of the
binding to human thrombin of four active site-directed inhibitors. 1991, 266, 20085-93.
(141) Tabernero, L.; Chang, C. Y.; Ohringer, S. L.; Lau, W. F.; Iwanowicz, E. J.; Han,
W. C.; Wang, T. C.; Seiler, S. M.; Roberts, D. G.; Sack, J. S. Structure of a retro-binding
peptide inhibitor complexed with human alpha-thrombin. 1995, 246, 14-20.
(142) Brandstetter, H.; Turk, D.; Hoeffken, H. W.; Grosse, D.; Sturzebecher, J.; Martin,
P. D.; Edwards, B. F.; Bode, W. Refined 2.3 A X-ray crystal structure of bovine thrombin
complexes formed with the benzamidine and arginine-based thrombin inhibitors NAPAP,
159
Page 175
4-TAPAP and MQPA. A starting point for improving antithrombotics. 1992, 226, 1085-
99.
(143) Dreyer, G. B.; Lambert, D. M.; Meek, T. D.; Carr, T. J.; Tomaszek, T. A.;
Fernandez, A. V.; Bartus, H.; Cacciavillani, E.; Hassell, A. M.; Minnich, M.; et al.
Hydroxyethylene isostere inhibitors of human immunodeficiency virus-1 protease:
structure-activity analysis using enzyme kinetics, X-ray crystallography, and infected T-
cell assays. 1992, 31, 6646-59.
(144) Backbro, K.; Lowgren, S.; Osterlund, K.; Atepo, J.; Unge, T.; Hulten; Bonham, N.
M.; Schaal, W.; Karlen, A.; Hallberg, A. Unexpected binding mode of a cyclic sulfamide
HIV-1 protease inhibitor. 1997, 40, 898-902.
(145) Hong, L.; Treharne, A.; Hartsuck, J. A.; Foundling, S.; Tang, J. Crystal structures
of complexes of a peptidic inhibitor with wild-type and two mutant HIV-1 proteases.
1996, 35, 10627-33.
(146) Newlander, K. A.; Callahan, J. F.; Moore, M. L.; Tomaszek, T. A.; Huffman, W. F.
A novel constrained reduced-amide inhibitor of HIV-1 protease derived from the
sequential incorporation of gamma-turn mimetics into a model substrate. 1993, 36, 2321-
31.
(147) Priestle, J. P.; Fassler, A.; Rosel, J.; Tintelnot-Blomley, M.; Strop, P.; Grutter, M.
G. Comparative analysis of the X-ray structures of HIV-1 and HIV-2 proteases in
complex with CGP 53820, a novel pseudosymmetric inhibitor. 1995, 3, 381-9.
(148) Thompson, S. K.; Murthy, K. H.; Zhao, B.; Winborne, E.; Green, D. W.; Fisher, S.
M.; DesJarlais, R. L.; Tomaszek, T. A.; Meek, T. D.; Gleason, J. G.; et al. Rational
design, synthesis, and crystallographic analysis of a hydroxyethylene-based HIV-1
160
Page 176
protease inhibitor containing a heterocyclic P1'--P2' amide bond isostere. 1994, 37,
3100-7.
(149) Kim, E. E.; Baker, C. T.; Dwyer, M. D.; Murcko, M. A.; Rao, B. G.; Tung, R. D.;
Navia, M. A. Crystal-Structure of Hiv-1 Protease in Complex With Vx-478, a Potent and
Orally Bioavailable Inhibitor of the Enzyme. J. Am. Chem. Soc. 1995, 117, 1181-1182.
(150) Baldwin, E. T.; Bhat, T. N.; Gulnik, S.; Liu, B.; Topol, I. A.; Kiso, Y.; Mimoto, T.;
Mitsuya, H.; Erickson, J. W. Structure of HIV-1 protease with KNI-272, a tight-binding
transition-state analog containing allophenylnorstatine. 1995, 3, 581-90.
(151) Chen, Z.; Li, Y.; Chen, E.; Hall, D. L.; Darke, P. L.; Culberson, C.; Shafer, J. A.;
Kuo, L. C. Crystal structure at 1.9-A resolution of human immunodeficiency virus (HIV)
II protease complexed with L-735,524, an orally bioavailable inhibitor of the HIV
proteases. 1994, 269, 26344-8.
(152) Jhoti, H.; Singh, O. M.; Weir, M. P.; Cooke, R.; Murray-Rust, P.; Wonacott, A. X-
ray crystallographic studies of a series of penicillin-derived asymmetric inhibitors of
HIV-1 protease. 1994, 33, 8417-27.
(153) Lam, P. Y.; Jadhav, P. K.; Eyermann, C. J.; Hodge, C. N.; Ru, Y.; Bacheler, L. T.;
Meek, J. L.; Otto, M. J.; Rayner, M. M.; Wong, Y. N.; et al. Rational design of potent,
bioavailable, nonpeptide cyclic ureas as HIV protease inhibitors. 1994, 263, 380-4.
(154) Bone, R.; Vacca, J. P.; Anderson, P. S.; Holloway, M. K. X-Ray Crystal-Structure
of the Hiv Protease Complex With L- 700,417, an Inhibitor With Pseudo C2 Symmetry.
J. Am. Chem. Soc. 1991, 113, 9382-9384.
(155) Quiocho, F. A.; Vyas, N. K. Novel stereospecificity of the L-arabinose-binding
protein. 1984, 310, 381-6.
161
Page 177
(156) Quiocho, F. A.; Wilson, D. K.; Vyas, N. K. Substrate specificity and affinity of a
protein modulated by bound water molecules. 1989, 340, 404-7.
(157) Vermersch, P. S.; Tesmer, J. J.; Lemon, D. D.; Quiocho, F. A. A Pro to Gly
mutation in the hinge of the arabinose-binding protein enhances binding and alters
specificity. Sugar-binding and crystallographic studies. 1990, 265, 16592-603.
(158) Vermersch, P. S.; Lemon, D. D.; Tesmer, J. J.; Quiocho, F. A. Sugar-binding and
crystallographic studies of an arabinose-binding protein mutant (Met108Leu) that
exhibits enhanced affinity and altered specificity. 1991, 30, 6861-6.
(159) Bode, W.; Turk, D.; Sturzebecher, J. Geometry of binding of the benzamidine- and
arginine-based inhibitors N alpha-(2-naphthyl-sulphonyl-glycyl)-DL-p-
amidinophenylalanyl-pipe ridine (NAPAP) and (2R,4R)-4-methyl-1-[N alpha-(3-methyl-
1,2,3,4-tetrahydro-8- quinolinesulphonyl)-L-arginyl]-2-piperidine carboxylic acid
(MQPA) to human alpha-thrombin. X-ray crystallographic determination of the NAPAP-
trypsin complex and modeling of NAPAP-thrombin and MQPA-thrombin. 1990, 193,
175-82.
(160) Kurinov, I. V.; Harrison, R. W. Prediction of new serine proteinase inhibitors.
1994, 1, 735-43.
(161) Marquart, M.; Walter, J.; Deisenhofer, J.; Bode, W.; Huber, R. The Geometry of
the Reactive Site and of the Peptide Groups in Trypsin, Trypsinogen and Its Complexes
With Inhibitors. Acta Crystallogr. Sect. B-Struct. Commun. 1983, 39, 480-490.
(162) Mattos, C.; Rasmussen, B.; Ding, X.; Petsko, G. A.; Ringe, D. Analogous inhibitors
of elastase do not always bind analogously. 1994, 1, 55-8.
162
Page 178
(163) Yao, N.; Trakhanov, S.; Quiocho, F. A. Refined 1.89-A structure of the histidine-
binding protein complexed with histidine and its relationship with many other active
transport/chemosensory proteins. 1994, 33, 4769-79.
(164) Cowan, S. W.; Newcomer, M. E.; Jones, T. A. Crystallographic refinement of
human serum retinol binding protein at 2A resolution. 1990, 8, 44-61.
(165) Vyas, N. K.; Vyas, M. N.; Quiocho, F. A. Sugar and signal-transducer binding sites
of the Escherichia coli galactose chemoreceptor protein. 1988, 242, 1290-5.
(166) Sacchettini, J. C.; Gordon, J. I.; Banaszak, L. J. Crystal structure of rat intestinal
fatty-acid-binding protein. Refinement and analysis of the Escherichia coli-derived
protein with bound palmitate. 1989, 208, 327-39.
(167) Wang, J.; Kollman, P. A.; Kuntz, I. D. Flexible ligand docking: a multistep strategy
approach. 1999, 36, 1-19.
(168) Tirado-Rives, J. CHOP Version 1.0; Yale University: New Haven, CT, 2001.
(169) Jorgensen, W. L., Unpublished Data
(170) Lim, D. Autozmat Version 1.85; Yale University: New Haven, CT, 2000.
(171) Jorgensen, W. L. BOSS Version 4.2; Yale University: New Haven, CT, 2001.
163