PNNL-15412 Computational Analysis of Coriant and PNNL Radioxenon Data Viewers J. I. McIntyre A. Carman October 2005 Prepared for the U.S. Department of Energy under Contract DE-AC05-76RL01830
Transcript
PNNL-15412
Computational Analysis of Coriant and PNNL Radioxenon Data Viewers J. I. McIntyre A. Carman October 2005 Prepared for the U.S. Department of Energy under Contract DE-AC05-76RL01830
DISCLAIMER This report was prepared as an account of work sponsored by an agency of the United States Government. Neither the United States Government nor any agency thereof, nor Battelle Memorial Institute, nor any of their employees, makes any warranty, express or implied, or assumes any legal liability or responsibility for the accuracy, completeness, or usefulness of any information, apparatus, product, or process disclosed, or represents that its use would not infringe privately owned rights. Reference herein to any specific commercial product, process, or service by trade name, trademark, manufacturer, or otherwise does not necessarily constitute or imply its endorsement, recommendation, or favoring by the United States Government or any agency thereof, or Battelle Memorial Institute. The views and opinions of authors expressed herein do not necessarily state or reflect those of the United States Government or any agency thereof. PACIFIC NORTHWEST NATIONAL LABORATORY operated by BATTELLE for the UNITED STATES DEPARTMENT OF ENERGY under Contract DE-AC05-76RL01830 Printed in the United States of America Available to DOE and DOE contractors from the Office of Scientific and Technical Information,
email: [email protected] Available to the public from the National Technical Information Service, U.S. Department of Commerce, 5285 Port Royal Rd., Springfield, VA 22161
Computational Analysis of Coriant and PNNL Radioxenon Data Viewers J. I. McIntyre A. Carman October 2005 Prepared for the U.S. Department of Energy under Contract DE-AC05-76RL01830
PNNL-15412
Computational Analysis of Coriant and PNNL Radioxenon Data Viewers
By Justin I. McIntyre and April Carman
Executive Summary The analysis by Coriant of the beta-gamma coincidence data coming from the ARSA systems show a systematic basis towards lower concentrations for all isotopes and a systematic increase in the minimum detectable concentrations. These variations can be directly traced to the method of analysis that is used by the Coriant software compared to the methods that have been developed by the International Noble Gas Experiment collaboration. This report details the differences and suggests solutions where appropriate. The report writers recommend that the algorithm changes be made to the Coriant software to bring up to the international standards.
1 of 11
PNNL-15412
Introduction The analysis of the beta-gamma coincidence to produce the four radioxenon isotopes concentrations and MDC values for these isotopes has been developed by three active groups, the Swedish SAUNA development team, the US ARSA development team and the US software company Verdian systems. Much of the early work was done independently and it became obvious during Phase II testing of the various radioxenon systems that a coherent approach was necessary to obviate discrepancies between the report concentration results and come to a consensus on the calculation of MDC values. The ARSA and SUANA development teams had the benefit of prolong concentration measurements during the Freiburg testing with independent onsite concentration measurements provided by the Insitut für Atmosphräische Radiaktivität (IAR). IAR hosted the Phase II testing and is internationally recognized in noble gas measurements. For the ARSA system the initial concentration analysis yielded results that were 30% lower than those measured by IAR using the archival samples. After a review of the data analysis routines used by both groups it was found that ~20% of the discrepancy was due to the temperature difference in reporting standard-temperature-and-pressure (STP). The field of Chemistry reports STP using a temperature of 0° C while the field of Physics uses 20° C. The remaining ~ 10% has been attributed to a number of detector efficiency, readout electronics dead time and gas volume, which a careful QA/QC program should be able to adequately address. For the comparison presented in this report we looked at data that was generated by the ARSA system located in Guang Zhou China. From the period of April 2002 to June of 2002. A longer time frame with larger concentration variations would have been more indicative of the differences, but the data used had sufficient variation over the 3 month period. The General Equation. The two-dimensional beta-gamma spectrum for the sample, the previous eight-hour gas background and the detector background spectrum are used to determine the concentrations of all four radioxenons. Figure 1 shows the 2-dimensional spectrum in question with each of the six regions-of-interest highlighted. The spectrum displayed shows a high concentration 133Xe spike with very low levels of radon present. The 30 and 80-keV x-ray and gamma-ray are clearly visible with the attendant beta spectrum in the lower half of the histogram. The equation used to determine the concentrations takes into account the half-life decay from the beginning of the sampling period, gamma and beta detection efficiencies, possible interferences from 222Rn daughters and other xenon isotopes, the appropriate gamma and beta branching ratios, and the xenon gas collection efficiency. The background spectrum provides information on the ubiquitous background as well as the residual xenon and radon gases that adhere to the walls of the plastic scintillator. The background spectrum is subtracted from the sample spectrum for each β-γ bin, accounting for the difference in spectrum collection times (8-hours versus 24-hours).
2 of 11
PNNL-15412
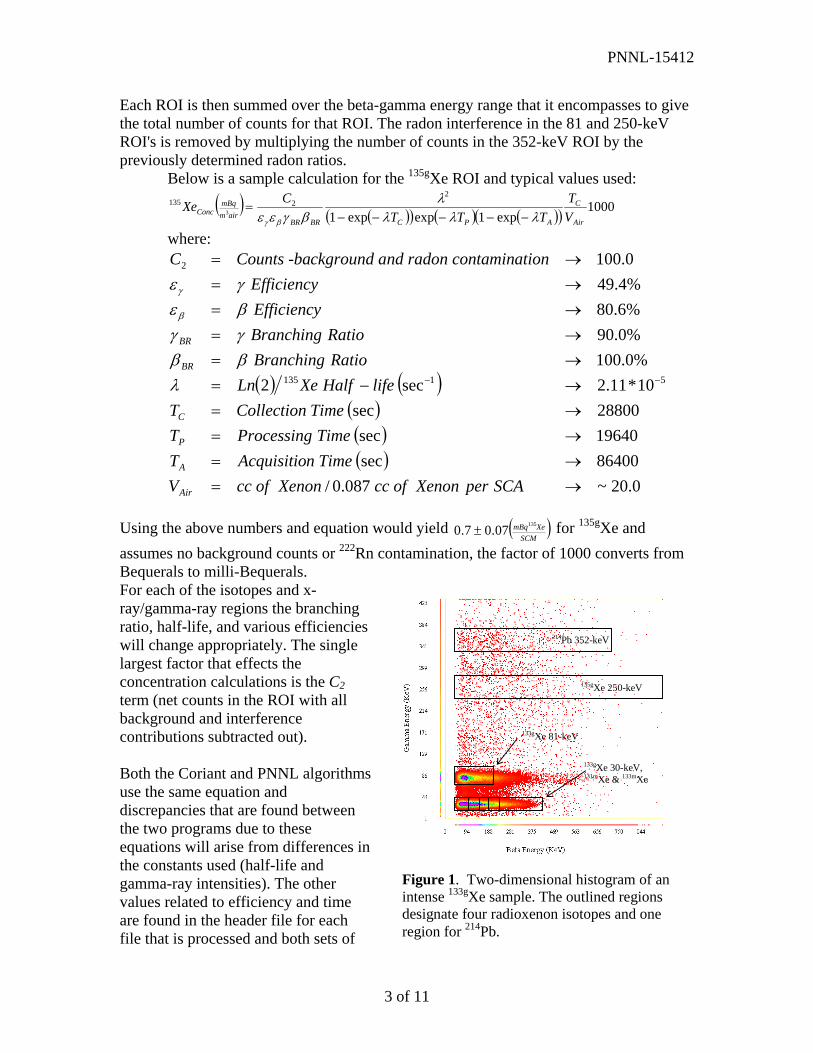
Each ROI is then summed over the beta-gamma energy range that it encompasses to give the total number of counts for that ROI. The radon interference in the 81 and 250-keV ROI's is removed by multiplying the number of counts in the 352-keV ROI by the previously determined radon ratios.
Below is a sample calculation for the 135gXe ROI and typical values used:
Using the above numbers and equation would yield ( )
SCMXemBq13507.07.0 ± for 135gXe and
assumes no background counts or 222Rn contamination, the factor of 1000 converts from Bequerals to milli-Bequerals. For each of the isotopes and x-ray/gamma-ray regions the branching ratio, half-life, and various efficiencies will change appropriately. The single largest factor that effects the concentration calculations is the C2 term (net counts in the ROI with all background and interference contributions subtracted out).
Figure 1. Two-dimensional histogram of an intense 133gXe sample. The outlined regions designate four radioxenon isotopes and one region for 214Pb.
133gXe 81-keV
133gXe 30-keV, 131mXe & 133mXe
135gXe 250-keV
214Pb 352-keV
Both the Coriant and PNNL algorithms use the same equation and discrepancies that are found between the two programs due to these equations will arise from differences in the constants used (half-life and gamma-ray intensities). The other values related to efficiency and time are found in the header file for each file that is processed and both sets of
3 of 11
PNNL-15412
software use these values. The half-life and gamma-ray intensities are unlikely to cause a large effect as the published precision to date is 5 significant figures. Assuming that more accurate numbers are determined at some later date it will affect the concentration and MDC values by much less than 1%. Calculation of Counts in the ROI’s Prior to the using the general equation for each of the isotopes each of the counts in any given ROI must be accurately tallied. There are several steps that are need to accurately account for background, memory effect and interference terms. The method which is used can give significantly different results as demonstrated below and it is this process where most of the discrepancy between the two codes lies. The counts in each of the six ROI are tallied for the three file types used (SAMPLEPHD, GASBKGPHD and DETBKGPHD). The PNNL software does this by summing the count in a given ROI with the edges of the ROI being defined by the values in the header file. Because the energy to channel number will not always be the same due to gain drifts the program rounds the energy bins up to the nearest whole channel number. For instance if the RO Is defined by gamma energy 22.3 to 44.5 and beta energy of 0 to 396.5 the program will convert these values to channel numbers via the energy calibration for the detector, so 22.3 becomes channel 6, 44.5 becomes channel 18, for a gamma energy calibration of 1.8chan/keV with an offset of -12.0 keV. This could be considered summing up the counts in ROI channel space. The Coriant software uses the same ROI and energy calibration information but it instead interpolates the counts across the energy bin (i.e. if a ROI spans a channel than the software will add up the partial counts in the ROI in energy space). This has the effect of given partial counts in the sum, where as the PNNL code will always give an integer number of counts. The graphs below show the summed counts for each of the ROI with Coriant vs. PNNL. The lines drawn are best fits and are indication of a systematic offset between the two codes. The following six graphs (one for each ROI) show the correlation between the two programs. In all cases the correlation between the raw counts as determined by each program are in very good agreement. Ideally both programs would calculate the same values, but there are differences due to the summing technique used. The most dramatic effect is seen in ROI #5 and #6 where the regions are small and they span a only a few beta and gamma channels. This leads to an increase in the discrepancy between the two summing methods (i.e. +/- a channels worth of counts will have a greater effect when the total channels is only 10 to begin with).
Graph 1. Comparison plot of ROI #1 (214Pb 352-keV region). The slope less than 1.0 indicates that the Coriant software obtains more count than the PNNL software. This region is the only region that the Coriant data set has more counts than the PNNL data set. From the scatter of the data points about the line it is apparent that the two programs consistently calculate the total number of counts with respect to one another.
Graph 3. Comparison plot of ROI #3 (133Xe 80-keV region). Offset for this data set seems abnormally large though the correlation is very good.
y = 1.008x + 8.447R2 = 1.000
0
5000
10000
15000
20000
25000
30000
35000
40000
0 5000 10000 15000 20000 25000 30000 35000 40000
Coriant
PNN
L
Graph 4. Comparison plot of ROI #4 (133Xe 30-keV region). Much like the 135Xe data set, very good correlation, slope and offset values.
6 of 11
PNNL-15412
y = 1.087x - 0.332R2 = 1.000
0
2000
4000
6000
8000
10000
12000
14000
0 2000 4000 6000 8000 10000 12000 14000
Coriant
PNN
L
Graph 5. Comparison plot of ROI #5 (133mXe 30-keV region). The slope for this dataset is abnormally large (8.7% decrease in the Coriant counts, though the offset is the smallest of all the regions.
y = 1.034x + 6.001R2 = 1.000
0
1000
2000
3000
4000
5000
6000
7000
0 1000 2000 3000 4000 5000 6000 7000
Coriant
PNN
L
Graph 6. Comparison plot of ROI #6 (131mXe 30-keV region). For this data set the slope is large (3.4% fewer counts) which indicates that the metastable isotope counts will be systematically underrepresented.
7 of 11
PNNL-15412
Neither technique is particularly advantageous or incorrect. What is problematic is how the initial calibration values are determined. The ROI limits, the efficiency values, and interference ratios inserted in the header files of the commercial ARSA unit were determined using the PNNL code. This makes them an inappropriate choice for use with the Coriant data. The solution to this problem is use the same analysis program to determine these values as the one that is used to subsequently analysis the production data. By way of example the calculation of the radon interference terms for each of the regions of interest is described below. After the PMT’s on the NaI and all four of the Beta cells have been gain matched and appropriate energy ranges and ROI’s determined a high concentration radon spike is injected into the beta cell that is being calibrated. A twenty-four hour run is then taken and the resulting 2-d Histogram is saved as a radon interference file. The interference ratios are then calculated by summing up the counts in all ROI’s and dividing these counts by the counts of ROI#1 (the 352-keV pure radon region). The errors associated with these ratios are appropriately calculated and the ratios and errors are entered into the Ratio block of the configuration file for that cell. Solution to Difference Counts in the ROI’s For the current analysis no attempt is made to correct the discrepancies between how the two codes calculate the total counts in each region, but the solution is to adopt one or the other method and use it consistently throughout the entire analysis process, from initial setup and calibration of the detector to the analysis of the production data and quality assurance/quality control program. Computational Differences The differences between the two codes become very large for the next level of comparison. The net counts are defined as the counts remaining after the GASBKG, DETBKG, and radon and xenon interference terms have been accounted for and appropriately subtracted. From the graphs displayed below it is clear that this process is not nearly as correlated between the two programs and accounts for a systematic biasing of the Coriant calculations by ~ 20-30% below those values obtained from the PNNL code. This translates into a ~20-30% decrease in the calculated radioxenon concentrations from the Coriant program. Recall that the concentrations reported from the PNNL program where ~10% low for the 133Xe isotope compared to those measured by an internationally certified laboratory IAR. The differences observed in the 135Xe (ROI #2) and 133Xe 80-keV (ROI #3) are the least complicated because they only deal with radon interference terms. Below are the two graphs of the net counts from each of the programs plotted against each other.
Graph 7. Comparison plot of ROI #2 net counts (135Xe 250-keV region). Because the correlation is so bad no attempt is made to draw a best fit line with slope and intercept. The scales have been kept the same for both axis in this case. The International Data Centre Solution The International Data Centre (IDC) at the CTBTO has been disappointed in several functional and design elements of the Coriant software and they feel that an IDC produced version of the software will alleviate much of the problems while incorporating the best practices. From a purely practical point of view the IDC will need to be able to distribute all versions of analysis software to the member states and so the IDC must have sovereign control over both the content and the license of any such software packages. The current Verdian contract does not allow such arrangement and it is not possible for the IDC personnel to make any changes in the software. For these reasons the IDC has decided to have third party software vendor generate a beta/gamma data analysis package in coordination with Internal Noble Gas Experiment Collaboration. During May of 2003 members of the IDC, The Swedish design team and members of the American design team met in Stockholm to go over the beta/gamma coincidence analysis routines used and come up with best practices that all felt were adequate. The important modifications are listed below with attendant reasons.
9 of 11
PNNL-15412
Analysis Topic Reason and Solution 30-keV Exclusion region
Including counts that had been previously subtracted from the metastable regions in the calculations of the 133Xe 30-keV region made the error and MDC extremely large for this region . By not including the counts it was felt that a better concentration with more accurate error bars and MDC values would be obtained.
135Xe contamination from Compton scatter
A calculation was done that should that even in the worst case scenario or 10 times more 135Xe than 133Xe the Compton scatter would increase the133Xe 80-keV concentration by at most 2%. This was felt to be too small to warrant inclusion in further calculations.
135Xe contamination in the 30-keV region
135Xe, like all the radioxenon isotopes has a ~5% branching ratio that includes a 30-keV x-ray. This contribution contains both the higher energy 135Xe beta particle (0-910 keV) and a 200-keV conversion electron. This shifts the distribution away from the two metastable regions and would only marginally effect the 200-keV and above distribution of the 133Xe 30-keV region. Total effect taking the 10 times greater 135Xe than 133Xe was calculated to be <3%.
Detector Background Runs
The two beta-gamma detectors have intrinsic backgrounds that are always present and are due to the intrinsic gamma rays of the environment and Cosmic rays. Long term analysis of the ARSA detector showed that this background was small and constant. For the SUANA system the background was considerably higher and shown to be dependent with time. The solution was to measure a long background upon initial system setup and to monitor a high energy region so that if the background changed it could be taken into consideration in subsequent analysis.
Energy Scales It was decided to set the energy scales for all Beta/gamma systems to 0-800 for the Gamma detector and 0-1000 for the Beta detectors. This will allow the QA/QC to be performed with no change in the gamma scales.
Use of LD to determine inclusion of radon in subsequent analysis
It was decided that upon calculation of the critical limit if an isotope was not present than it should be dropped in further calculations. This impacted the determination of radon in the SUANA. The system seldom sees radon and its inclusion needlessly increased the MDC and concentration error bars. Likewise a properly working ARSA should have no radon as well.
Use of LD to determine inclusion of the metastables in subsequent analysis
Like the radon determination it was decided that the critical limit for each of the metastables should be used to determine if their presence should be used in subsequent analysis. The decision was made to include them in one or both were present to cut down on calculational complexity.
10 of 11
PNNL-15412
The IDC has determined that a screen layout much like the PNNL beta/gamma analysis software was a good beginning point for the new software. It displayed all of the important information on a given analysis in a single page. Additional information is contained in other pages that the analyst can access through the use of onscreen buttons. A picture of the new layout is shown below in figure 2.
Figure 2. A conceptual screen layout of the proposed IDC software. The screen contains the 2-dimensional beta/gamma plot, the one dimensional histograms for the beta and gamma spectrums, the four radioxenon isotopes concentrations with error bars, the MDC’s and various other sample related information. References: Incorporation of an Exclude Region to Analyze 131mXe and 133mXe Concentrations in Beta Gamma Coincidence Spectrum, Justin I McIntyre, PNNL-14339, (2003).