36
Computational and physiological models Part 2 Daniel Renz Computational Psychiatry Seminar: Computational Neuropharmacology 14 March, 2014
| Date post: | 18-Dec-2015 |
| Category: |
Documents |
| Upload: | stanley-lawson |
| View: | 248 times |
| Download: | 0 times |

Computational and physiological modelsPart 2
Daniel RenzComputational Psychiatry Seminar: Computational Neuropharmacology14 March, 2014
Overview
• Dynamic Causal Modeling for fMRI• Example: visuomotor modulation of putamen• Dynamic Causal Modeling for EEG/MEG• Example: Reduction of synaptic plasticity using ketamine• Example: Dopaminergic modulation of neurotransmission

What is Dynamic Causal Modeling (DCM)?• Procedure for inferring the architecture of
coupled dynamic systems using Bayesian model comparison
• Need to specify competing models• neural state equation models neural dynamics• Observer function links neural dynamics to
measurements
• Infer model from measurements (model inversion), maximizing similarity between measurements and model predictions
𝑓
𝑔
inference

Neural dynamics - effective connectivity• Effective connectivity: causation• How to formalize? Deterministic differential equations
• : hidden states, : sensory input, : form and strength of influence
• We approximate to model neural population dynamics (differently for fMRI and EEG/MEG)
Sporns 2007, Scholarpedia

DCM for fMRI – approximation to neural population dynamics• All processes are assumed to occur instantaneously• Neural state variable represent a summary index of neural population
dynamics in the respective brain region• Approximation of using Taylor expansion around x=0, u=0•
�⃑� 𝑓= {𝐴 ,𝐵( 𝑗 ) ,𝐶 }

DCM for fMRI – neural population dynamics example
• : endogenous activity: modulation of connection j: direct inputs
𝑓 ( �⃑� , �⃑� , �⃑� 𝑓 )=(− 1 𝑎12
𝑎21 −1)(𝑥1
𝑥2)+( 0 0
𝑏21 0)𝑢2(𝑥1
𝑥2)+(𝑐0)𝑢1
x1
x2
u2
u1
a21 a12
-
-

Non-linear DCM for fMRI
• Extension of linear DCM to account for modulation of connectivity by brain regions
• Additional term corresponding to the second-order Taylor expansion in the states:

Non-linear DCM for fMRI
• : endogenous activity: modulation of connections by input j: direct inputs: modulation of connections by region i
x1
x2
u2
u1
a21
d12
a12
𝑓 ( �⃑� , �⃑� , �⃑� 𝑓 )=(− 1 𝑎12
𝑎21 −1)(𝑥1
𝑥2)+( 0 0
𝑏21 0)𝑢2(𝑥1
𝑥2)+(0 𝑑12
0 0 )𝑥1(𝑥1
𝑥2)+(𝑐0)𝑢1
-
-

DCM parameters are rate constants
• exp()x1
-
The coupling parameter thus describes the speed ofthe exponential change in x(t)
00.5x
a
2ln
Coupling parameter a is inverselyproportional to the half life of x(t):
0
0
( ) 0.5
exp( )
x x
x a
2ln
a❑⇒

DCM for fMRI – observer function
• Set of differential equations describing how neural activity causes the BOLD signal
• The forward model is important for model fitting, but of no interest for statistical inference.
• Computed separately for each region x1
x2
u2
u1
a21
a12
y1
y2
-
-
HRF

sf
tionflow induc
(rCBF)
s
v
stimulus functions
v
q q/vvEf,EEfqτ /α
dHbchanges in
100 )( /αvfvτ
volumechanges in
1
f
q
)1(
fγsxs
signalryvasodilato
u
s
CuxBuAdt
dx m
j
jj
1
)( neural state equation f
1
3.4
111),(
3
002
001
32100
k
TEErk
TEEk
vkv
qkqkV
S
Svq
f
Balloon model
BOLD signal change equation
6 hemodynamic parameters:
Friston et al. 2000, NeuroImageStephan et al. 2007, NeuroImage
},,,,,{ h },,,,,{ h
},,,,,{ h⃑𝜗𝑔
v: blood volumeq: deoxyhemoglobin content
Hemodynamic model

Bayesian Inversion
)|(
),(),|(),|(
)(),|()|(
myp
mpmypmyp
dpmypmyp
Make inferences
Define likelihood model
Specify priors
Neural state function
Observer function
Inference on models
Inference on parameters
𝑓 ( �⃑� , �⃑� , �⃑� 𝑓 )
𝑔 ( �⃑� , �⃑�𝑔)
Iterative optimization using Expectation-Maximization:1.Compute model response2.Compare with data3.Improve parameters, if possible
𝑝 (�⃑� 𝑓 ,𝑚)𝑝 (�⃑�𝑔 ,𝑚)Empirical prior
Conservative shrinkage prior

Overview
• Dynamic Causal Modeling for fMRI• Example: visuomotor modulation of putamen• Dynamic Causal Modeling for EEG/MEG• Example: Reduction of synaptic plasticity using ketamine• Example: Dopaminergic modulation of neurotransmission

Modulation of visuomotor integration by putamen• How do (failures of) learned predictions
about visual stimuli influence subsequent motor responses?
• Hypothesis: Visuomotor connections are modulated by activity in the putamen
• This activity increases with the size of the prediction error (surprise; free energy)
Den Ouden 2009

Bayesian learning model
• Speed and accuracy of motor responses increased significantly with predictability of stimulus
• Response speed is a good linear predictor of choice error, but unrealistic• Hierarchical Bayesian model estimates posterior PDF of both the probabilistic
associations and their volatility
Den Ouden 2009
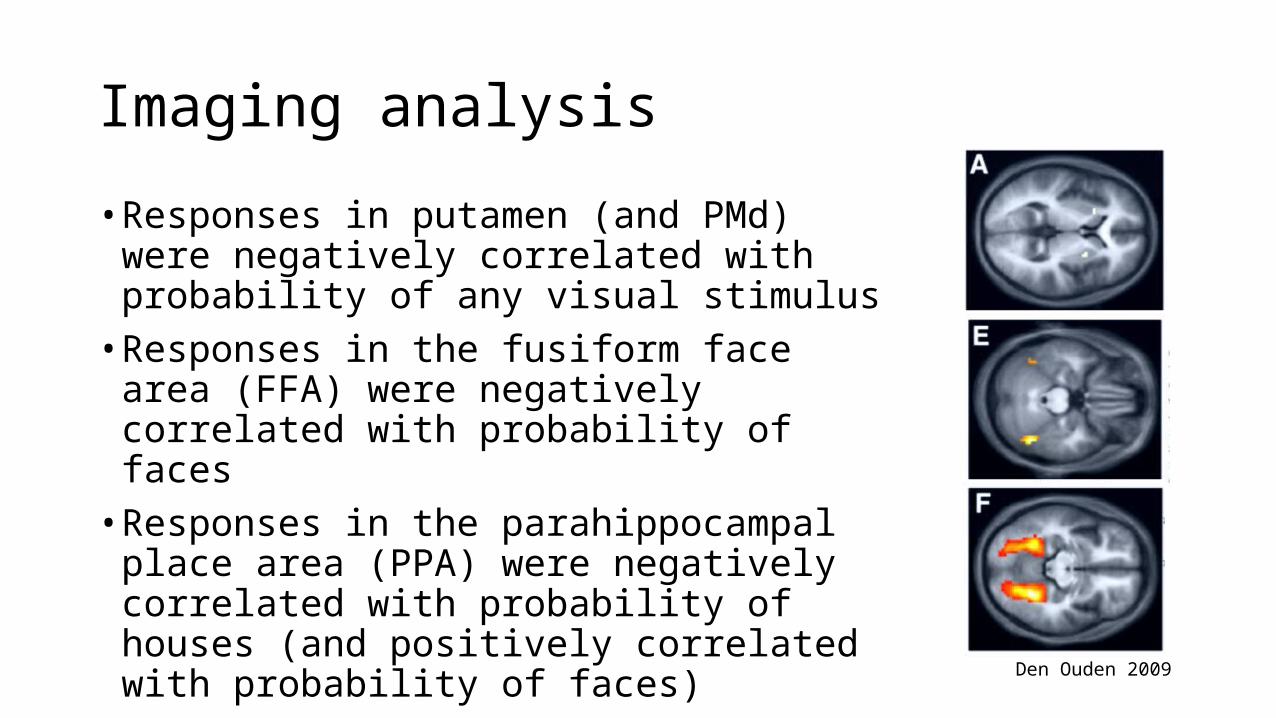
Imaging analysis
• Responses in putamen (and PMd) were negatively correlated with probability of any visual stimulus
• Responses in the fusiform face area (FFA) were negatively correlated with probability of faces
• Responses in the parahippocampal place area (PPA) were negatively correlated with probability of houses (and positively correlated with probability of faces)
Den Ouden 2009

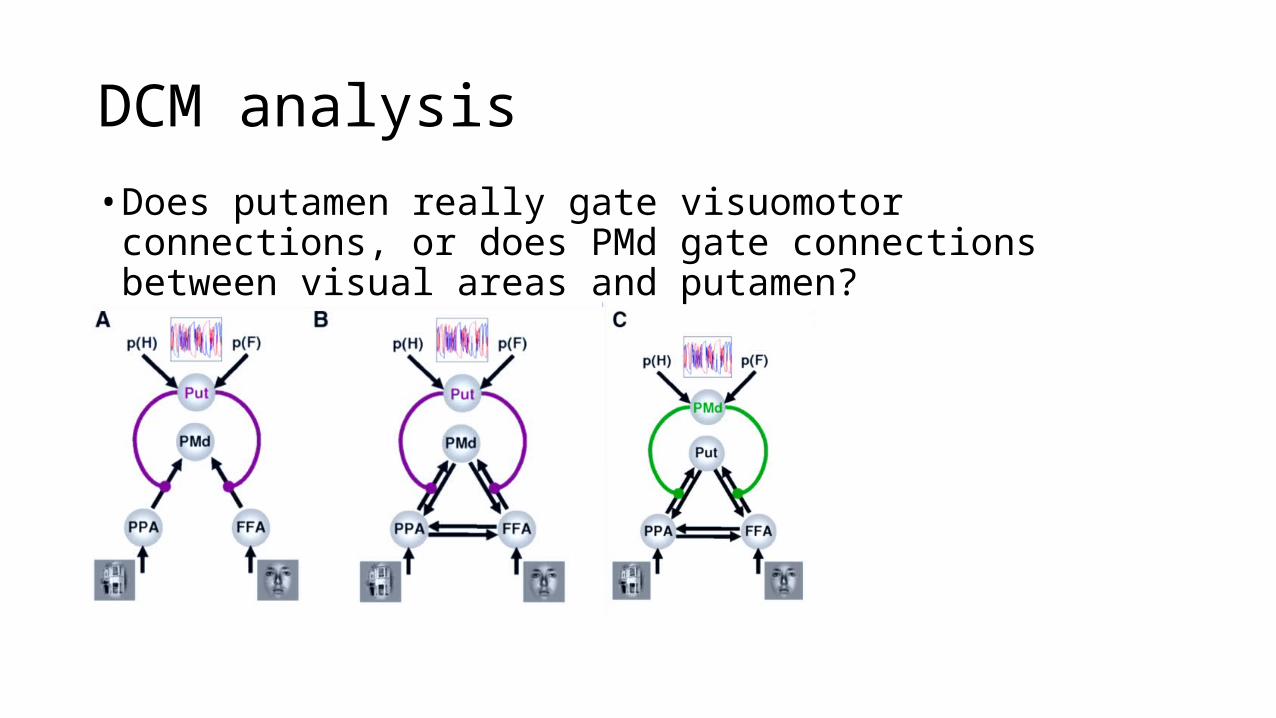
DCM analysis
DCM analysis
• Does putamen really gate visuomotor connections, or does PMd gate connections between visual areas and putamen?

DCM analysis
• Does putamen really gate visuomotor connections, or does PMd gate connections between visual areas and putamen?
Den Ouden 2009

Overview
• Dynamic Causal Modeling for fMRI• Example: visuomotor modulation of putamen• Dynamic Causal Modeling for EEG/MEG• Example: Reduction of synaptic plasticity using ketamine• Example: Dopaminergic modulation of neurotransmission
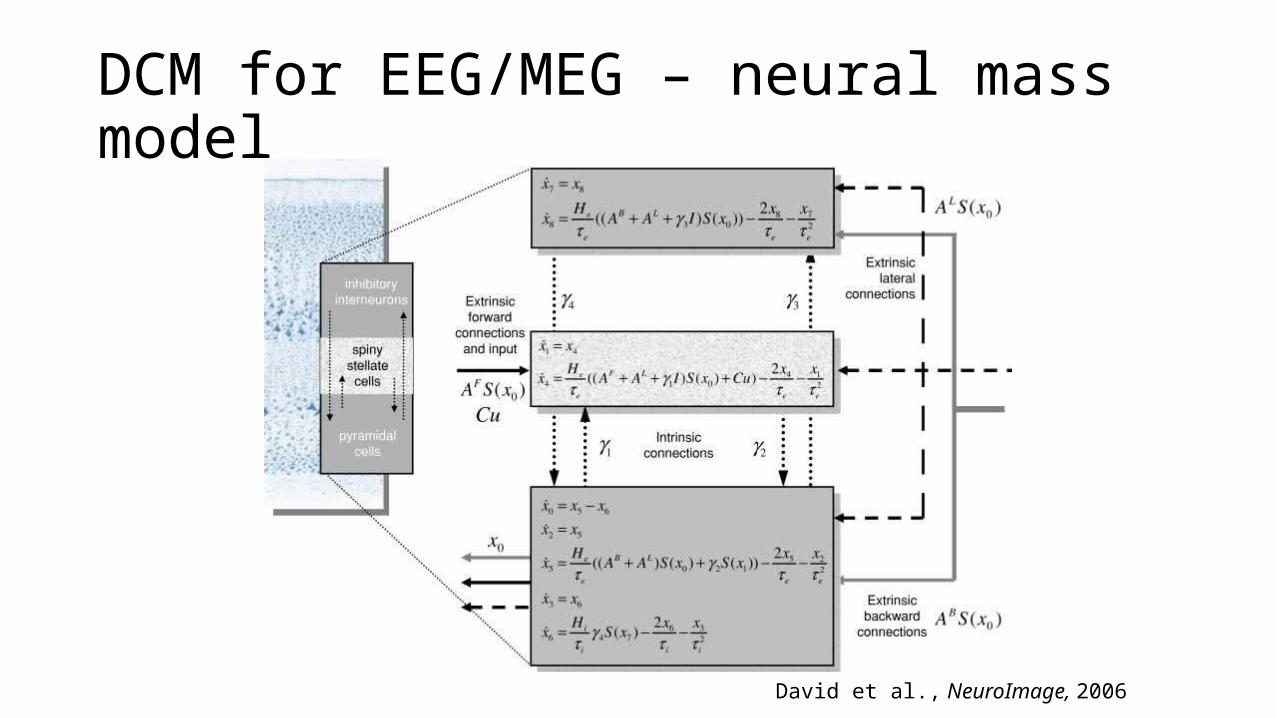
DCM for EEG/MEG – neural mass model
David et al., NeuroImage, 2006

DCM for EEG/MEG – forward model
measurementslead field matrix, coupling electrical sources to EEG channels membrane potential of pyramidal cellsobservation error
Kiebel et al., NeuroImage, 2006Daunizeau et al., NeuroImage, 2009
Overview
• Dynamic Causal Modeling for fMRI• Example: visuomotor modulation of putamen• Dynamic Causal Modeling for EEG/MEG• Example: Reduction of synaptic plasticity using ketamine• Example: Dopaminergic modulation of neurotransmission

How does Ketamine modulate synaptic plasticity underlying mismatch negativity?
Schmidt, Diaconescu, et al 2012
Roving paradigm
Mismatch negativity (MMN): ERP component elicited when the brain detects that an established pattern in sensory input has been violated.

Mismatch negativity
• Functionally, MMN is thought to serve two roles:• Current prediction error signal caused by previous neuronal spike-frequency
adaptation (memory trace formation) in auditory cortex• Model adjustment to minimize future prediction error, reflected by
glutamatergic long-range connections (between temporal and frontal regions)
• Free-energy principle: Suggests an overarching physiological and computational process of minimizing prediction error that requires both adaptation and model adjustment

Mismatch negativity and pathopsychology• MMN is a potential index for pathopsychology• Patients with schizophrenia show deficits in auditory sensory memory.
They show impaired ability to match tones, accompanied by deficient generation of MMN
• MMN can also be reduced using NMDA-antagonists, e.g. ketamine

Neurophysiology
• In animal studies it was shown that NMDAR plays a key role in MMN generation
• Both spike-frequency adaptation and glutamatergic plasticity are regulated by NMDARs
• Spike-frequency adaptation results from potassium channel-dependent hyperpolarization which relies on intracellular calcium influx modulated by NMDAR status
• NMDARs can lead to rapid changes in the strength of glutamatergic synapses, for example, via phosphorylation of AMPA receptors

ResultsInter-regional Synaptic Coupling
Adaptation and Inter-regional Synaptic Coupling
Schmidt, Diaconescu, et al 2012

ResultsInter-regional Synaptic Coupling
Adaptation and Inter-regional Synaptic Coupling
The model with plasticity in forward and backward connections as well as adaptation (expressed via post-synaptic gain modulation in A1) had the largest model evidence in both conditions
Schmidt, Diaconescu, et al 2012

Results
A significant reduction of synaptic plasticity, following ketamine administration, of the forward connection from left A1 to left STG was found.
There was a significant linear relation between drug effects on “control and cognition” ratings and drug effects on plasticity of the left A1-STG connection.
Schmidt, Diaconescu, et al 2012

Overview
• Dynamic Causal Modeling for fMRI• Example: visuomotor modulation of putamen• Dynamic Causal Modeling for EEG/MEG• Example: Reduction of synaptic plasticity using ketamine• Example: Dopaminergic modulation of neurotransmission

Delayed match-to-sample
• How does dopamine influence WM?• L-Dopa vs placebo in delayed match-to sample task• MEG recordings
Moran 2011

MEG results
• MEG measured greater activity during memory condition in delta, theta and alpha bands at predicted locations
• Prominent theta-activity in right superior frontal gyrus during memory maintenance. Spectra were boosted by L-Dopa
Moran 2011

Dopaminergic Synaptic Effects - Hypotheses• An enhancement in the conductance of GABAA and NMDA channels• A decreased conductance at AMPA receptor-associated channels (at
synapses between exogenous glutamatergic inputs and layer III pyramidal cells)
Moran 2011

Dopaminergic Synaptic Effects - Results• The only parameter with a differential contribution to theta band at
peak of interaction under L-DOPA was the NMDA non-linearity parameter
• This was further enhanced during the memory condition
NMDA nonlinear function. As alpha increases, the voltage-dependent magnesium switch becomes highly nonlinear.

Dopaminergic Synaptic Effects - Results• Can we link WM performance to synaptic parameters?• Greater L-Dopa mediated improvement in memory performance was
correlated with increased NMDA signaling and decreased AMPA signaling


