John W. Slater and John D. Saunders Glenn Research Center, Cleveland, Ohio Computational Fluid Dynamics (CFD) Simulation of Hypersonic Turbine-Based Combined-Cycle (TBCC) Inlet Mode Transition NASA/TM—2010-216362 May 2010 AIAA–2009–7349
Transcript
John W. Slater and John D. SaundersGlenn Research Center, Cleveland, Ohio
Since its founding, NASA has been dedicated to the advancement of aeronautics and space science. The NASA Scientifi c and Technical Information (STI) program plays a key part in helping NASA maintain this important role.
The NASA STI Program operates under the auspices of the Agency Chief Information Offi cer. It collects, organizes, provides for archiving, and disseminates NASA’s STI. The NASA STI program provides access to the NASA Aeronautics and Space Database and its public interface, the NASA Technical Reports Server, thus providing one of the largest collections of aeronautical and space science STI in the world. Results are published in both non-NASA channels and by NASA in the NASA STI Report Series, which includes the following report types: • TECHNICAL PUBLICATION. Reports of
completed research or a major signifi cant phase of research that present the results of NASA programs and include extensive data or theoretical analysis. Includes compilations of signifi cant scientifi c and technical data and information deemed to be of continuing reference value. NASA counterpart of peer-reviewed formal professional papers but has less stringent limitations on manuscript length and extent of graphic presentations.
• TECHNICAL MEMORANDUM. Scientifi c
and technical fi ndings that are preliminary or of specialized interest, e.g., quick release reports, working papers, and bibliographies that contain minimal annotation. Does not contain extensive analysis.
• CONTRACTOR REPORT. Scientifi c and
technical fi ndings by NASA-sponsored contractors and grantees.
• CONFERENCE PUBLICATION. Collected papers from scientifi c and technical conferences, symposia, seminars, or other meetings sponsored or cosponsored by NASA.
• SPECIAL PUBLICATION. Scientifi c,
technical, or historical information from NASA programs, projects, and missions, often concerned with subjects having substantial public interest.
• TECHNICAL TRANSLATION. English-
language translations of foreign scientifi c and technical material pertinent to NASA’s mission.
Specialized services also include creating custom thesauri, building customized databases, organizing and publishing research results.
For more information about the NASA STI program, see the following:
• Access the NASA STI program home page at http://www.sti.nasa.gov
• E-mail your question via the Internet to help@
sti.nasa.gov • Fax your question to the NASA STI Help Desk
at 443–757–5803 • Telephone the NASA STI Help Desk at 443–757–5802 • Write to:
NASA Center for AeroSpace Information (CASI) 7115 Standard Drive Hanover, MD 21076–1320
John W. Slater and John D. SaundersGlenn Research Center, Cleveland, Ohio
Prepared for the16th International Space Planes and Hypersonic Systems and Technologies Conferencecosponsored by the AIAA, DLR, and DGLRBremen, Germany, October 19–22, 2009
Acknowledgments
This work was performed as part of the Hypersonics Project of the NASA Fundamental Aerodynamics Program, Dr. James L. Pittman, Principal Investigator. Within the Hypersonics Project, this work was performed as part of the Propulsion Technology Integration task lead by Dr. Kenneth L. Suder as the Associate Principal Investigator. The second author serves as Manager for the Inlet Mode Transition experiment. The authors would also like to acknowledge the technical input of Mr. Vance Dippold III and Dr. Jinho Lee of the NASA Glenn Research Center and Mr. Bobby W. Sanders and Ms. Lois J. Weir of Techland Research, Inc.
Available from
NASA Center for Aerospace Information7115 Standard DriveHanover, MD 21076–1320
National Technical Information Service5301 Shawnee Road
Alexandria, VA 22312
Available electronically at http://gltrs.grc.nasa.gov
This work was sponsored by the Fundamental Aeronautics Program at the NASA Glenn Research Center.
Level of Review: This material has been technically reviewed by technical management.
National Aeronautics and Space Administration Glenn Research Center Cleveland, Ohio 44135
Abstract Methods of computational fluid dynamics were applied to simulate the aerodynamics within the
turbine flowpath of a turbine-based combined-cycle propulsion system during inlet mode transition at Mach 4. Inlet mode transition involved the rotation of a splitter cowl to close the turbine flowpath to allow the full operation of a parallel dual-mode ramjet/scramjet flowpath. Steady-state simulations were performed at splitter cowl positions of 0°, –2°, –4°, and –5.7°, at which the turbine flowpath was closed half way. The simulations satisfied one objective of providing a greater understanding of the flow during inlet mode transition. Comparisons of the simulation results with wind-tunnel test data addressed another objective of assessing the applicability of the simulation methods for simulating inlet mode transition. The simulations showed that inlet mode transition could occur in a stable manner and that accurate modeling of the interactions among the shock waves, boundary layers, and porous bleed regions was critical for evaluating the inlet static and total pressures, bleed flow rates, and bleed plenum pressures. The simulations compared well with some of the wind-tunnel data, but uncertainties in both the wind-tunnel data and simulations prevented a formal evaluation of the accuracy of the simulation methods.
Nomenclature R Gas constant REC Total-pressure recovery at the engine face (REC = pt2/pt0) pt0 Total pressure of the flow in the freestream ahead of the inlet (158.8 psi) pt2 Average total pressure at the engine face W2 Flow rate at the engine face WHS Reference capture flow rate of the ramjet/scramjet flowpath WLS Reference capture flow rate of the turbine flowpath αhole Angle of bleed hole axis with respect to surface Δ Normalized difference in value γ Ratio of specific heats
1.0 Introduction One concept for access to space involves a two-stage vehicle in which an air-breathing propulsion
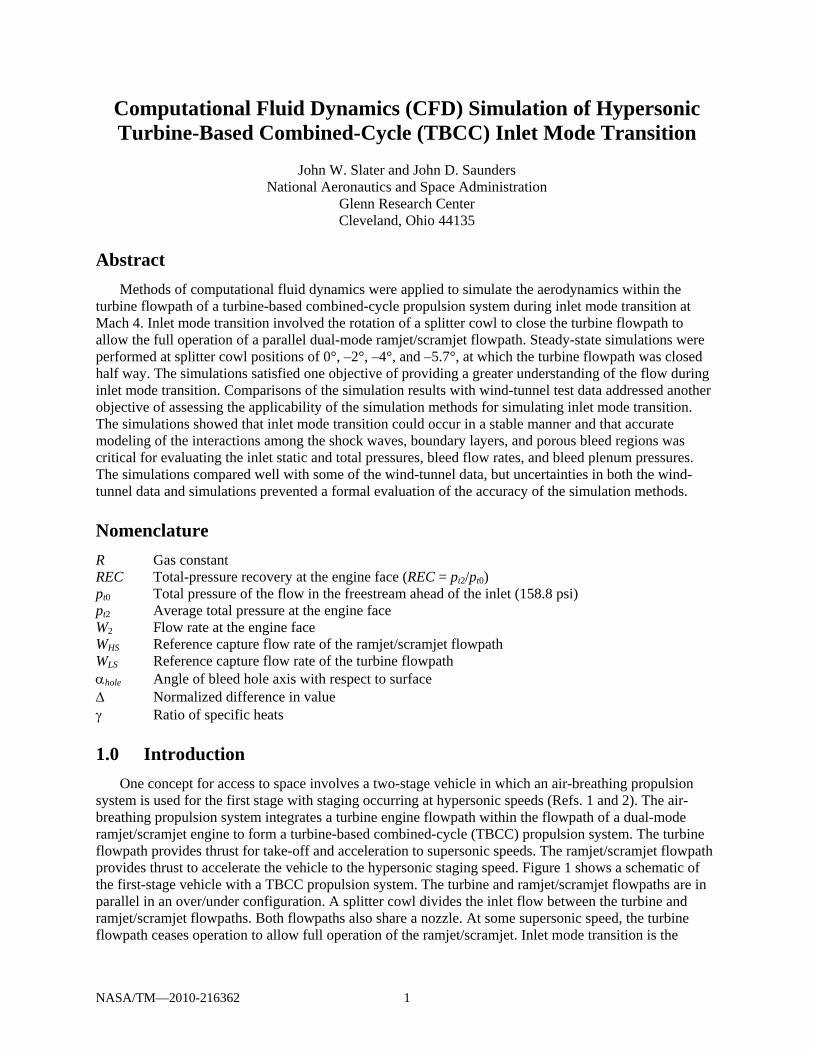
system is used for the first stage with staging occurring at hypersonic speeds (Refs. 1 and 2). The air-breathing propulsion system integrates a turbine engine flowpath within the flowpath of a dual-mode ramjet/scramjet engine to form a turbine-based combined-cycle (TBCC) propulsion system. The turbine flowpath provides thrust for take-off and acceleration to supersonic speeds. The ramjet/scramjet flowpath provides thrust to accelerate the vehicle to the hypersonic staging speed. Figure 1 shows a schematic of the first-stage vehicle with a TBCC propulsion system. The turbine and ramjet/scramjet flowpaths are in parallel in an over/under configuration. A splitter cowl divides the inlet flow between the turbine and ramjet/scramjet flowpaths. Both flowpaths also share a nozzle. At some supersonic speed, the turbine flowpath ceases operation to allow full operation of the ramjet/scramjet. Inlet mode transition is the
NASA/TM—2010-216362 1
Turbine Flowpath
Ramjet / Scramjet Flowpath
Splitter Cowl (closed)Nozzle
Turbine Engine
Figure 1.—A schematic of the first-stage with a turbine-based combined-cycle airbreathing propulsion system with the
turbine flowpath open (top) and closed (bottom).
process by which the inlet flow is diverted from the turbine flowpath to the ramjet/scramjet flowpath. The schematic of Figure 1 shows a rotating splitter cowl that can rotate to shut off flow to the turbine flowpath as part of the inlet mode transition.
One challenge for this concept is the establishment of stable and efficient aerodynamic processes for the flow through both flowpaths and during the inlet mode transition. The inlet flow is characterized by shock waves, turbulent boundary layers, shock/boundary layer interactions, and internal supersonic compression. Within the turbine flowpath, a terminal shock in the throat decelerates the flow to subsonic speeds for intake by the turbine engine. Stability requires that the inlet remain started with the terminal shock in the throat. Efficiency requires that the total-pressure recovery be maximized. A less efficient inlet would require a larger propulsion system to generate the required thrust, which would increase the weight of the propulsion system and vehicle. The vehicle should accelerate during inlet mode transition and disruptions to the thrust would degrade the system.
The aerodynamics of inlet flow for TBCC propulsion systems and inlet mode transition has been studied by a relatively small number of studies (Refs. 3 to 5). Reference 3 discussed a small-scale wind-tunnel test of a rectangular inlet that examined the stability and operation of a ramjet/scramjet flowpath as the inlet flow was diverted for a turbine flowpath. However, the focus of Reference 3 was on the ramjet/scramjet flowpath rather than the turbine flowpath. References 4 and 5 focused on the aerodynamics of the turbine flowpath. Reference 4 discussed the design of a rectangular inlet based on the schematic of Figure 1 and that inlet has become known as the inlet mode transition (IMX) inlet. The IMX inlet was studied with methods of computational fluid dynamics (CFD) and with a series of small-scale wind-tunnel tests. Some results of the CFD simulations and wind-tunnel tests were reported in Ref. 5. The CFD simulations provided some understanding of the flow features and performance of the inlet and the effects of the variation of some of the design parameters of the IMX inlet. The wind-tunnel tests were primarily intended to demonstrate the proof-of-concept of the IMX inlet and screen the parameters of the inlet design and operation space. The wind-tunnel tests did obtain data on the performance of the inlet and other flow properties during the inlet mode transition. However, a formal assessment of the uncertainties in the wind-tunnel data was not performed given the screening nature of the wind-tunnel tests.
The present paper discusses further CFD simulations of the IMX inlet. One objective was to better understand the flow features and aerodynamics within the turbine flowpath during the inlet mode transition. Another objective was to assess the applicability of the CFD methods for simulating inlet mode transition through comparison with the wind-tunnel test data. Ideally, one would like to make a statement on the accuracy of the CFD methods; however, the lack of an uncertainty assessment of the wind-tunnel data and lack of clear methods for determining uncertainty in CFD methods prevented a formal accuracy assessment of the CFD methods.
The next section discusses further details on the IMX inlet and the wind-tunnel tests. Section 3.0 discusses the CFD methods for modeling the inlet flow and geometry and establishing the flow domain, boundary conditions, initial flow solution, and computational grid. Included is a discussion on the
NASA/TM—2010-216362 2
modeling of the porous bleed boundary condition needed to simulate the bleed regions within the turbine flowpath. Section 4.0 presents the results of the CFD study and includes visualizations of the flow features and streamwise variations of the Mach number, static pressure, and total pressure during inlet mode transition. The details of the flow in the bleed regions are discussed and includes the variation of bleed rates and plenum static pressures during inlet mode transition. The performance of the inlet is examined through an evaluation of the total-pressure recovery and distortion at the engine face. Conclusions are then stated as to the applicability of CFD methods for simulating inlet mode transition.
2.0 Inlet Mode Transition (IMX) Inlet Some details on the design of the IMX inlet and the small-scale wind-tunnel tests are now provided as
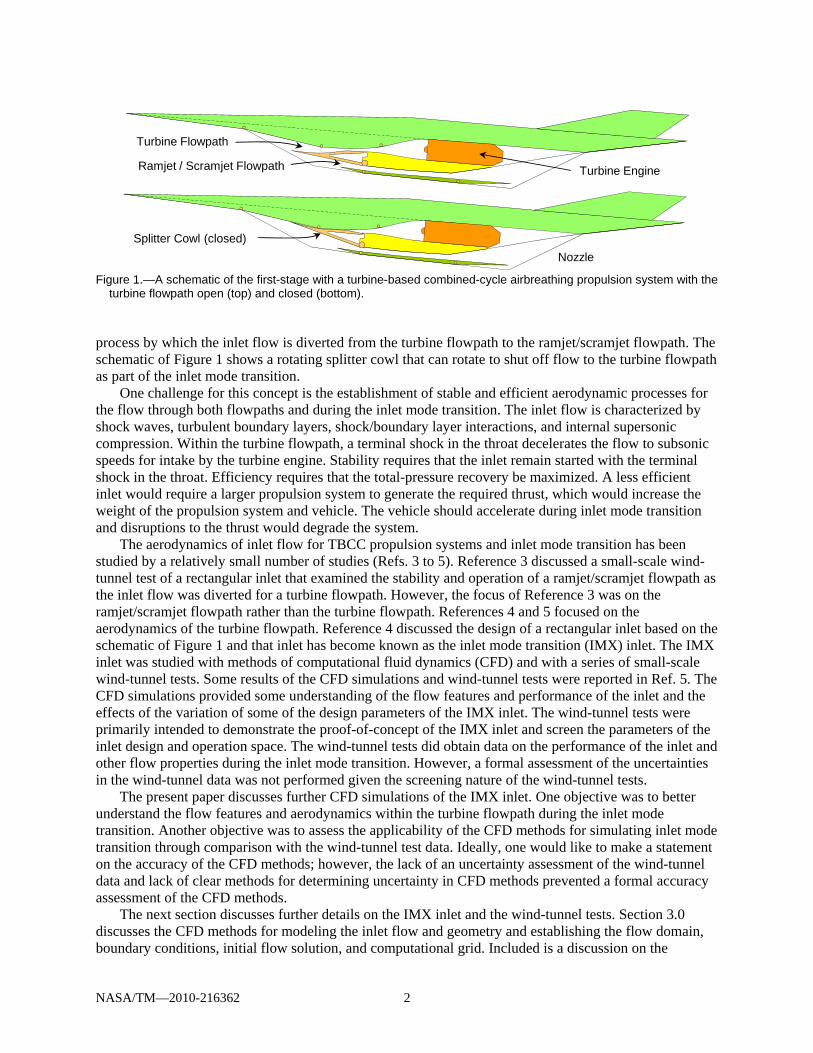
background for the CFD simulations. Figure 2 shows a cut-away image of the IMX inlet as tested in the wind-tunnel. The view is flipped from Figure 1 so that the turbine flowpath is now below the ramjet/scramjet flowpath. The IMX inlet has a rectangular cross-section for most of the turbine and ramjet/scramjet flowpaths. This simplified the mechanics of the splitter cowl rotation and other variable geometry required for the operation of a mixed-compression inlet at subsonic, transonic, and supersonic speeds. Flat sidewalls bounded the rectangular portions of inlet flowpaths. Within the turbine flowpath, the cross-section transitions from a rectangular to a circular shape just ahead of the engine face. The cross-sectional area was kept constant through the shape transition. The ramjet/scramjet flowpath remained rectangular since the flow was intended to remain supersonic through the flowpath and not of interest for study in the wind-tunnel tests.
The ramps and forward portions of the ramjet/scramjet flowpath of the IMX inlet were designed for a Mach 7 staging. This created relatively long surfaces on which boundary layers developed that were ingested by the turbine flowpath. As seen in Figure 1, the splitter cowl rotates such that its leading edge rests on the ramp surface to fully close off the turbine flowpath as part of the inlet mode transition. Thus, the turbine flowpath is integrated into the ramjet/scramjet flowpath. The top surface of the splitter cowl is part of the ramp for the ramjet/scramjet flowpath while the bottom surface is a portion of the cowl of the turbine flowpath. Compression must occur efficiently on both surfaces during inlet mode transition.
The model for the small-scale wind-tunnel tests had an engine face diameter of 1.821 in., which was also the width of the rectangular cross-sections of the flowpaths. The leading edge of the ramp was at (x,y) = (0,0) in. where x is the horizontal Cartesian coordinate and y is the vertical coordinate. The leading edge of the splitter cowl for the turbine flowpath at the 0° position was at (x,y) = (16.46, 3.78) in. The leading edge of the cowl for the ramjet/scramjet flowpath was at (x,y) = (21.23, 5.00) in.
Sidewall
Engine Face
Ramjet / Scramjet Flowpath
Flow Plug
Ramp Leading Edge
Turbine Flowpath
Splitter Cowl Leading Edge
Ramjet / Scramjet Cowl
Figure 2.—The IMX inlet model for the small-scale wind-tunnel tests.
NASA/TM—2010-216362 3
The turbine flowpath contained nine porous bleed regions: four on the ramp, two on the cowl, and three on each sidewall. The bleed regions on the ramp and cowl each had a plenum into which the bleed flow was extracted. The flow exited the plenums through plenum exits that led to the external flow. The areas of the exits were sized so that the exiting flow was choked. This prevented external disturbances from entering the plenum and affecting the inlet flow through the bleed holes. Static pressure taps in the bleed plenums recorded the plenum static pressure. The sidewall bleed regions did not have plenums and the bleed holes extracted the flow directly to the external flow.
The throat of the turbine flowpath was located in a region from approximately x = 23 to 25 in. Vortex generators were positioned within the turbine flowpath downstream of the throat at station at x = 26.5 in. The vortex generator array consisted of six vortex generators arrayed with two on the ramp, two on the cowl and one on each of the sidewalls. The vortex generators had an incidence of 16° in an alternating pattern.
The engine face was located at x = 32.9 in. A total-pressure rake consisting of nine probes recorded the total pressure at the engine face. A “cold pipe” consisting of a straight section of pipe with a flow plug at the outflow was attached to the engine face of the turbine flowpath. The flow through the plug was choked and the level of back pressure (average static pressure at the engine face) was adjusted by translating the plug along the axis of the duct. Other data collected included the static pressures along the surfaces of the turbine flowpath at the plane of symmetry and about the circumference of the engine face.
The CFD simulations were performed to match the conditions of the tests of the wind-tunnel experiment for which the Mach number of the freestream flow ahead of the inlet was at Mach 3.974, which was close to the Mach 4 at which inlet mode transition was expected to occur. The total pressure and total temperature of the freestream flow was pt0 = 158.8 psi and 547.2 °R, respectively. The model was oriented at a zero angle-of-attack with respect to the freestream flow. The CFD simulations were performed at splitter cowl positions of 0°, –2°, –4°, and –5.7° for which wind-tunnel test data was available.
3.0 CFD Methods The methods used to perform the CFD simulations of the IMX inlet are now described to provide
background for understanding the results and assess the applicability of the CFD methods for simulating inlet mode transition. The methods include those for modeling the flow, turbulence, geometry, flow domain, porous bleed regions, and other boundary conditions. The procedures for generating the grid and the initial flow solution are also described.
3.1 Flow Equations
The aerodynamics of the flow through the inlet was assumed to be described by the Reynolds-Averaged Navier-Stokes (RANS) equations. The RANS equations were discretized upon a structured, multi-block grid and solved using the Wind-US CFD solver (Ref. 6). The temperatures were assumed to be within the limits to allow the use of the ideally-perfect air model. The inviscid fluxes of the RANS equations were modeled using a second-order, upwind Roe flux-difference splitting method. The flow was assumed to be turbulent with the turbulent eddy viscosity calculated through a turbulence model. The two models used in the simulations were the one-equation Spalart-Allmaras model and the two-equation Menter shear-stress transport (SST) model. The simulation results presented in this paper were computed using the SST turbulence model. The Spalart-Allmaras turbulence model yielded similar results as the SST model; however, the SST model was used since it was more likely to improve the modeling of flows with significant boundary layer separation. The use of turbulence models for mixed-compression inlet simulations was discussed in earlier papers (Refs. 7 to 9). The equations were solved using a time-marching method with a first-order, implicit Euler method using local time-stepping. An initial solution was specified and the time-marching iterations were performed to obtain iterative convergence to a steady-state solution. The use of steady-state simulations for the inlet mode transition was based on the
NASA/TM—2010-216362 4
observation that the rotation of the splitter cowl occurred at much slower rate than the fluid velocities. It was assumed that the splitter cowl would require about 2 seconds to rotate from its design position of 0° through a rotation of 11.8° to close the turbine flowpath. The time scale of the fluid particles flowing along the length of the inlet was much smaller than the time scale of the splitter cowl rotation. Thus, it was assumed that the flow during inlet mode transition could be simulated with steady-state CFD simulations at each of the four splitter cowl positions of 0°, –2°, –4°, and –5.7°.
3.2 Porous Bleed Boundary Condition
The porous bleed regions within the turbine flowpath were critical for limiting the adverse effects of shock/boundary layer interactions by removing low-momentum flow within the boundary layer and enhancing the velocity profile to better withstand the high pressure gradients of the shock/boundary layer interactions. Within the throat of the turbine flowpath, the bleed regions helped keep the inlet started with the terminal shock in the throat by extracting flow downstream of the terminal shock. References 8 and 9 describe the porous bleed models and provide simulations that demonstrate the application of the models. The models are outlined below.
The bleed model is applied as a boundary condition imposed for surface grid points located within a bleed region. The bleed model assumes the region is continuously porous, and so, the flow through individual holes is not resolved nor are individual holes recognized. The bleed model affects the flow solution through a boundary condition on the component of the fluid velocity normal to the surface, vN, which is computed in the manner of
BB
bleedN A
Wvρ
= (1)
where AB is the surface area of the grid cell face at the boundary and ρB is the fluid static density at the boundary. The subscript “B” denotes flow properties evaluated at the boundary grid point. One form of the bleed model simply involves specifying Wbleed and assuming it remains constant through the simulation. This is the constant-bleed boundary condition model.
It should be intuitive that the bleed rate should vary according to local flow conditions across the bleed region. One approach is to compute Wbleed using the equation
BsonicBsonicbleed WQW −−= (2)
The Wsonic-B is a reference flow rate defined as
( ) ( )12/12/1
21 −γ+γ−
− ⎟⎠⎞
⎜⎝⎛ +γ
⎟⎟⎠
⎞⎜⎜⎝
⎛ γΦ=
BBBBsonic TR
ApW (3)
The calculation of Wsonic-B assumes isentropic conditions through the bleed holes with choked flow (M = 1) within the bleed holes. The static pressure pB and temperature TB are evaluated at the boundary grid point and are both easily computed from the CFD flow field. The porosity of the bleed region Φ is computed as the ratio
region
bleedAA
=Φ (4)
where Ableed is the cross-sectional area of the bleed holes and Aregion is the surface area of the bleed region.
NASA/TM—2010-216362 5
The surface sonic flow coefficient Qsonic-B is evaluated using the curve fit of Ref. 9. The curve fit is based on a scaling of wind-tunnel test data for circular bleed holes oriented at αhole = 90° to the surface. The curve fit has the form of
59799735.003069346.059361420.02
+⎟⎟⎠
⎞⎜⎜⎝
⎛+⎟⎟
⎠
⎞⎜⎜⎝
⎛−=−
B
plenum
B
plenumBsonic p
pp
pQ (5)
The pplenum is the average static pressure of the bleed plenum. A basic assumption of the model is that the volume of the bleed plenum is relatively large such that the Mach number of the flow within the plenum is very low, and so, much of the plenum is at the plenum static pressure, pplenum. The ratio (pplenum/pB) is the static plenum pressure ratio. The coefficient Qsonic-B is positive for bleed flow and negative for flow injection. As discussed in Reference 9, this allows the bleed model to simulate local injection or blowing of flow within the bleed region that might be present during shock/boundary layer interactions.
The bleed model is complete once the plenum pressure pplenum is known. One option for evaluating pplenum is to simply specify pplenum and assume that it remains constant throughout the simulation. This is known as the constant-pressure bleed boundary condition model. This implies that the inlet has a control system that maintains pplenum at the specified value.
An alternative option is to impose a constraint on pplenum involving the flow through the bleed plenum exit. The flow out of the plenum exit is modeled as a nozzle flow of the form
( ) ( )12/1
22/1
211
−γ+γ−
⎟⎠⎞
⎜⎝⎛ −γ+⎟⎟
⎠
⎞⎜⎜⎝
⎛ γ= exit
BplenumexitDexit M
TRpACW (6)
The Aexit is the cross-sectional area of the bleed plenum exit. The CD is the discharge coefficient of the flow through the exit. The Mexit is the Mach number of the flow through the exit. The bleed exit is typically operated such that the flow through the exit is choked with Mexit = 1. This ensures that the exterior flow does not propagate into the bleed plenum and inlet flow. Subsonic values of Mexit can be calculated from the ratio of the plenum pressure and the external static pressure with the assumption of isentropic flow through the exit. Equation 6 also assumes that the total temperature within the plenum is approximately equal to the surface static temperature TB. The plenum pressure is computed from the condition that the amount of flow through the exit must equal the total bleed flow through the porous bleed region. Reference 8 provides further discussion on modeling the plenum exit. Simpler bleed systems, such as those on the IMX inlet, have fixed exit areas. When the exit areas are fixed, the model is known as the fixed-exit bleed boundary condition model.
3.3 Flow Domain, Geometry Modeling, and Boundary Conditions
The flow domain is the control volume within which the flow equations are solved. The boundaries of the flow domain for the IMX inlet adhered to the shape of the inlet surfaces or were shaped as inflow or outflow boundaries. The equations required boundary conditions to be imposed on the boundaries of the flow domain. Figure 3 shows the outline and boundaries of the flow domain used for the CFD simulations. The geometric and flow symmetry of the inlet allowed the flow domain to only represent one-half of the inlet, which in this case was the left-hand side as one looked down the inlet from the leading edge of the splitter cowl to the engine face. Thus, the entire boundary on the right-hand side of the flow domain was on the plane-of-symmetry and symmetry boundary conditions were applied, which were equivalent to inviscid, slip-wall boundary conditions.
NASA/TM—2010-216362 6
NozzleThroat
Inflow
Ramp
Outflow, Ramjet / Scramjet Flowpath
Turbine Engine Face
Outflow, Turbine Flowpath
Ramp Leading Edge
Outflow, Exterior
Ramjet / Scramjet Cowl
Splitter Cowl Leading Edge
Turbine Flowpath Throat
Symmetry plane is on the right side of the geometry
Figure 3.—Flow domain for the CFD simulations.
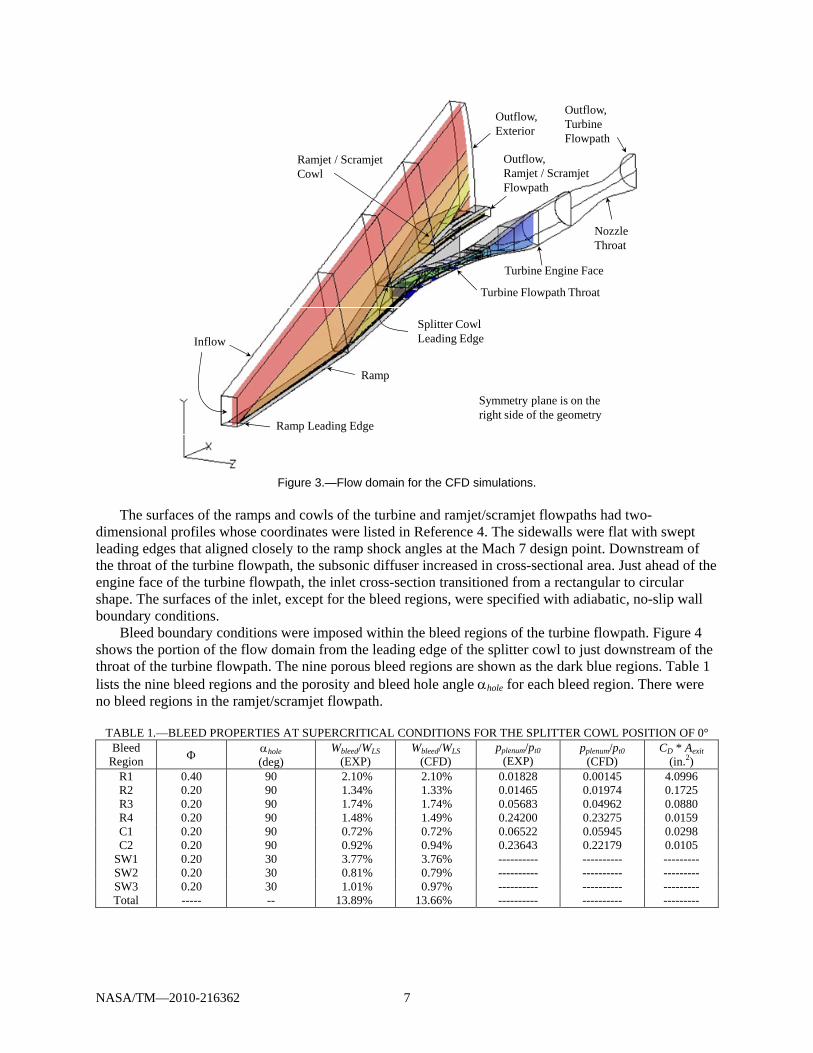
The surfaces of the ramps and cowls of the turbine and ramjet/scramjet flowpaths had two-
dimensional profiles whose coordinates were listed in Reference 4. The sidewalls were flat with swept leading edges that aligned closely to the ramp shock angles at the Mach 7 design point. Downstream of the throat of the turbine flowpath, the subsonic diffuser increased in cross-sectional area. Just ahead of the engine face of the turbine flowpath, the inlet cross-section transitioned from a rectangular to circular shape. The surfaces of the inlet, except for the bleed regions, were specified with adiabatic, no-slip wall boundary conditions.
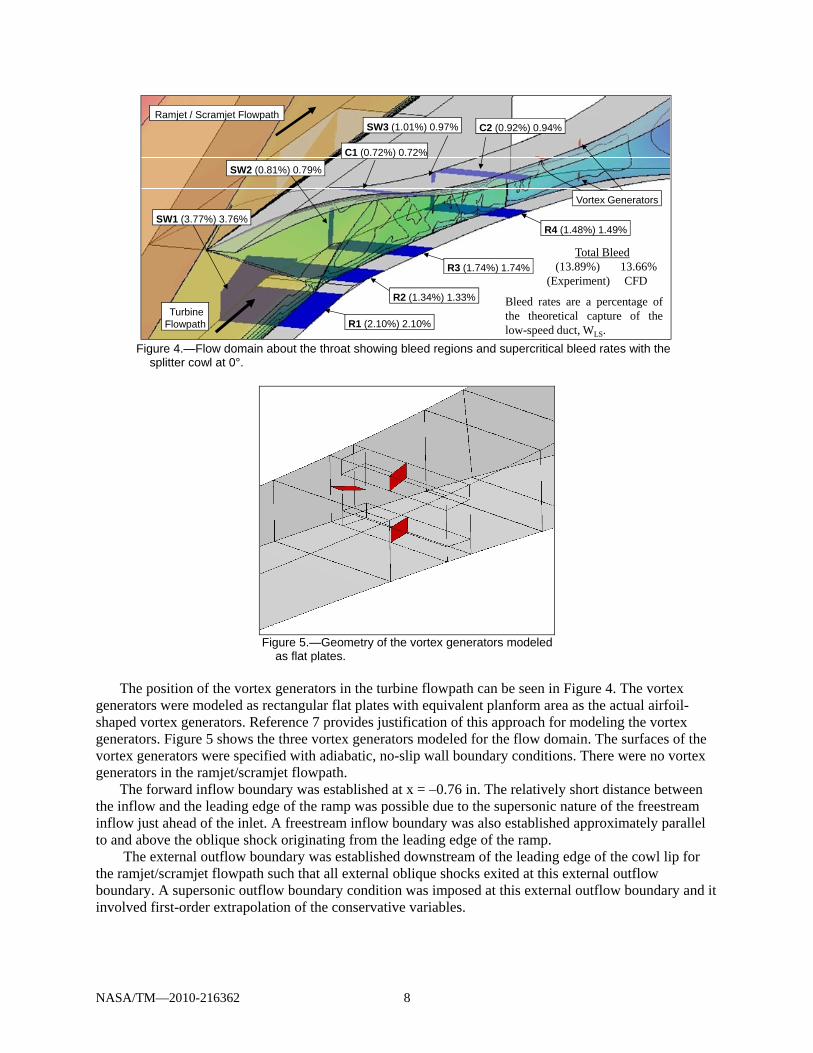
Bleed boundary conditions were imposed within the bleed regions of the turbine flowpath. Figure 4 shows the portion of the flow domain from the leading edge of the splitter cowl to just downstream of the throat of the turbine flowpath. The nine porous bleed regions are shown as the dark blue regions. Table 1 lists the nine bleed regions and the porosity and bleed hole angle αhole for each bleed region. There were no bleed regions in the ramjet/scramjet flowpath.
TABLE 1.—BLEED PROPERTIES AT SUPERCRITICAL CONDITIONS FOR THE SPLITTER COWL POSITION OF 0° Bleed
Bleed rates are a percentage ofthe theoretical capture of thelow-speed duct, WLS.
Total Bleed(13.89%) 13.66%
(Experiment) CFD
Vortex Generators
TurbineFlowpath
Ramjet / Scramjet Flowpath
Figure 4.—Flow domain about the throat showing bleed regions and supercritical bleed rates with the
splitter cowl at 0°.
Figure 5.—Geometry of the vortex generators modeled
as flat plates.
The position of the vortex generators in the turbine flowpath can be seen in Figure 4. The vortex generators were modeled as rectangular flat plates with equivalent planform area as the actual airfoil-shaped vortex generators. Reference 7 provides justification of this approach for modeling the vortex generators. Figure 5 shows the three vortex generators modeled for the flow domain. The surfaces of the vortex generators were specified with adiabatic, no-slip wall boundary conditions. There were no vortex generators in the ramjet/scramjet flowpath.
The forward inflow boundary was established at x = –0.76 in. The relatively short distance between the inflow and the leading edge of the ramp was possible due to the supersonic nature of the freestream inflow just ahead of the inlet. A freestream inflow boundary was also established approximately parallel to and above the oblique shock originating from the leading edge of the ramp.
The external outflow boundary was established downstream of the leading edge of the cowl lip for the ramjet/scramjet flowpath such that all external oblique shocks exited at this external outflow boundary. A supersonic outflow boundary condition was imposed at this external outflow boundary and it involved first-order extrapolation of the conservative variables.
NASA/TM—2010-216362 8
The flow through the ramjet/scramjet flowpath remained supersonic and was not of interest in the simulations. The outflow boundary of the ramjet/scramjet flowpath was established at x = 27.50 in. and was specified with a supersonic outflow boundary condition with first-order extrapolation.
On the vertical boundary above the sidewall, the flow was assumed to be parallel to the freestream flow. While some cross-spillage over the leading edge of the sidewall was possible, it was assumed that the amount of spillage was small enough to be ignored. Thus, this boundary was simulated with an inviscid wall boundary condition, which precluded any sidewall spillage.
The outflow boundary of the turbine flowpath was placed approximately six engine face diameters downstream of the engine face. This was assumed sufficient to ensure that the outflow boundary condition did not bias the flow conditions at the engine face, which were of interest in evaluating the performance of the inlet. The flow domain downstream of the engine face consisted of a constant-area duct of three engine face diameters in length and a converging-diverging nozzle of three engine face diameters in length. Both can be seen in Figure 3. The converging-diverging nozzle simulated the effect of the flow plug used in the wind-tunnel test when the nozzle throat was choked. The engine-face static pressure, which is also known as the back pressure of the turbine flowpath was increased by reducing the area of the nozzle throat. With choked flow in the nozzle throat, the flow was supersonic downstream of the nozzle throat in the diverging portion of the nozzle. A supersonic extrapolation boundary condition was used at the outflow boundary.
3.4 Grid Generation and Grid Resolution
A multi-block, structured grid consisting of H-grids was generated for the flow domain. The grid was clustered near the no-slip boundaries to resolve the turbulent boundary layer such that the first grid point off the wall was at a non-dimensional distance of about y+ ≈ 1. Away from the walls, the grid points were distributed so as to keep the maximum grid stretching (ratio of distances between grid points) below 15 percent and the maximum grid resolution below a grid resolution limit. In the throat, the streamwise and cross-stream grid resolution was kept approximately uniform and below the specified grid resolution limit.
To determine the appropriate grid resolution limit, a grid resolution study was performed on a planar (2D) grid of the forward portion of the IMX inlet. Simulations were performed on four grids for which the grid resolution limit was specified at 0.0364, 0.0228, 0.0152, and 0.0079 in. The effect of the grid resolution was determined by examining the bleed rate for the R1 bleed region and the total-pressure recovery (ratio of the average total pressure to the freestream total pressure) of the flow at the flow plane at the ramp shoulder, which was just downstream of the R1 bleed region. The results of the grid resolution study are listed in Table 2. It can be seen that the variation in the bleed rate was much greater than the variation in the total-pressure recovery. Thus, the grid resolution was based on resolving the bleed rate. The greater sensitivity of the bleed rates to grid resolution likely reflects the importance of resolving the interaction of the shock waves with the bleed regions in properly obtaining the bleed rates. Between grid resolutions of 0.0152 and 0.0079 in. the bleed rate changed by 0.08 percent. It was decided that a grid resolution limit of 0.0152 in. was sufficient to adequately resolve the bleed rates, as well as, the total pressure recovery. This grid resolution limit was a fraction 0.12 of the bleed hole diameter (1/8th in.). This is less than an earlier study which suggested a resolution of 0.4 of the bleed hole diameter to resolve the bleed rates (Ref. 8).
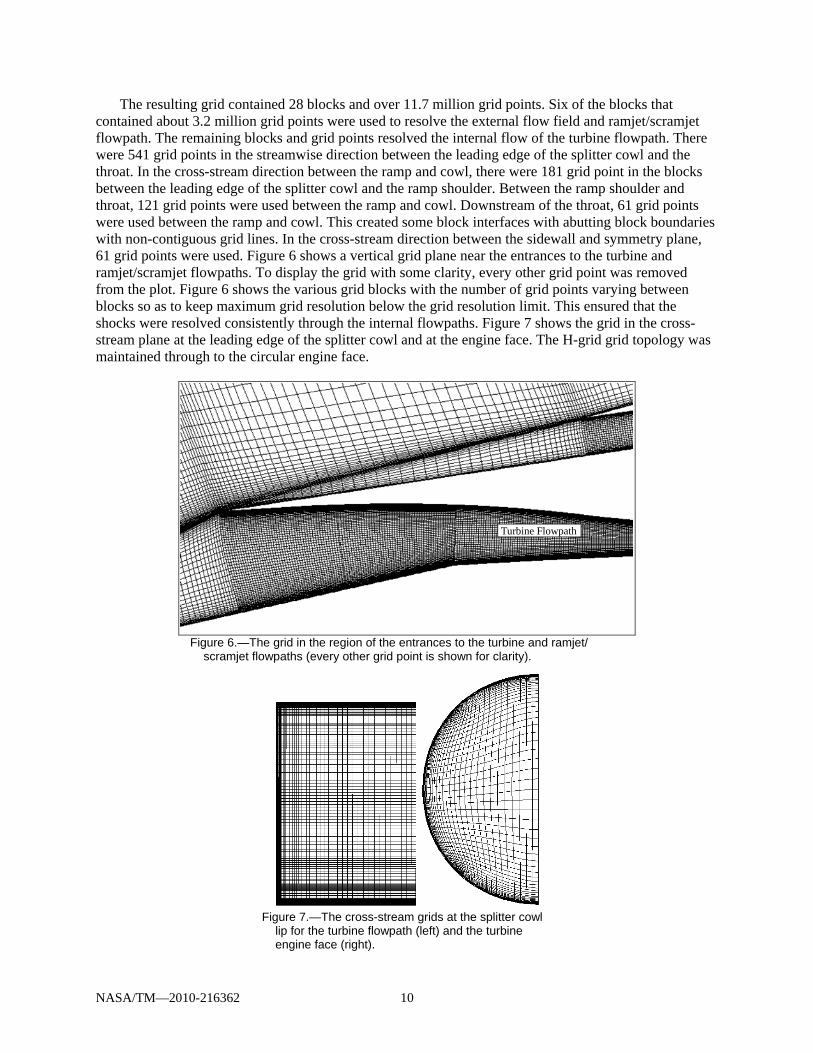
The resulting grid contained 28 blocks and over 11.7 million grid points. Six of the blocks that contained about 3.2 million grid points were used to resolve the external flow field and ramjet/scramjet flowpath. The remaining blocks and grid points resolved the internal flow of the turbine flowpath. There were 541 grid points in the streamwise direction between the leading edge of the splitter cowl and the throat. In the cross-stream direction between the ramp and cowl, there were 181 grid point in the blocks between the leading edge of the splitter cowl and the ramp shoulder. Between the ramp shoulder and throat, 121 grid points were used between the ramp and cowl. Downstream of the throat, 61 grid points were used between the ramp and cowl. This created some block interfaces with abutting block boundaries with non-contiguous grid lines. In the cross-stream direction between the sidewall and symmetry plane, 61 grid points were used. Figure 6 shows a vertical grid plane near the entrances to the turbine and ramjet/scramjet flowpaths. To display the grid with some clarity, every other grid point was removed from the plot. Figure 6 shows the various grid blocks with the number of grid points varying between blocks so as to keep maximum grid resolution below the grid resolution limit. This ensured that the shocks were resolved consistently through the internal flowpaths. Figure 7 shows the grid in the cross-stream plane at the leading edge of the splitter cowl and at the engine face. The H-grid grid topology was maintained through to the circular engine face.
Turbine Flowpath
Figure 6.—The grid in the region of the entrances to the turbine and ramjet/
scramjet flowpaths (every other grid point is shown for clarity).
Figure 7.—The cross-stream grids at the splitter cowl
lip for the turbine flowpath (left) and the turbine engine face (right).
NASA/TM—2010-216362 10
3.5 Initial Flow Solution and Iterative Convergence
The time-marching solution to the RANS equations required an initial solution for the flow field from which to iterate to the steady-state solution. For these simulations, the initial solution was set to the supersonic conditions of the freestream ahead of the inlet. A series of iteration sets were performed to handle the complexities of establishing the mixed-compression flow field within the turbine flowpath. The first set involved several hundred iterations to establish a realistic supersonic flow through the turbine flowpath. The outflow nozzle was set with a diameter just slightly smaller than the diameter of the engine face so as not to choke. The vortex generators were not included within the flow domain. First-order inviscid flux terms were used and viscous flux terms were not included. A coarser grid was used through the use of the grid sequencing in which every other grid point was bypassed. This approach allowed the large transients to be damped or propagate out of the flow domain. The resulting flow field contained the primary oblique shocks through the inlet.
The next set of several hundred iterations included the viscous terms to begin developing the boundary layers. The bleed regions were included to provide some control of the shock/boundary layer interactions. At first, the bleed rates for each bleed region were specified using the constant-bleed model. As the bleed flows develop, the bleed boundary conditions were changed to the constant-pressure bleed boundary condition. The bleed plenum pressures were adjusted during the iteration sets to obtain the desired bleed flow rate for each bleed region.
The iteration sets continued with gradual introduction of the second-order flux methods and finer grids. During the process, the flow rates through the bleed regions and engine face were monitored to check on the iterative convergence. The flow rates were the primary measure of iterative convergence. It was possible to reach a level of iterative convergence of the bleed rates to levels of variation of Wbleed/WLS ≈ 0.01 percent. Similar converge was observed for the engine-face flow rate W2/WHS. Another measure of iterative convergence was the variation of the total-pressure recovery. The solutions were typically able to converge to a variation of less than 0.001 (1/10th of a count).
The terminal shock and subsonic flow were established within the turbine flowpath by reducing the outflow nozzle throat area until choking was achieved. Further reductions in the nozzle throat increased the back pressure in the subsonic diffuser and pushed the terminal shock forward toward the inlet throat. Once the terminal shock was in the proximity of the throat, the vortex generators were added to the flow domain.
The turbine flowpath was considered supercritical when the terminal shock was established downstream of the bleed regions in the throat (R4/C2/SW3). With supersonic flow over all of the bleed regions, the bleed rates were at their supercritical levels. The wind-tunnel test data listed the supercritical bleed rates at each position of the splitter cowl. As the iterations were continued, the plenum static pressures were then adjusted until the supercritical bleed rates approached those of the wind-tunnel test. Table 1 lists the supercritical bleed rates from the wind-tunnel test and the CFD solution for the splitter cowl in the 0° position. The values of the resulting plenum pressures are also listed. The bleed rates are also shown in Figure 4.
With the bleed rates and plenum pressure known, Equation (6) was used to calculate the product of CD Aexit, which are listed in Table 1. These values were used to model the fixed-exit bleed system for the remaining inlet mode transition simulations at the other splitter cowl positions. The SW1, SW2, and SW3 bleed regions did not have plenums and exhausted directly to the external flow. It was assumed the flow through these bleed regions was choked. Thus, the plenum pressures for these three bleed regions were held fixed during the inlet mode transition simulations at the plenum pressure that produced the match with the supercritical bleed rate.
4.0 CFD Results Some results of the CFD simulations are presented to illustrate the flow features and quantify the flow
properties and inlet performance. These include variations of the Mach number, static pressure, bleed
NASA/TM—2010-216362 11
rates, bleed plenum pressures, total-pressure recovery, and total-pressure distortion. The applicability of the CFD methods for simulating inlet mode transition was evaluated through comparison of the CFD results to wind-tunnel test data.
4.1 Flow Features
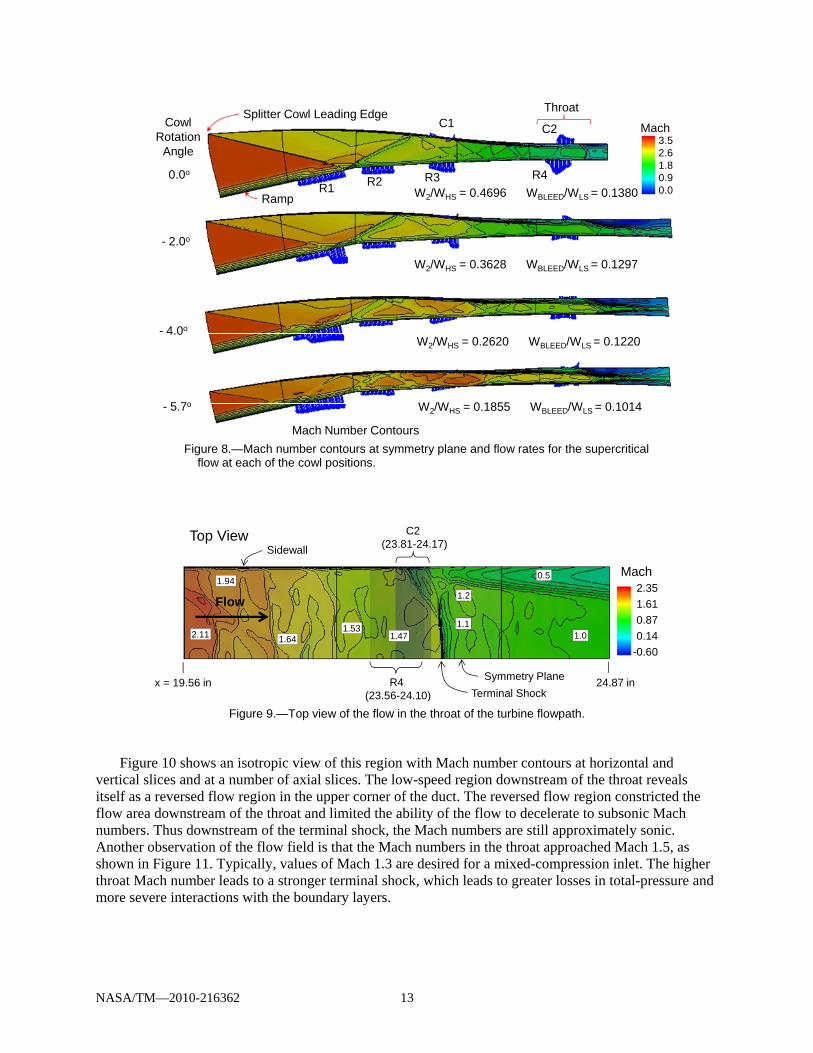
The CFD simulations provided an illustration of the shock waves, Mach numbers, static pressures, boundary layers and other flow features that allowed a greater understanding of the aerodynamics of the inlet flow during inlet mode transition. Figure 8 illustrates the changes in the flow field as the splitter cowl was rotated toward the closed position. Shown are the Mach number contours on the symmetry plane of the turbine flowpath from the leading edge of the splitter cowl to the throat for the four splitter cowl positions simulated (0°, –2°, –4°, and –5.7°). The four simulations were all performed at the same corrected flow rate for the turbine flowpath. For the flow field with the 0° splitter cowl position, an oblique shock started at the leading edge of the splitter cowl and propagated downward and intersected the ramp at the end of the R1 bleed region. An oblique shock reflected from the ramp and intersected the cowl just upstream of the C1 bleed region. There were several other reflected oblique shocks that formed, but they were too weak to show up clearly on the plot. The terminal shock was downstream of the R4 and C2 throat bleed regions and the flow was supercritical. The Mach number decelerated through the flowpath and decreased to about Mach 1.5 prior to the terminal shock. Downstream of the terminal shock, the Mach numbers were high subsonic values.
The blue arrows show the bleed momentum vectors across the bleed regions. The lengths of the arrows represent the relative magnitude of the local bleed momentum. Each arrow represents a single boundary grid point at which the porous bleed boundary condition was applied. One can see that the bleed model indicated a variation of bleed rates across the bleed region due to variations in the local pressures.
As the splitter cowl was rotated toward the closed position, the oblique shock changed angle and position such that the point of interaction with the ramp moved forward into the R1 bleed region. Downstream of the shock, the static pressures increased, which increased the bleed rate in the aft portion of the R1 bleed region. The oblique shock also became weaker as the splitter cowl angle became more aligned with the incoming ramp flow. The closing of the splitter cowl reduced the compression within the turbine flowpath which increased the Mach numbers in the throat. The higher Mach numbers resulted in stronger shock/boundary layer interactions which increased the boundary-layer separation downstream of the terminal shock.
Figure 8 includes the flow rates through the engine face of the turbine flowpath W2 as normalized by the reference captured flow rate of the ramjet/scramjet cowl WHS, which was computed as the rate of freestream flow through the capture area of the frontal projection of the leading edge of the cowl of the ramjet/scramjet flowpath. Figure 8 also includes the total bleed rates WBleed as normalized by the reference capture flow rate of the splitter cowl WLS. As can be seen, both W2 and WBleed decreased as the splitter cowl was rotated toward the closed position. The W2 decreased because the smaller opening captured less flow. The WBleed decreased due to higher Mach numbers and lower pressures within the turbine flowpath.
The flow through the turbine flowpath was quite three-dimensional despite the two-dimensional nature of the geometry. The sidewall boundary layer resulted in low-momentum corner flows. Figure 9 shows the Mach number contours for a horizontal slice through the duct or “top view”. Only a section in the throat region from x = 19.56 to 24.87 in. is shown. The flow is from the left to right and the sidewall is shown at the top and symmetry plane is shown at the bottom. The R4 and C2 bleed regions are shown as the vertical darker bands in the middle of the plot. The inset numbers indicate the Mach numbers at the respective locations. The terminal shock is indicated by the dark clustering of contours. Toward the symmetry plane, the terminal shock formed an approximately normal shock. However, toward the sidewall, the terminal shock interacted significantly with the sidewall boundary layer and a low-speed region formed along the sidewall downstream of the throat bleed regions.
NASA/TM—2010-216362 12
Cowl Rotation
Angle
- 2.0o
- 4.0o
- 5.7o
W2/WHS = 0.4696 WBLEED/WLS = 0.1380
W2/WHS = 0.3628 WBLEED/WLS = 0.1297
W2/WHS = 0.2620 WBLEED/WLS = 0.1220
W2/WHS = 0.1855 WBLEED/WLS = 0.1014
Mach Number Contours
0.0o
3.52.61.80.90.0
Mach
R1 R2 R3 R4
C2C1Splitter Cowl Leading Edge
Ramp
Throat
Figure 8.—Mach number contours at symmetry plane and flow rates for the supercritical
flow at each of the cowl positions.
1.0
0.5
1.1
1.2
1.471.53
1.94
1.642.11
C2 (23.81-24.17)
R4 (23.56-24.10)
Flow
Symmetry Plane
SidewallTop View
24.87 inx = 19.56 inTerminal Shock
Mach2.351.610.870.14
-0.60
Figure 9.—Top view of the flow in the throat of the turbine flowpath.
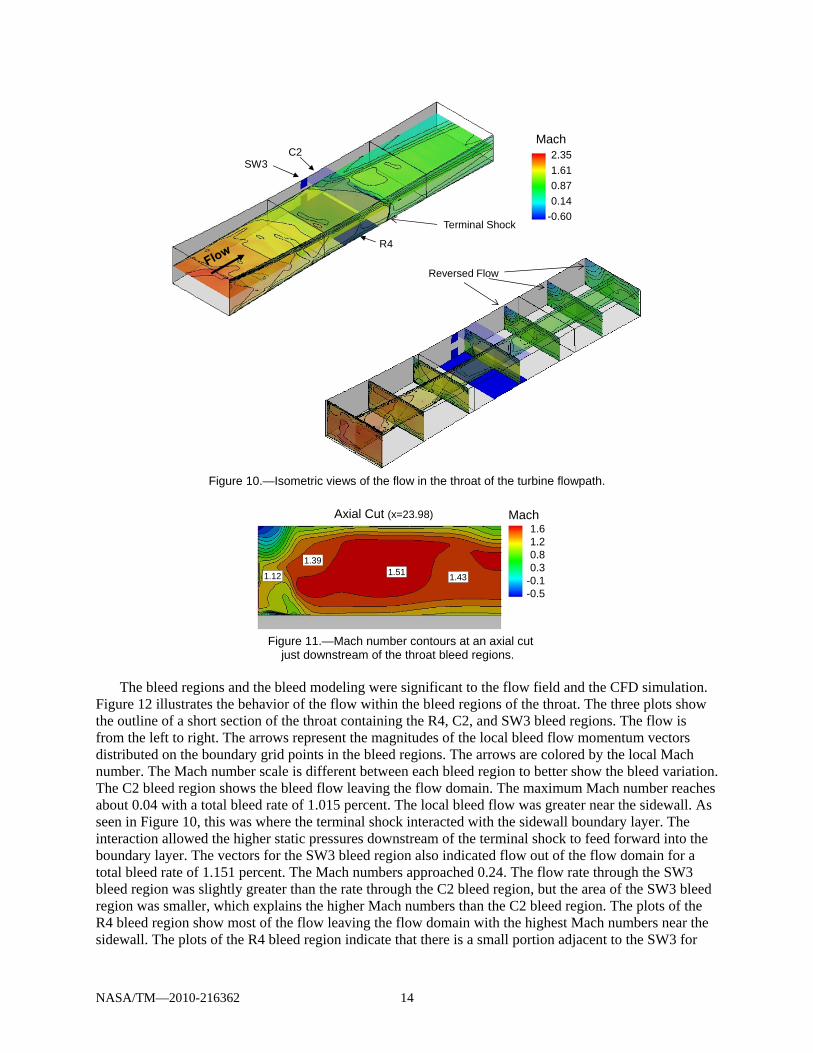
Figure 10 shows an isotropic view of this region with Mach number contours at horizontal and
vertical slices and at a number of axial slices. The low-speed region downstream of the throat reveals itself as a reversed flow region in the upper corner of the duct. The reversed flow region constricted the flow area downstream of the throat and limited the ability of the flow to decelerate to subsonic Mach numbers. Thus downstream of the terminal shock, the Mach numbers are still approximately sonic. Another observation of the flow field is that the Mach numbers in the throat approached Mach 1.5, as shown in Figure 11. Typically, values of Mach 1.3 are desired for a mixed-compression inlet. The higher throat Mach number leads to a stronger terminal shock, which leads to greater losses in total-pressure and more severe interactions with the boundary layers.
NASA/TM—2010-216362 13
R4
C2SW3
Terminal Shock
Reversed Flow
Mach2.351.610.870.14
-0.60
Figure 10.—Isometric views of the flow in the throat of the turbine flowpath.
Axial Cut (x=23.98)
1.391.51 1.431.12
1.61.20.80.3
-0.1-0.5
Mach
Figure 11.—Mach number contours at an axial cut
just downstream of the throat bleed regions.
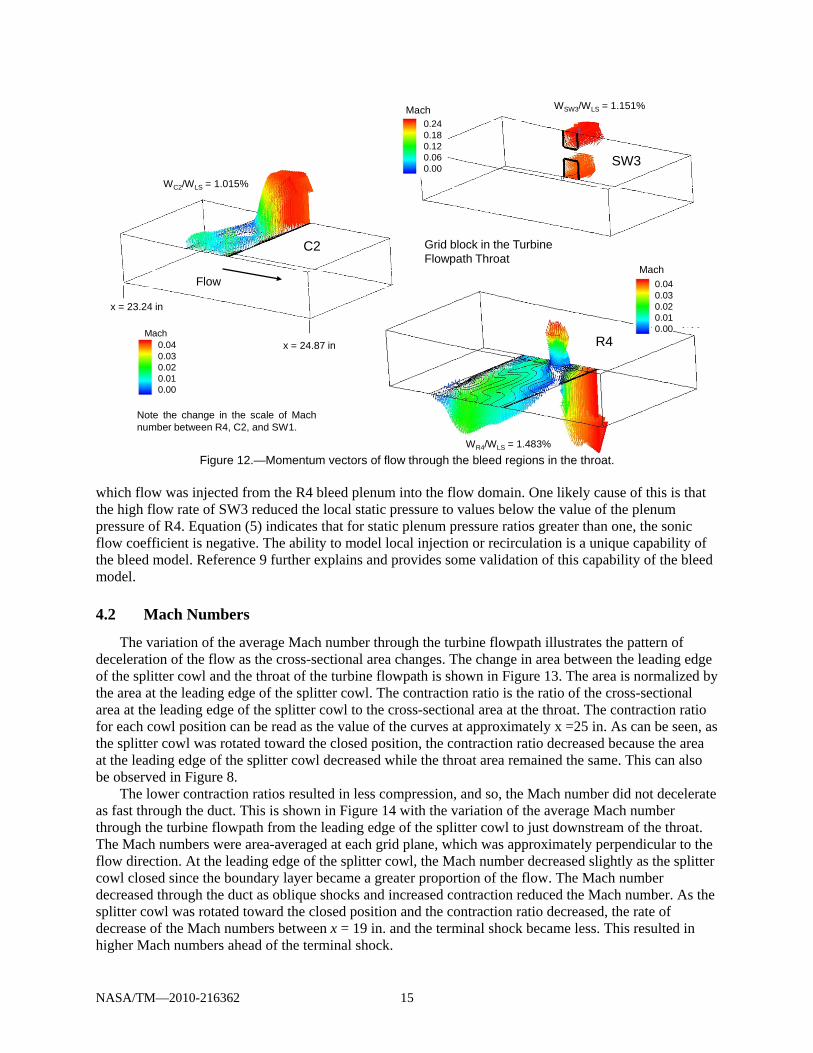
The bleed regions and the bleed modeling were significant to the flow field and the CFD simulation. Figure 12 illustrates the behavior of the flow within the bleed regions of the throat. The three plots show the outline of a short section of the throat containing the R4, C2, and SW3 bleed regions. The flow is from the left to right. The arrows represent the magnitudes of the local bleed flow momentum vectors distributed on the boundary grid points in the bleed regions. The arrows are colored by the local Mach number. The Mach number scale is different between each bleed region to better show the bleed variation. The C2 bleed region shows the bleed flow leaving the flow domain. The maximum Mach number reaches about 0.04 with a total bleed rate of 1.015 percent. The local bleed flow was greater near the sidewall. As seen in Figure 10, this was where the terminal shock interacted with the sidewall boundary layer. The interaction allowed the higher static pressures downstream of the terminal shock to feed forward into the boundary layer. The vectors for the SW3 bleed region also indicated flow out of the flow domain for a total bleed rate of 1.151 percent. The Mach numbers approached 0.24. The flow rate through the SW3 bleed region was slightly greater than the rate through the C2 bleed region, but the area of the SW3 bleed region was smaller, which explains the higher Mach numbers than the C2 bleed region. The plots of the R4 bleed region show most of the flow leaving the flow domain with the highest Mach numbers near the sidewall. The plots of the R4 bleed region indicate that there is a small portion adjacent to the SW3 for
NASA/TM—2010-216362 14
R4
Mach
WR4/WLS = 1.483%
Note the change in the scale of Machnumber between R4, C2, and SW1.
C2
x = 23.24 in
x = 24.87 in
Flow
WC2/WLS = 1.015%
SW3
WSW3/WLS = 1.151%
0.240.180.120.060.00
0.040.030.020.010.00
Mach
0.040.030.020.010.00
Mach
Grid block in the Turbine Flowpath Throat
Figure 12.—Momentum vectors of flow through the bleed regions in the throat.
which flow was injected from the R4 bleed plenum into the flow domain. One likely cause of this is that the high flow rate of SW3 reduced the local static pressure to values below the value of the plenum pressure of R4. Equation (5) indicates that for static plenum pressure ratios greater than one, the sonic flow coefficient is negative. The ability to model local injection or recirculation is a unique capability of the bleed model. Reference 9 further explains and provides some validation of this capability of the bleed model.
4.2 Mach Numbers
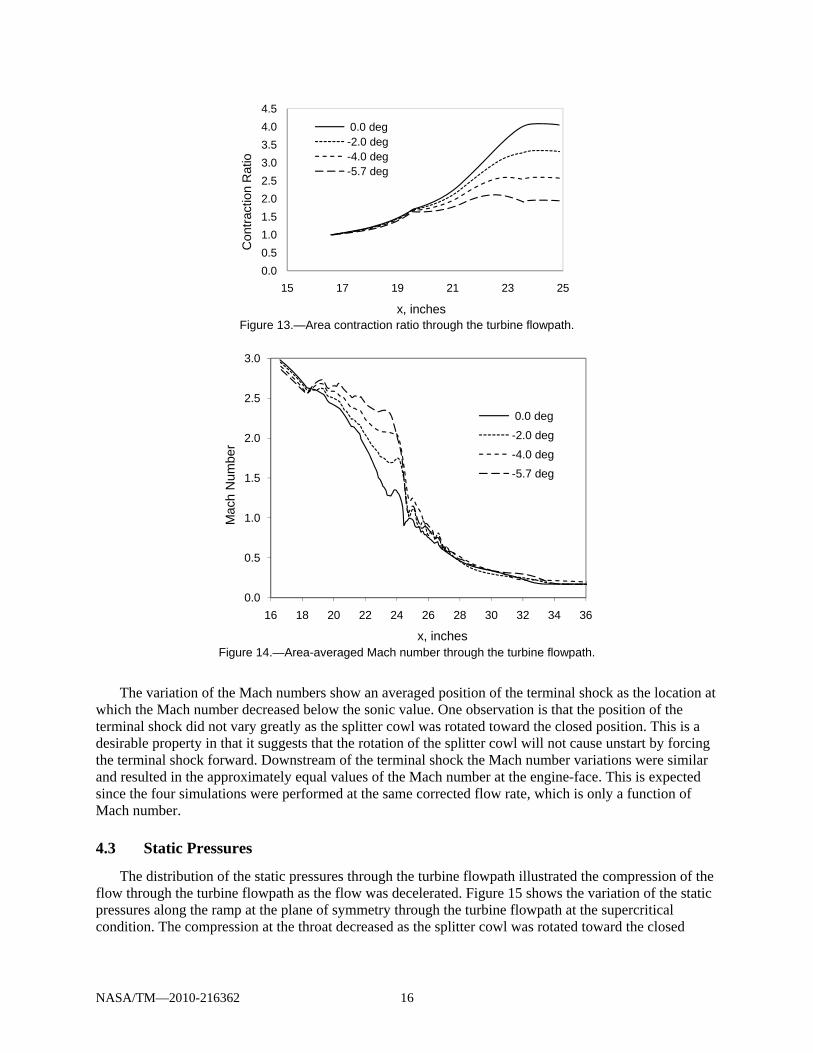
The variation of the average Mach number through the turbine flowpath illustrates the pattern of deceleration of the flow as the cross-sectional area changes. The change in area between the leading edge of the splitter cowl and the throat of the turbine flowpath is shown in Figure 13. The area is normalized by the area at the leading edge of the splitter cowl. The contraction ratio is the ratio of the cross-sectional area at the leading edge of the splitter cowl to the cross-sectional area at the throat. The contraction ratio for each cowl position can be read as the value of the curves at approximately x =25 in. As can be seen, as the splitter cowl was rotated toward the closed position, the contraction ratio decreased because the area at the leading edge of the splitter cowl decreased while the throat area remained the same. This can also be observed in Figure 8.
The lower contraction ratios resulted in less compression, and so, the Mach number did not decelerate as fast through the duct. This is shown in Figure 14 with the variation of the average Mach number through the turbine flowpath from the leading edge of the splitter cowl to just downstream of the throat. The Mach numbers were area-averaged at each grid plane, which was approximately perpendicular to the flow direction. At the leading edge of the splitter cowl, the Mach number decreased slightly as the splitter cowl closed since the boundary layer became a greater proportion of the flow. The Mach number decreased through the duct as oblique shocks and increased contraction reduced the Mach number. As the splitter cowl was rotated toward the closed position and the contraction ratio decreased, the rate of decrease of the Mach numbers between x = 19 in. and the terminal shock became less. This resulted in higher Mach numbers ahead of the terminal shock.
NASA/TM—2010-216362 15
0.00.51.01.52.02.53.03.54.04.5
15 17 19 21 23 25
Con
tract
ion
Rat
io
x, inches
0.0 deg-2.0 deg-4.0 deg-5.7 deg
Figure 13.—Area contraction ratio through the turbine flowpath.
0.0
0.5
1.0
1.5
2.0
2.5
3.0
16 18 20 22 24 26 28 30 32 34 36
Mac
h N
umbe
r
x, inches
0.0 deg
-2.0 deg-4.0 deg-5.7 deg
Figure 14.—Area-averaged Mach number through the turbine flowpath.
The variation of the Mach numbers show an averaged position of the terminal shock as the location at which the Mach number decreased below the sonic value. One observation is that the position of the terminal shock did not vary greatly as the splitter cowl was rotated toward the closed position. This is a desirable property in that it suggests that the rotation of the splitter cowl will not cause unstart by forcing the terminal shock forward. Downstream of the terminal shock the Mach number variations were similar and resulted in the approximately equal values of the Mach number at the engine-face. This is expected since the four simulations were performed at the same corrected flow rate, which is only a function of Mach number.
4.3 Static Pressures
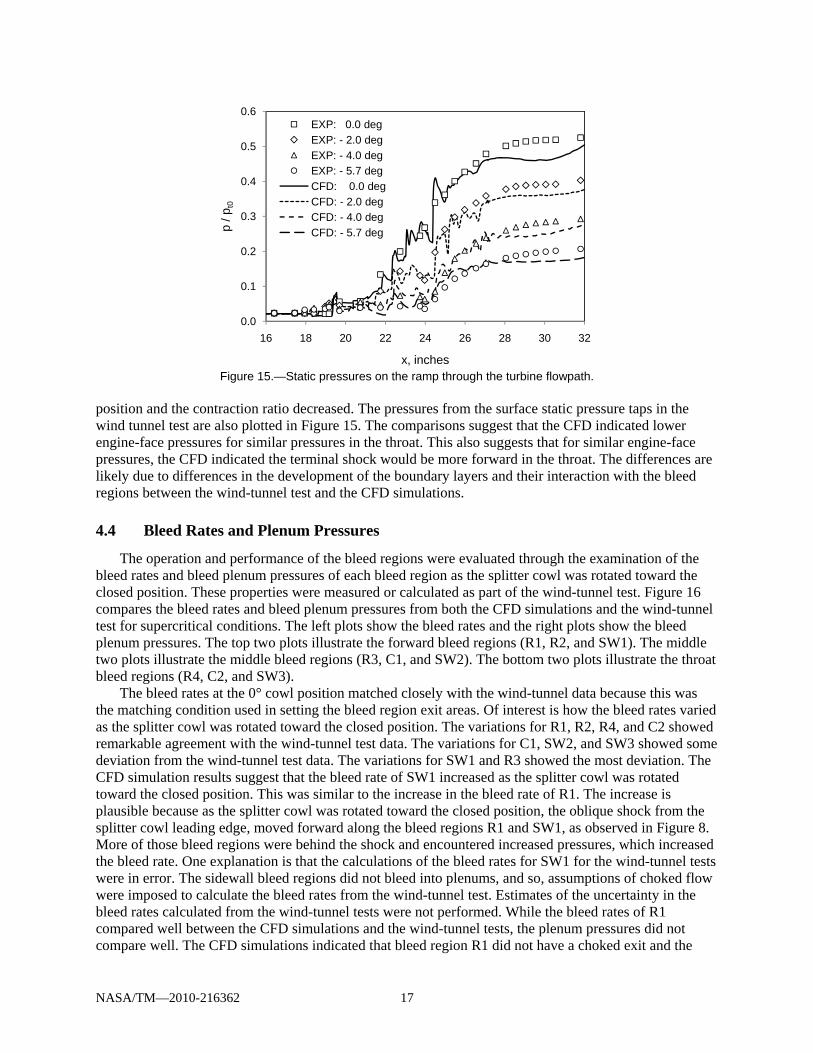
The distribution of the static pressures through the turbine flowpath illustrated the compression of the flow through the turbine flowpath as the flow was decelerated. Figure 15 shows the variation of the static pressures along the ramp at the plane of symmetry through the turbine flowpath at the supercritical condition. The compression at the throat decreased as the splitter cowl was rotated toward the closed
Figure 15.—Static pressures on the ramp through the turbine flowpath.
position and the contraction ratio decreased. The pressures from the surface static pressure taps in the wind tunnel test are also plotted in Figure 15. The comparisons suggest that the CFD indicated lower engine-face pressures for similar pressures in the throat. This also suggests that for similar engine-face pressures, the CFD indicated the terminal shock would be more forward in the throat. The differences are likely due to differences in the development of the boundary layers and their interaction with the bleed regions between the wind-tunnel test and the CFD simulations.
4.4 Bleed Rates and Plenum Pressures
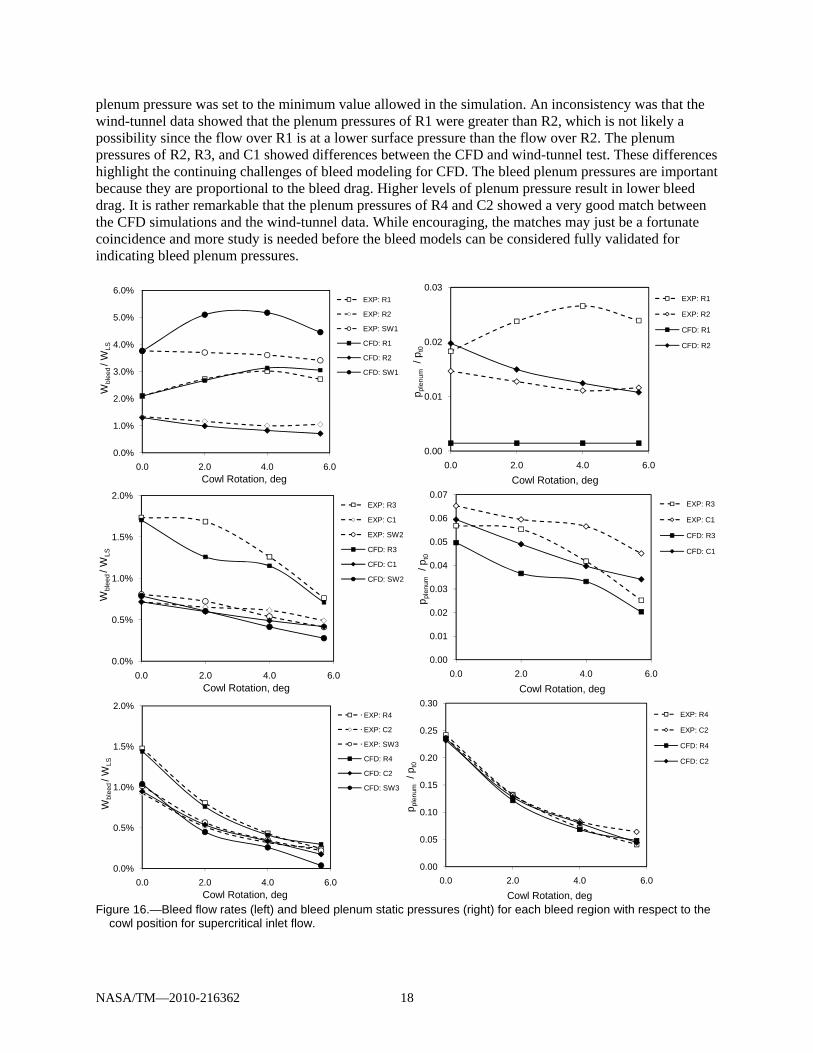
The operation and performance of the bleed regions were evaluated through the examination of the bleed rates and bleed plenum pressures of each bleed region as the splitter cowl was rotated toward the closed position. These properties were measured or calculated as part of the wind-tunnel test. Figure 16 compares the bleed rates and bleed plenum pressures from both the CFD simulations and the wind-tunnel test for supercritical conditions. The left plots show the bleed rates and the right plots show the bleed plenum pressures. The top two plots illustrate the forward bleed regions (R1, R2, and SW1). The middle two plots illustrate the middle bleed regions (R3, C1, and SW2). The bottom two plots illustrate the throat bleed regions (R4, C2, and SW3).
The bleed rates at the 0° cowl position matched closely with the wind-tunnel data because this was the matching condition used in setting the bleed region exit areas. Of interest is how the bleed rates varied as the splitter cowl was rotated toward the closed position. The variations for R1, R2, R4, and C2 showed remarkable agreement with the wind-tunnel test data. The variations for C1, SW2, and SW3 showed some deviation from the wind-tunnel test data. The variations for SW1 and R3 showed the most deviation. The CFD simulation results suggest that the bleed rate of SW1 increased as the splitter cowl was rotated toward the closed position. This was similar to the increase in the bleed rate of R1. The increase is plausible because as the splitter cowl was rotated toward the closed position, the oblique shock from the splitter cowl leading edge, moved forward along the bleed regions R1 and SW1, as observed in Figure 8. More of those bleed regions were behind the shock and encountered increased pressures, which increased the bleed rate. One explanation is that the calculations of the bleed rates for SW1 for the wind-tunnel tests were in error. The sidewall bleed regions did not bleed into plenums, and so, assumptions of choked flow were imposed to calculate the bleed rates from the wind-tunnel test. Estimates of the uncertainty in the bleed rates calculated from the wind-tunnel tests were not performed. While the bleed rates of R1 compared well between the CFD simulations and the wind-tunnel tests, the plenum pressures did not compare well. The CFD simulations indicated that bleed region R1 did not have a choked exit and the
NASA/TM—2010-216362 17
plenum pressure was set to the minimum value allowed in the simulation. An inconsistency was that the wind-tunnel data showed that the plenum pressures of R1 were greater than R2, which is not likely a possibility since the flow over R1 is at a lower surface pressure than the flow over R2. The plenum pressures of R2, R3, and C1 showed differences between the CFD and wind-tunnel test. These differences highlight the continuing challenges of bleed modeling for CFD. The bleed plenum pressures are important because they are proportional to the bleed drag. Higher levels of plenum pressure result in lower bleed drag. It is rather remarkable that the plenum pressures of R4 and C2 showed a very good match between the CFD simulations and the wind-tunnel data. While encouraging, the matches may just be a fortunate coincidence and more study is needed before the bleed models can be considered fully validated for indicating bleed plenum pressures.
0.0%
1.0%
2.0%
3.0%
4.0%
5.0%
6.0%
0.0 2.0 4.0 6.0
Wbl
eed / W
LS
Cowl Rotation, deg
EXP: R1
EXP: R2
EXP: SW1
CFD: R1
CFD: R2
CFD: SW1
0.00
0.01
0.02
0.03
0.0 2.0 4.0 6.0
p ple
num
/ pt0
Cowl Rotation, deg
EXP: R1
EXP: R2
CFD: R1
CFD: R2
0.0%
0.5%
1.0%
1.5%
2.0%
0.0 2.0 4.0 6.0
Wbl
eed / W
LS
Cowl Rotation, deg
EXP: R3
EXP: C1
EXP: SW2
CFD: R3
CFD: C1
CFD: SW2
0.00
0.01
0.02
0.03
0.04
0.05
0.06
0.07
0.0 2.0 4.0 6.0
p ple
num
/ pt0
Cowl Rotation, deg
EXP: R3
EXP: C1
CFD: R3
CFD: C1
0.0%
0.5%
1.0%
1.5%
2.0%
0.0 2.0 4.0 6.0
Wbl
eed / W
LS
Cowl Rotation, deg
EXP: R4
EXP: C2
EXP: SW3
CFD: R4
CFD: C2
CFD: SW3
0.00
0.05
0.10
0.15
0.20
0.25
0.30
0.0 2.0 4.0 6.0
p ple
num
/ pt0
Cowl Rotation, deg
EXP: R4
EXP: C2
CFD: R4
CFD: C2
Figure 16.—Bleed flow rates (left) and bleed plenum static pressures (right) for each bleed region with respect to the
cowl position for supercritical inlet flow.
NASA/TM—2010-216362 18
4.5 Engine-Face Total-Pressure Recovery
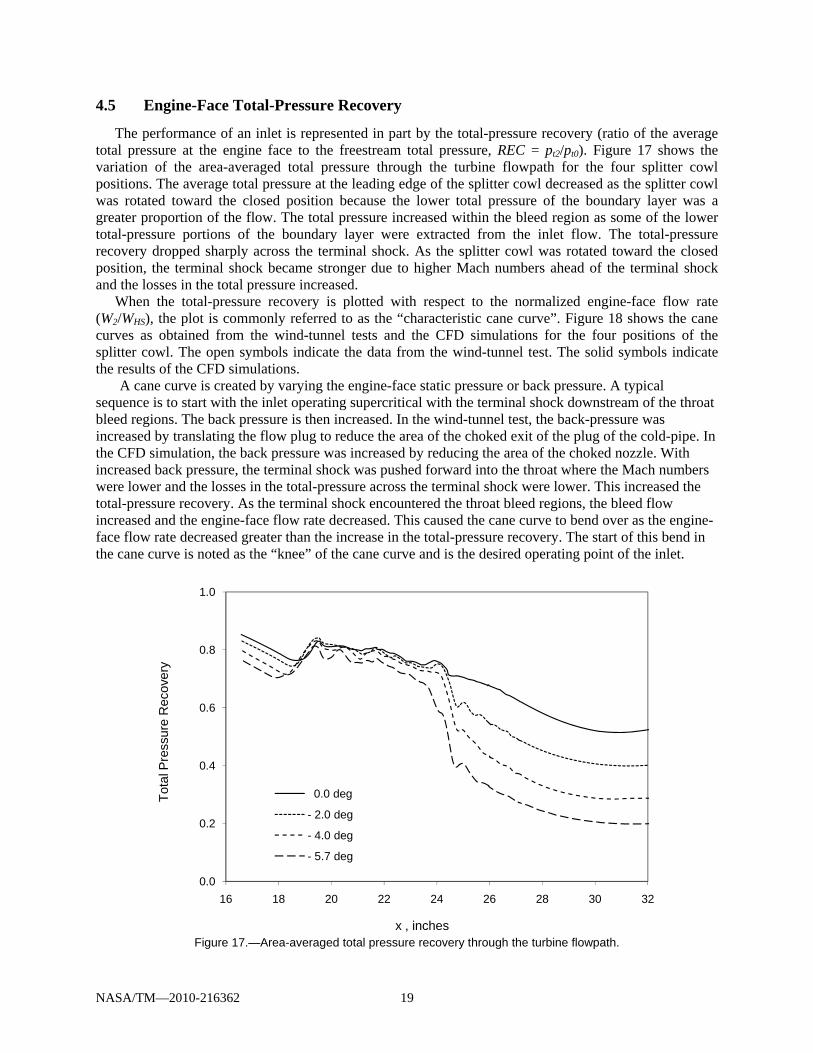
The performance of an inlet is represented in part by the total-pressure recovery (ratio of the average total pressure at the engine face to the freestream total pressure, REC = pt2/pt0). Figure 17 shows the variation of the area-averaged total pressure through the turbine flowpath for the four splitter cowl positions. The average total pressure at the leading edge of the splitter cowl decreased as the splitter cowl was rotated toward the closed position because the lower total pressure of the boundary layer was a greater proportion of the flow. The total pressure increased within the bleed region as some of the lower total-pressure portions of the boundary layer were extracted from the inlet flow. The total-pressure recovery dropped sharply across the terminal shock. As the splitter cowl was rotated toward the closed position, the terminal shock became stronger due to higher Mach numbers ahead of the terminal shock and the losses in the total pressure increased.
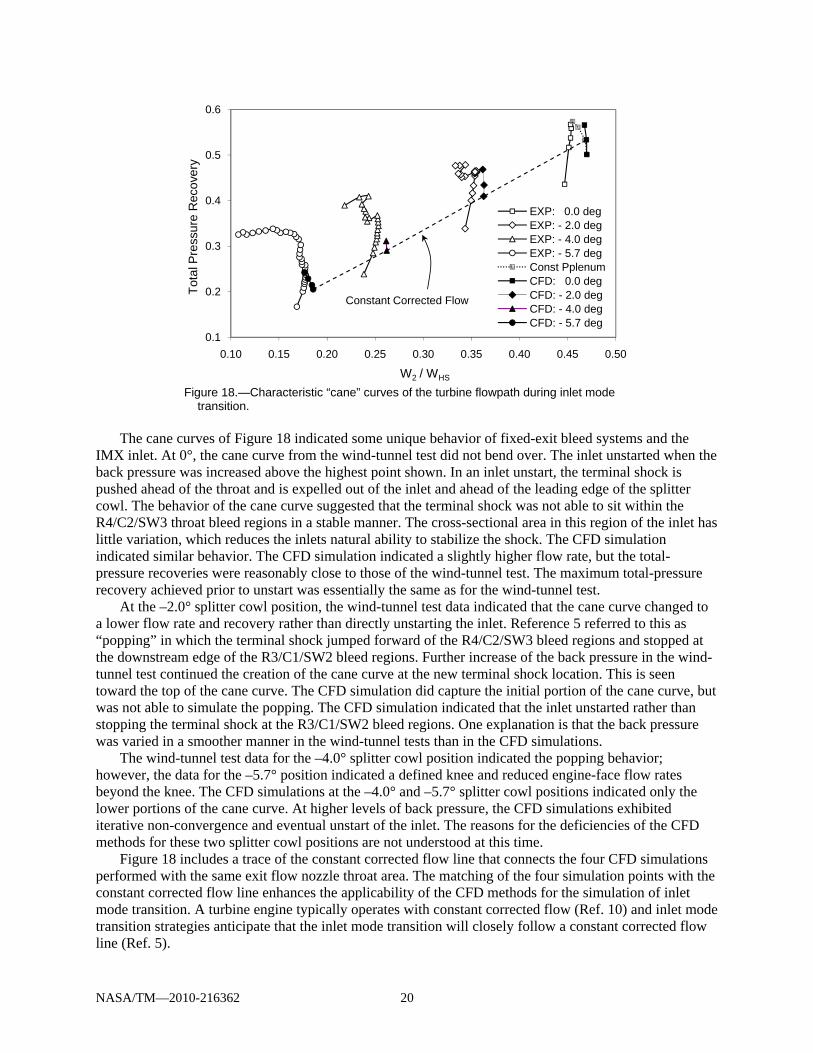
When the total-pressure recovery is plotted with respect to the normalized engine-face flow rate (W2/WHS), the plot is commonly referred to as the “characteristic cane curve”. Figure 18 shows the cane curves as obtained from the wind-tunnel tests and the CFD simulations for the four positions of the splitter cowl. The open symbols indicate the data from the wind-tunnel test. The solid symbols indicate the results of the CFD simulations.
A cane curve is created by varying the engine-face static pressure or back pressure. A typical sequence is to start with the inlet operating supercritical with the terminal shock downstream of the throat bleed regions. The back pressure is then increased. In the wind-tunnel test, the back-pressure was increased by translating the flow plug to reduce the area of the choked exit of the plug of the cold-pipe. In the CFD simulation, the back pressure was increased by reducing the area of the choked nozzle. With increased back pressure, the terminal shock was pushed forward into the throat where the Mach numbers were lower and the losses in the total-pressure across the terminal shock were lower. This increased the total-pressure recovery. As the terminal shock encountered the throat bleed regions, the bleed flow increased and the engine-face flow rate decreased. This caused the cane curve to bend over as the engine-face flow rate decreased greater than the increase in the total-pressure recovery. The start of this bend in the cane curve is noted as the “knee” of the cane curve and is the desired operating point of the inlet.
0.0
0.2
0.4
0.6
0.8
1.0
16 18 20 22 24 26 28 30 32
Tota
l Pre
ssur
e R
ecov
ery
x , inches
0.0 deg
- 2.0 deg
- 4.0 deg
- 5.7 deg
Figure 17.—Area-averaged total pressure recovery through the turbine flowpath.
Figure 18.—Characteristic “cane” curves of the turbine flowpath during inlet mode
transition.
The cane curves of Figure 18 indicated some unique behavior of fixed-exit bleed systems and the IMX inlet. At 0°, the cane curve from the wind-tunnel test did not bend over. The inlet unstarted when the back pressure was increased above the highest point shown. In an inlet unstart, the terminal shock is pushed ahead of the throat and is expelled out of the inlet and ahead of the leading edge of the splitter cowl. The behavior of the cane curve suggested that the terminal shock was not able to sit within the R4/C2/SW3 throat bleed regions in a stable manner. The cross-sectional area in this region of the inlet has little variation, which reduces the inlets natural ability to stabilize the shock. The CFD simulation indicated similar behavior. The CFD simulation indicated a slightly higher flow rate, but the total-pressure recoveries were reasonably close to those of the wind-tunnel test. The maximum total-pressure recovery achieved prior to unstart was essentially the same as for the wind-tunnel test.
At the –2.0° splitter cowl position, the wind-tunnel test data indicated that the cane curve changed to a lower flow rate and recovery rather than directly unstarting the inlet. Reference 5 referred to this as “popping” in which the terminal shock jumped forward of the R4/C2/SW3 bleed regions and stopped at the downstream edge of the R3/C1/SW2 bleed regions. Further increase of the back pressure in the wind-tunnel test continued the creation of the cane curve at the new terminal shock location. This is seen toward the top of the cane curve. The CFD simulation did capture the initial portion of the cane curve, but was not able to simulate the popping. The CFD simulation indicated that the inlet unstarted rather than stopping the terminal shock at the R3/C1/SW2 bleed regions. One explanation is that the back pressure was varied in a smoother manner in the wind-tunnel tests than in the CFD simulations.
The wind-tunnel test data for the –4.0° splitter cowl position indicated the popping behavior; however, the data for the –5.7° position indicated a defined knee and reduced engine-face flow rates beyond the knee. The CFD simulations at the –4.0° and –5.7° splitter cowl positions indicated only the lower portions of the cane curve. At higher levels of back pressure, the CFD simulations exhibited iterative non-convergence and eventual unstart of the inlet. The reasons for the deficiencies of the CFD methods for these two splitter cowl positions are not understood at this time.
Figure 18 includes a trace of the constant corrected flow line that connects the four CFD simulations performed with the same exit flow nozzle throat area. The matching of the four simulation points with the constant corrected flow line enhances the applicability of the CFD methods for the simulation of inlet mode transition. A turbine engine typically operates with constant corrected flow (Ref. 10) and inlet mode transition strategies anticipate that the inlet mode transition will closely follow a constant corrected flow line (Ref. 5).
NASA/TM—2010-216362 20
It is possible to incorporate a control system for the bleed region so as to control the level of plenum static pressure. Reference 11 demonstrated that by maintaining a near constant plenum pressure, the bleed systems of a supersonic inlet were able to enhance the stability of the terminal shock by removing greater amounts of bleed flow. With the fixed bleed plenum exits, the plenum pressure will increase as the terminal shock moves into the bleed region. This limits the amount of bleed flow the bleed region can extract, which limits the ability of the bleed region to stabilize the terminal shock. The control system can act by varying the bleed plenum exit area by either fluidic or mechanical means. Figure 18 includes a cane curve generated at the 0° splitter cowl position for a constant-pressure bleed boundary condition. The cane curve bends over due to greater amounts of bleed flow being extracted and achieves slightly higher levels of total-pressure recovery than for the fixed-exit bleed boundary condition. This increases the stability margin of the IMX inlet to withstand inlet unstart. Reference 8 presents another CFD application demonstrating the differences between the fixed-exit and constant-pressure bleed models.
4.6 Engine-Face Total-Pressure Distortion
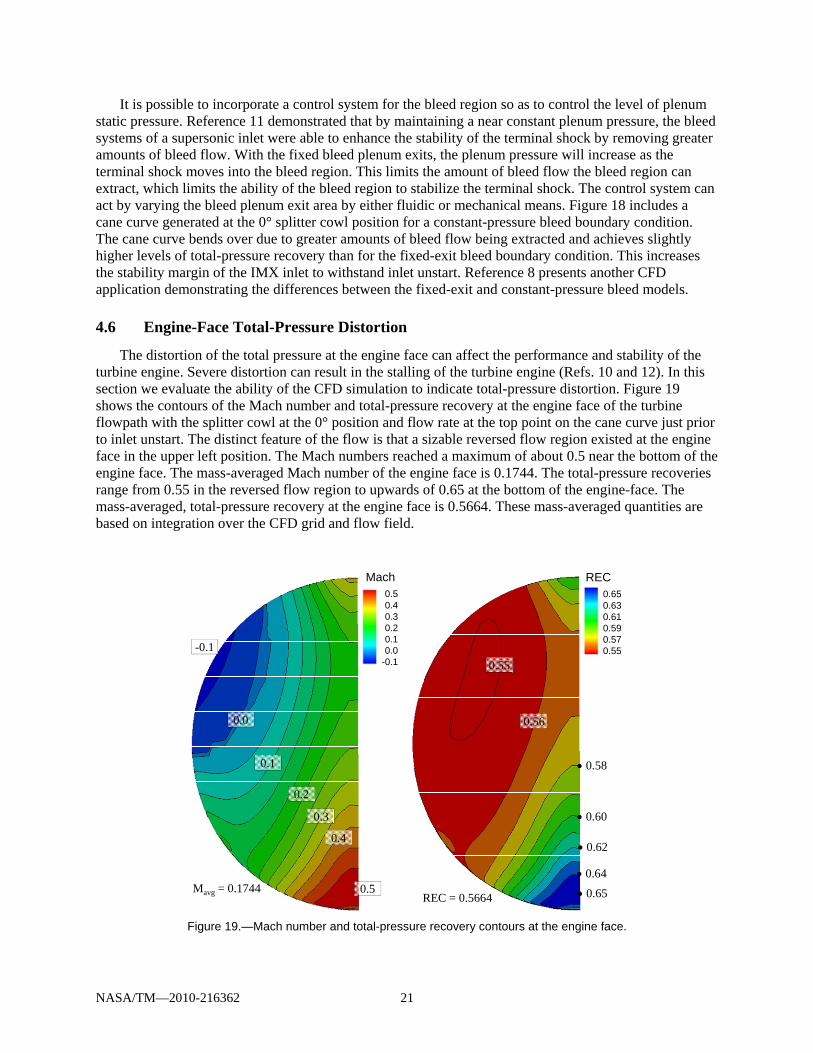
The distortion of the total pressure at the engine face can affect the performance and stability of the turbine engine. Severe distortion can result in the stalling of the turbine engine (Refs. 10 and 12). In this section we evaluate the ability of the CFD simulation to indicate total-pressure distortion. Figure 19 shows the contours of the Mach number and total-pressure recovery at the engine face of the turbine flowpath with the splitter cowl at the 0° position and flow rate at the top point on the cane curve just prior to inlet unstart. The distinct feature of the flow is that a sizable reversed flow region existed at the engine face in the upper left position. The Mach numbers reached a maximum of about 0.5 near the bottom of the engine face. The mass-averaged Mach number of the engine face is 0.1744. The total-pressure recoveries range from 0.55 in the reversed flow region to upwards of 0.65 at the bottom of the engine-face. The mass-averaged, total-pressure recovery at the engine face is 0.5664. These mass-averaged quantities are based on integration over the CFD grid and flow field.
0.0
0.1
-0.1
0.2
0.3
0.4
0.5Mavg = 0.1744
0.50.40.30.20.10.0
-0.1
Mach
0.55
0.56
• 0.58
• 0.62
• 0.60
• 0.64
• 0.65REC = 0.5664
0.650.630.610.590.570.55
REC
Figure 19.—Mach number and total-pressure recovery contours at the engine face.
NASA/TM—2010-216362 21
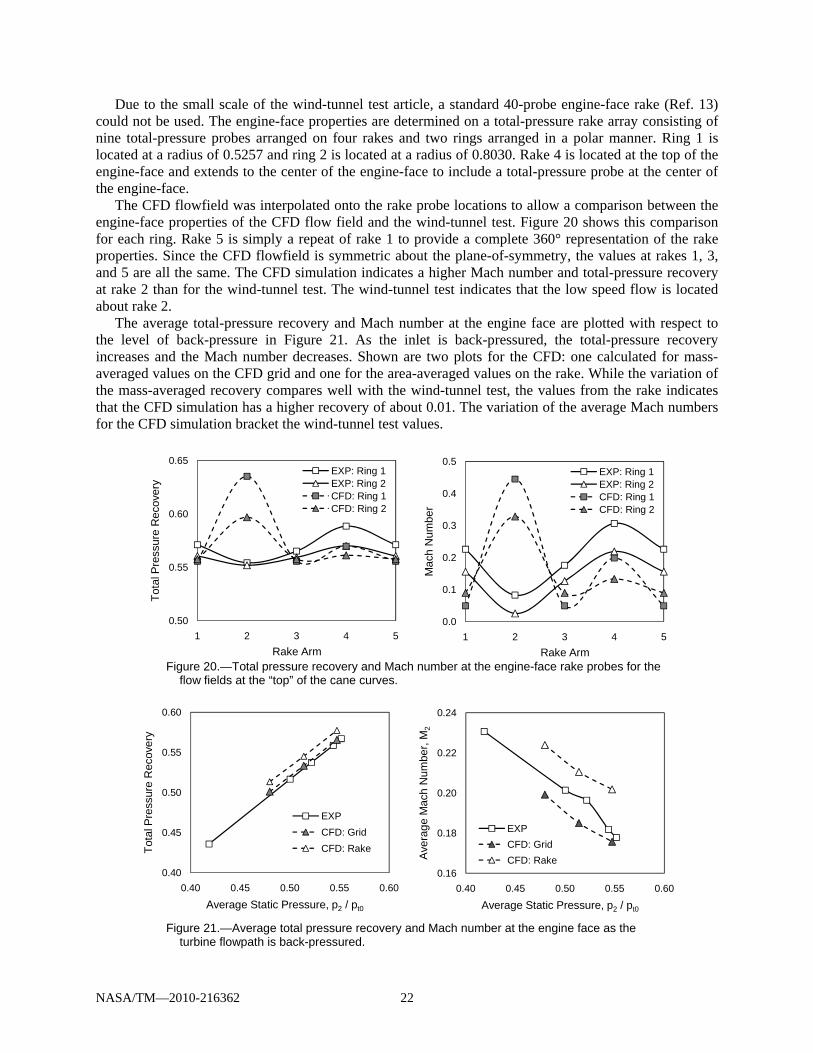
Due to the small scale of the wind-tunnel test article, a standard 40-probe engine-face rake (Ref. 13) could not be used. The engine-face properties are determined on a total-pressure rake array consisting of nine total-pressure probes arranged on four rakes and two rings arranged in a polar manner. Ring 1 is located at a radius of 0.5257 and ring 2 is located at a radius of 0.8030. Rake 4 is located at the top of the engine-face and extends to the center of the engine-face to include a total-pressure probe at the center of the engine-face.
The CFD flowfield was interpolated onto the rake probe locations to allow a comparison between the engine-face properties of the CFD flow field and the wind-tunnel test. Figure 20 shows this comparison for each ring. Rake 5 is simply a repeat of rake 1 to provide a complete 360° representation of the rake properties. Since the CFD flowfield is symmetric about the plane-of-symmetry, the values at rakes 1, 3, and 5 are all the same. The CFD simulation indicates a higher Mach number and total-pressure recovery at rake 2 than for the wind-tunnel test. The wind-tunnel test indicates that the low speed flow is located about rake 2.
The average total-pressure recovery and Mach number at the engine face are plotted with respect to the level of back-pressure in Figure 21. As the inlet is back-pressured, the total-pressure recovery increases and the Mach number decreases. Shown are two plots for the CFD: one calculated for mass-averaged values on the CFD grid and one for the area-averaged values on the rake. While the variation of the mass-averaged recovery compares well with the wind-tunnel test, the values from the rake indicates that the CFD simulation has a higher recovery of about 0.01. The variation of the average Mach numbers for the CFD simulation bracket the wind-tunnel test values.
0.50
0.55
0.60
0.65
1 2 3 4 5
Tota
l Pre
ssur
e R
ecov
ery
Rake Arm
EXP: Ring 1EXP: Ring 2CFD: Ring 1CFD: Ring 2
0.0
0.1
0.2
0.3
0.4
0.5
1 2 3 4
Mac
h N
umbe
r
Rake Arm5
EXP: Ring 1EXP: Ring 2CFD: Ring 1CFD: Ring 2
Figure 20.—Total pressure recovery and Mach number at the engine-face rake probes for the
flow fields at the “top” of the cane curves.
0.40
0.45
0.50
0.55
0.60
0.40 0.45 0.50 0.55 0.60
Tota
l Pre
ssur
e R
ecov
ery
Average Static Pressure, p2 / pt0
EXPCFD: GridCFD: Rake
0.16
0.18
0.20
0.22
0.24
0.40 0.45 0.50 0.55 0.60
Aver
age
Mac
h N
umbe
r, M
2
Average Static Pressure, p2 / pt0
EXPCFD: GridCFD: Rake
Figure 21.—Average total pressure recovery and Mach number at the engine face as the
turbine flowpath is back-pressured.
NASA/TM—2010-216362 22
0.00
0.05
0.10
0.15
0.20
0.25
0.30
0.40 0.45 0.50 0.55 0.60D
isto
rtion
Average Static Pressure, p2 / pt0
EXPCFD: GridCFD: Rake
Figure 22.—Distortion at the engine face.
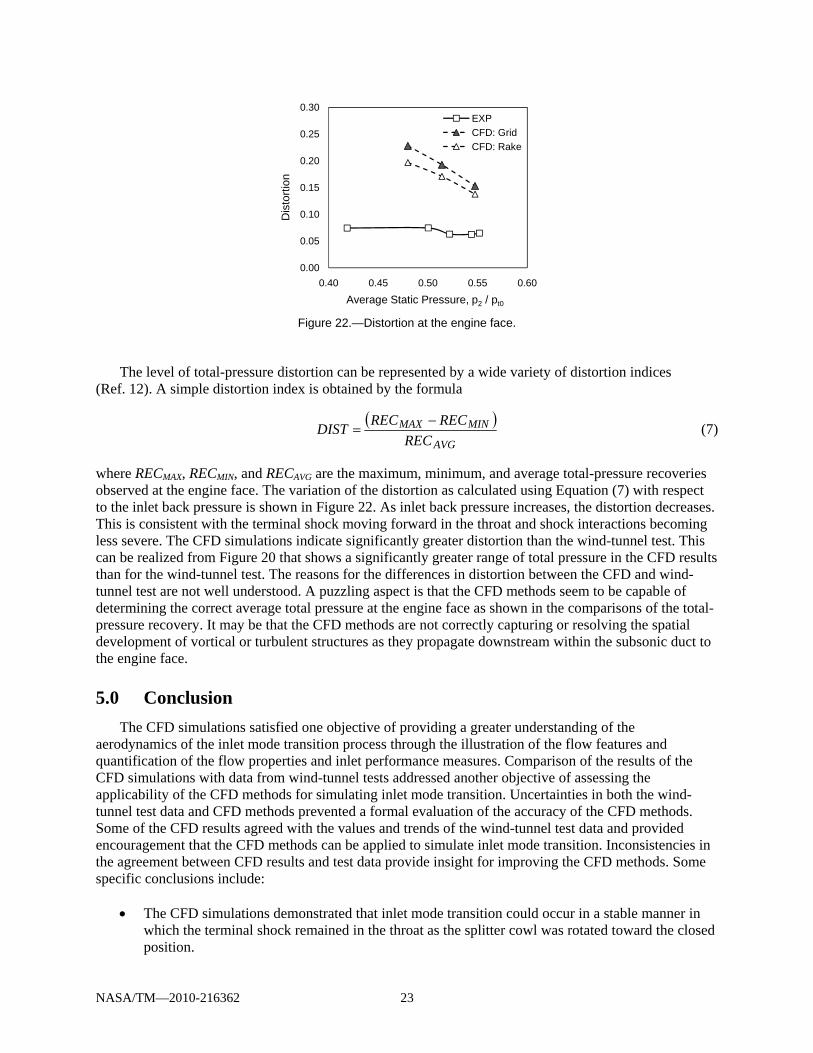
The level of total-pressure distortion can be represented by a wide variety of distortion indices (Ref. 12). A simple distortion index is obtained by the formula
( )AVG
MINMAXREC
RECRECDIST −= (7)
where RECMAX, RECMIN, and RECAVG are the maximum, minimum, and average total-pressure recoveries observed at the engine face. The variation of the distortion as calculated using Equation (7) with respect to the inlet back pressure is shown in Figure 22. As inlet back pressure increases, the distortion decreases. This is consistent with the terminal shock moving forward in the throat and shock interactions becoming less severe. The CFD simulations indicate significantly greater distortion than the wind-tunnel test. This can be realized from Figure 20 that shows a significantly greater range of total pressure in the CFD results than for the wind-tunnel test. The reasons for the differences in distortion between the CFD and wind-tunnel test are not well understood. A puzzling aspect is that the CFD methods seem to be capable of determining the correct average total pressure at the engine face as shown in the comparisons of the total-pressure recovery. It may be that the CFD methods are not correctly capturing or resolving the spatial development of vortical or turbulent structures as they propagate downstream within the subsonic duct to the engine face.
5.0 Conclusion The CFD simulations satisfied one objective of providing a greater understanding of the
aerodynamics of the inlet mode transition process through the illustration of the flow features and quantification of the flow properties and inlet performance measures. Comparison of the results of the CFD simulations with data from wind-tunnel tests addressed another objective of assessing the applicability of the CFD methods for simulating inlet mode transition. Uncertainties in both the wind-tunnel test data and CFD methods prevented a formal evaluation of the accuracy of the CFD methods. Some of the CFD results agreed with the values and trends of the wind-tunnel test data and provided encouragement that the CFD methods can be applied to simulate inlet mode transition. Inconsistencies in the agreement between CFD results and test data provide insight for improving the CFD methods. Some specific conclusions include:
• The CFD simulations demonstrated that inlet mode transition could occur in a stable manner in
which the terminal shock remained in the throat as the splitter cowl was rotated toward the closed position.
NASA/TM—2010-216362 23
• The CFD simulations were able to indicate the performance of the turbine flowpath during the inlet mode transition as measured by the total-pressure recovery and illustrated by the characteristic cane curves. At splitter cowl positions of 0° and –2°, the peak levels of total-pressure recovery matched closely to the data of the wind-tunnel tests with a slight offset in the engine-face flow rate.
• At the splitter cowl position of –2°, the CFD simulations were not able to simulate the “popping” phenomena observed in the wind-tunnel tests. This may be a reflection of the instability of the shock system at these conditions.
• At splitter cowl positions of –4° and –5.7°, the results of the CFD simulations agreed with the lower parts of the cane curves, but the CFD methods indicated inlet unstart at much lower levels of engine-face back pressure and total-pressure recoveries than observed in the wind-tunnel tests.
• The CFD simulations were able to follow the constant corrected flow line through the inlet mode transition. This is important because the inlet mode transition will likely follow a constant corrected flow path.
• The results of the CFD simulations agreed closely with the surface static pressures through the turbine flowpath; however, the pressures at the engine-face were lower than indicated by the wind-tunnel tests. This could be alternatively stated that the CFD simulations indicated a more forward terminal shock position than observed in the wind-tunnel tests for equivalent engine-face static pressures.
• The CFD methods were able to simulate realistic bleed flows with variations of bleed rates over the bleed regions due to shocks and localized injection of flow. Comparisons with the wind-tunnel test data showed some remarkable agreement for bleed rates and bleed plenum static pressures through the inlet mode transition for some of the bleed regions and considerable differences for others. The lack of consistency of the comparisons is of concern and warrants further work in the development of bleed models.
• While the CFD simulations were able to match closely with some of the total-pressure recoveries at the engine face, the distribution of total pressure at the engine face seemed considerably different than observed in the wind-tunnel tests. The CFD simulations indicated a much higher level of total-pressure distortion than observed in the wind-tunnel tests. Further study regarding the CFD methods is needed to understand this inconsistency.
References 1. Bradley, M., Bowcutt, K., McComb, J., Bartolotta, P., and McNelis, N., “Revolutionary Turbine
Accelerator (RTA) Two-Stage-to-Orbit (TSTO) Vehicle Study,” AIAA–2002–3902, July 2002. 2. Bartolotta, P.A., McNelis, N.B., and Shafer, D.G., “High Speed Turbines: Development of a Turbine
Accelerator (RTA) for Space Access,” AIAA–2003–6943, December 2003. 3. Albertson, C.W., Emani, S., and Trexler, C.A., “Mach 4 Test Results of a Dual-Flowpath, Turbine
Based Combined Cycle Inlet,” AIAA–2002–8138, November 2006. 4. Sanders, B.W., and Weir, L.J., “Aerodynamic Design of a Dual-Flow Mach 7 Hypersonic Inlet
System for a Turbine-Based Combined-Cycle Hypersonic Propulsion System,” NASA/CR—2008-215214, 2008.
5. Saunders, J.D., Slater, J.W., Dippold, V., Lee, J., Sanders, B.W., and Weir, L.J., “Inlet Mode Transition Screening Test for a Turbine-Based Combined-Cycle Propulsion System,” JANNAF, May 2008.
6. Mani, M., Cary, A., and Ramakrishnan, S., “A Structured and Hybrid-Unstructured Grid Euler and Navier-Stokes Solver for General Geometry,” AIAA–2004–0524, January 2004.
7. Slater, J.W., “CFD Methods for Computing the Performance of Supersonic Inlets,” AIAA–2004–3404, July 2004.
NASA/TM—2010-216362 24
NASA/TM—2010-216362 25
8. Slater, J.W. and Saunders, J.D, “Modeling of Fixed-Exit Porous Bleed Systems,” AIAA–2008–0094, January 2008.
9. Slater, J.W., “Improvements in Modeling 90-degree Bleed Holes for Supersonic Inlets,” AIAA–2009–0710, January 2009.
10. Mattingly, J.D., Heiser, W.H., and Daley, D.H., Aircraft Engine Design, AIAA, Inc., New York, 1987.
11. Sanders, B. W. and Mitchell, G. A., “Increasing the Stable Operating Range of a Mach 2.5 Inlet,” AIAA–1970–0686, June 1970; Also NASA TM X–52799, June 1970.
12. Goldsmith, E.L., and Seddon, J. ed., Practical Intake Aerodynamic Design, AIAA, Inc., New York, 1993, ch. 2.
13. Society of Automotive Engineers, “Gas Turbine Engine Inlet Flow Distortion Guidelines,” SAE ARP-1420, February 2002.
REPORT DOCUMENTATION PAGE Form Approved OMB No. 0704-0188
The public reporting burden for this collection of information is estimated to average 1 hour per response, including the time for reviewing instructions, searching existing data sources, gathering and maintaining the data needed, and completing and reviewing the collection of information. Send comments regarding this burden estimate or any other aspect of this collection of information, including suggestions for reducing this burden, to Department of Defense, Washington Headquarters Services, Directorate for Information Operations and Reports (0704-0188), 1215 Jefferson Davis Highway, Suite 1204, Arlington, VA 22202-4302. Respondents should be aware that notwithstanding any other provision of law, no person shall be subject to any penalty for failing to comply with a collection of information if it does not display a currently valid OMB control number. PLEASE DO NOT RETURN YOUR FORM TO THE ABOVE ADDRESS. 1. REPORT DATE (DD-MM-YYYY) 01-05-2010
2. REPORT TYPE Technical Memorandum
3. DATES COVERED (From - To)
4. TITLE AND SUBTITLE Computational Fluid Dynamics (CFD) Simulation of Hypersonic Turbine-Based Combined-Cycle (TBCC) Inlet Mode Transition
5a. CONTRACT NUMBER
5b. GRANT NUMBER
5c. PROGRAM ELEMENT NUMBER
6. AUTHOR(S) Slater, John, W.; Saunders, John, D.
5d. PROJECT NUMBER
5e. TASK NUMBER
5f. WORK UNIT NUMBER WBS 599489.02.07.03.02.02
7. PERFORMING ORGANIZATION NAME(S) AND ADDRESS(ES) National Aeronautics and Space Administration John H. Glenn Research Center at Lewis Field Cleveland, Ohio 44135-3191
8. PERFORMING ORGANIZATION REPORT NUMBER E-17298
9. SPONSORING/MONITORING AGENCY NAME(S) AND ADDRESS(ES) National Aeronautics and Space Administration Washington, DC 20546-0001
10. SPONSORING/MONITOR'S ACRONYM(S) NASA
11. SPONSORING/MONITORING REPORT NUMBER NASA/TM-2010-216362
12. DISTRIBUTION/AVAILABILITY STATEMENT Unclassified-Unlimited Subject Category: 07 Available electronically at http://gltrs.grc.nasa.gov This publication is available from the NASA Center for AeroSpace Information, 443-757-5802
13. SUPPLEMENTARY NOTES
14. ABSTRACT Methods of computational fluid dynamics were applied to simulate the aerodynamics within the turbine flowpath of a turbine-based combined-cycle propulsion system during inlet mode transition at Mach 4. Inlet mode transition involved the rotation of a splitter cowl to close the turbine flowpath to allow the full operation of a parallel dual-mode ramjet/scramjet flowpath. Steady-state simulations were performed at splitter cowl positions of 0°, -2°, -4°, and -5.7°, at which the turbine flowpath was closed half way. The simulations satisfied one objective of providing a greater understanding of the flow during inlet mode transition. Comparisons of the simulation results with wind-tunnel test data addressed another objective of assessing the applicability of the simulation methods for simulating inlet mode transition. The simulations showed that inlet mode transition could occur in a stable manner and that accurate modeling of the interactions among the shock waves, boundary layers, and porous bleed regions was critical for evaluating the inlet static and total pressures, bleed flow rates, and bleed plenum pressures. The simulations compared well with some of the wind-tunnel data, but uncertainties in both the wind-tunnel data and simulations prevented a formal evaluation of the accuracy of the simulation methods. 15. SUBJECT TERMS Supersonic inlets; Hypersonic inlets
16. SECURITY CLASSIFICATION OF: 17. LIMITATION OF ABSTRACT UU
18. NUMBER OF PAGES
31
19a. NAME OF RESPONSIBLE PERSON STI Help Desk (email:[email protected])
a. REPORT U
b. ABSTRACT U
c. THIS PAGE U
19b. TELEPHONE NUMBER (include area code) 443-757-5802
Standard Form 298 (Rev. 8-98)Prescribed by ANSI Std. Z39-18