Received 26th August 2019Accepted 1st October 2019
DOI: 10.1039/c9ra06706j
rsc.li/rsc-advances
32034 | RSC Adv., 2019, 9, 32034–320
uid dynamics simulation as a toolfor optimizing the hydrodynamic performance ofmembrane bioreactors
Yan Jin,a Cheng-Lin Liu, *ab Xing-Fu Song ab and Jian-Guo Yu*ab
The hydrodynamic properties and shear stresses experienced by a membrane bioreactor (MBR) are directly
related to its rate of membrane fouling. In this study, computational fluid dynamic models have been
combined with cold model PIV experimental studies to optimize the performance properties of MBRs.
The effects of membrane module height, number of aeration tubes and membrane spacing on liquid
phase flow rates, gas holdup and shear stresses at the membrane surface have been investigated. It has
been found that optimal MBRs experience the greatest shear forces on their surfaces at a distance of
250 mm from the aeration tube, around the 7 aeration tubes used to introduce gas and at the 40 mm
spacings between the membrane sheets. Use of an aeration intensity of between 0.02 and 0.47
m3 min�1 generated shear stresses that were 50–85% higher than the original MBR for the same aeration
intensity, thus affording optimal membrane performance that minimizes membrane fouling.
1 Introduction
Membrane bioreactor (MBR) technology has been used for themembrane ltration of activated sludge for wastewater treat-ment to produce high effluent quality with a small environ-mental footprint.1–3 However, problems associated withmembrane fouling constitute a major drawback for the use ofMBRs in waste water treatment plants. Aerated membranetanks can be used for fouling control, however use of thesemembrane systems involves high energy consumption.4–6 Thestructure of MBR directly affects their ow characteristics, with‘good gas–liquid’ interactions at the surface of the membranereducing the probability that membrane fouling will occur. Forexample, Liu et al.7 incorporated a baffle into an MBR, whichimproved the uid circulating ow rates at the membranesurface and reduced membrane fouling rates. The compactdesign of MBR membranes means that they are difficult toaccess to accurately obtain velocity distribution values withinthe reactor in real-time, which can make design/optimizationstudies difficult. Therefore, computational uid dynamic(CFD) calculations provide an opportunity to quantify ow elddistribution values in MBRs that cannot be detected experi-mentally.8–11 Consequently, numerical methods have beendeveloped that enable ow rates in aerated membrane ltrationprocesses to be predicted accurately.12–15 Yang et al.16 used CFD
tegrated Utilization of Salt Lake Resource,
ology, Shanghai 200237, China. E-mail:
n
ter for Ministry of Education, East China
hai, China
46
model for the cost-effective optimization of MBR and the modelfurther revealed that the high nitrogen removal efficiency(>90%) was achieved due to the high recirculation ratio drivenby airli force without destroying the oxygen deprivation andenrichment in the anoxic and oxic zone, respectively. Ndinisaet al.17 used CFD to simulate gas–liquid two-phase ow inimmersed at membrane MBRs to predict gas phase velocities,liquid phase velocities and membrane surface shear stressvalues during aeration. Brannock et al.18,19 used CFD to inves-tigated the effects of aeration and membrane congurationsuch as size and position of inlets, baffles, or membraneorientation on the overall membrane performance. However,MBR hollow ber membrane model contains large numbers ofmembrane laments that adopt a uid–solid coupling stateduring ltration that increases the difficulty of producingaccurate calculations. Wang et al.20 used an alternative porousmedium in their MBR calculation model to develop a methodbased on experimental determination of the resistance coeffi-cient of the uid owing through the hollow ber membrane.This porous medium model was coupled with a 3D multiphasemodel to improve the accuracy of the calculations used. Zamaniet al.21 developed a uid–solid coupling model based on uidand structural mechanic governing equations, which predictedthat enhanced vibrational shear forces are effective for reducingmembrane fouling. Wang et al.22 developed amodel coupled theNavier–Stokes and Darcy Brinkman equations to simulatea complete ltration run. Radaei et al.23 developed a 3D CFDmodel to the study shear stress induced by spherical capbubbles in hollow bre membrane modules.
Aer several decades of development, Particle Image Veloc-imetry (PIV) is now recognized as a mature technology for 2D
Fig. 1 Effect of grid independence on simulation results for differentmesh sizes.
Paper RSC Advances
Ope
n A
cces
s A
rtic
le. P
ublis
hed
on 0
9 O
ctob
er 2
019.
Dow
nloa
ded
on 3
/1/2
022
7:08
:46
AM
. T
his
artic
le is
lice
nsed
und
er a
Cre
ativ
e C
omm
ons
Attr
ibut
ion-
Non
Com
mer
cial
3.0
Unp
orte
d L
icen
ce.
View Article Online
ow eld measurement. For example, PIV is widely usedthroughout the chemical industry for the study of ow elddistributions in stirred tank reactors,24 at gas-evolving elec-trodes,25 in bubble columns26 and at sheet MBR.27 Forexample, Liu et al.28 have used PIV to investigate the hydrody-namic characteristics of two-phase ow elds at gas-evolvingelectrodes, whilst Leslie et al.29 used PIV to determine the owstates in an aerated bench scale MBR.
This study has used CFD to improve the hydrodynamics ofMBR through modication of their structures, including an
Fig. 2 Schematic of the experimental setup that was modeled in this st
examination of the effects of changing the height of themembrane, the number of aeration tubes and membranespacings. The mathematical models developed have been vali-dated through cold testing experiments using PIV technology.Finally, the hydrodynamic characteristics of standard andoptimized MBR have been measured under different gas owrate to evaluate their comparative efficiencies.
2 Simulation procedures
Gas–liquid two-phase or gas–liquid–solid three-phase ow model-ling approaches have been used to optimise the performance ofvarious types of sewage treatment and chemical reactors.30 MBRsare oenmodelled as a three-phasemixing system, with water usedas the continuous phase and air and sludge treated as a dispersedphase. Sludge distribution is relatively uniform because its densityis close to that of water, so they can be combined into a continuousphase and treated as a two-phase system.
Two different approaches have been developed to simulatemultiphase ow, based on Lagrangian or Eulerian models.31
The former method employs liquid as the continuous phaseand bubbles considered as the discrete phase, which enablesmotion trajectories to be tracked in each discrete phase. Thelatter method considers the two phases to be a continuousphase that coexist at the same spatial point, thus enablingprocesses to be modelled using their respective momentum,mass, and energy transfer equations. The aeration tube airotation design used in MBR systems generates a large numberof bubbles, with large computational resources required to
Fig. 3 Comparison of time-averaged velocities for different lines(generated using PIV techniques) with the mathematical model foraeration and liquid level heights of (a) 9 L min�1, 50 cm, (b) 3 L min�1,
RSC Advances Paper
Ope
n A
cces
s A
rtic
le. P
ublis
hed
on 0
9 O
ctob
er 2
019.
Dow
nloa
ded
on 3
/1/2
022
7:08
:46
AM
. T
his
artic
le is
lice
nsed
und
er a
Cre
ativ
e C
omm
ons
Attr
ibut
ion-
Non
Com
mer
cial
3.0
Unp
orte
d L
icen
ce.
View Article Online
model the motion of each bubble. Consequently, the focus ofthis study concentrated on modelling the macroscopic ow ofthe continuous phase, rather than the motion trajectories ofindividual bubbles. Therefore, a Eulerian model incorporatinga standard k–epsilon analysis has been used to describe theturbulent ow of the uid in the MBR. The complex uid ow inthe MBR means that not all factors could be calculated, and sothe following simplications were incorporated into thenumerical model used:
(1) The material properties in the MBR remained unchangedthroughout the analysis, with the liquid phase considered to beincompressible and conforming to Newtonian principles.
(2) No bubble coalescence or break-up was considered tooccur, with bubble diameters remaining constant over thecourse of the simulation process.
(3) No mass exchange between the gas and liquid phases wasconsidered to occur.
Base on these assumptions, the volume fractions of the gasand liquid phases in the Euler–Euler model used were set to 4l
and 4g, respectively. Continuity equations were developedindependently for both phases, without the need to include anadditional mass-transfer term.32
vðfkrkÞvt
þ VðfkrkukÞ ¼ 0 k ¼ l; g (1)
4l ¼ 1 � 4g (2)
Compared with turbulent viscous stress, the effect ofmolecular viscous stress on the two phases was considered to benegligible with the momentum equation written as follows.33
vðfkrkukÞvt
þ VðfkrkukulÞ ¼ �fkVpþ V�fkT
turbk
�þ fkrkg þ Fb
k ¼ l; g
(3)
where u is velocity (m s�1), p is pressure (Pa), r is density (kgm�3), g is the gravity vector (m s�2), Fb is the additional volumeforce (N m�3), Tk
turb is the turbulent stress tensor (N m�3).The stress tensor used was described as follows:
T turbk ¼ �meff ; k
�Vuk þ ðVukÞT � 2
3IðVukÞT
�; (4)
where meff,k is the effective viscosity, and I denote the identitytensor. For the liquid phase, the effective viscosity is the sum ofthe dynamic viscosity mL,k and the turbulent viscosity mT,k,
meff,k ¼ mL,k + mT,k. (5)
In this case, the turbulence properties, including theturbulent kinetic energy k (m2 s�2) and the dissipation rate ofturbulent kinetic energy 3 (m s�3) were solved using a multi-phase k–3 model.
Additional volume forces that act on the bubbles are dragforces, li forces and virtual mass forces, however, the magni-tude of the li and virtual mass forces are relatively small incomparison to the drag forces. Dıaz et al.34 have shown that
32036 | RSC Adv., 2019, 9, 32034–32046
inclusion of virtual mass forces does not signicantly effectcalculations, whilst Sokolichin and Eigenberger32 have shownthat inclusion of li forces is not relevant without clear exper-imental evidence of their direction and magnitude. Therefore,only the effect of drag forces on the BMR model was consideredin this study, with the drag force dened as,
FD ¼ �3
4
�fgflrl
�CD
db|ul � ug |
�ul � ug
�(6)
where db is the bubble diameter (m), CD is the drag coefficientwhich was dened mathematically using semi-empiricalmethods. Evaluation of the drag coefficient required consider-ation of the bubble Reynolds number (Reb), whose value isbased on the slip velocity of a single bubble in the uid.Extensive results on drag coefficient values have been reported
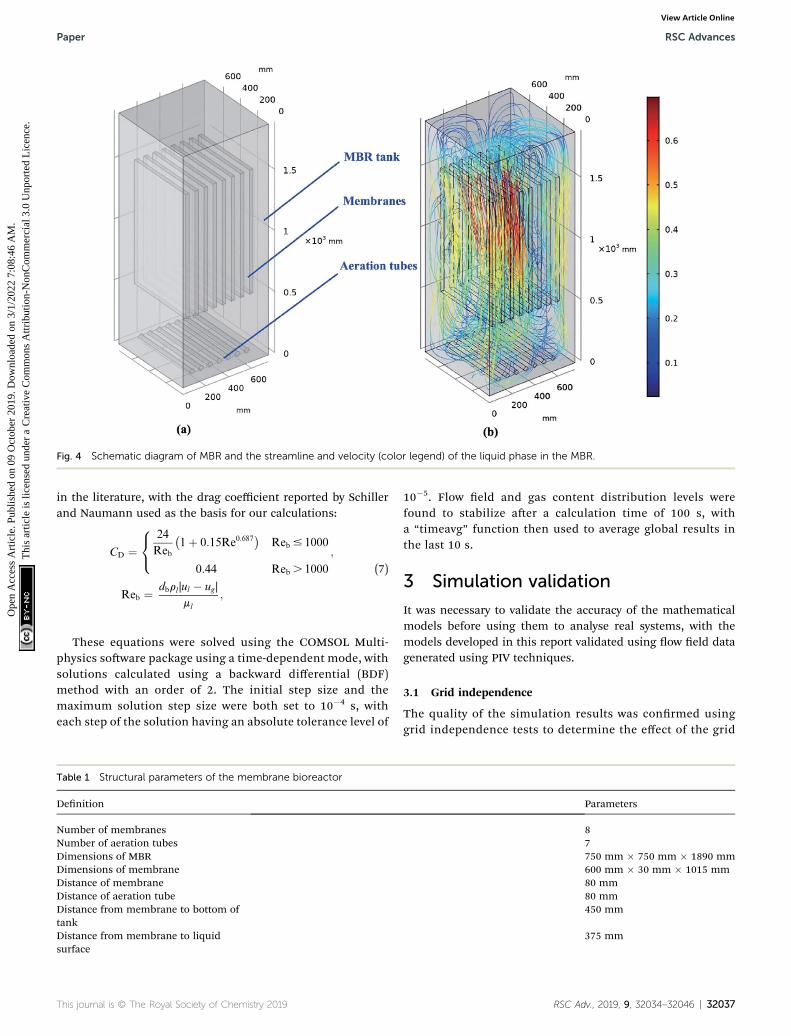
Fig. 4 Schematic diagram of MBR and the streamline and velocity (color legend) of the liquid phase in the MBR.
Paper RSC Advances
Ope
n A
cces
s A
rtic
le. P
ublis
hed
on 0
9 O
ctob
er 2
019.
Dow
nloa
ded
on 3
/1/2
022
7:08
:46
AM
. T
his
artic
le is
lice
nsed
und
er a
Cre
ativ
e C
omm
ons
Attr
ibut
ion-
Non
Com
mer
cial
3.0
Unp
orte
d L
icen
ce.
View Article Online
in the literature, with the drag coefficient reported by Schillerand Naumann used as the basis for our calculations:
CD ¼8<:
24
Reb
�1þ 0:15Re0:687
�Reb # 1000
0:44 Reb . 1000
;
Reb ¼ dbrl |ul � ug |
ml
;
(7)
These equations were solved using the COMSOL Multi-physics soware package using a time-dependent mode, withsolutions calculated using a backward differential (BDF)method with an order of 2. The initial step size and themaximum solution step size were both set to 10�4 s, witheach step of the solution having an absolute tolerance level of
Table 1 Structural parameters of the membrane bioreactor
Denition
Number of membranesNumber of aeration tubesDimensions of MBRDimensions of membraneDistance of membraneDistance of aeration tubeDistance from membrane to bottom oftankDistance from membrane to liquidsurface
10�5. Flow eld and gas content distribution levels werefound to stabilize aer a calculation time of 100 s, witha “timeavg” function then used to average global results inthe last 10 s.
3 Simulation validation
It was necessary to validate the accuracy of the mathematicalmodels before using them to analyse real systems, with themodels developed in this report validated using ow eld datagenerated using PIV techniques.
3.1 Grid independence
The quality of the simulation results was conrmed usinggrid independence tests to determine the effect of the grid
Parameters
87750 mm � 750 mm � 1890 mm600 mm � 30 mm � 1015 mm80 mm80 mm450 mm
size. An unstructured tetrahedral grid was used in themodel, with the grid size being reduced from 250 mm to60 mm and the corresponding grid numbers increased from3.6 � 103 to 1.8 � 104.
As shown in Fig. 1, the MBR numerical model reveals thatdifferent grid sizes produce large differences in uid ow rates,with velocity distribution points tending to be stable for gridsizes between 20 and 25 mm. As a result, an unstructured
Fig. 5 Distribution of mean liquid phase velocities and gas volume fractio400 mm; (b) gas volume fractions for y ¼ 400 mm; (c) liquid phase velo
32038 | RSC Adv., 2019, 9, 32034–32046
tetrahedral grid size of 25 mm was selected for all subsequentsimulations, which generated acceptable accuracy levels formanageable computational times.
3.2 PIV experiments
Numerical accuracy levels were veried using a cold model ofMBR with aeration and liquid level heights of 9 L min�1 and
ns for y ¼ 400 mm and x ¼ 400 mm. (a) liquid phase velocities for y ¼cities for x ¼ 400 mm; (d) gas volume fractions for x ¼ 400 mm.
50 cm and 3 Lmin�1 and 46 cm, 15 Lmin�1, respectively. Liquidphase velocity distributions were compared for a range of x¼ 0–98 mm, y ¼ 150 mm and z ¼ 375 mm. The equipment and thecorresponding model used for simulation experiments areshown in Fig. 2, with uid motions measured using PIV tech-niques. The PIV measurement was conducted using a doublepulsed Nd:YAG laser of 532 nm wavelength, and maximumenergy of 100 mJ per pulse (Continuum Inc., USA). The laserbeam was passed through an optical arrangement consisting ofcylindrical and spherical lenses, which generated a laser sheetwith a thickness of 1 mm. The images were acquired by a singleframe-straddling digital CCD camera (PowerView Plus, TSI Inc.,USA) at a resolution of 2048 � 2048 pixels, which was posi-tioned perpendicular to the plane of the light sheet in the glasstank. Frame and laser sequencing were controlled by a Laserpulse 610035 synchronizer (TSI Inc., USA). For all images
Fig. 6 Distribution of mean liquid phase velocities and gas volume fracti250 mm; (b) 350 mm; (c) 450 mm; (d) 550 mm; (e) 650 mm.
processing in TSI Insight 4G soware, the interrogation area(IA) was 64 � 64 pixels, with 50% overlap. A range lter wasimplemented to the raw data to remove obvious spuriousvectors. The ow characteristics of gas–liquid two-phase ow inthis MBR study were instantaneous, with error curves deter-mined for 500 PIV images (three times averaged) for each set ofexperimental conditions.
The results of this modelling study are shown in Fig. 3,with the ow rates generated from experimental and calcu-lated showing large gaps at two sides of the membrane wall(boundary condition set at u ¼ 0 m s�1). The velocitydistribution of the wall boundary could not be measuredexperimentally, however modelling predictions agreed wellwith previously determined experimental values, thus indi-cating that the numerical model has good reliability over theow range tested.
ons at y ¼ 400 mm planes for different membrane module heights: (a)
4 Results and discussion4.1 Experimental apparatus
MBRs are usually prepared from the combination ofmembranes sheets which simplies their industrial production,with this paper employing CFD studies to model uid dynamicsof this type of MBR tted with a series of aeration tubes ina membrane tank lled with aqueous media (see Fig. 4). Thegeometrical dimensions of the computed model were
Fig. 7 Distribution of mean liquid phase velocities and gas volume fractiomm; (b) 350 mm; (c) 450 mm; (d) 550 mm; (e) 650 mm.
32040 | RSC Adv., 2019, 9, 32034–32046
established according to the structure of the MBRs that wereavailable, whose detailed structural parameters are reported inTable 1.
4.2 Hydrodynamic characteristics of the MBR
The densities and viscosities of the bubbles and water in thesystem were set at 1.22 kg m�3 and 1.75 � 10�5 kg m�1 s�1,and 998.06 kg m�3 and 1.00 � 10�3 kg m�1 s�1, respectively.The initial conditions used to generate the MBR model were:
ns at z¼ 1000mmwith different membranemodule heights of: (a) 250
aeration volume of 1.7 m3 min�1, bubble size of 1 mm,membrane module height of 450 mm, 7 aeration tubes, withmembrane spacings of 5 mm. The overall state of the liquidowing throughout the MBR is shown in Fig. 4.
Fig. 5(a) shows the distribution of the mean liquid phasevelocities and gas volumes fraction in the center section (y ¼400) of the MBR reactor, which reveals a maximum ow rateof 0.74 m s�1 in the centers of the channels between themembranes. The uid ows from the channel to the liquidsurface from the le and right sides of the membrane plate,forming two le and right cycles at their cross-section.Similar velocity proles are obtained by the experiments ofLiu et al.35 Fig. 5(b) shows a cloud plot of the average gasholdup distribution at the same position in the MBRreactor, with bubbles accumulating at the lower edge of theaeration tube with a gas content of up to 17%. The gas phase(with a gas content of around 5%) is evenly distributedbetween the membrane plates, with Fig. 5(c) and (d)showing the average velocity and average gas fractiondistribution in the side section (x ¼ 400) of the MBR. Inaddition to the aeration tubes, the gas holdup is mainlyconcentrated between the membrane plates, with gasholdup rates lower and unevenly distributed in other places.The distribution of gas content on both sides of the moduleis relatively low, which is not ideal for washing precipitatedpollutants away from the surface of the membrane toprevent its blocking.
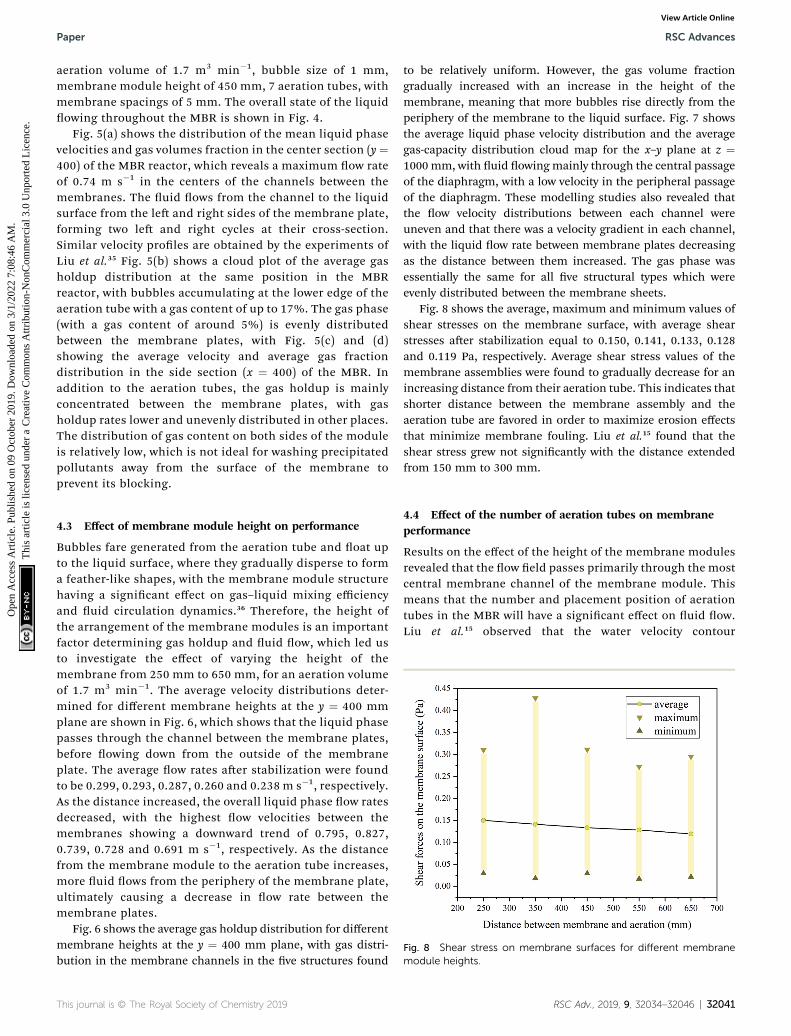
Fig. 8 Shear stress on membrane surfaces for different membranemodule heights.
4.3 Effect of membrane module height on performance
Bubbles fare generated from the aeration tube and oat upto the liquid surface, where they gradually disperse to forma feather-like shapes, with the membrane module structurehaving a signicant effect on gas–liquid mixing efficiencyand uid circulation dynamics.36 Therefore, the height ofthe arrangement of the membrane modules is an importantfactor determining gas holdup and uid ow, which led usto investigate the effect of varying the height of themembrane from 250 mm to 650 mm, for an aeration volumeof 1.7 m3 min�1. The average velocity distributions deter-mined for different membrane heights at the y ¼ 400 mmplane are shown in Fig. 6, which shows that the liquid phasepasses through the channel between the membrane plates,before owing down from the outside of the membraneplate. The average ow rates aer stabilization were foundto be 0.299, 0.293, 0.287, 0.260 and 0.238 m s�1, respectively.As the distance increased, the overall liquid phase ow ratesdecreased, with the highest ow velocities between themembranes showing a downward trend of 0.795, 0.827,0.739, 0.728 and 0.691 m s�1, respectively. As the distancefrom the membrane module to the aeration tube increases,more uid ows from the periphery of the membrane plate,ultimately causing a decrease in ow rate between themembrane plates.
Fig. 6 shows the average gas holdup distribution for differentmembrane heights at the y ¼ 400 mm plane, with gas distri-bution in the membrane channels in the ve structures found
to be relatively uniform. However, the gas volume fractiongradually increased with an increase in the height of themembrane, meaning that more bubbles rise directly from theperiphery of the membrane to the liquid surface. Fig. 7 showsthe average liquid phase velocity distribution and the averagegas-capacity distribution cloud map for the x–y plane at z ¼1000 mm, with uid owing mainly through the central passageof the diaphragm, with a low velocity in the peripheral passageof the diaphragm. These modelling studies also revealed thatthe ow velocity distributions between each channel wereuneven and that there was a velocity gradient in each channel,with the liquid ow rate between membrane plates decreasingas the distance between them increased. The gas phase wasessentially the same for all ve structural types which wereevenly distributed between the membrane sheets.
Fig. 8 shows the average, maximum and minimum values ofshear stresses on the membrane surface, with average shearstresses aer stabilization equal to 0.150, 0.141, 0.133, 0.128and 0.119 Pa, respectively. Average shear stress values of themembrane assemblies were found to gradually decrease for anincreasing distance from their aeration tube. This indicates thatshorter distance between the membrane assembly and theaeration tube are favored in order to maximize erosion effectsthat minimize membrane fouling. Liu et al.15 found that theshear stress grew not signicantly with the distance extendedfrom 150 mm to 300 mm.
4.4 Effect of the number of aeration tubes on membraneperformance
Results on the effect of the height of the membrane modulesrevealed that the ow eld passes primarily through the mostcentral membrane channel of the membrane module. Thismeans that the number and placement position of aerationtubes in the MBR will have a signicant effect on uid ow.Liu et al.15 observed that the water velocity contour
Fig. 9 Distribution of mean liquid phase velocities and gas volume fraction for different numbers of aerating tubes: (a) 1; (b) 3; (c) 7.
RSC Advances Paper
Ope
n A
cces
s A
rtic
le. P
ublis
hed
on 0
9 O
ctob
er 2
019.
Dow
nloa
ded
on 3
/1/2
022
7:08
:46
AM
. T
his
artic
le is
lice
nsed
und
er a
Cre
ativ
e C
omm
ons
Attr
ibut
ion-
Non
Com
mer
cial
3.0
Unp
orte
d L
icen
ce.
View Article Online
distributed in parallel arrangements (pipes under themembranes and between adjacent membranes) was muchmore even than that of perpendicular arrangement.
32042 | RSC Adv., 2019, 9, 32034–32046
Therefore, the model with the performance of MBRs con-taining aeration tube numbers of 1, 3 and 7 investigated fora gas ow rate of 1.7 m3 min�1.
Fig. 10 Mean liquid phase velocity distributions at y¼ 375mm and z¼1000 mm for different numbers of aerating tubes. Fig. 12 Shear stress at membrane surfaces for different numbers of
aerating tubes.
Paper RSC Advances
Ope
n A
cces
s A
rtic
le. P
ublis
hed
on 0
9 O
ctob
er 2
019.
Dow
nloa
ded
on 3
/1/2
022
7:08
:46
AM
. T
his
artic
le is
lice
nsed
und
er a
Cre
ativ
e C
omm
ons
Attr
ibut
ion-
Non
Com
mer
cial
3.0
Unp
orte
d L
icen
ce.
View Article Online
Distributions of mean liquid phase velocities and gasvolume fractions for different numbers of aeration tubes onthe y ¼ 400 mm plane are shown in Fig. 9. The average ow
Fig. 11 Distribution of mean liquid phase velocities and gas volume fract(c) 7.
rates aer stabilization were 0.155, 0.162 and 0.287 m s�1,respectively, which indicates that the overall ow rate of theliquid phase for multiple aeration tubes is increased. The
ions at z ¼ 1000 mm for different numbers of aerator tubes: (a) 1; (b) 3;
highest ow velocities between the membranes showeda downward trend of 0.617, 0.451 and 0.738 m s�1, respec-tively. A reactor tted with a single aeration tube results ingas being concentrated in the channel directly above theaeration tube, whilst use of three aeration tubes results ina more uniform ow velocity distribution between thechannels. The average gas holdup of the three modelsinvestigated was 0.35%, 1.25%, and 2.66%, respectively, withthe gas content in the MBR gradually increasing andbecoming more uniformly distributed as the number ofaeration tubes increased.
Fig. 10 shows the velocity prole at the MBR centerline (y¼ 375 mm and z ¼ 1000 mm), with 7 aeration tubes affordinga higher velocity in almost every channel, three aerationtubes giving the most uniform ow velocity distribution;and one aeration tube resulting in the greatest differences inow velocities between channels.
The distribution of mean liquid phase velocities and gasvolume fractions for different numbers of aerating tubes at z¼ 1000 mm is shown in Fig. 11, with their liquid phasesowing mainly from the center of the membrane plate, withlow ow velocities in the peripheral passage of the
Fig. 13 Distribution of mean liquid phase velocities and gas volume fract(c) 50 cm, (d) 60 cm, (e) 70 cm, (f) 80 cm.
32044 | RSC Adv., 2019, 9, 32034–32046
membrane module. The ow velocity was higher in themiddle of the channel, while a boundary layer with muchlower velocity existed near the membrane surface. The non-uniformity of gas–liquid ow in channels between twomembranes was also found by Zhang et al.11 Fluid owedthrough the central member channel of the MBR tted withonly one aeration tube, thus indicating that ow velocitydistribution between the channels was non-uniform andthat signicant velocity gradients were present. However,the gas content in the MBR tted with seven aeration tubeswas much higher are more uniformly distributed, indicatinga more optimal design.
Fig. 12 shows the average, maximum, and minimum shearstress values at the membrane surface for aeration tubenumbers of 1, 3, and 7, respectively, with average values aerstabilization increasing from 0.062 through 0.072 to 0.133 Pa,respectively.
4.5 Effect of membrane spacing
Membrane spacing is an important factor affecting uidow between membrane sheets, and so the effect ofincreasing membrane distances from 30 to 80 cm on the
ions for different membrane separation distances: (a) 30 cm, (b) 40 cm,
Fig. 15 Comparison of the shear forces experienced by membranesystems for different gas flow rates.
Paper RSC Advances
Ope
n A
cces
s A
rtic
le. P
ublis
hed
on 0
9 O
ctob
er 2
019.
Dow
nloa
ded
on 3
/1/2
022
7:08
:46
AM
. T
his
artic
le is
lice
nsed
und
er a
Cre
ativ
e C
omm
ons
Attr
ibut
ion-
Non
Com
mer
cial
3.0
Unp
orte
d L
icen
ce.
View Article Online
ow velocity distribution investigated. The distribution ofmean liquid phase velocities and gas volume fractions fordifferent membrane spacings at the y ¼ 400 mm plane areshown in Fig. 13. In all congurations, the liquid phasepasses through the middle of the membrane, before reach-ing the liquid level and owing downwards. The average owrates aer stabilization were found to be 0.262, 0.276, 0.287,0.257, 0.288 and 0.311 m s�1, respectively. The ow ratesrange is simular to the model in the study of Wu et al.10 Asthe distance from the membrane module to the aerationtube increased, then the overall ow rate of the liquid phasedecreases, with gas distribution levels found to be uniformfor all ve models, resulting in gas content levels of 3.42%,2.94%, 2.66%, 2.47%, 2.18%, and 1.91%, respectively.Increasing the spacing between the membranes resulted ingas holdup between the membranes gradually decreasing.When the membrane spacing was 30 cm, then the gasaccumulates under the membrane because it cannot passsmoothly through the membrane channels. This results inthe membrane channel being easily blocked, thus prevent-ing further uid ow through the channel.
Fig. 14 shows the average shear stress, maximum shearstress and minimum shear stress of the membrane surfacefor different membrane spacings, with the average shearstress aer stabilization found to be 0.038, 0.181, 0.133,0.026, 0.085, and 0.087 Pa, respectively. The average shearstress on the membrane surface reached a maximum whenthe membrane spacing was set at 40 mm.
4.6 Hydrodynamic characteristics of an optimized MBR
Increasing gas ow rates is the simplest way to increase aerationintensity levels, however increasing gas ow rates also result inincreased energy consumption. A previous study on MBRstructures revealed that a distance of 250 mm between themembrane and aeration tube was optimal, with our studyshowing that an aeration tube number of 7 and membrane
Fig. 14 Shear stresses of membrane surfaces for different separationdistances.
spacing of 40 mm was optimal for inducing the highest shearstress. The effect of gas ow rates from 0.2, 0.7, 1.7, 2.7, 3.7 to4.7 m3 min�1 on uid ow in MBR were then investigated, withFig. 15 showing shear stresses at membrane surfaces before andaer optimization of gas ow rates. The shear stress of themembrane surface increased for increasing gas ow rates, withthe shear stress at an optimized membrane surface beingincreased from 0.004 to 0.138 Pa for an aeration volume of 0.57m3 min�1. Average ow velocities decreased rapidly for largerrates of aeration, indicating that the gas content in themembrane plate channel rises sharply, resulting in access of theliquid phase to the membrane surface being hindered.
When the gas ow rate was 1.7 m3 min�1, the membranesurface shear stress levels of the optimized membrane structurewas increased from 0.133 to 0.209 Pa, which corresponds to anoverall increase of 57%. When the aeration volume was increasedto 4.7 m3 min�1, then the shear stress of the optimized structurewas increased from 0.187 to 0.343 Pa, which corresponds to an83% increase. In the case of Liu et al.,15 the shear stress increase82% with the aeration intensity increase 150%. When the aerationintensity was from 0.02 to 4.7 m3 min�1, the optimized cell whichcan save 57–69% of energy consumption than of original cell.These results show that the shear force on the surface ofmembrane can be signicantly improved by optimizing themembrane structure and aeration ow rates.
5 Conclusions
It is difficult to study structurally complicated MBR structuresusing real-time measurements and so this study has combinedCFD numerical calculations and MBR cold model experimentalmodels to carry out optimization studies on MBRs. Thesestudies have revealed the following results:
(1) A two-phase gas–liquid ow model can be used to effec-tively simulate MBR performance, with cold model experimentsthat employ PIV techniques used to generate experimental data
to validate the results produced by the computational model.Our two-phase simulation studies showed good agreement withexperimental results, thus establishing the reliability of thenumerical model for MBR optimization studies.
(2) The validated CFD simulation model was used to simu-late the effects of varying membrane module height, number ofaeration tubes and membrane spacing on liquid phase owrates, gas holdups and shear stresses of the performance of themembrane surfaces within MBRs.
(3) An optimal design was identied based on an MBR con-taining 40 mm spacings between membranes and the use of 7aerating tubes to introduce gas into the system. This designresulted in the largest shearing force being generated at thebottom of the membrane module at a distance of 250 mm fromthe aeration tube. Use of an aeration intensity of 0.02–0.47m3 min�1 in an optimal MBR resulted in shear stress levels thatwere 50–85% greater than those generated in a standard MBRsystem, meaning that the optimal MBR is much less likely tobecome blocked under these operating conditions.
Conflicts of interest
There are no conicts to declare.
Acknowledgements
We acknowledge the nancial support provided by the NationalNatural Science Foundation of China (Grant 21206038).
References
1 T. Melin, B. Jefferson, D. Bixio, C. Thoeye, W. De Wilde, J. DeKoning, J. van der Graaf and T. Wintgens, Desalination, 2006,187, 271–282.
2 M. Aslam, A. Char, G. Lesage, M. Heran and J. Kim, Chem.Eng. J., 2017, 307, 897–913.
3 A. Drews, J. Membr. Sci., 2010, 363, 1–28.4 F. Meng, S.-R. Chae, A. Drews, M. Kraume, H. S. Shin andF. Yang, Water Res., 2009, 43, 1489–1512.
5 K. Kimura, N. Yamato, H. Yamamura and Y. Watanabe,Environ. Sci. Technol., 2005, 39, 6293–6299.
6 P. Le-Clech, V. Chen and T. A. G. Fane, J. Membr. Sci., 2006,284, 17–53.
7 R. Liu, X. Huang, C. Wang, L. Chen and Y. Qian, ProcessBiochem., 2000, 36, 249–254.
8 Z. Trad, C. Vial, J. P. Fontaine and C. Larroche, Chem. Eng. J.,2015, 282, 77–90.
9 C.-L. Liu, Q.-W. Zhao, Z. Sun, G.-M. Lu and J.-G. Yu, Arabian J.Sci. Eng., 2018, 43, 5965–5976.
10 Q. Wu, X. Yan, K. Xiao, J. Guan, T. Li, P. Liang and X. Huang,Bioresour. Technol., 2018, 249, 402–409.
32046 | RSC Adv., 2019, 9, 32034–32046
11 Z. Qing, X. Rongle, Z. Xiang and F. Yaobo, Water Sci.Technol., 2014, 69, 1846–1852.
12 W. Naessens, T. Maere and I. Nopens, Bioresour. Technol.,2012, 122, 95–106.
13 W. Naessens, T. Maere, N. Ratkovich, S. Vedantam andI. Nopens, Bioresour. Technol., 2012, 122, 107–118.
14 M. Yang, D. Yu, M. Liu, L. Zheng, X. Zheng, Y. Wei, F. Wangand Y. Fan, Bioresour. Technol., 2017, 227, 102–111.
15 M. Liu, M. Yang, M. Chen, D. Yu, J. Zheng, J. Chang,X. Wang, C. Ji and Y. Wei, Bioresour. Technol., 2018, 269,300–308.
16 M. Yang, Y. Wei, X. Zheng, F. Wang, X. Yuan, J. Liu, N. Luo,R. Xu, D. Yu and Y. Fan, Bioresour. Technol., 2016, 219, 566–575.
17 N. V. Ndinisa, A. G. Fane, D. E. Wiley and D. F. Fletcher, Sep.Sci. Technol., 2006, 41, 1411–1445.
18 M. Brannock, Y. Wang and G. Leslie, Water Res., 2010, 44,3181–3191.
19 M. Brannock, G. Leslie, Y. Wang and S. Buetehorn,Desalination, 2010, 250, 815–818.
20 Y. Wang, M. Brannock, S. Cox and G. Leslie, J. Membr. Sci.,2010, 363, 57–66.
21 F. Zamani, A. W. K. Law and A. G. Fane, J. Membr. Sci., 2013,429, 304–312.
22 Z. Wang, K. Su, T. Shu and W. Wang, Water Sci. Technol.,2017, 76, 2503–2514.
23 E. Radaei, X. Liu, K. H. Tng, G. Merendino, F. J. Trujillo,P. R. Berube and G. Leslie, Water Res., 2019, 160, 60–69.
24 K. V. Sharp and R. J. Adrian, AIChE J., 2001, 47, 766–778.25 C.-L. Liu, Z. Sun, G.-M. Lu and J.-G. Yu, R. Soc. Open Sci.,
2018, 5, 171255.26 R. C. Chen, J. Reese and L.-S. Fan, AIChE J., 1994, 40, 1093–1104.27 B. Wang, K. Zhang and R. W. Field, AIChE J., 2018, 64, 2721–
2736.28 C. Liu, Z. Sun, G. Lu, X. Song and J. Yu, Flow Meas. Instrum.,
2015, 45, 415–420.29 X. Liu, Y. Wang, T. D. Waite and G. Leslie, J. Membr. Sci.,
2016, 520, 201–213.30 L. Li, G. A. Al-Muntasheri and F. Liang, Petroleum, 2016, 2,
313–323.31 C.-L. Liu, Z. Sun, G.-M. Lu, X.-F. Song and J.-G. Yu, Can. J.
Chem. Eng., 2015, 93, 565–579.32 A. Sokolichin, G. Eigenberger and A. Lapin, AIChE J., 2004, 50,
24–45.33 D. A. Drew, Annu. Rev. Fluid. Mech., 1983, 15, 261–291.34 M. E. Dıaz, A. Iranzo, D. Cuadra, R. Barbero, F. J. Montes and
M. A. Galan, Chem. Eng. J., 2008, 139, 363–379.35 N. Liu, Q. Zhang, G. L. Chin, E. H. Ong, J. Lou, C. W. Kang,
W. Liu and E. Jordan, J. Membr. Sci., 2010, 353, 122–134.36 R. Sengur, G. Deveci, R. Kaya, T. Turken, S. Guclu, D. Y. Imer
and I. Koyuncu, Desalin. Water Treat., 2015, 55, 1747–1761.