Computational Materials Techniques for Thermal Protection Solutions: Materials and Process Design 1 Thermal Protection Materials Branch, NASA Ames Research Center 2 AMA, Inc., Thermal Protection Materials Branch, NASA Ames Research Center Justin Haskins, 1 Lauren Abbott, 2 Joshua Monk 2 Materials Science and Technology 2019 | Portland, Oregon
Transcript
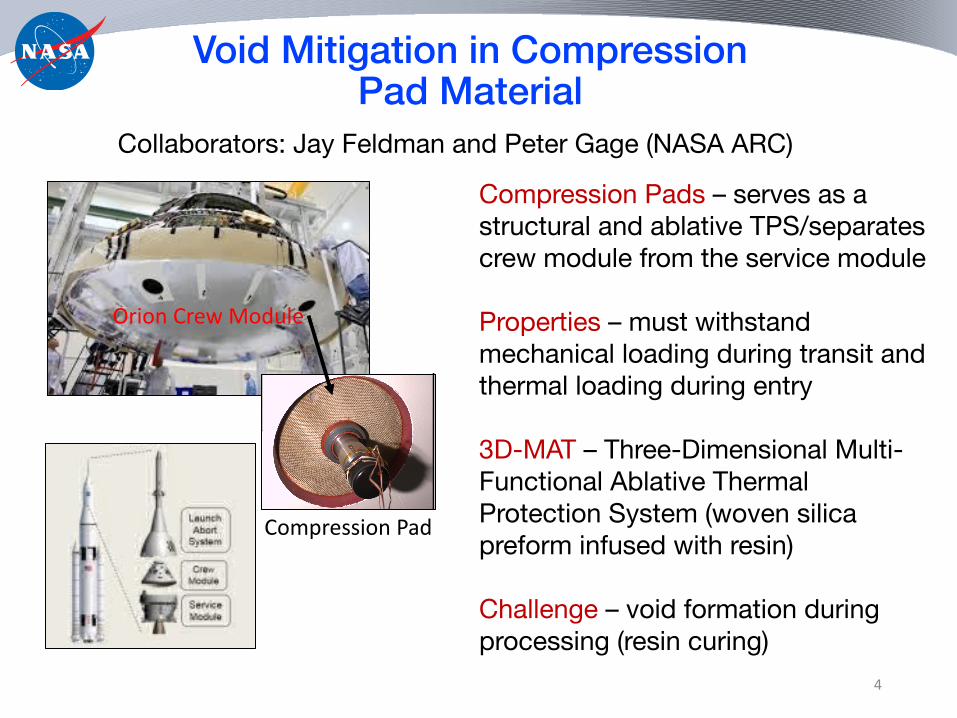
Computational Materials Techniques for Thermal Protection Solutions: Materials and Process Design
1Thermal Protection Materials Branch, NASA Ames Research Center2AMA, Inc., Thermal Protection Materials Branch, NASA Ames Research Center
Justin Haskins,1 Lauren Abbott,2 Joshua Monk2
Materials Science and Technology 2019 | Portland, Oregon
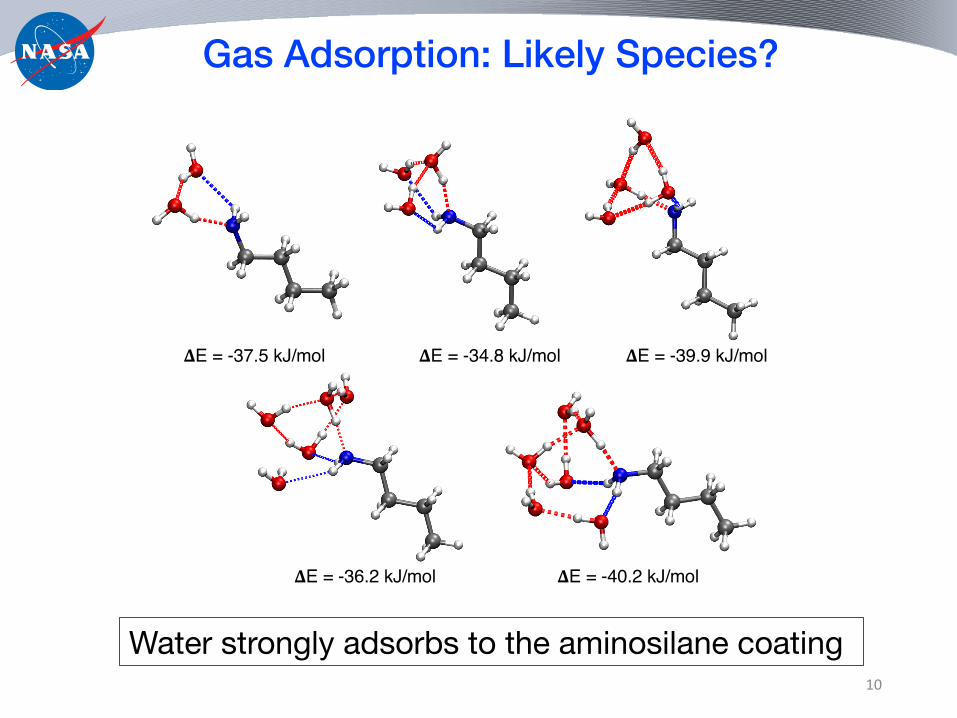
Fig. 2 Adsorption structures of 2-6 water molecules with the amine-group of aminosilane.
9
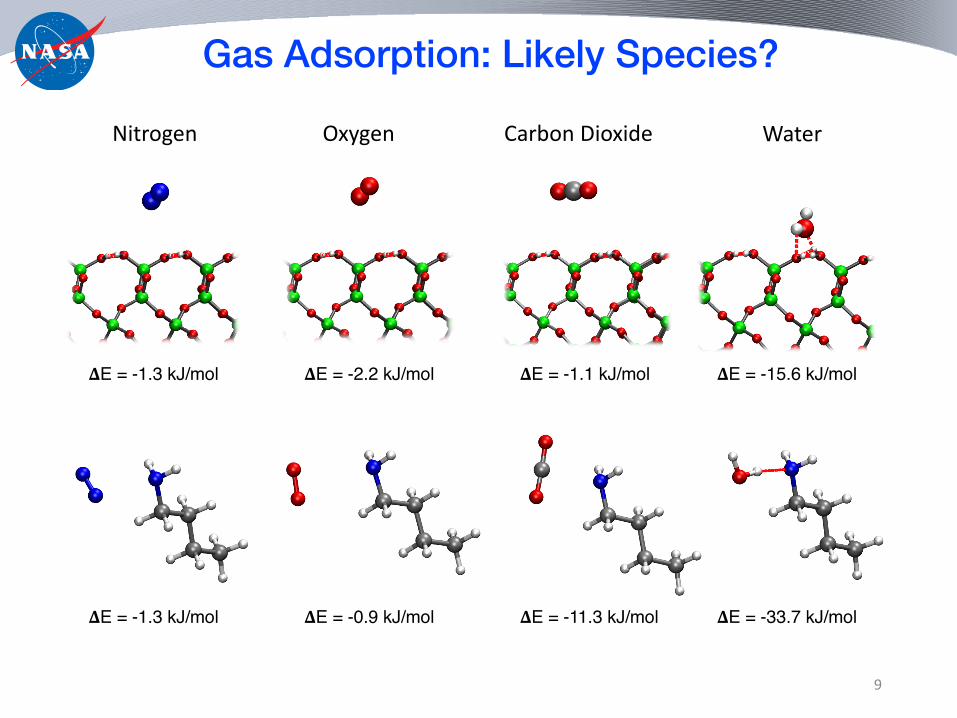
Water strongly adsorbs to the aminosilane coating
11
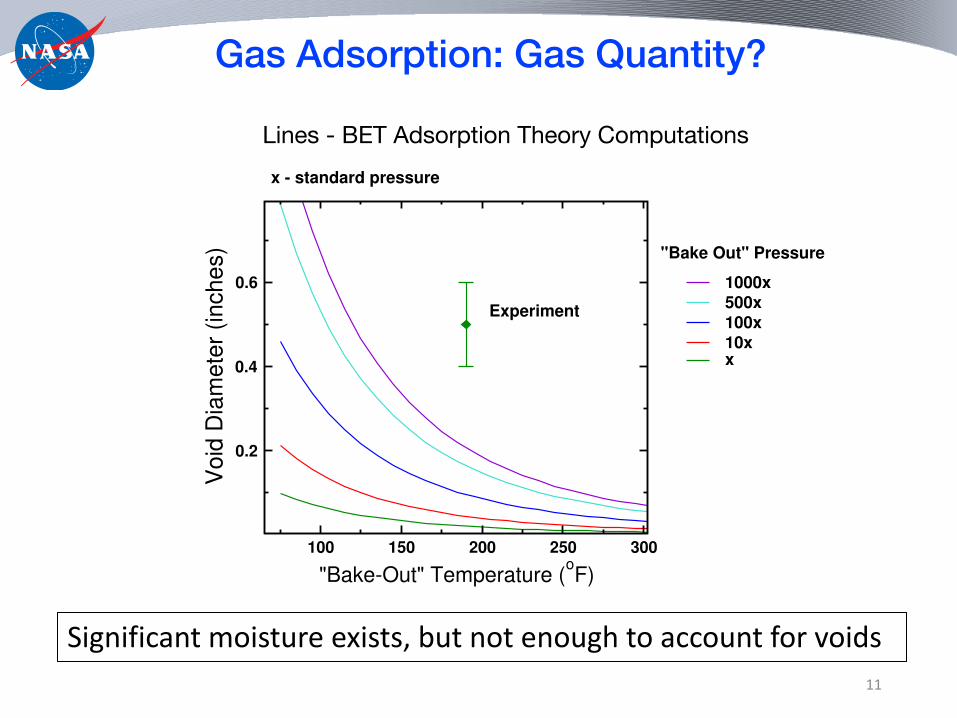
Gas Adsorption: Gas Quantity?
Significant moisture exists, but not enough to account for voids
Lines - BET Adsorption Theory Computations
100 150 200 250 300
"Bake-Out" Temperature (oF)
0.2
0.4
0.6
Vo
id D
iam
ete
r (in
che
s)
1000x500x100x10xx
0 40080012001600
Temperature (K)
-9.2
-8.8
-8.4
Fre
e E
ne
rgy
(e
V/a
tom
)
B2B33
"Bake Out" Pressure
Experiment
x - standard pressure
12
Cure Shrinkage
leads to
P0 =kBTQ
2⇡mkBT
h2
!3/2
, (2)
where kB is the Boltzmann constant, Q is the partition function of the adsorbed gas molecule, m is the mass of the
molecule, and h is the Plank constant. The partition function of a monatomic or diatomic gas molecule adsorbed on a
site of substrate may be described as
Q = e�Eads ,1/kBT , (3)
where Eads ,1 is the adsorption energy of the first layer of gas molecules. The quantity C is known as the BET coe�cient
and is given by
C = C0e(Eads ,1�Eads ,2)/kBT , (4)
where Eads ,2 is the adsorption energy of the second and higher layers and C0 is taken, generally, as unity.
C. Cure Shrinkage: Finite Volume Model
Volume shrinkage due to the curing reaction is assessed on the basis of a finite volume model that provides the
temperature profile and degree of cure in a one-dimensional slab of polymer exposed to a constant cure temperature, Tc .
The heat equation is given as
⇢Cp@T@t= k@2T@z2 , (5)
where ⇢ is density, Cp is heat capacity, t is time, and k is thermal conductivity. The reaction is modeled as first order
according to@a@t= Ka, (6)
where a is the extent of cure and K is the reaction constant.
A finite volume model is employed to solve the partial di↵erential equation that govern cure. The one dimensional
grid is evenly spaced with 1 cell/mm, the timestep employed is 1 ms, and Euler’s method is used for time propagation.
The derivative term required for the heat equation is given by
@2T@z2 =
Ti�1 � 2Ti � Ti+1
dz2 , (7)
where “i” is a given face between cells on the grid and dz is the cell width.
III. Characterization of Gas Adsorption
The basic quantities desired for the BET theory are the adsorption energies of the first and higher levels. To
obtain these energies, the adsorbate must be defined first. The major components of air, including N2, O2, CO2,
4
1-D finite volume model of heating and cure
Heat equation
First order conversion kinetics
Gradient formula
Constant-T Surface
Constant-T Surface
Infused BilletThickness
13
Experimental Cure Data
3.3. Thermal stability of the moldingcompound from Ba and BADCy
The gelation time of the molding compounds from50 mol% Ba and 50 mol% BADCy was measured.Furthermore, the reciprocal plot of gelation time asa function of temperature is shown in Figure 6. Themolding compound was thermally stable under120°C for about 45 min, because the curing reactioncould not occur. This was because the ring openingreaction of benzoxazine ring was difficult to occur
under 120°C, especially under dilution by BADCy,and the phenolic hydroxyl groups that contributedto the curing reaction were not produced. However,the gelation time was shortened with the rise of themolding temperature, because the benzoxazine ringopened and the phenolic hydroxyl groups that con-tributed to the curing reaction were produced easily,and thermal self-cyclotrimerization of cyanate estergroup occurred.
3.4. DSC analysis of the molding compoundFigure 7 shows the DSC curves of the moldingcompounds from Ba and BADCy or Ep. From the
Figure 4. Co-reaction of benzoxazine (BuPa) with cyanate ester (Monocy)
Figure 5. FT-IR spectra of the compound from curing reac-tion of 50 mol% Ba with 50 mol% BADCy.(a) before curing reaction, (b )after 180°C/2 hr,(c) after 180°C/2 hr + 200°C/2 hr, (d) after180°C/2 hr + 200°C/2 hr + 220°C/2 hr.
Figure 6. Reciprocal plot of gelation time as a function oftemperature
Reaction kinetics parameterized from curing experiments for cyanate ester - Gelation is 60 % conversion (BADcy)
Cure Times
14
Temperature and Cure Profiles
Cure is heterogeneous with the boundaries reaching the gel point first
0.2 m inch thick preform; elevated temperature cure
0 0.05 0.1 0.15 0.2
Through Thickness of Preform (m)
0
0.2
0.4
0.6
0.8
1
No
rma
lize
d T
em
pe
ratu
re I
ncr
ea
se
7000 s5000 s3000 s1000 s
0 40080012001600
Temperature (K)
-9.2
-8.8
-8.4
Fre
e E
ne
rgy
(e
V/a
tom
)
B2B33
Cure Time
0 0.05 0.1 0.15 0.2
Through Thickness of Preform (m)
0
0.2
0.4
0.6
0.8
1
No
rma
lize
d T
em
pe
ratu
re I
ncr
ea
se
7000 s5000 s3000 s1000 s
0 40080012001600
Temperature (K)
-9.2
-8.8
-8.4
Fre
e E
ne
rgy
(e
V/a
tom
)
B2B33
Cure Time
0 0.05 0.1 0.15 0.2
Through Thickness of Preform (m)
0
0.2
0.4
0.6
0.8
1
1 -
cure
fra
ctio
n 7000 s5000 s3000 s1000 s
0 40080012001600
Temperature (K)
-9.2
-8.8
-8.4
Fre
e E
nerg
y (
eV
/ato
m)
B2B33
Cure Time
0 0.05 0.1 0.15 0.2
Through Thickness of Preform (m)
0
0.2
0.4
0.6
0.8
1
No
rma
lize
d T
em
pe
ratu
re I
ncr
ea
se
7000 s5000 s3000 s1000 s
0 40080012001600
Temperature (K)
-9.2
-8.8
-8.4
Fre
e E
ne
rgy
(e
V/a
tom
)
B2B33
Cure Time
15
Refined Picture of Void Formation
Cooperative effect of gas adsorption and shrinkage
Thermal driving of vapor
Interior pressure reduction from shrinkage
Shrinkage and Gas DrivingCritical Shrinkage, Gas Expansion,
and Void Nucleation
16
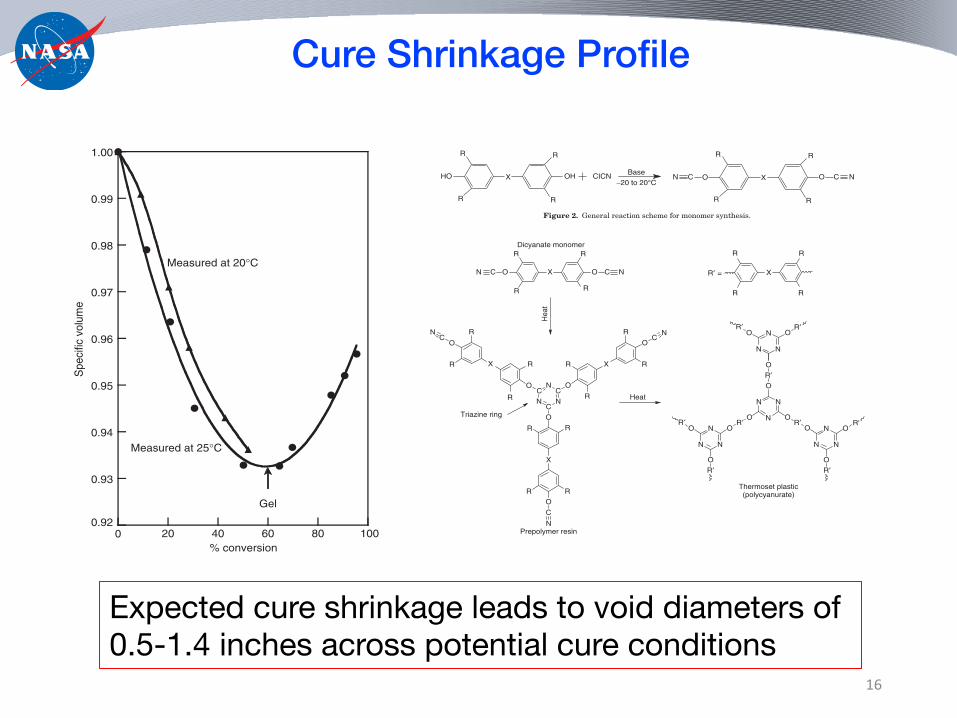
Cure Shrinkage Profile
Expected cure shrinkage leads to void diameters of 0.5-1.4 inches across potential cure conditions
6 CYANATE ESTER RESINS
0.92
0.93
0.94
0.95
0.96
0.97
0.98
0.99
1.00
0 20 40 60 80 100
Spe
cific
vol
ume
% conversion
Gel
Measured at 20°C
Measured at 25°C
Figure 8. Volume changes during cyclotrimerization of BADCyat 200◦C.
to the following structural features: ether–oxygen link-ages, low cross-link density, and apparent high free volumein cured state.
• After gelation, the volume increases as conversionincreases above 65% (Fig. 8). This tends to eliminatestress-induced shrinkage at cure temperature.
• Dielectric constant, Dk, (2.6–3.1) and dissipation fac-tor, Df ,(1–6 × 10⁻³) are unusually low for high Tgresins [28]. High free volume and relatively weakdipoles may contribute to these low loss properties.
• Weight gain due to moisture pickup (1.3–2.4%) inboiling water is lower than epoxy and BMI resins[29]. Long-term stability (>500 h) in 100◦C water hasbeen achieved with epoxy modification or orthome-thylation of the cyanate monomer [30].
• Copolymers with epoxy resins provide hybrid for-mulations with lower cure temperatures, increasedsteam resistance, and lower cost [30,31]. The copoly-mers contain oxazoline rings (cyanate–epoxy resincopolymer), triazine rings (cyanate cyclotrimeriza-tion), and epoxy homopolymer (polyether).
• Several engineering thermoplastic resins have beenused as modifiers for cyanate esters [32]. Low levelsof thermoplastic resin modifiers can be solubilizedin dicyanate; then efficient phase separation can beachieved during the cyclotrimerization step to pro-vide a high degree of toughness [27].
Matrix Properties Versus Epoxy and BMI
Typical cured-state properties associated with cyanateester homopolymers (from difunctional cyanate estermonomers), toughened BMIs, and epoxy resins curedwith aromatic amines are listed in Table 2. Note thatpolycyanurates have the toughness and adhesion of thediglycidyl ether type of epoxies with thermal propertiesintermediate between brittle tetrafunctional epoxies andtoughened BMIs. Advantages of polycyanurates includelower moisture absorption, less cure shrinkage, and lowerdielectric loss properties. In addition, polycyanurateshave superior adhesive strengths up to 250◦C and solventresistance intermediate between difunctional epoxies andtetrafunctional epoxies or BMI resins. This may be due tolower cross-link density of the polycyanurate network.
Blends with Epoxies and BMIs
Cyanate esters can be effectively blended with epoxies,co-reacting to form cost-effective hybrids. While the reac-tion pathway appears to be somewhat complex—involvingcyanate trimerization epoxide insertion and ring cleavagewith additional epoxide to form substituted oxazolidinones[9,33]—the resulting reaction is simplified in Fig. 9.
Likewise, cyanate esters can be copolymerized withBMI resins to create hybrid systems. These so-called BT(bismaleimide-triazine) resins form a high Tg networkstructure through reaction of the double bond of themaleimide group with the cyano groups to form hetero-cyclic six-membered aromatic ring structures with twonitrogen atoms (pyrimidines) as shown in Fig. 10.
Modifying BADCy resins with epoxy or BMI resinscan lead to the properties shown in Table 3. The dataindicate that cure temperatures to obtain >95% conver-sion can be lowered 20–50◦C. The modified systems havelower ultimate Tg values but superior moisture resistance,with no significant loss of physical strength properties.Self-extinguishing flammability ratings are achieved at10–16% bromine content, depending on level of epoxymodification. Epoxy-resin-modified cyanate ester resinsnot only absorb less water than polycyanurate homopoly-mers and tetrafunctional epoxies but also retain a higherpercentage of HDT and reach moisture content equilib-rium sooner. The best performance for long-term boilingwater resistance appears to be formulations with 1.0–1.8epoxide equivalents per monomer cyanate group. Opti-mum cure for epoxy-modified cyanates is offered by copperacetylacetonate with 2 phr nonylphenol catalyst systems.
Resin Forms
Commercial quantities of cyanate ester monomersand resins are available in several forms, includingliquid monomers and oligomers, crystalline monomers,amorphous semisolid prepolymers or oligomers, hardprepolymers in powder or lump form, solvent solutions,and blends. Toxicity screening test for all forms indicatelow health hazards for ingestion or skin contact withbisphenol-type dicyanates. Table 4 gives typical toxicityscreen data. In solution products, the principal hazardsare associated with the solvents. This low toxicity is
2 CYANATE ESTER RESINS
X OO
R
R
R
R
C C NN
Figure 1. General structure for most commercial cyanate estermonomers, where the substituent R and linkage X may vary toimpart specific properties to the resin (Table 1).
systems. Typically, commercial catalyst systems comprisecarboxylate salts and chelates of transition metals suchas copper, zinc, manganese, cobalt, or nickel dissolvedin a hydrogen-donating solvent such as an alkyl phenol.Shimp [7] proposed a trimerization mechanism for thesetransition metal carboxylates–active hydrogen-catalyzedsystems. As illustrated in Fig. 6, he suggests that the metal
acts as a clustering agent, creating a complex to bringthree reactive –OCN groups together, while the activehydrogen source provides reactive carbonic imide function-ality. The coordination metal catalyst is not very effectiveafter gelation, when trimerization proceeds mainly by thestep-growth mechanism shown in Fig. 7.
The heat of reaction for cyanate esters is higher than forepoxy resins, ∼105 kJ/mol for the OCN groups compared to50–58 kJ/mol for epoxies [2]. This can lead to overheatingfrom excessive exothermic reactions in thick compositesand in cases with very fast cure cycles.
Commercial Products
Polymers and oligomers of bisphenol A dicyanate (BADCy)were first offered by Bayer in Europe and Mobay Chem-ical in the United States in 1976 for use as laminat-ing resins for high performance printed wiring boards.
X OH CICN−20 to 20°C
BaseHO
R
R
R
R
X OO
R
R
R
R
C C NN
Figure 2. General reaction scheme for monomer synthesis.
Dicyanate monomer
Hea
t
Heat
Triazine ring
Prepolymer resin
Thermoset plastic(polycyanurate)
X
R
R
ON
R
R
O R′ = X
R
R R
R
NCN
CNC
O
O
O
X
X
X
OC
N
OC
N
OC
N R
R
R
R R
R
R
R
RR
RR
O
O
O
R′O
R′O
R′O
OOR′
OR′
OR′
OR′
OR'
N
N N
NN
N
NN
N
N
NN
C NC
R′
Figure 3. Curing via cyclotrimerization.
17
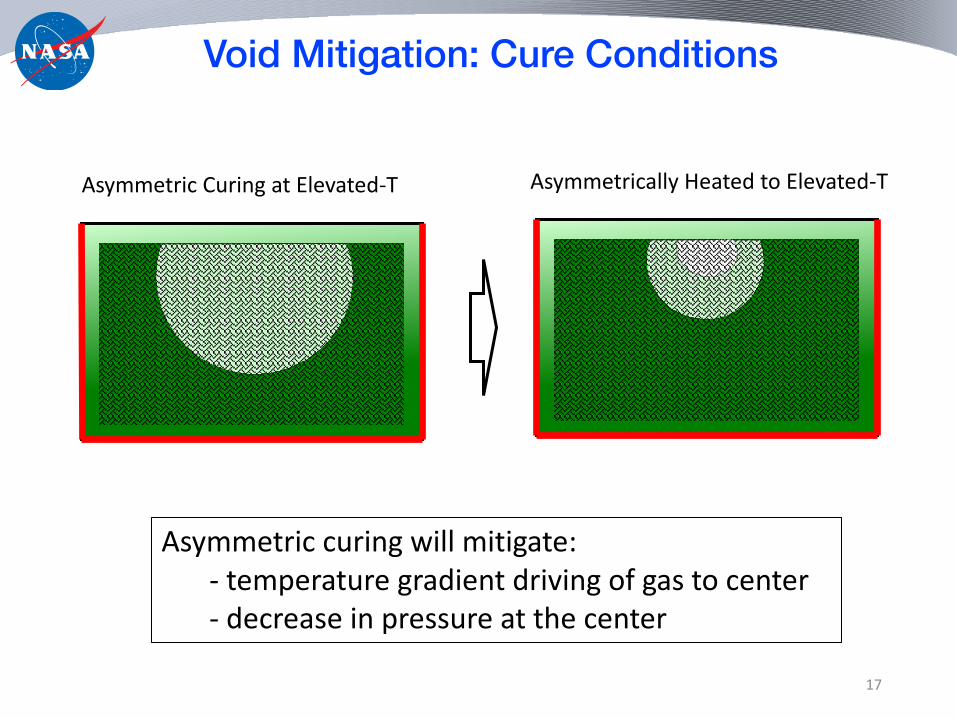
Void Mitigation: Cure Conditions
Asymmetric curing will mitigate:- temperature gradient driving of gas to center- decrease in pressure at the center
Asymmetric Curing at Elevated-T Asymmetrically Heated to Elevated-T
18
Summary
• Water is problematic species on silica/aminosilane
• Symmetric curing can drive gas to center of billet, reduce pressure, and lead to void nucleation
• Asymmetric curing a possible route to void mitigation
19
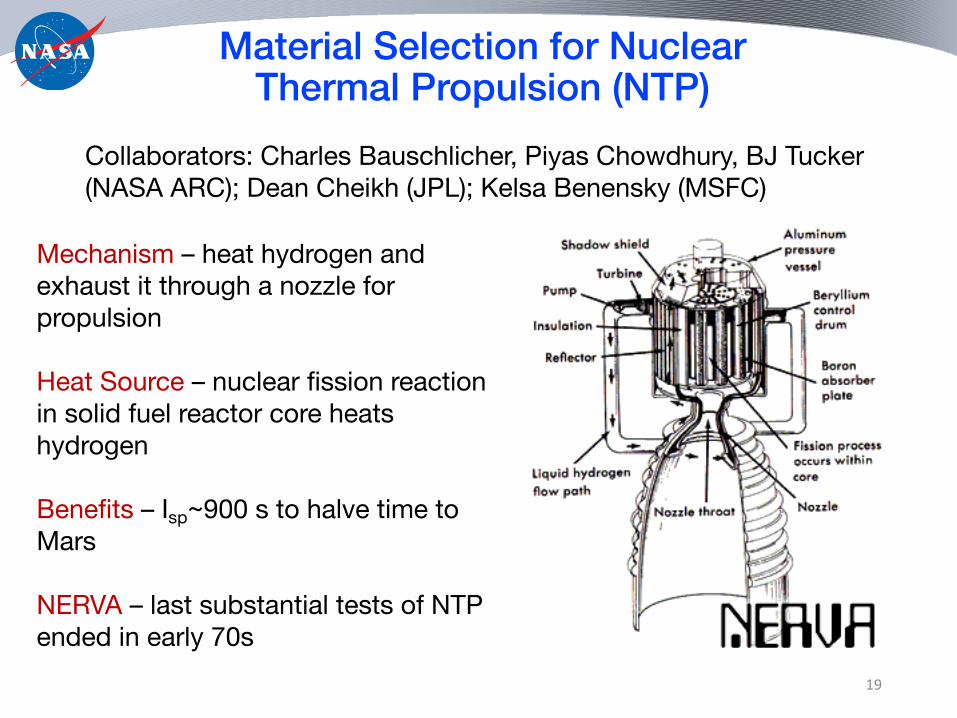
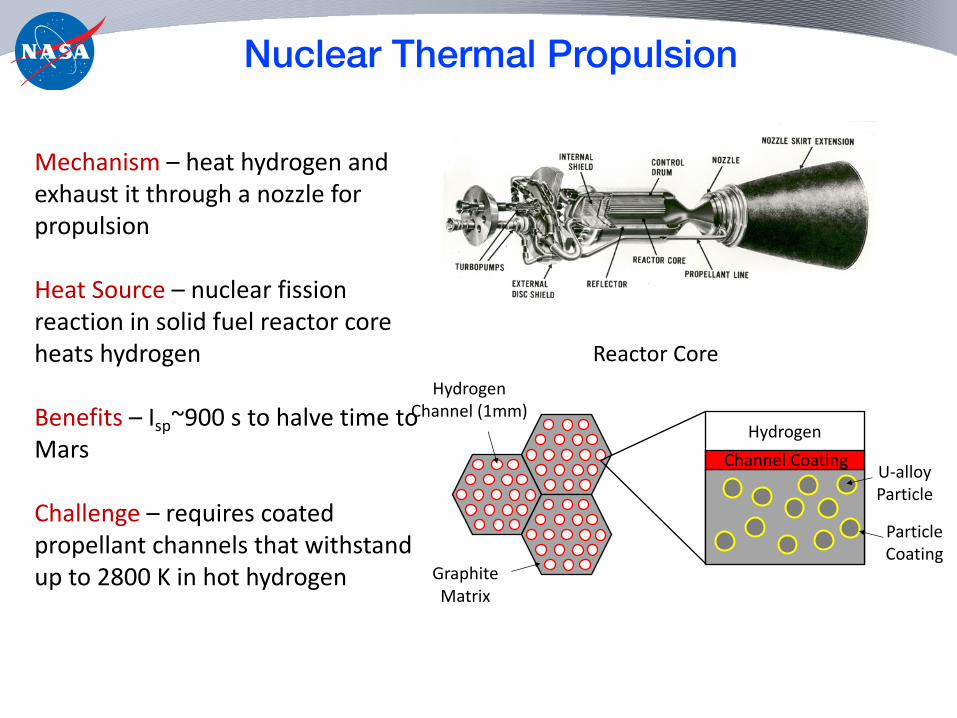
Material Selection for Nuclear Thermal Propulsion (NTP)
Mechanism – heat hydrogen and exhaust it through a nozzle for propulsion
NERVA – last substantial tests of NTP ended in early 70s
Collaborators: Charles Bauschlicher, Piyas Chowdhury, BJ Tucker (NASA ARC); Dean Cheikh (JPL); Kelsa Benensky (MSFC)
20
Reactor Core
Graphite Matrix
Hydrogen Channel (1mm)
Hydrogen
Channel Coating U-alloy Particle
Particle Coating
Challenging to find coatings for propellant channels that withstand 2800 K in hot hydrogen for multiple hours
21
Materials for NTP/STP
- Coatings must be sized to not react and ablate to failure- Coatings should restrict hydrogen diffusion to the carbon substrate- Coatings should be mechanically stable on the carbon substrate
vaporization
reaction
carbon/carbon
expansion
coating atoms
diffusionhydrogen
0
5
10
15
20
25
2000 2500 3000 3500 4000 4500
Den
sity
(g/c
c)
Melting Point (K)
HfC
C
TaC
ZrCNbC
SiCB4C TiC
HfTa
Nb
W
NTP Range
22
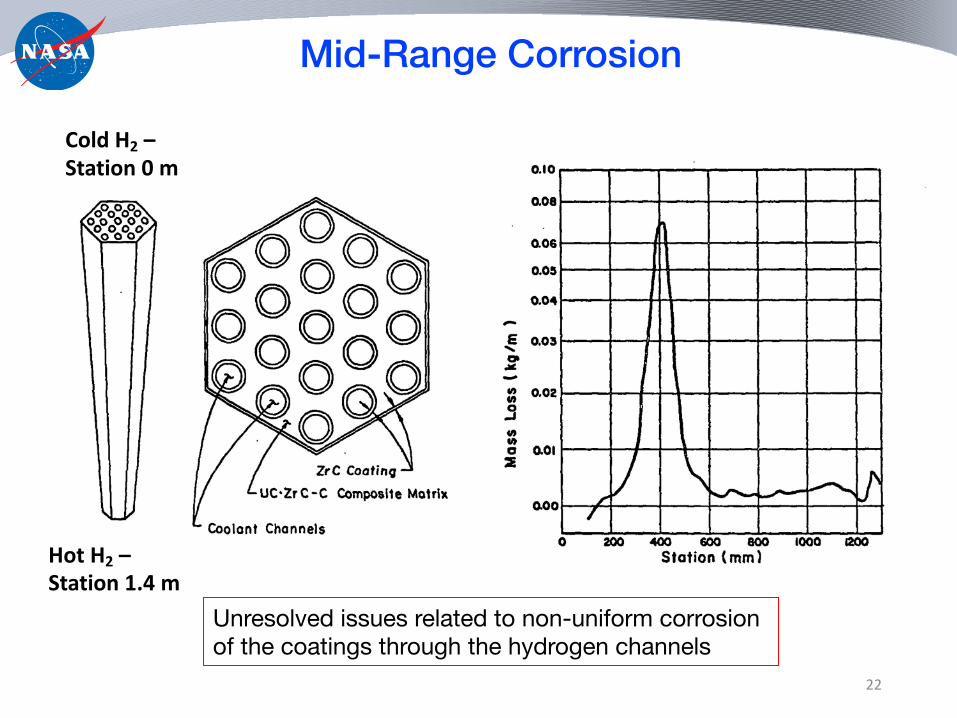
Mid-Range Corrosion
Unresolved issues related to non-uniform corrosion of the coatings through the hydrogen channels
Cold H2 –Station 0 m
Hot H2 –Station 1.4 m
23
Mid-Range Corrosion
0 400 800 1200
Station - Distance from Inlet (mm)
0
1000
2000
3000
4000
Cra
cks
(m-1
)
NERVA data
0 800 1600
Temperature (K)
-9.2
-8.8
-8.4
Fre
e E
ne
rgy
(e
V/a
tom
)
(a)
ZrC
harmonic anharmonic
0 400 800 1200
Station - Distance from Inlet (mm)
0
1000
2000
3000
4000
Mean T
em
pera
ture
(K
)
NERVA data
0 800 1600
Temperature (K)
-9.2
-8.8
-8.4
Fre
e E
nerg
y (
eV
/ato
m)
(a)
ZrC
harmonic anharmonic
processing temperature
processing temperature
Damage dramatically reduced when temperature is above the processing temperature
24
Initial Approach to Estimate Mass Loss
- Make an equilibrium assumption for surface reaction
- Use quantum computations to define reaction energetics and solid thermodynamics
- Compare to original NERVA rocket data (1957-1972) - only at temperature reactor data available
with a surface density of atomic sites (σ5) exposed to a gaseous hydrogen fuel with a volume (78), given by the volume of the flow channels, and a pressure ('8). The free energy difference between a coating atom in the solid and gaseous phase (∆"5,1→8) is given by
(4)
where ∆.5,1→8 is the internal energy per atom of solid and gaseous coating atoms, :8 is the entropy of an atom in the gas phase, and % is temperature. Only surface atoms are considered active and able to enter the gas phase, and, as such, the total number of surface atoms (;<=<) may be represented as the summation of the number of coating atoms in the solid phase (;5,1) and gas phase (;5,8) as,
(5)
The equilibrium of surface and gas phase coating atoms may be related to the free energy as,
(6)
The previous equations allow the solution of the number of surface atoms that enter the gas phase at a given instant. Because the system is dynamic and the fuel is owing with a given mass rate (,8) for a set time (>), the vaporized coating atoms are lost at a constant rate due to flow. As new fuel enters the heat exchanger, more surface atoms vaporize to establish equilibrium. The total number of atoms lost to vaporization in this way may be represented as
(7)
where ?8 is the density of the gaseous fuel, ΔA5 is the total thickness of coating lost, and ?5 is the density of the coating. As a case study, a prototype NbC coating was examined using representative conditions for the heat exchanger from a JPL feasibility study: 5 hrs at 3100 K, an H2 flow rate of 3 kg/s, a pressure of 50 psi, and total coated area of 20 m2. The computational predictions of vaporization energy and associated ablation during operation are provided in Table 5. The vaporization energy for all the coatings are positive, indicating a somewhat unfavorable process. Using the specific STP operation conditions, the ablation depths are found to be between 3-5 mm. Any error associated with this estimate is related to the solid-vapor equilibrium assumption. In a dynamic flow, the rate at which equilibrium is established may be slow compared to the rate of fuel flow. In this case, the ablation thickness is an overestimate. Determining the magnitude of this overestimate warrants further investigation, as each millimeter of coating reduction translates to significant mass saved (e.g., over 100 kg of mass savings for NbC).
To use LAT theory, the energetics of adsorption must be characterized through ab initio
techniques. A depiction of a hydrogen atom intercalated into NbC is given in Figure 3a.
The free energy of intercalation for a given hydrogen atom is found to be -1.23 eV. This
corresponds to roughly 1 out of every 2.5e-5 surface sites being occupied by a hydrogen.
The speed with which hydrogen travels through the coating may be given by the di↵usion
coe�cient. The di↵usivity of NbC is obtained through AIMD simulations by computing the
mean square displacement of hydrogen as a function of time (Figure 3b). According to the
Einstein relationship, the slope of the mean square displacement is twice the di↵usivity of
hydrogen - yielding 3.5⇥10�8 m2/s for hydrogen in NbC at 3500 K. Taking these metrics
into account, hydrogen is highly mobile in NbC (moving at 12 mm/hr).
Thickness and Ablation
At high temperature, loss of material to vaporization e↵ects (Figure 2c) is expected to be
an important factor that can play into sizing. An upper bound to the expected recession may
be determined from equilibrium considerations. The system of interest is a given amount of
coating surface area (Ac) with a surface density of atomic sites (�c) exposed to a gaseous
hydrogen fuel with a volume (Vg), given by the volume of the flow channels, and a pressure
(Pg). The free energy di↵erence between a coating atom in the solid and gaseous phase
(�Gc,s!g) is given by
�Gc,s!g = �Ec,s!g � TSg + PgVg, (4)
where �Ec,s!g is the internal energy per atom of solid and gaseous coating atoms, Sg is
the entropy of an atom in the gas phase, and T is temperature. Only surface atoms are
considered active and able to enter the gas phase, and, as such, the total number of surface
atoms (Ntot) may be represented as the summation of the number of coating atoms in the
solid phase (Nc,s) and gas phase (Nc,g) as,
Ntot = A�s = Nc,s +Nc,g. (5)
6
To use LAT theory, the energetics of adsorption must be characterized through ab initio
techniques. A depiction of a hydrogen atom intercalated into NbC is given in Figure 3a.
The free energy of intercalation for a given hydrogen atom is found to be -1.23 eV. This
corresponds to roughly 1 out of every 2.5e-5 surface sites being occupied by a hydrogen.
The speed with which hydrogen travels through the coating may be given by the di↵usion
coe�cient. The di↵usivity of NbC is obtained through AIMD simulations by computing the
mean square displacement of hydrogen as a function of time (Figure 3b). According to the
Einstein relationship, the slope of the mean square displacement is twice the di↵usivity of
hydrogen - yielding 3.5⇥10�8 m2/s for hydrogen in NbC at 3500 K. Taking these metrics
into account, hydrogen is highly mobile in NbC (moving at 12 mm/hr).
Thickness and Ablation
At high temperature, loss of material to vaporization e↵ects (Figure 2c) is expected to be
an important factor that can play into sizing. An upper bound to the expected recession may
be determined from equilibrium considerations. The system of interest is a given amount of
coating surface area (Ac) with a surface density of atomic sites (�c) exposed to a gaseous
hydrogen fuel with a volume (Vg), given by the volume of the flow channels, and a pressure
(Pg). The free energy di↵erence between a coating atom in the solid and gaseous phase
(�Gc,s!g) is given by
�Gc,s!g = �Ec,s!g � TSg + PgVg, (4)
where �Ec,s!g is the internal energy per atom of solid and gaseous coating atoms, Sg is
the entropy of an atom in the gas phase, and T is temperature. Only surface atoms are
considered active and able to enter the gas phase, and, as such, the total number of surface
atoms (Ntot) may be represented as the summation of the number of coating atoms in the
solid phase (Nc,s) and gas phase (Nc,g) as,
Ntot = A�s = Nc,s +Nc,g. (5)
6The equilibrium of surface and gas phase coating atoms may be related to the free energy
as,Nc,g
Nc,s
= exp(�Gc,s!g/kBT ), (6)
where kB is the Boltzmann constant. The previous equations allow the solution of the
number of surface atoms that enter the gas phase at a given instant. Because the system is
dynamic and the fuel is flowing with a given mass rate (mg) for a set time (t), the vaporized
coating atoms are lost at a constant rate due to flow. As new fuel enters the heat exchanger,
more surface atoms vaporize to establish equilibrium. The total number of atoms lost to
vaporization in this way may be represented as
mgt
⇢gVg
Nc,g = Ac�zc⇢c, (7)
where ⇢g is the density of the gaseous fuel, �zc is the total thickness of coating lost, and ⇢c
is the density of the coating.
As a case study, a prototype NbC coating was examined using representative conditions
for the heat exchanger from a JPL feasibility study: 5 hrs at 3500 K, an H2 flow rate of
3 kg/s, a pressure of 50 psi, and total coated area of 20 m2. The computations predict a
1.8 mm coating loss to vaporization over the course of operation. Any error associated with
this estimate is related to the solid-vapor equilibrium assumption. In a dynamic flow, the
rate at which equilibrium is established may be slow compared to the rate of fuel flow. In
this case, the ablation thickness would be an overestimate. Determining the magnitude of
this overestimate warrants further investigation to quantify, as each millimeter of coating
reduction translates to over 100 kg of mass savings.
Mechanical Behavior
During operation of the STP heat exchanger, the coating material and carbon-carbon
will undergo a roughly 3000-3500 K change in temperature. The danger associated with such
7
The equilibrium of surface and gas phase coating atoms may be related to the free energy
as,Nc,g
Nc,s
= exp(�Gc,s!g/kBT ), (6)
where kB is the Boltzmann constant. The previous equations allow the solution of the
number of surface atoms that enter the gas phase at a given instant. Because the system is
dynamic and the fuel is flowing with a given mass rate (mg) for a set time (t), the vaporized
coating atoms are lost at a constant rate due to flow. As new fuel enters the heat exchanger,
more surface atoms vaporize to establish equilibrium. The total number of atoms lost to
vaporization in this way may be represented as
mgt
⇢gVg
Nc,g = Ac�zc⇢c, (7)
where ⇢g is the density of the gaseous fuel, �zc is the total thickness of coating lost, and ⇢c
is the density of the coating.
As a case study, a prototype NbC coating was examined using representative conditions
for the heat exchanger from a JPL feasibility study: 5 hrs at 3500 K, an H2 flow rate of
3 kg/s, a pressure of 50 psi, and total coated area of 20 m2. The computations predict a
1.8 mm coating loss to vaporization over the course of operation. Any error associated with
this estimate is related to the solid-vapor equilibrium assumption. In a dynamic flow, the
rate at which equilibrium is established may be slow compared to the rate of fuel flow. In
this case, the ablation thickness would be an overestimate. Determining the magnitude of
this overestimate warrants further investigation to quantify, as each millimeter of coating
reduction translates to over 100 kg of mass savings.
Mechanical Behavior
During operation of the STP heat exchanger, the coating material and carbon-carbon
will undergo a roughly 3000-3500 K change in temperature. The danger associated with such
7
Key Reaction at Surface:
Reactants Products Free Energy (2500 K)
ZrC(s) + 2H2 Zr(s) + CH4 1.96 eV
25
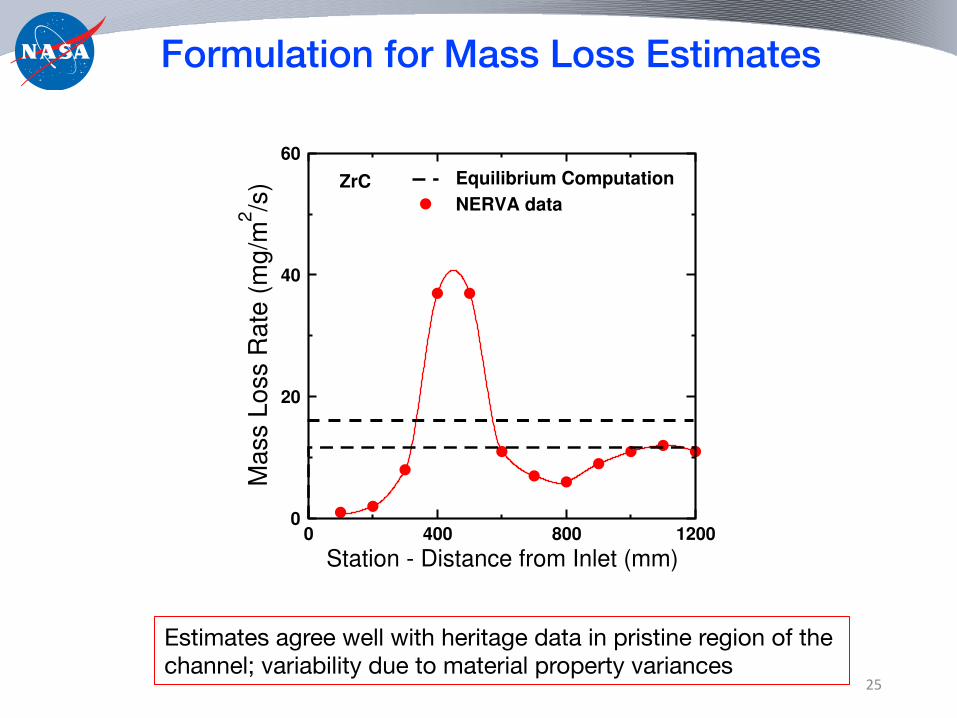
Formulation for Mass Loss Estimates
0 400 800 1200
Station - Distance from Inlet (mm)
0
20
40
60
Ma
ss L
oss
Ra
te (
mg
/m2/s
) Equilibrium Computation
NERVA data
0 800 1600
Temperature (K)
-9.2
-8.8
-8.4
Fre
e E
ne
rgy
(e
V/a
tom
)
(a)
ZrC
harmonic anharmonic
Estimates agree well with heritage data in pristine region of the channel; variability due to material property variances
Challenge – requires coated propellant channels that withstand up to 2800 K in hot hydrogen
HydrogenChannel Coating
Graphite Matrix
Hydrogen Channel (1mm)
U-alloy Particle
Particle Coating
Reactor Core
Fuel Element
30
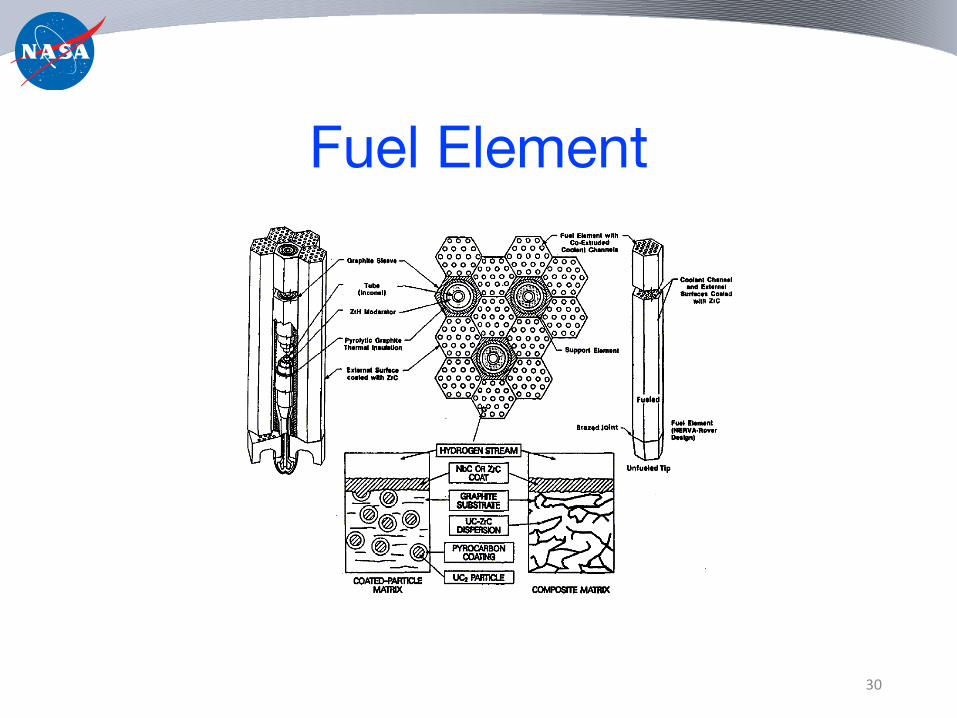
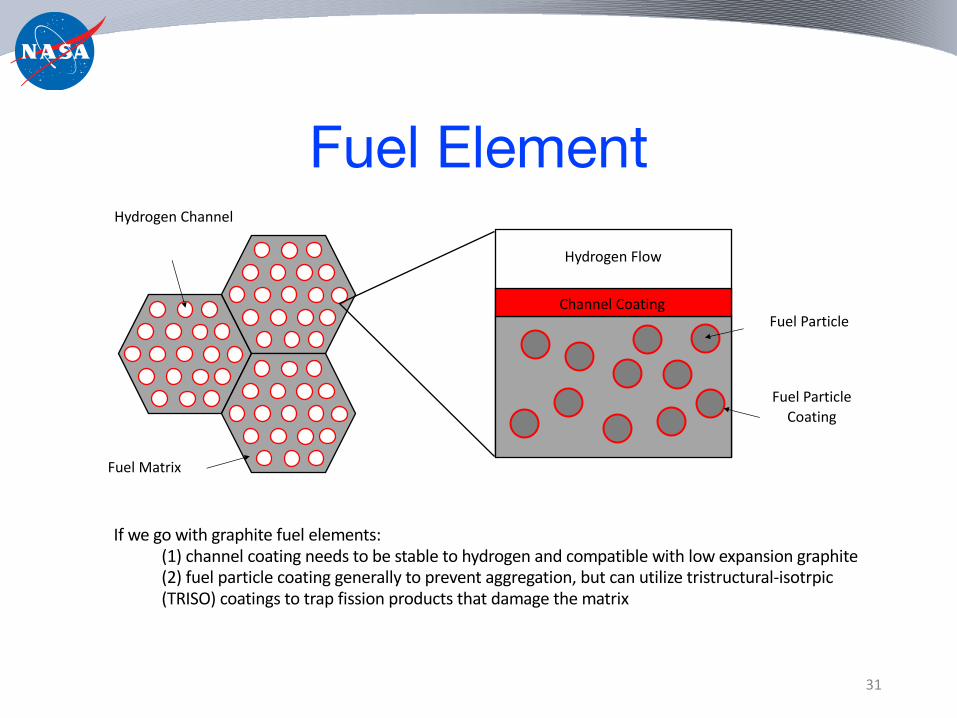
Fuel Element
31
Hydrogen Flow
Channel Coating
Fuel Matrix
Hydrogen Channel
Fuel Particle
Fuel Particle Coating
If we go with graphite fuel elements: (1) channel coating needs to be stable to hydrogen and compatible with low expansion graphite(2) fuel particle coating generally to prevent aggregation, but can utilize tristructural-isotrpic(TRISO) coatings to trap fission products that damage the matrix
32
Solar Thermal Propulsion
Mechanism – heat hydrogen and exhaust it through a nozzle for propulsion
Heat Source – craft closely approaches sun and uses solar energy to heat hydrogen
Benefits – Isp~1200 s for fast travel to the ISM
Challenge – requires a coated carbon heat exchanger than can withstand up to 3500 K in hot hydrogen
NASA Partners – JPL (STP project)GRC (experimental coatings)
Heat Exchanger
HeatExchanger
Channel Coating
Solar Energy
33
Cure Shrinkage6 CYANATE ESTER RESINS
0.92
0.93
0.94
0.95
0.96
0.97
0.98
0.99
1.00
0 20 40 60 80 100
Spe
cific
vol
ume
% conversion
Gel
Measured at 20°C
Measured at 25°C
Figure 8. Volume changes during cyclotrimerization of BADCyat 200◦C.
to the following structural features: ether–oxygen link-ages, low cross-link density, and apparent high free volumein cured state.
• After gelation, the volume increases as conversionincreases above 65% (Fig. 8). This tends to eliminatestress-induced shrinkage at cure temperature.
• Dielectric constant, Dk, (2.6–3.1) and dissipation fac-tor, Df ,(1–6 × 10⁻³) are unusually low for high Tgresins [28]. High free volume and relatively weakdipoles may contribute to these low loss properties.
• Weight gain due to moisture pickup (1.3–2.4%) inboiling water is lower than epoxy and BMI resins[29]. Long-term stability (>500 h) in 100◦C water hasbeen achieved with epoxy modification or orthome-thylation of the cyanate monomer [30].
• Copolymers with epoxy resins provide hybrid for-mulations with lower cure temperatures, increasedsteam resistance, and lower cost [30,31]. The copoly-mers contain oxazoline rings (cyanate–epoxy resincopolymer), triazine rings (cyanate cyclotrimeriza-tion), and epoxy homopolymer (polyether).
• Several engineering thermoplastic resins have beenused as modifiers for cyanate esters [32]. Low levelsof thermoplastic resin modifiers can be solubilizedin dicyanate; then efficient phase separation can beachieved during the cyclotrimerization step to pro-vide a high degree of toughness [27].
Matrix Properties Versus Epoxy and BMI
Typical cured-state properties associated with cyanateester homopolymers (from difunctional cyanate estermonomers), toughened BMIs, and epoxy resins curedwith aromatic amines are listed in Table 2. Note thatpolycyanurates have the toughness and adhesion of thediglycidyl ether type of epoxies with thermal propertiesintermediate between brittle tetrafunctional epoxies andtoughened BMIs. Advantages of polycyanurates includelower moisture absorption, less cure shrinkage, and lowerdielectric loss properties. In addition, polycyanurateshave superior adhesive strengths up to 250◦C and solventresistance intermediate between difunctional epoxies andtetrafunctional epoxies or BMI resins. This may be due tolower cross-link density of the polycyanurate network.
Blends with Epoxies and BMIs
Cyanate esters can be effectively blended with epoxies,co-reacting to form cost-effective hybrids. While the reac-tion pathway appears to be somewhat complex—involvingcyanate trimerization epoxide insertion and ring cleavagewith additional epoxide to form substituted oxazolidinones[9,33]—the resulting reaction is simplified in Fig. 9.
Likewise, cyanate esters can be copolymerized withBMI resins to create hybrid systems. These so-called BT(bismaleimide-triazine) resins form a high Tg networkstructure through reaction of the double bond of themaleimide group with the cyano groups to form hetero-cyclic six-membered aromatic ring structures with twonitrogen atoms (pyrimidines) as shown in Fig. 10.
Modifying BADCy resins with epoxy or BMI resinscan lead to the properties shown in Table 3. The dataindicate that cure temperatures to obtain >95% conver-sion can be lowered 20–50◦C. The modified systems havelower ultimate Tg values but superior moisture resistance,with no significant loss of physical strength properties.Self-extinguishing flammability ratings are achieved at10–16% bromine content, depending on level of epoxymodification. Epoxy-resin-modified cyanate ester resinsnot only absorb less water than polycyanurate homopoly-mers and tetrafunctional epoxies but also retain a higherpercentage of HDT and reach moisture content equilib-rium sooner. The best performance for long-term boilingwater resistance appears to be formulations with 1.0–1.8epoxide equivalents per monomer cyanate group. Opti-mum cure for epoxy-modified cyanates is offered by copperacetylacetonate with 2 phr nonylphenol catalyst systems.
Resin Forms
Commercial quantities of cyanate ester monomersand resins are available in several forms, includingliquid monomers and oligomers, crystalline monomers,amorphous semisolid prepolymers or oligomers, hardprepolymers in powder or lump form, solvent solutions,and blends. Toxicity screening test for all forms indicatelow health hazards for ingestion or skin contact withbisphenol-type dicyanates. Table 4 gives typical toxicityscreen data. In solution products, the principal hazardsare associated with the solvents. This low toxicity is
Experimental shrinkage after curing cycle
Maximum shrinkage: 4%Thermal expansion: 3 %Total Shrinkage: 1 %
Volume in Preform: 3 cubic in.Diameter: 1.44 in.
Given a 2 GPa modulus of the resin, final interior pressure falls from 300 psi to a negative value
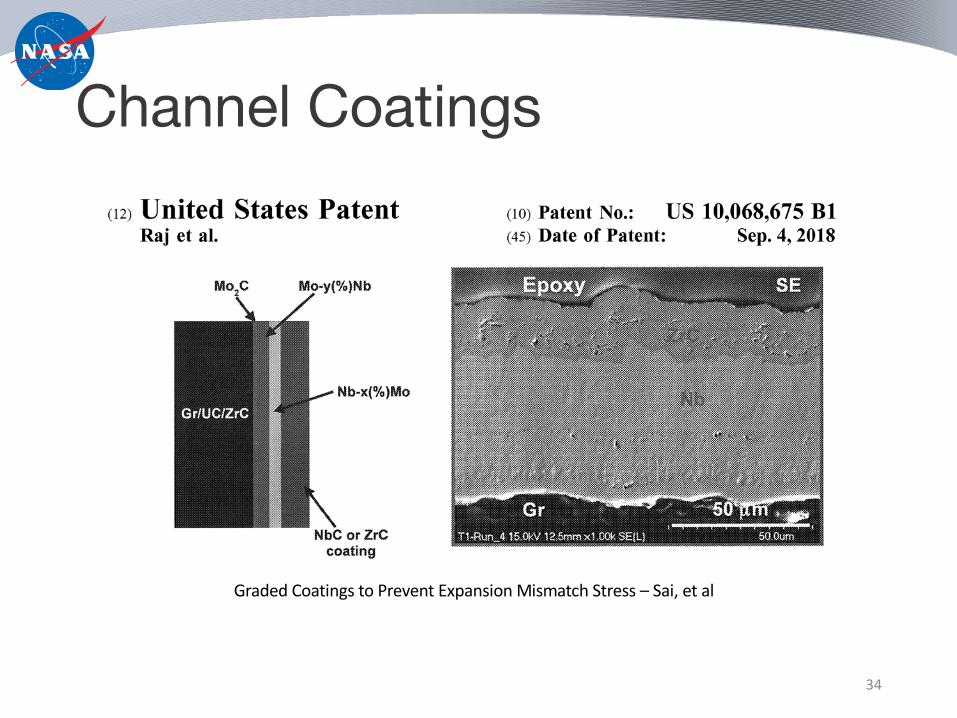
Channel Coatings
34
Graded Coatings to Prevent Expansion Mismatch Stress – Sai, et al
35
Gas Adsorption: Resin Interactions
!E = -41.7 kJ/mol
!E = -17.8 kJ/mol
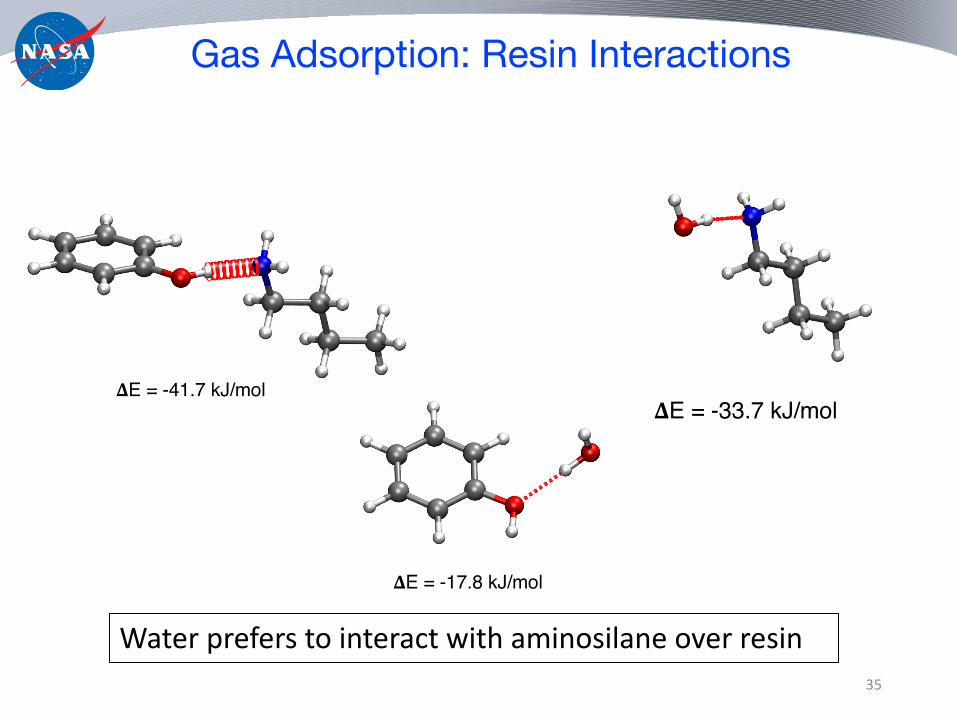
Fig. 3 Structures and energetics of phenol with aminosilane and water.
10
!E = -41.7 kJ/mol
!E = -17.8 kJ/mol
Fig. 3 Structures and energetics of phenol with aminosilane and water.
10
Water prefers to interact with aminosilane over resin