RESEARCH PAPER Computational Prediction of Drug Solubility in Fasted Simulated and Aspirated Human Intestinal Fluid Jonas H. Fagerberg & Eva Karlsson & Johan Ulander & Gunilla Hanisch & Christel A. S. Bergström Received: 6 May 2014 /Accepted: 15 August 2014 /Published online: 4 September 2014 # The Author(s) 2014. This article is published with open access at SpringerLink.com ABSTRACT Purpose To develop predictive models of apparent solubility (S app ) of lipophilic drugs in fasted state simulated intestinal fluid (FaSSIF) and aspirated human intestinal fluid (HIF). Methods Measured S app values in FaSSIF, HIF and phosphate buffer pH 6.5 (PhB pH6.5 ) for 86 lipophilic drugs were compiled and divided into training (Tr) and test (Te) sets. Projection to latent structure (PLS) models were developed through variable selec- tion of calculated molecular descriptors. Experimentally deter- mined properties were included to investigate their contribution to the predictions. Results Modest relationships between S app in PhB pH6.5 and FaSSIF (R 2 =0.61) or HIF (R 2 =0.62) were found. As expected, there was a stronger correlation obtained between FaSSIF and HIF (R 2 =0.78). Computational models were developed using calculated descriptors alone (FaSSIF, R 2 =0.69 and RMSE te of 0.77; HIF, R 2 =0.84 and RMSE te of 0.81). Accuracy improved when solubility in PhB pH6.5 was added as a descriptor (FaSSIF, R 2 =0.76 and RMSE Te of 0.65; HIF, R 2 =0.86 and RMSE Te of 0.69), whereas no improvement was seen when melting point (Tm) or logD pH 6.5 were included in the models. Conclusion Computational models were developed, that reli- ably predicted S app of lipophilic compounds in intestinal fluid, from molecular structures alone. If experimentally determined pH- dependent solubility values were available, this further improved the accuracy of the predictions. KEY WORDS biorelevant solubility . human intestinal fluid . simulated intestinal fluid . in silico . prediction INTRODUCTION Modern drug discovery programs using high throughput screening and combinatorial chemistry continue to favor the selection of large and lipophilic new chemical entities (NCE). This is in spite of their poor aqueous solubility [1–4], the increased awareness of related problems and the multitude of mnemonic rules for avoiding these compounds with low or variable absorption and pharmacokinetics [5–7]. Solubility in intestinal fluids is a key property for estimating absorption of oral drugs and in this context aspirated human intestinal fluid (HIF) has been described as the gold standard medium for these estimations [8,9]. However, there are disadvantages associated with its use. Ethical concerns about HIF sampling regulate the availability of the fluid. The amount available to the scientific community is therefore sparse and expensive. Other concerns are its low buffer capacity and batch variation in pH and bile content. These variations are due to differences in aspiration protocols and individual differences between volunteers [9,10], although differences due to the latter can be somewhat alleviated by pooling samples. Alternatives to HIF for dissolution testing and solubility measurements be- came available when Dressman and colleagues introduced fasted state simulated intestinal fluid (FaSSIF) in 1998 [11]. Other biorelevant dissolution media (BDM) have been devel- oped since then, some to closer mimic the intestinal milieu [12,13] and others for ease of preparation or lower expense [14,15]. Nonetheless the use of FaSSIF continues to be wide- spread and a large number of compounds and formulations have been evaluated in them. The medium contains taurocholate and lecithin that form mixed lipid aggregates in the form of vesicles which are colloidal structures known to efficiently solubilize drug molecules. The extent of J. H. Fagerberg : C. A. S. Bergström (*) Department of Pharmacy, Uppsala University, Biomedical Centre P .O. Box 580, SE-751 23 Uppsala, Sweden e-mail: [email protected]E. Karlsson : G. Hanisch Pharmaceutical Development, AstraZeneca R&D Pepparedsleden 1, SE-431 83 Mölndal, Sweden J. Ulander Cardiovascular & Metabolic Diseases, AstraZeneca R&D Pepparedsleden 1, SE-431 83 Mölndal, Sweden Pharm Res (2015) 32:578–589 DOI 10.1007/s11095-014-1487-z
Transcript
RESEARCH PAPER
Computational Prediction of Drug Solubility in Fasted Simulatedand Aspirated Human Intestinal Fluid
Jonas H. Fagerberg & Eva Karlsson & Johan Ulander & Gunilla Hanisch & Christel A. S. Bergström
Received: 6 May 2014 /Accepted: 15 August 2014 /Published online: 4 September 2014# The Author(s) 2014. This article is published with open access at SpringerLink.com
ABSTRACTPurpose To develop predictive models of apparent solubility(Sapp) of lipophilic drugs in fasted state simulated intestinal fluid(FaSSIF) and aspirated human intestinal fluid (HIF).Methods Measured Sapp values in FaSSIF, HIF and phosphatebuffer pH 6.5 (PhBpH6.5) for 86 lipophilic drugs were compiledand divided into training (Tr) and test (Te) sets. Projection to latentstructure (PLS) models were developed through variable selec-tion of calculated molecular descriptors. Experimentally deter-mined properties were included to investigate their contributionto the predictions.Results Modest relationships between Sapp in PhBpH6.5 andFaSSIF (R2=0.61) or HIF (R2=0.62) were found. As expected,there was a stronger correlation obtained between FaSSIF andHIF (R2=0.78). Computational models were developed usingcalculated descriptors alone (FaSSIF, R2=0.69 and RMSEte of0.77; HIF, R2=0.84 and RMSEte of 0.81). Accuracy improvedwhen solubility in PhBpH6.5 was added as a descriptor (FaSSIF,R2=0.76 and RMSETe of 0.65; HIF, R2=0.86 and RMSETe of0.69), whereas no improvement was seen when melting point(Tm) or logDpH 6.5 were included in the models.Conclusion Computational models were developed, that reli-ably predicted Sapp of lipophilic compounds in intestinal fluid, frommolecular structures alone. If experimentally determined pH-dependent solubility values were available, this further improvedthe accuracy of the predictions.
KEY WORDS biorelevant solubility . human intestinal fluid .simulated intestinal fluid . in silico . prediction
INTRODUCTION
Modern drug discovery programs using high throughputscreening and combinatorial chemistry continue to favor theselection of large and lipophilic new chemical entities (NCE).This is in spite of their poor aqueous solubility [1–4], theincreased awareness of related problems and the multitudeof mnemonic rules for avoiding these compounds with low orvariable absorption and pharmacokinetics [5–7]. Solubility inintestinal fluids is a key property for estimating absorption oforal drugs and in this context aspirated human intestinal fluid(HIF) has been described as the gold standard medium forthese estimations [8,9]. However, there are disadvantagesassociated with its use. Ethical concerns about HIF samplingregulate the availability of the fluid. The amount available tothe scientific community is therefore sparse and expensive.Other concerns are its low buffer capacity and batch variationin pH and bile content. These variations are due to differencesin aspiration protocols and individual differences betweenvolunteers [9,10], although differences due to the latter canbe somewhat alleviated by pooling samples. Alternatives toHIF for dissolution testing and solubility measurements be-came available when Dressman and colleagues introducedfasted state simulated intestinal fluid (FaSSIF) in 1998 [11].Other biorelevant dissolution media (BDM) have been devel-oped since then, some to closer mimic the intestinal milieu[12,13] and others for ease of preparation or lower expense[14,15]. Nonetheless the use of FaSSIF continues to be wide-spread and a large number of compounds and formulationshave been evaluated in them. The medium containstaurocholate and lecithin that form mixed lipid aggregates inthe form of vesicles which are colloidal structures known toefficiently solubilize drug molecules. The extent of
J. H. Fagerberg :C. A. S. Bergström (*)Department of Pharmacy, Uppsala University, Biomedical CentreP.O. Box 580, SE-751 23 Uppsala, Swedene-mail: [email protected]
E. Karlsson :G. HanischPharmaceutical Development, AstraZeneca R&DPepparedsleden 1, SE-431 83 Mölndal, Sweden
J. UlanderCardiovascular & Metabolic Diseases, AstraZeneca R&DPepparedsleden 1, SE-431 83 Mölndal, Sweden
Pharm Res (2015) 32:578–589DOI 10.1007/s11095-014-1487-z
solubilization is dependent on lipid concentration andsubstance-specific properties such as size, charge, flexibility,and lipophilicity. Drugs with a partition coefficient betweenoctanol and water (logP) greater than 3 have considerablyhigher apparent solubility (Sapp; the total concentration ofdrug dissolved in the lipid-containing dissolution medium) inBDM than in water or buffers [16–19]. Solubilization in lipidaggregates and molecular ionization as a response to the pHof the fluid can increase the Sapp in BDM of compoundsseveral orders of magnitude compared to that observed inwater.
Solubility measurements are time consuming. More im-portantly, the substances of interest must be synthesized beforetheir solubility can be evaluated. Computational predictionsof solubility, on the other hand, are rapid and can be per-formed on large compound libraries without synthesis of thesubstances. This provides the medicinal chemists with solubil-ity profiles on which they can make better informed decisions,and the costs associated with the pharmaceutical profilingcycle are reduced because of decreased demand for expensivesimulated or aspirated intestinal fluid. Solubility predictions inBDM, or even better HIF, are therefore highly warranted.
Numerous models for the prediction of intrinsic aqueoussolubility (S0), i.e., the solubility of the neutral compound, havebeen developed [20]. One of the most renowned is the generalsolubility equation (GSE) [21] and derivatives thereof [22,23]. These are based on logP, which typically can be compu-tationally predicted with an RMSE of around one log10 unit,and experimentally determined melting temperature (Tm).The latter is sometimes replaced with other properties moreamenable to trivial calculations or prediction such as MW[24]. Aqueous solubility can also be successfully predictedusing calculated molecular descriptors, see e.g. [25,26],.However, in the gastrointestinal tract, pH values range from~2.5 in the stomach to ~6.9 in the jejunum [10]. This pH-gradient greatly impacts the ionization of protolytic com-pounds and hence, the observed Sapp is dependent on theextent of ionization of a particular molecule. The pH-dependent solubility can be calculated from S0 and the disso-ciation constant (pKa) with the Henderson-Hasselbalch equa-tion [27]. However, the accuracy of these estimations variesconsiderably because the Henderson-Hasselbalch equationdoes not take into account aggregation or common ion/salteffects [28]. The complexity increases even more when solu-bility is measured in BDM since the apparent solubility inthese media is a result of ionization, aggregation and solubi-lization. We have previously attempted to predict Sapp inbiorelevant media using a small dataset [16,17]. A predictiveartificial neural network (ANN) model for FaSSIF solubility isalso available in the commercial software ADMET Predictorfrom Simulations Plus. However, no transparent models forprediction of FaSSIF Sapp have been developed using publiclyavailable solubility data for drugs, nor have any predictive
models of HIF Sapp been proposed. Here, we report an opendatabase applicable for solubility modeling in FaSSIF andHIF. This database has been used to develop transparentand reliable models for the prediction of solubility in FaSSIFand HIF with the aim of revealing molecular features thatdrive solubilization in these fluids.
METHODS
Datasets
Sapp values for 86 drugs in FaSSIF (3 mM taurocholate,0.75 mM lecithin in PhBpH6.5 [11]) were extracted from in-house databases [8,16,17,29] and literature sources [30–38](Table I). To reduce experimental variability in the dataset themain part of the compounds was obtained from our in-housedatabases in which solubility measurements taking use ofshake-flask or the μDISS Profiler are reported. Only com-pounds with a calculated logP greater than 2 were includedsince it is assumed that there is significant solubilization ofhighly lipophilic compounds in the mixed lipid aggregatespresent in FaSSIF [16–19]. Hence, we argue that for com-pounds with log P<2, in silico models predicting solubility inpH-adjusted water/simple buffer are also predictive of theirsolubility in intestinal fluid (Fig. S1). The FaSSIF Sapp valueswere supplemented with the corresponding Sapp values inPhBpH6.5 and the Tm, when available, for the free base orfree acid (i.e., not salts).
This same approach was used in the selection of a datasetfor which solubility in aspirated HIF was available (Table I).An additional criterion for this dataset was that correspondingsolubility measurements were available in FaSSIF and that thesame protocol had been used for solubility measurements inFaSSIF and HIF. The final HIF dataset consisted of 48compounds. In addition to the FaSSIF and HIF literaturedatasets, a discovery dataset of 26 AstraZeneca proprietarycompounds for which the Sapp in FaSSIF, HIF and PhBpH6.5
were available was used as an external validation dataset forthe developed models.
Calculation of Molecular Descriptors
Molecular structures for the compounds were obtained asSMILES strings (Table SI) and converted to energy-mini-mized, three-dimensional structures with added implicit hy-drogens using Corina 3.49 (Molecular Networks, Germany).Molecular descriptors from the resulting structures were gen-erated using DragonX 6.0.16 (Talete, Italy). The descriptorswere blinded to avoid selection bias, cubic-root transformed,mean-centered and scaled to unit variance. Thereafter, anydescriptors not displaying normal distribution were excludedfrom the model development.
Computational Prediction of Drug Solubility in Intestinal Fluids 579
TableIPhysico
chem
icalproperties
andS appoftheinvestigatedcompounds
a
Com
pound
Set
Mw(Da)
logD
pH6.5
Polar
Surface
Area
(Å2 )
Rotablebonds(count)
logS appPhB
pH6.5(M
)logS appFaSSIF(M
)logS appHIF(M
)Tm
(°C)
Albendazole
Te265.3
3.2
79.7
6−5.49
−5.14
−4.45
178.1
Amiodarone
Tr645.3
5.2
193.0
9−7.30
−3.26
−3.23
159.0
Amitriptyline
Tr277.4
2.4
2.2
3−2.49
−2.50
196.5
Amprenavir
Tr505.6
1.7
138.0
13−3.47
−3.65
−3.74
72.0
Aprepitant
Te534.4
4.4
325.0
8−6.16
−4.37
−4.61
252.0
Astemizo
leTr
458.6
4.4
57.6
8−4.38
−3.67
−4.68
174.4
Atovaquone
Tr366.9
3.7
155.0
2−5.93
−5.29
−6.06
224.0
Azelnidipine
Te582.7
6.0
174.0
8−3.97
122.0
Bicalutamide
Tr430.4
2.6
251.0
7−4.65
273.0
Brom
azepam
Tr316.2
1.8
144.0
0−3.42
243.0
Brom
ocriptine
Tr654.6
3.6
167.0
6−4.05
215.0
Carbamazepine
Tr236.3
2.6
73.5
1−3.27
−3.00
−2.92
191.0
Carvedilol
Te406.5
2.4
70.9
10−3.95
−3.86
−4.05
114.1
Celecoxib
Tr381.4
3.5
222.0
2−4.29
158.0
Cilostazole
Te369.5
2.8
139.0
7−4.77
−4.76
159.0
Cinnarizine
Tr368.5
4.3
2.6
5−5.42
−4.44
−4.28
119.0
Cisapride
Tr466.0
2.6
182.0
9−5.27
−4.86
110.0
Clotrimazole
Tr344.9
5.2
50.4
4−5.17
−5.00
−4.13
142.0
Cyclosporine
Te1202.6
3.0
179.0
15−5.80
−5.32
−5.54
150.0
Danazol
Tr337.5
3.6
68.8
1−5.75
−4.60
−4.84
227.0
Diazepam
Te284.8
2.9
105.0
0−3.91
−3.64
−3.28
131.6
Diclofenac
Tr296.2
2.2
169.0
4−2.78
−2.59
−2.52
158.0
Diethylstilb
estro
lTr
268.4
4.8
80.2
2−4.31
−3.83
−3.85
171.0
Digo
xinTe
781.0
1.4
241.0
7−4.69
−4.66
249.0
Dipyridam
ole
Te504.6
1.8
103
12−4.9
−4.64
−4.24
163.0
Diso
pyramide
Te339.5
−0.2
58.7
8−3.24
−3.03
96.4
Efavirenz
Te315.7
3.9
214.0
3−3.41
139.0
Felodipine
Tr384.3
4.8
136.0
4−5.51
−3.85
−4.44
143.0
Fenofibrate
Te360.8
5.3
138.0
5−6.26
−4.58
−4.26
79.0
Flufenam
icacid
Tr281.2
2.6
167.0
3−2.75
−2.48
−2.82
133.5
Fluoxetine
Tr309.3
1.6
109.0
7−2.35
132.8
Gefitin
ibTe
446.9
3.8
147.0
8−5.04
−3.72
−3.72
119.0
Glibenclamide
Tr494.0
3.9
203.0
10−5.04
−5.02
−4.12
173.6
Griseofulvin
Tr352.8
2.5
135.0
3−4.38
−4.18
−4.32
219.0
580 Fagerberg et al.
TableI(con
tinu
ed)
Com
pound
Set
Mw(Da)
logD
pH6.5
Polar
Surface
Area
(Å2 )
Rotablebonds(count)
logS appPhB
pH6.5(M
)logS appFaSSIF(M
)logS appHIF(M
)Tm
(°C)
Halo
fantrine
Te500.4
6.0
252.0
11−4.07
77.0
Halo
peridol
Tr375.9
2.0
160.0
5−3.68
−3.53
151.0
Ibuprofen
Tr206.3
1.8
73.8
4−2.17
−2.02
76.0
Indinavir
Tr613.8
3.0
72.5
14−3.90
−4.31
−4.16
167.5
Indomethacin
Te357.8
1.5
185.0
3−3.21
−2.91
−2.46
159.8
Indoprofen
Te281.3
0.7
102.0
3−2.98
−2.66
211.4
Irbesartan
Tr428.5
4.0
108.0
5−3.62
−3.58
−3.54
180.5
Isotre
tinoin
Te300.4
4.4
74.7
0−3.76
174.0
Ivermectin
Te875.1
4.7
112.0
8−6.10
−3.86
150.0
Ketoconazole
Tr531.4
3.9
181.0
8−4.56
−3.50
−3.98
146.0
Lansoprazole
Tr369.4
1.8
161.0
6−4.17
−3.97
178.0
Loperamide
Tr477.1
3.9
112.0
8−4.04
−3.67
130.0
Lopinavir
Te628.8
4.2
67.0
17−5.76
−4.04
−4.67
124.0
Lorazepam
Tr321.2
2.6
213.0
0−3.44
−2.93
167.0
Loviride
Tr351.2
3.2
177.0
4−5.55
−4.92
−3.71
286.8
Naproxen
Tr230.3
1.3
84.5
3−3.00
−2.67
−2.05
155.6
Nefazodone
Tr470.0
3.9
110.0
10−3.27
83.5
Nelfinavir
Te567.8
4.7
83.8
11−6.16
−3.68
−4.01
349.8
Nevirapine
Tr266.3
1.7
55.9
1−3.51
−3.14
196.1
Nimesulide
Tr308.3
2.3
164.0
4−4.13
−3.93
−3.56
144.0
Nitrendipine
Tr360.4
3.5
126.0
4−4.95
−4.35
−4.95
157.7
Omeprazole
Tr345.4
1.9
76.9
5−3.28
−3.10
−3.03
156.0
Panadiplon
Tr335.4
2.5
57.5
2−3.64
−3.60
169.0
Phenazopyridine
Tr213.2
2.8
115.0
0−3.08
−2.67
139.0
Phenytoin
Tr252.3
2.2
113.0
2−3.81
−3.77
295.6
Pranlukast
Tr481.5
3.3
177.0
8−5.17
−3.75
236.0
Praziquantel
Te312.4
2.2
55.0
2−3.17
−3.08
139.0
Probenecid
Te285.4
0.0
132.0
6−2.34
−2.24
−2.59
198.9
Probucol
Te516.9
10.0
14.9
8−8.94
−5.18
−5.75
126.0
Progesterone
Tr314.5
3.8
63.1
1−4.45
−4.09
−4.08
128.0
Quinidine
Tr324.4
1.5
39.4
4−2.19
−2.16
−2.70
174.0
Rifam
picin
Te823.0
3.0
158.0
4−2.92
−2.61
−2.14
183.0
Riluzole
Tr234.2
2.3
159.0
2−2.58
119.0
Rimonabant
Tr463.8
5.3
227.0
2−6.39
−4.62
−4.93
154.7
Computational Prediction of Drug Solubility in Intestinal Fluids 581
TableI(con
tinu
ed)
Com
pound
Set
Mw(Da)
logD
pH6.5
Polar
Surface
Area
(Å2 )
Rotablebonds(count)
logS appPhB
pH6.5(M
)logS appFaSSIF(M
)logS appHIF(M
)Tm
(°C)
Ritonavir
Tr721.0
4.6
77.9
22−5.27
−5.07
−4.32
120.0
Rofecoxib
Tr314.4
2.7
119.0
1−4.61
−4.53
207.0
Salsalate
Tr258.2
0.8
119.0
2−2.21
147.0
Saquinavir
Te670.9
4.1
152.0
15−3.93
−3.57
−4.24
349.8
Sertraline
Tr306.2
2.8
135.0
2−3.10
219.0
Spironolactone
Te416.6
3.0
111.0
2−4.21
134.5
Sulfasalazine
Tr398.4
0.3
188.0
5−3.49
−3.34
−2.86
255.0
Tamoxifen
Tr371.5
4.8
8.6
5−4.80
−3.38
−3.77
97.8
Tamsulosin
Te408.5
1.1
121.0
11−2.45
226.0
Telmisartan
Tr514.6
4.5
79.8
4−5.37
269.0
Terfenadine
Tr471.7
3.5
46.2
9−4.62
−3.74
149.6
Tipranavir
Tr602.7
6.0
189.0
12−5.19
−4.47
−4.00
86.0
Tolectin
Te257.3
0.1
99.5
2−2.14
156.0
Tolfenamicacid
Tr261.7
2.9
129.0
2−3.98
−3.62
213.0
Troglitazone
Te441.6
4.9
143.0
5−4.96
184.0
Warfarin
Tr308.3
3.1
70.8
4−3.19
−2.94
−2.99
161.0
Voriconazole
Tr349.3
2.1
146.0
5−2.72
127.0
Zafirlukast
Te575.7
4.1
123.0
10−5.44
139.0
Min
206.3
−0.2
2.2
0−8.94
−5.44
−6.06
72.0
Max
1202.6
10.0
325.0
22−2.19
−2.14
−2.02
349.8
Median
369.0
3.0
122.0
5−4.38
−3.73
−4.00
158.0
aSetindicatestraining(Tr)or
test(Te)setclassificationintheFaSSIFmodels.Allcom
pounds
listedwereused
asthetrainingsetintheHIFmodel.M
Wrepresentsmolecularwheigh
tinDaltons.logD
pH6.5isthelogarithm
ofoctanol/w
aterpartitioning
atpH
6.5,aspredicted
fromtheAD
MET
predictor
(Simulations
Plus,C
A).T
hissoftwarewasalsoused
tocalcu
latepolar
surface
area
andnumbero
frotatablebonds.Ap
parentsolubility
inPhB p
h6.5,FaSSIFandHIFisexpressedasthelogarithm
ofmolarequilibrium
concentration
582 Fagerberg et al.
We also used ADMET Predictor 6.5 (Simulations Plus,CA) to predict FaSSIF Sapp for the compounds and to calcu-late pKa (Table SI) and pH-dependent lipophilicity at pH 6.5(logDpH6.5), polar surface area (PSA), and number of rotatablebonds, see Table I. The predictions of FaSSIF were used as acomparator for our predictions.
In Silico Model Development
Partial least squares projection to latent structures (PLS)models were developed with the purpose of predicting Sappvalues in FaSSIF and in HIF. The respective models weredeveloped with Simca-P 13.0.2.0 (Umetrics, Sweden) using astandardized protocol previously implemented by our group[39,40]. The responses were used in the logarithmic form ofthe solubility in the two different media. For the FaSSIFmodel, the compounds were randomized into a training (Tr,n=56) and a test (Te, n=30) set. The compounds were sortedby their Sapp to achieve an even distribution and as wide apredictive range as possible. Every third compound was thenassigned to the test set. The structural diversity and the suit-ability of the selected test set was thereafter tested by a prin-cipal component analysis (PCA) extracted from all descriptors.Any training set outliers identified in the PCA (SupportingInformation, Fig. S2) or distance–to–the–model–of–X [41](DmodX) were moved to the corresponding test set to avoidsuch compounds weighting the training of the models. PCAwas also used to ensure that the training and test sets were welldistributed in the chemical space. In addition to the literature-derived test set, a discovery dataset of 26 AstraZeneca in-house compounds was used to challenge the model. For theHIF model, these discovery compounds were used as the soletest set while the training set consisted of the literature values.PCA confirmed that the chemical space of this dataset wascovered by the training set (Fig. S2).
All but the top 100 descriptors (Table SII) (as defined byvariable of importance–to–projection, VIP) were excluded inthe first step of model development. The variable selectionprocedure was thereafter based on the VIP and the loadingplots, and monitored by the leave-one-out (using 7 groups),cross-validated R2 (Q2). The variable selection was performedto remove non-significant descriptors and increase modelrobustness. If the exclusion of a variable resulted in an equalor improved Q2, the variable was permanently eliminatedfrom the model. The variable selection procedure was repeat-ed until no further descriptors could be removed without aresultant lower Q2. Only thereafter was the accuracy of theprediction of the test set investigated.
In the second step, the impact of experimental data com-monly available during early development was investigated byadding such measured data to the final model obtained afterthe completion of variable selection. The investigated exper-imental data were Sapp in PhBpH6.5, Tm, and logDpH6.5.
Measured PhBpH6.5 Sapp was available for 76% of thecompounds (Table I). It was not possible to extractmeasured logDpH6.5 for a large number of the com-pounds and therefore the calculated logDpH6.5
(ADMET Predictor, Simulations Plus, CA) was usedfor all of them. Whether these properties were beneficialor not for the models was evaluated in the same man-ner as for the calculated descriptors, see above.
In addition to the models above, a consensus model wasestablished which used the developed FaSSIF PLS modelbased on calculated descriptors only and the predictions ob-tained from ADMET Predictor ANN model. No weightingwas performed. The consensus model used the average of thepredicted logSapp from the developed PLS model and thecommercial ANN model.
RESULTS
Physicochemical Properties and Apparent Solubility
The datasets used were structurally diverse. The FaSSIFmodelling dataset (Table I) ranged in size from 206.3 to1202.6 Da with a median mass of 369; hydrogen bondcapacity in the form of PSA ranged from 2.2 to 325 Å2
with a median of 122 Å2; and molecular flexibility(described by the number of rotatable bonds count)ranged from 0 to 22, with a median of 5. The datasetwas selected to focus on lipophilic compounds andtherefore all compounds had a calculated AlogP-value>2 (obtained from the software DragonX). In spite ofthis lipophilicity criterion, the predicted pH-dependent
FaS
SIF
log
Sap
p (
M)
Tr Te AZ Te-6
-5
-4
-3
-2
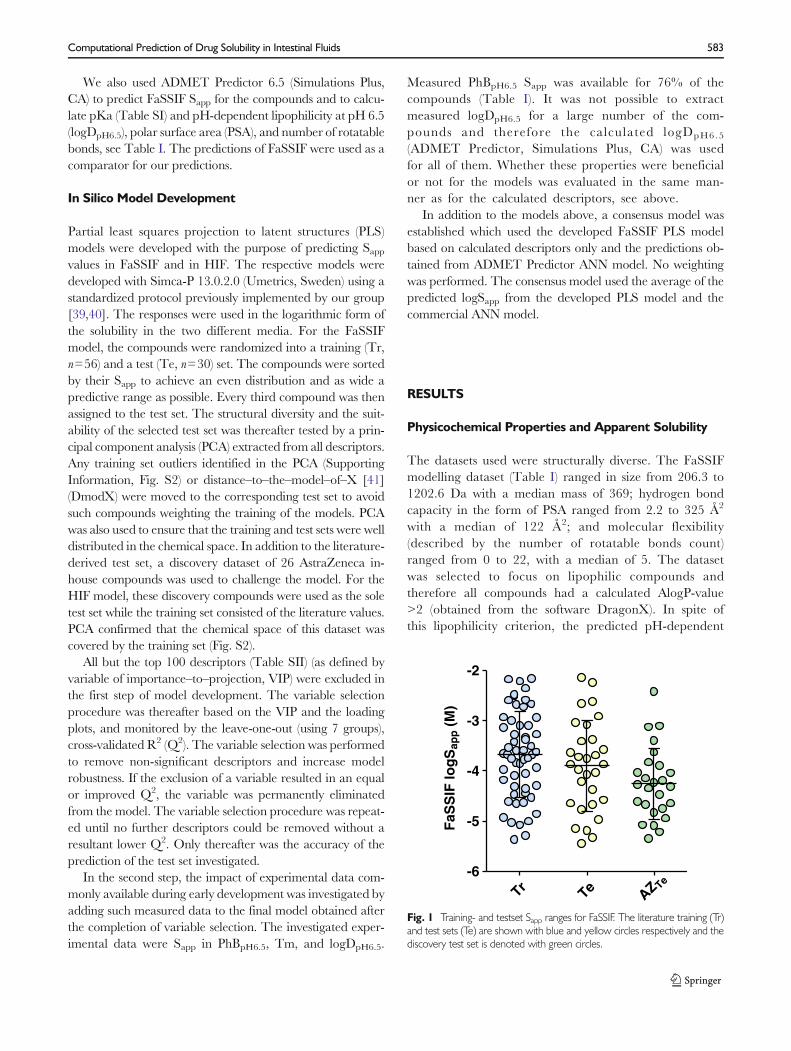
Fig. 1 Training- and testset Sapp ranges for FaSSIF. The literature training (Tr)and test sets (Te) are shown with blue and yellow circles respectively and thediscovery test set is denoted with green circles.
Computational Prediction of Drug Solubility in Intestinal Fluids 583
lipophilicity logD6.5 values from ADMETPredictorranged over 10 orders of magnitude, from -0.2 to10.0. The solubility varied 2000- and 10,000-fold inFaSSIF and HIF, respectively (Table I).
The solubility range of the training set was similar to that ofthe literature test set, whereas the 26 discovery compoundsused to challenge the models had a somewhat lower solubility(Fig. 1).
The solubility values of the dataset revealed modest rela-tionships between measured solubility in PhBpH6.5 andFaSSIF or HIF (R2:0.61 and R2:0.62, respectively, Fig. 2).The PhBpH6.5 and FaSSIF Sapp correlation was considerablyweaker for the more lipophilic compounds (logDpH6.5>4) forwhich R2 decreased to 0.28. However, for compounds with alogDpH6.5<3, there was a strong correlation (R2: 0.82) Thecorrelation between FaSSIF Sapp andHIF Sapp was also strong(R2: 0.78) but unaffected by lipophilicity (Fig. 2c). Under- orover-prediction of the solubility was not related to meltingpoint or lipophilicity.
Prediction of Intestinal Solubility
The developed PLS models are summarized in Table II.The FaSSIF model (Fig. 3a) required seven calculateddescriptors to produce two principal componentsresulting in R2 of 0.69, Q2 of 0.64 and an RMSEtr of0.48 log10 units. The HIF model (Fig. 4a), based onnine descriptors, had a higher R2 of 0.84 (Q2 of 0.78)and a lower RMSEtr (0.34). The inclusion of experi-mentally determined Sapp in PhBpH6.5 strengthened thepredictive power of both models to R2 of 0.76 (FaSSIF)and 0.86 for HIF (Figs. 3b and 4b, respectively), and itreduced the RMSE of the test sets (Table II). Inclusionof Tm and logDpH6.5 did not improve the developedmodels. Further, these properties were unable to identifyover- or under-predicted compounds or any clusters.
All descriptors remaining after the variable selectionwere significant in either both or the last component.For the FaSSIF model these include: i) eigenvaluesweighted by bond order (Eig04_EA(bo)) or edge degree(Eig04_AEA(ed)); ii) a spectral moment of order 6 fromBurden matrix weighted by van der Waals volume; andiii) a second-component accessibility directional WHIMindex weighted by van der Waals volume; all thesedescriptors negatively influenced the solubility. These
descriptors are related to some extent to molecular size.Geary autocorrelation (GATS4s) and Morse signal
PhBpH6.5 logSapp (M)
FaS
SIF
log
Sap
p (
M)
-8 -6 -4 -2
-8
-6
-4
-2
PhBpH6.5 logSapp (M)
HIF
log
Sap
p (
M)
-8 -6 -4 -2
-8
-6
-4
-2
FaSSIF logSapp (M)
HIF
log
Sap
p (
M)
-6 -5 -4 -3 -2
-6
-5
-4
-3
-2
a
b
c
�Fig. 2 Correlation between HIF, FaSSIF and buffer pH 6.5 Sapp correlations.a FaSSIF and PhBpH6.5, b HIF and PhBpH6.5, and c HIF and FaSSIF. Lightgray circles represent compounds with a predicted logDpH6.5 below 3. Graycircles denote compounds with logDpH6.5 between 3 and 4. Dark gray circlesshows compounds with a logDpH6.5 above 4.
584 Fagerberg et al.
26(Mor26s), both weighted by intrinsic state and thefrequency of N – O at a topological distance of 5(F05[N-O]) correlated with a high Sapp in FaSSIF(Fig. 5a and b).
The HIFmodel descriptors included an eigenvalue weight-ed by bond order (Eig03_AEA(bo)), Morse signal 4 weightedby ionization potential (Mor04i) and an eigenvalue fromreciprocal squared distance matrix (SpMax_H2); these werefound to limit the Sapp. The HIF Sapp was further positivelyinfluenced by the following descriptors:, R maximal index(RTe+) and a WHIM index (E3e) both weighted bySanderson electronegativity, R maximal autocorrelationweighted by ionization potential (R1i+), the presence of N –O at topological distance 5(B05[N-O]), CATS2D acceptor-acceptor at lag 09 (CATS2D_09_AA) and hydrogen attachedto alpha carbons (H-051) (Fig. 5c and d).
The model using calculated descriptors over-predicted theFaSSIF Sapp of albendazole and cilostazole by one logarithmicunit or more. On the other hand, ivermectin, tamsulosin, andtolectin were all under-predicted by one log10 unit or more.The inclusion of measured Sapp in PhBpH6.5 as a descriptorimproved the predictions for cilostazole and albendazole andreduced their residual values by 0.41 and 0.69 log10 unitsrespectively.
The consensus model based on the calculations obtainedfrom our FaSSIF model and the ADMET Predictor resultsexhibited a lower RMSEte (0.70) compared to each of themodels separately (Table III). The PLS model was howevermore accurate compared to the consensus model in the
prediction of the solubility of the discovery test set.Importantly, predictions of outliers resulting from each ofthe PLS and ANN models were greatly improved by consen-sus modelling (Fig. 6).
DISCUSSION
Intestinal solubility, together with permeability over the intes-tinal wall, are the two most important drug properties deter-mining absorption after oral intake. Solubility measurementsin HIF will continue to be important in understanding intes-tinal solubility, but the medium is expensive and subject tobatch variations. Therefore, a number of BDMs have beendeveloped as robust and reproducible surrogates. The strongcorrelation between FaSSIF and HIF Sapp found herein con-firms those reported previously [8, 9] and further supports theuse of in vitro experiments in BDMs, such as FaSSIF, for theprediction of intestinal solubility.
The aim of this study was to develop predictive models forSapp in FaSSIF and HIF using calculated descriptors alone orin conjunction with experimental data likely to be available inearly drug discovery or development stages. The descriptorsincluded in the final FaSSIF model can be used to interpretmolecular properties of importance for solubility in FaSSIF.The descriptors reveal that larger structures are solubilized toa lesser extent than the smaller ones. Most likely this is as aresult of the increased cavity that needs to be formed in the
Table II Model Summary.Model Descriptors R2 Q2 RMSETr RMSETe n in Te
a bFig. 3 Prediction results forsolubility in FaSSIF. a FaSSIF modelbased on seven calculateddescriptors and b the same butincluding measured buffer solubility.Light green circles represent thetraining set while green and darkgreen circles denote the literaturetest set and discovery test set,respectively.
Computational Prediction of Drug Solubility in Intestinal Fluids 585
Predicted HIF logSapp (M)
Ob
serv
ed H
IF lo
gS
app (
M)
-6 -5 -4 -3 -2
-6
-5
-4
-3
-2TrTe
Predicted HIF logSapp (M)
Ob
serv
ed H
IF lo
gS
app (
M)
-6 -5 -4 -3 -2
-6
-5
-4
-3
-2TrTe
a bFig. 4 Prediction results forsolubility in HIF. a HIF model basedon nine calculated descriptors and bthe same but including measuredbuffer solubility. Light blue circlesshow the literature training set whileblue circles represent the discoverycompound test set.
Weights in first component
Wei
gh
ts in
sec
on
d c
om
po
nen
t
-0.6 -0.3 0.0 0.3 0.6
0.0
0.4
0.8
SM6_B(v)
GATS4s
Eig04_EA(bo)
Eig04_AEA(ed)
Mor26s
E2v
F05[N-O]
Sapp FaSSIF
Weights in first component
Wei
gh
ts in
sec
on
d c
om
po
nen
t
-0.6 -0.3 0.0 0.3 0.60.0
0.4
0.8
Sapp PhB pH6.5
SM6_B(v)
GATS4s
Eig04_EA(bo)
Eig04_AEA(ed)
Mor26s
E2v
F05[N-O]
Sapp FaSSIF
Weights in first component
Wei
gh
ts in
sec
on
d c
om
po
nen
t
-0.6 -0.3 0.0 0.3 0.6-0.6
-0.3
0.0
0.3
0.6
SpMax_H2
Eig03_AEA(bo)
Mor04i
E3e
RTe+R1i+
H-051
CATS2D_09_AA
B05[N-O]
HIF Sapp
Weights in first component
Wei
gh
ts in
sec
on
d c
om
po
nen
t
-0.6 -0.3 0.0 0.3 0.6-0.6
-0.3
0.0
0.3
0.6
PhBpH6.5 Sapp
SpMax_H2
Eig03_AEA(bo)
Mor04i
E3e
RTe+
R1i+
H-051
CATS2D_09_AA
B05[N-O]
HIF Sapp
a
c
b
d
Fig. 5 Loading plots for the FaSSIF and HIF models. a FaSSIF model loading plot and b with measured PhBph6.5 Sapp as additional descriptor. c HIF modelloading plot and d experimentally determined PhBph6.5 Sapp as a_descriptor.
586 Fagerberg et al.
water as well as the increased molecular surface area exposedto the water. In addition, aromatic structures were revealed tobe less hydrated than aliphatic ones. We speculate that thiscould be because of their stronger crystal lattices, due to thestronger van der Waals interactions formed by the densepacking. Further, when in the water, rigid aromatic structureshave a larger molecular surface area exposed to the solventthan flexible aliphatic chains that can change conformation toshield the carbon skeleton from water molecules. The descrip-tors also identify the importance of hydrogen bond donor andacceptors for the hydration of the molecule. Although thedescriptors in the HIF model differ to some extent from thoseof the FaSSIF model, they too reflect similar properties.
During the model development we tested three empiricalor semi-empirical descriptors. The addition of experimentallydetermined Sapp in PhBpH6.5 as a descriptor improved bothdeveloped PLS models considerably. This solvent can beregarded as a blank FaSSIF because it is a phosphate buffer(pH 6.5) that does not contain any mixed lipid aggregates.Ionizable compounds are therefore charged to the same ex-tent in both media and information on this effect facilitates theprediction. The relationship between PhBpH6.5 and FaSSIFSapp was modest and weak for the lipophilic compounds. It istherefore interesting to note that such a divergence was notseen in the PLS predictions regardless of whether or notPhBpH6.5 was included as an experimentally determined de-scriptor. Tm and lipophilicity expressed as logP or logDpH6.5
are common inputs for aqueous solubility predictions, andwere therefore tested herein. However, neither logDpH6.5
nor Tm improved the developed models. Intestinal fluidscontain lipid aggregates that may solubilize lipophilic drugmolecules and it is well-known that logP is not a good descrip-tor of solubility in lipids, see e.g. [40],. The reduced solubilityof the bulk water seen in intestinal fluids with higher logDpH6.5
is to some extent compensated by partitioning to and/orsolubilization in the aggregates. To elucidate if Tm orlogDpH6.5 were described to some extent by the selectedcalculated descriptors these properties were used as responsesin the models. We found no indication of correlation betweenthe selected descriptors and lipophilicity or solid state proper-ties of the compounds (R2<0.45). An interesting aspect of theincreased accuracy of the predictions when Sapp in PhB6.5 isincluded as descriptor is that the influence of the solid state on
the Sapp is diminished. Hence, the PhB6.5 contributes to betterpredictions at two levels; the hydration is better described as aresult of the correct description of the pH-dependent solubilityand the impact of the dissociation of molecules from thecrystal lattice is embedded in this solubility input variable.
It was possible to further improve the FaSSIF predictionsby performing consensus modeling based on the combinationof two different computational models that used only calcu-lated descriptors. The combination of the (ANN) FaSSIFmodel results (obtained from ADMET Predictor) with thePLS predictions increased the predictive power, as identifiedfrom the lowered RMSEte (Table III). Three test sets wereevaluated: all test compounds (n=75), a literature-derived testset (n=49), and a discovery test set of AstraZeneca proprietarycompounds (n=26). For all three, the consensus model per-formed better than the worst-performing computational mod-el. Most importantly, the consensus model increased the ro-bustness and reduced the number of outliers (Fig. 6). Indeed,for the 23 compounds that were 10 to 320-fold over- or under-predicted by either of the two models, the employment of theconsensus model reduced the RMSE to <1 log unit for 12 ofthem. Of these 23 compounds, 14 were significantly falselypredicted by the ANN, 5 by the PLS, and 4 by both. Since it isdifficult to deem beforehand which one of several models willbe the most accurate predictor for any new compound orcompound series, it is advisable to employ consensus model-ling based on two or more models.
There are a number of hurdles to allow increased accuracyin solubility predictions in BDM. The models developed here-in that are based on calculated descriptors alone are reliableand statistically strong, but the observed residual errors doimply that the predictions could be up to tenfold off in eitherdirection. This is not uncommon for predictions of solubilityin aqueous media and the developed models are certainlyaccurate enough for guiding decision-making in drug
Table III Consensus model performance.a
Test Set FaSSIFPLS FaSSIFANN FASSIFConsensus
CombinedTe 0.77 0.82 0.70
LiteratureTe 0.89 0.73 0.71
AZTe 0.62 0.91 0.69
a RMSEs for the different test sets of the developed PLS model, the commer-cial ANN model, and the resulting average consensus model
Predicted FaSSIF logSapp (M)
Ob
serv
ed F
aSS
IF lo
gS
app (
M)
-6 -5 -4 -3 -2
-6
-5
-4
-3
-2
Consensus modelSingel model PLS or NN
Fig. 6 Consensus model for compounds with residuals over 1 log10 unit inany model based on calculated descriptors. Light green circles without outlineshow the worst prediction from either the ANN or PLS model. Outlined darkturquoise circles represent the consensus model prediction.
Computational Prediction of Drug Solubility in Intestinal Fluids 587
discovery and development. To further improve the compu-tational predictions of solubility in media containing mixedlipid aggregates molecular dynamics (MD) simulation is apromising tool to study solubilization interactions [42,43].MD simulation also has the potential to predict self-aggregation and the tendency to form mixed micelle aggre-gates. Food effects on bioavailability is another issue related toBDM and larger datasets need to be studied for solubility infed state BDM to obtain information on molecular features ofdrug molecules that are significantly affected by the increasedlipid content in the fed state.
CONCLUSIONS
Measurements of solubility in physiologically relevant mediasuch as FaSSIF andHIF are costly and in part restricted by thelimited access to intestinal fluids aspirated from donors.Herein we present computational approaches to instead pre-dict intestinal solubility taking use of calculated moleculardescriptors to allow this property to be estimated alreadybefore compound synthesis. It was found that the Sapp oflipophilic compounds in FaSSIF and in HIF was possible topredict by this approach. The most accurate predictions wereobtained when a consensus modeling approach was used,which reduced the number of outliers obtained from predic-tions based on a single computational model. Further, wehave examined experimental parameters within reach duringearly drug development and identified pH-dependent solubil-ity as a descriptor that further increases the accuracy of thepredictions.
ACKNOWLEDGMENTS AND DISCLOSURES
J.H.F. and C.A.S.B are grateful for financial support from theSwedish Research Council (Grants 621-2008-3777 and 621-2011-2445) and the Swedish Medical Products Agency. Weare also thankful to Simulations Plus (Lancaster, CA, USA) forproviding the Department of Pharmacy, Uppsala University,with a reference site license for the software ADMETPredictor.
OpenAccessThis article is distributed under the terms of theCreative Commons Attribution License which permits anyuse, distribution, and reproduction in any medium, providedthe original author(s) and the source are credited.
REFERENCES
1. Hann MM. Molecular obesity, potency and other addictions in drugdiscovery. Med Chem Comm. 2011;2(5):349–55.
2. Benet LZ, Wu CY, Custodio JM. Predicting drug absorption and theeffects of food on oral bioavailability. Bull Tech Gattefossé.2006;99:9–16.
3. Koslov-Davino E, Wang X, Schroeter T. Target promiscuity andphysicochemical properties contribute to pharmacologically inducedER-stress. Toxicol in Vitro. 2013;27(1):204–10.
4. Leeson PD, Springthorpe B. The influence of drug-like concepts ondecision-making in medicinal chemistry. Nat Rev Drug Discov.2007;6(11):881–90.
5. Young RJ, Green DVS, Luscombe CN, Hill AP. Getting physical indrug discovery II: the impact of chromatographic hydrophobicitymeasurements and aromaticity. Drug Discov Today. 2011;16(17–18):822–30.
6. Lipinski CA, Lombardo F, Dominy BW, Feeney PJ. Experimentaland computational approaches to estimate solubility and permeabil-ity in drug discovery and development settings. Adv Drug Deliv Rev.1997;23(1–3):3–25.
7. Hughes JD, Blagg J, Price DA, Bailey S, DeCrescenzo GA,Devraj RV, et al. Physiochemical drug properties associatedwith in vivo toxicological outcomes. Bioorg Med Chem Lett.2008;18(17):4872–5.
8. Söderlind E, Karlsson E, Carlsson A, Kong R, Lenz A, Lindborg S,et al. Simulating fasted human intestinal fluids: understanding theroles of lecithin and bile acids. Mol Pharm. 2010;7(5):1498–507.
9. Augustijns, P., Wuyts, B., Hens, B., Annaert, P., Butler, J., andBrouwers, J., A review of drug solubility in human intestinal fluids:Implications for the prediction of oral absorption. Eur J Pharm Sci.2014;57:322–32.
10. Bergström, C.A.S., Holm, R., Jørgensen, S.A., Andersson, S.B.E.,Artursson, P., Beato, S., Borde, A., Box, K., Brewster, M., Dressman,J., Feng, K.-I., Halbert, G., Kostewicz, E., McAllister, M., Muenster,U., Thinnes, J., Taylor, R., and Mullertz, A., Early pharmaceuticalprofiling to predict oral drug absorption: Current status and unmetneeds. Eur J Pharm Sci. 2014;57:173–99.
11. Galia E, Nicolaides E, Hörter D, Löbenberg R, Reppas C,Dressman JB. Evaluation of various dissolution media forpredicting in vivo performance of class i and ii drugs. PharmRes. 1998;15:698–705.
12. Jantratid E, Janssen N, Reppas C, Dressman JB. Dissolution mediasimulating conditions in the proximal human gastrointestinal tract:an update. Pharm Res. 2008;25(7):1663–76.
13. Ilardia-Arana D, Kristensen HG,Müllertz A. Biorelevant dissolutionmedia: aggregation of amphiphiles and solubility of estradiol. JPharm Sci. 2006;95(2):248–55.
14. Taupitz T, Klein S. Can biorelevant media be simplified by usingSLS and Tween 80 to replace bile compounds? Open Drug Deliv J.2010;4(SPEC. ISSUE 1):30–7.
15. Zoeller T, Klein S. Simplified biorelevant media for screening disso-lution performance of poorly soluble drugs. Dissol Technol.2007;14(4):8–13.
16. Fagerberg, J.H., Al-Tikriti, Y., Ragnarsson, G., and Bergstrom, C.A.,Ethanol effects on apparent solubility of poorly soluble drugs insimulated intestinal fluid. Mol Pharm, 2012.
17. Fagerberg JH, Tsinman O, Sun N, Tsinman K, Avdeef A,Bergström CAS. Dissolution rate and apparent solubility ofpoorly soluble drugs in biorelevant dissolution media. MolPharm. 2010;7(5):1419–30.
19. Persson EM, Gustafsson AS, Carlsson AS, Nilsson RG, Knutson L,Forsell P, et al. The effects of food on the dissolution of poorly solubledrugs in human and in model small intestinal fluids. Pharm Res.2005;22(12):2141–51.
20. Wang J, Hou T. Recent advances on aqueous solubility prediction.Comb Chem High Throughput Screen. 2011;14(5):328–38.
588 Fagerberg et al.
21. Yalkowsky SH, Valvani SC. Solubility and partitioning I: solubility ofnonelectrolytes in water. J Pharm Sci. 1980;69(8):912–22.
22. Ran Y, Yalkowsky SH. Prediction of drug solubility by the generalsolubil ity equation (GSE). J Chem Inf Comput Sci.2001;41(2):354–7.
23. Ali J, Camilleri P, Brown MB, Hutt AJ, Kirton SB. Revisiting thegeneral solubility equation: in Silico prediction of aqueous solubilityincorporating the effect of topographical polar surface area. J ChemInf Model. 2011;52(2):420–8.
24. Meylan WM, Howard PH. Estimating log P with atom/fragmentsand water solubility with log P. Perspect Drug Discov Des. 2000;19:67–84.
25. Bergström CAS, Wassvik CM, Norinder U, Luthman K, ArturssonP. Global and local computational models for aqueous solubilityprediction of drug-like molecules. J Chem Inf Comput Sci.2004;44(4):1477–88.
26. Abraham MH, Le J. The correlation and prediction of the solubilityof compounds in water using an amended solvation energy relation-ship. J Pharm Sci. 1999;88(9):868–80.
27. Hasselbalch KA. Die Berechnung der Wasserstoffzahl des blutes aufder freien und gebundenen Kohlensaure desselben, und dieSauerstoffbindung des Blutes als Funktion der Wasserstoffzahl.Biochem Z. 1916;78:112–44.
28. Bergström CAS, Luthman K, Artursson P. Accuracy of calculatedpH-dependent aqueous drug solubility. Eur J Pharm Sci. 2004;22(5):387–98.
29. Zaki NM, Artursson P, Bergström CAS. A modified physiologicalBCS for prediction of intestinal absorption in drug discovery. MolPharm. 2010;7(5):1478–87.
30. Kawai Y, Fujii Y, Tabata F, Ito J, Yukiko M, Kameda A, et al.Profiling and trend analysis of food effects on oral drug absorptionconsidering micelle interaction and solubilization by bile micelles.Drug Metab Pharmacokinet. 2011;26(2):180–91.
31. Clarysse S, Brouwers J, Tack J, Annaert P, Augustijns P. Intestinaldrug solubility estimation based on simulated intestinal fluids: com-parison with solubility in human intestinal fluids. Eur J Pharm Sci.2011;43(4):260–9.
32. Glomme, A., März, J., and Dressman, J.B., Predicting the intestinalsolubility of poorly soluble drugs. Pharmacokinetic profiling in drugresearch, 2006: p. 259-280.
33. Jinno JI, Kamada N, Miyake M, Yamada K, Mukai T, Odomi M,et al. Effect of particle size reduction on dissolution and oral absorp-tion of a poorly water-soluble drug, cilostazol, in beagle dogs. JControl Release. 2006;111(1–2):56–64.
34. Singh BN. A quantitative approach to probe the dependence andcorrelation of food-effect with aqueous solubility, dose/solubilityratio, and partition coefficient (Log P) for orally active drugs admin-istered as immediate-release formulations. Drug Dev Res.2005;65(2):55–75.
35. Sugano K, Kataoka M, da Costa Mathews C, Yamashita S.Prediction of food effect by bile micelles on oral drug absorptionconsidering free fraction in intestinal fluid. Eur J Pharm Sci.2010;40(2):118–24.
36. Takano R, Furumoto K, Shiraki K, Takata N, Hayashi Y, Aso Y,et al. Rate-limiting steps of oral absorption for poorly water-solubledrugs in dogs; prediction from a miniscale dissolution test and aphysiologically-based computer simulation. Pharm Res.2008;25(10):2334–44.
37. VertzoniM, Fotaki N, Kostewicz E, Stippler E, Leuner C, NicolaidesE, et al. Dissolutionmedia simulating the intralumenal composition ofthe small intestine: physiological issues and practical aspects. J PharmPharmacol. 2004;56(4):453–62.
38. Wuyts B, Brouwers J, Mols R, Tack J, Annaert P, Augustijns P.Solubility profiling of HIV protease inhibitors in human intestinalfluids. J Pharm Sci. 2013;102(10):3800–7.
39. Bergström CAS, Charman SA, Nicolazzo JA. Computational pre-diction of CNS drug exposure based on a novel in vivo dataset. PharmRes. 2012;29(11):3131–42.
40. Persson LC, Porter CJH, Charman WN, Bergström CAS.Computational prediction of drug solubility in lipid based formula-tion excipients. Pharm Res. 2013;30(12):3225–37.
41. Eriksson, L., Multi-and megavariate data analysis. 2006: MKSUmetrics AB.
42. Rane SS, Anderson BD. Molecular dynamics simulations of func-tional group effects on solvation thermodynamics of model solutes indecane and tricaprylin. Mol Pharm. 2008;5(6):1023–36.
43. Warren DB, King D, Benameur H, Pouton CW, Chalmers DK.Glyceride lipid formulations: molecular dynamics modeling of phasebehavior during dispersion andmolecular interactions between drugsand excipients. Pharm Res. 2013;30(12):3238–53.
Computational Prediction of Drug Solubility in Intestinal Fluids 589