Page 1
COMPUTATIONAL PROTEIN DESIGN: ASSESSMENT AND
APPLICATIONS
Zhixiu Li
Submitted to the faculty of University Graduate School in partial fulfillment of the requirements
for the degree Doctor of Philosophy
in the School of Informatics and Computing, Indiana University
May 2015
Page 2
Accepted by the Graduate Faculty, Indiana University, in partial
fulfillment of the requirements for the degree of Doctor of Philosophy.
________________________________ Yunlong Liu, PhD, Chair
________________________________ Huanmei Wu, PhD Doctoral Committee
________________________________ Samy Meroueh, PhD
November 24, 2014 ________________________________ Yaoqi Zhou, PhD
ii
Page 3
© 2015
Zhixiu Li
iii
Page 4
DEDICATION
Dedicated to my family and friends.
iv
Page 5
ACKNOWLEDGEMENTS
I would like to thank my research committee members, my family and friends for their
help in my Ph.D study.
Foremost, I would like to express my sincere gratitude to my advisor Prof Yaoqi Zhou.
He has provided me excellent research advice, great insights, enthusiasm and
encouragement throughout all my research projects. His guidance and support help all the
time in research and dissertation writing. I would never have been able to finish my
dissertation without his help.
Besides my advisor, I would like to extend my sincerest thanks and appreciation the rest
of my research committee: Profs Yunlong Liu, Samy Meroueh, and Huanmei Wu, for all
the useful discussions, encouragement, and insightful comments.
I also want to thank my colleagues, collaborators, teachers and classmates in various
projects. I shared a great time with them while learning from them. They are Profs
Qizhuang Ye, Song Liu, Shiaofen Fang, Mohammad Al Hasan, James H. Hill, Jihua
Wang, Drs Yuedong Yang, Huiying Zhao, Jian Zhan, Tuo Zhang, Liang Dai, Eshel
Faraggi, Wenchang Xiang, Hui Huang, Md Tamjdul Hogue, Mr. Arthur Liu, Mr. Haoyu
Cheng, Mr. Liang-Chin Huang, and others.
Last but not the least, I would like to thank my family for their love and unconditional
support throughout my life.
v
Page 6
Zhixiu Li
COMPUTATIONAL PROTEIN DESIGN: ASSESSMENT AND APPLICATIONS
Computational protein design aims at designing amino acid sequences that can fold into a
target structure and perform a desired function. Many computational design methods
have been developed and their applications have been successful during past two decades.
However, the success rate of protein design remains too low to be of a useful tool by
biochemists whom are not an expert of computational biology. In this dissertation, we
first developed novel computational assessment techniques to assess several state-of-the-
art computational techniques. We found that significant progresses were made in several
important measures by two new scoring functions from RosettaDesign and from
OSCAR-design, respectively. We also developed the first machine-learning technique
called SPIN that predicts a sequence profile compatible to a given structure with a novel
nonlocal energy-based feature. The accuracy of predicted sequences is comparable to
RosettaDesign in term of sequence identity to wild type sequences. In the last two
application chapters, we have designed self-inhibitory peptides of Escherichia coli
methionine aminopeptidase (EcMetAP) and de novo designed barstar. Several peptides
were confirmed inhibition of EcMetAP at the micromole-range 50% inhibitory
concentration. Meanwhile, the assessment of designed barstar sequences indicates the
improvement of OSCAR-design over RosettaDesign.
Yunlong Liu, PhD, Chair
vi
Page 7
Contents
List of Tables .................................................................................................................... xi
List of Figures ................................................................................................................. xiii
List of Equations ............................................................................................................. xv
Chapter 1 Introduction ................................................................................................. 1
1.1 Protein: From Sequence to Structure ................................................................... 1
1.2 Computational Protein Design ............................................................................. 3
1.2.1 Searching Algorithm ..................................................................................... 5
1.2.2 Energy Function ............................................................................................ 6
1.3 Overview of the Dissertation ............................................................................... 7
Chapter 2 Energy Functions in De Novo Protein Design .......................................... 9
2.1 Abstract ................................................................................................................ 9
2.2 Introduction .......................................................................................................... 9
2.3 De Novo Designed and Structurally Validated Proteins .................................... 12
2.4 Origin of Low Success Rate in Protein Design .................................................. 15
2.5 Energy Function in Protein Design .................................................................... 18
2.5.1 RosettaDesign Energy Function ................................................................. 18
2.5.2 EGAD Energy Function .............................................................................. 20
2.5.3 Liang-Grishin Energy Function .................................................................. 21
2.5.4 Balancing Nonlocal and Local Interactions ................................................ 22
2.5.5 RosettaDesign-SR Energy Function ........................................................... 22
2.6 Computational Assessment of Designed Proteins .............................................. 23
2.6.1 Sequence Assessment: Native Sequence Recovery .................................... 25
vii
Page 8
2.6.2 Local Assessment: Secondary Structure Recovery ..................................... 27
2.6.3 Local Assessment: Intrinsic Disorder ......................................................... 28
2.6.4 Surface Assessment: Solvent Accessibility Recovery ................................ 28
2.6.5 Surface Assessment: Hydrophobic Patch ................................................... 29
2.6.6 Packing Assessment: Total Accessible Surface Area ................................. 30
2.6.7 Global Structure Assessment ...................................................................... 31
2.6.8 Summary ..................................................................................................... 33
2.7 Community-wide Scoring Function Assessment ............................................... 34
2.8 Current Challenges and Future Prospects .......................................................... 35
Chapter 3 Assessment of Novel Energy Functions for Design ................................ 38
3.1 Introduction ........................................................................................................ 38
3.2 Results ................................................................................................................ 40
3.2.1 Sequence Assessment: Native Sequence Recovery .................................... 41
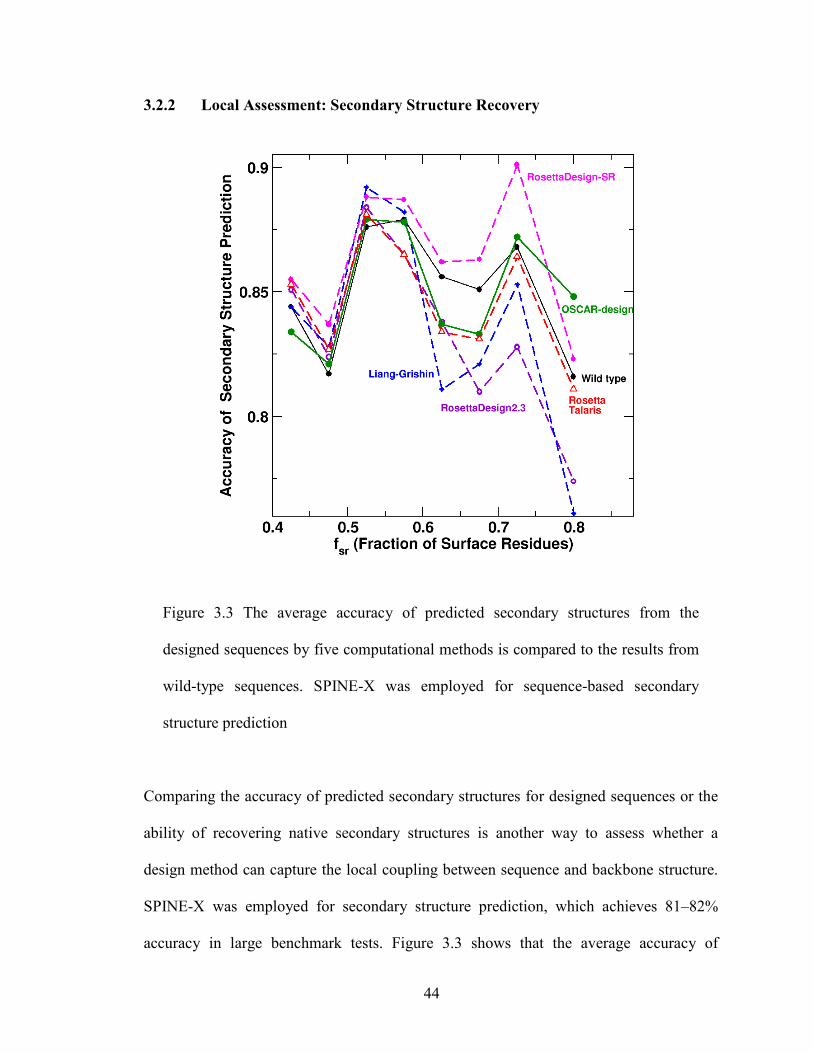
3.2.2 Local Assessment: Secondary Structure Recovery ..................................... 44
3.2.3 Local Assessment: Predicted Intrinsic Disorder and Low Complexity
Residues ..................................................................................................................... 45
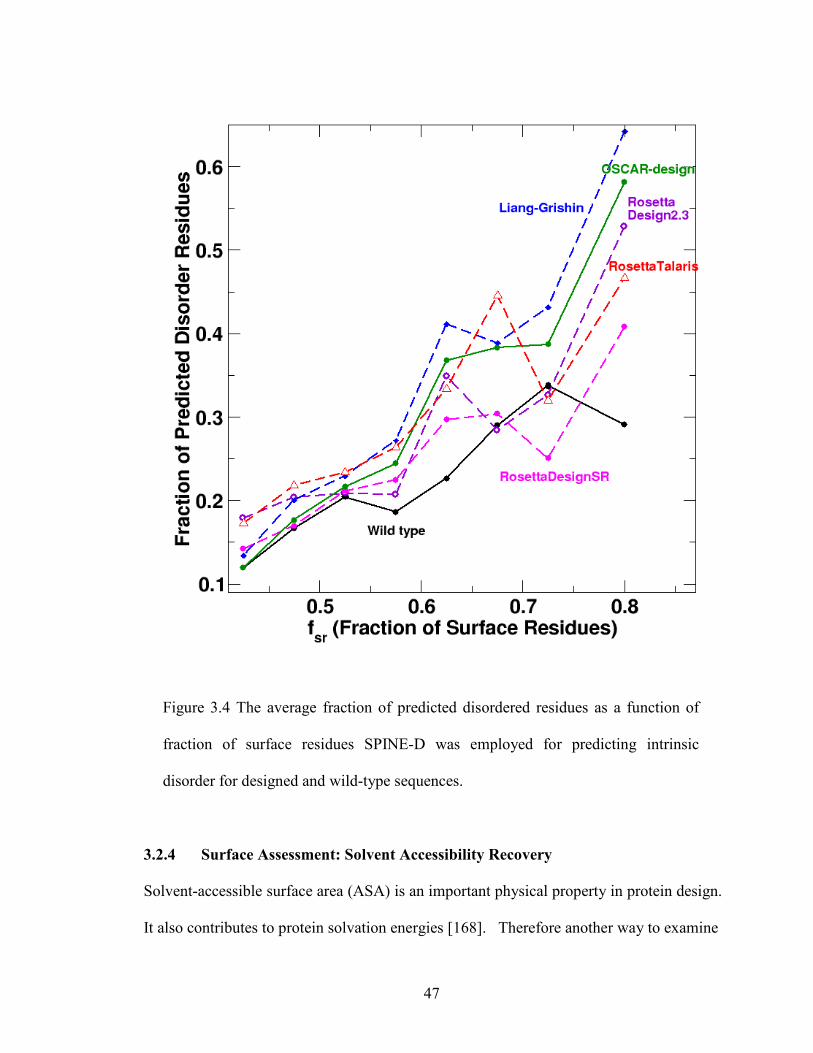
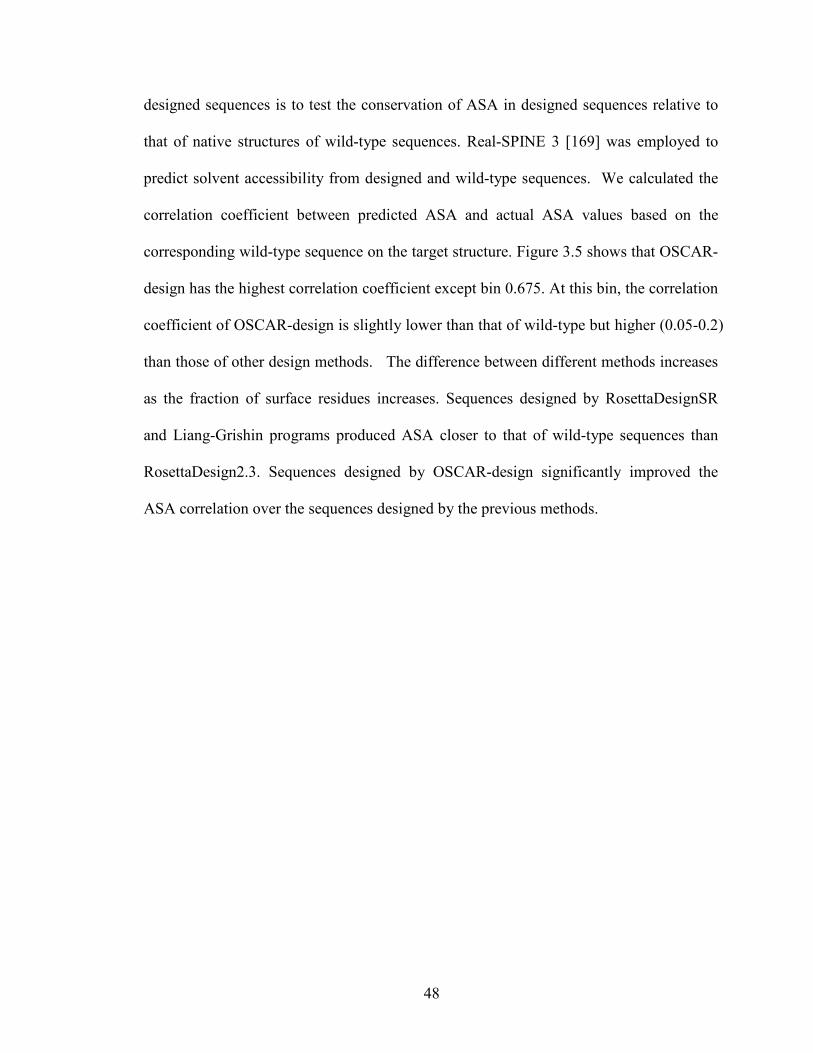
3.2.4 Surface Assessment: Solvent Accessibility Recovery ................................ 47
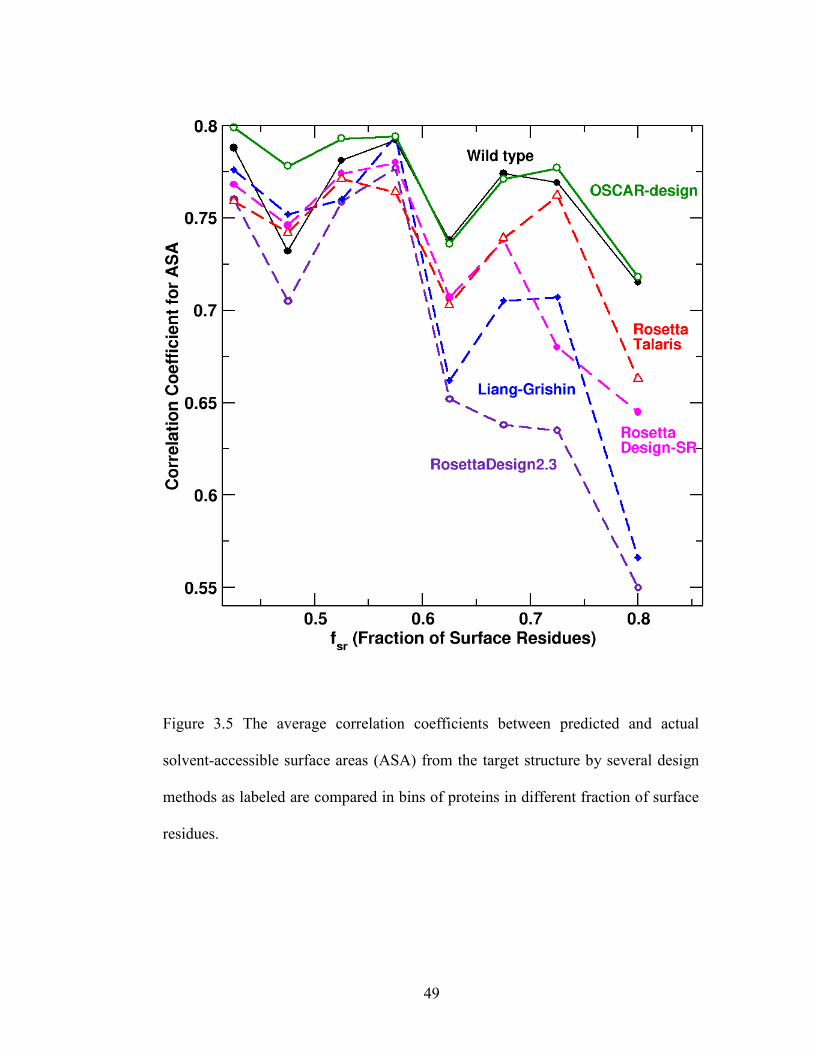
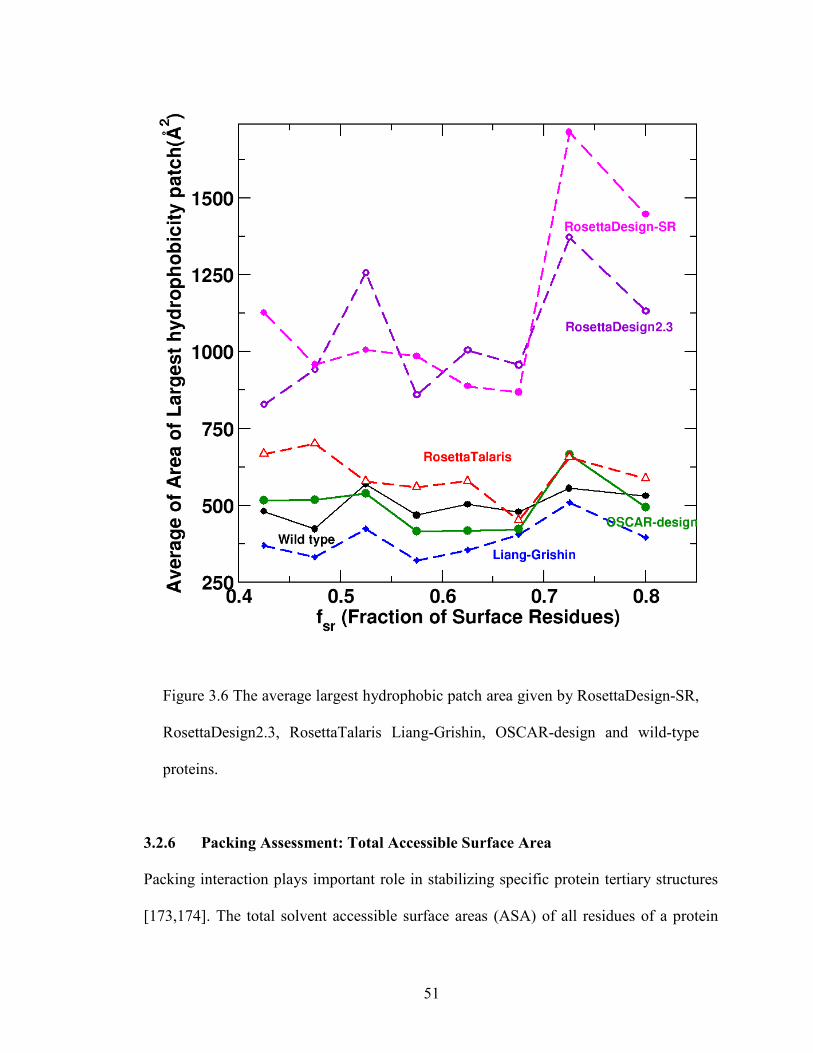
3.2.5 Surface Assessment: Hydrophobic Patch ................................................... 50
3.2.6 Packing Assessment: Total Accessible Surface Area ................................. 51
3.2.7 Global Structure Assessment ...................................................................... 54
3.3 Conclusion .......................................................................................................... 57
viii
Page 9
Chapter 4 Direct Prediction of the Profile of Sequences Compatible to a
Protein Structure by Neural Networks with Fragment-Based Local and
Energy-Based Nonlocal Profiles .................................................................................... 59
4.1 Abstract .............................................................................................................. 59
4.2 Introduction ........................................................................................................ 60
4.3 Methods .............................................................................................................. 62
4.3.1 Datasets ....................................................................................................... 62
4.3.2 Neural Network ........................................................................................... 64
4.3.3 Input Features.............................................................................................. 65
4.3.4 Output Layer ............................................................................................... 66
4.3.5 Ten-fold Cross Validation and Independent Test ....................................... 67
4.3.6 Performance Evaluation .............................................................................. 67
4.3.7 RosettaDesign ............................................................................................. 68
4.4 Results ................................................................................................................ 68
4.4.1 Sequence Prediction .................................................................................... 68
4.4.2 PSSM Prediction ......................................................................................... 76
4.4.3 Comparison to Profiles Generated by RosettaDesign ................................. 78
4.5 Discussion .......................................................................................................... 80
Chapter 5 Self-inhibitory Peptides of Escherichia coli Methionine
Aminopeptidase ............................................................................................................... 84
5.1 Introduction ........................................................................................................ 84
5.2 Selection and Validation of Self-inhibitory Peptides of EcMetAP .................... 86
5.3 De novo Design of Self-inhibitory Peptides of EcMetAP ................................. 92
ix
Page 10
5.4 Mutation Design of Self-inhibitory Peptides of EcMetAP ................................ 97
5.5 Conclusion .......................................................................................................... 99
Chapter 6 Computational Design of a Ribonuclease Inhibitor Barstar .............. 100
6.1 Introduction ...................................................................................................... 100
6.2 Methods ............................................................................................................ 102
6.2.1 Design Programs ....................................................................................... 102
6.2.2 Target Structure Setup .............................................................................. 102
6.2.3 Target Region Designed ........................................................................... 103
6.3 Results .............................................................................................................. 104
6.4 Discussion ........................................................................................................ 113
Chapter 7 Conclusion ............................................................................................... 115
Appendices ................................................................................................................... 118
Appendix A List of 112 X-ray Monomeric Proteins .............................................. 118
Appendix B Twenty Computationally Optimized and Experimentally Tested
Self-inhibitory Peptides of EcMetAP .......................................................................... 119
References ................................................................................................................... 122
CURRICULUM VITAE
x
Page 11
List of Tables
Table 2.1 De novo, computationally designed proteins validated by NMR or X-ray
structure determination. .................................................................................................... 14
Table 3.1 Average sequence identity to wild-type sequences by RosettaDesign-SR,
RosettaDesign2.3, RosettaTalaris, Liang-Grishin and OSCAR-design............................ 43
Table 4.1 Sequence identities between predicted and wild-type sequences ..................... 74
Table 4.2 Performance of various methods ...................................................................... 77
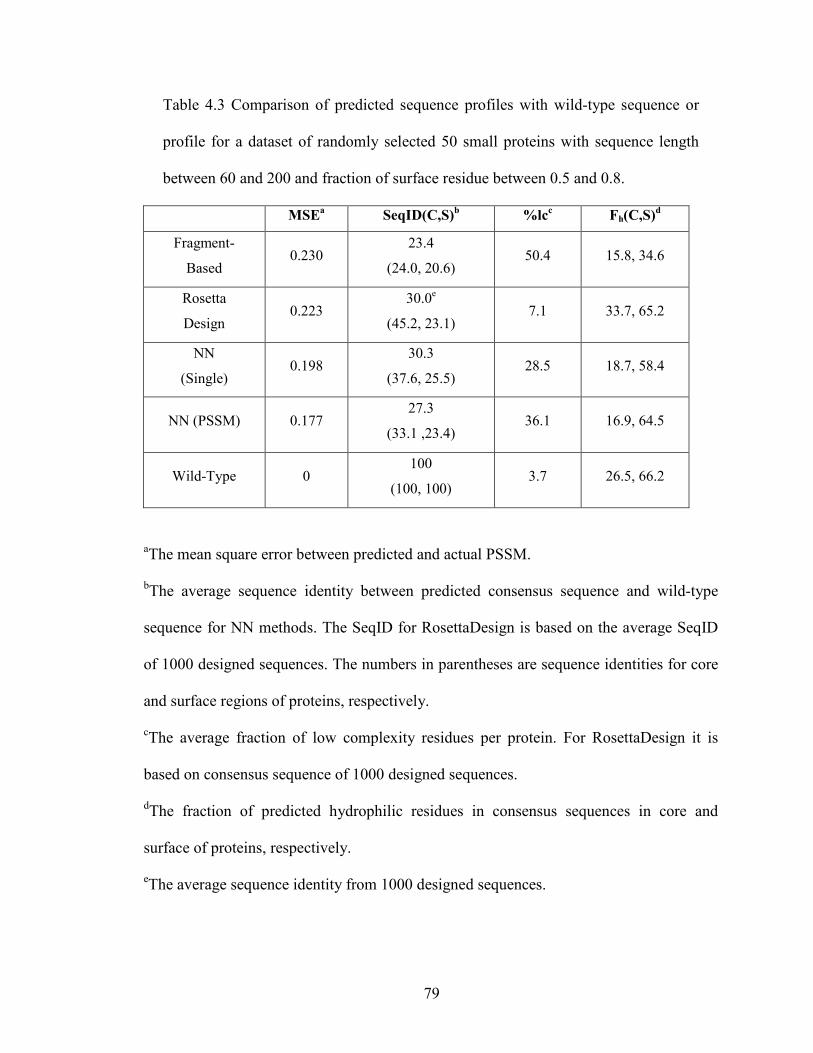
Table 4.3 Comparison of predicted sequence profiles with wild-type sequence or
profile ................................................................................................................................ 79
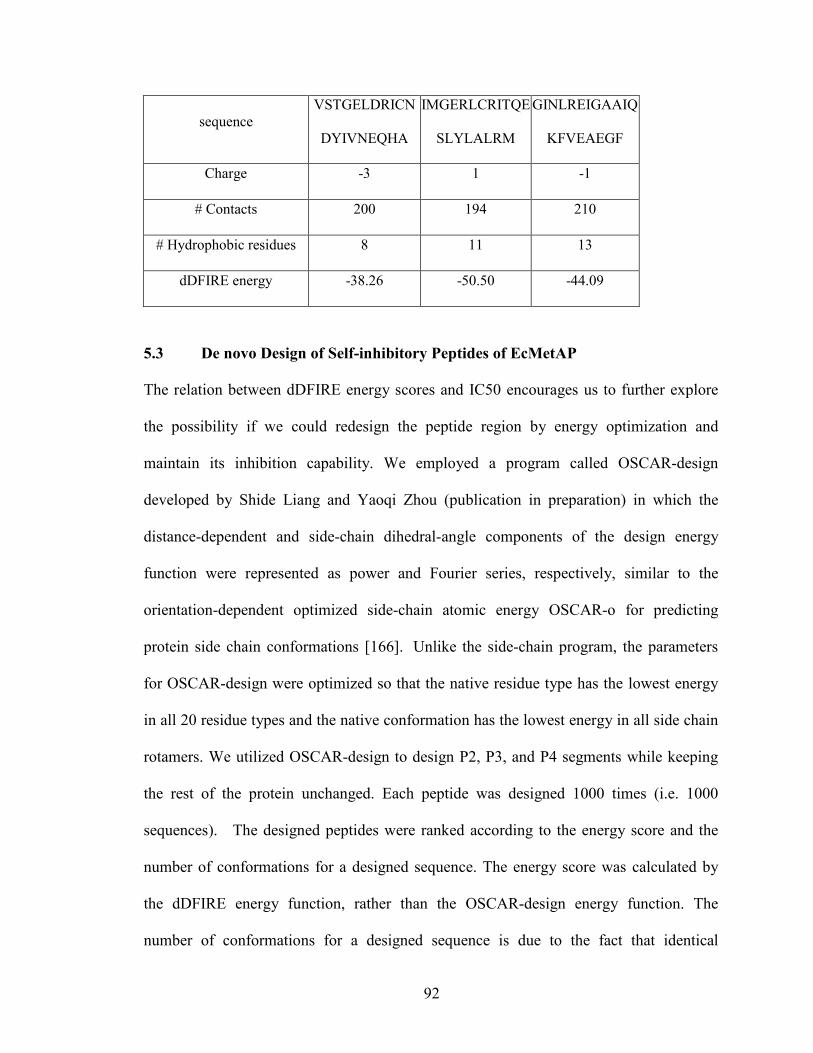
Table 5.1 Properties of four selected and one control peptides. ....................................... 88
Table 5.2 Properties of wild-type peptides. ...................................................................... 91
Table 5.3 Statistics of designed peptides. ......................................................................... 94
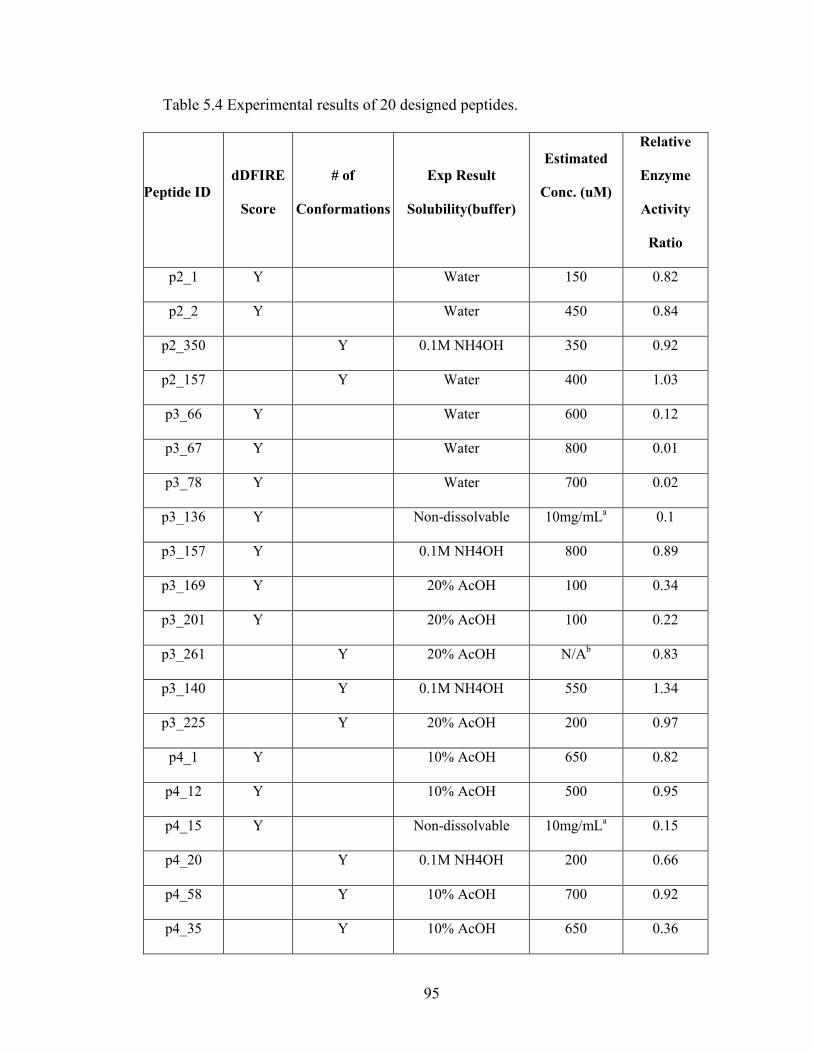
Table 5.4 Experimental results of 20 designed peptides................................................... 94
Table 5.5 Details of PSSM guided mutations. ................................................................. 98
Table 6.1 Statistical information of designed sequences. ............................................... 106
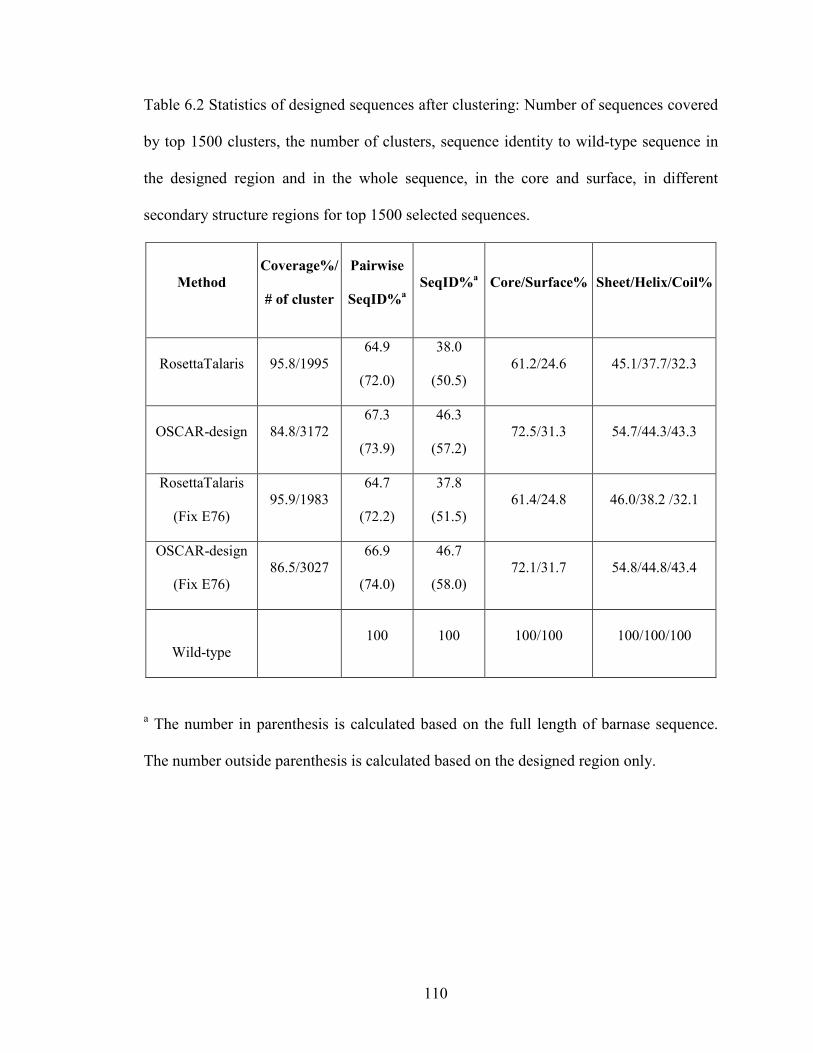
Table 6.2 Statistics of designed sequences after clustering ............................................ 110
Table 6.3 E76 recovery rate, low complexity rate at residue and protein levels, the
average hydrophobic patch area and the average number of hydrogen bonds
involved with side chain for top 1500 selected sequences. ............................................ 112
Table 6.4 The fraction (and recovery rate) of hydrophilic residues in core and on
surface, and in different secondary structure regions for top 1500 selected
sequences. ....................................................................................................................... 112
xi
Page 12
Table B.1 Properties of twenty candidate peptides including dDFIRE energy,
contacted residue pair, total charge, number of hydrophobic residue, Isoelectric
point and number of confirmations for unique sequence. ............................................... 119
xii
Page 13
List of Figures
Figure 1.1 Formation of peptide bond and description of four protein structure levels. .... 2
Figure 1.2 An example of two asparagine rotamers with backbone atoms. ....................... 5
Figure 2.1 The sizes of computationally designed proteins for the past 15 years. ........... 15
Figure 2.2 The RosettaDesign energy score (RosettaDesign 2.3) as a function of
sequence identity ............................................................................................................... 17
Figure 2.3 Computationally assess design methods. ........................................................ 26
Figure 2.4 Comparisons of largest hydrophobic patch area and total ASA /
maximum total ASA. ........................................................................................................ 29
Figure 2.5 The average root-mean-squared distance (RMSD) between the target
structure and the structure predicted ................................................................................. 31
Figure 3.1 Computational assessment of designed sequences according to several
criteria. .............................................................................................................................. 40
Figure 3.2 The average sequence identity to wild-type sequences of sequences ............. 42
Figure 3.3 The average accuracy of predicted secondary structures ................................ 44
Figure 3.4 The average fraction of predicted disordered residues as a function of
fraction of surface residues. .............................................................................................. 47
Figure 3.5 The average correlation coefficients between predicted and actual
solvent-accessible surface areas (ASA) ............................................................................ 49
Figure 3.6 The average largest hydrophobic patch area ................................................... 51
Figure 3.7 The total solvent-accessible surface area (SASA) for all residues in a
protein normalized by their maximum possible total solvent-accessible surface
area .................................................................................................................................... 53
xiii
Page 14
Figure 3.8 Superposition of the target structures (PDB ID 3PTE and 1B1U, cyan)
and the best 3D structure predicted from designed sequence by SPARKS-X. ................. 55
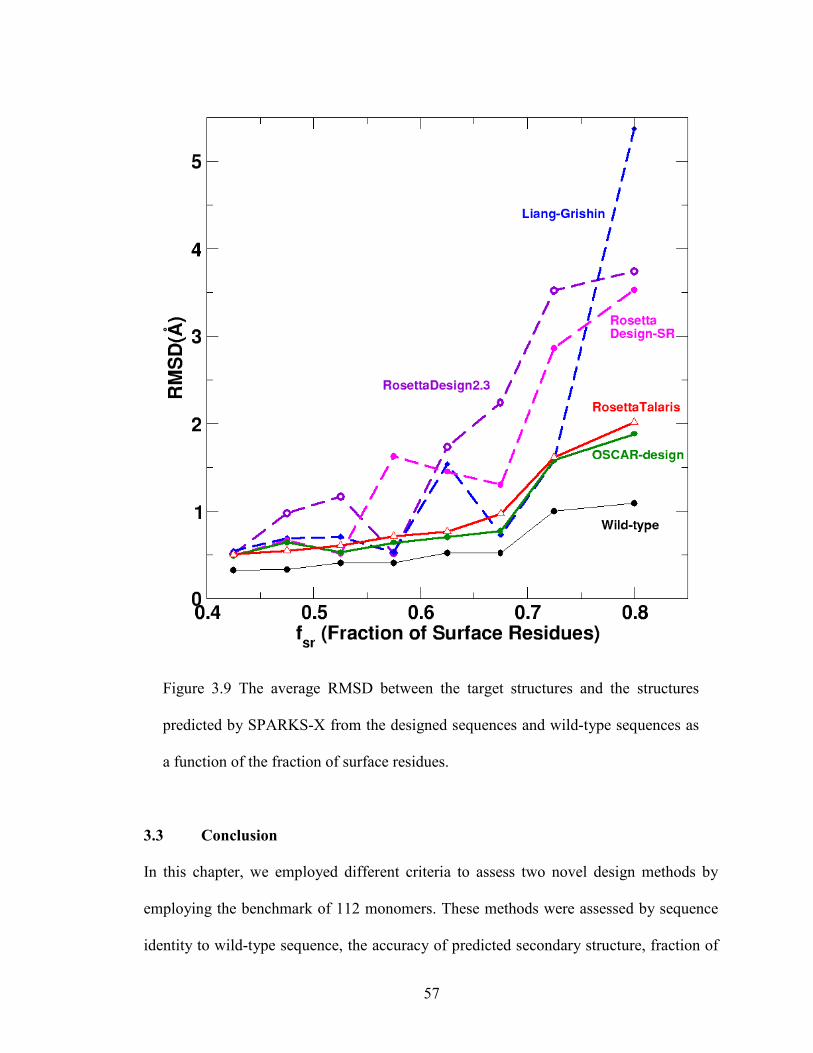
Figure 3.9 The average RMSD between the target structures and the structures
predicted by SPARKS-X .................................................................................................. 57
Figure 4.1 Average sequence identity between predicted and wild-type sequences as
a function of protein length ............................................................................................... 70
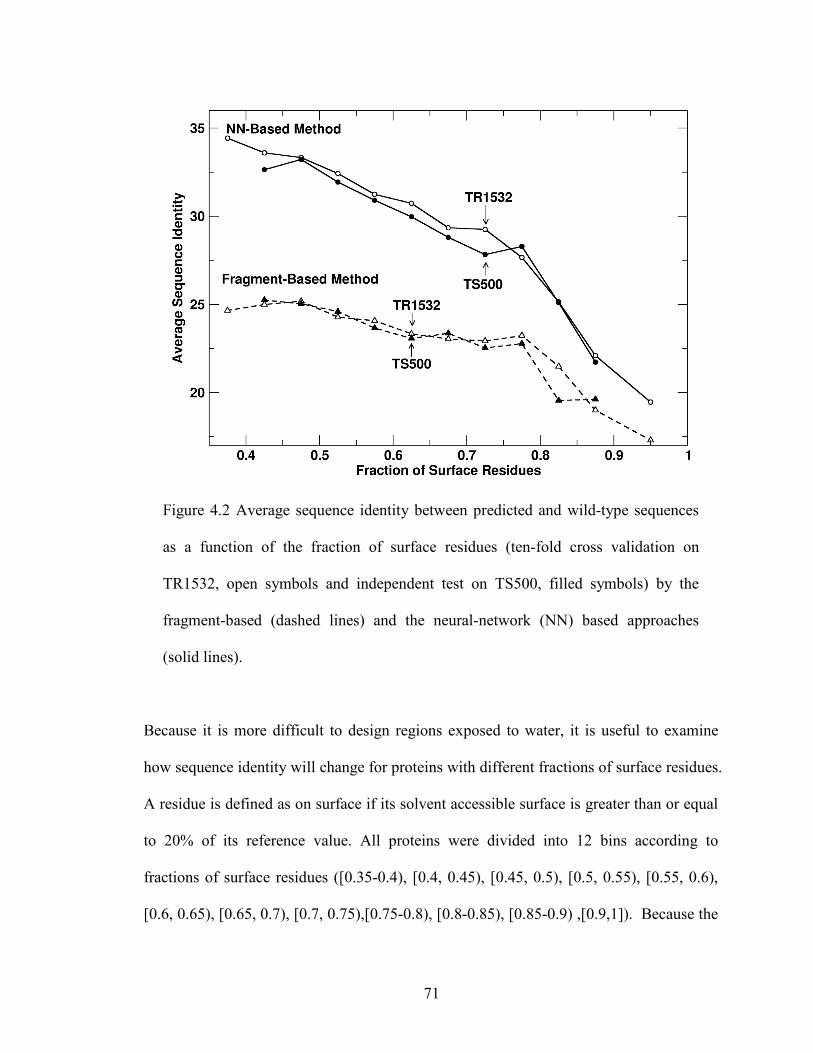
Figure 4.2 Average sequence identity between predicted and wild-type sequences as
a function of the fraction of surface residues .................................................................... 71
Figure 4.3 Recovery rate, precision and frequencies for each residue type. .................... 73
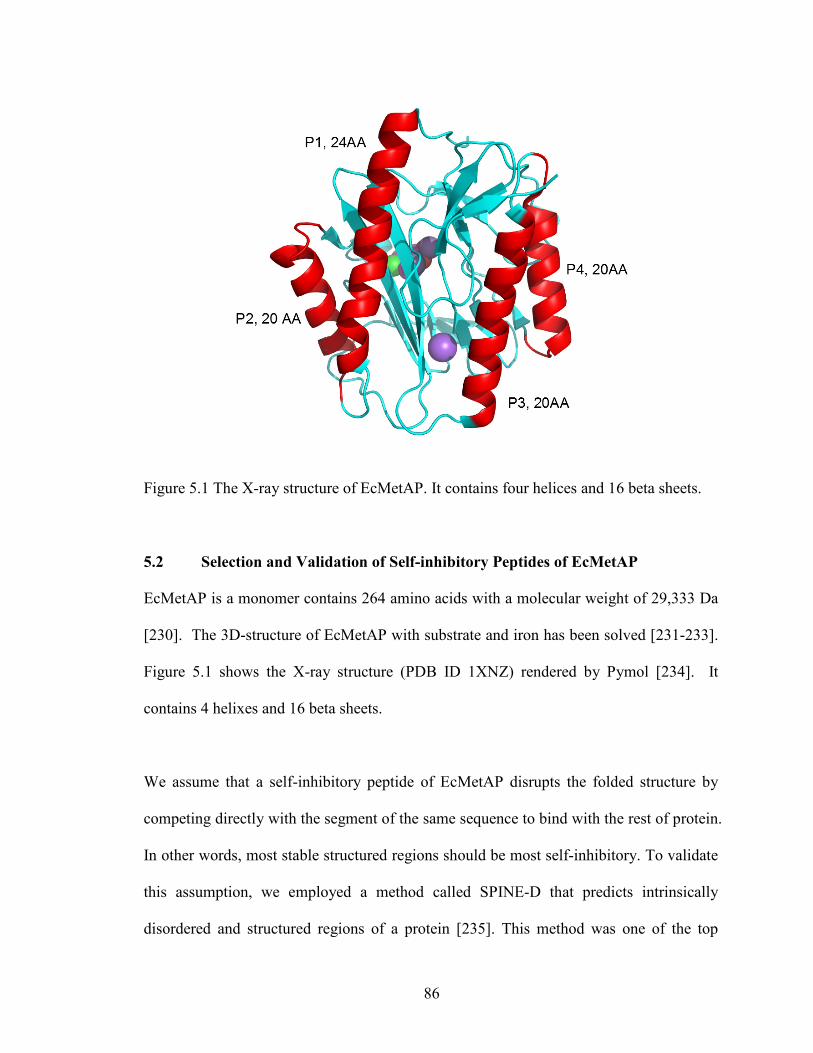
Figure 5.1 The X-ray structure of EcMetAP. It contains four helices and 16 beta
sheets. ................................................................................................................................ 86
Figure 5.2 Predicted disorder probability of EcMetAP. The bar represents the
location of each peptide .................................................................................................... 88
Figure 5.3 Relative enzyme activity of designed peptides. .............................................. 90
Figure 5.4 IC50 determination for P1 and P3. Lines were fitted by SigmaPlot. .............. 90
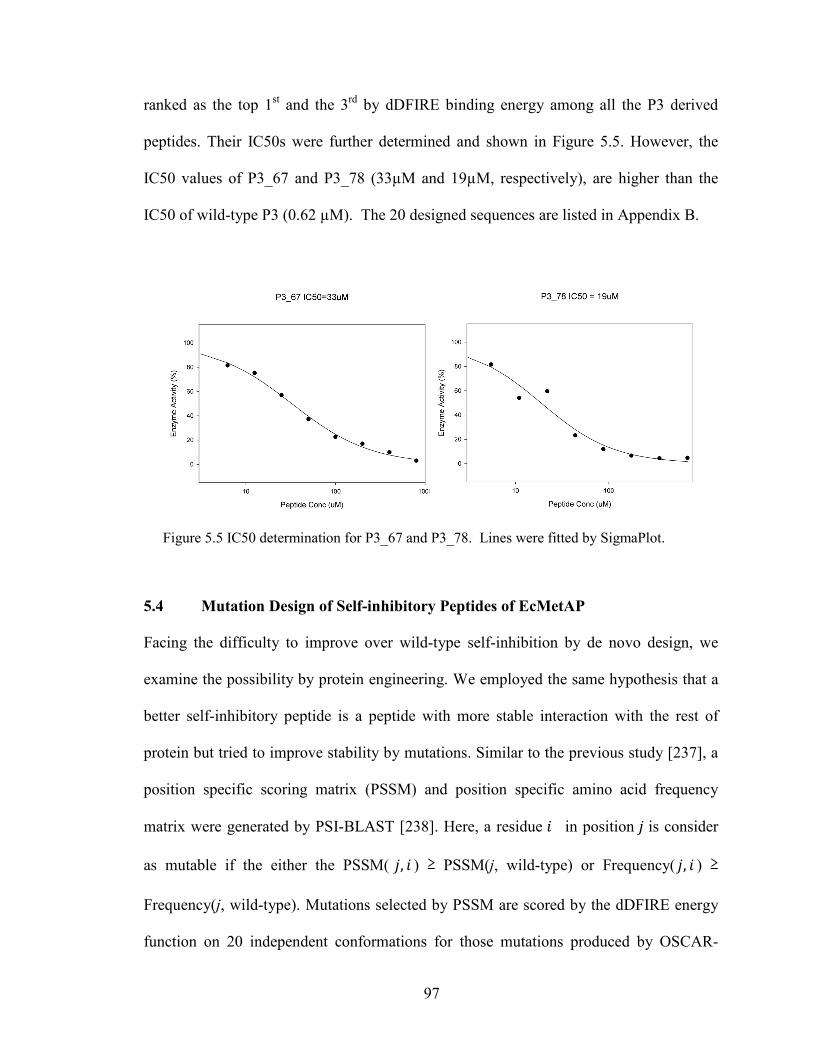
Figure 5.5 IC50 determination for P3_67 and P3_78. ...................................................... 97
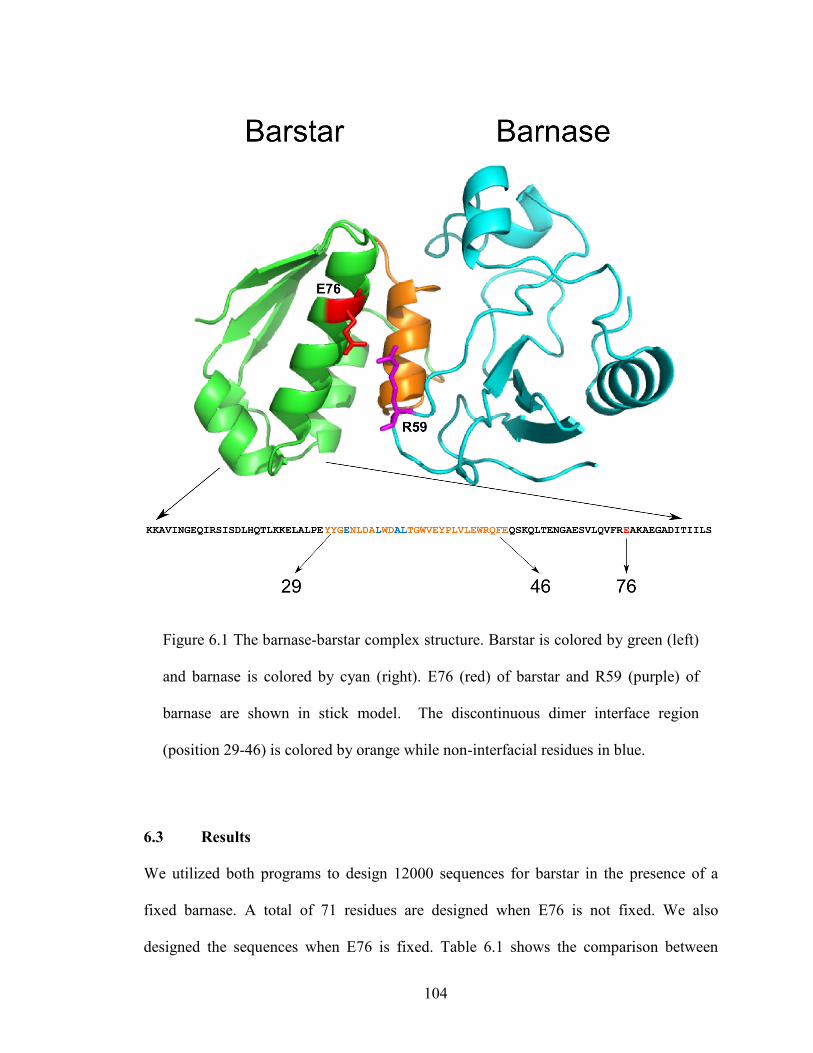
Figure 6.1 The barnase-barstar complex structure. Barstar is colored by green (left)
and barnase is colored by cyan (right). E76 (red) of barstar and R59 (purple) of
barnase are shown in stick model. .................................................................................. 104
Figure 6.2 Distributions of pairwise sequence identity between any two designed
sequences for the four datasets as labeled. ...................................................................... 111
xiv
Page 15
List of Equations
Equation 2.1 ...................................................................................................................... 19
Equation 2.2 ...................................................................................................................... 20
Equation 2.3 ...................................................................................................................... 21
Equation 2.4 ...................................................................................................................... 22
Equation 3.1 ...................................................................................................................... 52
xv
Page 16
Chapter 1 Introduction
1.1 Protein: From Sequence to Structure
Proteins are biological macromolecules made of chains of amino acid residues. Each
amino acid residue consists of α carbon atom (Cα) chemically bonded to amine (NH2),
carboxyl (COOH) atoms and a variable side chain group R specific to a particular type of
amino acid residues. Proteins are building blocks of life that perform various important
functions in most processes of live cells. The function of an individual protein depends
on its structure. The structure of a protein is characterized at primary, secondary, tertiary
and quaternary levels (Figure 1.1).
Primary structure refers to the linear-amino acid sequence in the polypeptide chain. This
sequence is encoded by the nucleotide sequence of the gene. The primary structure is
joined together by peptide bonds formed by reaction between the carboxyl group of one
amino acid with the amino group of another amino acid during the polymerization
process shown Figure 1.1. An amino acid in the polypeptide chain is called residue due to
the loss of one water molecule in the process. Because the R group of an amino acid,
which presents as side chain in a protein, is specific to different amino acid types, a
protein of N amino-acid long will have 20N possible sequences. That is, protein sequence
space is astronomically large.
1
Page 17
Figure 1.1 Formation of peptide bond and description of four protein structure
levels.
2
Page 18
Secondary structure is highly regular local backbone sub-structure stabilized by backbone
hydrogen bonds. The sub-structure usually classified into α-helix, β-sheet and coil
according to the patterns of hydrogen bonds [1]. These secondary structures are further
packed into a unique compact tertiary structure (3D-structure). This process is driven by
interplay of hydrophobic interaction, hydrogen bonding, electrostatic interactions and
disulfide bonds. Individual proteins can interact with each other and form stable complex
structures or quaternary structures. The interface between two interacting proteins is also
stabilized by hydrophobic and other interactions. A nascent polypeptide synthesized in
ribosome is not functional until it folds into a unique 3D-structure from random coils in
the order of micro to milliseconds in most cases. This process is driven by various
interactions including but not limited to hydrophobic interactions among side chains,
hydrophilic interactions with water, hydrogen bonding within the backbone (forming of
α-helix and β-sheet), salt-bridges (forming by interacting polar residue pairs), disulfide
bonds, van der Waals forces and electrostatics. These interactions are utilized in protein
structure prediction and protein design.
1.2 Computational Protein Design
Nature has produced proteins with diverse structures and functions, and creates new
structural topology and function through evolution. Experimental techniques, such as
direct evolution, attempt to mimic the process of natural selections to generate protein
with improved functionality or new functions. An experimental approach was the primary
choice to obtain a protein sequence with a desired function [2-9]. However, a successful
evolution process takes millions of years and an experimental study can only explore a
3
Page 19
very limited sequence space. Therefore, evolving protein sequences computationally are
more desirable. Computational protein design aims at computationally designing protein
sequences that will fold into a desirable 3D structure and perform a desired biological
function. It allows efficiently exploring a much larger sequence space at low cost,
comparing to experimental approaches. Significant progress has been made in both
design methods and applications in last two decades. Proteins have been successfully
redesigned or de novo designed to perform a diverse range of functions and even fold
into novel protein structures [10-16]. Those successfully designed proteins provide
insights into the relation between protein sequence, structure, stability, and functions.
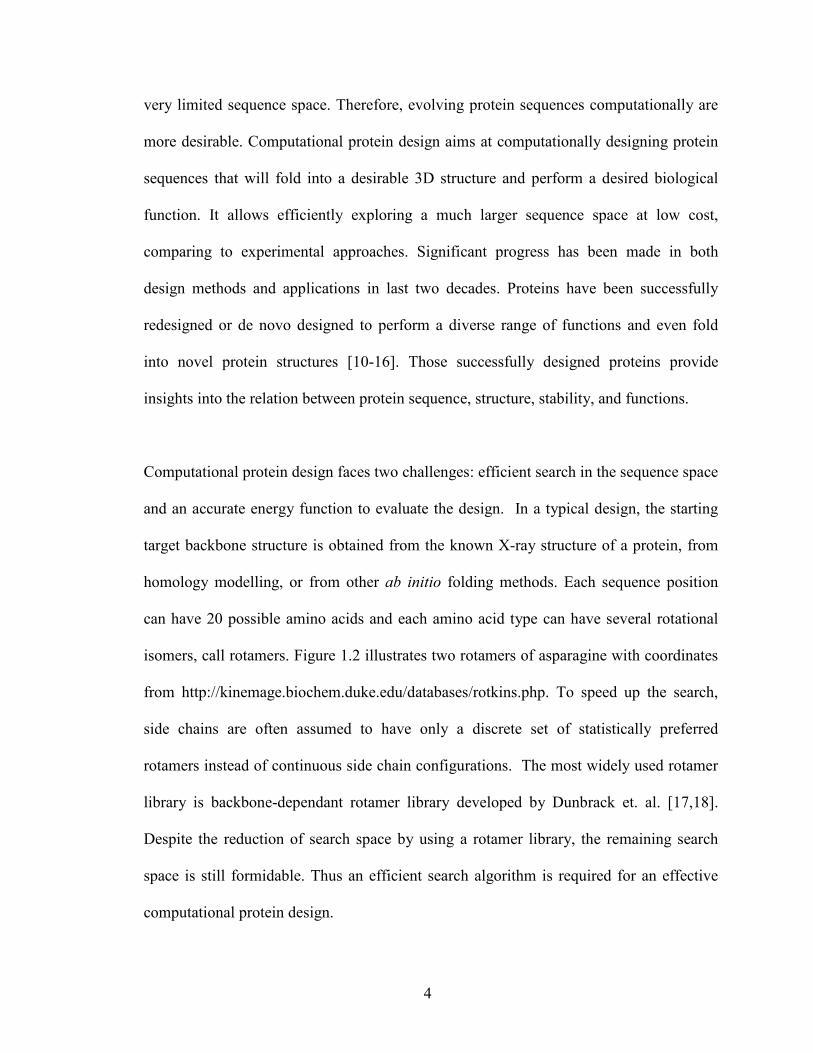
Computational protein design faces two challenges: efficient search in the sequence space
and an accurate energy function to evaluate the design. In a typical design, the starting
target backbone structure is obtained from the known X-ray structure of a protein, from
homology modelling, or from other ab initio folding methods. Each sequence position
can have 20 possible amino acids and each amino acid type can have several rotational
isomers, call rotamers. Figure 1.2 illustrates two rotamers of asparagine with coordinates
from http://kinemage.biochem.duke.edu/databases/rotkins.php. To speed up the search,
side chains are often assumed to have only a discrete set of statistically preferred
rotamers instead of continuous side chain configurations. The most widely used rotamer
library is backbone-dependant rotamer library developed by Dunbrack et. al. [17,18].
Despite the reduction of search space by using a rotamer library, the remaining search
space is still formidable. Thus an efficient search algorithm is required for an effective
computational protein design.
4
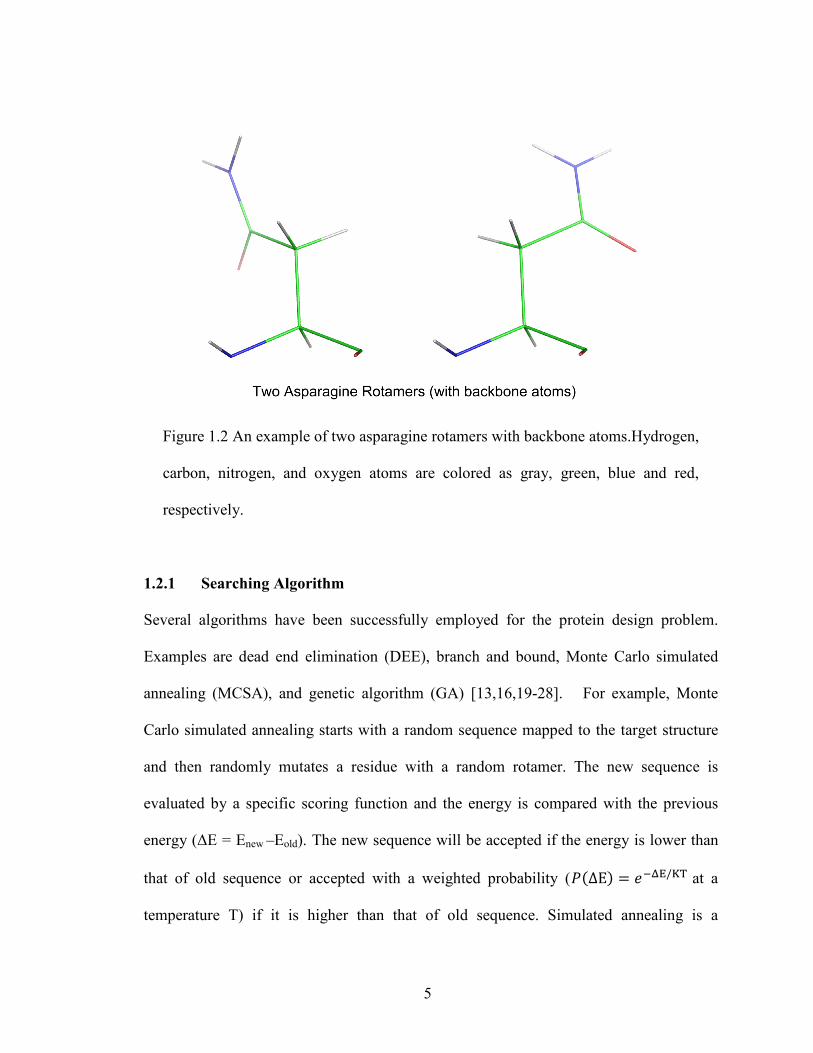
Page 20
Figure 1.2 An example of two asparagine rotamers with backbone atoms.Hydrogen,
carbon, nitrogen, and oxygen atoms are colored as gray, green, blue and red,
respectively.
1.2.1 Searching Algorithm
Several algorithms have been successfully employed for the protein design problem.
Examples are dead end elimination (DEE), branch and bound, Monte Carlo simulated
annealing (MCSA), and genetic algorithm (GA) [13,16,19-28]. For example, Monte
Carlo simulated annealing starts with a random sequence mapped to the target structure
and then randomly mutates a residue with a random rotamer. The new sequence is
evaluated by a specific scoring function and the energy is compared with the previous
energy (ΔE = Enew –Eold). The new sequence will be accepted if the energy is lower than
that of old sequence or accepted with a weighted probability (𝑃𝑃(ΔE) = 𝑒𝑒−ΔE/KT at a
temperature T) if it is higher than that of old sequence. Simulated annealing is a
5
Page 21
commonly used technique for searching the global minimum by slowly decreasing
temperatures. However, the rate of temperature reduction is not infinitely slow and thus a
global minimum is not guaranteed.
DEE is a deterministic technique employed in many protein design programs [20,29-36].
Examples are, OSPREY [29] and ORBIT [36]. DEE removes a rotamer if other rotamers
yield a lower energy. It also removes the rotamer pair in two positions if there is a pair of
rotamers giving lower energy. Those values are pre-calculated and stored to speed up the
computing.
1.2.2 Energy Function
Searching algorithms described above are guided by a scoring function that distinguishes
sequences compatible to a target structure from those that do not. In general, the
interaction terms of an energy function can be classified as knowledge-based and
physical-based.
Knowledge-based energy terms, or statistical energy terms, are derived from a database
of known protein structures (i.e. Protein Data Bank). There are many types of knowledge-
based terms employed in different design methods. One simple example is that residues
in the protein core tend to be more hydrophobic while residues on the surface tend to be
more hydrophilic. Thus an energy penalty can be applied to exposed hydrophobic
residues [32,37,38].
6
Page 22
Physical-based energy terms model atomic interaction based on the molecular mechanics
force field employed for molecular dynamics simulations of proteins. A physical-based
energy function typically contains van der Waals interactions, orientation-dependent
hydrogen bonding potential, an implicit solvation term and electrostatic interaction.
Energy functions for protein design are usually a mixture of knowledge-based and
physical-based energy terms [29,32,39-41] with empirical reference states for the
denatured states of 20 amino acid types. Weights of various energy terms were often
optimized to ensure that the energy of a wild-type residue in its native rotamer is the
lowest among all possibilities. Some design methods employed purely physical-based
energy terms [42,43].
1.3 Overview of the Dissertation
In this dissertation we addressed two fundamental questions facing protein design: how to
assess designed sequences computationally and improve an energy function for design. In
0, we developed several novel assessment techniques that allow us to better understand
strengths and weaknesses of different program design techniques. In 0, these newly
developed assessment techniques were applied to the newest version of RosettaDesign
and a new technique called OSCAR-design and demonstrated significant improvement
over previous methods. In Chapter 4, we propose to employ a structure-compatible
sequence profile as a potential novel energy term for design and developed a machine-
learning technique to obtain it. In Chapter 5 and Chapter 6, we designed self-inhibitory
7
Page 23
peptides of Escherichia coli methionine aminopeptidase and de novo designed barstar to
compare with experimental studies.
8
Page 24
Chapter 2 Energy Functions in De Novo Protein Design
2.1 Abstract
In the past decade, a concerted effort to successfully capture specific tertiary packing
interactions produced specific three-dimensional structures for many de novo designed
proteins that are validated by nuclear magnetic resonance and/or X-ray crystallographic
techniques. However, the success rate of computational design remains low. In this
review, we provide an overview of experimentally validated, de novo designed proteins
and compare four available programs, RosettaDesign, EGAD, Liang-Grishin, and
RosettaDesign-SR, by assessing designed sequences computationally. Computational
assessment includes the recovery of native sequences, the calculation of sizes of
hydrophobic patches and total solvent-accessible surface area, and the prediction of
structural properties such as intrinsic disorder, secondary structures, and three-
dimensional structures. This computational assessment, together with a recent
community-wide experiment in assessing scoring functions for interface design, suggests
that the next-generation protein-design scoring function will come from the right balance
of complementary interaction terms. Such balance may be found when more negative
experimental data become available as part of a training set.
2.2 Introduction
De novo protein design refers to computational design of new protein molecules that
possess desired biological functions. Such computational design is needed to supplement
and accelerate naturally occurring processes that can create conformationally and
functionally novel proteins, as naturally occurring processes are constrained by biological
9
Page 25
functional requirements and limited by the tools available in nature. For example, one
naturally occurring process that produces new topologically linked protein structures is
circular permutation, a process that closes the N and C termini with a short loop and
opens another loop for new termini [44,45]. This single loop permutation, however, is not
efficient in producing new structures because most resulting structures are nearly the
same as the structure prior to circular permutation [46,47]. By comparison, new
topologically folded structures can be generated efficiently by computationally changing
the connections of multiple rather than single loops while maintaining the core packing
[48]. This and other studies [49,50] suggest the existence of vast structural fold space that
is yet to be explored. A limited exploration of the protein structural space is more obvious
for proteins with a knot in their polypeptide backbones. There are only 78 non-redundant
knotted proteins in the entire Protein Data Bank of 30,000 structures (90% sequence
identity cutoff), a number much lower than would be expected to occur by chance [51,52].
Most of these 78 knots are the simple three-point crossing (trefoil) knot, and the most
complex is a sixpoint crossing knot for one protein called α-haloacid dehalogenase (the
Stevedore knot) [53,54]. The rarity and simplicity of knotted proteins again suggest the
opportunity to supplement natively knotted proteins with designed ones [48,55]. The
functional space of proteins is also far from fully explored by nature. For example,
enzymes can catalyze only a selected set of chemical reactions required for the life cycle
of living organisms. Such vast unexplored structural and functional space of proteins has
motivated active research in protein design, which is steadily increasing our knowledge
of protein structure and function while more clearly defining opportunities for future
explorations.
10
Page 26
Significant strides in a number of areas have been made in the past two decades. In the
early 1990s, most designed proteins had molten-globule-like structures with low stability
[14,56-58]. Currently, on the other hand, specific structures of de novo designed proteins
are routinely validated by NMR or X-ray structure determination [32,59-68]. New
structural folds were also successfully designed in 2003 [13] and 2009 [69] were also
successfully designed. Progress in structural specificity and stability was accompanied by
novel proteins designed with functions ranging from protein binding [70-76], catalytic
activities [77-82] to conformational switches [83,84]. Such advances make it clear that de
novo protein design holds promise to significantly accelerate the development of novel
proteins for diagnostic, therapeutic, and industrial purposes.
This promise, however, is still unfulfilled largely because of the low success rate of de
novo design [85-89]. Dantas et al. [90] performed a large-scale test of nine proteins
designed by RosettaDesign and found that only "half of the folded designs have NMR
spectra and temperature melts typical of tightly packed proteins''. Schreier et al. [91] re-
examined five computationally designed proteins and found that none of them performed
as expected due to instability, aggregation, or lack of detectable designed ligand binding.
Fleishman et al. [87] showed that only 2 of 73 designed proteins bind with detectable
binding affinity to the targeted stem region of influenza hemagglutinin.
To improve the success rate of protein design faces two practical challenges. First,
because experimentally measuring the success rate of design is time-consuming and
costly, many studies relied on manual inspection and human expertise in selecting
11
Page 27
designed sequences likely to be successful [86]. As a result, it is difficult to know the
actual success rate of a fully automated design that is necessary for routine usage by
biochemists. Second, because most protein design software is not openly available for
academic users, few comparisons between different computational techniques have been
made. These factors have made it difficult to determine what makes one design
successful and another design unsuccessful.
To limit our scope, this review focuses on de novo design of protein structures. We
compare four available protein design programs by computationally assessing designed
sequences. We show how different balances of energetic terms lead to different outcomes
in native sequence recovery, sizes of hydrophobic patches, and intrinsic disorder, among
others. We propose that inaccurate scoring functions are the origin of low success rates of
protein design. Locating the right balance for the right energy terms is the key to further
improving protein design.
2.3 De Novo Designed and Structurally Validated Proteins
To retrieve all de novo designed and structurally validated proteins, we searched
keywords “synthetic”, “de novo designed”, or “designed proteins” in protein databank
and excluded coiled coil, peptides and those proteins that were not computationally
designed (i.e. not by optimizing an energy function). We further removed those structures
that do not have corresponding publications. This leads to a small list of 12 proteins (see
Table 2.1) whose structures were determined by NMR or X-ray diffractions over the span
of 15 years. As shown in Figure 1, various structural folds ranging from all alpha, mixed
12
Page 28
alpha and beta, and all beta proteins with increased complexities and sizes were
successfully designed. The largest computationally designed protein has 127 residues. Six
of the 12 proteins listed were designed by RosettaDesign [13,67,68,92-94] that utilized a
mixed knowledge-based and physical based energy terms with heavy emphasis on
specific packing of hydrophobic and hydrophilic residues. The use of knowledge-based
and/or physical-based energy functions for packing interactions is also crucial for other
computational techniques [32,60,62,69,95,96] to achieve structural specific. However,
over the past 15 years we have seen no significant change in the number of proteins that
are de novo designed and structurally validated in a given year. It is either 0, 1, or 2 per
year. This low number of designed proteins suggests lack of a broader utilization of
computational design, lack of improvement in success rates, or both.
13
Page 29
Table 2.1 De novo, computationally designed proteins validated by NMR or X-ray
structure determination.
Year PDB# Length Fold Expt. Computational
1997 1fsd 28 β−β−α motif NMR
pairwise residue rotamer energy
optimization by dead-end elimination
[32]
1999 2a3d 73 3-helix bundle NMR Started from coiled coil and hydrophobic
core repacked by genetic algorithm [60]
2003 1qys 93 novel α+β X-ray
(1.2Å)
Combining structure prediction with
sequence design (Rosetta-Design) [13]
2004 1vjq 79 α/β X-ray
(2.1Å) RosettaDesign [68]
2005 2cw1 65 α+β NMR Optimizing a knowledge-based function
by simulated annealing [95]
2005 2a3j 127 α+β NMR Rosetta-Design [67]
2007 2p6j 52 3-helix bundle NMR
Fixed binary pattern, energy
optimization by dead-end elimination,
sidechain conformations by MC
simulated annealing [62]
2007 3b83 100 Beta-sandwich X-ray
(2.4Å)
Specific energy function optimized for
beta proteins by Rosetta-design [92]
2008 2jvf 96 α+β NMR
Sequences generated from local
tetrapeptide fragment library with some
core residues fixed [96]
2009 2ki0 36 Novel β−α−β NMR
A combination of knowledge-based
secondary structure design with energy
optimization [69]
2011 3u3b 113 4-helix bundle X-ray
(1.85Å)
Allowed backbone flexibility for
redesigning the entire hydrophobic core
(Rosetta-Design) [93]
2011 3tdm 126 Tim-Barrel α/β X-ray (2Å) Imposing symmetry in Rosetta-Design
[94]
14
Page 30
Figure 2.1 The sizes of computationally designed proteins for the past 15 years.
2.4 Origin of Low Success Rate in Protein Design
For a given length, an astronomically large number of possible sequences can be
generated from different combination of amino acid residues (20100 for a 100-residue
protein). Only a tiny fraction of those sequences can be folded into specific structures by
the water-mediated interaction among amino acid residues. Thus, observed low success
rates in protein design can be caused either by failure to locate the global minimum
specified by the free energy function, or both. To assess which one is the likely cause, we
examined 100 sequences designed by RosettaDesign 2.3 on the basis of different initial
conditions. We [97] found that these sequences are highly homologous among each other,
15
Page 31
with an average sequence identity of 68% based on a database of 944 proteins. In other
words, all designed sequences are converging to a single solution, suggesting that
searching for a global minimum is not a major issue, at least for proteins designed with a
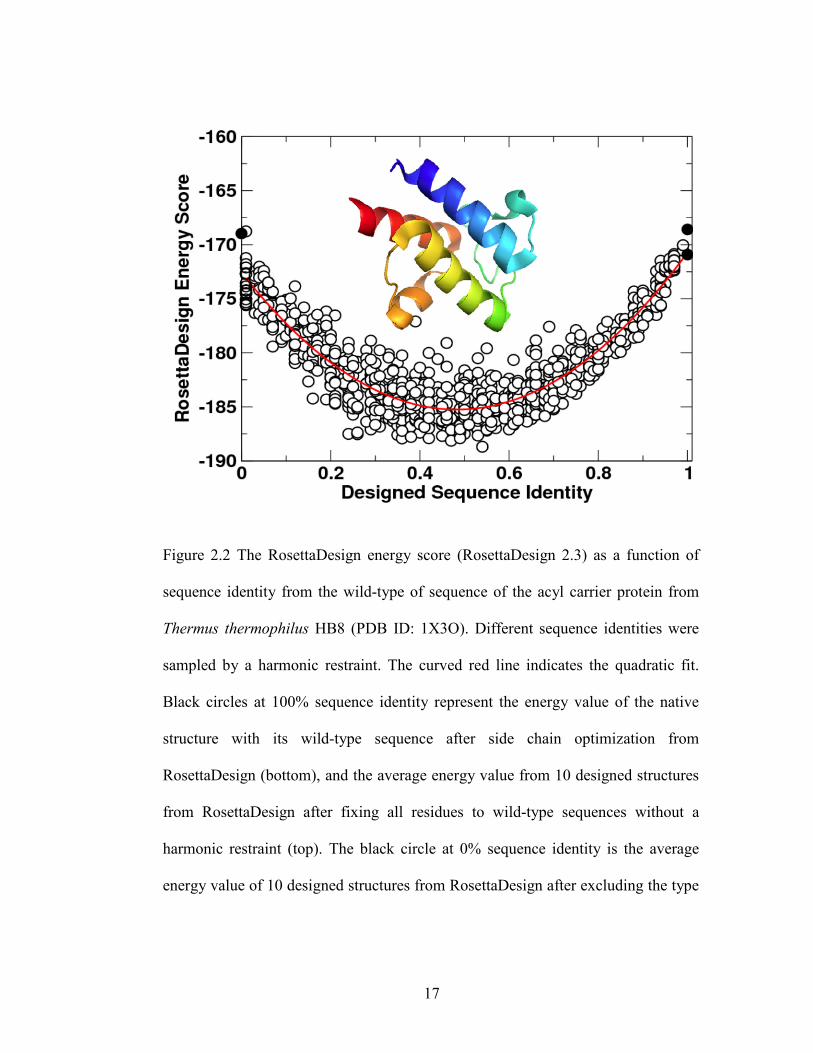
fixed backbone. To confirm this, we added a harmonic restraint to the RosettaDesign
energy function [E=-wseq(SeqID-SeqID0)2 with wseq=10000] so that we could sample
sequences around a fixed sequence identity (SeqID0) to the wild type sequence of the
target structure. Figure 2.2 shows that RosettaDesign energy scores of 1010 sequences
designed for the structure of the acyl carrier protein from Thermus thermophilus HB8
(PDB ID: 1X3O) at different SeqID0 ranging from 0 to 1 (100%). Without the harmonic
restraint, the average sequence identity to the wild type sequence of the acyl carrier
protein is around 50%. The energy score increases significantly when sequence identity
moves toward either 0% or 100% sequence identity. This finding indicates that the wild-
type sequence is not part of the solution. Because each RosettaDesign energy unit is 0.5-1
kcal/mole according to some estimates [82,98,99], the energy difference between the
sequence at 100% sequence identity and at 50% sequence identity is about 15
RosettaDesign energy units or approximately 8-15 kcal/mole. Although a wild-type
sequence is not necessarily optimized for its structure, this energy difference is too large
to be realistic as it is close to the typical stability free energy of proteins (-10 kcal/mole)
[100]. The limitation of existing energy functions is further reflected from poorer
performance in designing for NMR structures than for X-ray structures [101,102]. In
other words, the quality of an energy function remains the main obstacle to successful
computational design.
16
Page 32
Figure 2.2 The RosettaDesign energy score (RosettaDesign 2.3) as a function of
sequence identity from the wild-type of sequence of the acyl carrier protein from
Thermus thermophilus HB8 (PDB ID: 1X3O). Different sequence identities were
sampled by a harmonic restraint. The curved red line indicates the quadratic fit.
Black circles at 100% sequence identity represent the energy value of the native
structure with its wild-type sequence after side chain optimization from
RosettaDesign (bottom), and the average energy value from 10 designed structures
from RosettaDesign after fixing all residues to wild-type sequences without a
harmonic restraint (top). The black circle at 0% sequence identity is the average
energy value of 10 designed structures from RosettaDesign after excluding the type
17
Page 33
of wild-type amino acid residue at each sequence position without the harmonic
restraint.
2.5 Energy Function in Protein Design
Energy functions for protein design are typically modified from the energy functions for
protein folding or dynamics studies (for a discussion, see [85,86,103-108]). Because no
major change in energy functions for protein design has occurred in the past decade, we
do not provide a comprehensive summary of all existing energy functions employed in
protein design. Instead, we describe in detail the energy functions of three programs
(RosettaDesign [101,109,110], EGAD [43], and Liang-Grishin [40]), which are fairly
representative of current state-of-the-art energy functions. RosettaDesign is dominated by
knowledge-based energy functions derived from protein structures, with the exception of
van derWaals and hydrogen bonding terms. EGAD attempts to build its energy function
largely on a physical-based molecular mechanics force field. The Liang-Grishin scoring
function, on the other hand, is an empirical mix of various geometry-based, knowledge-
based, and physical-based terms. More importantly, these programs are available for our
comparative studies.
2.5.1 RosettaDesign Energy Function
The RosettaDesign energy function [101,109,110] is made of fourteen terms as shown in
Equation 2.1 below:
18
Page 34
𝐸𝐸𝑅𝑅𝑅𝑅 = 𝑊𝑊𝑏𝑏𝑏𝑏𝑏𝑏𝑏𝑏𝐸𝐸𝑏𝑏𝑏𝑏𝑏𝑏𝑏𝑏 + 𝑊𝑊𝑏𝑏𝑏𝑏𝑏𝑏𝑏𝑏𝑜𝑜𝑜𝑜𝑜𝑜𝑜𝑜𝑏𝑏𝐸𝐸𝑏𝑏𝑏𝑏𝑏𝑏𝑏𝑏
𝑜𝑜𝑜𝑜𝑜𝑜𝑜𝑜𝑏𝑏 + 𝑊𝑊𝑟𝑟𝑜𝑜𝑟𝑟𝑏𝑏𝑜𝑜𝑜𝑜𝑟𝑟𝐸𝐸𝑟𝑟𝑜𝑜𝑟𝑟𝑏𝑏𝑜𝑜𝑜𝑜𝑟𝑟
+𝑊𝑊𝑟𝑟𝑜𝑜𝑟𝑟𝑟𝑟𝑟𝑟𝐸𝐸𝑟𝑟𝑜𝑜𝑟𝑟𝑟𝑟𝑟𝑟 +𝑊𝑊𝑟𝑟𝑜𝑜𝑟𝑟𝑟𝑟𝑟𝑟𝑖𝑖𝑖𝑖𝑟𝑟𝑟𝑟𝑏𝑏𝐸𝐸𝑟𝑟𝑜𝑜𝑟𝑟𝑟𝑟𝑟𝑟𝑖𝑖𝑖𝑖𝑟𝑟𝑟𝑟𝑏𝑏 + 𝑊𝑊𝑏𝑏𝑟𝑟𝑟𝑟𝑟𝑟𝐸𝐸𝑏𝑏𝑟𝑟𝑟𝑟𝑟𝑟
+𝑊𝑊𝑠𝑠𝑜𝑜𝑟𝑟𝑠𝑠𝐸𝐸𝑠𝑠𝑜𝑜𝑟𝑟𝑠𝑠 + 𝑊𝑊𝑏𝑏𝑜𝑜𝑟𝑟𝑜𝑜𝐸𝐸𝑏𝑏𝑜𝑜𝑟𝑟𝑜𝑜 + 𝑊𝑊ℎ𝑏𝑏𝑜𝑜𝑖𝑖𝑏𝑏𝑟𝑟𝑏𝑏 𝐸𝐸ℎ𝑏𝑏𝑜𝑜𝑖𝑖𝑏𝑏𝑟𝑟𝑏𝑏
+𝑊𝑊ℎ𝑏𝑏𝑜𝑜𝑖𝑖𝑏𝑏𝑖𝑖𝑟𝑟𝑏𝑏 𝐸𝐸ℎ𝑏𝑏𝑜𝑜𝑖𝑖𝑏𝑏𝑖𝑖𝑟𝑟𝑏𝑏 + 𝑊𝑊ℎ𝑏𝑏𝑜𝑜𝑖𝑖𝑏𝑏
𝑠𝑠𝑏𝑏𝑏𝑏 𝐸𝐸ℎ𝑏𝑏𝑜𝑜𝑖𝑖𝑏𝑏𝑠𝑠𝑏𝑏𝑏𝑏
+𝑊𝑊ℎ𝑏𝑏𝑜𝑜𝑖𝑖𝑏𝑏𝑠𝑠𝑏𝑏 𝐸𝐸ℎ𝑏𝑏𝑜𝑜𝑖𝑖𝑏𝑏𝑠𝑠𝑏𝑏 + 𝑊𝑊𝑃𝑃𝑟𝑟𝑜𝑜𝐸𝐸𝑃𝑃𝑟𝑟𝑜𝑜 − 𝐸𝐸𝑟𝑟𝑜𝑜𝑟𝑟
(2.1)
where Eref and W are optimized reference energies and weight factors for different energy
terms, respectively. Eback is a backbone energy term for φ and ψ angles based on the
Ramachandran diagram [111]. 𝐸𝐸𝑏𝑏𝑏𝑏𝑏𝑏𝑏𝑏𝑜𝑜𝑜𝑜𝑜𝑜𝑜𝑜𝑏𝑏is a statistical omega-angle potential. Erotamer is a
backbone-dependent sidechain-rotamer energy term [112]. This is a knowledge-based
self-energy of an amino acid residue at a specific rotameric state derived from known
protein structures. 𝐸𝐸𝑏𝑏𝑟𝑟𝑟𝑟𝑟𝑟 and E𝑟𝑟𝑜𝑜𝑟𝑟𝑟𝑟𝑟𝑟 are attractive and repulsive portions of 12-6 Lennard-
Jones potential, respectively. E𝑟𝑟𝑜𝑜𝑟𝑟𝑟𝑟𝑟𝑟 is finite, linearly dependent on distance for rij<0.89σij
(rij and σij are the distance between atoms i and j and the average van der Waals radius
of atoms i and j, respectively). Intra-residue repulsive interactions are weighted
separately. Esolv is the Lazaridis-Karplus implicit solvation energy [113]. Ekelec is a
knowledge-based, electrostatic interaction based on the probability of two polar amino
acid residues at a given distance [114]. Eℎ𝑏𝑏𝑜𝑜𝑖𝑖𝑏𝑏 is a geometry-based hydrogen bonding
term that is weighted separately for local backbone-backbone (lb), nonlocal backbone-
backbone (nlb), sidechain-backbone (scb) and sidechain-sidechain (sc), respectively.
𝐸𝐸𝑃𝑃𝑟𝑟𝑜𝑜 is a specific energy term for proline ring closure. There are also four additional
terms for disulfide bonds. We do not list them here because RosettaDesign typically fixes
Cys residues. All parameters and reference state values were optimized by native
19
Page 35
sequence recovery and amino acid compositions. Here we employ RosettaDesign 2.3
only because more recent versions do not make significant changes to its energy function.
2.5.2 EGAD Energy Function
An EGAD energy function [43] contains four terms.
𝐸𝐸𝐸𝐸𝐸𝐸𝐸𝐸𝑅𝑅 = 𝐸𝐸𝑂𝑂𝑃𝑃𝑂𝑂𝑂𝑂−𝐸𝐸𝐸𝐸 + 𝐸𝐸𝑠𝑠𝑜𝑜𝑟𝑟𝑠𝑠 − 𝐸𝐸𝑟𝑟𝑜𝑜𝑟𝑟 + 𝑇𝑇𝑇𝑇𝑟𝑟𝑖𝑖𝑟𝑟𝑜𝑜𝑟𝑟𝑏𝑏𝑜𝑜𝑏𝑏
(2.2)
where T is temperature. 𝐸𝐸𝑂𝑂𝑃𝑃𝑂𝑂𝑂𝑂−𝐸𝐸𝐸𝐸 is the molecular mechanics energy function from the
OPLS-AA force field [115] that includes a van der Waals term, the Coulombic
interaction, and torsion-angle terms as well as truncated electrostatic energies between
close atom pairs and a finite, linear repulsive term for the van derWaals interaction at
rij<0.82σij. The purpose of modification was to reduce hard-core overlap energies due to
approximations introduced from fixed backbone and discrete sidechain rotamers as in
RosettaDesign. Esolv is the solvation free energy from the generalized Born model for
electrostatic interactions and solvent-accessible-surface-area dependent term for
hydrophobic interactions [116]. Eref is a reference state energy estimated from the
average of interaction energies for a given residue type in random sequences threaded
onto protein structures. Sunfolded is sidechain entropy (dependent on residue types only) in
the unfolded state estimated from peptide simulations and rotamer statistics [117]. In
Equation 2.2, only two parameters for softening van der Waals repulsions were optimized
for reproducing experimental mutation-induced change in protein stability. Pro, Gly and
Cys residues are fixed in the program.
20
Page 36
2.5.3 Liang-Grishin Energy Function
The energy function for the Liang-Grishin method [40] is shown in Equation 2.3:
𝐸𝐸𝑂𝑂𝑖𝑖𝑏𝑏𝑖𝑖𝑜𝑜−𝐸𝐸𝑟𝑟𝑖𝑖𝑠𝑠ℎ𝑖𝑖𝑖𝑖 = −𝑊𝑊𝑠𝑠𝑟𝑟𝑟𝑟𝑟𝑟𝑏𝑏𝑏𝑏𝑜𝑜𝐸𝐸𝑠𝑠𝑟𝑟𝑟𝑟𝑟𝑟𝑏𝑏𝑏𝑏𝑜𝑜 +𝑊𝑊𝑠𝑠𝑜𝑜𝑟𝑟𝑟𝑟𝑜𝑜𝑜𝑜𝐸𝐸𝑠𝑠𝑜𝑜𝑟𝑟𝑟𝑟𝑜𝑜𝑜𝑜
+𝑊𝑊ℎ𝑏𝑏𝑜𝑜𝑖𝑖𝑏𝑏 𝐸𝐸ℎ𝑏𝑏𝑜𝑜𝑖𝑖𝑏𝑏 + 𝑊𝑊𝑜𝑜𝑟𝑟𝑜𝑜𝑏𝑏𝐸𝐸𝑜𝑜𝑟𝑟𝑜𝑜𝑏𝑏 −𝑊𝑊𝑠𝑠𝑜𝑜𝑟𝑟𝑠𝑠𝑟𝑟 𝐸𝐸𝑠𝑠𝑜𝑜𝑟𝑟𝑠𝑠
𝑟𝑟
+𝑊𝑊𝑠𝑠𝑜𝑜𝑟𝑟𝑠𝑠ℎ 𝐸𝐸𝑠𝑠𝑜𝑜𝑟𝑟𝑠𝑠ℎ + 𝑊𝑊𝑠𝑠𝑜𝑜𝑟𝑟𝑠𝑠
ℎ𝑖𝑖ℎ𝐸𝐸𝑠𝑠𝑜𝑜𝑟𝑟𝑠𝑠ℎ𝑖𝑖ℎ +𝑊𝑊𝑜𝑜𝑒𝑒𝑏𝑏𝑟𝑟𝑉𝑉𝑜𝑜𝑒𝑒𝑏𝑏𝑟𝑟
+𝑊𝑊𝑟𝑟𝑜𝑜𝑟𝑟𝑏𝑏𝑜𝑜𝑜𝑜𝑟𝑟𝐸𝐸𝑟𝑟𝑜𝑜𝑟𝑟𝑏𝑏𝑜𝑜𝑜𝑜𝑟𝑟 −𝑊𝑊𝑠𝑠𝑠𝑠𝑏𝑏𝑜𝑜𝑖𝑖𝑏𝑏𝑁𝑁𝑠𝑠𝑠𝑠𝑏𝑏𝑜𝑜𝑖𝑖𝑏𝑏 − 𝐸𝐸𝑟𝑟𝑜𝑜𝑟𝑟
(2.3)
where Eref and W are optimized reference energy and weight factors for different energy
terms, respectively. 𝐸𝐸𝑠𝑠𝑟𝑟𝑟𝑟𝑟𝑟𝑏𝑏𝑏𝑏𝑜𝑜 and 𝐸𝐸𝑠𝑠𝑜𝑜𝑟𝑟𝑟𝑟𝑜𝑜𝑜𝑜 are contacting surface area and overlapping
volume between a rotamer and surrounding protein atoms [118], respectively. Ehbond is an
empirical, geometry-based hydrogen-bond energy function. Eelec represents CHARMM
eletrostatic interactions based on distance dependent dielectric constants [119]. There are
four desolvation energy terms based on buried hydrophobic surface area (𝐸𝐸𝑠𝑠𝑜𝑜𝑟𝑟𝑠𝑠𝑟𝑟 ), the
hydrophilic surface area (𝐸𝐸𝑠𝑠𝑜𝑜𝑟𝑟𝑠𝑠ℎ ), the fraction of buried surface area of non-hydrogen-
bonded hydrophilic atoms(𝐸𝐸𝑠𝑠𝑜𝑜𝑟𝑟𝑠𝑠ℎ𝑖𝑖ℎ) and solvent-exclusion volume of charged atoms Vexcl.
𝐸𝐸𝑟𝑟𝑜𝑜𝑟𝑟𝑏𝑏𝑜𝑜𝑜𝑜𝑟𝑟 is an intrinsic rotamer energy term calculated on the basis of the expected
rotamer frequency for a given amino-acid (AA) residue type multiplied by the frequency
of that amino acid type for given backbone torsion angles. The program also utilizes a
specific disulfide-bond term based on the number of disulfide bonds (𝑁𝑁𝑠𝑠𝑠𝑠𝑏𝑏𝑜𝑜𝑖𝑖𝑏𝑏) . All
parameters and reference state values were optimized by native sequence recovery and
amino acid compositions as in RosettaDesign.
21
Page 37
2.5.4 Balancing Nonlocal and Local Interactions
All three energy functions, similar to other energy functions for protein design
[85,86,103-108], heavily emphasize nonlocal interactions between residues that are
located close to each other in the three-dimensional space but far from each other in
sequence positions. These nonlocal interactions including van der Waals, electrostatic,
hydrogen bonding, and solvation energies) were built for capturing tight and specific
tertiary packing interactions. By comparison, local interactions between neighboring
residues along the sequence is limited on single-residue property such as secondary
structure propensity as used in ORBIT [32], backbone torsion-angle terms
(RosettaDesign and EGAD), and backbone angle-dependent rotamer energy
(RosettaDesign and Liang-Grishin). On the other hand, secondary structures (or backbone
torsion angles) are determined largely by local sequence segment of 20 residues at about
80% accuracy for three-state secondary structure [120,121] or 83% for backbone and
torsion angles both within 60 degree from their native values [122]. Thus, going beyond
single-residue properties maybe required to account for the coupling between local
backbone structure and sequence for protein design.
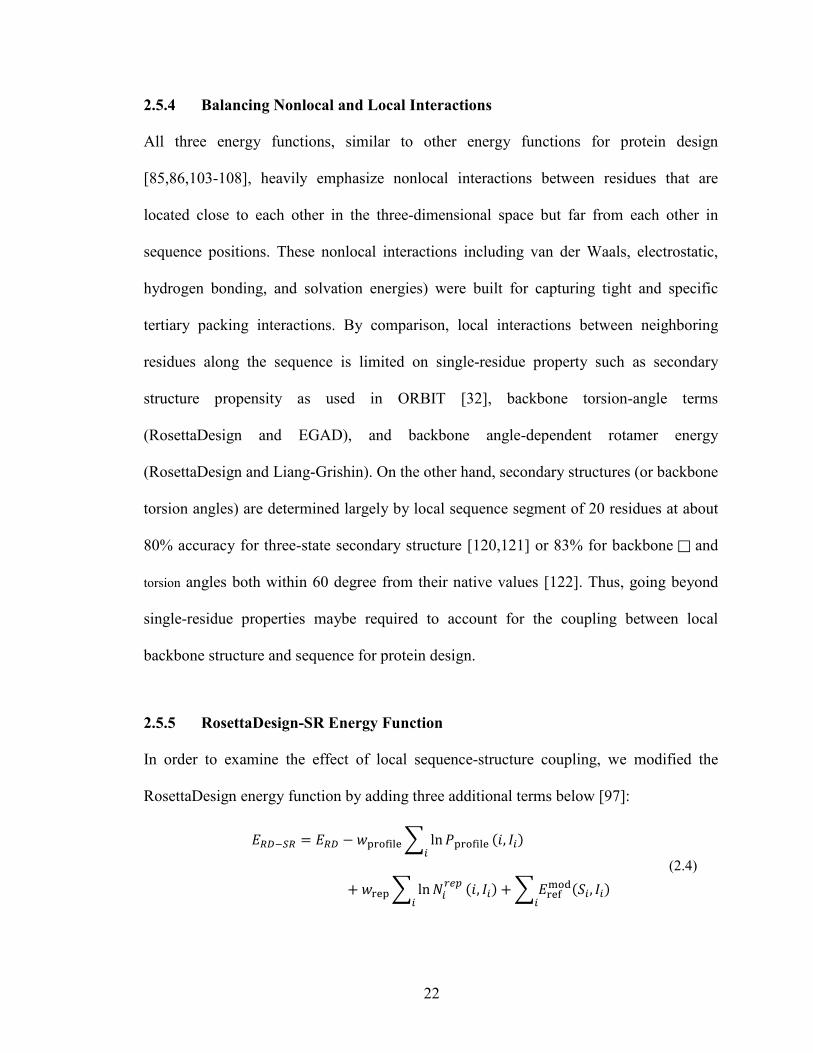
2.5.5 RosettaDesign-SR Energy Function
In order to examine the effect of local sequence-structure coupling, we modified the
RosettaDesign energy function by adding three additional terms below [97]:
𝐸𝐸𝑅𝑅𝑅𝑅−𝑂𝑂𝑅𝑅 = 𝐸𝐸𝑅𝑅𝑅𝑅 − 𝑤𝑤profile� ln𝑃𝑃profile (𝑖𝑖, 𝐼𝐼𝑖𝑖)𝑖𝑖
+ 𝑤𝑤rep� ln𝑁𝑁𝑖𝑖𝑟𝑟𝑜𝑜𝑟𝑟 (𝑖𝑖, 𝐼𝐼𝑖𝑖) + �𝐸𝐸ref
mod(𝑇𝑇𝑖𝑖, 𝐼𝐼𝑖𝑖)𝑖𝑖𝑖𝑖
(2.4)
22
Page 38
where Pprofile(i, Ii) is a structure-derived sequence profile (probability of an amino acid
residue type I at a given sequence position i). This sequence profile is generated by using
target structural fragments to search matching structural fragments stored in a structural
fragment library. The sequences of the matching structural fragments were employed to
produce the probability of a given amino-acid residue type at a given sequence position.
The sequence profile for the whole target structure can be produced by a sliding window
from N-terminal to C-terminal. This structure-derived sequence profile was successfully
employed for protein structure prediction [123] and protein design [124]. This profile
term, however, leads to an increase in number of repeats of same residue types such as
LLL and VVV and a reduction of complexity of the designed sequence. Because low
complexity protein sequences are often associated with intrinsically disordered regions of
a protein [125], such region is not desirable in designing structured proteins. Thus, to
penalize a repetitive sequence segment, the second term in Equation 2.4 was introduced
by calculating Nirep, the number of nearest and second nearest neighboring residues that
repeat the residue type at the sequence position i (ranging from i-2 to i+2 including itself).
This second term is a simplified measure of the extent of sequence randomness by
Shannon's entropy [126]. The third term in Equation 2.4 reflects the change to the
reference state energy due to introduction of new energy terms.
2.6 Computational Assessment of Designed Proteins
How to make an accurate, computational assessment of designed sequences is an
unsolved problem. We attempt to assess RosettaDesign, EGAD, Liang-Grishin and
RosettaDesign-SR structure-derived sequence profile and repetitive penalty) on the basis
23
Page 39
of several criteria by employing a dataset of monomeric proteins to avoid possible
complications due to interprotein interactions. The stably folded monomeric proteins is
obtained by searching protein databank based on the following criteria: a) X-ray
determined structures without DNA, RNA, hybrid or other ligands; b) having only one
chain (both biological assembly and asymmetric unit); c) high resolution (≤3.0Å) with
size ≥70 residues and ≤400; and d) no missing residues (except terminal regions) or
abnormal amino acid types. A total of 616 proteins are obtained after removing redundant
chains at 30% sequence identity. These proteins are then clustered according to the
fraction of surface residues fsr because surface residues are more difficult to design due to
larger conformational freedom and more direct interactions with solvent molecules. We
define that a residue is “on surface” if its solvent accessible surface is greater than or
equal to 20% of its reference value [127]. We divided proteins according to the ranges of
fsr values ([0.4, 0.45), [0.45, 0.5), [0.5, 0.55), [0.55, 0.6), [0.6, 0.65), [0.65, 0.7), [0.7, 0.75)
and [0.75-0.85)). We started from 0.4 because there are few proteins with fsr<0.4. For the
same reason, the last bin was combined from two bins [0.75-0.8) and [0.8-0.85). Because
designing proteins with EGAD and Liang-Grishin programs are computationally
intensive, we only design 15 smallest proteins per bin except the last bin with 7 proteins
only from the dataset of 616 proteins. A total of 112 proteins are designed by four
programs (the list of protein can be found in Appendix A ). We employed all default
setting in those programs for fixed backbone design to increase computational efficiency
and removed all side chains from structures prior to computational design.
24
Page 40
Computational programs including Real SPINE-3, SPINE-D, SPARKS-X, QUILT and
STRIDE are involved in the assessment process. The developments of all of these
programs are independent from the assessment work which makes them non-biased to the
assessment of protein design methods.
2.6.1 Sequence Assessment: Native Sequence Recovery
One commonly employed approach is the sequence identity to the wild type sequence, or
recovery of the native sequence. The reported sequence identities range from 30% to 37%
[27,92,101,128,129]. These results were often based on a small number of proteins.
Moreover, some methods fixed certain types of amino acid residues such as Gly, Cys or
Pro. Figure 2.3a compares the average sequence identity of designed sequences to their
respective wild-type sequences at different fractions of surface residues without fixing
any residue types. RosettaDesign-SR gives the highest sequence identities ranging from
36% to 44% that are close to 4-8% better than the next best while RosettaDesign and
Liang-Grishin yield similar sequence identities. The lowest sequence identity was given
by EGAD in all methods examined likely because EGAD was not optimized for native
sequence recovery.
25
Page 41
Figure 2.3 Computationally assess design methods. (a) The average sequence
identity of sequences designed by RosettaDesign-SR, RosettaDesign, Liang-
Grishin, and EGAD is compared to their respective wild-type sequences as a
function of the fraction of surface residues. (b) The average accuracy of predicted
secondary structures from the sequences designed by four computational methods
is compared with the results for wild-type sequences. SPINE-X was employed for
sequence-based secondary structure prediction. (c) The average fractions of
predicted disordered residues are compared. SPINE-D was employed for predicting
26
Page 42
intrinsic disorder for designed and wild-type sequences. (d) The average correlation
coefficients between predicted and actual solvent-accessible surface areas (ASA)
from the target structure are compared. Real-SPINE 3 was employed for solvent
accessibility prediction from designed and wild-type sequences
2.6.2 Local Assessment: Secondary Structure Recovery
The effect of lacking the local coupling term between sequence and backbone structure
can be examined by comparing the accuracy of predicted secondary structures for
designed sequences or the ability of recovering native secondary structures. We
employed SPINE-X for secondary structure prediction that achieves 81-82% accuracy for
large benchmark tests [121]. Figure 2.3b shows that the average accuracy for predicted
secondary structures for sequences designed by RosettaDesign-SR is consistently higher
than those predicted from wild-type sequences. This reflects the usefulness of utilizing
the local-structure-derived sequence profile in RosettaDesign-SR. The sequences
designed by the RosettaDesign and Liang-Grishin program yield more accurate
secondary structures than wild-type sequences at low fractions of surface residues but not
at high fractions of surface residues. This suggests that local sequence-structure coupling
is more effective for capturing correct secondary structure in surface regions. EGAD has
the lowest recovery of native secondary structure, consistent with its low sequence
identity to wild type sequences.
27
Page 43
2.6.3 Local Assessment: Intrinsic Disorder
The possibility of low complexity in designed sequences leads us to examine predicted
intrinsically disordered residues in designed sequences. We employ SPINE-D [130] for
this task because it was one of the top disorder predictors in critical assessment of
structure prediction techniques in 2010 (CASP 9) [131]. Figure 2.3c compares average
fractions of disordered residues given by wild type sequences with those from designed
sequences at different fractions of surface residues. Except for one bin where a few wild-
type sequences have regions with predicted disordered probability at about 0.5, the
fractions of disordered residues in wild-type sequences are usually lower than those in
designed sequences. This suggests the usefulness of using SPINE-D for detecting
potentially unstable regions. Liang-Grishin and EGAD have the highest fraction of
predicted disordered regions in all bins while RosettaDesign-SR and RosettaDesign have
similar performance and close to wild-type sequences in most bins.
2.6.4 Surface Assessment: Solvent Accessibility Recovery
Another way to examine designed sequences is to test the conservation of solvent
accessible surface area (ASA) of designed sequences relative to that of native structures
of wild-type sequences. We calculate the correlation coefficient between the ASA
predicted by real-SPINE 3 [132] and actual ASA based on the corresponding wild-type
sequence on the target structure. Figure 2.3d shows that at low fractions of surface
residues, all sequences yield similar correlation coefficients for ASA (∼0.75). The
difference between different methods increases for proteins with higher fractions of
surface residues. Sequences designed by RosettaDesign-SR and Liang-Grishin programs
28
Page 44
produced ASA closer to that of wild-type sequences than did RosettaDesign and EGAD
programs.
Figure 2.4 Comparisons of largest hydrophobic patch area and total ASA /
maximum total ASA. (a) A comparison of the average largest hydrophobic patch
area given by RosettaDesign-SR, RosettaDesign, Liang-Grishin, and EGAD with
that given by wild-type proteins. (b) A comparison of the total solvent-accessible
surface area (ASA) for all residues in a protein normalized by their maximum
possible total solvent-accessible surface area for the four programs and wild type.
2.6.5 Surface Assessment: Hydrophobic Patch
Aggregation is one common problem for designed proteins [91]. Rate of aggregation is
associated with exposed hydrophobic surface area [133]. Figure 2.4a compares the
average largest hydrophobic patch area given by different methods. Hydrophobic patch
29
Page 45
area is generated by the program QUILT [134]. RosettaDesign and RosettaDesign-SR
produced significantly higher hydrophobic patch area (2-3 times higher) than wild-type
proteins. Remarkably, the sequences designed by Liang-Grishin program have smaller
hydrophobic patch area than wild-type sequences. This finding highlights the emphasis of
the Liang-Grishin energy function on surface-exposed residues with four separate
solvation terms. EGAD-designed proteins also produced smaller hydrophobic patches
than wild-type proteins. One should note, however, that designed sequences with large
hydrophobic patches may be filtered by manual selection of sequences for experimental
validations.
2.6.6 Packing Assessment: Total Accessible Surface Area
Packing interaction is the dominant stabilization factor for specific tertiary structures. We
utilized the target structure with designed sequences to calculate total solvent accessible
surface areas for all residues in a protein normalized by their maximum total (reference)
solvent-accessible area. Figure 2.4b shows that RosettaDesign and RosettaDesign-SR
programs yielded higher values (about 8%) of total ASA than wild-type sequences did,
whereas the Liang-Grishin program gave significantly lower values of total ASA. The
EGAD program, on the other hand, yielded ASA values essentially equal to those of
wild-type sequences. This suggests that protein cores designed by RosettaDesign and
RosettaDesign-SR do not pack as tightly as EGAD and native proteins. The Liang-
Grishin program seems to pack protein cores more tightly than native proteins.
30
Page 46
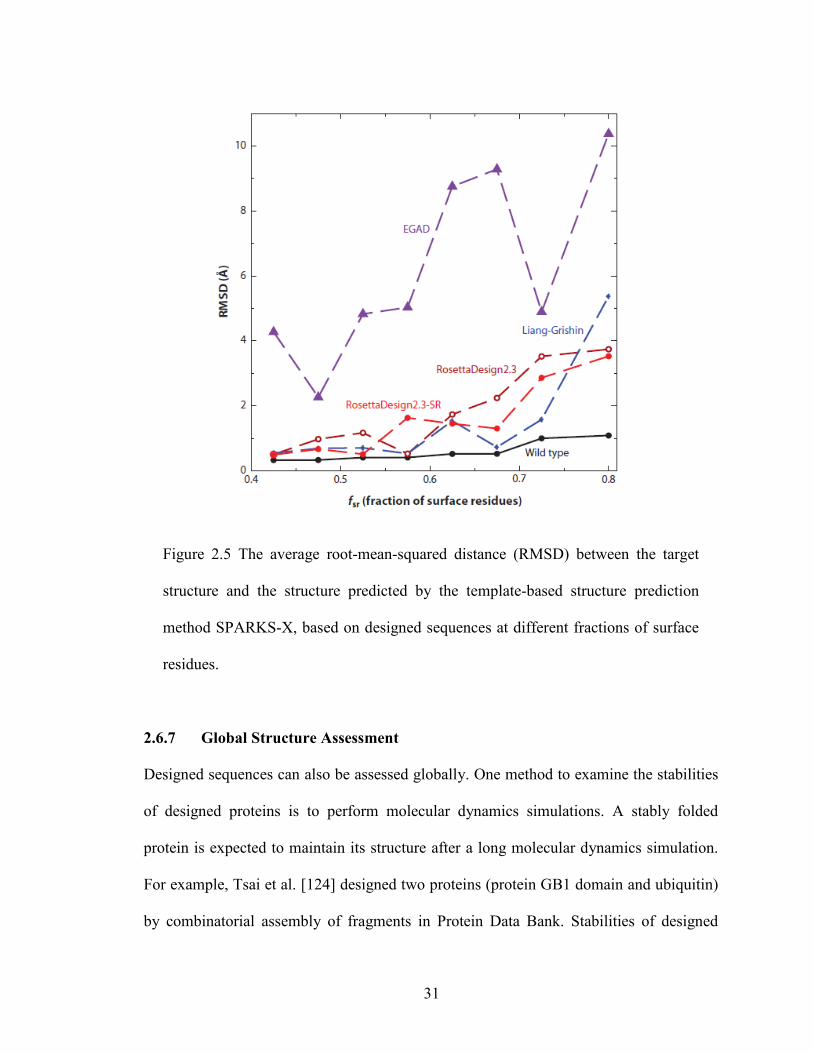
Figure 2.5 The average root-mean-squared distance (RMSD) between the target
structure and the structure predicted by the template-based structure prediction
method SPARKS-X, based on designed sequences at different fractions of surface
residues.
2.6.7 Global Structure Assessment
Designed sequences can also be assessed globally. One method to examine the stabilities
of designed proteins is to perform molecular dynamics simulations. A stably folded
protein is expected to maintain its structure after a long molecular dynamics simulation.
For example, Tsai et al. [124] designed two proteins (protein GB1 domain and ubiquitin)
by combinatorial assembly of fragments in Protein Data Bank. Stabilities of designed
31
Page 47
proteins were tested by molecular dynamics simulations. Designed proteins for protein
GB1 domain and ubiquitin have higher root-mean squared distances (RMSD) from the
target structure than wild-type proteins but lower RMSD than nonprotein controls
(inverted hydrophobic/hydrophilic residue patterns).). Liang et al. [135] designed protein-
protein interaction interfaces by grafting binding epitopes onto small proteins. Molecular
dynamics simulations revealed that some designed interfaces are not stable
(disassociating) during the course of long molecular dynamics simulations whereas
interfaces and natively binding proteins remain stable. Another way to assess designed
proteins globally is to predict structures of designed sequences. For example, Bazzoli et
al. [136] assessed designed sequences by fragment/template-based structure prediction
technique I-TASSER. They found that the majority of top designed sequences have
folded into the structures within 2Å RMSD from the target structure, even though
different energy-scoring functions were used in design and folding assembly. Here, we
[137] employ the template-based structure prediction tool SPARKS-X to predict
structures of designed sequences where the target structures are contained in the template
library. The predicted structures are then compared to their respective target structures by
RMSD. Figure 2.5 shows that the performances of Liang-Grishin, RosettaDesign, and
RosettaDesign-SR programs are similar. EGAD performed the worst largely because its
low native sequence recovery makes recognizing correct template structures difficult.
Note that even wild-type sequences have small RMSD values because SPARKS-X
rebuilt and refined predicted structures using the program MODELLER [138].
32
Page 48
2.6.8 Summary
Based on results from Figure 2.3 to Figure 2.5, it is clear that introducing local sequence-
structure coupling and sequence complexity terms in RosettaDesign (RosettaDesign-SR)
leads to the intended effect of increasing sequence identity to wild-type sequence (Figure
2.3a) and improving the consistency between predicted secondary structure and actual
secondary structure (Figure 2.3b) and between predicted ASA and actual ASA (Figure
2.3d). However, the average largest hydrophobic patch area given by RosettaDesign-SR,
as by RosettaDesign, is too large, compared with that given by wild-type sequences. This
result points out an area for future improvement by introducing explicit [110,139,140] or
implicit [141] scoring methods for hydrophobic patches. Although reference energies, in
principle, can control the amount of the hydrophobic surface area exposed by controlling
the ratio of hydrophobic to hydrophilic residues, such reference states do not seem
adequate in RosettaDesign or RosettaDesign-SR. Another interesting result is that Liang-
Grishin and EGAD programs performed the best in terms of sizes of the largest
hydrophobic patch. However, too few hydrophobic residues on the surface may reduce
the overall stability of proteins because hydrophobic interactions are the major driving
force of protein stability [142]. Even surface hydrophobic residues improve protein
stability [143,144]. Thus, weighting various energetic terms differently leads to different
outcomes. Determining how to balance these different interactions is the key to
successful protein design.
33
Page 49
2.7 Community-wide Scoring Function Assessment
Recently, a large number of designed proteins targeting the conserved stem region of
influenza hemagglutinin [87] offered an unprecedented opportunity to examine the ability
of energy scoring functions to separate binders from nonbinders by a blind-prediction,
community-wide experiment [145]. Twenty-eight groups, including ours, armed with
different energy functions participated in this experiment. These energy functions range
from physical-based molecular mechanics force fields, knowledge-based energy
functions, empirical combinations of various knowledge-based and physical-based terms,
to scoring functions trained by machine learning techniques. The highest area under the
receiver operating characteristic curve for two-state binding/nonbinding prediction is 0.86
by three scoring functions. Two scoring functions (Group 2 J.C. Mitchell & O.N.A.
Demerdash and Group 6 by I.H. Moal, X. Li & P.A. Bates) are specifically trained for
binding/nonbinding classification by employing support vector machines (SVM) with
many knowledge-based and physical-based features. The third scoring function (Group 7
by M. Zacharias) is a coarse-grained force field with energy parameters optimized for
scoring near-native docking decoys [146]. Yet, these best scoring methods continue to
fail to adequately separate native from designed interfaces and to identify an
experimentally validated designed binder [145]. Thus, it is difficult to assess what really
worked for these best energy-scoring functions except that specific training is needed for
balancing the terms in the scoring functions.
34
Page 50
2.8 Current Challenges and Future Prospects
The above assessment of designed sequences highlights the importance of balancing
different types of interactions. Folded and functional proteins result from the interplay of
backbone and side chain interactions and delicate balance among van der Waals
interactions, electrostatic interactions, and solvation effects. Nature has mastered the art
of balance via trial and error over the course of billions of years. Furthermore, it employs
quantum effects to enhance its magic. Various knowledge-based, physical-based, and
empirical energy functions have been proposed over the years [85,86,103-108,147],
including a recent solvent-exposure dependent potential [148] and structure-derived
sequence profile and sequence complexity [97]. We believe that the next practical step
for significantly improving protein design is not to search for new terms but to select the
correct terms whose weights are optimized with appropriate objective functions. The
usefulness of rebalancing energy terms is suggested from the success of employing SVM-
trained scoring functions to separate binding from nonbinding designed interfaces [145]
and of balancing local and nonlocal interactions to achieve higher recovery of native
sequence, secondary structure, and solvent accessibility [97]. Balancing stability and
solubility [110,139,140] is another key aspect for producing functional and foldable
globular proteins.
Our optimism for individual energy terms is built on the discovery that in some cases
knowledge-based energy functions are directly comparable to quantum calculations.
Examples include the agreement between a statistical hydrogen-bonding potential and
quantum mechanical calculations [149] and the strong positive correlation between
35
Page 51
statistical descriptions of cation-π and amino-π interactions and quantum calculations at
the Hartree-Fock and the second-order Moller-Plesset perturbation theory levels [150]. In
addition, recently developed, orientation-dependent [151-154] and multibody [155]
energy functions have yet to be tested for protein design. For example, dipolar DFIRE
(Distance-scaled, Finite, Ideal-gas REference) energy function [151] based on a DFIRE
stat [156] accounts for the orientation dependence of the interactions not only between
hydrogen-bonded polar atoms but also between other polar atoms and between polar
atoms and nonpolar atoms. The last interaction is known to play important role in
secondary structure formation [157-159].
There is another balance that needs attention: the balance of speed and accuracy. Fixed
backbone structures were employed for all tests performed here in order to reduce
computing time. Fixing backbone structures may have made protein structures less
favorable to native sequences as a result of employing less accurate energy functions for
compensating the effects of rigid backbone and discretization of side chain conformations.
Allowing flexibility improved sequence identity between designed and wild-type
sequences [160] and in successful redesign of hydrophobic core [93]. Discretization of
side chain rotamers is another issue that may adversely affect the performance of an
energy function. Gainza et al. [161] employing continuous rotamers leads to an
impressive 10% improvement in sequence identity by redesigning 12–15 selected core
residues. That is, not all problems in protein design are caused by defects in energy
functions. Unfortunately, efficient sampling of the conformational space of flexible
proteins is still an unsolved problem, although progresses are made [162].
36
Page 52
The main obstacle to searching for the right balance of correct terms in energy functions
is the lack of a large number of negative experiments for understanding where designs
have failed and for training the delicate balance of various energetic terms. This lack is
caused by two factors. First, most publications reported only successfully designed
sequences. Second, few laboratories can afford a large number of experiments to measure
the success rate of protein design. The large number of designed proteins targeting
influenza hemagglutinin [87] is the first sizeable dataset of negative examples for protein-
protein interactions. Experiments such as this in de novo protein design are needed to
further understand deficiencies in existing energy-scoring functions and to achieve the
optimal balance between selected energetic terms. This balance will happen when
inexpensive high-throughput techniques for measuring the success rate of protein design
become available.
37
Page 53
Chapter 3 Assessment of Novel Energy Functions for Design
3.1 Introduction
De novo protein design aims to computationally design new protein molecules that have
desirable 3D structures and perform desired biological functions. It is a powerful tool to
explore protein structural and functional spaces in nature by creating novel proteins.
Nature has provided abundant structures and functions, and creates new topology and
function through evolution. Computational protein design speeds up this process in silico
and holds the promise to accelerate development of novel catalytic, pharmaceutical,
structural, and sensing proteins for diagnostic, therapeutic, and industrial purposes.
Impressive number of successful designs has been made during the last decade [13-
16,92,94,163]. In the meantime, many computational design methods have been
developed, including RosettaDesign [101], RosettaDesign-SR [41], Liang-Grishin [118],
Medusa [164], EGAD [27], ORBIT [32] and others. RosettaDesign energy function is
composed by different physical energy terms. In Chapter 2, we reviewed RosettaDesign,
RosettaDesign-SR, Liang-Grishin and EGAD by assessing their performances on the
sequence recovery rate, sizes of hydrophobic patches and total solvent-accessible surface
area, and the prediction of structural properties such as intrinsic disorder, secondary
structures, and three-dimensional structures. Among these methods, RosettaDesign has
updated their default energy function from score12 to Talaris2013 and has replaced the
Dunbrack's 2002 version of the backbone dependent rotamer library [165] by the 2010
version [17] . The Talaris2013 score function made several improvements to the previous
default score function, score12, including a sp2 hydrogen bond potential, a new explicit
electrostatics term with a distance dependent dielectric, rather than a pairwise knowledge-
38
Page 54
based electrostatic potential, an adjustment to the LK_DGFREE parameters for four
atom types, an expansion of hydroxyl sampling for serine and threonine, the use of
bicubic spline interpolation in RosettaDesign knowledge-based potentials instead of
bilinear interpolation, an improved disulfide potential, analytic evaluation of Lennard-
Jones and EEF1 potentials and a new set of reference-state energies consistent with the
above modifications. The new version of the RosettaDesign program also changed the
atomic coordinates to 05.2009 ideal coordinates. This new version achieved 39.4%
sequence recovery rate on Jane Richardson's HiQ54 benchmark dataset which contains
55 high quality monomeric PDB structures with pre-relaxation. We labelled this energy
function as RosettaTalaris in order to distinguish from its older version RosettaDesign2.3.
Meanwhile, Shide Liang and Yaoqi Zhou developed a new protein design method
labelled as OSCAR-design. The energy function is similar to the orientation-dependent
optimized side-chain atomic energy OSCAR-o [166]. The distance-dependent and side-
chain dihedral-angle components of the design energy function were represented as
power and Fourier series, respectively. OSCAR-o was developed by maximizing the
energy gap between the native conformation and other rotamer types. In OSCAR-design,
all the parameters were re-optimized to maximize the recovery rate of native residue type
of a single residue while fixing all other residues. In this chapter, we examined these two
new methods using the same assessment criteria discussed in Chapter 2. Same dataset of
112 stably folded monomeric proteins used in ref [167] were employed to assess the new
design program OSCAR-design and RosettaTalaris. The test dataset was obtained by
searching the Protein Data Bank with the following criteria: (a) X-ray-determined
structures without DNA, RNA, hybrid, or other ligands; (b) proteins having only one
39
Page 55
chain (both biological assembly and asymmetric unit); (c) high resolution (≤3.0Å), with
the number of residues ≥70 and ≤ 400; and (d) proteins with no missing residues (except
terminal regions) or abnormal amino acid types. A total of 616 proteins were obtained
after removing redundant chains at 30% sequence identity. Afterwards, these proteins
were clustered by the fraction of surface residues (>20% solvent-accessible area exposed).
3.2 Results
As shown in Figure 3.1, we compared five design energy functions including two newly
updated versions from Liang and RosettaDesign in sequence identity, the accuracy of
predicted secondary structure, the fraction of disordered residues, the area of hydrophobic
patches, the correlation coefficient between predicted accessible surface area (ASA) and
actual ASA, the ratio of total ASA over maximum total ASA and the RMSD between
predicted 3D structure for a designed sequence and that for the wild-type sequence.
Figure 3.1 Computational assessment of designed sequences according to several
criteria.
40
Page 56
3.2.1 Sequence Assessment: Native Sequence Recovery
Sequence identity to wild-type sequence is a common computational assessment for
protein design. The sequence identities range from 30% to 37% for previously published
methods. The RosettaTalaris achieved 39.4% after pre-relaxing the structure on Jane
Richardson's HiQ54 benchmark dataset according to RosettaDesign documentation
(unpublished). Figure 3.2 compares the average sequence identity of designed sequences
to their corresponding wild-type sequences at different fractions of surface residues
without fixing any residue types. RosettaDesign-SR gives the highest sequence identities,
in average 39.8%, which are 0.7% better than the next best OSCAR-design and 3.7%
better than RosettaTalaris. OSCAR-design performs about 7-10% better than Liang-
Grishin in all the bins while RosettaTalaris also improves the performance in sequence
identity to wild-type sequence over its previous version. As shown in Table 3.1,
OSCAR-design improves about 6.5% in average sequence identity for the whole dataset
comparing to Liang-Grishin. RosettaTalaris also improves about 2.9% in average
sequence identity compared to RosettaDesign2.3. OSCAR-design is about 2.7% higher
than RosettaTalaris. This result confirmed the improvement of new energy functions over
previous energy functions for protein design.
41
Page 57
Figure 3.2 The average sequence identity to wild-type sequences of sequences
designed by RosettaDesign-SR, RosettaDesign2.3, RosettaTalaris, Liang-Grishin
and OSCAR-design as a function of the fraction of surface residues
42
Page 58
Table 3.1 Average sequence identity to wild-type sequences by RosettaDesign-SR,
RosettaDesign2.3, RosettaTalaris, Liang-Grishin and OSCAR-design.
Method Sequence Identity%
Wild-type 100
RosettaDesign-SR 39.8
OSCAR-design 39.1
RosettaTalaris 36.1
Rosetta2.3 33.2
Liang_ Grishin 32.3
43
Page 59
3.2.2 Local Assessment: Secondary Structure Recovery
Figure 3.3 The average accuracy of predicted secondary structures from the
designed sequences by five computational methods is compared to the results from
wild-type sequences. SPINE-X was employed for sequence-based secondary
structure prediction
Comparing the accuracy of predicted secondary structures for designed sequences or the
ability of recovering native secondary structures is another way to assess whether a
design method can capture the local coupling between sequence and backbone structure.
SPINE-X was employed for secondary structure prediction, which achieves 81–82%
accuracy in large benchmark tests. Figure 3.3 shows that the average accuracy of
44
Page 60
predicted secondary structures for sequences designed by five different methods and
wild-type sequences. RosettaDesign-SR shows consistently higher accuracy of structures
predicted from other design methods and even higher than that from wild-type sequences.
This reflects the usefulness of utilizing the local-structure-derived sequence profile in
RosettaDesign-SR. The sequences designed by the RosettaTalaris yielded more accurate
secondary structures than its corresponding previous method RosettaDesign2.3. OSCAR-
design performs as the 2nd best methods especially in the bins with large fraction of
surface residues. Apparently, improvement in hydrogen bonding in the RosettaTalaris
energy function is successful whereas OSCAR-design takes into account orientation
dependence by Fourier expansion.
3.2.3 Local Assessment: Predicted Intrinsic Disorder and Low Complexity
Residues
We further examined possible unstable structural regions inherent in designed sequences
by predicting intrinsically disordered residues. SPINE-D [130], one of the top disorder
predictors in CASP 9 was employed to predict intrinsically disordered residues. Figure
3.4 compares average fractions of disordered residues given by wild-type sequences with
those from designed sequences at different fractions of surface residues. The fractions of
disordered residues in wild-type sequences are lower than those in designed sequences,
except for bin 0.725 where a few wild-type sequences have regions with predicted
disorder probabilities at about 0.5. Liang-Grishin and RosettaDesign2.3 programs yielded
sequences with higher fractions of predicted disordered residues than wild-type
sequences did, whereas the sequences generated from RosettaDesignSR, RosettaTalaris
45
Page 61
and RosettaDesign2.3 programs and wild-type sequences have a similar amount of
disorder in most bins. However, OSCAR-design produces higher number of disordered
residues than wild type sequences for non-globular proteins with high fractions of surface
residues. RosettaTalaris performs slightly worse than RosettaDesign2.3 in term of
structural disorder.
46
Page 62
Figure 3.4 The average fraction of predicted disordered residues as a function of
fraction of surface residues SPINE-D was employed for predicting intrinsic
disorder for designed and wild-type sequences.
3.2.4 Surface Assessment: Solvent Accessibility Recovery
Solvent-accessible surface area (ASA) is an important physical property in protein design.
It also contributes to protein solvation energies [168]. Therefore another way to examine
47
Page 63
designed sequences is to test the conservation of ASA in designed sequences relative to
that of native structures of wild-type sequences. Real-SPINE 3 [169] was employed to
predict solvent accessibility from designed and wild-type sequences. We calculated the
correlation coefficient between predicted ASA and actual ASA values based on the
corresponding wild-type sequence on the target structure. Figure 3.5 shows that OSCAR-
design has the highest correlation coefficient except bin 0.675. At this bin, the correlation
coefficient of OSCAR-design is slightly lower than that of wild-type but higher (0.05-0.2)
than those of other design methods. The difference between different methods increases
as the fraction of surface residues increases. Sequences designed by RosettaDesignSR
and Liang-Grishin programs produced ASA closer to that of wild-type sequences than
RosettaDesign2.3. Sequences designed by OSCAR-design significantly improved the
ASA correlation over the sequences designed by the previous methods.
48
Page 64
Figure 3.5 The average correlation coefficients between predicted and actual
solvent-accessible surface areas (ASA) from the target structure by several design
methods as labeled are compared in bins of proteins in different fraction of surface
residues.
49
Page 65
3.2.5 Surface Assessment: Hydrophobic Patch
A prevalent problem in designed proteins is protein aggregation [170]. Protein
aggregation is associated with large exposed hydrophobic surface areas [133,171]. The
hydrophobic surface patch area of a designed or wild-type structure was calculated by the
program QUILT [172]. Figure 3.6 compares the average of the largest hydrophobic patch
area of proteins in different bins by five design methods. It is clear that designed proteins
by RosettaDesign have larger hydrophobic patch areas than wild-type proteins do.
RosettaTalaris significantly improves over RosettaDesign 2.3 although it still yields a
slightly larger hydrophobic patch area than wild type sequences. The sequences designed
by OSCAR-design have very similar patch areas to wild-type sequences. By comparison,
the Liang-Grishin method yields hydrophobic patch areas smaller than wild-type
sequences.
50
Page 66
Figure 3.6 The average largest hydrophobic patch area given by RosettaDesign-SR,
RosettaDesign2.3, RosettaTalaris Liang-Grishin, OSCAR-design and wild-type
proteins.
3.2.6 Packing Assessment: Total Accessible Surface Area
Packing interaction plays important role in stabilizing specific protein tertiary structures
[173,174]. The total solvent accessible surface areas (ASA) of all residues of a protein
51
Page 67
were calculated on the target structure with designed sequence by STRIDE [175] and
then normalized by their maximum total (reference) solvent-accessible area by Equation
3.1:
𝑃𝑃𝑃𝑃𝑃𝑃𝑃𝑃𝑖𝑖𝑃𝑃𝑃𝑃 𝑅𝑅𝑃𝑃𝑅𝑅𝑖𝑖𝑅𝑅 = ∑ 𝐴𝐴𝑇𝑇𝐴𝐴(𝑖𝑖)𝑂𝑂𝑖𝑖
∑ max (𝐴𝐴𝑇𝑇𝐴𝐴(𝑖𝑖))𝑂𝑂𝑖𝑖
�
(3.1)
Where 𝑖𝑖 is the residue position and L is the protein length. ASA(𝑖𝑖) is the ASA value of a
certain amino acid of residue position 𝑖𝑖. max(ASA(𝑖𝑖)) is the reference ASA of a given
residue type at residue position 𝑖𝑖.
As shown in Figure 3.7, sequences designed by RosettaDesign 2.3 have higher ratio (total
ASA / maximum total ASA) while sequences designed by Liang’s methods have lower
ratio than wild-type sequences. This indicates that proteins designed by
RosettaDesign2.3 and RosettaTalaris do not pack as tightly as those designed by the
Liang-Grishin and OSCAR-design methods and wild-type proteins. RosettaTalaris
slightly improves over Rosetta2.3 while OSCAR-design’s result moves closer to wild
type’s comparing to the Liang-Grishin method.
52
Page 68
Figure 3.7 The total solvent-accessible surface area (SASA) for all residues in a
protein normalized by their maximum possible total solvent-accessible surface
areagiven for wild type sequences and designed sequences.
53
Page 69
3.2.7 Global Structure Assessment
In order to examine whether the designed sequence can fold into the target structure, we
can also assess the designed sequence by structure prediction. Here we utilized
SPARKS-X, a template-based structure prediction tool, to predict the 3D structure of
designed sequences. Figure 3.8 shows two examples of predicted 3D structures of
designed sequences by both OSCAR-design and RosettaTalaris aligned to corresponding
wild-type structure. Figure 3.8a shows the superposition of the target structure (PDB ID
3PTE) and the best predicted 3D structure from designed sequence by OSCAR-design.
The RMSD between predicted structure is 0.12 Å with 50.7% overall sequence identity.
Figure 3.8b shows that the structure alignment between 3PTE and the best predicted 3D
structure for the sequence designed by RosettaTalaris with an overall sequence identity of
45% and RMSD as 0.57 Å. Figure 3.8c and d show that the structure comparison between
1B1U and the best predicted 3D structure of designed sequences. Both designed
sequences of 1B1U have sequence identity to wild-type sequence lower than 30% but
both predicted 3D structures are very similar to wild-type structure. Figure 3.8 indicates
that SPARKS-X can predict reasonable structure similar to target structure even though
designed protein sequences have low sequence identity to wild-type sequences.
54
Page 70
Figure 3.8 Superposition of the target structures (PDB ID 3PTE and 1B1U, cyan)
and the best 3D structure predicted from designed sequence by SPARKS-X. (a).
The wild-type structure of 3PTE and best 3D structure predicted by SPARKS-X
from the sequence designed by OSCAR-design (green). The RMSD between two
structures is 0.12 Å while sequence identity is 50.7%. (b). Superposition of 3PTE
and the best 3D structure predicted by SPARKS-X from the sequence designed by
RosettaTalaris (magentas). The RMSD between the predicted structure and the
target structure is 0.57 Å with overall sequence identity of 45%. (c). Superposition
of 1B1U (cyan) and the best predicted 3D structure of designed sequence by
OSCAR-design (green). The RMSD is 0.39 Å with sequence identity of 28.2%. (d).
55
Page 71
Superposition of 1B1U (cyan) and the best predicted 3D structure of designed
sequence by RosettaTalaris (magentas). The RMSD is 0.84 Å with sequence
identity of 23.9%. The circles indicate where not in perfect alignment.
The Figure 3.9 shows the average RMSD between target structures and structure
predicted by SPARKS-X for designed sequences by five design methods and wild-type
sequences. The wild-type sequences yield the smallest RMSD but not equal to 0 since
SPARKS-X re-built the final structure by MODELLER [176]. As expected, the RMSD
increases as the fraction of surface residues increases for all design techniques. OSCAR-
design has the smallest RMSD to the target structure and RosettaTalaris is the 2nd best
method according to RMSD. The average RMSDs between predicted structures and
target structures of both methods are lower than 2Å. Both OSCAR-design and
RosettaTalaris improve the performance over previously developed techniques in nearly
all the bins, especially in the bins with higher fraction of surface residues.
56
Page 72
Figure 3.9 The average RMSD between the target structures and the structures
predicted by SPARKS-X from the designed sequences and wild-type sequences as
a function of the fraction of surface residues.
3.3 Conclusion
In this chapter, we employed different criteria to assess two novel design methods by
employing the benchmark of 112 monomers. These methods were assessed by sequence
identity to wild-type sequence, the accuracy of predicted secondary structure, fraction of
57
Page 73
predicted disordered residues, the correlation between predicted and actual ASA, the
areas of hydrophobic patches, the relative total ASA and the RMSD between predicted
and the target structures. OSCAR-design performs the best in surface, packing and global
structure assessment while RosettaDesign-SR performs the best in sequence and local
assessment. All assessments indicate that both OSCAR-design and RosettaTalaris made
significant improvement over previously developed methods. They have higher sequence
recovery rate, better packing and less disordered residues, and hydrophobic patches
closer to wild-type structures and better in target structure recovery. Thus,
RosettaTalaris is the best RosettaDesign program. OSCAR-design, whose energy
function is purely mathematical and optimized for native residue type, performs better
than RosettaTalaris in most assessments. The computational assessments from multiple
angles provide a reliable initial examination of design programs. To confirm
computational assessment, large-scale experimental measurement of success rate for
protein design is required.
58
Page 74
Chapter 4 Direct Prediction of the Profile of Sequences Compatible to a Protein
Structure by Neural Networks with Fragment-Based Local and
Energy-Based Nonlocal Profiles
4.1 Abstract
Locating sequences compatible with a protein structural fold is the well-known inverse
protein-folding problem. While significant progress has been made, the success rate of
protein design remains low. As a result, a library of designed sequences or profile of
sequences is currently employed for guiding experimental screening or directed evolution.
Sequence profiles can be computationally predicted by iterative mutations of a random
sequence to produce energy-optimized sequences, or by combining sequences of
structurally similar fragments in a template library. The latter approach is
computationally more efficient but yields less accurate profiles than the former because
of lacking tertiary structural information. Here we present a method called SPIN that
predicts Sequence Profiles by Integrated Neural network based on fragment-derived
sequence profiles and structure-derived energy profiles. SPIN improves over the
fragment-derived profile by 6.7% (from 23.6 to 30.3%) in sequence identity between
predicted and wild-type sequences. The method also reduces the number of residues in
low complex regions by 15.7% and has a significantly better balance of hydrophilic and
hydrophobic residues at protein surface. The accuracy of sequence profiles obtained is
comparable to those generated from the protein design program RosettaDesign 3.5. This
highly efficient method for predicting sequence profiles from structures will be useful as
a single-body scoring term for improving scoring functions used in protein design and
fold recognition. It also complements protein design programs in guiding experimental
59
Page 75
design of the sequence library for screening and directed evolution of designed sequences.
The SPIN server is available at http://sparks-lab.org.
4.2 Introduction
Designing a protein sequence that would fold into a given structure is the well-known
inverse-protein folding problem. Solving this problem will not only improve our
fundamental understanding of the interactions responsible for protein folding and
structure prediction but also advance our capability of designing novel proteins with
existing function improved or with completely new functionality.
Significant progress in protein design has been made in recent years with a number of
designed sequences successfully validated experimentally in terms of their structures and
their functions [32,59-68]. These designs typically start from random protein sequences
and iteratively optimize an energy score via mutations until the scoring function reaches a
minimum. However, existing scoring functions for protein design are not yet accurate
enough to produce high success rates [85-89]. In fact, designed sequences usually do not
contain wild-type sequences as a part of the solution [97,177]. Low success rate of single
sequence design has led to current effort in employing multiple computationally
predicted sequences (or sequence profiles) to build a sequence library for large-scale
experimental screening of desirable properties [178-182] or for directed evolution
[87,183]. Sequence or sequence profiles obtained from protein design programs require
solving a NP-hard combinatorial optimization problem[184]. Thus, it is time consuming
to produce sequence profiles based on multiple runs.
60
Page 76
In addition to above energy-based methods, sequence profiles can also be predicted by
employing local fragment structures [185]. In this approach, fragment structures from a
target structure are compared to the fragment structures from a template library of known
protein structures. Sequences of those template fragment structures with high structural
similarity to target fragments are obtained to produce the sequence profile for the entire
target structure by a sliding-widow approach. Sequence profiles generated from fragment
structures and/or from protein design programs have been found useful for enhancing the
ability of recognizing structural similarity in the absence of sequence similarity (fold
recognition) by matching a sequence profile of a query not only with the sequence profile
of a template sequence but also the sequence profile predicted from a template structure
[185-187]. More recently, sequence profiles derived from fragment structures were
employed as a single-body energy term for improving the energy function of protein
design [97]. Predicting sequence profiles by fragments only needs to perform pairwise
structural alignment between short fragments and, thus, is computationally much more
efficient than solving the combinatorial optimization problem required by an energy-
based design. However, sequence profiles derived from short fragments are dominated by
local structural information. That is, they are only useful for capturing the interactions
responsible for local structure formation, but do not account for non-local interactions
(interactions between structural but not sequence neighbours) that are responsible for the
stability of tertiary structure. As a result, fragment-derived profiles are not as useful as
the profiles derived from energy optimization for using in experimental screening or
directed evolution.
61
Page 77
In this paper, we test the idea of using neural network (NN) to improve fragment-derived
sequence profiles by incorporating a mean-field like non-local interaction. We found that
an energy-based nonlocal feature makes a significant improvement in the quality of
sequence profiles over that from fragment structural alignment in terms of sequence
identity to wild-type sequences, fraction of hydrophilic residues, recovery rate of wild-
type residue types, precision of predicted amino-acid residue types, distribution of amino-
acid residue types, and fraction of low complexity regions. The quality of predicted
sequence profiles is comparable to the profiles generated from the protein design program
RosettaDesign 3.5 [101] based on several measures. This NN-derived profile is
complementary to existing energy-based techniques for identifying sequences that are
compatible with a desired structural fold. It should be also useful as a single-body term
for improving the fold-recognition scoring function or protein-design energy function as
fragment-based profiles did [97,185-187].
4.3 Methods
4.3.1 Datasets
To perform training and test and avoid over-training, we need three datasets: structural
templates, a dataset for training the neural network, and a dataset for independent test.
For the template library, we started from a non-redundant protein set with resolution
better than 2.0 Å, pair-wise sequence identity of less than 30% from the PISCES server
[188] downloaded on October 17, 2008. This set contains 4803 protein chains that were
further reduced to 2528 chains after removing chains with missing residues or backbone
atoms. We further cleaned the dataset by removing proteins (1) complexed with DNA or
62
Page 78
RNA, (2) whose sequence contain un-recognized residue types; and (3) whose secondary
structures were not defined by DSSP [189]. This leads to a total of 2282 protein chains
that are employed as our templates for fragment structures (TL2282).
For training and test sets, we started from the new non-redundant protein set with
resolution better than 3.0 Å, pair-wise sequence identity of less than 30% from the
PISCES server [188] on April 28, 2013. This set contains 10460 protein chains. We
cleaned the dataset using the same criteria above and removed all chains with >30%
sequence identity to the proteins in the template library (TL2282). This leads to a dataset
of 2032 proteins. We randomly selected 500 proteins for independent test (TS500) and
utilized the remaining proteins for training and ten-fold cross validation (TR1532).
From TS500, we randomly selected 50 small proteins with sequence length between 60-
200 and fraction of surface residue between 0.5-0.8 (TS50). This small dataset is used to
compare the sequence profiles generated from our neural-network approach with those
generated from RosettaDesign, one of the most widely used programs for protein
design(Kuhlman and Baker, 2000). A small dataset is used because it is computationally
intensive to produce sequence profiles by designing 1000 sequences utilizing
RosettaDesign. These 50 proteins (PDB ID plus chain ID) are 1eteA, 1v7mV, 1y1lA,
3pivA, 1or4A, 2i39A, 4gcnA, 1bvyF, 3on9A, 3vjzA, 3nbkA, 3l4rA, 3gwiA, 4dkcA,
3so6A, 3lqcA, 3gknA, 3nngA, 2j49A, 3fhkA, 2va0A, 3hklA, 2xr6A, 3ii2A, 2cayA,
3t5gB, 3ieyB, 3aqgA, 3q4oA, 2qdlA, 3ejfA, 3gfsA, 1ahsA, 2fvvA, 2a2lA, 3nzmA,
63
Page 79
3e8mA, 3k7pA, 3ny7A, 2gu3A, 1pdoA, 1h4aX, 1dx5I, 1i8nA, 2cviA, 3a4rA, 1lpbA,
1mr1C, 2xcjA, and 2xdgA.
To remove all information from wild-type sequences in their structures, amino-acid
residue types in the PDB structural files of all datasets were labelled as ALA (alanine).
All native positions of Cβ atoms were removed and replaced by the positions of
pseudo Cβ atoms based on standard 1.54 Å for the Cα − Cβ bond length, 109.538° for the
N − Cα − Cβ bond angle and 109.468° for the C − N − Cα − Cβ dihedral angle. All
protein structures are not energy minimized prior to removal of original side chains to
avoid possible “memory” of side chains by the energy function used in minimization. The
latter could lead to artificially high sequence identity to wild type sequences.
4.3.2 Neural Network
We employed the same neural-network method developed for sequence-based
continuous-value prediction of backbone torsion angles and residue solvent accessibility
[122,169,190]. It contains a two-hidden-layer neural network. Each of the two hidden
layers contains 51 hidden neurons and one bias. We employed a bipolar activation
function given by f (x) = tanh(αx), with α = 0.2. Back propagation with momentum was
applied to optimize the weights. The learning rate and momentum were set to 0.001 and
0.4, respectively.
64
Page 80
4.3.3 Input Features
4.3.3.1 Local Features
There are two types of local features. The first one is backbone torsion angles (ϕ and ψ)
at a given sequence position. The second one is the fragment-derived sequence profile.
The method for obtaining the fragment-derived sequence profile was described in [97].
Briefly, 5-residue fragments (from i to i+4; i=1, 2, …, L-4) in a target structure of
sequence length L are structurally compared to all fragments in the same length located in
the structural template library (TL2282). The sequences of most structurally similar
fragments (in RMSD) are utilized to calculate probability of a residue type at each
sequence position (sequence profile). For each sequence position, this profile has a
dimension of twenty for 20 residue types.
4.3.3.2 Energy-based Non-local Features
We introduced an energy-based non-local feature as follows. For a given sequence
position, we built the full side-chain based on the rotamers of each amino-acid residue
type, one rotamer at a time while assuming that the residue type at all other positions is
alanine. The total interaction energies of the residue of 20 residue types in all rotameric
states with all other alanine residues are calculated separately. We record only the lowest
total energy in all rotameric states of each residue type at a given sequence position plus
the energies of six most frequent rotamers (or less if a residue type has less than six
rotamers). The total number of features is 114 (=7×13+4×4+3×1+2×2) because four
residue types have only three rotamers, Proline has two, and Glycine and Alanine have
one conformation]. Here, the bbdep02 rotamer library [165] and a knowledge-based
65
Page 81
energy function based on the distance-scaled finite-ideal gas reference state (DFIRE)
[156,191] were employed.
4.3.3.3 Sliding Window and Normalization of Input Values
In addition to the features from the current position (i), we also include the features from
two sequence neighbors (i-1 and i+1). That is, a window size of 3 is employed. We
utilized this window size because a larger window size did not improve our prediction.
The values of all input features were linearly transformed to [-1, 1]. The total number of
input features is 136×3 (136=2+20+114).
4.3.4 Output Layer
The output layer contains 20 nodes with each node representing one amino-acid residue
type. We trained the neural network to make two types of predictions. The first one is to
predict wild-type sequences where each sequence is represented by a 20×L matrix. That
is, each sequence position has a 20-dimension vector for 20 amino-acid residue types.
The value is 1 if a particular residue type is located at the sequence position and -1 for all
other dimensions. The second one is to predict position-specific substitution matrix
(PSSM) generated by PSI-BLAST [192]. This prediction takes into account the fact that
more than one sequence can have the same structure. In this case, a 20×L matrix
generated from PSI-BLAST [192] is used as the target for training and prediction.
66
Page 82
4.3.5 Ten-fold Cross Validation and Independent Test
To examine the accuracy of prediction, we performed 10-fold cross validation on
TR1532. The dataset is randomly divided into 10 equal parts. Nine were used for training
and the remaining was for testing. This process was repeated 10 times, once for each of
the 10 parts. To prevent over-training, a random over-fit protection set with 5% of the
training set is excluded from training and is used as a small test set for determining the
stop criterion for neural-network weight optimization. We did 10 fold cross-validations
for five times with different random seeds. The consensus of predicted amino-acid types
of 5 independent runs is employed to calculate the sequence identity to wild-type
sequences. For independent test, TR1532 was employed for training and TS500 was for
test only.
4.3.6 Performance Evaluation
The objective function in the neural network is to minimize the difference between
predicted and actual values (20-dimension 1 and -1 vector or PSSM). The performance,
on the other hand, is assessed by several different measures. One is the sequence identity
between predicted sequence and the wild-type sequence, which is equal to the number of
correctly predicted residue types divided by the total number of residues. We also
calculated precision and recovery rate of each residue type where precision is the fraction
of correctly predicted residues for a given residue type in the number of predicted
residues of that type. Recovery rate is the fraction of correctly predicted residues of a
given residue type in the number of wild-type residues of that type.
67
Page 83
Another measure of performance is mean square error, In order to calculate the mean
square error between PSSM and a predicted profile, the predicted profile (fragment and
single-sequence NN-based approaches, or RosettaDesign) was transformed to a pseudo
PSSM by log�𝑃𝑃𝑖𝑖𝑖𝑖�, where 𝑃𝑃𝑖𝑖𝑖𝑖 Is the probability for given residue type i in position j. Both
pseudo PSSM and PSSM are normalized from 0 to 1. The mean square error is obtained
by calculating the difference between PSSM and the best linear fit of the pseudo PSSM to
the PSSM.
4.3.7 RosettaDesign
RosettaDesign 3.5 was downloaded from https://www.rosettacommons.org/software/.
Proteins are designed based on a fixed backbone structure with the command
“fixbb.linuxgccrelease -s example.pdb -resfile example.resfile -ex1 -ex2 -nstruct 100 -
database ROSETTA_DATABASE -linmem_ig 10 -extrachi_cutoff 0 -
ignore_unrecognized_res -no_opth false -skip_set_reasonable_fold_tree -
no_his_his_paire -score:weights score12prime.wts”. 1000 sequences were designed by
optimizing all residues simultaneously for each protein in order to obtain a sequence
profile. All positions are set as ALLAA in example.resfile. All structures are not
minimized prior to optimization for design.
4.4 Results
4.4.1 Sequence Prediction
One way to measure the accuracy of design is to estimate the sequence identity between
designed sequence and the original wild-type sequence. The fragment-based approach
68
Page 84
yields an average sequence identity of 23.6% for TR1532, which is consistent with 24%
obtained by using other databases [97]. For the neural-network (NN) based approach, we
can predict the “best” sequence based on the residue type that has the highest predicted
value at each sequence position. We found that neural-network based prediction made a
7.1% improvement from 23.6% to 30.7% over the fragment-based approach. We can also
evaluate the improvement based on top 2 predicted residue types. A correct prediction is
made if one of the top 2 predictions matches to the wild-type sequence. The improvement
is 8% from 36.3% by the fragment-based approach to 44.3% by the neural-network-based
approach. For the independent test (TS500), the improvement is essentially identical at
7.1% (23.6% to 30.7%) for top 1 and 7.7% (36.1% to 43.8%) for top 2 matching,
respectively.
To examine the relative importance of different features, we evaluated different
combinations of three features employed here. Because we would like to compare against
the fragment-based approach, we utilized the structure fragment profile as a base feature
and added torsion angles or the energy-based profile for comparison. We found that
adding the energy-based profile improves the sequence identity to wild-type sequences
by 6% while adding the dihedral angles adds 1.4% only. In addition, using the energy-
based profile alone can yield an average sequence identity of 26% to wild type sequences
which is 2% higher than the fragment-based profile. These results highlight the
importance of nonlocal interaction energy function in neural-network learning.
69
Page 85
Figure 4.1 Average sequence identity between predicted and wild-type sequences
as a function of protein length (ten-fold cross validation on TR1532, open symbols
and independent test on TS500, filled symbols) by the fragment-based (dashed
lines) and neural-network based approaches (solid lines).
Figure 4.1 compares average sequence identities as a function of protein lengths (number
of amino acid residues). The bins for protein lengths are [0-100), [100-200), and etc. The
last bin contains all proteins with greater than 700 amino acid residues for TR1532 and
greater than 600 residues for TS500. The figure reveals a consistent improvement of the
neural-network based prediction over the fragment-based prediction for different sizes of
proteins. Moreover, the result from the independent test is nearly indistinguishable from
ten-fold cross validation, highlighting the robustness of our training method.
70
Page 86
Figure 4.2 Average sequence identity between predicted and wild-type sequences
as a function of the fraction of surface residues (ten-fold cross validation on
TR1532, open symbols and independent test on TS500, filled symbols) by the
fragment-based (dashed lines) and the neural-network (NN) based approaches
(solid lines).
Because it is more difficult to design regions exposed to water, it is useful to examine
how sequence identity will change for proteins with different fractions of surface residues.
A residue is defined as on surface if its solvent accessible surface is greater than or equal
to 20% of its reference value. All proteins were divided into 12 bins according to
fractions of surface residues ([0.35-0.4), [0.4, 0.45), [0.45, 0.5), [0.5, 0.55), [0.55, 0.6),
[0.6, 0.65), [0.65, 0.7), [0.7, 0.75),[0.75-0.8), [0.8-0.85), [0.85-0.9) ,[0.9,1]). Because the
71
Page 87
dataset TS500 does not have enough data to form the bin [0.9,1], we combined those
proteins to the bin [0.85-0. 9). We started from a fraction of 0.35 because all proteins
contain at least 35% surface residues. Figure 4.2 displays the average sequence identity
as a function of the fraction of surface residues in a protein. Consistent with other
methods [97,177], sequence identities between predicted and actual sequences are lower
for proteins with higher fraction of surface residues. Again, there is a consistent
improvement of 2-10% by the neural-network-based method over the fragment-based
method regardless the value of the fraction of the surface residues. We further observed
the consistency between the ten-fold cross validation and the independent test.
72
Page 88
Figure 4.3 Recovery rate, precision and frequencies for each residue type. (A)
Recovery rate and precision for each amino acid type by fragment-based and
neural-network-based approaches as labeled. (B) Frequencies of 20 types of amino
acid by fragment-based and NN-based approaches are compared to those from
wild-type sequences as labeled.
We calculated the recovery rate and precision for each residue type. As shown in Figure
4.3Figure 4.3A, the NN-based approach improves over the fragment-based approach in
15 out of 20 residue types for both precision and recovery rate. We noted that glycine (G)
and proline (P) are the most accurately predicted residue types because of their unique
73
Page 89
backbone conformations. Recovery rates for R (Arg), H (His), Q (Glu), C (Cys), M (Met),
and W (Trp) for both approaches are very low. This behavior is likely due to low
occurrence of residue types such as W, M, C, and H in wild-type sequences. Figure 4.3B
compares the occurrence of 20 amino acid residue types in wild-type sequences with
those in predicted sequences. We calculated the Kullback–Leibler divergence of residue
distribution between NN approach and wild-type and that between fragment-based
approach and wild-type sequences. The former is 0.18 and the latter is 0.31. That is, the
NN approach yields a distribution much closer to that of wild-type sequences than the
fragment-based approach except for residue E (Glu) where the NN approach over-
predicts it. We found that the NN approach over-predicts E because it often mis-predicts
R and Q as E. 27.8% Q residues were predicted as E, 13.6% as K and 11% as L. 20.8%
of R residues were predicted as E, 15.3% as K and 12.2% as L. The confusion between R
and Q (both under-predict) with E and K (both over-predict) are likely due to the fact that
all of them are hydrophilic residues with relatively long side-chains.
Table 4.1 Sequence identities between predicted and wild-type sequences along
with the fraction of hydrophilic residues (the number in parentheses) in different
secondary structure surface (residues with 20% or more solvent accessible surface)
and core regions for the independent test set
% Ha
(fhb)
Sa
(fh)
Ca
(fh)
Surf
(fh)
Core
(fh) Lcc
Fragment-
Based 18.1 (24.9) 19.6 (16.8) 29.9 (37.4)
22.1
(33.5)
26.2
(17.8) 50.8
Neural
Network 26.1 (43.7) 24.5 (30.2) 35.0 (47.7)
26.2
(60.0)
36.7
(17.8) 34.5
74
Page 90
Wild-Type 100
(52.2)
100
(35.7)
100
(53.6)
100
(64.7)
100
(27.6) 3
a H, S, and C denote helix, sheet and coil, respectively.
b fh denotes fraction of hydrophilic residues (D, E, H, K, N, Q, R, S, T, and Y).
c fraction of residues in low complexity regions.
Table 4.1 further examines sequence identity in different secondary structure and in
surface regions (only independent test results shown as they are essentially same as ten-
fold cross validation). Interestingly, coil regions in protein backbones have the highest
identity (30% by fragment and 35% by neural network), compared to 26% in helical or
25% in sheet regions. This is largely because of high occurrence of Gly and Pro in coil
regions. These two residue types were most accurately predicted because of their unique
backbone conformations. The most significant improvement of the NN approach over the
fragment-based approach is in the core region (10.5% increasement in sequence identity).
Table 4.1 also shows the fraction of hydrophilic residues. It is clear that the NN approach
has a significantly better balance of hydrophilic-hydrophobic residues on the surface of
proteins in particular (34% by the fragment-based approach, 60% by the NN approach
and 65% in wild-type sequences). However, there is no improvement in the core of
proteins which have 10% less hydrophilic residues in predicted sequences than in wild-
type sequences. Here hydrophilic residues refer to D, E, H, K, N, Q, R, S, T, and Y. Low
complexity region (e.g. multiple repeats of same residue type such as VVV) is often
associated with intrinsically disordered regions of proteins. We have employed the
program SEG[126] to locate low complexity regions in predicted sequences. As Table 4.1
75
Page 91
shows, the fraction of residues in low complexity regions is as high as 50.8% per protein
by the fragment-based approach for the test set TS500. The NN approach cuts it to 34.5%,
although it is still significantly higher than 3% in wild-type sequences.
4.4.2 PSSM Prediction
So far, we have trained our NN to predict a single sequence despite the fact that there are
more than one sequence that could be fitted for a single structure. Thus, it is of interest to
know if training a NN to predict sequence profile directly, rather than a single sequence,
would lead to an improved result. To do this, we use the Position Specific Substitute
Matrix (PSSM) generated from PSI-BLAST [192] for training and testing the NN
approach. The PSSM is normalized to -1 to 1. We define a PSSM consensus sequence
based on the most frequent residue from PSSM at each sequence position.
Table 4.2 compares sequence identities between consensus sequences from PSSM and
predicted consensus sequences by the fragment-based approach, the NN trained by single
sequence and the NN trained by PSSM. Interestingly, the NN trained by PSSM is similar
to the NN trained by a single sequence when judged by the sequence identity to the
PSSM consensus sequence (26.6% versus 26.1% for TR1532 and 26.3% versus 26.7%
for TS500 for top 1). Improvement on the mean square error (MSE) is greater because the
NN trained by PSSM was directly optimized for MSE. The difference in conserved
regions between NN (single sequence) and NN (PSSM) is also small. For example, the
sequence identity to the consensus sequence in the conserved regions (PSSM≥7) is 31.8%
by single-sequence trained NN (single sequence) and 32.4% by PSSM-trained NN.
76
Page 92
Table 4.2 Performance of various methods measured according to sequence identity
to wild-type sequences, consensus sequences from PSSM (either top 1 match or
either of the top 2 match) and mean-square error (MSE) to PSSM on the dataset of
TR1532 or TS500 (the number in parentheses).
PSSM
Method Top 1%
TR1532 (TS500)
Top 2%
TR1532 (TS500)
MSE
TR1532 (TS500)
Fragment- Based
21.5 (21.5)
42.7 (41.8)
0.24 (0.24)
NN (Single)
26.6 (26.3)
51.7 (51.7)
0.21 (0.21)
NN (PSSM)
26.1 (26.7)
50.3 (50.7)
0.18 (0.18)
athe mean square error between predicted and actual PSSM.
bthe average sequence identity between predicted consensus sequence and wild-type
sequence for NN methods. The seqid for RosettaDesign is based on the average seqid of
1000 designed sequences. The numbers in parentheses are sequence identities for core
and surface regions of proteins, respectively.
cthe number of designed sequences that are homologous to a wild-type sequence based on
a PSI-BLAST search. The number in parentheses is the number of designed sequences
that can find the hits which are 100% sequence identity to wild-type sequences of target
structures according BLAST.
dthe average fraction of low complexity residues per protein. For RosettaDesign it is
based on consensus sequence of 1000 designed sequences.
ethe fraction of predicted hydrophilic residues in consensus sequences in core and
surface of proteins, respectively.
77
Page 93
fthe average sequence identity from 1000 designed sequences.
We compared the fractions of hydrophilic residues in PSSM consensus sequences and in
wild-type sequences and found that they are quite similar (28.4% in PSSM consensus
sequence versus 27.9% in wild-type sequence in protein core and 61.3% in PSSM
consensus sequence versus 64.3% in wild-type sequences in protein surface). However,
the PSSM trained NN predicts significantly more hydrophilic residues (5%) on protein
surface and 3% more in protein core than the single-sequence trained NN. It is unclear
why using PSSM for training neural networks would significantly increase the number of
hydrophilic residues on the surface of proteins.
4.4.3 Comparison to Profiles Generated by RosettaDesign
We compared to RosettaDesign [101] for 50 proteins due to costly computational
requirement by using RosettaDesign for producing sequence profiles. As shown in
, RosettaDesign deviates more from wild-type PSSM than NN-based approaches do. Its
sequence identity to wild-type sequence (based on the average sequence identity from
1000 designed sequences) is similar to the NN-based approach. Interestingly,
RosettaDesign employs significantly more hydrophilic residues in core than wild-type
sequences while fragment-based and NN-based approaches consistently under-predict
hydrophilic residues in the core. RosettaDesign, however, has similar number of residues
in low complexity regions as wild-type sequences, as it was optimized for.
78
Page 94
Table 4.3 Comparison of predicted sequence profiles with wild-type sequence or
profile for a dataset of randomly selected 50 small proteins with sequence length
between 60 and 200 and fraction of surface residue between 0.5 and 0.8.
MSEa SeqID(C,S)b %lcc Fh(C,S)d
Fragment-
Based 0.230
23.4
(24.0, 20.6) 50.4 15.8, 34.6
Rosetta
Design 0.223
30.0e
(45.2, 23.1) 7.1 33.7, 65.2
NN
(Single) 0.198
30.3
(37.6, 25.5) 28.5 18.7, 58.4
NN (PSSM) 0.177 27.3
(33.1 ,23.4) 36.1 16.9, 64.5
Wild-Type 0 100
(100, 100) 3.7 26.5, 66.2
aThe mean square error between predicted and actual PSSM.
bThe average sequence identity between predicted consensus sequence and wild-type
sequence for NN methods. The SeqID for RosettaDesign is based on the average SeqID
of 1000 designed sequences. The numbers in parentheses are sequence identities for core
and surface regions of proteins, respectively.
cThe average fraction of low complexity residues per protein. For RosettaDesign it is
based on consensus sequence of 1000 designed sequences.
dThe fraction of predicted hydrophilic residues in consensus sequences in core and
surface of proteins, respectively.
eThe average sequence identity from 1000 designed sequences.
79
Page 95
4.5 Discussion
In this paper, we employed neural networks for predicting sequences associated with a
given protein structure. We found that a local fragment-derived sequence profile can be
significantly improved by integrating with an energy-based nonlocal feature through
neural networks. Together with backbone torsion angles, the neural-network based
method SPIN makes 7% improvement over fragment-derived sequence profiles in
sequence identity to wild-type sequences. The accuracy of sequence profiles from SPIN
is comparable to RosettaDesign in term of sequence identity to wild-type sequences and
sequence variation. The MSE between predicted and actual PSSM given by single-
sequence trained SPIN is 0.198, compared to 0.223 by RosettaDesign for a dataset of 50
proteins. SPIN and RosettaDesign also yield similar sequence identities to wild-type
sequences (~30%).
The average 30% sequence identity for 50 proteins achieved by RosettaDesign is
significantly lower than 37.0% reported by Leaver-Fay et al. [193] despite the same
scoring function and procedures were employed. A close examination found that this
discrepancy is caused by structural relaxation prior to sequence design. Structural
relaxation of crystal structures by RosettaDesign prior to design inevitably introduces the
bias toward wild-type sequences and lead to a higher sequence identity. We found that
for the 50 proteins, relaxation prior to design yielded an average sequence identity of
35.6%. Here, we reported the results from RosettaDesign without pre-relaxation to be
consistent with the structures employed for SPIN.
80
Page 96
SPIN can be considered as a mean-field like approach. This is because nonlocal
interaction energy is calculated by assuming that all neighboring residues except the
residue of interest are alanine. We used alanine because it is the smallest amino acid
residue except glycine. Using a residue with a small side chain is necessary to avoid
steric clashes. We do not utilize glycine because lacking a side chain makes it different
from most residue types by allowing a much more flexible backbone conformation.
Moreover, alanine has only one conformation. Thus, there is no need for optimizing its
rotameric state. In addition, alanine is the second most widely employed amino acid
residues in proteins (8.1%, only 1% behind 9.5% for leucine). The abundance level in
protein structures is important for minimizing the error caused by approximating all other
positions as alanine. It should be mentioned that using alanine for the energy-based
nonlocal profile brings over-predicted alanine (19%) by fragment-based profile to a
population (7%) similar to the actual population (8%).
The comparable accuracy between SPIN and RosettaDesign suggests that there is room
for further improving an energy-based approach. In fact, thirty percent sequence identity
to wild-type sequence reached by this neural-network method and the difficulty to
improve much beyond 30% for protein design by energy optimization [97,177] suggests a
common bottleneck facing protein design. This 30% sequence identity is in a so-called
twilight zone [194] where two protein sequences may or may not have the same structure
[97]. That is, going beyond 30% is necessary to significantly improve the success rate of
protein design. Typical energy functions for protein design contain, at minimum, single-
body profiles and two-body pairwise interaction terms. In contrast, SPIN relied on single
81
Page 97
body energetic terms only. Thus, SPIN raises the bar for protein design programs that are
based on more sophisticated energetic terms. On the other hand, the results of SPIN can
be effectively employed as a single-body energy term to improve an energy function for
design. In our previous work, we found that incorporation of the fragment-derived profile
into the RosettaDesign energy function [90] can increase the sequence identity by 4-8%
[97]. Using this newly improved profile (7% higher sequence identity over the fragment-
based approach) as an energy term may further improve the ability of recovering wild-
type sequences.
Another potential application of this structure-derived profile is fold recognition. Several
studies have found that sequence profiles from protein design significantly improve the
ability of recognizing structural similarity in the absence of sequence similarity [185-187].
This is particularly important for recognizing new structure folds that do not have wild-
type sequence information but are generated from multiple loop permutations [48].
Application to fold recognition is feasible because SPIN is computationally efficient. It
takes only 343 processor seconds to predict one sequence profile from structures,
compared to 833×1000 processor seconds by RosettaDesign for predicting 1000
sequences by Intel(R) Xeon(R) CPU E5-2670 0 @ 2.60 GHz.
There is a recent trend to overcome low success rate of design by using a library of
protein sequences designed by a design program. The library is then utilized for large-
scale experimental screening of desirable properties [178-182] or for directed evolution
[87,183]. SPIN provides a complementary approach to protein design programs for
82
Page 98
building a library of sequences that are compatible to a given structure with similar
accuracy at a much lower computational cost.
One way to further improve SPIN is to improve its energy-based features. The nonlocal
energy profile was obtained by employing a DFIRE-based statistical energy function.
We employed this energy function because it has been found useful in protein structure
and binding prediction and other applications [147]. Other coarse-grained statistical
potentials (backbone only) [195] can also be employed here. Obviously, DFIRE or any
other statistical energy functions were not optimized for this purpose. One might expect
that our method can be further improved if a knowledge-based potential is optimized for
single-residue-type recovery when the rest proteins are approximated as occupied by
alanine residues.
One surprising finding is that using PSSM to train neural networks does not lead to any
visible improvement over the single-sequence based training. Essentially the same
sequence identity to PSSM consensus sequences is observed despite that the single-
sequence method was not trained for predicting PSSM at all. In fact, we found that the
top two amino acid residue types predicted by single-sequence-trained NN are essentially
the same as the top two amino acid residue types by the PSSM-trained NN (87.5% in
agreement). This suggests that a neural network is capable of capturing the profile
encoded in a given protein structure regardless if it was trained or not trained by a profile.
In other words, the structure of a protein has a dominated effect on the evolution of
sequences.
83
Page 99
Chapter 5 Self-inhibitory Peptides of Escherichia coli Methionine
Aminopeptidase
5.1 Introduction
The start codon in a messenger RNA always codes for methionine in eukaryotes (or
modified methionine in prokaryotes). The resulting N-terminal methionine from nascent
proteins during protein synthesis is removed in all organisms by a protein called
methionine aminopeptidase (MetAP) [196], particularly when it is connected to a smaller
and uncharged residue such as Ala, Cys, Gly, Pro, Ser, Thr, or Val [197,198]. The
removal of methionine, known as the N-terminal methionine excision (NME), is a major
proteolytic process responsible for the diversity of amino-termini of proteins in both
prokaryotes and eukaryotes [199]. MetAP is an essential gene in the bacterium; its
knockout in Escherichia coli and other bacteria leads to cell inviability [200,201]. As a
result, MetAP is a drug target for anti-bacteria agents [202-204]. In human, MetAP is
found important in facilitating intracellular translocation of newly synthesized proteins
from the ribosome [205] and in tumor progression of various cancers [206] and has been
employed as potential targets for treatment of gastrointestinal cancers and other tumours
[207]. Inhibition of the methionine aminopeptidase 2 enzyme, targeted by angiogenesis
inhibitors AGM-1470 and ovalicin [208], is a potential treatment for obesity [209]. Thus,
developing inhibitors of MetAP and understanding of their molecular mechanisms is an
important area of research that has implications in many human diseases.
In this chapter, we will focus on inhibition of the E. coli methionine aminopeptidase
(EcMetAP) by self-inhibitory peptides. Peptide is an important class of therapeutics in
84
Page 100
addition to small molecular and protein drugs in pharmaceutical industry. Peptide drugs
such as Goserelin and Copaxone have been successfully applied to treat human disease
including breast cancer and prostate cancer, type 2 diabetes, neuroendocrine tumors and
HIV [210-220]. Although not yet received FDA approval [221], many antimicrobial
peptides in clinical trials were published and under clinical trials [222,223].
Self-inhibitory peptide is a peptide derived from a segment of a protein that inhibits the
protein itself. In the past decades, many self-inhibitory peptides were developed to inhibit
a disease-related protein [224-229]. Some of these peptides were found useful as an
antiviral agent in fighting against viruses such as HIV, Dengue virus, and West Nile virus.
Their mechanisms, however, remain poorly understood. As result, locating self-inhibitory
peptides is more an art than a science.
Here, we hypothesize that self-inhibitory peptides disrupt the folded structure of its target
protein through direct competition with the same peptide segment in the target protein for
interaction with the rest of the protein. We tested this assumption by experimentally
validating several selected peptides (Chapter 5.2) and by designing new peptide inhibitors
of EcMetAP (Chapter 5.3).
85
Page 101
Figure 5.1 The X-ray structure of EcMetAP. It contains four helices and 16 beta sheets.
5.2 Selection and Validation of Self-inhibitory Peptides of EcMetAP
EcMetAP is a monomer contains 264 amino acids with a molecular weight of 29,333 Da
[230]. The 3D-structure of EcMetAP with substrate and iron has been solved [231-233].
Figure 5.1 shows the X-ray structure (PDB ID 1XNZ) rendered by Pymol [234]. It
contains 4 helixes and 16 beta sheets.
We assume that a self-inhibitory peptide of EcMetAP disrupts the folded structure by
competing directly with the segment of the same sequence to bind with the rest of protein.
In other words, most stable structured regions should be most self-inhibitory. To validate
this assumption, we employed a method called SPINE-D that predicts intrinsically
disordered and structured regions of a protein [235]. This method was one of the top
86
Page 102
intrinsic disorder predictors according to critical assessments of structure prediction
techniques in 2010 (CASP 9) [131]. It takes a protein sequence and predicts the disorder
probability of each amino acid along the protein sequence.
Figure 5.2 shows the predicted disordered probability as a function of the residue index in
EcMetAP. We found that four helical regions and two beta sheets are located at the most
stable structural region with predicted disordered probability around 0.1. We only choose
four helical regions (P1, P2, P3, and P4) as candidate self-inhibitory peptides because
they are more likely to have residual structures than beta sheet regions when isolated.
Figure 5.2 listed the details information of these four selected peptides. The peptide
length for P2, P3, and P4 is 20 amino acids. P1 has 24 residues because the entire helical
region is 24 amino-acids long. P2, P3 and P4 have similar average disorder probability.
The slightly higher disorder probability in P1 is likely due to over prediction of disorder
near the terminal region by SPINE-D [235]. A control peptide from β sheet region with
index from 244-263 is labelled as P5.
87
Page 103
Figure 5.2 Predicted disorder probability of EcMetAP. The bar represents the location of
each peptide.
Table 5.1 Properties of four selected and one control peptides.
P1 P2 P3 P4 P5
Sequence
PEDIEKMRVAG
RLAAEVLEMIE
PY
VSTGELDRICN
DYIVNEQHA
IMGERLCRITQ
ESLYLALRM
GINLREIGAAI
QKFVEAEGF
GCEILTLRKDD
TIPAIISHD
Length 24 AA 20 AA 20 AA 20 AA 20AA
Position
(PDB index) 8-31 36-55 120-139 143-162 244-263
88
Page 104
Ave. Disorder
Probability 0.137 0.095 0.096 0.098 0.537
These four peptides at 98% purity were synthesized by the commercial company
Genscript. We obtained active, wild type EcMetAP by expression and purification from
BL21(DE3). Then, 4uM EcMetAP was incubated with each peptide at a concentration of
20uM in a 50mM MOPS (3-(N-morpholino)propanesulfonic acid) buffer under 4°C
overnight. Afterwards, they were diluted by 2X reaction master mix containing
fluorogenic substrate L-Methionine-7-amido-4-methylcoumarin (Met-AMC). The
inhibitory effects of four peptides on EcMetAP are measured according to the relative
enzyme activity with 10uM synthesized peptides compared with the enzyme activity
without peptides. Results of enzymatic activity assays in the presence and absence of
peptides are shown in Figure 5.3 along with a self-derived peptide P5 from EcMetAP β
sheet area and a 20-aa peptide GFP11 derived from the green fluoresce protein as
negative controls. Figure 5.3 shows that P2 and P4 have weak inhibition to EcMetAP
while P1 and P3 significantly reduced the enzymatic activity. P3 has the strongest
inhibition with the lowest enzyme activity. P5 and GFP11 do not affect the enzymatic
activity of MetAP as expected. These results confirm that most self-derived peptides
from stable, structured helical regions (3 out of 4) can indeed inhibit the protein itself.
89
Page 105
Figure 5.3 Relative enzyme activity of designed peptides.
We further obtained 50% inhibition concentrations (IC50) for P1 and P3. This was
obtained by measuring enzymatic activities at different peptide concentrations from
dilution with 50mM MOPS buffer at pH 7.5. As shown in, IC50 values are 1.2 µM for P1
and 0.67µM for P3.
Figure 5.4 IC50 determination for P1 and P3. Lines were fitted by SigmaPlot.
0
20
40
60
80
100
P1 P2 P3 P4 P5 GFP11
Rela
tive
Enzy
me
Activ
ity
with
10u
M P
eptid
e (%
)
90
Page 106
In order to gain some understanding of why different helical regions have different
inhibition capability, we compared several chemical/physical properties of P2, P3, and P4.
We did not list P1 here because its longer length (24 amino acid residues) makes it
difficult to compare with others. Two active peptides (P3 and P4) are close to neutral
with charge of 1 and -1, respectively. P2 has a negative charge of -3. However, the charge
is not the issue because P1 also has a negative charge of -3. We calculated the number of
contacts between a peptide segment and the rest of the protein. A contact is defined if the
distance between the two atoms in two different amino acid residues is less than 4 Å. The
number of contact of a peptide segment to the rest of proteins is similar to each other
(194-210) among P2, P3, and P4, thus, cannot account for difference in IC50. P3 and P4
have more hydrophobic residues, stronger interaction energy with the rest of the protein
than P2. This is consistent with P3 and P4 having smaller IC50 than P2. Here, Residues
A, C, F, G, I, L, M, P, V and W are defined as hydrophobic. The interaction energy (the
total energy excluding the energy of peptide and the energy of the rest of the protein
themselves) is calculated by the statistical energy function called dDFIRE [236]. The
dDFIRE energy function has the same trend as the IC50: P2>P4>P3, supporting the
relation between self-inhibition and structural disruption.
Table 5.2 Properties of wild-type peptides.
P2 P3 P4
IC59 (uM) Poor 0.67 10
Length 20 20 20
91
Page 107
sequence VSTGELDRICN
DYIVNEQHA
IMGERLCRITQE
SLYLALRM
GINLREIGAAIQ
KFVEAEGF
Charge -3 1 -1
# Contacts 200 194 210
# Hydrophobic residues 8 11 13
dDFIRE energy -38.26 -50.50 -44.09
5.3 De novo Design of Self-inhibitory Peptides of EcMetAP
The relation between dDFIRE energy scores and IC50 encourages us to further explore
the possibility if we could redesign the peptide region by energy optimization and
maintain its inhibition capability. We employed a program called OSCAR-design
developed by Shide Liang and Yaoqi Zhou (publication in preparation) in which the
distance-dependent and side-chain dihedral-angle components of the design energy
function were represented as power and Fourier series, respectively, similar to the
orientation-dependent optimized side-chain atomic energy OSCAR-o for predicting
protein side chain conformations [166]. Unlike the side-chain program, the parameters
for OSCAR-design were optimized so that the native residue type has the lowest energy
in all 20 residue types and the native conformation has the lowest energy in all side chain
rotamers. We utilized OSCAR-design to design P2, P3, and P4 segments while keeping
the rest of the protein unchanged. Each peptide was designed 1000 times (i.e. 1000
sequences). The designed peptides were ranked according to the energy score and the
number of conformations for a designed sequence. The energy score was calculated by
the dDFIRE energy function, rather than the OSCAR-design energy function. The
number of conformations for a designed sequence is due to the fact that identical
92
Page 108
sequences were resulted from the design but they are in different side chain
conformations. A larger number of conformations for the same sequence from the design
indicates a greater entropy for the sequence at a low energy level. 1000 designed
sequences were clustered into different clusters according to sequence identity. The
sequences with the lowest dDFIRE energy from each cluster were selected. To avoid
examination of nearly identical sequences, we require at least four-residue difference
between different clusters. We also clustered the sequences according to the number of
conformations and applied the same sequence identity restraint. The sequence with most
conformations at each cluster was selected. In addition, the candidate peptides must be
predicted with good solubility according to Innovagen's peptide calculator
(http://pepcalc.com/).
Table 5.3 shows statistics of designed P2, P3, and P4 regions. P4 has the least while P2
has the most unique number of sequences out of 1000 designed ones. Overall speaking,
the average sequence identity of design sequences to the respective wild-type sequence is
about 40-60%. That is, about 8-12 residues of a design sequence are identical to wild-
type residues. The diversity of designed sequences is similar according to the average
pairwise sequence identity (71-73% for P2-P4). The average number of hydrophobic
residues in designed P2 sequences (7.6) is very close to the wild-type P2 peptide (8)
while designed P3 and P4 have 1 or 2 more hydrophobic residues than corresponding
wild-type sequences. In average, the net electronic charges of design P2 and P3
sequences have the same sign as their wild-type peptides but that of P4 is the opposite.
93
Page 109
Interestingly, only 7 designed P2 sequences have lower dDFIRE energies than its wild-
type sequence while P3 has the most sequences with lower dDFIRE energy scores.
Table 5.3 Statistics of designed peptides. All the numbers here are calculated on
unique sequences.
P2 P3 P4
No. of unique
sequence 577 460 327
Ave. sequence ID 56.4% 42.9% 59.1%
Ave. Pairwise
sequence identity 71.0% 70.7% 73.4%
Ave. hydrophobic
residue 7.648 (8) 12.9(11) 9.1(8)
Ave. charge -0.714 (-3) 1.6(1) 0.25(-1)
No. of sequence with
a better dDFIRE
energy
11 405 100
94
Page 110
Table 5.4 Experimental results of 20 designed peptides.
Peptide ID dDFIRE
Score
# of
Conformations
Exp Result
Solubility(buffer)
Estimated
Conc. (uM)
Relative
Enzyme
Activity
Ratio
p2_1 Y Water 150 0.82
p2_2 Y Water 450 0.84
p2_350 Y 0.1M NH4OH 350 0.92
p2_157 Y Water 400 1.03
p3_66 Y Water 600 0.12
p3_67 Y Water 800 0.01
p3_78 Y Water 700 0.02
p3_136 Y Non-dissolvable 10mg/mLa 0.1
p3_157 Y 0.1M NH4OH 800 0.89
p3_169 Y 20% AcOH 100 0.34
p3_201 Y 20% AcOH 100 0.22
p3_261 Y 20% AcOH N/Ab 0.83
p3_140 Y 0.1M NH4OH 550 1.34
p3_225 Y 20% AcOH 200 0.97
p4_1 Y 10% AcOH 650 0.82
p4_12 Y 10% AcOH 500 0.95
p4_15 Y Non-dissolvable 10mg/mLa 0.15
p4_20 Y 0.1M NH4OH 200 0.66
p4_58 Y 10% AcOH 700 0.92
p4_35 Y 10% AcOH 650 0.36
95
Page 111
aEstimated concentration of undesalted peptides which cannot dissolve in water.
bEffective concentration cannot be determined due to the zero extinction coefficient.
We selected 20 peptides for experimental examination according to the dDFIRE energy
or the number of conformations (Table 5.4). The peptides were synthesized by Genscript
as crude products. Though all of them were predicted to have good water solubility, only
6 peptides can be fully dissolved in distilled water. 12 of them were can be dissolve in
other aqueous solvent including 10% Acetic Acid or 0.1M NH4OH. Two of them were
totally unable to be dissolved in aqueous solvent (P3_136 and P4_15). The 18 dissolvable
peptides were desalted using Qiagen DyeEx 2.0 spin columns and resuspend in 50mM
MOPS (pH 7.5). Their concentrations were estimated using the absorbance at 280nm
except P3_261 since it does not contain aromatic residues. Due to the variance in
solubility, the experimental concentrations of peptides are different. And for Peptides
P3_136 and P4_15 their turbid suspensions were directly tested for enzyme inhibition.
Table 5.4 shows the inhibitory effects of the concentrated designed peptides derived from
P2, P3 and P4. The peptides derived from P2 show very weak inhibition to EcMetAP.
Two out of six peptides from P4 show relative inhibition ratio less than 50%. The non-
desalted P3_136 and P4_15 show strong inhibition, however insolubility prevents more
detailed analysis. The top 4 P3 derived peptides ranked by minimal dDFIRE energy show
1% - 10% enzyme activity ratio which indicates that they can inhibit about 90-99%
EcMetAP. Two designed peptides with the strongest inhibition, P3_67 and P3_78 (the
redesigned P3 region), can inhibit EcMetAP to less than 2% enzyme activity. They were
96
Page 112
ranked as the top 1st and the 3rd by dDFIRE binding energy among all the P3 derived
peptides. Their IC50s were further determined and shown in Figure 5.5. However, the
IC50 values of P3_67 and P3_78 (33µM and 19µM, respectively), are higher than the
IC50 of wild-type P3 (0.62 µM). The 20 designed sequences are listed in Appendix B.
Figure 5.5 IC50 determination for P3_67 and P3_78. Lines were fitted by SigmaPlot.
5.4 Mutation Design of Self-inhibitory Peptides of EcMetAP
Facing the difficulty to improve over wild-type self-inhibition by de novo design, we
examine the possibility by protein engineering. We employed the same hypothesis that a
better self-inhibitory peptide is a peptide with more stable interaction with the rest of
protein but tried to improve stability by mutations. Similar to the previous study [237], a
position specific scoring matrix (PSSM) and position specific amino acid frequency
matrix were generated by PSI-BLAST [238]. Here, a residue 𝑖𝑖 in position 𝑗𝑗 is consider
as mutable if the either the PSSM( 𝑗𝑗, 𝑖𝑖 ) ≥ PSSM(j, wild-type) or Frequency( 𝑗𝑗, 𝑖𝑖 ) ≥
Frequency(j, wild-type). Mutations selected by PSSM are scored by the dDFIRE energy
function on 20 independent conformations for those mutations produced by OSCAR-
97
Page 113
design. Minimal, median and average dDFIRE energies are obtained. We located two
single-mutation mutants, one double-mutation mutants and one triple-mutation mutants
by the dDFIRE energy (Table 5.5). The energy score for the wild type is calculated based
on the side-chain optimized confirmation by OSCAR-design. The single mutation G121A
and S136C are both mutated from small to large volume which increasing the interaction
with other residues. Those two mutations have much higher PSSM value (more than two
folds) and frequency in sequence alignment which indicates the mutant are more
conserved than the wild-type. The double mutation combines G121A and S136C while
triple mutation combines both of them in addition of L131I. The PSSM value and
frequency in sequence alignment of I is significant higher than wild-type L. I and L have
same volume but different isomers. The dDFIRE energy values of all mutants are better
than the wild-type in minimal, average and median. These mutated peptides are currently
under synthetizing and will be further tested for their inhibition capability.
Table 5.5 Details of PSSM guided mutations.
Residue index Mutation(PSSM,
Frequency)a Min. Ave. Med.
121 G->A(2:5 7:63) -621.19 -619.21 -619.07
136 S->C(3:8 27:45) -622.42 -619.81 -619.71
121_131 G->A(2:5 7:63)
S->C(3:8 27:45) -622.85 -621.47 -621.67
98
Page 114
121_131_136
G->A(2:5 7:63)
S->C(3:8 27:45)
L->I(2:7 14:81 )
-623.53 -621.11 -621.03
Wild-type -619.38 -617.03 -616.98
aThe values in the parenthesis are PSSM (wild-type) : PSSM(mutant) , Frequency (wild-
type) : Frequency (mutant). The larger value means more conserved in sequence.
5.5 Conclusion
EcMetAP is a very import drug target for anti-bacterial agent. This work designed and
experimentally validated several self-inhibitory peptides for EcMetAP. In this chapter we
first identified two strong self-derived peptides (P1 and P3) with IC50 values in the
micromolar range. Computational optimization was later applied to P2, P3 and P4
sequences and 20 candidate peptide candidates were tested. Two designed peptides of P3
(P3_67 and P3_78) did inhibit EcMetAP with IC50 values within the micromolar range.
However, the inhibition ability of P3_67 and P3_78 is weaker than the wild-type P3,
highlighting the difficult to improve over wild-type by de novo design. We have
introduced PSSM guided mutations to wild-type P3 peptide with increased the interaction
between the self-inhibitory segment with the rest of protein. Further experimental studies
are in progress. In summary, EcMetAP can be inhibited by its self-inhibitory peptides. De
novo designed self-inhibitory peptide regions are also self-inhibitory, confirming the role
of peptide-protein core interaction in self-inhibition.
99
Page 115
Chapter 6 Computational Design of a Ribonuclease Inhibitor Barstar
6.1 Introduction
Protein design aims to design a protein sequence which can fold into the target structure
and perform desired function. Designing proteins is a powerful method for understanding
the underlying physical principles of protein folding and function. Moreover, it brings
new topologies and functions to proteins much faster than nature evolution. Furthermore,
it holds the promise of accelerating the creation of novel catalytic, pharmaceutical,
structural, and sensing properties for diagnostic, therapeutic, and industrial purposes.
Significant progress has been made in both design methods and applications for
computational protein design in the last two decades. Researchers have successfully
redesigned existing proteins and de novo designed proteins to perform a diverse range of
functions and even designed novel protein structures [10-16]. These computationally
designed proteins provide insights into physical interactions responsible for protein
structure stability and folding. Computational protein design requires both an accurate
energy function and an efficient search algorithm to locate the global minimum or
reasonably low energy conformations from astronomically large conformational space.
Our previous study suggests that all programs examined are able to locate near global
minimal for a specific energy function in fixed backbone design [167] and the accuracy
of an energy function limited the success rate of computational protein design.
Traditionally, sequence identity to wild-type sequence is employed to assess the
computational design and the success rate of protein design is obtained by experimentally
testing designed proteins individually. Experimentally validation is very costly and time
consuming due to structure determination is required to confirm the correct folding of
100
Page 116
designed sequence. This has prevented large-scale experimental validation and
measurement of success rate. Such a large-scale study would be useful for improving
computational design techniques. Therefore in this chapter, we computationally designed
a total of 48000 sequences of barstar in the presence of barnase and selected 6000
sequences. Those sequences are prepared for our high-throughput experiments that are in
progress.
Barnase is a single domain ribonuclease of 110 amino acids [239] and secreted to
extracellular space by the bacterium Bacillus amyloliquefaciens. Barnase degrades RNA
and destroys the cells in which it is present. Barstar is a smaller protein (89 amino acids)
also synthesised by Bacillus amyloliquefaciens. It binds tightly to barnase and inhibits
intracellular ribonuclease activity of barnase. Barstar-barnase complexes are very stable
and results in the inactivation of barnase cytotoxic activity. Both barnase and barstar are
water soluble and very stable in their monomeric and complex forms [240]. Therefore
Barnase-Barstar is a well-studied protein complex for protein-protein binding study. We
chose the barnase-barstar system as our design target because it is relative small, very
stable and water soluble. The successful designed candidates of barstar can fold back to
wild-type structure to inhibit barnase and maintain viability of cell. Unsuccessful
designed barstar variants will not bind to barnase and lead to cell death. Thus, the success
rate of the design can be measured by the number colonies on the selective plate divided
by the tested number of designed sequences (non-selective plates).
101
Page 117
6.2 Methods
6.2.1 Design Programs
In this study, we employed two methods: RosettaTalaris (the RosettaDesign method with
Talaris2013 as default design scoring function) and OSCAR-design (Liang, et al. in
preparation). As described in 0, OSCAR-design represents the distance-dependent and
side-chain dihedral-angle components of the design energy function as power and Fourier
series, respectively, similar to the orientation-dependent optimized side-chain atomic
energy OSCAR-o for predicting protein side chain conformations. Unlike the side-chain
program, the parameters for OSCAR-design were optimized so that the native residue
type has the lowest energy in all 20 residue types and the native conformation has the
lowest energy in all side chain rotamers. RosettaDesign [13,90,241-244] uses Monte
Carlo simulated annealing to search the protein sequences based on an energy made of a
combined physical and knowledge-based terms. A fixed backbone conformation with the
latest talaris2013 energy function and Dunbrack 2010 rotamer library [17] was employed
in this study.
6.2.2 Target Structure Setup
A barnase-barstar complex structure at 2.0Å resolution [245] was chose as the design
target (PDB code 1BRS, uniprot ID P11540). This structure is made of 6 chains: Chains
A, B and C are belong to barnase and chains D, E and F are belong to barstar. We
employ the target structure based on Chain C (barnase) and F (barstar) because Chains D
and E missed residues 64 and 65 (see Figure 6.1). There are one backbone oxygen atom
missing in the terminal ARG in chain C and one backbone oxygen atom missing in
102
Page 118
terminal SER in chain F. These missing backbone oxygen atoms were built by
RosettaTalaris using NATRO (native rotamer confirmation) design. Program Reduce
[246] was then used to add hydrogen atoms for the target structure because OSCAR-
design requires polar hydrogen atoms for its energy function.
6.2.3 Target Region Designed
The goal of this study is to design sequences that are foldable. That is, the protein-protein
interface between barnase and barstar is not the focus. Thus, we fixed barnase structure
and sequence as well as the interface residues of barstar. We define a residue as an
interface residue if any heavy atom of this residue in barstar is within 4 Å to any heavy
atom in barnase. As shown in Figure 6.1, there are 14 residues located in the dimeric
interface discontinuously from positions 29 to 46 (coloured by orange in protein sequence)
and one extra binding residue locates at index 76 (coloured by red) of barstar (sequence
was renumbered from 1). To facilitate our design, we fixed native residue types
continuously from 29 to 46 but not residue 76 (coloured by orange in PDB structure
including 4 non-binding residues, coloured by blue in protein sequence) and allowed side
chain flexibility. Fixing the binding interface allows us to examine the foldability of
designed barstar variants. It is worthy to mention that although E76 is far from the major
binding region, it forms a salt bridge with R59 residue in barnase. This salt bridge was
found essential for inhibition of barnase by barstar [247]. Hence the recovery rate of E76
is one way to assess the design programs computationally when E76 is not fixed.
103
Page 119
Figure 6.1 The barnase-barstar complex structure. Barstar is colored by green (left)
and barnase is colored by cyan (right). E76 (red) of barstar and R59 (purple) of
barnase are shown in stick model. The discontinuous dimer interface region
(position 29-46) is colored by orange while non-interfacial residues in blue.
6.3 Results
We utilized both programs to design 12000 sequences for barstar in the presence of a
fixed barnase. A total of 71 residues are designed when E76 is not fixed. We also
designed the sequences when E76 is fixed. Table 6.1 shows the comparison between
104
Page 120
RosettaTalaris and OSCAR-design. Sequences designed by OSCAR-design have a much
higher sequence identity to wild types (7.2%) than RosettaTalaris. The similarity among
sequences designed by OSCAR-design is slightly lower (more diverse) than that designed
by RosettaTalaris (1.4-1.8% lower, about 1 amino acid residue). The sequence
differences between designs with fixed or without fixed E76 are small in term of
sequence identity to wild-type sequence and pairwise sequence similarity.
As discussed above, the recovery rate of E76 of barstar can be viewed as a criterion for
judging design success when E76 is not fixed. As Table 6.1 shows, the recovery rate of
E76 for OSCAR-design is significantly higher (27.9%) than RosettaTalaris (4.7%).
We further examined low complexity regions in designed sequences by SEG program
[248]. A low complexity rate is measured at a residue level (SEG output) or at a protein
level. A protein-level low-complexity rate is calculated by the total number of proteins
with low complexity region divided by the total number of designed protein sequences
(12000). Sequences designed by RosettaTalaris have slightly high rate of low complexity
at both residue (0.3% higher) and protein (1.2% higher) levels than those designed by
OSCAR-design. The overall rate is low for both methods.
One important factor for a good protein design is to avoid large hydrophobic patch area.
All designed sequences by OSCAR-design and RosettaTalaris with or without fixing E76
have a larger hydrophobic patch area than wild-type. The areas for the sequences
designed by OSCAR-design are about 37-38 Å2 larger than wild-type. This increase,
105
Page 121
however, is less than RosettaTalaris. The areas of the sequences designed by
RosettaTalaris are 116 (not fixing E76) or 123 (fixing E76) Å2 than wild types. We also
examined the hydrogen bonds using the program HBPLUS [249] as hydrogen bonding
plays an important role in determining protein three-dimensional structures. The more
hydrogen bonds a protein has, the more likely its structure will be stable. Because the
backbone of target structure is fixed, the number of backbone-backbone hydrogen bonds
is the same in target structure and designed structures. Thus, we only listed the total
number of hydrogen bonds between main chain and side chain and between side chains.
Sequences designed by OSCAR-design have more hydrogen bonds than sequences
designed by RosettaTalaris and wild-type sequences. It seems that the energy functions in
both design programs have stronger hydrogen-bonding terms than wild types.
Table 6.1 Statistical information of designed sequences.
Method SeqID%a
Pairwise
SeqID%a
E76
recovery
rate%
Low
complexity
rate%b
Hydrophobic
patch
area(Å2)
# of
hydrogen
bond
Wild-type 100 100 100 0/0 323.329c 20c
RosettaTalaris 39.4 (51.7) 70.6(76.9) 4.7 0.5/(3.7) 439.37 28.3
OSCAR-design 46.6 (57.4) 68.8(75.5) 27.9 0.2(1.5) 360.04 30.06
RosettaTalaris
(Fix E76) 39.8 (52.7) 70.7(77.0) 100 0.4(3.1) 456.67 28.7
106
Page 122
OSCAR-design
(Fix E76) 47.0 (58.3) 69.3(75.9) 100 0.4(3.4) 361.33 29.94
aThe number in parenthesis is calculated based on the full length of barnase sequence.
The number outside parenthesis is calculated based on the designed region only.
bThe number in parenthesis is calculated by the number of proteins with the low
complexity region divided by the total number of proteins in the corresponding dataset.
cThe hydrophobic patch area was calculated based on the structure with missing
sidechain and main chain filled by RosettaTalaris.
We have designed four sets of sequences each containing 12000 designed sequences (two
methods fixing and not fixing E76). To prepare for experimental studies of a total of 6000
sequences, the program CD-HIT [250,251] was employed to cluster these four datasets.
A sequence cut-off of 87% was applied to all the datasets with the command “cd-hit -i
input_dataset -g 1 -c 0.87 -o output”. We chose the top 1500 clusters with the most
members of sequences from each dataset. Table 6.2 shows statistics of selected sequences.
The top 1500 sequence clusters covered 84.8-86.5% sequences designed by OSCAR-
design. The top 1500 clusters designed by RosettaTalaris covered about 10% more, from
95.8-95.9% of the whole dataset. That is, sequences designed by OSCAR-design are
more diverse. Sequences designed by OSCAR-design have more than 3000 clusters while
datasets designed by RosettaTalaris have less than 2000 clusters under the same cluster
method. This indicates that the number of sequences in each cluster of RosettaTalaris is
about 1.5 times more than that of OSCAR-design. We took a further inspection by using
pairwise sequence identity between any two designed sequences in 1500 selected
107
Page 123
sequences. Interestingly, sequences designed by RosettaTalaris tend to be more diverse
than sequences designed by OSCAR-design after clustering by CD-hit. It is 1.8-1.9%
difference (1.6-1.7 residue difference) in full sequence length (89 residues). Figure 6.2
shows the distribution of overall pairwise sequence identity of datasets before clustering
and after clustering. We only showed the distribution of sequences designed by both
methods without fixing E76. OSCAR-design produces sequences having slightly higher
diversity than RosettaTalaris before clustering but less after clustering.
We also examined the E76 recovery rate in selected sequences. The E76 recovery rate
increases in both methods while OSCAR-design has a significant higher E76 recovery
rate. Low complexity rate at the residue and protein levels increase slightly in
RosettaTalaris fixing or not fixing E76. Selected sequences designed by OSCAR-design
without fixing E76 also have slightly higher low complexity rate than the average for all
sequences but is the same when fixing E76. There are also minor increases in term of the
hydrophobic patch areas of sequences designed by OSCAR-design (1Å increase) or by
RosettaTalaris (6 Å increase). The number of hydrogen bonds for selected sequences is
essentially the same as for all designed sequences designed by OSCAR-design and
increased by 1 for the sequences designed by RosettaTalaris. The average sequence
identity to wild-type sequence in the designed region decreases about 0.1-0.3% in the
clustered dataset designed by OSCAR-design but decreases more (1.4-2.1%) for
sequences designed by RosettaTalaris. OSCAR-design performs significantly better for
the sequence identity to wild-type sequence in core, surface and different secondary
structure regions than RosettaTalaris in the final selected sequences.
108
Page 124
Hydrophilic-hydrophobic balance is very important for protein stabilization and protein
function. The interface of any two sub-units is often composed by hydrophobic residues
but too many hydrophobic residues on surface may lead to protein aggregation [133,252].
Table 6.4 shows the distribution of hydrophilic residues and their recovery rates in
protein core and on protein surface and in different secondary structures. There are a
total of 38 (37 with E76 fixed) hydrophilic residues in the designed region of wild-type
sequence. The E76 is on protein surface and in a helix and thus the fractions of
hydrophilic residues at surface and helical regions with E76 fixed are different from those
with E76 not fixed. There are 5 hydrophilic residues in β-sheet, 22 (21 with E76 fixed) in
α-helix and 11 in coiled regions. Overall fractions of hydrophilic residues are very
similar to those of wild-type sequence. OSCAR-design produced slightly more similar
fraction of hydrophilic residues to the wild-type sequence comparing to RosettaTalaris
and significantly higher rate of recovery in hydrophilic residues (> than 5%) than
RosettaTalaris. OSCAR-design yielded a slightly higher fraction of hydrophilic residues
in protein core (about 0.4-0.6%) while RosettaTalaris produced slightly less (~1.2-1.3%).
But the difference in number of residues is very small (about 0.1-0.3 residue in average)
because there are 26 core residues in the designed region. Overall speaking, designed
sequences from both methods have hydrophilic residue contents very similar to the wild-
type sequence. OSCAR-design performs better than RosettaTalaris in the recovery rate in
core, surface and different secondary structure regions.
109
Page 125
Table 6.2 Statistics of designed sequences after clustering: Number of sequences covered
by top 1500 clusters, the number of clusters, sequence identity to wild-type sequence in
the designed region and in the whole sequence, in the core and surface, in different
secondary structure regions for top 1500 selected sequences.
Method Coverage%/
# of cluster
Pairwise
SeqID%a SeqID%a Core/Surface% Sheet/Helix/Coil%
RosettaTalaris 95.8/1995 64.9
(72.0)
38.0
(50.5) 61.2/24.6 45.1/37.7/32.3
OSCAR-design 84.8/3172 67.3
(73.9)
46.3
(57.2) 72.5/31.3 54.7/44.3/43.3
RosettaTalaris
(Fix E76) 95.9/1983
64.7
(72.2)
37.8
(51.5) 61.4/24.8 46.0/38.2 /32.1
OSCAR-design
(Fix E76) 86.5/3027
66.9
(74.0)
46.7
(58.0) 72.1/31.7 54.8/44.8/43.4
Wild-type 100 100 100/100 100/100/100
a The number in parenthesis is calculated based on the full length of barnase sequence.
The number outside parenthesis is calculated based on the designed region only.
110
Page 126
Figure 6.2 Distributions of pairwise sequence identity between any two designed
sequences for the four datasets as labeled.
111
Page 127
Table 6.3 E76 recovery rate, low complexity rate at residue and protein levels, the
average hydrophobic patch area and the average number of hydrogen bonds
involved with side chain for top 1500 selected sequences.
Method
E76
recovery
rate%
Low complexity
rate%a
Ave. hydrophobic
patch area(Å2)
Ave. # of hydrogen
bond
RosettaTalaris 8.8 0.6(4.8) 440.94 29.33
OSCAR-design 32.1 0.3(2.2) 362.55 30.32
RosettaTalaris
(Fix E76) 100 0.6(5.2) 462.98 29.59
OSCAR-design
(Fix E76) 100 0.4(3.4) 362.89 30.14
Wild-type 100 0(0) 323.329 20
a The number in parenthesis is calculated by number of proteins contains low complexity
region divided by total of numbers in the corresponding dataset.
Table 6.4 The fraction (and recovery rate) of hydrophilic residues in core and on
surface, and in different secondary structure regions for top 1500 selected
sequences.
Method Overall%a Core% Surface% Sheet% Helix% Coil%
RosettaTalaris 50.2 14.1 71.1 28.5 58.4 53.0
112
Page 128
(73.8) (41.5) (77.6) (69.7) (77.3) (68.6)
OSCAR-design 51.4
(79.6)
15.8
(51.2)
72.1
(82.9)
36.4
(83.6)
57.8
(80.0)
51.9
(76.9)
RosettaTalaris
(Fix E76)
49.8
(73.6)
14.2
(41.5)
70.8
(77.5)
28.1
(69.6)
57.3
(76.1)
54.2
(70.8)
OSCAR-design
(Fix E76)
50.8
(79.1)
16.0
(51.1)
71.4
(82.5)
36.4
(83.2)
56.6
(79.2)
52.0
(76.9)
Wild-type 53.5/52.8b 15.4 75.6/75.0 b 31.3 59.5/58.3 b 61.1
a Hydrophilic residues are D, E, H, K, N, Q, R, S, T, and Y.
bThe fraction of hydrophobic residues for the case of E76 fixed.
6.4 Discussion
Traditionally, the success rate of protein design is obtained by experimental testing of a
number of designed sequences for a given protein. This is very costly and inefficient
because an accurate measure requires testing a large number of design sequences [87,90].
High cost and inefficiency have prevented the use of experimental success rate as a tool
to improve computational techniques. In this chapter we employed OSCAR-design and
RosettaTalaris to design 15000 sequences for barstar with and without E76 fixed,
respectively. A total of 6000 sequences will be tested by our high-throughput experiment
and the success rate of computational design methods will be measured. The feedback
113
Page 129
from experimental studies will help to further examine and improve the energy function
of computational design. Improving success rate is needed for a more wide use of protein
design as a tool for designing proteins with desirable structural and functional properties
by experimental biochemists.
114
Page 130
Chapter 7 Conclusion
In summary, this dissertation presented a comprehensive assessment of state-of-the-art de
novo computational protein design methods and developed a new energy term for design
by neural-network-based prediction of structural compatible sequence profiles. It also
presented two applications: designing and optimizing self-inhibitory peptides for
methionine aminopeptidase and barstar for the barnase-barstar system.
Low success rate of de novo computational protein design is not caused by insufficient
search in the sequence space because all designed sequences from a given design
program are converged around a single solution with pairwise sequence identity about 68%
in a benchmark test. The low success rate is due to inaccurate energy functions currently
employed because a wild-type sequence has an energy score much higher (about 8-15
kcal/mole) than designed sequences (Chapter 2). To improve our understanding for the
low success rate, we analysed the sequences designed by several representative design
programs with several novel techniques. Two new scoring functions, OSCAR-design and
RosettaTalaris, were found to significantly improve over previous methods in several
important measurements including sequence identities to wild types and sizes of
hydrophobic patches. OSCAR-design, despite of its purely mathematical energy function,
is superior over RosettaDesign in the overall assessment.
To overcome the deficiency in energy functions, we developed a machine-learning
technique to predict sequences compatible to a given target structure. It produced 30.3%
sequence identity to wild-type sequence in independent test dataset of 500 proteins. The
115
Page 131
sequence identity to the wild-type sequence by SPIN is comparable to RosettaDesign in
randomly selected 50 proteins (30.3% vs 30.0%) without pre-minimizing target structures.
SPIN produced a better sequence profile to PSSM than RosettaDesign based on MSE
measurement with a much faster computing time (~103 order of magnitude faster). The
method can be further improved by optimizing the nonlocal energy profile and taking the
advantage of deeper learning network technique.
The discovery of improvement of OSCAR-design over RosettaDesign led us to employ it
to design self-inhibitor peptides for methionine aminopeptidase (MetAP). Four peptides
(P1, P3 and P3 derived P3_67 and P3_78) can achieve IC50 at a micromole concentration.
These findings supported that MetAP can be inhibited by self-derived peptides and
designed peptides can also be self-inhibitory, although not as strong as wild type peptides.
We attempted to further improve efficiency of inhibition over wild-type peptides by
utilizing PSSM guided mutations. Experiments are in progress. Final experimental
results will help to further understand the mechanism of self-inhibitory and develop better
methods to design self-inhibitory peptide for biomedical purposes.
To further test protein design techniques, we designed a total of 48000 sequences for the
barnase-barstar system with OSCAR-design and RosettaTalaris. 6000 designed
sequences were selected to further test by our high-throughput experiment that is in
progress. Computational analysis of designed sequences suggests that OSCAR-design
performed better in sequence identity to wild-type sequence, the recovery rate of the
critical E76 residue, the size of hydrophobic patch areas, sequence complexity, the
116
Page 132
number of hydrogen bonds, and the number of hydrophilic residues and their recovery
rate. The feedback from experimental studies (in progress) will help us to further
examine current design methods and improve their energy functions.
117
Page 133
Appendices
Appendix A List of 112 X-ray Monomeric Proteins
1eur, 1ede, 1fhl, 1izz, 1mtz, 1qtr, 1ri6, 1v6y, 1xfk, 3d2a, 3f7m, 3hvm, 3ils, 3mxx, 3pte,
153l, 1ahc, 1g62, 1nrf, 1o0x, 1olr, 1p3c, 1qtf, 1qva, 1vin, 2a6z, 2rkx, 3hoj, 3ne0, 3oc6,
1ezk, 1gak, 1hzt, 1i04, 1kng, 1pzc, 1sau, 1tzv, 2a4v, 2ehg, 3csr, 3fh2, 3g7y, 3k8u, 3kh7,
1e6m, 1aa2, 1b1u, 1bm8, 1gh2, 1ooi, 2aif, 2c6u, 2fc3, 2fi9, 2gkg, 2wz9, 3d4m, 3dju,
3kt9, 1dsl, 1h75, 1hoe, 1ptf, 1tig, 1ulr, 1x3o, 1x6j, 2fi0, 2gtg, 2uwr, 2w9q, 2zeq, 2zrr,
3llb, 1f0m, 1hyp, 1pht, 1tsf, 1uj8, 1vcc, 1zzk, 2b8i, 2cgq, 2ckx, 2evb, 2fq3, 2ywk, 2zqe,
3adg, 1fna, 1n7e, 1o3x, 1wvn, 1yqb, 1zeq, 2o37, 2ozf, 2vc8, 2yxy, 3g7c, 3hak, 3rd2, 3hjl,
2ciu, 1a32, 1dvo, 1ntn, 2cg7, 2wj5, 3pr9, 1lr9
118
Page 134
Appendix B Twenty Computationally Optimized and Experimentally Tested Self-
inhibitory Peptides of EcMetAP
Table B.1 Properties of twenty candidate peptides including dDFIRE energy,
contacted residue pair, total charge, number of hydrophobic residue, Isoelectric
point and number of confirmations for unique sequence.
ID Sequence dDFIREa AA Pairb Charge Hydrophobic
residue PIc Confirmation
p2_1 MSTGELNKICDKFI
REYQGA -38.85 54 0 9 6.47 1
p2_2 ESTGKLNKICQKFI
EEYQGA -38.74 54 0 8 6.51 1
p2_350 SSTGELDRICERYI
KEHQGA -36.04 54 -1 7 5.43 19
p2_157 SSTGDLDKICEKYI
KEYQGA -36.96 54 -1 7 4.56 14
p3_66 PLGEKLCKVTYEA
LLRALLL -55.49 59 1 13 8.84 3
p3_67 PLGKKLCEVTRKA
LYIALLL -55.49 60 3 13 10.05 1
p3_78 PLGKRLCEVTYKA
LVRALLL -55.29 57 3 13 10.18 1
p3_136 PLGARLCDVTRRA
LYRALLL -55.59 60 3 13 10.98 1
119
Page 135
p3_157 PLGERLCKVTLEAL
YRALLM -54.17 58 1 13 8.87 3
p3_169 PEAERLCRVTLRAL
YRALLL -53.93 59 2 12 9.86 1
p3_201 PLAQKLCDVTYEA
LKRALLL -53.60 58 1 12 8.84 1
p3_261 PLGEKLCKVTLEA
LQRALLL 52.81 55 1 13 8.93 26
p3_140 PLGERLCKVTYEA
LVRALLM -54.37 60 1 13 8.87 5
p3_225 PLGQKLCDVTYEA
LKRALLL -53.17 60 1 12 8.84 5
p4_1 GVNLRDIGRLIQQY
VESKGF -46.13 61 1 10 9.71 1
p4_12 GVNLRDIGRKIEQY
INSQGF -45.14 61 1 9 9.71 1
p4_13 GVNLREIGRHIQQY
IESQGF -45.09 63 0 9 7.76 1
p4_20 GVNLREIGRHIQQY
VESQGF -45.00 64 0 9 7.76 126
p4_58 GTNLRDIGRAIQQY
VESKGF -44.42 61 1 9 9.71 11
p4_35 GVNLREIGRAIENY
VKSKGF -44.73 60 2 10 10.17 9
120
Page 136
a minimal dDFIRE energy.
b maximal contacted residue pair with 4 Å.
c calculated Isoelectric point by Innovagen's peptide calculator (http://pepcalc.com/).
121
Page 137
References
[1] Pauling, L., Corey, R.B., Branson, H.R., 1951. The structure of proteins; two hydrogen-bonded helical configurations of the polypeptide chain. Proc Natl Acad Sci U S A 37, 205-211.
[2] Kuchner, O., Arnold, F.H., 1997. Directed evolution of enzyme catalysts. Trends
in biotechnology 15, 523-530. [3] Fox, R.J., Davis, S.C., Mundorff, E.C., Newman, L.M., Gavrilovic, V., Ma, S.K.,
Chung, L.M., Ching, C., Tam, S., Muley, S., Grate, J., Gruber, J., Whitman, J.C., Sheldon, R.A., Huisman, G.W., 2007. Improving catalytic function by ProSAR-driven enzyme evolution. Nature biotechnology 25, 338-344.
[4] Qian, Z., Lutz, S., 2005. Improving the catalytic activity of Candida antarctica
lipase B by circular permutation. J Am Chem Soc 127, 13466-13467. [5] Fischbach, M.A., Lai, J.R., Roche, E.D., Walsh, C.T., Liu, D.R., 2007. Directed
evolution can rapidly improve the activity of chimeric assembly-line enzymes. P Natl Acad Sci USA 104, 11951-11956.
[6] McIsaac, R.S., Engqvist, M.K., Wannier, T., Rosenthal, A.Z., Herwig, L.,
Flytzanis, N.C., Imasheva, E.S., Lanyi, J.K., Balashov, S.P., Gradinaru, V., Arnold, F.H., 2014. Directed evolution of a far-red fluorescent rhodopsin. Proc Natl Acad Sci U S A 111, 13034-13039.
[7] Lian, J., Li, Y., HamediRad, M., Zhao, H., 2014. Directed evolution of a
cellodextrin transporter for improved biofuel production under anaerobic conditions in Saccharomyces cerevisiae. Biotechnology and bioengineering 111, 1521-1531.
[8] Lamb, B.M., Mercer, A.C., Barbas, C.F., 2013. Directed evolution of the TALE
N-terminal domain for recognition of all 5' bases. Nucleic Acids Res 41, 9779-9785.
[9] Molina-Espeja, P., Garcia-Ruiz, E., Gonzalez-Perez, D., Ullrich, R., Hofrichter,
M., Alcalde, M., 2014. Directed Evolution of Unspecific Peroxygenase from Agrocybe aegerita. Appl Environ Microb 80, 3496-3507.
[10] Bryson, J.W., Desjarlais, J.R., Handel, T.M., DeGrado, W.F., 1998. From coiled
coils to small globular proteins: design of a native-like three-helix bundle. Protein science : a publication of the Protein Society 7, 1404-1414.
[11] Dantas, G., Corrent, C., Reichow, S.L., Havranek, J.J., Eletr, Z.M., Isern, N.G.,
Kuhlman, B., Varani, G., Merritt, E.A., Baker, D., 2007. High-resolution
122
Page 138
structural and thermodynamic analysis of extreme stabilization of human procarboxypeptidase by computational protein design. J Mol Biol 366, 1209-1221.
[12] Reina, J., Lacroix, E., Hobson, S.D., Fernandez-Ballester, G., Rybin, V., Schwab,
M.S., Serrano, L., Gonzalez, C., 2002. Computer-aided design of a PDZ domain to recognize new target sequences. Nature structural biology 9, 621-627.
[13] Kuhlman, B., Dantas, G., Ireton, G.C., Varani, G., Stoddard, B.L., Baker, D.,
2003. Design of a novel globular protein fold with atomic-level accuracy. Science 302, 1364-1368.
[14] Hill, C.P., Anderson, D.H., Wesson, L., DeGrado, W.F., Eisenberg, D., 1990.
Crystal structure of alpha 1: implications for protein design. Science 249, 543-546. [15] Bender, G.M., Lehmann, A., Zou, H., Cheng, H., Fry, H.C., Engel, D., Therien,
M.J., Blasie, J.K., Roder, H., Saven, J.G., DeGrado, W.F., 2007. De novo design of a single-chain diphenylporphyrin metalloprotein. Journal of the American Chemical Society 129, 10732-10740.
[16] Dahiyat, B.I., Sarisky, C.A., Mayo, S.L., 1997. De novo protein design: towards
fully automated sequence selection. J Mol Biol 273, 789-796. [17] Shapovalov, M.V., Dunbrack, R.L., Jr., 2011. A smoothed backbone-dependent
rotamer library for proteins derived from adaptive kernel density estimates and regressions. Structure 19, 844-858.
[18] Dunbrack, R.L., Jr., 2002. Rotamer libraries in the 21st century. Curr Opin Struct
Biol 12, 431-440. [19] Georgiev, I., Lilien, R.H., Donald, B.R., 2006. Improved Pruning algorithms and
Divide-and-Conquer strategies for Dead-End Elimination, with application to protein design. Bioinformatics 22, e174-183.
[20] Hallen, M.A., Keedy, D.A., Donald, B.R., 2013. Dead-end elimination with
perturbations (DEEPer): a provable protein design algorithm with continuous sidechain and backbone flexibility. Proteins 81, 18-39.
[21] Gordon, D.B., Mayo, S.L., 1999. Branch-and-terminate: a combinatorial
optimization algorithm for protein design. Structure 7, 1089-1098. [22] Kingsford, C.L., Chazelle, B., Singh, M., 2005. Solving and analyzing side-chain
positioning problems using linear and integer programming. Bioinformatics 21, 1028-1036.
[23] Hu, X., Hu, H., Beratan, D.N., Yang, W., 2010. A gradient-directed Monte Carlo
approach for protein design. J Comput Chem 31, 2164-2168.
123
Page 139
[24] Sandelin, E., 1999. A novel Monte Carlo procedure for protein design. Aip Conf
Proc 469, 295-296. [25] Irback, A., Peterson, C., Potthast, F., Sandelin, E., 1998. Monte Carlo procedure
for protein design. Phys Rev E 58, R5249-R5252. [26] Scott, L.P.B., Chahine, J., Ruggiero, J.R., 2008. Using genetic algorithm to design
protein sequence. Appl Math Comput 200, 1-9. [27] Pokala, N., Handel, T.M., 2005. Energy functions for protein design: Adjustment
with protein-protein complex affinities, models for the unfolded state, and negative design of solubility and specificity. J Mol Biol 347, 203-227.
[28] Saraf, M.C., Moore, G.L., Goodey, N.M., Cao, V.Y., Benkovic, S.J., Maranas,
C.D., 2006. IPRO: an iterative computational protein library redesign and optimization procedure. Biophysical journal 90, 4167-4180.
[29] Gainza, P., Roberts, K.E., Georgiev, I., Lilien, R.H., Keedy, D.A., Chen, C.Y.,
Reza, F., Anderson, A.C., Richardson, D.C., Richardson, J.S., Donald, B.R., 2013. OSPREY: protein design with ensembles, flexibility, and provable algorithms. Method Enzymol 523, 87-107.
[30] Gainza, P., Roberts, K.E., Donald, B.R., 2012. Protein design using continuous
rotamers. PLoS computational biology 8, e1002335. [31] Desmet, J., De Maeyer, M., Hazes, B., Lasters, I., 1992. The dead-end elimination
theorem and its use in protein side-chain positioning. Nature 356, 539-542. [32] Dahiyat, B.I., Mayo, S.L., 1997. De novo protein design: fully automated
sequence selection. Science 278, 82-87. [33] Georgiev, I., Donald, B.R., 2007. Dead-end elimination with backbone flexibility.
Bioinformatics 23, i185-194. [34] Yanover, C., Fromer, M., Shifman, J.M., 2007. Dead-end elimination for
multistate protein design. J Comput Chem 28, 2122-2129. [35] Georgiev, I., Lilien, R.H., Donald, B.R., 2008. The minimized dead-end
elimination criterion and its application to protein redesign in a hybrid scoring and search algorithm for computing partition functions over molecular ensembles. J Comput Chem 29, 1527-1542.
[36] Bolon, D.N., Mayo, S.L., 2001. Enzyme-like proteins by computational design.
Proc Natl Acad Sci U S A 98, 14274-14279.
124
Page 140
[37] Dahiyat, B.I., Mayo, S.L., 1997. Probing the role of packing specificity in protein design. Proceedings of the National Academy of Sciences of the United States of America 94, 10172-10177.
[38] Dahiyat, B.I., Mayo, S.L., 1996. Protein design automation. Protein Sci 5, 895-
903. [39] Kuhlman, B., Baker, D., 2000. Native protein sequences are close to optimal for
their structures. Proceedings of the National Academy of Sciences of the United States of America 97, 10383-10388.
[40] Liang, S., Grishin, N.V., 2004. Effective scoring function for protein sequence
design. Proteins 54, 271-281. [41] Dai, L.A., Yang, Y.D., Kim, H.R., Zhou, Y.Q., 2010. Improving computational
protein design by using structure-derived sequence profile. Proteins 78, 2338-2348.
[42] Suarez, M., Tortosa, P., Jaramillo, A., 2008. PROTDES: CHARMM toolbox for
computational protein design. Systems and synthetic biology 2, 105-113. [43] Pokala, N., Handel, T.M., 2005. Energy functions for protein design: adjustment
with protein-protein complex affinities, models for the unfolded state, and negative design of solubility and specificity. J Mol Biol 347, 203-227.
[44] Cunningham, B.A., Hemperly, J.J., Hopp, T.P., Edelman, G.M., 1979. Favin
versus concanavalin A: Circularly permuted amino acid sequences. Proc Natl Acad Sci U S A 76, 3218-3222.
[45] Lindqvist, Y., Schneider, G., 1997. Circular permutations of natural protein
sequences: structural evidence. Current opinion in structural biology 7, 422-427. [46] Hennecke, J., Sebbel, P., Glockshuber, R., 1999. Random circular permutation of
DsbA reveals segments that are essential for protein folding and stability. J Mol Biol 286, 1197-1215.
[47] Iwakura, M., Nakamura, T., Yamane, C., Maki, K., 2000. Systematic circular
permutation of an entire protein reveals essential folding elements. Nat Struct Biol 7, 580-585.
[48] Dai, L., Zhou, Y., 2011. Characterizing the Existing and Potential Structural
Space of Proteins by Large-Scale Multiple Loop Permutations. J Mol Biol 408, 585-595.
[49] Taylor, W.R., Chelliah, V., Hollup, S.M., MacDonald, J.T., Jonassen, I., 2009.
Probing the "Dark Matter" of Protein Fold Space. Structure 17, 1244-1252.
125
Page 141
[50] Cossio, P., Trovato, A., Pietrucci, F., Seno, F., Maritan, A., Laio, A., 2010.
Exploring the Universe of Protein Structures beyond the Protein Data Bank. Plos Comput Biol 6, E1000957.
[51] Virnau, P., Mallam, A., Jackson, S., 2011. Structures and folding pathways of
topologically knotted proteins. J Phys-Condens Mat 23, 033101. [52] Hwang, J.K., Lai, Y.L., Yen, S.C., 2010. Comprehensive Analysis of Knotted
Proteins, in: Zhao, Z. (Ed.), Sequence and Genome Analysis: Methods and Applications. iConcept Press, Queensland, pp. 22-39.
[53] Kolesov, G., Virnau, P., Kardar, M., Mirny, L.A., 2007. Protein knot server:
detection of knots in protein structures. Nucleic Acids Res 35, W425-W428. [54] Lai, Y.L., Yen, S.C., Yu, S.H., Hwang, J.K., 2007. pKNOT: the protein KNOT
web server. Nucleic Acids Res 35, W420-W424. [55] King, N.P., Jacobitz, A.W., Sawaya, M.R., Goldschmidt, L., Yeates, T.O., 2010.
Structure and folding of a designed knotted protein. Proc Natl Acad Sci U S A 107, 20732-20737.
[56] Kamtekar, S., Schiffer, J.M., Xiong, H., Babik, J.M., Hecht, M.H., 1993. Protein
design by binary patterning of polar and nonpolar amino acids. Science 262, 1680-1685.
[57] Regan, L., DeGrado, W.F., 1988. Characterization of a helical protein designed
from first principles. Science 241, 976-978. [58] Quinn, T.P., Tweedy, N.B., Williams, R.W., Richardson, J.S., Richardson, D.C.,
1994. Betadoublet: de novo design, synthesis, and characterization of a beta-sandwich protein. P Natl Acad Sci USA 91, 8747-8751.
[59] Harbury, P.B., Plecs, J.J., Tidor, B., Alber, T., Kim, P.S., 1998. High-resolution
protein design with backbone freedom. Science 282, 1462-1467. [60] Bryson, J.W., Desjarlais, J.R., Handel, T.M., DeGrado, W.F., 1998. From coiled
coils to small globular proteins: design of a native-like three-helix bundle. Protein Sci 7, 1404-1414.
[61] Walsh, S.T., Cheng, H., Bryson, J.W., Roder, H., DeGrado, W.F., 1999. Solution
structure and dynamics of a de novo designed three-helix bundle protein. P Natl Acad Sci USA 96, 5486-5491.
126
Page 142
[62] Shah, P.S., Hom, G.K., Ross, S.A., Lassila, J.K., Crowhurst, K.A., Mayo, S.L., 2007. Full-sequence computational design and solution structure of a thermostable protein variant. J Mol Biol 372, 1-6.
[63] Bender, G.M., Lehmann, A., Zou, H., Cheng, H., Fry, H.C., Engel, D., Therien,
M.J., Blasie, J.K., Roder, H., Saven, J.G., DeGrado, W.F., 2007. De novo design of a single-chain diphenylporphyrin metalloprotein. J Am Chem Soc 129, 10732-10740.
[64] Kortemme, T., Ramirez-Alvarado, M., Serrano, L., 1998. Design of a 20-amino
acid, three-stranded beta-sheet protein. Science 281, 253-256. [65] Kuhlman, B., O'Neill, J.W., Kim, D.E., Zhang, K.Y., Baker, D., 2002. Accurate
computer-based design of a new backbone conformation in the second turn of protein L. J Mol Biol 315, 471-477.
[66] Offredi, F., Dubail, F., Kischel, P., Sarinski, K., Stern, A.S., Van de Weerdt, C.,
Hoch, J.C., Prosperi, C., Francois, J.M., Mayo, S.L., Martial, J.A., 2003. De novo backbone and sequence design of an idealized alpha/beta-barrel protein: Evidence of stable tertiary structure. J Mol Biol 325, 163-174.
[67] Dobson, N., Dantas, G., Baker, D., Varani, G., 2006. High-resolution structural
validation of the computational redesign of human U1A protein. Structure 14, 847-856.
[68] Dantas, G., Corrent, C., Reichow, S.L., Havranek, J.J., Eletr, Z.M., Isern, N.G.,
Kuhlman, B., Varani, G., Merritt, E.A., Baker, D., 2007. High-resolution structural and thermodynamic analysis of extreme stabilization of human procarboxypeptidase by computational protein design. J Mol Biol 366, 1209-1221.
[69] Liang, H., Chen, H., Fan, K., Wei, P., Guo, X., Jin, C., Zeng, C., Tang, C., Lai, L.,
2009. De novo design of a beta alpha beta motif. Angew Chem Int Ed Engl 48, 3301-3303.
[70] Kuhlman, B., O'Neill, J.W., Kim, D.E., Zhang, K.Y., Baker, D., 2001. Conversion
of monomeric protein L to an obligate dimer by computational protein design. P Natl Acad Sci USA 98, 10687-10691.
[71] Reina, J., Lacroix, E., Hobson, S.D., Fernandez-Ballester, G., Rybin, V., Schwab,
M.S., Serrano, L., Gonzalez, C., 2002. Computer-aided design of a PDZ domain to recognize new target sequences. Nat Struct Biol 9, 621-627.
[72] Shifman, J.M., Mayo, S.L., 2002. Modulating calmodulin binding specificity
through computational protein design. J Mol Biol 323, 417-423.
127
Page 143
[73] Looger, L.L., Dwyer, M.A., Smith, J.J., Hellinga, H.W., 2003. Computational design of receptor and sensor proteins with novel functions. Nature 423, 185-190.
[74] Ashworth, J., Havranek, J.J., Duarte, C.M., Sussman, D., Monnat, R.J., Stoddard,
B.L., Baker, D., 2006. Computational redesign of endonuclease DNA binding and cleavage specificity. Nature 441, 656-659.
[75] Grigoryan, G., Reinke, A.W., Keating, A.E., 2009. Design of protein-interaction
specificity gives selective bZIP-binding peptides. Nature 458, 859-854. [76] Koder, R.L., Anderson, J.L., Solomon, L.A., Reddy, K.S., Moser, C.C., Dutton,
P.L., 2009. Design and engineering of an O(2) transport protein. Nature 458, 305-309.
[77] Pinto, A.L., Hellinga, H.W., Caradonna, J.P., 1997. Construction of a catalytically
active iron superoxide dismutase by rational protein design. P Natl Acad Sci USA 94, 5562-5567.
[78] Bolon, D.N., Voigt, C.A., Mayo, S.L., 2002. De novo design of biocatalysts. Curr
Opin Chem Biol 6, 125-129. [79] Dwyer, M.A., Looger, L.L., Hellinga, H.W., 2004. Computational design of a
biologically active enzyme. Science 304, 1967-1971. [80] Lassila, J.K., Keeffe, J.R., Oelschlaeger, P., Mayo, S.L., 2005. Computationally
designed variants of Escherichia coli chorismate mutase show altered catalytic activity. Protein Eng Des Sel 18, 161-163.
[81] Jiang, L., Althoff, E.A., Clemente, F.R., Doyle, L., Rothlisberger, D., Zanghellini,
A., Gallaher, J.L., Betker, J.L., Tanaka, F., Barbas, C.F., Hilvert, D., Houk, K.N., Stoddard, B.L., Baker, D., 2008. De novo computational design of retro-aldol enzymes. Science 319, 1387-1391.
[82] Siegel, J.B., Zanghellini, A., Lovick, H.M., Kiss, G., Lambert, A.R., St Clair, J.L.,
Gallaher, J.L., Hilvert, D., Gelb, M.H., Stoddard, B.L., Houk, K.N., Michael, F.E., Baker, D., 2010. Computational design of an enzyme catalyst for a stereoselective bimolecular Diels-Alder reaction. Science 329, 309-313.
[83] Ambroggio, X.I., Kuhlman, B., 2006. Computational design of a single amino
acid sequence that can switch between two distinct protein folds. J Am Chem Soc 128, 1154-1161.
[84] Ambroggio, X.I., Kuhlman, B., 2006. Design of protein conformational switches.
Curr Opin Struc Biol 16, 525-530.
128
Page 144
[85] Suarez, M., Jaramillo, A., 2009. Challenges in the computational design of proteins. J R Soc Interface 6, S477-S491.
[86] Lippow, S.M., Tidor, B., 2007. Progress in computational protein design. Curr
Opin Biotech 18, 305-311. [87] Fleishman, S.J., Whitehead, T.A., Ekiert, D.C., Dreyfus, C., Corn, J.E., Strauch,
E.M., Wilson, I.A., Baker, D., 2011. Computational Design of Proteins Targeting the Conserved Stem Region of Influenza Hemagglutinin. Science 332, 816-821.
[88] Clark, L.A., Boriack-Sjodin, P.A., Eldredge, J., Fitch, C., Friedman, B., Hanf,
K.J.M., Jarpe, M., Liparoto, S.F., Li, Y., Lugovskoy, A., Miller, S., Rushe, M., Sherman, W., Simon, K., Van Vlijmen, H., 2006. Affinity enhancement of an in vivo matured therapeutic antibody using structure-based computational design. Protein Science 15, 949-960.
[89] Lazar, G.A., Dang, W., Karki, S., Vafa, O., Peng, J.S., Hyun, L., Chan, C., Chung,
H.S., Eivazi, A., Yoder, S.C., Vielmetter, J., Carmichael, D.F., Hayes, R.J., Dahiyat, B.I., 2006. Engineered antibody Fc variants with enhanced effector function. P Natl Acad Sci USA 103, 4005-4010.
[90] Dantas, G., Kuhlman, B., Callender, D., Wong, M., Baker, D., 2003. A large scale
test of computational protein design: folding and stability of nine completely redesigned globular proteins. J Mol Biol 332, 449-460.
[91] Schreier, B., Stumpp, C., Wiesner, S., Hocker, B., 2009. Computational design of
ligand binding is not a solved problem. P Natl Acad Sci USA 106, 18491-18496. [92] Hu, X.Z., Wang, H.C., Ke, H.M., Kuhlman, B., 2008. Computer-Based Redesign
of a beta Sandwich Protein Suggests that Extensive Negative Design Is Not Required for De Novo beta Sheet Design. Structure 16, 1799-1805.
[93] Murphy, G.S., Mills, J.L., Miley, M.J., Machius, M., Szyperski, T., Kuhlman, B.,
2012. Increasing Sequence Diversity with Flexible Backbone Protein Design: The Complete Redesign of a Protein Hydrophobic Core. Structure 20, 1086-1096.
[94] Fortenberry, C., Bowman, E.A., Proffitt, W., Dorr, B., Combs, S., Harp, J.,
Mizoue, L., Meiler, J., 2011. Exploring Symmetry as an Avenue to the Computational Design of Large Protein Domains (vol 45, pg 18026, 2011). J Am Chem Soc 133, 21028-21028.
[95] Isogai, Y., Ito, Y., Ikeya, T., Shiro, Y., Ota, M., 2005. Design of lambda Cro fold:
solution structure of a monomeric variant of the de novo protein. J Mol Biol 354, 801-814.
129
Page 145
[96] Stordeur, C., Dalluge, R., Birkenmeier, O., Wienk, H., Rudolph, R., Lange, C., Lucke, C., 2008. The NMR solution structure of the artificial protein M7 matches the computationally designed model. Proteins 72, 1104-1107.
[97] Dai, L., Yang, Y., Kim, H.R., Zhou, Y., 2010. Improving computational protein
design by using structure-derived sequence profile. Proteins 78, 2338 - 2348. [98] Das, R., 2011. Four Small Puzzles That Rosetta Doesn't Solve. Plos One 6,
e20044. [99] Hu, X.Z., Wang, H.C., Ke, H.M., Kuhlman, B., 2007. High-resolution design of a
protein loop. P Natl Acad Sci USA 104, 17668-17673. [100] Privalov, P.L., 1979. Stability of proteins: small globular proteins. Adv Protein
Chem 33, 167-241. [101] Kuhlman, B., Baker, D., 2000. Native protein sequences are close to optimal for
their structures. P Natl Acad Sci USA 97, 13383-13388. [102] Schneider, M., Fu, X., Keating, A.E., 2009. X-ray vs. NMR structures as
templates for computational protein design. Proteins 77, 97-110. [103] Boas, F.E., Harbury, P.B., 2007. Potential energy functions for protein design.
Curr Opin Struc Biol 17, 199-204. [104] Russ, W.P., Ranganathan, R., 2002. Knowledge-based potential functions in
protein design. Curr Opin Struc Biol 12, 447-452. [105] Poole, A.M., Ranganathan, R., 2006. Knowledge-based potentials in protein
design. Curr Opin Struc Biol 16, 508-513. [106] Pokala, N., Handel, T.M., 2001. Review: Protein design - Where we were, where
we are, where we're going. J Struct Biol 134, 269-281. [107] Cootes, A.P., Curmi, P.M.G., Torda, A.E., 2000. Automated Protein Design and
Sequence Optimisation: Scoring Functions and the Search Problem. Curr Protein Pept Sc 1, 255-271.
[108] Vizcarra, C.L., Mayo, S.L., 2005. Electrostatics in computational protein design.
Curr Opin Chem Biol 9, 622-626. [109] Rohl, C.A., Strauss, C.E.M., Misura, K.M.S., Baker, D., 2004. Protein structure
prediction using Rosetta. Method Enzymol 383, 66-93. [110] Jacak, R., Leaver-Fay, A., Kuhlman, B., 2012. Computational protein design with
explicit consideration of surface hydrophobic patches. Proteins 80, 825-838.
130
Page 146
[111] Lovell, S.C., Davis, I.W., Arendall, W.B., 3rd, de Bakker, P.I., Word, J.M.,
Prisant, M.G., Richardson, J.S., Richardson, D.C., 2003. Structure validation by Calpha geometry: phi,psi and Cbeta deviation. Proteins 50, 437-450.
[112] Dunbrack, R.L., Jr., Karplus, M., 1994. Conformational analysis of the backbone-
dependent rotamer preferences of protein sidechains. Nat Struct Biol 1, 334-340. [113] Lazaridis, T., Karplus, M., 1999. Effective energy function for proteins in solution.
Proteins 35, 133-152. [114] Simons, K.T., Ruczinski, I., Kooperberg, C., Fox, B.A., Bystroff, C., Baker, D.,
1999. Improved recognition of native-like protein structures using a combination of sequence-dependent and sequence-independent features of proteins. Proteins-Structure Function and Genetics 34, 82-95.
[115] Jorgensen, W.L., Maxwell, D.S., TiradoRives, J., 1996. Development and testing
of the OPLS all-atom force field on conformational energetics and properties of organic liquids. J Am Chem Soc 118, 11225-11236.
[116] Pokala, N., Handel, T.M., 2004. Energy functions for protein design I: efficient
and accurate continuum electrostatics and solvation. Protein Sci 13, 925-936. [117] Creamer, T.P., 2000. Side-chain conformational entropy in protein unfolded states.
Proteins 40, 443-450. [118] Liang, S.D., Grishin, N.V., 2002. Side-chain modeling with an optimized scoring
function. Protein Science 11, 322-331. [119] Brooks, B.R., Bruccoleri, R.E., Olafson, B.D., States, D.J., Swaminathan, S.,
Karplus, M., 1983. CHARMM: A Program for Macromolecular Energy, Minimization, and Dynamics Calculations. J. Computational Chemistry 4, 187-217.
[120] Rost, B., 2001. Review: Protein secondary structure prediction continues to rise. J
Struct Biol 134, 204-218. [121] Faraggi, E., Zhang, T., Yang, Y., Kurgan, L., Zhou, Y., 2011. SPINE X:
Improving protein secondary structure prediction by multi-step learning coupled with prediction of solvent accessible surface area and backbone torsion angles. J. Computational Chemistry 33, 259-263.
[122] Faraggi, E., Yang, Y.D., Zhang, S.S., Zhou, Y., 2009. Predicting Continuous
Local Structure and the Effect of Its Substitution for Secondary Structure in Fragment-Free Protein Structure Prediction. Structure 17, 1515-1527.
131
Page 147
[123] Zhou, H., Zhou, Y., 2005. Fold recognition by combining sequence profiles derived from evolution and from depth-dependent structural alignment of fragments. Proteins 58, 321-328.
[124] Tsai, H.H., Tsai, C.J., Ma, B.Y., Nussinov, R., 2004. In silico protein design by
combinatorial assembly of protein building blocks. Protein Science 13, 2753-2765. [125] Romero, P., Obradovic, Z., Li, X.H., Garner, E.C., Brown, C.J., Dunker, A.K.,
2001. Sequence complexity of disordered protein. Proteins-Structure Function and Genetics 42, 38-48.
[126] Wootton, J.C., Federhen, S., 1993. Statistics of Local Complexity in Amino-Acid-
Sequences and Sequence Databases. Comput Chem 17, 149-163. [127] Samanta, U., Bahadur, R.P., Chakrabarti, P., 2002. Quantifying the accessible
surface area of protein residues in their local environment. Protein Eng 15, 659-667.
[128] Liu, Y., Kuhlman, B., 2006. RosettaDesign server for protein design. Nucleic
Acids Res 34, W235-238. [129] Liang, S., Grishin, N.V., 2004. Effective scoring function for protein sequence
design. Proteins 54, 271-281. [130] Zhang, T., Faraggi, E., Xue, B., Dunker, A.K., Uversky, V.N., Zhou, Y., 2012.
SPINE-D: Accurate prediction of short and long disordered regions by a single neural-network based method. J. Biomol. Struc. Dyan. 28, 799-813.
[131] Monastyrskyy, B., Fidelis, K., Moult, J., Tramontano, A., Kryshtafovych, A.,
2011. Evaluation of disorder predictions in CASP9. Proteins 79 (S10), 107-118. [132] Faraggi, E., Xue, B., Zhou, Y., 2009. Improving the prediction accuracy of
residue solvent accessibility and real-value backbone torsion angles of proteins by guided-learning through a two-layer neural network. Proteins 74, 847-856.
[133] Chiti, F., Stefani, M., Taddei, N., Ramponi, G., Dobson, C.M., 2003.
Rationalization of the effects of mutations on peptide and protein aggregation rates. Nature 424, 805-808.
[134] Lijnzaad, P., Berendsen, H.J., Argos, P., 1996. A method for detecting
hydrophobic patches on protein surfaces. Proteins 26, 192-203. [135] Liang, S.D., Li, L.W., Hsu, W.L., Pilcher, M.N., Uversky, V., Zhou, Y.Q.,
Dunker, A.K., Meroueh, S.O., 2009. Exploring the Molecular Design of Protein Interaction Sites with Molecular Dynamics Simulations and Free Energy Calculations. Biochemistry-Us 48, 399-414.
132
Page 148
[136] Bazzoli, A., Tettamanzi, A.G.B., Zhang, Y., 2011. Computational Protein Design
and Large-Scale Assessment by I-TASSER Structure Assembly Simulations. J Mol Biol 407, 764-776.
[137] Yang, Y., Faraggi, E., Zhao, H., Zhou, Y., 2011. Improving protein fold
recognition and template-based modeling by employing probabilistic-based matching between predicted one-dimensional structural properties of the query and corresponding native properties of templates. Bioinformatics 27, 2076-2082.
[138] Sali, A., Blundell, T.L., 1993. Comparative Protein Modeling by Satisfaction of
Spatial Restraints. J Mol Biol 234, 779-815. [139] Dahiyat, B.I., Mayo, S.L., 1997. Probing the role of packing specificity in protein
design. P Natl Acad Sci USA 94, 10172-10177. [140] Sun, S., Brem, R., Chan, H.S., Dill, K.A., 1995. Designing amino acid sequences
to fold with good hydrophobic cores. Protein Eng 8, 1205-1213. [141] Wernisch, L., Hery, S., Wodak, S.J., 2000. Automatic protein design with all
atom force-fields by exact and heuristic optimization. J Mol Biol 301, 713-736. [142] Dill, K.A., Stigter, D., 1995. Modeling Protein Stability as Heteropolymer
Collapse. Advances in Protein Chemistry, Vol 46 46, 59-104. [143] Schindler, T., Perl, D., Graumann, P., Sieber, V., Marahiel, M.A., Schmid, F.X.,
1998. Surface-exposed phenylalanines in the RNP1/RNP2 motif stabilize the cold-shock protein CspB from Bacillus subtilis. Proteins-Structure Function and Genetics 30, 401-406.
[144] Poso, D., Sessions, R.B., Lorch, M., Clarke, A.R., 2000. Progressive stabilization
of intermediate and transition states in protein folding reactions by introducing surface hydrophobic residues. J Biol Chem 275, 35723-35726.
[145] Fleishman, S.J., Whitehead, T.A., Strauch, E.M., Corn, J.E., Qin, S.B., Zhou,
H.X., Mitchell, J.C., Demerdash, O.N.A., Takeda-Shitaka, M., Terashi, G., Moal, I.H., Li, X.F., Bates, P.A., Zacharias, M., Park, H., Ko, J.S., Lee, H., Seok, C., Bourquard, T., Bernauer, J., Poupon, A., Aze, J., Soner, S., Ovali, S.K., Ozbek, P., Ben Tal, N., Haliloglu, T., Hwang, H., Vreven, T., Pierce, B.G., Weng, Z.P., Perez-Cano, L., Pons, C., Fernandez-Recio, J., Jiang, F., Yang, F., Gong, X.Q., Cao, L.B., Xu, X.J., Liu, B., Wang, P.W., Li, C.H., Wang, C.X., Robert, C.H., Guharoy, M., Liu, S.Y., Huang, Y.Y., Li, L., Guo, D.C., Chen, Y., Xiao, Y., London, N., Itzhaki, Z., Schueler-Furman, O., Inbar, Y., Potapov, V., Cohen, M., Schreiber, G., Tsuchiya, Y., Kanamori, E., Standley, D.M., Nakamura, H., Kinoshita, K., Driggers, C.M., Hall, R.G., Morgan, J.L., Hsu, V.L., Zhan, J., Yang, Y.D., Zhou, Y.Q., Kastritis, P.L., Bonvin, A.M.J.J., Zhang, W.Y., Camacho, C.J.,
133
Page 149
Kilambi, K.P., Sircar, A., Gray, J.J., Ohue, M., Uchikoga, N., Matsuzaki, Y., Ishida, T., Akiyama, Y., Khashan, R., Bush, S., Fouches, D., Tropsha, A., Esquivel-Rodriguez, J., Kihara, D., Stranges, P.B., Jacak, R., Kuhlman, B., Huang, S.Y., Zou, X.Q., Wodak, S.J., Janin, J., Baker, D., 2011. Community-Wide Assessment of Protein-Interface Modeling Suggests Improvements to Design Methodology. J Mol Biol 414, 289-302.
[146] Fiorucci, S., Zacharias, M., 2010. Binding site prediction and improved scoring
during flexible protein-protein docking with ATTRACT. Proteins 78, 3131-3139. [147] Zhou, Y., Zhou, H.Y., Zhang, C., Liu, S., 2006. What is a desirable statistical
energy function for proteins and how can it be obtained? Cell Biochem Biophys 46, 165-174.
[148] DeLuca, S., Dorr, B., Meiler, J., 2011. Design of Native-like Proteins through an
Exposure-Dependent Environment Potential. Biochemistry-Us 50, 8521-8528. [149] Morozov, A.V., Kortemme, T., Tsemekhman, K., Baker, D., 2004. Close
agreement between the orientation dependence of hydrogen bonds observed in protein structures and quantum mechanical calculations. P Natl Acad Sci USA 101, 6946-6951.
[150] Gilis, D., Biot, C., Buisine, E., Dehouck, Y., Rooman, M., 2006. Development of
novel statistical potentials describing cation-pi interactions in proteins and comparison with semiempirical and quantum chemistry approaches. J Chem Inf Model 46, 884-893.
[151] Yang, Y.D., Zhou, Y., 2008. Specific interactions for ab initio folding of protein
terminal regions with secondary structures. Proteins 72, 793-803. [152] Ma, J., 2009. Explicit orientation dependence in empirical potentials and its
significance to side-chain modeling. Acc Chem Res 42, 1087-1096. [153] Liang, S., Zhou, Y., Grishin, N., Standley, D.M., 2011. Protein side chain
modeling with orientation-dependent atomic force fields derived by series expansions. J Comput Chem 32, 1680-1686.
[154] Buchete, N.V., Straub, J.E., Thirumalai, D., 2004. Development of novel
statistical potentials for protein fold recognition. Curr Opin Struc Biol 14, 225-232.
[155] Gniewek, P., Leelananda, S.P., Kolinski, A., Jernigan, R.L., Kloczkowski, A.,
2011. Multibody coarse-grained potentials for native structure recognition and quality assessment of protein models. Proteins 79, 1923-1929.
134
Page 150
[156] Zhou, H.Y., Zhou, Y., 2002. Distance-scaled, finite ideal-gas reference state improves structure-derived potentials of mean force for structure selection and stability prediction. Protein Science 11, 2714-2726.
[157] Maccallum, P.H., Poet, R., James Milner-White, E., 1995. Coulombic interactions
between partially charged main-chain atoms not hydrogen-bonded to each other influence the conformations of [alpha]-helices and antiparallel [beta]-sheet. A new method for analysing the forces between hydrogen bonding groups in proteins includes all the Coulombic interactions. J Mol Biol 248, 361-373.
[158] Deane, C.M., Allen, F.H., Taylor, R., Blundell, T.L., 1999. Carbonyl-carbonyl
interactions stabilize the partially allowed Ramachandran conformations of asparagine and aspartic acid. Protein Eng 12, 1025-1028.
[159] Paulini, R., Muller, K., Diederich, F., 2005. Orthogonal multipolar interactions in
structural chemistry and biology. Angew Chem Int Edit 44, 1788-1805. [160] Saunders, C.T., Baker, D., 2005. Recapitulation of protein family divergence
using flexible backbone protein design. J Mol Biol 346, 631-644. [161] Gainza, P., Roberts, K.E., Donald, B.R., 2012. Protein Design Using Continuous
Rotamers. Plos Comput Biol 8, E1002335. [162] Mandell, D.J., Kortemme, T., 2009. Backbone flexibility in computational protein
design. Curr Opin Biotech 20, 420-428. [163] Hu, X., Wang, H., Ke, H., Kuhlman, B., 2008. Computer-based redesign of a beta
sandwich protein suggests that extensive negative design is not required for de novo beta sheet design. Structure 16, 1799-1805.
[164] Ding, F., Dokholyan, N.V., 2006. Emergence of protein fold families through
rational design. Plos Comput Biol 2, 725-733. [165] Dunbrack, R.L., Jr., Cohen, F.E., 1997. Bayesian statistical analysis of protein
side-chain rotamer preferences. Protein Sci 6, 1661-1681. [166] Liang, S., Zhou, Y., Grishin, N., Standley, D.M., 2011. Protein side chain
modeling with orientation-dependent atomic force fields derived by series expansions. Journal of computational chemistry 32, 1680-1686.
[167] Li, Z., Yang, Y., Zhan, J., Dai, L., Zhou, Y., 2013. Energy functions in de novo
protein design: current challenges and future prospects. Annual review of biophysics 42, 315-335.
135
Page 151
[168] Leaver-Fay, A., Butterfoss, G.L., Snoeyink, J., Kuhlman, B., 2007. Maintaining solvent accessible surface area under rotamer substitution for protein design. J Comput Chem 28, 1336-1341.
[169] Faraggi, E., Xue, B., Zhou, Y., 2009. Improving the prediction accuracy of
residue solvent accessibility and real-value backbone torsion angles of proteins by guided-learning through a two-layer neural network. Proteins 74, 847-856.
[170] Schreier, B., Stumpp, C., Wiesner, S., Hocker, B., 2009. Computational design of
ligand binding is not a solved problem. Proceedings of the National Academy of Sciences of the United States of America 106, 18491-18496.
[171] Munch, C., Bertolotti, A., 2010. Exposure of hydrophobic surfaces initiates
aggregation of diverse ALS-causing superoxide dismutase-1 mutants. J Mol Biol 399, 512-525.
[172] Lijnzaad, P., Berendsen, H.J., Argos, P., 1996. A method for detecting
hydrophobic patches on protein surfaces. Proteins 26, 192-203. [173] Sneddon, S.F., Tobias, D.J., 1992. The role of packing interactions in stabilizing
folded proteins. Biochemistry-Us 31, 2842-2846. [174] Lim, W.A., Sauer, R.T., 1991. The role of internal packing interactions in
determining the structure and stability of a protein. J Mol Biol 219, 359-376. [175] Andersen, C.A., Palmer, A.G., Brunak, S., Rost, B., 2002. Continuum secondary
structure captures protein flexibility. Structure 10, 175-184. [176] Sali, A., 1995. Comparative Protein Modeling by Satisfaction of Spatial
Restraints. Mol Med Today 1, 270-277. [177] Li, Z.X., Yang, Y.D., Zhan, J., Dai, L., Zhou, Y.Q., 2013. Energy Functions in De
Novo Protein Design: Current Challenges and Future Prospects. Annual Review of Biophysics, Vol 42 42, 315-335.
[178] Hayes, R.J., Bentzien, J., Ary, M.L., Hwang, M.Y., Jacinto, J.M., Vielmetter, J.,
Kundu, A., Dahiyat, B.I., 2002. Combining computational and experimental screening for rapid optimization of protein properties. Proc Natl Acad Sci U S A 99, 15926-15931.
[179] Treynor, T.P., Vizcarra, C.L., Nedelcu, D., Mayo, S.L., 2007. Computationally
designed libraries of fluorescent proteins evaluated by preservation and diversity of function. Proc Natl Acad Sci U S A 104, 48-53.
136
Page 152
[180] Guntas, G., Purbeck, C., Kuhlman, B., 2010. Engineering a protein-protein interface using a computationally designed library. Proc Natl Acad Sci U S A 107, 19296-19301.
[181] Allen, B.D., Nisthal, A., Mayo, S.L., 2010. Experimental library screening
demonstrates the successful application of computational protein design to large structural ensembles. Proc Natl Acad Sci U S A 107, 19838-19843.
[182] Chen, T.S., Palacios, H., Keating, A.E., 2013. Structure-based redesign of the
binding specificity of anti-apoptotic Bcl-x(L). J Mol Biol 425, 171-185. [183] Rothlisberger, D., Khersonsky, O., Wollacott, A.M., Jiang, L., DeChancie, J.,
Betker, J., Gallaher, J.L., Althoff, E.A., Zanghellini, A., Dym, O., Albeck, S., Houk, K.N., Tawfik, D.S., Baker, D., 2008. Kemp elimination catalysts by computational enzyme design. Nature 453, 190-195.
[184] Pierce, N.A., Winfree, E., 2002. Protein design is NP-hard. Protein Eng 15, 779-
782. [185] Zhou, H., Zhou, Y., 2005. Fold recognition by combining sequence profiles
derived from evolution and from depth-dependent structural alignment of fragments. Proteins 58, 321-328.
[186] Busch, M.S.A., Mignon, D., Simonson, T., 2009. Computational protein design as
a tool for fold recognition. Proteins 77, 139-158. [187] Larson, S.M., Garg, A., Desjarlais, J.R., Pande, V.S., 2003. Increased detection of
structural templates using alignments of designed sequences. Proteins-Structure Function and Genetics 51, 390-396.
[188] Wang, G., Dunbrack, R.L., Jr., 2003. PISCES: a protein sequence culling server.
Bioinformatics 19, 1589-1591. [189] Kabsch, W., Sander, C., 1983. Dictionary of protein structure: pattern recognition
of hydrogen-bonded and geometrical features. Biopolymers 22, 2577-2637. [190] Faraggi, E., Zhang, T., Yang, Y., Kurgan, L., Zhou, Y., 2012. SPINE X:
improving protein secondary structure prediction by multistep learning coupled with prediction of solvent accessible surface area and backbone torsion angles. J Comput Chem 33, 259-267.
[191] Yang, Y.D., Zhou, Y., 2008. Ab initio folding of terminal segments with
secondary structures reveals the fine difference between two closely related all-atom statistical energy functions. Protein Science 17, 1212-1219.
137
Page 153
[192] Altschul, S.F., Madden, T.L., Schaffer, A.A., Zhang, J.H., Zhang, Z., Miller, W., Lipman, D.J., 1997. Gapped BLAST and PSI-BLAST: a new generation of protein database search programs. Nucleic Acids Res 25, 3389-3402.
[193] Leaver-Fay, A., O'Meara, M.J., Tyka, M., Jacak, R., Song, Y.F., Kellogg, E.H.,
Thompson, J., Davis, I.W., Pache, R.A., Lyskov, S., Gray, J.J., Kortemme, T., Richardson, J.S., Havranek, J.J., Snoeyink, J., Baker, D., Kuhlman, B., 2013. Scientific Benchmarks for Guiding Macromolecular Energy Function Improvement. Methods in Protein Design 523, 109-143.
[194] Rost, B., 1999. Twilight zone of protein sequence alignments. Protein Eng 12, 85-
94. [195] Tozzini, V., 2005. Coarse-grained models for proteins. Curr Opin Struc Biol 15,
144-150. [196] Kanudia, P., Mittal, M., Kumaran, S., Chakraborti, P.K., 2011. Amino-terminal
extension present in the methionine aminopeptidase type 1c of Mycobacterium tuberculosis is indispensible for its activity. BMC biochemistry 12, 35.
[197] Ben-Bassat, A., Bauer, K., Chang, S.Y., Myambo, K., Boosman, A., Chang, S.,
1987. Processing of the initiation methionine from proteins: properties of the Escherichia coli methionine aminopeptidase and its gene structure. Journal of bacteriology 169, 751-757.
[198] Xiao, Q., Zhang, F., Nacev, B.A., Liu, J.O., Pei, D., 2010. Protein N-terminal
processing: substrate specificity of Escherichia coli and human methionine aminopeptidases. Biochemistry-Us 49, 5588-5599.
[199] Giglione, C., Boularot, A., Meinnel, T., 2004. Protein N-terminal methionine
excision. Cellular and molecular life sciences : CMLS 61, 1455-1474. [200] Chang, S.Y., McGary, E.C., Chang, S., 1989. Methionine aminopeptidase gene of
Escherichia coli is essential for cell growth. Journal of bacteriology 171, 4071-4072.
[201] Miller, C.G., Kukral, A.M., Miller, J.L., Movva, N.R., 1989. Pepm Is an Essential
Gene in Salmonella-Typhimurium. Journal of bacteriology 171, 5215-5217. [202] Wang, W.L., Chai, S.C., Huang, M., He, H.Z., Hurley, T.D., Ye, Q.Z., 2008.
Discovery of inhibitors of Escherichia coli methionine aminopeptidase with the Fe(II)-form selectivity and antibacterial activity. Journal of medicinal chemistry 51, 6110-6120.
[203] Ye, Q.Z., Chai, S., Wang, W.L., 2008. Characterization of cellular activities of
inhibitors of E. coli methionine aminopeptidase. Faseb J 22.
138
Page 154
[204] Ma, Z.Q., Xie, S.X., Huang, Q.Q., Nan, F.J., Hurley, T.D., Ye, Q.Z., 2007.
Structural analysis of inhibition of E-coli methionine aminopeptidase: implication of loop adaptability in selective inhibition of bacterial enzymes. Bmc Struct Biol 7.
[205] Mauriz, J.L., Martin-Renedo, J., Garcia-Palomo, A., Tunon, M.J., Gonzalez-
Gallego, J., 2010. Methionine Aminopeptidases as Potential Targets for Treatment of Gastrointestinal Cancers and other Tumors. Curr Drug Targets 11, 1430-1448.
[206] Sawanyawisuth, K., Wongkham, C., Pairojkul, C., Saeseow, O.T., Riggins, G.J.,
Araki, N., Wongkham, S., 2007. Methionine aminopeptidase 2 over-expressed in cholangiocarcinoma: Potential for drug target. Acta Oncol 46, 378-385.
[207] Shahlaei, M., Sabet, R., Ziari, M.B., Moeinifard, B., Fassihi, A., Karbakhsh, R.,
2010. QSAR study of anthranilic acid sulfonamides as inhibitors of methionine aminopeptidase-2 using LS-SVM and GRNN based on principal components. European journal of medicinal chemistry 45, 4499-4508.
[208] Griffith, E.C., Su, Z., Turk, B.E., Chen, S.P., Chang, Y.H., Wu, Z.C., Biemann,
K., Liu, J.O., 1997. Methionine aminopeptidase (type 2) is the common target for angiogenesis inhibitors AGM-1470 and ovalicin. Chem Biol 4, 461-471.
[209] Joharapurkar, A.A., Dhanesha, N.A., Jain, M.R., 2014. Inhibition of the
methionine aminopeptidase 2 enzyme for the treatment of obesity. Diabetes, metabolic syndrome and obesity : targets and therapy 7, 73-84.
[210] Blamey, R.W., Jonat, W., Kaufmann, M., Bianco, A.R., Namer, M., 1993.
Survival data relating to the use of goserelin depot in the treatment of premenopausal advanced breast cancer. European journal of cancer 29A, 1498.
[211] Blamey, R.W., Jonat, W., Kaufmann, M., Bianco, A.R., Namer, M., 1992.
Goserelin depot in the treatment of premenopausal advanced breast cancer. European journal of cancer 28A, 810-814.
[212] Chauvet, B., 1998. [Improved survival in patients with locally advanced prostate
cancer treated with radiotherapy and goserelin]. Cancer radiotherapie : journal de la Societe francaise de radiotherapie oncologique 2, 312.
[213] Vogelzang, N.J., Chodak, G.W., Soloway, M.S., Block, N.L., Schellhammer, P.F.,
Smith, J.A., Jr., Caplan, R.J., Kennealey, G.T., 1995. Goserelin versus orchiectomy in the treatment of advanced prostate cancer: final results of a randomized trial. Zoladex Prostate Study Group. Urology 46, 220-226.
139
Page 155
[214] Kala, M., Miravalle, A., Vollmer, T., 2011. Recent insights into the mechanism of action of glatiramer acetate. J Neuroimmunol 235, 9-17.
[215] Saltz, L., Trochanowski, B., Buckley, M., Heffernan, B., Niedzwiecki, D., Tao, Y.,
Kelsen, D., 1993. Octreotide as an Antineoplastic Agent in the Treatment of Functional and Nonfunctional Neuroendocrine Tumors. Cancer 72, 244-248.
[216] Ducreux, M., Ruszniewski, P., Chayvialle, J.A., Blumberg, J., Cloarec, D., Michel,
H., Raymond, J.M., Dupas, J.L., Gouerou, H., Jian, R., Genestin, E., Hammel, P., Rougier, P., 2000. The antitumoral effect of the long-acting somatostatin analog lanreotide in neuroendocrine tumors. Am J Gastroenterol 95, 3276-3281.
[217] Wymenga, A.N.M., Eriksson, B., Salmela, P.I., Jacobsen, M.B., Van Cutsem,
E.J.D.G., Fiasse, R.H., Valimaki, M.J., Renstrup, J., de Vries, E.G.E., Oberg, K.E., 1999. Efficacy and safety of prolonged-release lanreotide in patients with gastrointestinal neuroendocrine tumors and hormone-related symptoms. J Clin Oncol 17, 1111-1117.
[218] Maes, M., Binda, E., 2012. Peptides that inhibit HIV-1 integrase by blocking its
protein-protein interactions (vol 279, pg 2795, 2012). Febs J 279, 4109-4109. [219] Jiang, S.B., Lin, K., Strick, N., Neurath, A.R., 1993. Inhibition of Hiv-1 Infection
by a Fusion Domain Binding Peptide from the Hiv-1 Envelope Glycoprotein-Gp41. Biochem Bioph Res Co 195, 533-538.
[220] Jiang, S.B., Lin, K., Strick, N., Neurath, A.R., 1993. Hiv-1 Inhibition by a Peptide.
Nature 365, 113-113. [221] Steckbeck, J.D., Deslouches, B., Montelaro, R.C., 2014. Antimicrobial peptides:
new drugs for bad bugs? Expert opinion on biological therapy 14, 11-14. [222] Andres, E., Dimarcq, J.L., 2004. Cationic antimicrobial peptides: update of
clinical development. J Intern Med 255, 519-520. [223] Fox, J.L., 2013. Antimicrobial peptides stage a comeback. Nature biotechnology
31, 379-382. [224] Caldarini, M., Vasile, F., Provasi, D., Longhi, R., Tiana, G., Broglia, R.A., 2009.
Identification and characterization of folding inhibitors of hen egg lysozyme: an example of a new paradigm of drug design. Proteins 74, 390-399.
[225] Sergel, T.A., McGinnes, L.W., Morrison, T.G., 2001. Mutations in the fusion
peptide and adjacent heptad repeat inhibit folding or activity of the Newcastle disease virus fusion protein. Journal of virology 75, 7934-7943.
140
Page 156
[226] Bonomi, M., Gervasio, F.L., Tiana, G., Provasi, D., Broglia, R.A., Parrinello, M., 2007. Insight into the folding inhibition of the HIV-1 protease by a small peptide. Biophysical journal 93, 2813-2821.
[227] Broglia, R.A., Provasi, D., Vasile, F., Ottolina, G., Longhi, R., Tiana, G., 2006. A
folding inhibitor of the HIV-1 protease. Proteins 62, 928-933. [228] Schmidt, A.G., Yang, P.L., Harrison, S.C., 2010. Peptide inhibitors of flavivirus
entry derived from the E protein stem. Journal of virology 84, 12549-12554. [229] Wang, R.R., Yang, L.M., Wang, Y.H., Pang, W., Tam, S.C., Tien, P., Zheng, Y.T.,
2009. Sifuvirtide, a potent HIV fusion inhibitor peptide. Biochem Biophys Res Commun 382, 540-544.
[230] Bennett, B., Holz, R.C., 1997. EPR studies on the mono- and dicobalt(II)-
substituted forms of the aminopeptidase from Aeromonas proteolytica. Insight into the catalytic mechanism of dinuclear hydrolases. J Am Chem Soc 119, 1923-1933.
[231] Ye, Q.Z., Xie, S.X., Ma, Z.Q., Huang, M., Hanzlik, R.P., 2006. Structural basis of
catalysis by monometalated methionine aminopeptidase. P Natl Acad Sci USA 103, 9470-9475.
[232] Ye, O.Z., Xie, S.X., Huang, M., Huang, W.J., Lu, J.P., Ma, Z.Q., 2004.
Metalloform-selective inhibitors of Escherichia coli methionine aminopeptidase and X-ray structure of a Mn(II)-form enzyme complexed with an inhibitor. J Am Chem Soc 126, 13940-13941.
[233] Lowther, W.T., Orville, A.M., Madden, D.T., Lim, S.J., Rich, D.H., Matthews,
B.W., 1999. Escherichia coli methionine aminopeptidase: Implications of crystallographic analyses of the native, mutant, and inhibited enzymes for the mechanism of catalysis. Biochemistry-Us 38, 7678-7688.
[234] https://www.pymol.org/. [235] Zhang, T., Faraggi, E., Xue, B., Dunker, A.K., Uversky, V.N., Zhou, Y.Q., 2012.
SPINE-D: Accurate Prediction of Short and Long Disordered Regions by a Single Neural-Network Based Method. J Biomol Struct Dyn 29, 799-813.
[236] Yang, Y., Zhou, Y., 2008. Specific interactions for ab initio folding of protein
terminal regions with secondary structures. Proteins 72, 793-803. [237] Zhou, B.R., Feng, H.Q., Kato, H., Dai, L., Yang, Y.D., Zhou, Y.Q., Bai, Y.W.,
2013. Structural insights into the histone H1-nucleosome complex. P Natl Acad Sci USA 110, 19390-19395.
141
Page 157
[238] Altschul, S.F., Madden, T.L., Schaffer, A.A., Zhang, J., Zhang, Z., Miller, W., Lipman, D.J., 1997. Gapped BLAST and PSI-BLAST: a new generation of protein database search programs. Nucleic Acids Res 25, 3389-3402.
[239] Takahashi, K., Noguti, T., Hojo, H., Yamauchi, K., Kinoshita, M., Aimoto, S.,
Ohkubo, T., Go, M., 1999. A mini-protein designed by removing a module from barnase: molecular modeling and NMR measurements of the conformation. Protein Eng 12, 673-680.
[240] Khurana, R., Hate, A.T., Nath, U., Udgaonkar, J.B., 1995. pH dependence of the
stability of barstar to chemical and thermal denaturation. Protein Sci 4, 1133-1144. [241] Hu, X., Wang, H., Ke, H., Kuhlman, B., 2007. High-resolution design of a protein
loop. Proc Natl Acad Sci U S A 104, 17668-17673. [242] Leaver-Fay, A., Kuhlman, B., Snoeyink, J., 2005. Rotamer-pair energy
calculations using a trie data structure. Lect Notes Comput Sc 3692, 389-400. [243] Leaver-Fay, A., Kuhlman, B., Snoeyink, J., 2005. An adaptive dynamic
programming algorithm for the side chain placement problem. Pacific Symposium on Biocomputing 2005, 16-27.
[244] Leaver-Fay, A., Snoeyink, J., Kuhlman, B., 2008. On-the-fly rotamer pair energy
evaluation in protein design. Lect N Bioinformat 4983, 343-354. [245] Buckle, A.M., Schreiber, G., Fersht, A.R., 1994. Protein-protein recognition:
crystal structural analysis of a barnase-barstar complex at 2.0-A resolution. Biochemistry-Us 33, 8878-8889.
[246] Word, J.M., Lovell, S.C., Richardson, J.S., Richardson, D.C., 1999. Asparagine
and glutamine: Using hydrogen atom contacts in the choice of side-chain amide orientation. J Mol Biol 285, 1735-1747.
[247] Jucovic, M., Hartley, R.W., 1996. Protein-protein interaction: a genetic selection
for compensating mutations at the barnase-barstar interface. Proc Natl Acad Sci U S A 93, 2343-2347.
[248] Wootton, J.C., 1994. Nonglobular Domains in Protein Sequences - Automated
Segmentation Using Complexity-Measures. Comput Chem 18, 269-285. [249] McDonald, I.K., Thornton, J.M., 1994. Satisfying hydrogen bonding potential in
proteins. J Mol Biol 238, 777-793. [250] Li, W., Godzik, A., 2006. Cd-hit: a fast program for clustering and comparing
large sets of protein or nucleotide sequences. Bioinformatics 22, 1658-1659.
142
Page 158
[251] Li, W.Z., Jaroszewski, L., Godzik, A., 2002. Tolerating some redundancy significantly speeds up clustering of large protein databases. Bioinformatics 18, 77-82.
[252] Lins, L., Thomas, A., Brasseur, R., 2003. Analysis of accessible surface of
residues in proteins. Protein Science 12, 1406-1417.
143
Page 159
CURRICULUM VITAE
Zhixiu Li
EDUCATION
• 2009-2015 Indiana University, PhD in Bioinformatics, minor in Computer
Science
Dissertation: Computational protein design: assessment and applications
• 2005-2009 University of Science and Technology of China, Bachelor of Science
PROFESSIONAL EXPERIENCE
• Research Assistant, 2013-Present
Institute for Glycomics, Griffith University
• Research Assistant, 2009-2013
School of Informatics, Indiana University-Purdue University at Indianapolis
RESEARCH INTERESTS
• Computational Protein/Peptide drug/Vaccine design
• Codon/Expression Optimization
• Human Genetic Variations Classification
SKILLS
• Programming languages: C++, C, Perl, Python, R, Matlab, Shell, MySQL
• High-performance computing on Linux/Unix supercomputers and Beowulf Linux
clusters
HONORS
• Travel Scholarship for Grace Hopper Celebration of Women in Computing, 2012
• Third Prize of the Challenge Cup of USTC, 2009
Page 160
• Excellent Graduate Student Award, 2009
PEER-REVIEWED PUBLICATIONS
1. Cheng, H., Chan, W.S., Li, Z., Wang, D., Liu, S., Zhou, Y., 2011. Small open
reading frames: current prediction techniques and future prospect. Current protein
& peptide science 12, 503-507
2. Zhang, T., Faraggi, E., Li, Z., Zhou, Y., 2013. Intrinsically semi-disordered state
and its role in induced folding and protein aggregation. Cell biochemistry and
biophysics 67, 1193-1205
3. Li, Z., Yang, Y., Zhan, J., Dai, L., Zhou, Y., 2013. Energy functions in de novo
protein design: current challenges and future prospects. Annual review of
biophysics 42, 315-335.
4. Wang, J., Yang, Y., Cao, Z., Li, Z., Zhao, H., Zhou, Y., 2013. The role of
semidisorder in temperature adaptation of bacterial FlgM proteins. Biophysical
journal 105, 2598-2605.
5. Li, Z., Yang, Y., Faraggi, E., Zhan, J., Zhou, Y., 2014. Direct prediction of
profiles of sequences compatible with a protein structure by neural networks with
fragment-based local and energy-based nonlocal profiles. Proteins 82, 2565-2573.
6. Folkman, L., Yang, Y., Li, Z., Stantic, B., Sattar, A., Mort, M., Cooper, D.N., Liu,
Y., Zhou, Y., 2015. DDIG-in: detecting disease-causing genetic variations due to
frameshifting indels and nonsense mutations employing sequence and structural
properties at nucleotide and protein levels. Bioinformatics.