COMPUTER AIDED ARCHITECTURAL EVALUATION AND DESIGN - A COST MODELLING EXPERIMENT. ( Volume I) bY Tami A. BELHADJ Thesis submitted to the University of Sheffield for the Degree of Doctor of Philosophy in the Faculty of Architectrural Studies. Department of Architecture. July 1989
Transcript
COMPUTER AIDED ARCHITECTURAL EVALUATION ANDDESIGN
- A COST MODELLING EXPERIMENT.( Volume I)
bYTami A. BELHADJ
Thesis submitted to the University of Sheffield for the Degreeof Doctor of Philosophy in the Faculty of Architectrural Studies.
Department of Architecture.July 1989
Thesis title : COMPUTER AIDED ARCHITECTURAL EVALUATION AND DESIGN- A COST MODELLING EXPERIMENT.
Abstract Tami A. BELHADJ
This dissertation addresses the problem of Computer Aided
Architectural Evaluation and Design, with particular reference to
building cost evaluation and cost modelling. It identifies the lack of
building evaluation tools in the CAAD environment, and suggests an
integrated approach to building modelling and cost modelling. The
interaction of elemental and spatial descriptions of a design solution is
considered as an original contribution to the field of computer aidedbuilding modelling and evaluation. It demonstrates the potential of
CAAD and Bills of Quantities intergration to give an extra dimension
to cost modelling at early design stages.
Essentially, this reseach project advocates a larger overlap in the use of
computers for the generation and evaluation of design. It asserts that
any computer aided solution evaluation system must be able toconverse with the designer during the highly integrated iteration of
briefing, analysis, synthesis and evaluation stages of design. A working
example is produced after software specification and implementation,
to demonstrate to possibilites and/or limitations of such an approach.
To my Parents
Acknowledgements
My sincere gratitude is due to Pr B. R. Lawson, for his invaluableassistance during the corse of this research. He made extensive,precise and valuable criticisms throughout this project, and I havedone my best to act upon them. Much that is in this thesis hasbeen learned from him, though its interpretation and form isentirely my own responsibility.I also most appreciate the financial support provided by theAlgerian Ministry of Higher Education, without which it wouldhave been difficult for me to stay abroad and carry out thisresearch.
My colleagues, Joongseok Ryu, Barrie Bowden and Abu HasanIsmail, have considerably helped this project, by discussing manyof its ideas. I also wish to express my thanks to the softwaredevelopment team at GABLE CAAD system Ltd., as well as to thesupport staff of the Department of Architecture and MelvynBroady in particular.
Finally, I would like to thank my family and friends for theirendless support end encouragements.
i
TABLE OF 03NTENTS
VOLUME I
Abstract.Acknowledgement.
Chapter 1: INTRODUCTION. 1
PART A - THEORETICAL BACKGROUND. 6
Chapter 2: DESIGN OVERVIEW. 7
2.1 DESIGN IN ARCHITECTURE. 7
2.1.1 Architectural design. 7
2.1.2 Theory of design and methodology. 9
2.2 DESIGN AND INFORMATION PROCESSING. 14
2.2.1 Design and psychology. 14
2.2.2 Problem solving and information processing. 18
"Computers have come to stay; they are changing theworld whether we like it or not, and gradually they willfind their way into the offices of architects and theschools of architecture all over the world."(p 1).
Sudbo, B. (1988)
This quote was extracted from a report of an international forum held in
Zurich in 1987, on 'architectural education and the information explosion'.
It sets the background of the general feeling concerning computers
'overture' in architectural practice and education. There are several reasons
to support such a view. Some are related to developments in computers
technology, whereas others are associated with our understanding of the
computer's role in design.
Computing technology has achieved in the last two decades a tremendous
advance; for example processing speed and circuit density have increased by
order of magnitude. The software field has also progressed considerably,
with new software development tools, programming languages and
methodologies. This new powerful computing environment is packaged
and made available to individual users in the form of 'Personal
Computers', and to engineers or designers in the form of the new
generation of 'Graphical Workstations'.
During the same period, continuous research and development in the
computer aided design field, has enabled to harness this computer power,
and provide designers with new tools. Computer based design tools offer
significant advantages over traditional design practice. In fact, they allow to
perform design operations in ways that have never been possible before.
The broader concern of this thesis is to make the best possible use of
computers in architectural design. Not just by accelerating the processing of
1
design information, but by amplifying the intellectual abilities of the
designer. The process of architectural design since its first inception has
aimed at the production of 'good' buildings. The process itself, the teaching
of design, and the evaluation methods and criteria, are subject to change
and depend on the state-of-the-art in research and technology. Abstractions,
in Schmitt's (1987) terms, support both the generative and the analytical
phases of design. The concept of abstraction ( or modelling ) in architectural
design is historically linked to the level of complexity of the design product.
It involves the representation of existing structures and can be described as
an attempt to recreate reality. Developments in the field of computer
modelling, computer graphics, and more recently in cognitive psychology
and artificial intelligence provide the theoretical basis to build
fundamentally new tools to support the architectural design process, in
particular for design abstraction and evaluation. The first generation design
tools that have emerged from the early computer technology development
have mainly concentrated on model building for drawing production, with
the exception of few design evaluation systems. These were underpining
the graphic characteristics of traditional architectural representation, where
generally the abstraction hides most of the meaning of the drawing -not to
the designer, but to the computer. It is the ability of a computer aided design
system to 'understand' the implicit information contained in a drawing,
that gives it the 'competence' to support 'intelligent' modelling and
evaluation.
Among the large number of computer aided design tolls available to
designers, very few offer support for the evaluation of design. Nearly all
will assist in model visualisation for aesthetic examination, but there
capabilities for computer aided building evaluation remain very limited.
2
Whilst architects can now produce many views and drawings of their
designs, they can still do relatively little about evaluating the structural,
functional, environmental, and financial performances of their buildings. It
is the objective of this research to understand the reasons for such a
situation, and explain it. In the process of doing so, the review of computer
aided design developments is undertaken, and the theory behind it
investigated. The lack of building evaluation tools in the CAAD
environment is identified, and an attempt is made to explain as well as
suggest solutions for it.
As an example for the computerisation of building performance evaluation,
cost modelling was selected among different building design parameters.
After reviewing the historical developments of quantity surveyors use of
computers, this research project suggests an original approach to the
integration of CAAD and cost modelling. The elemental and spatial
description of a building computer model are combined to generate building
quantities, which are subsequently used for cost analysis and cost modelling.
The computer processing speed and the nature of the data processed, have
allow the performance of building cost evaluation in such a way that a
larger overlap may be expected between the synthesis and the evaluation
stages of design. From a design methodology point of view this last matter
can be considered as a significant contribution to the computer closer
'involvement' in the design process.
As far as the organisation of the thesis is concerned, it is physically divided
into two volumes; the first describes in general the work undertaken and
demonstrates it in use, whereas the second volume consists of a listing of
3
the program source code written during this research. In this first volume
the introduction describes the context in which the research project was
undertaken. It also defines which particular area, of the increasingly
growing field of Computer Aided Architectural Design, is examined.
Volume one is presented in four main parts; first of all, Part A consists of a
review of the theoretical background relevant to the understanding of the
current situation of CAAD research and development. For instance, Chapter
2 gives an overview of design theory and design methodology, with
particular emphasis on events sequence. It also reviews psychological work
on human thinking and its relevance to problem solving in design. On the
other hand, Chapter 3 outlines the historical development of computer
technology, and gives some details on the basic computing techniques
involved on computer aided design. Chapter 4 deals with the general issue
of using computers in architectural design, and addresses the question of
computer/designer interaction.
The next section is Part B, which consists of defining the problem, or in
other words describing the aims and objectives of the study. In its Chapter 5,
the importance of the evaluation stage of design is underlined, as well as its
centrality in the design process. This is done using Markus's model of
building modelling. Building cost evaluation is used as an example to
support the experimental study. In the same section Chapter 6 introduces
the notion of cost modelling in a CAAD environment. A brief historical
review is done of the use of computers in cost estimating and cost
modelling, and the suggested approach for the following software
development is outlined.
4
The main section of the thesis is Part C. It describes the software application
development involved in putting into practice the suggested approach to
integrated Cost Modelling and Computer Aided Architectural Design. In
Chapter 7, GABLE ( Graphical Aids for Building Layout and Evaluation )
system is described, and its building modelling system is explained using a
simple architectural model. A cost modelling experiment is done on that
building model, to illustrate the capabilities of the application.
Finally, Part D discusses very broadly the implications of the latest
developments in CAAD, and speculates on the potential effects these might
have on architectural design. The requirement for a system to link graphics,
words and numbers is explained, and its relevance justified.
The second Volume contains the appendices and program listings.
5
Chapter 2: DESIGN OVERVIEW.
2.1 DESIGN IN ARCHITECTURE.
" We could investigate the architect's contribution toarchitecture in several ways-by looking at what theyhave designed... ,or by looking at architect'sthemselves..."(p 1).
Broadbent, G (1973)
The word architecture can be directly associated with two things. Firstly the
product, or in other words the building, produced from the work of the
architect, and secondly the process of producing such architecture. It is very
difficult to envisage the study of architecture dissociating the product from
the process. Historians often have the crude task of criticising buildings
with little knowledge of the conditions in which they were designed.
Similarly, theorists tend to discuss design processes without having
experienced the use of buildings designed in that manner.
2.1.1 ARCHITECTURAL DESIGN.
Heath (1984) asks the question "What is architecture ?", and his answer
inevitably refers to both the activity of designing and the artifact. The close
relationship between product and process appears in early forms of
architecture, where the same person or group of people conceived, realised
and often used a building. Attempts were made to arrive at an
'anthropology' of architecture, Broadbent (1973) has enumerated four
distinct ways of generating three-dimensional form that he describes as
Pragmatic, Iconic, Analogic and Canonic, in chronological order of
application. He argues that this chronology implies an increasing
sophistication, with pragmatic design as the most primitive way of
designing and canonic as the most intellectual. A good example of the
7
'increasing sophistication' referred to by Broadbent, is the 15th century
Brunelleschi cathedral in Florence (Prager, F.. D. & Scaglia, G. 1970,
Mainstone, R. 1977), where the design of the building and especially the
dome were so innovative in terms of construction techniques, that no
builder could undertake the job merely relying on his own skills.
Consequently, the builders had to obey the architects instructions to
construct the sophisticated parts of the 'cupola'. This was, I believe, the start
of the separation of designing from making. It is worth noticing here that
Brunelleschi's ingenuity was helped by the use of scaled models at design
stage, we will come back to this point later in section 3.2.1..
The separation of designing from making was accentuated in western
industrial society, where the mass production of housing and other
elements of the built environment have increased the remoteness of
architects from builders and/or users (Lawson 1980). The teaching of
architecture has itself reinforced such separation, in fact, the history of
architectural education shows an increasing demand for abstraction and
'rationalism'. Bruno Zevi (1964) identifies three methods employed in the
education of architects.
The first called the 'bottega' method (which means 'office' in Italian), where
a master is selected and the teaching is done by working in his office. This
teaching method still perhaps exist in some schools where there are few
students and a great personality among the teachers, but the problem of
mass education does not allow this any more.
The second educational system is the Beaux-Arts, where the design teaching
is directed towards a 'style', probably many schools are still-run with this
method.
8
The last system of teaching architecture suggested by Bruno Zevi is the
'historical' -that is to say, scientific- method , which he sees as a Bauhaus
type of school with historical consciousness. Arguing this he says:
" ...the idea that art is something purely intuitive,irrational, something that has to do only withfeelings, is outdated. Art is a conscious act, a processwhich can be controlled and verified throughout."(p15).
He adds :
" ..., we should recognize that in the very few,exceptional works of art that are creative, there is aprocess that we can grasp and demonstrate andverify, just behind the lyrical or poetic aspect whichappears irrational."(p 16).
This type of statement is bound to lead us into philosophical discussions on
the difference between feeling and reason or art and science, which is not
really the object of this thesis. However, Bruno Zevi's point of view is clear,
and if creativity is purely a private process going on in the inaccessible
recesses of the mind, then it would be purely subjective, and consequently,
impossible to assess and educate (Best, D. 1985).
In conclusion, it is clear that architects are urged to be more explicit about
their design process. We have seen that the study of architecture involves
the combination of design process and design product, and that the growing
complexity of the man-made world has put designers away from builders .
Also that the education of the design itself is evolving, with more and more
attention given to the design process. The next section will investigate the
design methods and strategies of the generally accepted design theories.
2.1.2 THEORY OF DESIGN AND METHODOLOGY.
"...designing should not be confused with art, withscience, or with mathematics. It is a hybrid activitywhich depends, for its successful execution, upon a
9
proper blending of all three."(p 10).
Jones,J.C.(1970)
Architects have always been associated with artists because of their reliance
on drawings to represent designs. Another reason for relating architecture
to the arts is the sharing of intuitive design methods. Until recently
architects relied almost exclusively on a 'philosophy' of design based on
intuition. This consists of giving mystical explanations to design. Jones
(1970) described it as the "Black-box" method, where intuition is the only
guide through the design process. This of course promotes individualism,
which means it will probably persist in practice.
Certainly, there have been advocates for 'rational' design. In fact, since the
early nineteenth century, studies for classification of 'styles' were
undertaken to discover the principles by which to design architecture
(Viollet-le-Duc 1863). However, the theory of design had to wait for new
scientific developments made during the 1950's in the fields of cybernetics
(Gerardin, L. 1968) and information theory (Shannon, C.E. and Weaver, W.
1949) to put forward systematic design methods. Rittel (1972), an early
operation researcher, argues that social science in a state of 'crisis' has
turned to 'methods' to find a solution to its problems. He argues that it is by
borrowing from para-military, post Second World War project strategies,
like NASA programs in the USA, that design methodology got into civilian
applications. This consisted of applying a rational approach, based upon
system theory as a tool for reaching an optimum design solution ( Foque, R.
1982).
It obviously means that design is seen from a 'pragmatic' perspective, and
will rely considerably on scientific foundations. Yet, for a better
understanding of the borrowing made from science; systems theory
concepts and mathematical modelling will be looked at in Chapter 3. ,
10
Ilk t
The term 'design methodology' refers to the study of methods of designing,
it suggests that design as an activity may be the subject of scientific
investigation. This does not necessarily mean that design is exclusively a
scientific activity. Also, the term 'design methods' refers to the procedures
of the act of designing. According to the Design Methods Group (DMG),
design methods are :
"...step-by-step, teachable-learnable, repeatable andcommunicable procedures to aid the designer in thecourse of designing,"
(DMG,1978)
Most significant analysis of the design process suggests a separation of the
two crucial ingredients of design; logical analysis and creative thinking. The
articulation of these two activities is generally used to describe the design
process (Tovey, M. 1986).
The most popular design strategies among design methodologists (Cross, N.
1985) are the following
- Sequential design (Asimow, M. 1962)
- Holestic design (Jones, J.C. 1970).
- Convergent design [P-D-I] (March, L. 1976).
- Flexible design (Alexander, C. 1964).
- Divergent design (Halprin, L. 1969).
- Focused design (Archer, B.L. 1965).
It is generally accepted that the overall structure of the design process
include the three following steps
+Analysis -----0' Synthesis Evaluation
Figure 2.1 - The three stages design process.
11
These, in a cyclic process, should carry on until the identification of the
design problems, and subsequently the production of a solution.
In this respect, Markus (1967), has noted that there are two distinct
structures in designing; a 'vertical' one of the sequential phases, and a
'horizontal' one of iterative cyclic processes. The 'vertical' structure
attempts to regulate the development of a design, usually from outline to
detailed proposal. Whereas, the 'horizontal' structure is usually in the form
of a number of steps in a design process with frequent recycling over a
number of these steps. The core of these structure frequently consists of
four steps:- Analysis, Synthesis, Appraisal and Decision. A design process
may consist of hundreds, or may be thousands, of such sequences put
together in ways that are determined not by some abstract flowcharts but by
the nature of the design task itself (Markus 1967).
One of the major issues in the field of design methods is the 'direct'
participation of users in the decision making process of design. In this
respect it is believed (Broadbent 1979) that there are three generations of
design methods.
This is put very clearly by Nasar (1980), who argues that the first generation
methods of design broke problems into parts, analysed and solved the parts,
and recombined them into a synthesis solution. This way the solutions
evolved logically from an appropriate stating of the problem by the designer
or the 'expert methodologist', to the production of the 'best' solution. The
sequential design strategy (Asimow 1962) and the 'pattern language' design
method (Alexander 1964), can be considered as first generation methods.
The criticism of these methods is mainly in the assumption of stating
exhaustively the problem characteristics at the start of the design process,
whereas many requirements are likely to occur to the designer and user
12
during the synthesis stage (March 1976, Lawson 1980).
The second generation methods came partly as a response to the first.
Methodologists stepped down amongst the people and presented them with
means to plan for themselves. The medical faculty building of Louvain
University, built on the outskirts of Brussels in the early 70's (Kroll, L. 1975),
is one of the few buildings designed and built in that manner, but with little
success.
The reason for its failure is due, according to Broadbent (1979), to
participatory decision making having produced a building with technical
oversights making the product unacceptable to users. Relatively more
successful applications of this method were made in Third-World countries
where the economical frame work and the professional institutions are less
resistant to users participation to the design and construction process
(Hassan, F. 1973).
A third generation of design methods is identified by methodologists, this
one would incorporate both participatory decision making and the expert
designer or methodologist (Broadbent 1979).
A way in which this method might proceed is suggested by Nasar (1980).
The user might undertake a preliminary design using scale models. The
methodologist or professional designer might then describe adjacencies,
setting characteristics, and behavioural flows as portrayed in the model. On
the basis of that description the participants might revise the model to
improve certain connections or to correct some unforeseen behaviour
problems. Later, another expert might assess the cost implications of their
plan, and they might decide to revise the model. This method seeks
cooperative endeavours rather than isolated efforts. One of the objectives of
this research is to contribute in the achievement of such cooperation.
13
2.2 DESIGN AND INFORMATION PROCESSING.
2.2.1 DESIGN AND PSYCHOLOGY.
"...the world of design is the thought in the heads ofdesigners, plus the skills of designers inexternalising their thoughts;..."(p 3).
BUL, A. (1987)
A literature survey of the design theory (Jones, C.J. 1970, Hillier et al 1972,
reveals that designing is a specific form of human thought, of which the
study falls in the area of the psychology of thinking.
Historically a number of theoretical approaches have been taken to the topic
of thinking. The principle early approaches were those of introspectionism,
behaviourism, Gestalt theory and neo-behaviourism (Gilhooly, K.J. 1982).
Recently, the work in this field has been dominated by the information
processing approach. To put the current developments of the design theory
and design thinking in perspective, a brief historical overview of the above
approaches will be given.
ASSOCIATIONIST AND INTROSPECTIONISM.
Associationism prevailed toward the end of the nineteenth century. It is
described as a mechanistic type of doctrine using irreducible lawlike
relationships (Rowe 1987). It postulated that ideas took the form of elements
analogous to basic physical entities and that these elements were hooked
together to form thoughts or insights about problems. Associated with
models of atomic structure in the physical world and their law of contiguity,
to account for the association of elements of thoughts (Newell, Shaw and
Simon 1958). Such analysis was to be made by means of the classical
introspective report. The main reason for the decline of such methods was
that the question of thinking without images aroused considerable
1 4
controversy between the introspectionists (Gilhooly, K.J. 1982).
BEHAVIOURISM.
The behaviourist approach came as a reaction to the self observed mental
experiences of introspectionism. Watson, J.B. (1913), an early behaviourist
felt that introspection was a futile approach, he argued that;
"Psychology, as the behaviorist view it, is a purelyobjective, experimental branch of natural sciencewhich needs introspection as little as do the sciencesof chemistry and physics."( p 176).
At this point psychology discards all references to consciousness, and is
defined in terms of 'Stimulus-Response'. This will advocate the 'black-
box' view of designing (Jones, J.C.1970). Behaviourism claims that
behaviour should be the sole subject matter of psychology, and only by
studying what people do -their behaviour- is an objective science of
psychology possible (Atkinson, R.C., Atkinson, E.R. and Hilgard, E.R. 1953).
This definition helped shape the course of psychology during the first half
of this century, until the Gestalt theory.
GESTALT.
A contrasting view was put forward by the Gestalt psychologists who
objected to the different forms of 'elementarism' presented by the classical
introspectionist and the early behaviourist (Gilhooly, K.J. 1982). According
to Kohler, W. (1947), it is absolutely impossible to develop psychology as a
science using experiment alone, if the processes underlying experience are
merely a dynamic province of a much larger functional whole. Illustrating
the notion of whole, He argues ;
'No-body can understand a game of chess throughwatching only the moves in one corner of theboard.'(p 248).
15
The word 'Gestalt' has no exact English translation -from German- though
"form", "configuration" or "pattern" come close. It emphasizes that the
whole affects the way in which the parts are perceived. For this reason, it is
sometimes said that 'The whole is different from the sum of its parts', a
favourite principle of Gestalt psychologists (Atkinson, R.C., Atkinson, E.R.
and Hilgard, E.R. 1953). In dealing with thinking and problem solving, the
Gestalt theorists emphasised the way in which the problem was perceived
as a determining factor in the task difficulty. The solving process was
described as one of perceptual restructuring in which the problem comes to
be seen in such a way that the solution is obvious. However, the Gestalt
explanations did not get transported to many fields of psychology apart
from visual perception. This gave the way to a behaviourist counter-
reformulation.
NEO-BEHAVIOURISM.
The neo-behaviourists, incorporated some of the Gestalt findings into their
theory (Koestler, A. 1964). They suggested that richer internal processes
have to be postulated within the behaviourist theory. This allowed for the
concept of directed thinking (Gilhooly, K.J. 1982). However, by the time this
work developed, the information processing theory that still dominates
cognitive* psychology had begun.
INFORMATION PROCESSING THEORY.
According to Gilhooly (1982) the main stimulus for the development of the
information processing approach to thinking was the arrival of the
computer.
cognition* = is the mental process of perception, memory and information processing by whichthe individual acquires information, makes plans, and solve problems.
16
He believes that this approach takes the 'computer' as its key metaphor for
the mind. The basic idea being that, in his cognitive aspects, man can be
regarded as a computer-like system that codes, stores and transforms
information. This is very often the caricature made of the influence of
information theory on the psychology of thinking. A more accurate picture
should include developments made in the information measurement and
communication engineering fields (see Shannon, C.E. and Weaver, W.
1949, Garner, RW. 1962).
Newell, Shaw and Simon (1958) have described a theory of human problem
solving behaviour in terms of what they call 'information processes', which
they believe can have applications in the theories of learning, of perception,
and of concept formulation. In this respect they say:
"The real importance of the digital computer for thetheory of higher mental processes lies not merely inallowing us to realize such processes "in the metal"and out side the brain, but in providing us with amuch more profound idea than we have hitherto hadof the characteristics a mechanism must possess if itis to carry out complex information-processingtasks."(p 163).
Both, the mapping of traditional design processes on the computer, and the
exploration of design mechanisms will be investigated in respectively
Chapter 3 and 4.
It must be said at this point that the evolution of our understanding of
intellectual processes described above is proper to a group of countries
sharing the same language and/or intellectual background. Different groups
of countries mainly French speaking and Russian speaking have had
different approaches to the study of thinking, which interestingly enough
has shown some remarkable parallels and convergences with the work of
the English speaking psychologists (Berlyne, D.E. 1965).
17
2.2.2 PROBLEM SOLVING AND INFORMATION PROCESSING.
" A problem arises when a living creature has a goalbut does not know how this goal is to be reached."(p1).
Duncker, K.(1945)
Problem solving and logical reasoning have been given more attention
than undirected thinking or 'daydreaming'. This is perhaps because directed
thinking is technically easier to investigate. Psychologists have described a
theory of information processing for problem solving (Newell and Simon
1972), which sees thinking as a hierarchical organisation of elementary
processes carried out one at a time. It introduces the concept of 'task
environment' or in other words 'design situation', which is admittedly
impossible to describe in advance, because in architecture it is very complex
and continuously changing. The 'problem-space' is the internal
representation of the designer task environment, and is searched by the
problem solver (i.e. designer) using three methods : recognition, generate-
and-test and heuristic search.
Recognition is the basic procedure of unselfconscious design; the problem is
reduces to a point at which a known procedure is applied (Heath, T. 1984).
The generate-and-test approach is a variant of 'trial-and-error', were the
results of tests are explicitly used to guide subsequent attempts to generate
solutions (Rowe, P.G. 1987). The heuristic is any procedure, or device that
contributes to reduce in the search for a satisfactory solution, also referred to
as 'rule of thumb' (Perkins, P.N. 1981).
There have been several attempts to apply Newell and Simon theory to
architectural design. Pfefferkorn's (1975) experimental work on the Design
Problem Solver is an example of such borrowing. More recently Akin (1986)
18
describes a Design Information-Processing System (DIPS) which he sees
operating on two environmental sources of information: the first studying
the problem and the second developing the solution, respectively 'receptor'
and 'effector'. Three modules characterize the DIPS, one is what Akin calls
'external representations', which combines knowledge acquisition and
information representation of the real world ( Receptors + Effectors). The
second is a combination of 'design processes' or 'Processors' in Newell and
Simon terms, these consist of tests and operations chained to each other by
links that simply indicate the passage of control. The last one is the
'organisation of memory', and this is done by using three basic methods of
search : recognition; generate-and-test and heuristic search. Akin being
obviously very close to the Carnegie-Mellon group of information
processing theorists, has drawn heavily from this theory in developing his
model of the design process.
The theory of information processing is itself under criticism from
psychologists rejecting its serial assumption, as it clashes with the parallel
thought processes view of thinking which believes that undirected thinking
is sometimes concerned with anticipating future problems (Gilhooly, K.J.
1982). In a new speculative thinking about the working of the mind, Robert
Ornstein (1987) reveals the human mind as a hybrid system composed of
many 'small minds' that work on their own and even conflict,
The design process is certainly not sequential as resent research in cognitive
strategies in architectural design have shown (Lawson 1979). This means
that the applicability of Newell and Simon information processor to
architectural design remain to be proved.
More recently, design is seen as a procedure in which an emphasis is made
19
on the identification of whatever will allow the generation of a solution
conjecture of the design problem at the earliest possible stage of the design
process, in other words before the problem has been fully analysed and
understood. The design conjecture in the form of undetailed design concept
is used to give direction to the analytical thinking, which will either
simultaneously or subsequently propel the development of the design
proposal (Tovey, M. 1986).
(1)2.2.3 UNDERSTANDING DESIGN.
"Attempts have been made to break the designprocess down into a chain of activities. This has notbeen too successful in determining how we work, buthas instead given rise to many ideas about how wemight or even should work."(p 87).
Lawson, B.R. (1970)
The relevance of cognitive psychology to the understanding of design is not
questionable. It certainly gives an insight about the human mental inner-
processes during the design activity. Using this approach, Hillier et al (1972)
have produced a view of design about which they argue :
"...design problems are essentially pre-structuredboth by constraints and by the designer's owncognitive map ..."(p 29-3-1).
The design solutions (or 'conjectures'), pre-existing in the designer's
cognitive capabilities, are seen as to be originating from
" ..- Knowledge of the instrumental sets, solutiontypes and informal codes, and occasionally fromright out side - an analogy perhaps, or metaphor, orsimply what is called inspiration." (p 29-3-10).
In this situation, the purpose of design analysis is primarily, to test
conjectures, or in other words, evaluate solutions.
20
Supporting this last point, Lawson (1972 and 1979), investigating cognitive
strategies in architectural design, reinforces the conjecture-evaluation view
of design. He studied strategies used in two-dimensional spatial layout
problem-solving by architecture students and science students. In
comparing their strategies, he found that whereas the science base students
tended to search for underlying rules (analysis) and then proposed a
solution which satisfied the rules (synthesis), the architecture students
proceeded by trying alternative configurations (conjectures) and then testing
whether they complied with the rules (evaluation). These are respectively
described as problem-focused strategy, and solution focused strategy ( Lera,
S.G. 1981).
This approach of design understanding unveils the large overlapping that
exists between the analysis, synthesis and evaluation stages of design. As
against the information processing approach described in section 2.2.1, that
presented design as a linear, sequential and repetitive succession of events.
The cognitive approach suggest that the analysis and synthesis stages take
place almost simultaneously, with design evaluation going on in parallel,
and taking part in the generative process. This view of design is going to be
used as a frame work for this thesis, and will be further explained in
Chapter 5.
Having said that, it does not mean that design is fully understood. In fact,
there is still much to explain about design
- How undirected thinking influences design ?
- What guides the production of design conjectures ?
- How design gets evaluated ?
- etc...
These questions could be answered by different approaches to the research
21
of design :
1- Interview designers (Darke, J. 1979).
2- Observe what designers do (Lera, S. 1982, Hodde, A. 1988).
3- Construct artificial experiments under controlled conditions (Lawson
1972).
4- Think about design.
More recently, the development of computer aided architectural design
systems has encouraged the investigation of design methods. It also
required the development of mathematical models, which will be described
in the next chapter. This type of work could be considered as a way to
improve our understanding of design, and offers new means to
comprehend designers decision making processes.
5- Develop and use computer based design aides.
Although it is suggested by Lawson (1980) that it might not be a good idea to
try to fully understand design;
"Perhaps we should hope never fully to understandthe way designers think, for it is exactly because thedesigner does not know what he will think nextwhich makes design such a challenging andsatisfying occupation..."(p 202).
Nonetheless, there are some good reasons to pursue research work for a
better understanding of design mechanisms. Firstly, to improve education
of design by, for example, describing design methods that have produced
'good' or 'bad' solutions. Secondly, to help designers justify their design
decisions to other members of the design team, or to the clients and/or
users. Thirdly, to enable the identification and location of design errors, this
is to prevent mistakes being repeated. Finally, use the observations to help
guide the specification of computer aides for architectural design, the ones
22
destinated to aid the 'architect', not the 'draftsman'. In the next chapters,
this last point will be further explained.
(1) I am deeply indebted to Pr B.R. Lawson for enlighting discussions on thesubject of this section, of which some ideas were suggested by him. Needless tosay, he is not responsible for my conclusion.
Chapter 3: COMPUTER SIMULATION AND MODELLING.
3.1 COMPUTERS TECHNOLOGICAL FUNDATIONS.
"Roughly speaking those who work in connectionwith the ACE (Automatic Computing Engine) will dedivided into its masters and its servants. Its masterswill plan out instruction tables for it, thinking updeeper and deeper ways of using it. Its servantswill feed it with card as it calls for them. ... As timegoes on the calculator itself will take over thefunctions both of masters and servants. Theservants will be replaced by mechanical andelectrical limbs and sense organs... The masters areliable to get replaced because as soon as anytechnique becomes at all stereotyped it becomespossible to device a system of instruction tablewhich will enable the electronic computer to do itfor itself. It may happen however that masterswill refuse to do this. They may be unwilling to lettheir jobs be stolen from then in this way. In thatcase they would surround the whole of their workwith mystery and make excuses, couched in wellchosen gibberish, wherever any dangeroussuggestions were made. I think that a reaction ofthis kind is a very real danger. This topic naturallyleads to the question as to how far it is possible inprinciple for a computing machine to simulatehuman activities."(p 20-21).
TURING, A.M. (1947)
There are different approaches to making computing machines. One of
these, the analogue computer, is now outdated and no longer used. When
we talk about computers here we are looking at a particular restricted class
of machines - the stored program digital computer. These are the type of
machines that have been commonly available since the 1950s, namely
'digital computers'.
3.1.1 Computers historical development.
The original 'concept' of the digital computer can reasonably be attributed to
two cybernetics pioneers; John Von Neumann and Alan M. Turing. They
24
both, in separate reports, agreed on the description of a device that would
have to carry out four basic functions: INPUT, to take in data and
instructions; MEMORY, to keep track of the data; PROCESSING, to do the
actual computing; and OUTPUT, to report the answer back to the human
user ( Michie, D. 1980, Reid, T.R. 1985). Their work would have been
impossible without the mathematical foundation provided by the English
philosopher and mathematician George Boole. In the mid 19th century,
Boolean algebra showed how logical problems could be expressed in
symbols. These symbols could then be manipulated without destroying the
sense of the original problem, provided that all the factors involved in the
problem could be expressed by variables that have only two states which
Boole called "true" or "false". It is, in what is considered the most
influential scientific text of our time 'Principia mathematica '(1910-1913),
that Whitehead, A.N. and Russel, B. argued that logic is not only
inseparable from mathematics but is also the foundation of it. This work
developed also a propositional calculus in which problems could be solved
in terms of a series of statements that are either 'true' or 'false'.
The construction of the first general purpose computing machine is
attributed to Vannevar Buch in the 1930s (Evans, C. 1981). As against the
special purpose calculating machines like Pascal's 'Pascaline ' that was
exclusively mechanical -in 1644 the first significant calculating machine,
followed by Charles Babbage 'Analytical Engine' in 1833. Bush, introduced
thermionic tubes or valves as a remedy to the slow speed operation,
imperfect tolerance, and the difficulty of switching to solve one type of
problem rather than another on the mechanical differential analyser at the
Massachusetts Insitute of Technology. Working at the same Institute,
Shannon (1938) demonstrated that it was possible to perform complex
mathematical operations by means of relay circuits. Those had only two
25
possible states; "on" or "off", which could completely emulate Boolean
logic. It is generally accepted that the technological development of
computers has evolved through successive hardware performance
improvements, with the principle of binary switching remaining the same.
Each of these advances has marked the start of a new computer generation.
- First generation computers:
The first general purpose machines (programmable), had their mechanical
components replaced with valves in which the values were stored as
voltages. The valves were large and unreliable, and consumed an
enormous amount of power, which, of course, they also discharged in heat.
Consequently, they had to be spaced widely apart and supplied with coolers,
making them enormous in size (Evans, C. 1981). The second World War
was the main stimulus to develop such machines; Alan Turing with a
group British and Polish mathematicians gave the Allies an invaluable step
up by cracking the Germans' "Enigma" military code using a real-life
variation of the abstract 'Turing Machine' (Hodges, A. 1983). Cryptography,
has since been one of favourite applications of computers number
crunching power.
- Second generation computers:
The invention of the transistor by three Bell laboratories engineers in 1947
promised to eliminate all the bugs of the vacuum tube. The transistor
achieved amplification and rapid on-off switching by moving electronic
charges along controlled paths inside a solid block of semiconductor
material (Reid, T.R. 1985). Not only the transistor is smaller then the valve
but much less energy consuming, this resulting in much smaller and much
more reliable component.
26
- Third generation computers:
The improvement in the computer components in the 1960s continued
with the introduction of integrated circuits, this marking the start of the
third generation of computers. Then, many transistors and their connecting
wiring could be built on one circuit or microschip. It not only contributed to
further reduce the size of computers but also made their cost more
accessible to large government bodies, as well as research and education
establishments. It is during this period that high level languages like Algol
and Fortran became commonly used. These, encouraged scientists to
implement computer applications in various engineering fields.
During the same period, important research was done in computer
interactive graphic, producing work like Sutherland's (1963) publication on
the 'Sketchpad'.
- Fourth generation computers:
Very large scale integration (VLSI) circuits appeared in the 1970s. These are
basically extremely small circuit boards where transistors were replaced by
layers of semiconductors like silicon. This marked the start of the
proliferation of microcomputer systems.
Myers, G.J. (1978) argues, that the construction of physical computing
devices has advanced significantly; for example, circuits speeds and
densities have increased by orders of magnitude, new storage technologies
have been invented, and the microprogramming concept has been
exploited. The software field has advanced tremendously; for instance, there
are now better tools, methodologies, and programming languages, software
applications are more and more sophisticated, new algorithms have been
invented, and the construction of such programs as operating systems and
27
compilers are fairly well understood.
However, there have been almost no advances at the hardware/software
interface, the level of a system referred to as the computer architecture. This
is perhaps not totally true ( or not any more ), because we have seen very
recently parallel processing machines ( Transputers ) coming out of research
laboratories and showing great promise as the next step from Von
Neumann computers architecture (Walker, P. 1985). At a more
experimental level connectionist machines ( Neural Networks ) are
becoming a realistic alternative. They were introduced to model neural
electrical activity, based on concepts derived from an analogy with the
human central nervous system (Denker, J.S. 1986). Projects like these, have
started off the long awaited next computer generation.
- Fifth generation computers.
The challenge to revolutionise computer hardware and software was taken
by Japan in April 1982, when the Institute for New Generation Computer
Technology (ICOT) was founded. It was a major and impressive national
plan of the Ministry of International Trade and Industry (MITI), called 'Fifth
Generation Computer Systems'. Moto-oka et al (1982) anticipated the
emergence of knowledge base systems (KBS) and Expert Systems as the key
development areas of the new computer generation. In response to the
Japanese challenge, Britain started an advanced information technology
program, known as the 'Alvey Program' (Feigenbaum, E.A. & McCorduck,
P. 1984). This one included a project directly related to the construction
industry, which consisted of an Expert System for building cost
management ( It will be briefly described in section 8.2.1.).
Basically, the fifth generation computers function is not information
28
processing, in the conventional sense, but 'knowledge processing'.
Intelligent Knowledge-Based Systems (IKBS), are the central elements of
this new computer generation. They are based on systems that draw
reasoned conclusions from knowledge (inference processors). This requires
a radically different concept of the hardware/software design. Based on a
mutual interaction of algorithms, computer architecture and technology, it
consists of an assembly containing a knowledge based processor, an
inference processor and an intelligent user interface (Bishop, P. 1986).
In spite of the conceptual break with previous computer generations, it
would seem that the hardware of the fifth generation computers will still be
based on Very Large Scale Integration of semi-conductor components.
However, a very higher degree of parallelism will distinguish the new
computers architecture.
Thus, new programming languages are required to cope with the
innovative hardware, and the types of processing for knowledge base
management. Non-procedural languages like OCCAM, ADA, and LISP are
among the solutions. As well as declarative languages like PROLOG and
HOPE (Bishop, P. 1986).
The intelligent user interface of the fifth generation computers is expected
to reach the level of interaction between computer and user to something
approaching the intelligence inherent in inter personal communication.
Techniques of natural language recognition, speech synthesis and voice
recognition are some of the key instruments to achieve such computer/user
interaction. The current range of fourth generation computers user
interface is likely to move on to the next generation, namely Windows,
Icons, Mice, Pointers and Standards menus (WIMPS).
29
V
CPU Output
3.1.2 Hardware versus software.
The type of computers used during the course of this research were fourth
generation machines. Known as having a 'Van Neuman' type of
architecture (see Figure 3.1).
SecondarySt orage
A
LInput
Figure 3.1 - Generalised Computer System -
Three main components constitute these machines, hardware, firmware
and software:
- Hardware.
Data arrives to, and leaves the computer Central Processing Unit (CPU)
through the input/output (I/O) devices. These are hardware devices to
interface directly the CPU with the user. They cover a wide range of
capabilities and characteristic. Terminals, printers, plotters, scanners,
digitizers, voice synthetisers and voice recognition instruments are
different types of I/O devices. An input device is required to provide a
means to enter data and programs in the CPU, also an output device is
require to receive at least some of the results of the processing.
- Firmware.
Firmware is that aspect of the operation of the system which, together with
the hardware, defines the structure or shape of the computer system as seen
from the user's viewpoint. It is a sort of interface between the hardware
30
and the software of a machine, consisting of elementary sequences of
instructions to the CPU to be performed frequently and rapidly. Usually, it
takes the form of hardwired microprograms located in a Read Only Memory
(ROM). Although, recently, the use of various semiconductor electrically
erasable and reprogrammable read-only memories (EPROM) has brought
together both the high speed and ready reprogramability of microprograms
(Baywater, R.E.H. 1981). Firmware is often used in computer animation to
speed up graphic manipulations that use standard algorithms, and needs to
be performed at high speed for real time animations for example.
- Software.
Software is the name given to a program or a set of instructions for a
computer. There are two broad classes of software: applications software and
system software. An application program is set of computer instructions
whose purpose is to carry out a specific user's application, a well known
example of such program is a 'word processor'. Systems software ( also
called Operating System) refers to programs consisting of a set of
instructions whose purpose is oriented around either efficient handling of
an applications program or efficient utilisation of the computer system for
the benefit of its applications-oriented to the users. Thus, systems software
is of indirect, but critical, benefit to the users, whereas an application
program is of direct benefit to that same user (Murray, T.J. 1985).
3.2 MATHEMATICAL MODELLING.
3.2.1 Systems theory.
' A building functions the way it does because itsparts have certain attributes and because a givenset of relationships exist among them. If theseattributes and the way they are connected change,the function changes... It follows from these
31
considerations that effectively to approacharchitecture in functional terms involves treatingit as a system.'(p 14).
Handler, A.B. (1970)
The 'systems theory' is the emerging contemporary view of organised
complexity. It replaces the atomistic view of organised simplicity as seen by
the Newtonian science. Which viewed the physical universe as a
mechanistic aggregate of parts in isolable causal relations (Laszlo, E. 1972).
The systems view instead, treats systems as integrated wholes of their
subsidiary components. Neelamkavil, F. (1987) defines a system as
"...a set or assemblage of entities (elements orcomponents) interrelated to each other and thewhole so as to achieve a common goal."(p 17).
Systems can be classified as natural ( solar system ) or artificial ( computer
system ). Interrelationship or interdependence is the key word here.
Systematic models are intended to represent and interpret the real world, in
such a way that predictions can be made about its behaviour. A system is
composed of one or more sub-systems, and sub-systems consist of one or
more sub-systems, and so on. We come across several systems in our daily
life such as the postal system, water distribution system, tax system or
educational system. The systems relationship must achieve reasonable
consistency. Markus (1967) suggested that architecture could be seen as a
system comprising four sub-systems - the building system, the environment
system, the activity system and the objective system. The purpose of systems
study is to learn, to design, to change, to preserve, and if possible control the
behaviour of the system. Nevertheless, March (1974) points out potential
problems in dealing with systems. He argues that when studying a system as
if it were a set of elements with fairly strong relationships between them,
we may be overlooking a large number of weak relationships between
32
elements which may have more effect than a few strong ones. Systems can
be studied by direct experimentation, by building prototypes, or by building
mathematical/logical models. Experimentation with a prototype is often too
expensive, impractical, risky, or time-consuming, and will not be dealt with
in this thesis. It is interesting though to mention that scaled models suffer
from the deficiencies inherent in modelling at small scale the properties of
the full-size structures, and consequently suffer in accuracy if the physical
laws do not give exactly the same effect as in the full-size building for
example. Analogies and digital calculation demand an even more precise
knowledge of the physical laws, and the external conditions to be
Mathematical/logical modelling is central to the specification of computer
aided design systems and will be examined in the next section.
3.2.2 Mathematical models.
"... a class of architectural problems can, undersuitable conditions, be transformed into a class ofmathematical problems..."(p 42).
March, L. (1976)
Among symbolic models, the mathematical models are the most important
and widely used category of model (see Figure 3.2).
A mathematical model is a set of mathematical and logical relations
between various system elements. Being derived from 'modus ' (in Latin a
measure) the word 'model' implies a change of scale in its representation
(Aris, R. 1978).
33
ISYMBOL IC MODELS I
NON-M ATHEM AT IC AL
PHYSICAL MODELS MENTAL MODELS
1 M ATHEM AT IC AL
I
MODELS
Figure 3.2 - Types of models according to Neelamkavil (1987) p32.
Unquantifiable elements like attitude, values, etc., cannot be included in
mathematical models. The dynamic models are generally described by
differential equations, while algebraic equations characterise static
mathematical models.
Mayer (1970) in his analysis develops three categories of theoretical
modelling for architectural design
1. Formal mathematical modelling.
This is defined as the modelling of the relationship between interdependent
variables using mathematical expressions. Regression analysis techniques
are used to establish relationships between selected design parameters, and
then linear functions calculated. Mayer identifies three short comings to
this modelling method. First, selected relationships might not fully
represent the real world situation (this point was already made in section
3.2.1), and if they do, they do not necessarily have a linear relationship.
Second, there is a danger in extrapolating from past experiences statistical
data. Finally, a model using the relationships of previous solutions might
not promote innovative design. These arguments are not proper to
34
mathematical modelling for architectural design, but are general to
operational research methods.
2. Heuristic modelling.
Heuristic modelling in Markus' terms is to search for the 'best' alternative
out of an infinite range of possible solutions. This is in fact the method used
in early computer aided floor layout optimization research (Whithead, B.
and Eldars, M.Z. 1964). The 'heuristics' are the rules applied to limit the area
of search. Once selected, these take the form of algorithms, and according to
Shaviv (1987) when implemented . require too much computer time or
trivialize complex architectural problems.
3. Simulation modelling.
'Simulation' here is taken to mean the modelling of design solutions. By
modelling a variety of solutions, performance indices can be compared and
a satisfactory solution can be approached progressively, says Markus.
Parametric modifications of the model with relational integrity preserved,
are essential to undertake such modelling.
We shall come back to this categorisation of design modelling later in
chapter 4. However, it is interesting to point out that these modelling
methods ( each having a different design application ), if combined, would
cover most stages of the design process. Therefore, it seems that the
ultimate mathematical model for an integrated system should support the
following requirement. First, the definition of strong, as well as weak
relationships between elements. Second, allow each element to have
several attributes to apply heuristics with multi-variate problems search.
Finally, support both static and dynamic mathematical modelling.
35
3.2.3 Graph theory and connectivity.
" If something like a theory of architecture willever be developed, then one of its first chapterswill deal with the theory of cellconfigurations..."(p 179)
Rittel, H.(1970)
A growing interest in the theory of graphs has developed during the last
two decades, particularly among applied mathematicians and engineers.
This is because of its inherent simplicity, and its wide range of applications.
The first formal description of its principles was made by Euler, a Swiss
mathematician, in 1736 (Deo, N. 1974). He set himself the problem of
walking around the city of Konigsberg, where seven bridges join different
parts of it, and by starting from any point, crossing all the bridges, each only
once, to arrive back at the starting point ( see figure 3.3).
- Konigsberg bridge problem. - Euler's graph of the bridgeproblem.
Figure 3.3 - First graph application.
Euler proved that a solution for this problem does not exist, also that a
simple geometrical figure of points and lines could represent any kind of
relationships. By definition, a graph consists of a set of objects called vertices
, and another set, whose elements are called edges . Each edge is identified
with an unordered pair of vertices. The most common representation of a
graph is by means of a diagram, in which the vertices are represented as
points and each edge as a line segment joining its end vertices. Often this
36
2
1
6
43 5
- Floor plan. - Graph.
diagram itself is referred to as the 'graph'.
There is no doubt, that the theory of graphs has useful applications in
problems of architectural layout and planning (Levin, P.H. 1964). It has
often been used to represent the relation of adjacency between pairs of
rooms in the plan; that is to say whether rooms do or do not touch (see
Figure 3.4), abut, or share some length (may be surface) of wall in common
(Steadman, P 1976). By applying a special branch of mathematics, such as
graph theory, to architecture, we can use existing algorithms already
developed for other purposes. March and Steadman (1971) have previously
used Kirchoff's law (for electricity) to solve the problem of dimensioning
architectural plans. More recently, Roth and Hashimshony (1988) have used
'Max-flow Min-cut' algorithm for decomposing complex graphs, and to
turn non-planar graphs into planar ones.
Figure 3.4 - A space adjacency planar graph.
Less frequently, graphs have been used to represent adjacencies between
spaces in three dimensions (Teague, L.C. 1970).
Whereas, most work previously done, was motivated by a wish to solve
design circulation problems of large building plans, using computer
methods based on heuristic approaches, or exhaustive enumeration
approaches. We will not be concerned here with generating optimum plan
37
layouts, but with establishing the relationship of spaces in a computer
building model, and using this data for building design evaluation.
38
3.3 ALGORITHMS AND DATA STRUCTURES.
"Algorithms + Data Structures = Programs
Wirth, N. (1976)
Berztiss (1975) summarises three distinct phases in the process of solving a
problem using a digital computer. Firstly, a mathematical model of the
problem has to be found. Secondly, an algorithm has to be developed
within the mathematical model. Finally, a computer representation has to
be selected for the data on which the algorithm is to operate. The computer
representation of data is also called 'data structure', and any manipulation
of it operates under the control of 'algorithms'.
According to Eastman (1978), two approaches to Man-Machine collaboration
were initially envisaged in developing computer based design aids. These
were outlined by Coons (1963), and were based on a scenario developed
from the joint development of computer graphics and time-sharing
systems.
First, the automatic encoding of data from manual representational
methods was envisaged. This approach relies on pattern recognition
techniques and systematic analysis, the complexity of syntax drawings and
design information interpretation are central to the slow progress of this
method (Klinger, A., Fu, K.S. and Kunii, T.L. 1977).
The second approach relies on an essentially machine readable encoding of
design information. In other words, the computer defines the syntax by
which communication takes place. It is the actual computer language 'data
types' that will define the abstract entities.
Ultimately, a merger of these two approaches should take place when the
translation between drawings and machine readable formats improves ( eg:
Scanner technology ).
39
CAD
The current development of Computer based design aids falls in the second
category of Man-Machine design collaboration, of which the
communication syntax is represented in the computer by the geometrical
algorithms and data structures to which the next section is to be devoted
(see Figure 3.5).
COMPUTER GRAPH ICS
DATA PROCESSING
DRAWING PRODUCTION
110DEL VISUALISATION
SIMULATION/ANIMATION
ANALYSIS/EVALUATION
Figure 3.5 - CAD development overview.
CAD is an acronym, some times used for 'Computer Aided Design', and at
others for 'Computer Aided Drawing', or even 'Computer Aided Drafting'.
Unless specified, it is the first meaning that will be used during the rest of
this thesis.
3.3.1 Algorithms.
The definition given to an algorithm by Kronsjo (1979) is the following:
" A procedure consisting of a finite set ofunambiguous rules which specify a finite sequence ofoperations that provides the solution to a problem orto a specific class of problems... "(p 1).
More briefly, the Concise Oxford Dictionary defines an algorithm as a
"process or rules for (esp. machine) calculation". The word 'algorithm' it
self comes from the name of a 9th century Arab mathematician 'Al-
Khwarismi' who described how to perform the four arithmetic operations
40
//Processing operation
Input/Output
Decision point
Instruction which modifyprogram sequence
in the decimal number system. The notion of an algorithm has been
extended quite recently, and denotes nowadays a set of rules which specify a
sequence of actions to be taken for solving a problem (Marciszewski, W.
1981). Very often, an analogy is drawn between algorithms and computer
programming, where a computer is made to to work through a set of
procedures (i.e.: an algorithm), to achieve a desired result.
It is usually in the planning phase of writing a computer program that
algorithms are used, in which case it is very common to use a flowchart as
an aid in analysing what the program is to do. The flowchart is purely an
aid to the programmer in visualizing the program steps : it traces out the
algorithm, or the general shape of the solution of the problem. As such, it is
part of the program documentation (see Figure 3.6).
(-----) Start/End operation
Keying operation
paper document
Ca on-line storage
Connection pointin flowchart
Figure 3.6 - Conventional symbols used in flowcharts.
3.3.2 Geometrical data structures.
There are at least three approaches to the design of a CAD system; the two-
dimensional drafting system approach, the two-and-a-half-dimensional
system, and the three-dimensional modelling system approach. The first
creates and manages basic geometrical primitives. The manual sketching
TY .
41
Lines- -
and drawing of lines and arcs on paper is replaced by similar operations on
a Visual Display Unit (VDU) or Sketchpad. It is only two-dimenslong
geometry that is supported at this stage. The second creates a three
dimensional model, but the views of the model are limited to a few
orthogonal projections. The last approach creates an analog model of a
desired three-dimensional object, and stores it as geometric data, attributes,
and relationships. This approach can be used for both visualizing a real-
world object and generating traditional production drawings.
- Two dimensional system data structures (2D):
Computer aided drafting systems store drawing information as a collection
of images, items, or objects. These terms refer to the same elements.
Unfortunately, there is no standard terminology. Each image corresponds to
a primitive data structure that contains all of the information necessary to
fully describe each individual image.
Text
Markers Arcs
ID 0 0,.... 0 G 00El ® _—______„„
Polygons Curves & Splines...-xw 12345 -,
6 6789E$7,^8c@-a-- - ABCDE=+})
INVERT
1113AM I Tfl3UH I
A°c 1\1---/-1-1 C-----.0
Figure 3.7 - Two dimensional graphical primitives.
The input of drawings is done through a 'graphic editor'. It is the
equivalent of a word processor, but, instead of manipulating alpha-
numerical information, it allows for the input and manipulation of
42
LINES
From To
POINTSX Y
1 1 .5 4
2 3 4 4.5
3 4 3.5 1 .5
4 1 1 1
graphical elements such as lines, circles, regular or non-regular shapes and
so on. Most common drawing primitives encountered in two dimensional
CAD systems are shown in Figure 3.7.
Each of these graphics primitives is defined with geometric information
represented in a Cartesian system, were points are defined by x and y
coordinates (see Figure 3.8).
Figure 3.8 - Graphical input of a shape and data storage.
In addition, each primitive has data attributes to describe how it is drawn or
visualised. Lines and curves will have a colour, line-style, and width
parameter to be used by the display and output device to render the
graphics.
The Graphical Kernel System (GKS) was developed with the objective of
easing the production and manipulation of pictures, in a way that does not
depend on the computer or graphical device used (Hopgood, F., Duce, D.,
Gallop, J. & Sutcliffe, D.C. 1983) . It supports four main primitives :
(1) - Polyline : Draws a sequence of connected line segments.
(2) - Polymarker : Marks a sequence of points with the same symbol.
(3) - Fill area : Displays a specific area.
43
(4) - Text : Draws a string of characters.
With these geometrical primitives all kind of modelling may be performed.
The usual 'Euclidean Transformations' are scaling, rotation, translation
and reflection. This may be accomplished by the use of two-dimensional
transformation matrices, on which a wealth of literature is now available
for computer graphics software programmers ( Newman, M.N. & Sproull,
R.F. 1981; Bowyer, A. & Woodwark, J. 1983; Foley, J.D & Van Dam, A. 1984).
To facilitate the transfer of graphical data between computers, the IGES
(Internal Graphics Exchange Specification) was developed and emerged as
the likely standard of moving data from one CAD system to an other
(Mayer, R.J. !987).
- Two-and-a-half-dimensional modelling data structures (2.5D):
This approach is also called the 'box geometry' method. It basically consists
of building a graphical description by the input of a number of related
views. Each view being an orthogonal projection or section of the model.
The attraction of such a method is that it is relatively simple to draw each of
the views as a two-dimensional drawing. However, it is not a completely
unambiguous description of a solid object. Perhaps a a not too significant
limitation for some building designs, but certainly not the best way to
observe and explore spatial conflicts in a multi-level and non-orthogonal
design.
The data structure of two-and-a-half-dimensional modelling is a mixture of
two-dimensional and three-dimensional modelling data structures.
- Three dimensional modelling data structures (3D):
First of all, we should make clear the difference between three-dimensional
44
Cu bold
Face A
Face B
Edge Edge
1,2 2,3
AVertex Vertex Vertex Vertex Vertex
1
2 3 4 1
Edge
1 ,5
surface modelling and three dimensional solid modelling. Both help
visualise real world objects and provide extensive mathematical
information for engineers and designers, but the two modelling types
involve different mathematical foundations, different terminology, and
present solutions to different design problems (Lyons, E. 1988).
Surface modellers represent objects as a series of surface entities, and result
in models that approximate the appearance of physical objects. They
provide information only about the skin of the object. On the other hand,
solid modellers aim to create models that provide numerical information
on real world objects. This is to be used to measure volume, determine
mass, find centre of gravity, and examine all sorts of physical properties for
design and engineering purposes. They provide information about both the
exterior and interior structures of a solid. The difference between surface
and solid modelers is in their notion of spatial relationship and location.
Whereas a solid modeler can determine whether a point is inside, outside
or on the surface of a solid. A surface modeller can only keep track of
whether a point is on or off a surface (Lyons, E. 1988).
Figure 3.9 - Hierarchical model representing polyhedral computer shapes.
Architectural design CAD applications have mainly used surface modelling
45
techniques for three dimensional building modelling (see Figure 3.9).
Recently, there have been advocates of solid modelling for architectural
design (Mitchell, W.J. 1986, Lyons, E. 1988), they promise to revolutionise
CAD by providing a unified database for a complete building description,
which could be used for automatic generation of drawings, and as a basis for
various analyses. This does have the limitation to assume that the same
drawings are used for both design and construction, which is not the case in
architecture. Eastman, C. (1987), warns that this is inherently incompatible
with architectural drawings and practice.
Taking the argument further, it can be said that architecture is as much
concerned with voids as it is with solids, and the ultimate CAAD system
should incorporate both void modelling as well as solid modelling.
Incidentally, Yessios, C.I. (1987) suggests a computational method of 'void
architectural modelling', which uses space enclosures as the primitive
elements in architectural composition. It aims to address the deficiencies of
solid modelling when applied to architectural design.
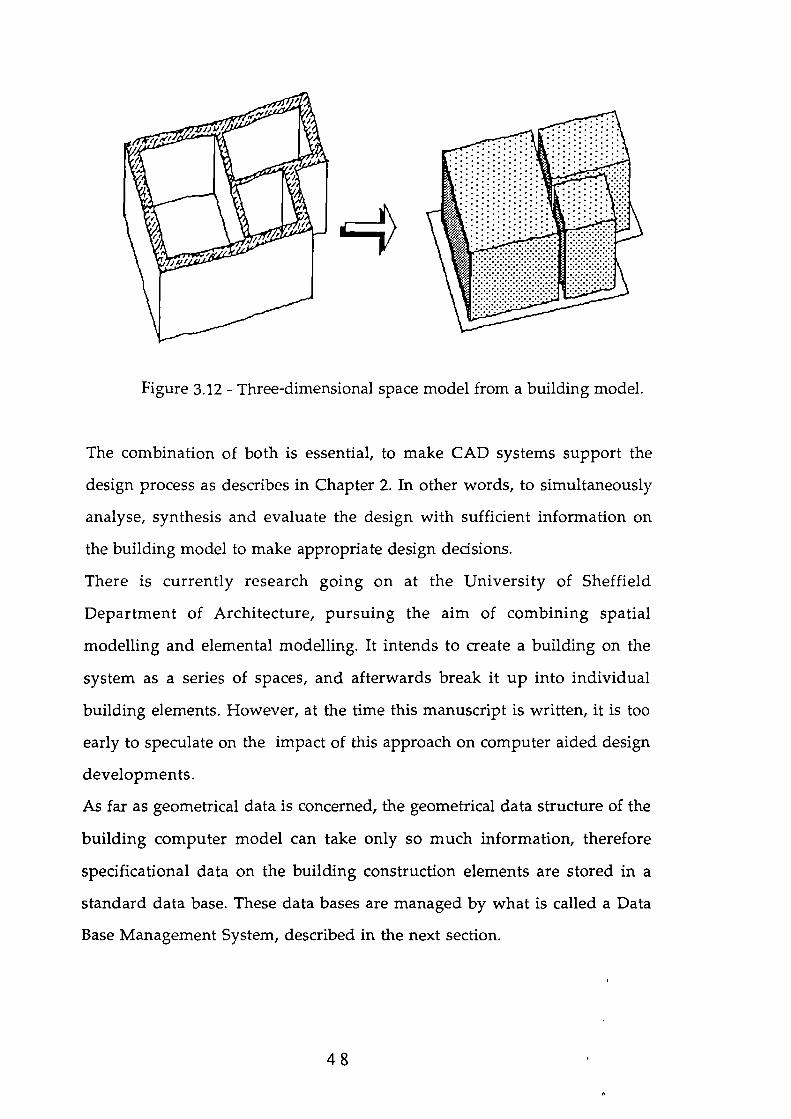
It might be useful at this point to explain how in principle the modelling of
buildings is approached in different computer aided architectural design
systems. There is first the approach that bases the construction of the
computer building model on the input of 'space outlines'. The designer
needs to have a clear idea of the geometry of each individual space of the
building design. In a very simplified manner it means that the input
consists of laying down all the spaces of a particular floor, by drawing in
plan the space outline of each space. The system then asks for the height
and thickness of internal and external walls, to then build a three-
dimensional model of the building (see Figure 3.10). This approach was
used by the ABACUS Unit of the University of Strathclyde, in the GOAL
building modelling system (Sussock, H. 1982).
46
- User Input - Computer model
Figure 3.10 - The ABACUS approach to generate building models.
- User Input - Computer model
The second approach consists of defining in advance the building materials
that are going to be used ( i.e.: walls constructions, windows and doors), and
then use those to describe the building plan. The system in this case will
interpret the information to generate a three-dimensional space model
(Figure 3.11 & 3.12). This method is for instance used by GABLE CAD
system, which will be described in some details later in Chapter 7.
Figure 3.11 - The GABLE approach to building modelling.
The two approaches are complementary, the first one suits sketch layout
design for space manipulation at an early stage of the design process.
Whereas the second one is more appropriate for designs that are not so
much concerned with the organisation of spaces (or rooms) in the first
place, but want to produce accurate design drawings.
47
Figure 3.12 - Three-dimensional space model from a building model.
The combination of both is essential, to make CAD systems support the
design process as describes in Chapter 2. In other words, to simultaneously
analyse, synthesis and evaluate the design with sufficient information on
the building model to make appropriate design decisions.
There is currently research going on at the University of Sheffield
Department of Architecture, pursuing the aim of combining spatial
modelling and elemental modelling. It intends to create a building on the
system as a series of spaces, and afterwards break it up into individual
building elements. However, at the time this manuscript is written, it is too
early to speculate on the impact of this approach on computer aided design
developments.
As far as geometrical data is concerned, the geometrical data structure of the
building computer model can take only so much information, therefore
specificational data on the building construction elements are stored in a
standard data base. These data bases are managed by what is called a Data
Base Management System, described in the next section.
4 8
3.3.3 Data Base Management Systems.
Whereas commercial CAD systems are depicted in terms of their geometric
capabilities and their applications, very little is revealed about their data
structures. Those are so jealously guarded, that advanced techniques of
information processing such as database system theory have had very little
repercussion on CAD software design.
Data Base Management Systems (DBMS) techniques have been successfully
applied in commercial and business types of data processing, it is not until
recently that they are being considered for CAD data processing.
Before going any further, may be the DBMSs concepts deserve to be given
some explanation, and later, their relevance to the different stages of the
design process will be discussed.
Application 1 Application 2 Application 3
I----------IData Base Management System I
Operating System
1
....71_ :71::
-DatEl 1-DateI
File_ _File_
Figure 3.13 - Data Base Management System Processing.
The diagram in Figure 3.13 describes the role of the DBMS in computer
systems. It consists of interfacing different applications with the host
operating system and data files. It is important to differentiate between
schema and sub-schema (Murray, T.J. 1985).
1
I
49
SCHEMA (Internal Model) : SUB-SCHEMA (External Model )
- Interfaces with the computer - Logical view of the data base.
technologies. - Query applications (Data
- D.B.M.S. Manipulation Language).
- Operating system access.
It is generally accepted that the most significant characteristic of a DBMS is
the separation of the logical view and the physical view of the data. The
objective of this separation is to make data storage independent of the
applications programs using that data.
Apl 1 Apl 2
7-
Apl 3/ SUB-SCHEMA
OPERATING SYSTEM
SCHEMA
SCHEMA
1
Figure 3.14 - General organisation of a relational data base system.
A schema is the logical view of the entire data base, whereas, a sub-schema
is an applications program's logical view of the data base. Although only
one schema will be associated with any data base, there can be multiple sub-
schemas associated to the data base ( see Figure 3.14). There exist different
data models in DBMS; hierarchical, networked and relational models. Their
differences lay in the way association between data items is performed.
Basically, there are three types of data associations :
50
A >D ONE-TO-ONE RELATIONSHIP<
A IIONE-TO-MANY< >> 13
A\ IIIMANY-TO- MANY/ 13
- The hierarchical data model.
A hierarchical data model represents data as a set of nested one-to-one and
one-to-many relationships.
- The network data model.
The network data model represents data as a set of record types and pairwise
relationships between records. Relations that involve more than two record
types are not 'directly permitted.
- The relational data model.
The relational data model uses the concept of a relation to represent what is
usually called a file. A relation is viewed as a two-dimensional table.
Koriba, M. (1983), reviewing DBMS theories applied to CAD, concludes that
Relational Data Base Management (RDBM) technology offers sound
theoretical foundations upon which some common methodology of CAD
software design may be drawn. This is emphasised by Kalay (1983), who
explains that the data redundancy and extensive cross-reference linkage
used by hierarchical models representing polyhedral shapes in computers,
are unsuitable for storage and transmission over communication channels.
These, problems are eliminated by the relational model, which allows
compact storage and non-manipulative query operations through the select,
project, and join operators (Codd, E.T. 1970, 1982 and 1985). Four data
manipulation operations; (1) retrieval, (2) modification, (3) deletion and (4)
insertion are usually grouped together and part of a language ( data
manipulation language - DML ). Among conventional DMLs, it is SQL (
5 1
Structured Query Language; the acronym SQL is usually pronounced
'sequel' ) that has the largest acceptance in relational data base technology.
This provides the user with formal means to rearrange the data so that it
will conform to the needs of particular queries.
The relational model data structure represents data in a two dimensional
tabular form. Much of the relational literature refers to these tables as
'relations'. Rows of a table are generally called tuples , also the terms 'row'
or 'record' are often used. A crucial feature of relation data structure is that
associations between tuple (records) are represented solely by data values in
columns drawn from a common domain (Date, C.J. 1975). It is a
characteristic of the relational approach that all information in the data base
-both 'entities' and 'associations'- is represented in a single uniform
manner, namely, in the form of tables.
Considerable work has been done on storing geometrical objects in a
relation database system (Guttman, A. & Stonebraker, M. 1982, Kalay, Y. E.
1983, and Meier, A. 1986). Unfortunately, there is no room in this thesis to
review the work done in this very promising field. However, a tabular data
base with relational functionality, will be used in this research to store and
manipulate data extracted from dedicated geometrical data files ( see
Chapter 7).
52
Chapter 4: COMPUTER AIDED ARCHITECTURAL DESIGN.
4.1 WHY C.A.A.D. ?
"The objective of a CAD system is to blend the designerand the computer into a problem-solving team able toattain the goals of design problems more efficientlythan each one working alone."(p 61).
Latombe, J-C. (1977)
4.1.1 Man-Machine collaboration in design.
Simon (1965), in his early work on computers and automation,
distinguished two main areas of concern to the development of a man-
machine research strategy. The first having a technological dimension, the
second, an economic dimension. With each incorporating two opposite
attitudes, one radicalist, and the other conservative.
For instance, according to Simon, a technological radicalist would believe
that computers will be able to do anything a man can do, whereas, a
technological conservative would assert that computers do only what they
are programmed to do. Similarly, an economist radicalist would see in
automation the start of a mass unemployment era, resulting with an
organisation masterminded by machines, whereas, conservative economists
will simply see in automation a continuation of the industrial revolution.
As a computer technology pioneer, Herbert Simon, identifies himself as a
technological radical and economic conservative. There have been various
attitudes towards the use of computers as human partners. Some, were very
enthusiastic, whereas others like Weizenbaum, J. (1984 and 1985) have had a
very skeptical attitude, especially concerning the subject of artificial
intelligence ( called also cognitive simulation or information processing
psychology ).
The professionals associated with the design and construction of buildings,
53
have certainly not been over'whelmed by the idea of working with
machines. Whilst many architects were aware of the development of
computers, very few were convinced that they had a direct bearing on their
practice (Gero, J.S. 1983). The use of computers in technical areas associated
with building design, not appearing until the late 60's early 70's.
Nevertheless, it must be said that the cost of computers at that time might
have caused the caution of the design professionals. In other words, the
productivity improvement promised by computers, was not sufficient to
justify the high investment cost.
However, the research effort was sustained. Freeman (1987), suggests that
apart from the two classical explanations given to technological change,
namely; 'demand-pull' or 'technology-push'. There is a third form that
could be defined as a new combination of radical innovations related both
to major advances in science and technology and to organisational
innovation. This is particularly the case of research in information
technology and allied subjects. For instance this research work is itself
aimed to apply new techniques (information technology) to help solve old
problems (building design). Nonetheless, it is not until a new design tool
has proved useful and cost effective, that it will replace an existing
traditional method.
Anticipating the use of computers in architecture, Negroponte (1970)
highlighted ways in which the machine could assist the design process , he
identified three possible applications
1 - The automation of current procedures, tospeed up and reduce the cost of existingpractices.
2 - The alteration of existing methods to fitwithin the specifications and construction of
54
the machine.
3 - The evolution of the design processrepresented in the machine, with man-machine mutual training, resilience andgrowth to be developed.
It is possible to view this categorisation in the light of existing computer
applications to design.
The first approach could correspond to what is commonly known as
Computer Aided Drafting, or also Computer Aided Design Drawing systems
(Schilling, G.T. 1988). These are generally two-dimensional drawing
production tools, and have been underlying the significant part of the
increased productivity in design, attributed to computers. They can save a
substantial proportion of the time spent on drawing production, especially
when there is a high degree of repetition in the design work. Effectively,
they consist of automating the drawing process and are fairly easily absorbed
into existing design office procedures. The limitation of draughting systems
is in coordinating information between different drawings. This is entirely
left to the user, because drawings are held in separate two-dimensional files.
It is also impossible to perform any evaluation work on such drawings,
since all the information they contain is abstract graphical primitives with
no relation to building elements.
The second category, would include all types of Computer Aided Design
systems that support two-dimensional as well as three-dimensional
modelling. These allow us to design buildings spatially, by storage and
manipulation of construction elements (i.e.: walls, doors, windows, sanitary
fittings, etc...). Systems that belong to this category and exhibit some building
design capabilities, are called Computer Aided Building Design (C.A.B.D.)
systems. The detailed information required by such systems on the building
55
design solution, makes them difficult to use at early stages of the design
process. They require that the user obeys very strict procedures, and impose
the use of a pre-defined semantics and syntax that can sometimes be very
complex. They also, occasionally, restrict the user to very regular forms, not
allowing curved surfaces or various thickness materials. Obviously, a strong
argument in their favour is the three-dimensional visualisation capability.
Since they allow direct observation of spatial conflicts, while drawings do
not (Eastman, C. 1975). The up-dating of the information contained in the
drawings is made much easier, by the fact that they all originate from the
three-dimensional model. This means any alteration of the building model
would automatically be reflected in the drawings. Another substantial
advantage is the prospect of performing building evaluation with such
systems.
Last but not least, Negroponte suggests a third way of looking at human-
machine collaboration in design. He suggests, in his book "the Architecture
machine " (1970), a 'man-computer symbiosis' to perform the design of
buildings. This, he describes as :
"...a machine that can follow your design methodologyand at the same time assimilate your conversationalidiosyncrasies..."(p 11).
He adds;" ... an architecture machine must understand ourmetaphors, must solicit information on its own, mustacquire experiences, must talk to a wide variety ofpeople, must improve over time, and be intelligent. Itmust recognize context, particularly changes in goalsand changes in meaning brought about by changes incontext.."(p 119-121).
There is no computer at the moment that can interact with men in this
fashion. In fact, the above quote is very much like the description of the
capabilities that one might expect to find in a human designers. This raises
56
the problem of comparing man with machine, as well as the questions of
machine intelligence and machine learning capabilities. The nearest thing
to such an ambitious vision could be what has resently emerged from
Artificial Intelligence (AI) research, namely Knowledge Based Systems
(KBS) and Expert Systems ( mentioned earlier in section 3.1.1 ).
The argument in favour of such research (i.e.: in machine learning and
machine intelligence) is validated by Simon (1983), saying
" Perhaps the deepest legitimate reason for doingmachine learning research is that, in the long run forbig knowledge-based systems, learning will turn out tobe more efficient than programming,.. "(p 36).
He adds :
"... among the the most important kinds of learningresearch to carry out in Al are those that are orientedtoward understanding human learning."(p 36).
As a means to understand human cognitive abilities, there is no doubt in
the relevance of AT for design education, and possibly, for the development
of knowledge based systems for design. Nevertheless, whatever this new
development comes out with, the human control over the decision making
process in design should never be given to a machine however 'intelligent'
it might be. Simply because as computers are at the moment, they process
information sequentially, whereas design problem solving needs to
consider all aspects of a problem simultaneously (see section 2.2.3). This
makes it most dangerous to rely on a computer for multi-variable problem
solving.
In architectural CAD, the possibilities and problems of KBS for design have
certainly been under investigation (Kalay, Y.E. 1985, Lansdown, J. 1982,
Lansdown, J. & Roast, C. 1987). Some implementations were even done in
logic programming languages like LISP and PROLOG to develop new CAAD
57
applications (Swinson, P.S. 1982). These have not yet had much impact on
the Computer Aided Design field, but their influence on future
developments is almost certain.
The next section intends to identify the different ways in which computers
are used in design, and underline the area on which the focus is going to be
made.
4.1.2 Using computers in architectural design.
Cross (1977) reviewing what he calls the 'state-of-the-art' in computer aided
architectural design of the 60's and early 70's period, groups the systems in
four categories:
- Computer analysis.
- Computer synthesis.
- Computer evaluation.
- Integrated system ( analysis + synthesis + evaluation ).
This categorisation is still very visible in the large spectrum of existing CAD
products, as well as in the research and development of new systems.
In a resent review and evaluation of CAD systems for the construction
industry, carried out by Hamilton, I. & Winterkorn, E. (1985) for the
Construction Industry Computer Association (C.I.C.A.). It has been shown
that computer programs are being aimed at a large variety of subjects like
management, quantities and stock control, accounting, design graphics,
structural engineering, services engineering, transport and
communications. A similar review of computer systems used by the U.K.
•construction industry was undertaken by Gill, M. & Atkin, B. (1985), and
shows that very few systems are specially 'architectural design' oriented,
however, they are largely used by architects. These would cover applications
58
such as office management project cost analysis and control, project
scheduling and management, civil engineering, space planning and
facilities management, computer aided drafting, as well as mathematics and
statistics.
It is well known that the evaluation of CAAD systems is not a simple task.
First, because it is difficult to find reliable and objective information on the
suitability of a particular system for a particular use. Secondly, because the
only way to know if a system is doing what it pretends to do, is to use it. The
success of installing a computer system depending on the attitudes and
capabilities of its operators.
Campion (1968) anticipated applications of computers in architectural
design for management techniques, administrative tasks, design production
and basic design. Similarly, Lawson (1985) asserts that the computer in the
design office is to have four roles, in organisation and management,
information presentation, solution evaluation and solution generation.
Whereas information management and information presentation
computer tools (i.e.; Word Processor, Spread Sheet, Data Base Management
and Computer Aided Drafting systems) have encouraged the introduction
of information technology in the architectural design office, designers are
still very rarely using the computer as a design partner. It is not until the
computer is used for analytic and generative tasks that it becomes possible to
envisage involving 'it' in the design process.
Reynolds (1980) suggests that the computer in design could be used in; an
analytical way to check the viability of a proposed solution, and in a
generative way, to produce a design solution.
59
- Generative design.
The use of computers as a means of automatically generating design
solutions, has for a long time been the focus of CAAD research. The early
applications consentrated on generating architectural layouts, a research
area known also as 'spatial allocation problem'. Some of the first attempts
were oriented towards the creation of a floor layout that minimise a certain
objective function. Whitehead, B. and Eldars, M.Z. (1964) produced a
program to design a single story building so as to minimize the traveling
time of the occupants moving between spaces. This was based on an
optimization approach, of which most algorithms require too much
computer time, and trivialize complex architectural problems ( see section
3.2.3).
Another approach to generative design, focused on the search for the most
feasible solutions that responded to a given set of constraints without a
particular objective function. The constraint satisfaction approach is limited
by the fact that design criterias could not all be computationaly represented.
It was followed by an approach that uses algorithms to automatically
generate 'all feasible' solutions, and then allowing the architect to choose
the best alternative. Due to the complexity and size of algorithms used by
this approach, many attempts to use it were limited to architectural
problems composed of fewer than 16 entities (Shaviv 1987). Making little
difference with manual floor plan generation, since small projects are not
difficult to design.
In architecture, the design is generated in response to several requirements.
Consequently, one would expect a design solution produced by a computer
to comply with all these requirements, which is not the case with existing
generative systems, because they only support a limited number of
quantifiable design parameters. The design 'solution' generated in such
60
conditions will need alterations and transformations eventually to fulfil all
the design requirements as perceived by the human designer. A mention to
some very resent work in this field will be made in section 5.11.
However, the few generative systems that have been developed so far, have
put much emphasis on the production of 'a' design solution, mainly floor
should be the management of design constraints (i.e.; brief or programme)
during the process of generating a design solution that ought to be given
most attention, to help validate the produced solution.
- Analytical design.
Here analytical design stands for design evaluation. The evaluation of a
design artifact is made with reference to design requirements, and by
comparison to the performance of similar artifacts that have proved to have
a good or bad behaviour in similar design conditions. When evaluating a
design , the architect needs to know about the aims and motivations of such
design, and have information or experience on the behaviour of similar
buildings. To evaluate a building, five performance characteristics can be
identified
- Aesthetical.
- Spatial (Functional).
- Environmental.
- Structural.
- Financial.
Existing computer aided design tools have made buildings evaluation for
aesthetical evaluation accessible to most designers. Whereas architects can
now produce many kinds of views and drawings, they can still do relatively
61
little about evaluating the structural, functional, environmental and
financial performances of their buildings.
When generating models of buildings on computers, the only aspects that
can be modeled are those which can be quantified, it is on these quantifiable
elements that the evaluation will takes place. Generally, it consists of three
operations; (1) measuring the model, (2) performing calculations on those
measurements and then (3) comparing the results with targeted
performances. The comparison stage of the evaluation is the most crucial,
because judgemental decisions are made in the absence of non-quantifiable
information. This last issue will be dealt with in the next chapter, with
particular reference to financial evaluation.
The review of design methods and design methodology done in the second
chapter, suggested that generative and analytical design should never be
dissociated. Accordingly, there are arguments in favour of integrating
generative and analytical computer aided design techniques. Shaviv (1987)
believes that
" The combined use of computational generation andevaluation techniques will help designers find bettersolutions to the architectural layout problem than couldbe derived manually."(p 211).
He suggests that alternative design solutions should be generated
automatically; according to design requirements formulated as constraints
and as objective functions. Then, the generated alternative would be
evaluated and appraised by means of automatic programs. Finally, the
deficiencies of the proposed solution, identified by the evaluation, would be
rectified through the automatic or manual generation of new and better
design alternatives.
62
The above scenario is very attractive, in the sense it offers the possibility to
design 'with', rather then 'on' a computer system. Although, it has the
danger of placing the naive user in the situation where his/her design
decisions are a series of 'reactions' and 'transformations' of what the system
will have produced base on a limited number of design parameters. It is not
clear wether the transformation of the model is done by the user, by the
computer or by both. This is certainly a very important matter that deserve
considerable attention.
In a similar line of thought, Lansdown (1986,1987) suggests the use of
computer systems in design as 'prototype modification' instruments. His
argument is that good designs are not created out of nothing, almost every
design is a modification of some prototype that already exists in the
designer's mind. He believes that
"The best designers are those who possess a rich supplyof mental prototypes, and the skill to modify them to suitthe task in hand."
According to Lansdown (1988) the computer aids currently available for
designers are ill-conceived, instead of building blocks, they should provide
prototypes which the designer can modify at will. He advocates the us of
'frame-grabbed computer images' as prototypes for computer aided art and
design work, which he believes is a more 'productive' way of designing
than starting work from a blank sheet.
This might be valid for artistic work, but probably not for architecture.
Because a video image transferred to a computer will be at best a two-
dimensional drawing, with no information what so ever about the
functional, environmental, structural and financial characteristics of the
63
building (or building drawing) it was taken from. It is essential to have
attached to any building model, to be used as a prototype, information on its
individual components as well as contextual behaviour.
Whereas we have seen in this section that neither generative design nor
analytical design methods have yet, separately, proved to offer much to
CAAD users, at least in their current state. There could be something to
expect from the combination of both.
For the sake of the following argument, we shall take on the idea of design
being a 'prototype modification' process in Lansdown's terms. Where the
building 'prototype' would be a three-dimensional building model, either
computer generated or human generated. The computer aided architectural
design process, would then consist of evaluating the design solutions by
comparison with computer models of existing buildings ( see Figure 4.1 ).
Design transformations would then take place on the proposed solution by
the human designer, with the computer assistance. This last argument will
be taken further in chapter 5.
64
4.1.3 Ad-hoc, integrated and 'dis-integrated' approach.
Broadly, there are three ways to approach the development of computer
based design systems. The first two were clearly articulated by Lansdown
(1969), and have been largely in use. The ad-hoc approach, and integrated
approach both have advantages depending on the situation in which they
are used.
- Ad-hoc approach.
In the ad-hoc approach, a number of programs exist for tackling specific,
limited-scope design problems. Independent design programs will each
access a number of data base files of parts, components, technical data and
geometrical data generated by the user. For example, thermal evaluation,
day lighting or cost modelling will each require a set of the data representing
the computer building model. This involves usually a tedious data input,
and is consequently an error prone task. It is some times possible to transfer
data from the building modelling system to the appropriate evaluation
package through specific links, which tends to be a complicated task.
Although, this is less likely to be a problem with new computer networking
and files transfer handling facilities. This approach represents a simple way
of performing very limited building modelling and evaluations.
Application1
Application2
Application
Date Date _ _Date ateD,File File 2 File 3
_ njFile
Figure 4.2 - Diagrammatic representation of the ad-hoc approach.
65
Application1
Application2
----.k-- ..-d
DataBase
'•-..._ ___ ,,
- Integrated approach.
The integrated approach can be envisaged as a comprehensive building
modelling system. It will benefit from the integration of two dimensional
and three dimensional descriptions of the model, as well as the
measurement and calculation roles of the system. It means that each
individual evaluation study makes virtually no demands on the designer,
since the model would have initially been described using editing
techniques.
The main advantage of the integrated evaluation approach is that the
designer can run a whole multiplicity of evaluative jobs on the same
computer building model. For example the same design solution can be
checked against building industry regulations and at the same time undergo
a thermal evaluation, and/or a cost evaluation.
Figure 4.3 - Diagrammatic representation of the integrated approach.
- Dis-integrated approach.
More recently, Richens, P. (1983 and 1984) suggests a 'dis-integrated'
modelling approach to computer building design. He argues that to
integrate architects activities, it is necessary to dis-integrate their data.
It is intended to aid coordination and enforce consistency while enabling all
members of the design team to work with the most recent information.
This approach faces major data consistency problems, but it has advantages
in giving each discipline control of its own data, and in working in just the
66
Application2
Data2
Data3
Application1
Data•_JBase
Application
DataBase
same way when they are using separate computers.
Figure 4.4 - Diagrammatic representation of the 'dis-integrated'
approach.
Eastman (1978), an early advocate of INTEGRATED DESIGN DATABASES
(IDD), argues that integrity and consistency problems of computer aided
design can be dealt with IDDs. He believes that these will allow the
definition of global goals and contextual conditions to be satisfied for a
design, and later, during relatively unstructured design decision processes,
the computer will automatically check decisions as they are made against
the earlier stated goals, warning the user regarding inconsistencies and
possibly making changes to other parts of the design so as to correct them.
This last point could be a big constraint on the user of such a system. A
designer must be able to describe his solution to the computer gradually as it
develops, and the system must accept information in virtually any sequence
and allow the designer to change any aspect of his design at any stage.
However, Eastman goes on to suggest a general conceptual structure that
should facilitate automatic integrity management, to which he sees an
application at the analysis and synthesis stages of the computer aided design
process.
67
Whereas the actual internal structure of a CAAD system matters very little
if it is to be used for the organisation, management and information
presentation of design, it is crucial for design evaluation. Any computer
aided evaluation system must be able to converse with the designer during
his possible highly integrated iteration of briefing, analysis, synthesis and
evaluation (Lawson, B.R. 1981). This requirement has profound
implications for the kinds of data structures and data organisation which
such computer programs must establish. In this thesis, a combination of the
integrated and dis-integrated data organisation, coupled with a sophisticated
data structure are used, of which an extensive description will be given in
Chapter 7.
68
1 2w
03—i
ii-• 03cc 0ict cc00.
Chapter 5: DESIGN EVALUATION.
"A design is a statement about values. Designing isinextricably bound up with evaluation".(p 1).
March, L. (1976)
5.1 BUILDING DESIGN EVALUATION.
In the earliest notion of design morphology, introduced by Asimow (1962),
evaluation was featured as an independent stage of design, taking place in a
linear sequence of events. Markus (1967), was among the first to explore the
ways in which measurement and appraisal can become part of the design
method. He showed its relevance both as, a generative technique of use
during the creative stages, and as an evaluative technique of use in more
advanced stages of the design process. In describing his approach he
suggested :
"... appraisal is central to design for two reasons. First,because data from buildings-in-use are the meanswhereby what would remain a series of isolated andclosed design projects becomes a single linked designactivity, in which the connecting elements are aseries of performance appraisals... Second, becausethe complete building-in-use is only one of manyembodiments of a design concept, albeit the last, mostdetailed and precise."(p 1567).
He adds :
"Models generated at earlier stages in the design havesufficient details for many of the performanceappraisal techniques to be applicable. Thus, whileappraisal presupposes earlier design activities of agenerative kind, which have produced testablesolutions, it itself is part of the generative process."(p1567).
In other words, evaluation is assigned the position of an integral part of the
design process, as against being the last stage in the architect's relationship
70
with the building. The lack of emphasis upon evaluation as an integral part
of design work is seen, by Gregory (1982), as due to the design techniques
which are taught. These tend to concentrate upon synthesis and neglect
evaluation; supposedly because synthesis is more spectacular or more
mysterious, the expression of 'creativity'. It is true that in the language used
about design, evaluation does not always appear.
Evaluation represents an attempt to find a value for a particular design
arrived at by synthesis. Where there are multiple proposals the values need
to be compared in some way. This comparison may refer to the foundations
of the proposals, or attempt to examine their likely future consequences or
anything else which seems likely to help in choice (Gregory, S. 1982). The
actual use of evaluation and its derived results can broadly be categorised in
three; (1) Evaluation before design, (2) Evaluation during design and (3)
Evaluation after design.
Although our interest here is in evaluation during the design process, it is
useful to describe the various uses of evaluation to clarify the problems of
developing a computer aided design evaluation implementation.
It is suggested by Donald (1988), that evaluation research and its results can,
(1) be fed-forward; where the results of studies of existing buildings are
applied to the construction of other new buildings, (2) fed-in; whereby
evaluation research is conducted for a building in the design and
construction process, and (3) fed-back into an existing building designs.
The last use of evaluation belongs to the Post Occupancy Evaluation (P.O.E.)
application, and will not be dealt with in this thesis. Although, the
implications of CAD on such issues ought not to be undermined. Instead,
we will concentrate on the feed forward and feed in uses of evaluation,
71
respectively applied before and during design, and their interactions.
First of all, it is important to identify what type of information and
knowledge is catered for, and in what form will it be fed forward or fed in.
There are generally two broad sets of information which can be collected; (1)
the details of a problem and its solutions, in relation to a particular building
being studied, and (2) general broad type of 'ideas' which have the potential
of use in future designs. It is this last type of information that could be
suited for what Lansdown calls 'prototype transformation' design.
However, when information has been fed forward, it may still be necessary
to evaluate its adequacy within the new person-environment context
(Donald 1988). A major consideration at this point is the form this
information should take.
Several studies have attempted to discover how evaluation research
information should be presented to the designers. Goodey and Matthew
(1971) did a study on information flow in British architects' offices, and their
preferences among presentation styles. Their recommendations emphasized
brevity, clarity, visual illustration well coordinated with text and
architectural vocabulary. This last point is very significant, and will be
developed later in the thesis. More recently, Mackinder, M. and Marvin, H.
(1982) looked at the interaction between the designer and information, and
they report an unwillingness to consult written data, because this is seen as
time consuming.
Lera et al (1984) argue that the nature of information presentation is not the
core issue, because even if information is presented in a usable form, it will
help very little, if the architect does not consult it in the first place. This
means that throughout the process of designing, the choices that designers
make (i.e.: their choice of consulting or not consulting information) are
72
theirs, and are affected by their predispositions. These reflect the designers
attitudes, values, and belief toward not only what is possible but about what
ought to be done.
Many published accounts of the design process have emphasized the
important role of value judgement in design (Daley, J. 1969, Dark, J. 1979,
Lera, S. 1981). In an interesting book, Collins, P (1971), has sown the
contiguities which seems implicitly shared by the philosophy of law and the
philosophy of architecture, and the affinity between the judicial criteria of
architecture and law. There is, unfortunately, no room in this thesis to deal
with this subject fully. However, human ability to make balanced
judgement remains the best instrument for design decision making. This
'talent' could be enhanced by supporting it with precise, reliable and rapidly
accessible information.
There is no doubt in the fact that, communication and decision making in
design evaluation are closely related design issues, and that the process of
designing a building is a function of design team communication. Wallace,
W.A. & Kelly, J.R. (1987) say in this respect :
" Each member of the design team together with theclient evolve the design through a longitudinalprocess of communication. The roles of theparticipants and the timing and configuration oftheir communication is obviously vital."(p 20).
It is not until the designer communicates, and by doing so gets informed,
that he or she can make a decision concerning the value of a design
solution. In the case of evaluation before design, the information consulted
will describe an existing building. Whereas, when evaluating during design,
the information used will describe a design model.
The information gathered by the designer will be used to compare and
contrast, two essential ingredients of evaluation. For evaluation , prior to
73
design, the comparing and contrasting will involve on one hand the
building, and on the other hand the level of satisfaction ( or unsatisfaction)
it provides to its users and to the environment. Whereas, for evaluation
during design, comparisons will be made between the design model and the
objectives aimed at by such design. In both cases it is specific building
characteristics that will be contrasted. These are multiple, some of them are
quantifiable and others are not.
Since our aim is to involve the computer in building design evaluation, the
next section will differentiate between quantifiable and non-quantifiable
building design characteristics.
5.1.1 Measurement and appraisal in design.
The measurement and evaluation of building performances is a full part of
the design method and we shall now identify what types of building
performances and which quantifiable characteristics are the most suitable
for computability. In an attempt to define systematic routines and
techniques for design evaluation, Markus (1967) suggested four main types
of activities that ought to be undertaken; identification, finding
relationships, model building, and optimization.
-1. IDENTIFICATION.
This consists of identifying design constraints. The design constraints were
clearly defined by Lawson (1971 and 1980), who differentiated between
domain constraints, function constraints and generator constraints. These
are three sets of relations between the variables of the architectural design
problem. Organising them is a very difficult task for the designer, since he
74
construction
services
contents
...Z..
physical
K
spatial
> visual
....
I
cost ofmaintenance+
production
adabtability
moral
stability
)
..,!!..
I
cost ofactivity+
I>
<
value ofachievingobjective
must decide what to take on trust, what to question and what to reject.
Unfortunately, systematic constraints identification routines and
techniques, which could help designers considerably, have been given very
little attention. However, recent research developments at the M.I.T. (Groos,
M.D., Ervin, S.M., Anderson, J.A. & Fleisher, A. 1987 and 1988), is showing
some promise in this direction.
For the time being, the identification of constraints will be entirely left to
the designer, who might use the computer to store and organise
information as well as relationships between the different constraints.
-2. FINDING RELATIONSHIPS.
To find design relationships, Markus (1967,1971) suggests a conceptual
model called the Building-Environment-Activity-Objectives system. The
system has five main parts :
BU lD MG ENV FlOrattENTAL
ACTIN' 1TY
OBJECTIVESSYSTEM SYSTEM
SYSTEM
SYSTEM
)
I
cost ofprovision
'workflow
'control
c omm unica-6 on
!identification
Iinfirmalactivity -
COST SYSIBA
Figure 5.1 - The Building-Environment-Activity-Objectives system(Markus 1971).
This system is considered to consist of people and objects interacting in a
complex way ( see Section 3.2.1). The 'objects' are the fabric or hardware that
generates the environment ( natural and/or artificial ). Whilst, 'people',
75
assumed to be goal oriented, use the environment to achieve objectives of
an idealised kind.
i- The building system;
The building system includes all concrete items, components, assembly and
objects that are part of the building. Its complete description gives not only
all the physical characteristics of these parts but also their dimensions and
relationships. This information is normally described, in a very explicit
manner, in a set of drawings, specifications, and bill of quantities. Although,
some of the relationships between elements are sometimes implicit in the
drawing representation technique and/or terminology used by the building
professionals. Few architectural CAD systems do handle at the moment the
information required to describe Markus's building system, and it is
interesting to quote him saying.
"Much of today's interest in automatic data processingand handling of these documents (drawings) missesthe relation that the characteristics of a buildingmust not only be able to be described unambiguouslybut must also be quantifiable if worth whilepredictive relationships are to be obtained."(p 1571).
Here, the emphasis is put on the quantifiability of building elements to
predict relationships, which tend to suggest that if a building element is
quantifiable, it is subsequently easy to relate it to other building elements.
This assumption is based on the fact that relations are a straight-forward
matter, when implicit in drawings. In the implementation of CAAD
systems, this last point has proved to be a considerable challenge. However,
when over come (which will be described in chapter 7). These still remains
the problem of relational integrity, a matter of major importance when
trying to transform a building model for interactive evaluation.
76
ii- The environmental system;
The environmental system has three main sub-systems, the spatial, the
physical and visual. It is to insure a proper functioning for the different
patterns of activity housed in the building, as well as modify the external
climate to provide a controlled internal environment within which the
activity system can develop. The relationship between these sub-systems is
particularly complex and the elucidation of this relationship is central to the
understanding of building and environmental design.
iii- The activities system;
The activities system sets up and maintain an activity pattern consisting of
work flow etc... A combination of those can some times, if identified by the
designer, constitute a 'radical' constraint in Lawson (1980) terms. For which
a 'radical' solution has to be found, to solve the design problem in its
totality.
iv- The objectives system;
It consists of the long term aims for which the organisation exists. The
objectives provide the context for all the activities and consequently for the
buildings and environments. Markus (1971) point out that
"Often an organisation's objective is in conflict withbroader, social objectives (e.g. industry and pollution)or with narrow personal ones (e.g. production andfriendship formation). Such micro and macroconflicts are inherent in all orgenisations and thedesigner had to understand them and adopt priorities.Often his own objectives will cause furtherconflict."(p 85).
The objectives give rise to the activities which it is necessary to implement
77
in order to achieve those objectives. The designer's role is, partly, to reduce
conflicts between the different objectives, and in doing so, he will introduce
his own aims. Lera (1982), identifies the designer's aims as originating from;
(1) self-imposed goals and (2) precedent knowledge. The first are part of the
designer's personal values and opinions, like style and ideology. Whereas
the 'precedent knowledge' consists of, on one hand stereotypes and patterns,
and on the other hand information on previous buildings (i.e.: published
information on designs or existing buildings). This last point has some
significance to this research work, in the sense that it links the 'objectives'
that are the beginning and the end of the whole system, to external previous
experiences of the designer that are essential for the evaluation for design
appraisal and evaluation.
v- The resources and cost system.
Each of the previous systems has an initial and/or continual cost or value.
The building system costs to provide design, construction materials, labour;
the environment system has costs of energy maintenance and cleaning; the
activity system consumes resources in the form of wages, salaries, the
materials it uses (or wastes), hence the growing need for facility
management computer systems in modern services society.
If the system is not to run at a loss, the value of achieving the objectives
must not exceed the combined cost of the building, environmental, and
activity systems. The difficulty of quantifying values in terms of money or
other units commensurate with cost, should not over shadow the need for
adopting cost benefit analyses for solving problems related to the building
during the design process. The way to appraise any design concept is to
embody its characteristics in a testable model.
78
-3. MODEL BUILDING.
Markus (1967) defines the building model as :
"...nothing more than a representation of an abstractconcept in more or less concrete form- symbol,mathematical relationships, schematic diagram,detailed design drawing, three dimensional model or anetwork simulation system. In any of these, designvariables (design parameters) can be changed andthe consequences (dependent variables) can bemeasured."(p 1572).
In making models of buildings, the only variables that can be modeled are
those which can be quantified. Hence the importance of measurement in
the appraisal of building performance. A building model can be seen as a
representation of a system in which the relationship of parts are fully
understood. The modelling of the building system described above, would
for instance consist of representing abstract construction materials, and the
relationship between them. For example, walls, floors, ceilings, windows,
and doors would be independent entities, with the relation of walls 'to'
ceiling and window 'to' wall explicitly defined. In the case of computer
building modelling, each of the building system elements will be associated
with a geometrical element, that will have the similar properties to the real
world element it represents. For example a wall will be represented by a
surface (usually vertical) of various thickness and height.
The measurement and appraisal of the resources put in a building system,
will consist of measuring the geometrical characteristics (i.e.: length, width,
area, volume, etc...) of all the building elements used to model the building
on the computer. Each element having a unit cost (i.e.: cost per-square
metre, or per-cubic metre, etc...) and a labour cost. The calculation of the
total building system cost becomes a simple matter of adding up the
elemental cost. However, the building system is not the only element of the
built environment represented in the conceptual model. We have seen
79
above that the environmental and activity systems have both an initial
and/or continual cost. These ought to be taken into consideration in
building modelling and evaluation. For instance, the environmental
system needs to distinguish between 'in-side' and 'out-side' for thermal and
visual performance evaluation. Also, it must distinguish between spaces of
the building to enable the appraisal of proper functioning for the different
patterns of activity. This is an essential information for the activity system
evaluation.
It is clear that computer model building system, for a comprehensive
representation of resources, ought to incorporate both elemental and spatial
modelling. The measurement and appraisal of a building design will not
only enumerate the elements of the building fabric in congruence to there
constructive role, but also according to the environment and/or activity
they have in common..
-4. OPTIMISATION.
Optimisation is the last appraisal activity, it consists of selecting the 'best'
design from any number of possible solutions. The points outlined here
will cover only the quantifiable aspects of design variables. Imponderable
factors, like aesthetics, will not be included in this analysis. Markus (1967)
argues that without a single criterion, alternative solutions for parts of the
design can never be combined nor the best overall solution be found.
According to him, it is meaningless to ask; "Which is better, a good lift
service or freedom of glare ?". But it is quite meaningful to ask; "Which of
two lifts design is better, or which of two lighting installations produces less
glare."
From this single standard evaluation approach, 'cost' suggests itself as the
best criterion for optimisation of building design evaluation. The objective
80
being to produce design solutions of maximum value at minimum cost.
The argument could as well have been optimising comfort or satisfaction in
terms of physiological or psychological response, or optimising a particular
activity like circulation ( see section 3.1.2). Cost is simply a convenient scale
of measurement, and the considerable computation involved in calculating
the performance of an outline design, makes it, by the use of fast computers,
feasible to consider the implications of many design alternatives. The
balancing of architectural objectives is certainly very much influenced by
the prime cost of a design. However, money is not necessarily more
objective than comfort, desire, sensation or satisfaction (Markus 1970).
Under different conditions (eg: high inflation, poverty, economic boom,
etc..), judgement of the value of a certain increment of money does change
considerably.
From a methodological point of view, the practice of optimisation, using
statistical decision theory for optimising behaviour, is getting largely
replaced by the 'satisficing' behaviour management approach. Simon (1981)
argues :
" ... real-world business firm turns to procedures thatfind good enough answers to questions whose bestanswers are unknown. Thus normativemicroeconomics, by showing real-world optimizationto be impossible, demonstrates that economic man isin fact a satisficer, a person who accept "goodenough" alternatives, not because he prefers less tomore but because he has no choice."(p 36).
In the current condition of domination of the market systems, against the
state systems, it is recommended to the architect to learn from the
economics man. Therefore, it is not believed that cost on its own could
justify the acceptance of a proposed design solution. But that among other
design constraints, the cost parameter should be well handled (i.e.: 'closely
81
monitored with the rest of the design constraints), so it can help make the
'best' choice.
5.1.2 Inquiry and decision.
It is through the process of decisions that problems are solved and action
taken. It is argued by O'Shaughnessy, J. (1972), that the steps that in such
discovering consequences and finally making a choice-, are composed of the
elements of description, explanation, prediction and evaluation.
- Description.
A description is regarded as a factual statement, because it is usually based
on simple direct observation where no attempt is made to change what is
being observed. However, observation can be erroneous. For it is selective
and depends on interpretation of sensory stimuli. Such interpretation
involves giving meaning to sensations by organising them through theory
and concepts.
- Explanation.
Explaining the origins of a problematic situation offers guidance in deciding
appropriate action. To prevent the repetition of a problem, then it needs to
be explained. It seems that re-stating or re-formulating a problem can enable
the recall of ideas and concepts not aroused by the original statement.
Explanation seeks to find the conditions that are functionally related to
events.
- Prediction.
Prediction refers to future events, as against explanation which argues about
the nature of current or past events. There is an isomorphic relationship
between explanation and prediction, since to be able to explain it is to be able
82
to predict correctly. A prediction results from some hypothesis, and the
validity of that prediction is related to the probability with which the
hypothesis is true.
- Evaluation.
In an evaluative decision, which is what designers continuously do, the
decision-maker is concerned with the decision whose immediate goal is to
rank the value of a set of items according to some criterion. Its aim is to
determine relative worth or contribution to objective.
In evaluating the cost of a building, the designer has to undertake the above
operations several times and in various sequences. The next section will
describe the main techniques devised for building cost evaluation.
5.2 BUILDING COST EVALUATION.
" One major task facing building research workers isanalysis of cost data to discover systematic costvariation with changes in design parameters. Withoutthis, cost analysis will remain a checking tool andreal design with costs cannot take place."(p 1571).
Markus, T. (1967)
In the procedure of the implementation of a building scheme, the architect
usually rely on the quantity surveyor to supply cost information to plan the
various operations required for the execution of the construction. The cost
information is normally based on the actual costs of previous buildings of
similar type, suitably adjusted to make allowance for such factors as
difference of location, site conditions, market conditions and quality of
works. The costing exercise is called 'cost planning', and prepares a
provisional estimate on a comparative or interpolation basis.
5.2.1 Cost planning and cost modelling.
83
The general construction preparation procedure requires the quantity
surveyor to interact with the architect from the outline proposal stage of
design. As soon as design drawings are produced, the quantity surveyor is in
a position to give general guidance on cost, and evaluate the financial effect
of different solutions. From this phase an outline cost plan is usually
prepared, which will considerably influence the final potential building cost.
At the scheme design stage, the quantity surveyor checks his approximate
estimate figure and, with the aid of extensive cost information, re-appraises
the initial cost plan with provisional target cost figures allocated to each
element or major part of the building. Later, when the design is more
detailed, comparative costs of different forms of construction, material and
services layout are provided by the quantity surveyor. He will adjust the
distribution of cost in the cost plan, and include running and maintenance
costs if they have significant effect on the outcome. Continuous checks will
ensure that the development of the design remains compatible with the cost
plan.
According to Seeley, I.H. (1972 and 1984), there are two basic methods of cost
planning currently in use; elemental cost planning and comparative cost
planning, although in practice variations of those have been introduced.
(1) Elemental cost planning.
This method uses approximate methods, such as cost per place (i.e.: per
occupant), cost per square metre or cost per gross floor area. The building in
broken down in various elements of construction or constructional parts,
such as walls, floors and roofs, and each element is allocated a cost based on
cost analysis of previously erected buildings of similar type. The sum of the
84
cost targets set against each element, must not exceed the total estimated
cost.
(2) Comparative cost planning.
The comparative system starts from sketch plan, but does not use fixed
budgets like the elemental system. Instead, a cost study is made showing the
various ways in which the design may be realised and the cost of each
alternative considered. The cost study is usually based on approximate
quantities and constitutes an analysed estimate. In Seeley's (1972) words,
comparative cost planning
"...is not necessarily to show how cheaply a buildingcan be produced but to show the spread of cost overvarious parts of the building and what economics arefeasible."(p 136).
He adds;"The comparative system endeavours to show thearchitect the cost consequences of what he is doingand what he can do. It shows the effect of choice ofdesign for one component of the building on other."
The hindrance in using comparative cost planning, is the difficulty of
breaking down the building into parts, and the handling of that information
for comparative cost analysis.
For cost advice at early design stage, 'cost modelling' seems to be a more
flexible instrument to analyse cost variations. It is often mentioned in
conjunction with the use of computers, although it does not necessarily
depend on them. According to Ferry, D.J. and Brandon, P.S. (1984) cost
modelling may be defined as :
...the symbolic representation of a system,expressing the content of that system in terms of thefactors which influence its cost.'(p 101).
85
Seeley (1984) gives three examples which illustrate the wide range of
investigations and activities for which cost modelling can be suited. He
describes Brandon, P.S. and Moore, R.G. (1983) computer programs on
building appraisal. These have constructed an elemental cost analysis data
base, from which information could be retrieved and adjusted for new
project.
Similarly, Smith, G. (1980) has devised an approach whereby the design
target parameters and cost targets are set out and compared with those
contained in the budget model. This is a quick way of assessing the chosen
strategy at the early stage of the design.
Finally, he refers to Mathur, K. (1982) cost modelling approach. This is seen
as being very global, as building forms are seen as the single most important
and strategic decision made at early stages in the design process. It
determines the cost of superstructure, services and operation of the
building. This approach postulates that if a suitable data base was generated
which relates compactness of form, cost elements and total cost, then an
early decision on form could provide a reliable cost prediction.
However, it is generally thought among quantity surveyors that the
increasing use of computers has the potential for vast amounts of cost data
and design parameters of previous projects to be readily accessible and used
in the design and cost planning of new buildings. A system that would
support the elemental modelling of building components, and would
provide historical cost information for such elements, holds obviously
considerable promise in the field of cost estimating and cost modelling.
5.2.2 Design costing.
86
Design costing represents an attempt to put costs against a building design
solution. It operates at various stages of the design process, and thus
requires different techniques depending on the amount of information
available. Estimating methods can be associated with building modelling
techniques. Beeston (1987) has suggested that they may be classified as
'descriptive model methods', 'in-place quantities model methods' and
'realistic model methods'.
Descriptive models method.
This approach is based on the idea of attaching cost to descriptive features of
a design rather than its building materials. Descriptive models use formulae
in which the variables describe the design and its environment by such key
factors as size, shape, type of construction and location.
In-place quantities models method.
The in-place quantities method could be described as a building material
quantification based approach. It usually assumes that there is a fixed
relationship between design variables and the material cost. Each item of
building material used in the construction is associated with a unit cost.
This method requires a great deal of detail, and is therefore limited to late
design stages. Increasing the detail and complexity of quantity-based
methods does not necessarily produce greater overall accuracy. This
approach is inadequate as a design tool since modern business methods
make increasing demands for accurate financial forecasting and control at
early design stages.
Realistic models method.
Realistic models are intended to improve estimating accuracy by ,reflecting
87
the effects of the constructional process on the cost. For example, brickwork
will be costed differently at higher levels of the building because of the
overheads required to raise scaffolding and lift materials. Although
apparently more accurate this technique depends upon having details of the
whole construction management process, which are not usually available at
early design stages.
Emphasising the importance of cost modelling to take place in the initial
phases of the design process, Atkin, B. ( 1987) writes
"Is is at early design where the quantity surveyor canexercise the most influence and thereby provide abetter service to clients. Once the early stages ofdesign have passed, the design and, therefore, its costare virtually frozen."(p 60).
Our aim being to allow cost modelling to take place at the early stages of the
design process, it seems appropriate to adopted the descriptive model
method of design costing. At this point two problem areas in the use of
descriptive models can be identified. The first is the method used to produce
raw data on the design variables for the model. The second being the actual
performance of cost analysis as a way of exploring cost situations. The latter
is not going to be dealt with in this thesis, since matters like regression
methods for econometrics and cost data comprehensiveness are beyond the
scope of this research. Nevertheless, an original approach is envisaged for
the production of quantitative data on the design solution using an
'elemental cost technique'.
88
Chapter 6: COST MODELLING IN C.A.A.D. ENVIRONMENT.
"...CAD systems have much to offer the entire designand construction team by acting as a focal point forintegrating all information on a project. As the roleof the QS in management develops, so too should anunderstanding of the tools and techniques by whichthe design process might be managed moreefficiently."(p 13).
Atkin, B.L. (1986)
6.1 COMPUTERS IN QUANTITY SURVEYING.
It is generally accepted that, decisions taken in the early design stages
strongly influence the final building cost. Our aim here is to assist the design
team in producing buildings which are cost effective from the point of view
of initial cost, running cost, maintenance and efficiency of use. To achieve
these objectives, appropriate design tools need to be made available to
designers.
In developing computer aids for building design evaluation in general or for
building cost evaluation in particular, two main approaches can be
envisaged; (1) the implementation of computer programs that mimic
routine processes that exist in the traditional practice of the design
evaluation work, or (2) the development of new methods that take
advantage of the information processing power of computers and the logic
that can be built in the information processed.
In the early 60's, the increasing use of machines for accounting, statistical
and similar purposes, by industry and commerce, has encouraged quantity
surveyors (QSs) to examine their application to quantity surveying practices.
Most implementations consisted of reproducing existing techniques and
methods of bill of quantities production.
89
The following section will describe these early implementations, and will be
followed by a proposal for an integration of 'state-of-the-art' CAAD
techniques to building cost modelling and evaluation.
6.1.1 Bills of Quantities automation.
Since the first developments of electronic computers, Quantity Surveyors
have been interested in the use of machines for the automatic production of
bills of quantities. The preparation of bills of quantities traditionally
consisted ( and still does in most cases ) of four distinct operations ;
(1) Taking-off : The measurement of units of material and labour from
architects drawings, by a standard method.
(2) Squaring : The multiplication of the dimensions of the taking-off to
obtain areas, volumes and linear dimensions.
(3) Abstracting : The process of collecting like items and putting them into
the a standard order, and converting them into the units to be used in the
final bill.
(4) Billing : Transferring information from abstract sheets to final
documents, the bill of quantities.
The last three operations are almost entirely routine processes, and
consequently, lend themselves to mechanisation. One of the first to
advocate the mechanization of the "working-up" process (i.e.: the last three
operation), was H. M. Stafford (1957). He emphasised the need of
standardized quantities for mechanized billing.
The "working-up" involves operations which can be reduced to the five
following functions : calculating, sorting, classifying, summarizing and
recording (Dent 1964). All these basic clerical and accountancy procedures
made, in the late 50's early 60's, an increasing use of machine accounting in
90
such fields as banking, sale analysis, pay-roll preparation, stock control, and
the like.
It is reported by Lancaster Britch, A. (1963) that, in 1958, a firm of charted
surveyors approached Ferranti Ltd to investigate the use of electronic
computers for the production of bills of quantities. The promise given by the
preliminary investigation encouraged the creation of one of the first firms
in the U.K. to exploit the new technology commercially. 'Computaquants
Ltd was set up, and started offering a service to quantity surveyors, who
needed only to send along taking-off sheets to obtain fully processed copies
of the bill of quantity.
During the same period, more ambitious work was going on in the USA.
Where an analysis system that would permit comparative assessments of
cost and benefit at every design stage from schematics to working drawings
was under development (Barnett, J. 1967). This research project used the
'Sketchpad' program (Sutherland 1963, Barnett 1965) as a graphical input
interface to the computerized cost estimating system. What it basically tried
to do was to automate the 'Taking-off' operation for preparing the bills of
quantities. It is interesting to note that this research project was initiated and
carried out by architects, and is described by Barnett (1967), saying :
"The computer programs follow the way in which anarchitect would naturally work, providing a methodof evaluating his own designs, rather thanattempting to automate the design process. The moretypical computer-oriented approach would have beento produce some kind of optimization program thatconcentrated on generating the cheapest possiblebuilding, to the exclusion of everything else."(p 166).
This project was unfortunately given little attention, and ended , up being
91
used only by the small architectural office that developed it. Possibly, because
it was a head of its time, in the sense that computer technology had not yet
matured, and did not enjoy the acceptance it has got now a days among the
architecture professionals.
As computer technology evolved, the techniques for mechanized billing
improved. For instance, punch card techniques were replaced by interactive
keyboard input on screen monitors. More recently, digitizers are used to
take-off measurements from hand made drawings, or less frequently,
measurements are derived from CAD systems. However, the largest use of
computers made by QSs is for cost estimating and cost planning. There are
currently many cost estimating packages available, but they all perform cost
analysis in different ways. The reason for it, is that they were developed by
QSs trying to automate their own mechanised procedures of cost analysis.
Lancaster Britch, A. (1963), had foreseen such situation and identified two
different directions in which machine billing could develop
(a) through individual and unrelated efforts, or
(b) through some centralised body initiating research and development.
It is obvious that the first approach was the most successful, if one may call it
a success.
The architecture profession has usually turned to quantity surveyors for
accurate and timely advice on the cost of construction during early design
stages. The problem of bill of quantities production automation, has been
addressed by both architects and quantity surveyors. Unfortunately, it some
times, was perceived as a threat to the 'convenient' distribution of work
among specialised professionals, especially QSs.
Whereas it is generally the quantity surveying profession that fears loosing
92
some of its work, by the computerisation of bill of quantities production
operations, there are, surprisingly enough, claims that automating
measurement functions is more threatening for the architects, then the QS
(Curran, J 1987).
We have no intention here to get involved in the polemic that surrounds
the issue of bills of quantities automation, and its professional consequences.
Our aim here is to show how it is possible to develop an automatic system of
computer aided building cost modelling, which uses data directly from a
CAD system and obviates the need for manual data entry. Such
development has given rise to new expectations and opened new horizons
for the integration of CAD and cost modelling. The next chapter will
describe in some detail the work undertaken.
6.2 INTEGRATION C.A.A.D./BILLS OF QUANTITIES.
Computer based cost modelling has always held out the prospect of a good
feed back on likely building cost at the early stages of design. It is an
attractive prospect to all members of the building design team. However if
that program can in turn be fed with data directly from a system actually
being used to design the building then at least two important advantages can
be obtained.
Firstly, one of the potential areas of human error has been removed since
most of the data required by the cost modelling system is obtained without
the need for manual entry. Since the CAD system itself reveal any error in
the form of unexpected geometry in perspectives and other views, it seems
unlikely that this data will contain any errors of significance in cost terms.
The second advantage of this integrated approach lies in the ability to design
as opposed merely to estimate. In this regard it is important to consider not
93
only capital cost but all the other criteria the design may have to satisfy.
With an integrated CAD system it should be possible to explore design
alternatives in all their aspects and to be able trade off advantages and
disadvantages. The isolated cost modeller may thus present a useful tool for
the quantity surveyor faced with the task of estimating the cost of a fixed
design. The integrated CAD system and cost modeller may allow that
quantity surveyors to become a more active member of the design team,
suggesting and exploring design changes, which may immediately be
modeled not just in cost terms but also be seen in the CAD system and
studied for all their implications (Belhadj, T.A. and Lawson, B.R. 1989).
6.2.1 CAD/BQ system integration.
Two main approaches can be envisaged to the way quantity surveyors can
exploit the inherent measurement capabilities of CAD systems. First, by
using a dimensioning, scheduling and reporting approach. Which would
consist of extracting relevant information from the CAD system files, and
then transfer them to a database. Second, by integrating computer aided
building modelling and cost modelling.
The first approach consists of creating lists of building parts from a drawing.
It uses the specification and description of elements designed with the CAD
system, and then creates materials schedules. This approach tends to
promote links between CAD and other packages Which could either be
standard database management or spread sheet software, or dedicated cost
estimating and cost planning applications. A project, currently carried out at
the 'Construction Computing Centre' of Napier college in Edinburgh,
attempts to achieve such a link by using a commercial CAD package, where
94
components (eg: walls, floors, etc...) are identified and automatically
measured, then their dimensions are transferred, again automatically, into a
spreadsheet (Curran, J. 1987). Similarly, Ashworth, G.N. & Wilson, R.A.
(1988) described what they call a CAD/BQ (Bills of Quantities) integration
consisting of linking a large commercial CAD system to a dedicated
estimating program developed, on request, by a quantity surveying practice.
These stand-alone programs are some times very good at doing their own
job, but do not make full use of the modelling capabilities that the CAD
system has to offer.
The second approach uses 3D models as the basis for describing the geometry
of the building, with elements sufficiently defined to support later
measurement and evaluation. This means that the building modelling
system will require considerable non-geometrical information introduced
before and during design. This is to enable the production of bills of
quantities without further manual intervention. The measurements in this
case are passed to a built-in module for cost analysis and evaluation. The
latter will be fine-tuned to the capabilities of the computer aided building
modelling system. The claim for integration in this approach, is not just for
having brought together two programs in one application, but to have
enabled two design tasks to take place almost simultaneously on the same
set of data.
The idea that the data required by a cost modeller could be extracted from a
three dimensional CAD system does not in itself seem extraordinary.
However, it does presents quite difficult problems unless the CAD system
itself is able to perform a certain level of 'intelligence'. To examine this idea
it is easier to move towards the kind of CAD system needed in three'steps.
The most basic CAD systems are really simple two dimensional drafting
systems. Here the data held by the computer is entirely abstract and
uncoordinated. The lengths, areas and volumes of items cannot be obtained
from any one drawing of the building, and unfortunately such systems
cannot relate the various drawings in order to obtain three dimensional
data. At its most crude level however, a link to a cost modeller could be
made in which the user points to graphical items within drawings, explains
what they are and leaves the system to compute some basic geometrical data.
Unfortunately this does not really show either of the advantages of
integration as discussed above. The scope for human error and omission is
still considerable and there is no real provision for interacting with a design.
It would simply have to be redrawn and all the work done again. In any case
it is unlikely that a building would be entered into a drafting system until
the design was already reasonably well developed.
The second kind of CAD system we might envisage is a three dimensional
modeller. Here all the major features of the building would be modeled and
their geometrical data could be extracted. However unless the computer also
'knows' what each item is in building construction terms this data must still
be individually explained to the computer. In such a system even the simple
distinction between internal and external walls may be missing.
This then brings us to the idea of an 'intelligent' modeller specifically
designed to hold data about buildings. Such a modeller must clearly 'know'
what each element is (i.e.: wall, window, door, etc...), how it is constructed
(i.e.: bricks, concrete, etc...), and how the elements are interconnected. It has
been concluded that this leads to the separation in the system of three quite
96
------------
specificational locational relational
distinct types of data which were called locational, specificational, and
relational (Lawson 1981). The separation of these kinds of data enables the
designer to make changes which are understandable by the computer in
building terms.
To illustrate these principles we shall consider a simple door. The
specification data here would almost certainly describe the size and shape of
the door as well as its construction, and this data will be common to all
doors of that type in the building. The locational data will describe where
one particular instance of the door type is, while the relational data is likely
to describe the wall in which the door is an opening, the direction in which
it faces and the room or rooms into which it looks. A detailed description of
the data structure used will be given in section 8.1.2., but it is relevant to this
discussion to note that specificational data varies in type with building
elements which are categorised as one of three kinds. There are 'units' such
as doors and windows, 'surfaces' such as walls and floors, and 'edges' such
as eaves. These categories vary in their ability to contain geometric data
within the specification. Described, for example, by its specification, the
'surface' may only contain cross sectional data leaving each instance to
contain the remaining size and shape description within the locational data.
Figure 6.1 - The GABLE BMS three basic data representations.
The GABLE 4D ( Graphical Aids for Building Layout and EvaIllation - 4
97
Dimension ) series building modelling system which was originally
researched at Sheffield University and developed by GABLE CAD System
Ltd. follows these general data structure principles. In this system, the
relational data is automatically developed by the computer using a special
series of routines which so analyse the pattern of building elements that a
room by room model of the building is established in addition to the
elemental model. This enables the designer to extract data about the building
in many ways. For example data can be listed by element, by floor level, by
room, by orientation, or any combination of these. So, for example, it is
possible to ask for the areas of all windows of a particular type facing north
on the first floor or above which look into a particular type of space.
This effect is achieved in GABLE by performing a survey of the building in
which all quantities are automatically measured and, together with
specificational references and relational descriptions of each item, this data is
streamed into a series of data base files which are then accessible to the user (
see Section 7.1.4. ). The specificational data is also held in data base files of
the same format so that cross reference between quantities and specifications
is possible. It is these data base files which are used as the 'link' not only to
the cost modeller but also to other evaluative routines such as those which
provide heat load and solar gain calculation. The data in these files can be
searched and reported upon by using normal data base type enquiry and
report formatting techniques, thus providing very flexible scheduling
facilities. There is also a provision to display this data in graphical form by
creating business graphics type files in the GABLE drafting system (see
section 8.3.2). If required, these schedules and diagrams can be combined
with the original building plans and plotted together.
98
A typical sequence of events during early design stages using the GABLE
system would thus be as follows. The designer would explore the initial
design form, and an 'intelligent' three dimensional building model would
be developed. This model in then automatically surveyed creating a database
of use to many evaluative routines. In turn, this data is used by the cost
modeller routine to create a 'Floor Fundamental Quantities' file in which
each record describes data about a particular floor level. This is effectively
the descriptive model used for costing.
This technique allows editing of the data at any stage, but most usefully for
cost modelling purposes, using the 'Floor Fundamental Quantities' file.
Here, experiments on such descriptive features as the floor to ceiling height,
floor areas and the like can offer the 'DESIGNING TO A COST' facility
describes earlier. Of course the 'COSTING FOR A DESIGN' approach is
satisfied by the appropriate selection of cost rates from the historical data
base of previously modeled buildings.
So far we have demonstrated an integrated approach from CAD to cost
modelling. However, the techniques developed have the further potential
of offering 'space based' cost modelling. Space based cost modelling aims to
draw a parallel between space modelling and cost modelling. It could take
place on either a descriptive model or an in-place quantities model.
Basically, it consists of grouping building elements that belong to the same
spacio-functional unit of the design solution, and permits the identification
and location of cost in the building layout for cost estimating within the
early stages of the design process.
6.2.2 Space based building measurement.
The idea behind space based cost modelling is to add an extra informative
dimension to the cost of a design solution, this being the 'location of cost', or
to suit the architects vocabulary the 'spatial location of cost'. The best way to
illustrate this method is by comparing it with traditional design practice. If
we look at the way information is processed from the client to the architect,
and from the architect to the quantity surveyor, it is clear that in the first
place the client expresses the brief chiefly in the form of functions with
different priorities of inter-communication. From that, the architect
elaborates a three dimensional model where functions are associated with
spaces or rooms. Then the three dimensional model is represented in two
dimensional projections (i.e.: plan, elevation or section), which the quantity
surveyor uses to take off measurements. It is at this stage that an essential
piece of information is lost; the quantities of materials measured from the
drawing are not related to spaces and subsequently the functions to which
they belong.
It is by associating building elements to spaces (or rooms), and by providing
the means to maintain these relationships that it is possible to appreciate the
cost implication of design variations. The integration of CAAD with
'intelligent' building modelling and cost modelling, enables us to preserve
this spatial information, and pass it across to the quantity surveyor for
'intelligent' cost modelling.
This method of cost modelling is not entirely new, and has been in 'vogue'
in the late 60s and early 70s, but did not have much success in the
application field. Under the name of 'spatial costing', its concept was to
express the cost of a room of a certain type in terms of its floor area. ,
Generally, it is accepted that there is a high correlation between the cost of
room finishes, fittings, ceilings and walls, and the activity for which the
room is designed. Other items like infra-structure, structure, external
envelope and services are considered separately. For instance, the cost of a
wall attached to a room would be the cost of the finishings plus
approximately 50% of the structural partition; same thing with floors and
ceilings.
The main reason for the unpopularity of this method is the difficulty in
dividing up the normal bill of quantities measurements of the building into
the room categories for cost analysis purposes. According to Ferry &
Brandon (1984) :
"The room concept requires more complex analysisand is therefore even more expensive to use, It alsolacks the simplicity of the elemental form and theclear communication of what is meant andincluded."(p 112).
This criticism of the spatial costing method is now less valid, because
computer models, when appropriately conceived, enable us to perform
complex analysis and still present it in a simple elemental form. In fact,
Beeston (1987) believes that for a substantial improvement in estimating,
advice to designers and cost control, it is necessary to change fundamentally
the basis of calculation so that it corresponds to the way in which cost arises.
Ferry & Brandon (1984) had anticipated such progress saying :
"Computer models which symbolise a particularbuilding and can build up rates from the basicresource costs are more likely to provide a bettersolution (to the spatial costing method ) in thefuture."(p 112).
The results obtained by the computer implementation of this method,
through its integration to an 'intelligent' CAAD system, have produced
tremendous results. It offers the possibility to involve only a selected
number of spaces on a particular floor level of a building, and/or a selected
number of floors of a computer building model in the cost analysis. The
architect and/or the quantity surveyor are able, for example, to cost
circulation areas independently from office spaces, or compare the cost of
two spaces located on different floor levels of a building, or examine the cost
implication of designing the building in quite different forms.
However, two major deficiencies can be found in this approach. Firstly, the
accuracy of spacial costing, limited by the descriptive model technique used
for cost modelling, is not as accurate as we may desire. The only alternative
is realistic models (see section 5.2.1), but those will require models of the
influences of market forces, to which there seem to be no real answer at
early design stages. Secondly, this approach can only be used once a sensible
three dimensional building model exists in the CAAD system.
A full description of the work undertaken for the implementation of space
based cost modelling will be done in the next chapter.
Chapter 7: SOFTWARE DEVELOPMENT INTEGRATING GABLE
CAD SYSTEM WITH A COST MODELLING SYSTEM.
7.1 GABLE CAD SYSTEM.
The GABLE CAD system began life as an educational and research project at
Sheffield University, Department of Architecture. Its early aims centred
around efforts to help students understand some of the more technical
aspects of building performance using computers to demonstrate the effects
of design decisions.
Since its beginnings, an extensive suite of programs was developed,
incorporating the early research which aimed to simulate comprehensively
building characteristics in terms of appearance, environmental
performance, cost, as well as having facilities for producing conventional
architectural drawings.
The philosophy behind this suite of programs was both that systems should
integrate technical appraisal into the design process, and that its
organisation should cause a minimum of disturbance to the designer. These
basic premises made it clear that its development would have to be based on
an understanding of the way architects approach design and present
projects.
GABLE is intended, not only to aid solving specific design problems when
they occurred, but also as a facility to maximize the benefit of traditional
design methods. Inherent to this sort of approach is the need for flexibility.
Although it has proved necessary to realise building performance
characteristics to a certain extent, the intention has been to impose a
minimum of extra discipline on the designer.
In assessing the various features and benefits of CAAD systems there is one
central theme underlying the debate; how integrated these features are,
since it is only through integration that the real benefits of increased
104
Buil di n g ModellingSystem
Groung ModellingSystem
Object Modelli ngSystem
Data ManagementSystem
I nteg rated DraftingSystem
productivity and better co-ordination of output are achieved. GABLE has
pioneered the development of these ideas about an integrated approach to
computer aided design in the building industry.
7.1.1 General system organisation.
GABLE 4D SERIES:
Gable is made up of a number of inter-related systems (groups of programs)
as seen in Fig 7.1, dealing with two dimensional drafting, three dimensional
modelling, data organisation and the interpretation and evaluation of
building models ( the 'fourth' dimension ). Each system consists of a
number of modules or programs.
Figure 7.1 - GABLE 4D series MODULES -
IDS (Integrated Drafting System) is GABLE's two dimensional drafting
system. Drawings can be created directly in IDS or derived from three
dimensional models produced by other Gable system modules.
OMS (Object Modelling System) is one of the three dimensional modelling
systems. Dealing with purely abstract three dimensional forms, it allows
105
cuboids known as 'blocks' to be defined and decorated with 2D drawings, as
well as full 3D models. Gable will interpret the 3D model to produce 2D IDS
drawings.
BMS (Building Modelling System) extends 3D modelling to give some
knowledge of building construction. Walls, floors, ceilings, roofs, doors and
windows are included in the available elements, the Gable database holds
specifications of these building elements, and the system will evaluate the
model in terms of enclosed rooms and spaces, as well as deriving 2D
drawings.
DMS (Data Management System) is a general relational data base system,
which allows the user to interrogate and modify the database Gable uses to
hold its knowledge of specifications and properties of elements.
GMS (Ground Modelling System) is a 3D modelling system with special
features and elements for modelling land forms and sites.
Various other modules concerned with system management, plotting
drawings, etc. are grouped together in a utility facility.
7.1.2 Modules description.
GABLE 4D Series is primarily a building design system (CAAD - Computer
Aided Architectural Design).
Non-graphical
modules
Graphical
modules
Data ManagementModule
3D modules
2D modules
Figure 7..2.1 - Graphical and non-graphical modules.
Its modules, can first of all be grouped into two categories, (1) graphical
modules, and (2) non-graphical modules (Fig 7.2). The graphical ones will
require a specific hardware to support interactive graphic operations,
whereas non-graphical ones could be used on alpha-numeric consoles.
Figure 7.2.2 - 2D and 3D modules.
A further subdivision, with in graphical modules, will distinguish between
(1) two dimensional, and (2) three dimensional graphic modules (Fig 7.2.2).
However, GABLE allows information to be exchanged, between the two and
three dimensional systems. In other words, the 3D system not only allows
users to view the model, but pass these views as drawing files into the 2D
system. Similarly, 2D drawing files can be passed back to the 3D system.
Thus these two systems taken together can provide for the three
dimensional co-ordination of drawings. For example, if an element was to
move in the 3D model, it will be possible not only to see it in the new
position in any 3D view but also to update the 2D drawings ( eg: plans,
elevations, sections or perspective ).
B MS
OMS
GMS
DMS
IDS
Figure 7.2.3 - GABLE 4D SERIES integration.
The 3D environment on GABLE is further sub-divided into three different
modelling applications, each one addressing a particular design modelling
need (Fig 7.2.3). For instance, OMS supports the modelling of objects in
three dimensions, these are made-up of lines and surfaces. Similarly, GMS
supports the modelling of site layouts using specific elements to suit ground
modelling and surveys (i.e.: spot-heights, strings, break-lines, etc...). There
are currently plans to develop and urban modelling system (UMS), which
would handle urban design situations. More related to our research is BMS.
It supports the modelling of buildings, which in addition to OMS elements
uses building-specific elements -internal and external walls, roofs, floors,
ceilings, doors and windows.
With reference to the CAAD systems differentiation made earlier in chapter
3, GABLE can be considered in part as an 'elemental modelling' based
system, of which BMS is the core. Since this research is mostly related to
building design and evaluation, we shall concentrate on BMS and its related
applications.
108
7.2 Model building with GABLE BMS.
A GABLE building data model is composed of three main classes of
elements : surfaces, edges and units. To enable the user to rapidly develop a
model which is comprehensible to the system, all the main component
parts of a real building are considered as falling into one of these categories.
Any complex element must be built up from these basic units. The user
adds elements on-screen, usually by means of mouse, bit-pad or puck.
It might be useful to use an example to illustrate the model building process
in GABLE, and go through the sequence of events necessary to generate a
building computer model. For this purpose, we shall use as a model, a
small flat the author lived in during his stay in Sheffield.
7.2.1 Elements specification.
First, it is necessary to specify the building materials, or building
components that are going to be used for the construction of the model.
These are grouped into three ; (1) surface specification, (2) windows and
doors, and (3) staircase design.
SURFACES SPECIFICATION:
This is done using Module 391 of GABLE system. It consists of defining
building materials, by describing their density, thermal conductivity, heat
specification, etc.. For example, a record structure of the material file will be
Figure 7.3.2 (e) - Report of the building survey file : ISAAC,
135
Windows and Doors Specification
Surfaces Specification
i
-
--......i.--CREATE BUILDING MODEL
I
--..........-
-
Interpret Building Model _
Survey Building Model
i
----.......--
Varied fields as room acoustics or sound insulation, artificial lighting or
solar penetration, structural analysis or checking of building regulation can
use the geometrical, specificational and relational information contained in
five survey files. Cost evaluation is one of the appraisals that can make an
extensive use of surveyed data, and will be described in the next section.
7.4 THE COST MODELLER.
The diagram in Figure 7.3.3 should describe GABLE features used to arrive
at a building cost model.
COST MODELLER
MOD390/M0D391
MOD 320
MOD300/MOD630
MOD 385
Figure 7.3.3 - GABLE modules pre-requisits for COST MODELLING.
The next sections will describing the work involved in the development
GABLE - Module 385, or in other word the 'COST MODELLER'.
7.4.1 Concept description.
136
The development of a building cost modelling module in the GABLE CAD
system was aimed at enabling practical early cost evaluation. This new
module is to contribute in promoting cost data analysis to discover
systematic cost variations, with changes in design parameters contained in
GABLE building models.
For this purpose, it was decided to analyse a piece of existing cost modelling
software, to get a better understanding of what is being done in the field.
A quantity surveying practice was approached, and an agreement was made
to make available a cost modelling program that was initially developed for
the own use of that practice. The software came with a user manual, but
consultations were regularly exchanged to make sure that the package was
used correctly.
It was soon revealed that "Bucknall Austin Plc." cost model program suited
our aims, and the next step consisted of analysing it for an eventual
adaptation to GABLE CAD system. It appeared from that analysis that the
software had several features organised around a central cost modelling
'unit'. The diagram should in Figure 7.3.4 illustrates the articulation of its
main features.
MODEL FUNDAMENTAL QUANTITIES
ELEMENTAL UNIT QUANTITIES
ELEMENTAL UNIT RATES
_______.----•--"--......_„_
HISTORICAL COST DATABASE
Figure 7.3.4 - Main features of 'Bucknall Austin' cost modelling system.
Bucknall Austin Plc. have based their cost consultancy strategy around
ELEMENTAL COST PLANS, which are prepared for all schemes. The role of
the element cost plan as a cost control, cost monitoring and cost checking
tool is a fundamental part of the practice strategy ( Patchell, B.R.T. 1987).
The practice recognised the need for an additional form of cost planning,
else then abbreviated quantities techniques. The argument was that budget
should never be based on gross floor area rates, as they do not take into
account shape, form or volume. Also, abbreviated quantities cost plans
require considerable details and variations in options, which require
remeasurement as there is little re-use of the abbreviated quantities.
A very similar approach to cost analysis was taken in the development of
Module 385. However, more emphasis was put on the measurements
production process in conjunction with the CAD system. The number of
items of 'fundamental' building works quantities, was dictated by the type
of building elements that GABLE BMS can support.
Technically, the cost modeller attempts to make to best of GABLE's ability to
provide specificational, relational and locational data with each building
element of the building model. Thus, fundamental building quantities, can
be located in the building (i.e. : floor level and/or space location ), and can
be related to each other or to the space and/or floor they belong to ( i.e.
windows and doors relation to the walls they lie in, or doors and windows
relation to a particular room on a specific level of the building ), and can be
associated to a specification of building material.
Figure 7.3.5 - Hierarchical tree of the elements relation to the building.
A typical sequence of events during a cost modelling cession on GABLE
CAD system would be as follow. The designer would explore the initial
design form, and an 'intelligent' three dimensional building model would
be developed. This model is then automatically surveyed creating a data
base of use to many evaluative routines. In turn, this data ( i.e. : LEVEL,
ROOM, ISAAC, LAYOUT and OPENING files ) is used by the cost modeller
routines to create different files.
The user is given the option to group the building measurements around
spaces or floor levels, before producing a 'Building Elemental Model'
(BEM). The building elemental model is the ultimate representation of the
building measurements for the cost analysis, it currently uses the Ci/Sfb
format but could equally well be in BCIS or any other similar standard. It
contains information on different building works, and the quantities of
building elements involved in the construction of each of those. A sample
of a BEM file can be found in Appendix 10. To arrive to a BEM file, the user
will have to
:GABLEJOB:TAMI:DMS:SF0
RECORD 1CODE 0
RECORD 3CODE :2
RECORD 5CODE :4
LEVEL 0 LEVEL :0 LEVEL : 0GROSS AREA 9.46 GROSS AREA : 2.23 GROSS AREA : 12.17SPACE TITLE CONSERVATORY SPACE TITLE : CORRIDOR SPACE TITLE : KITCHENSPACE NUMBER 1 SPACE NUMBER :3 SPACE NUMBER : 5SPACE TYPE 0 SPACE TYPE :0 SPACE TYPE : 0EXT WALL BEDS 2.10 EXT WALL BEDS : .64 EXT WALL BEDS : 1.36INT WALL BEDS .56 INT WALL BEDS : .23 INT WALL BEDS : .49EXT STOREY HT 3000.06 EXT STOREY HT : 3000.06 EXT STOREY HT : 3000.06INT STOREY HT 2999.89 INT STOREY HT : 0000.00 INT STOREY HT : 2999.92EXT WALL AREAINT WALL AREAEXT WIND AREAINT WIND AREAEXT DOOR AREAINT DOOR AREACEILING AREASUSP. CEILINGGR. SLAB AREAROOF AREA
28.3915.04
: 9.18: 3.60: 1.89: 1.57: 9.46:0: 12.15:0
EXT WALL AREAINT WALL AREAEXT WIND AREAINT WIND AREAEXT DOOR AREAINT DOOR AREACEILING AREASUSP. CEILINGGR. SLAB AREAROOF AREA
: 8.55: 13.80:0:0:03.15
: 2.23:0: 2.10:0
EXT WALL AREAINT WALL AREAEXT WIND AREAINT WIND AREAEXT DOOR AREAINT DOOR AREACEILING AREASUSP. CEILINGGR. SLAB AREAROOF AREA
RECORD 2 RECORD 4CODE :1 CODE :3LEVEL :0 LEVEL :0GROSS AREA : 18.08 GROSS AREA : 6.48SPACE TITLE : ROOM SPACE TITLE : BATH ROOMSPACE NUMBER :2 SPACE NUMBER :4SPACE TYPE :0 SPACE TYPE :0EXT WALL BEDS : 2.00 EXT WALL BEDS : 1.22INT WALL BEDS : .66 INT WALL BEDS : .26EXT STOREY HT : 3000.06 EXT STOREY HT : 3000.06INT STOREY HT : 3000.06 INT STOREY HT : 3000.00EXT WALL AREA : 26.66 EXT WALL AREA : 16.31INT WALL AREA : 25.69 INT WALL AREA : 15.34EXT WIND AREA :0 EXT WIND AREA : .22INT WIND AREA : 3.60 INT WIND AREA :0EXT DOOR AREA :0 EXT. DOOR AREA :0INT DOOR AREA : 1.57 INT DOOR AREA : 1.57CEILING AREA : 18.08 CEILING AREA : 6.48SUSP. CEILING :0 SUSP. CEILING :0GR. SLAB AREA : 20.74 GR. SLAB AREA : 7.96ROOF AREA :0 ROOF AREA :0
Figure 7.3.3 - Sample of the COST MODELLER - SFQ file.
:GABLEJOB:TAMI:DMS:FFQ :GABLEJ08:TAM:DMS:FFQ_TEST
RECORD 1CODELEVEL
.o
GROSS AREA 50.74GRND SLAB AREA 58.10LET USE AREA 48.43EXT STOREY HT 1534INT STOREY HT 1534EXT WALL AREA 98.02INT WALL AREA .00EXT WIND AREA 11.20INT WIND AREA 3.60EXT DOOR AREA 1.89INT DOOR AREA 6.30ROOF AREACEILING AREASTRCASE FLIGHTLIFT FLIGHTS :SUSPENDED CEARSANITARY FITNS 3NO OF SPACES 5
RECORD 1CODELEVELGROSS AREAGRND SLAB AREALET USE AREAEXT STOREY HTINT STOREY HTEXT WALL AREAINT WALL AREAEXT WIND AREAINT WIND AREAEXT DOOR AREAINT DOOR AREAROOF AREACEILING AREASTRCASE FLIGHTLIFT FLIGHTSSUSPENDED CEARSANITARY FITNSNO OF SPACES
:0:0: 40.60: 55.41: 38.96: 3000
:(930.23: 79.54
;(202).
:0: 5.51:0: 38.96:0:0:0:3: -4
Fig 7.3.4 (a) - FFQ file for the allbuilding model.
Fig 7.3.4 (b) - FFQ file for themodel without conservatory.
140
create a Floor Fundamental Quantities (FFQ) file, in which each record
contains data about a particular floor level in the building ( see Appendix
10.6 ). This could be the descriptive model used for costing.
MODULE 385 - THE COST HODELLER
F.F .Q.
B.E .M.
`.....____.../
Figure 7.3.8 - The COST MODELLER file production sequence.
Since GABLE can support the modelling of buildings that have up to one
hundred floors, the FFQ file will contain up to that number of records.
However, the user can combine any selected number of floors to be
included in the Building Elemental Model. This last option is the first
move towards the 'designing to a cost' facility described earlier. Although, it
should be used carefully since the interpretation of spaces three
dimensional adjacencie is not provided.
7.4.2 Space based cost modelling.
Alternatively, the user can create a Building Elemental Model, out of a
Space Fundamental Quantities (SFQ) file. The techniques developed in the
corse of this research, have shown the potential of offering space based cost
141
modelling. It basically consists of grouping building elements that belong to
the same spatio-functional unit of the design solution. In the SFQ file each
record describes an individual space rather than a complete floor level ( see
Appendix 10.5). By relating building elements to spaces, and by providing
means to maintain these relationships, it is made possible to appreciate the
cost implications of space design modelling.
At early design stage it might be useful to include only particular spaces on
each floor level. In which case, quite sophisticated corrective calculations
can be made by the system because of the way it retains spatial location data.
If, for example, a particular space is omitted from the data, then the walls
specification of its neighbouring spaces may change from internal to
external, if appropriate, entirely automatically. Thus experiments can be
conducted without the need to return to the three dimensional building
model while still maintaining the constructional logic of the building. This
has been possible with the full combination of locational, specificational
and relational data which can be obtained from the 'intelligent' building
modelling system described earlier in the thesis.
7.4.3 Cost analysis.
The final link in the chain involves the inclusion of cost rate data applied
to the Building Elemental Model. Therefore, a data base of rates must be
established from which appropriate rates may be selected. These rates are
elemental unit costs, and are worked out by measuring existing buildings,
or by automatically surveying previously designed ones. In either event the
measurement method has to be similar to the one used by the 'cost
0 .4. 0.00000 m '.: 007-7-071037.1..raN Iv ZE V. 0. .0 MV IN Li,' M. .
m itS.1 0...,,
...r. t ,E
t 0-0 00....u 0, 0 . E .7....
Cr 0000000 "F. f7000vV0MC .0 - 'E'< .N .a. a . v . M N
5. F 1-I- . E. .M. -00E .N . F7: '6'7.
_0-0, 0-.
z z5 c ..L. T;ccog. . < 0.74105:05:7
cm.m0m0..., 0 m6 o .r t. •
. r=ZN 0 -. .r. -. 1
O Enn'i S g E EZEE i 5 T721t72
;
1.0.1
O• .N0vANo MMMMMM0LI
om 0• u0mmC000 0 ItN a
F W 053,23000. XL- no,o I-.WU
44,
rC) 4-7,5:47-a M:s.0M.e71a2 • • • • •OF 0. v m 7 r. 0a.< v.01-1,(La .
Id• I-Nm,N0C NNNN,NNCI
4/, 4
aro•= .5 - 7,
• romc...so• .700
w
•
%00.0..coc.0.-.00c171 UOC.:44
I.N0vANOvVVVV”
Figure 7.4.1 (b) - BEM file report for the building without conservatory.
144
and of compatible format (i.e.: Ci/Sfb or BCIS in the context of this research).
At this stage all projects in the cost data bank are categorised by building
types, and given a general description.
For example, a project can belong to the category of 'residential buildings',
and described according to its size, shape, type of construction, installations,
site abnormals, location and tender type. All of this data is held in standard
data base files with the same format as all quantities and specification data.
This enables us to use standard data base enquiry , selection and cross
referencing techniques to find the most suitable project from which to select
the cost data. It then simply remains for the cost modelling system to extract
the appropriate rates from this project and apply them to the currently
modeled one. The Building Elemental Quantities file will see its quantities
multiplied by the imported rates, to arrive at a final cost model for the
building.
In fact, the multiplication operation in this case is made more sophisticated
by attaching a price adjustment factor to the rate after it is imported from
the cost data base. In addition to allowing for such standard items as price
rises or regional variation, this also allows for further modelling
possibilities from within the Building Elemental Model file. Operations
such as adjusting the rate of a particular building element are thus made
possible simply by increasing or decreasing the price adjustment factor for
that item, without altering the original imported rate.
It is suggested that the cost data bank should be organised in such a way, that
any imported cost data is adjusted before use in a cost analysis.
145
rfr
0
/—
U_
Cl'Si
6000
5000
4000
3000
2000
1000
7000
6000
5000
4000
3000
2000
100C(.4
0
ELEMENT
Figure 7.4.2 (a) - Bar-chart of cost analysis for the all building model.
ELEMENT
Figure 7.4.2 (b) - Bar-char for cost analysis for the building withoutconservatory.
146
DMS COST DATA BANK
41::::r
C097 DATA
SEL_ECTION
Figure 7.4.3 - Cost data bank interaction with the CAAD system.
147
This is to control the distortion of rates generated using a particular method
of measurement, and the applied to an other measurement method. The
diagram shown in Figure 7.4.3, describes the cost data bank interaction with
the CAD system and the cost information supplier.
The sequence of events described above can be repeated for a different
combination of spaces (or rooms) contained in the building model. For
example, a Floor Fundamental Quantities file can be created out of a
selected number of rooms. In Figure 7.3.4 (b), the FFQ file represents the
building model quantities without the 'conservatory'. From that file a cost
analysis is performed to estimate the cost variations due the change in the
design ( i.e. the omission of one space ). It is important to note that the
geometrical model has not been altered, instead, the survey data will change
according to the new design layout situation.
A Building Elemental Model file is then created, and rates imported from
the cost data bank. A report of the new BEM file is shown in figure 7.4.1 (b).
If it is the same rates as the previous cost model that are imported, which is
the case in this particular experiment, it might be useful to compare the two
BEM files. In other words compare the cost distribution in the cost model
representing all the spaces contained in the building model, with the cost
model representing the building model without the 'conservatory'. To ease
such a comparison, histograms have been produced of each BEM file, and
are shown in Figures 7.4.2 (a) and 7.4.2 (b). It can be seen on these diagrams,
that it is the completion cost that has the most dramatically been cut down.
For the obvious reason that the conservatory with its large windows, bears a
large proportion of the completion cost.
148
This approach to cost modelling has made 'cost location' a realistic option
during design costing. Nevertheless, there are two major deficiencies in it.
Firstly the accuracy of descriptive model techniques is not as high as may be
desired, however there seems to be no real answer to this at early design
stage. Secondly, this cost modelling system can be used only once a sensible
three dimensional building model exists in the CAAD system.
Behind this work lies an attempt to increase our capability to predict
building cost whilst the building design is still fluid enough to allow for
changes which might be suggested by cost modelling, and to be incorporated
in the design as smoothly as possible.
0Cl)
00
0
150
Chapter 8: DESIGN OFFICE AUTOMATION AND CA.A.D.INTEGRATION.
8.1 LINKING GRAPHICS, WORDS AND NUMBERS.
The roles of the computer in the design office have been described in
section 4.1.2., and its use as a generative and/or analytical tool was
discussed. This research work on computer aided building design and
evaluation has highlighted the importance of relating graphical
information to numerical and textual information.
In the particular case of cost modelling, we have seen that by locating
building elements spatially and relating them to each other, it is possible to
estimate and model consistently the cost of a design solution. The design
solution is modeled graphically, with the visualisation of the CAD system
helping to reveal any error in the form of unexpected geometry. The
implicit logic of relationship between the building elements, built in the
computer model, is used to monitor the modelling of textual and
numerical information attached to the model. Words and numbers are
either attributes describing intrinsic properties of building elements, or
indicating in what context they were used. The storage of the graphical
information and the numerical/textual information is shared between a
graphical database, and a standard general purpose database ( in our case of
the relational type ). This arrangement is very promising for media
integration in design office automation.
8.1.1 Design office automation.
The separation between drawing and, say, specification writing, is largely
the result of using two different media, graphical and textual/numerical.
The isolation of these tasks is not always desirable. We have seen that,
151
when designing, different kinds of information are handled. Lists of
materials, such as windows, doors, hardware and finishes, are as important
to design as drawings; they are often selected by consulting manufacturer's
catalogues, which in turn use drawings to give dimensions and describe
their products. Design specifications are written by adapting this existing
information to a specific project. For example, to estimate the cost of a
construction, specific quantity information has to be extracted from
drawings, and price information from a costing database, and then combine
the two.
In designing and documenting a single decision or detail, it is often drawn,
listed, scheduled, engineered, specified and costed in different steps. In
doing this, there can be a tremendous amount of redundant work involved
in handling a single building element.
Computers can be useful in bridging some of the gaps imposed by different
media. In this respect, Crosley (1988) suggested that, first, computers can
enable the transfer of information from one medium to another,
eliminating the need to recreate it. Second, some computers can do more
than one thing at once, a process called 'multi-tasking'. By combining these
two capabilities, things can be done that are impossible to envisage using
traditional methods. The beauty of such a thing is that decisions can be
made while designing, based on information accessed very rapidly, which
could be modified later, then reported in textual or numerical form.
When talking about design office automation and the linking of graphical,
textual, and numerical information, we ought to distinguish between
processing information during conceptual design, and presenting that same
information after the design is completed.
It has been show in section 4.1.1, that the automation of the design process
152
as such is not suitable. First, because design decisions are largely concern
with value judgement, and second, because the machines used for design
automation are at the moment processing information sequentially,
whereas design rely on forms of parallel ( or lateral ) thinking and multi-
variable problem solving. However, computers can be very useful during
early conceptual design stages, if they provide a suitable environment for
problem re-structuring, and allow the overlapping of the different design
stage (i.e. : analysis, syntheses and evaluation). It is to the latter issue, that
this research work has aimed to contribute, and while doing so, it has been
revealed that it is essential to be able to link graphics, words and numbers,
to achieve any improvement of the computer's role in conceptual design.
For the successful processing of information among various members of a
multi-disciplinary design team, during the conceptual stages of design, it is
essential to allow the design information to be exchanged in its various
forms ( i.e.: Textual, numerical, and graphical (or pictorial) ). More
importantly, the implicit relational information contained in the two and
three dimensional computer models, must be consistently kept whenever
an information exchange occurs. This has been demonstrated earlier, and is
considered as key element of progress in the field of design office
automation.
On the other hand, the quality of design information presentation rely also
considerably on the ability of a computer system to handle different media.
Integrated software applications, which have been available for some time,
are programs that include word processors, database managers and spread
sheets. They are supposed to offer the ideal solution for data transfer
between different applications. Whereas, in the architectural and
153
engineering office, most non-graphical tasks can be done with the help of
integrated packages. These become of little help when it is required to
handle graphical information.
A solution to this problem is offered by what is called Hypermedia. Before
describing a hypermedia environment, it is better to first introduce the
Hypertext concept, which is at the source of this new technology. Ted
Nelson (1967), one of the pioneers of hypertext, defined it as
"a combination of natural language text with thecomputer's capacity for interactive branching, ordynamic display... of a nonlinear text...which cannotbe printed conveniently on a conventional page."
More recently, Conklin, J. (1987) in a comprehensive survey of the subject
writes
"The concept of hypertext is quite simple: Windowson the screen are associated with objects in a database,and links are provided between these objects, bothgraphically (as labeled tokens) and in the database (aspointers)"(p. 17).
Hypertext could be described as being, in its original form, a tool that
provides access to a large text or document, with mechanisms to make links
between any two pieces of information in the system. However, with todays
computer technology, a logical extension to Hypertext has produced
Hypermedia. Which instead of linking just text, users can link to other
media, such as graphics, video, spreadsheets, animations and voice. In
short, users of hypermedia systems can link together information of any
media type provided by the current technology.
There has been attempts to make use of a Hypertext system for CAD
applications (Delisle, N. and Schwartz, M. 1986), but so far, the techniques of
this new concept seem to be restricted to word processing and data base
154
management applications.
It would certainly be interesting to see CAAD benefit from Hypermedia
technology developments. Nevertheless, there are already information
technology products available, based on similar techniques, that can be
profitable for designers. Some of them are described next.
8.1.2 Multi-media CAAD applications.
A variety of applications can be developed based on the interaction of
graphical and non graphical information in a CAD environment. Some
have recently emerged from such combinations, like Facility Management
and Geographical Information Systems.
The aim of the CAD system in a facilities management package is to enable
an office manager to 'see', by looking into a database, a drawing of a
particular floor or of a whole building and to be able to manipulate items
around the office. The flexibility of the database is essential, with the ability
to manage reports as well as make structured complex enquiries (Lawrence,
A. 1988). Very much similar to what we have been doing to enable cost
modelling to take place at early design stage, but in this situation it is post-
occupancy evaluation and building maintenance that it is aimed at.
For example, facilities management applications will enable text data to be
built up around items in the drawing. Typically this data will include code
numbers, costs and date of purchase, description, dimensions, maintenance
schedule, special problems and so on. Location information should be
automatically handled by the CAD system. By using this information a
facilities manager is able to 'see' what is going on in the building. It is
possible to pick out items from the 2D or 3D model and check on their price,
their age, their maintenance schedule, their history, and so forth. It is also
possible to take an item from one room to another and all the textual
information relating to that item will go with it. Facilities management at
present is still in its infancy, but has potentially lot of promise. In the long
term, as networking technology advances, it might become the main
building block of the future building control system.
Another application that emerges from the two way link between CAD
systems and database management, is what is now called Geographical
Information Systems (GIS). This allows the contents of databases to be
displayed against a map. A reason to make such applications so powerful is
that so much everyday data has a spatial element, that is, it can be related to
a specific location on the Earth. This includes, for example, data on the
distribution of natural resources, the location of buildings, the incidence of
pollutants, the infrastructure of utility and transport services and even the
population's health, wealth and voting habits (Sweet, P. 1989).
The techniques used here are not radically new, but the refinements in
relational database technology and the increasing availability of digital data
(eg. satellite digital pictures) have all combined to take GIS out of the
research institutions. GIS offer important savings in the labour required to
keep the maps up to date and reduce chances of error (Bennion, F. 1989).
Although, this type of application do not appear to have direct relevance to
architectural design. It has the substance to support architectural design
decision, by allowing rapid access to urban and regional planning
information.
8.2 FROM DESIGN TO MANAGEMENT.
The last decade has seen a rapid change in the roles of some architects,
quantity surveyors and builders. As George, B.W. (1988) put's it :
"Any architect, if he now wishes, may build; at thesame time builders are offering design services andquantity surveyors are some times seen as a threat toarchitects and builders by offering projectmanagement services" (p. 4).
This new situation, however exaggerated, did not occur instantly, and it is
believed that several reasons have helped bringing it about. For example,
the industry/profession fragmentation due to the fluctuating workload
caused by the receding economic situation, is believed to have increased
competitive pressures on adjacent professions (McGee, J. 1988). However, it
is not the intention to investigate the causes of this new condition, but to
help manage it adequately.
The role of information technology in accomplishing this professions
overlapping can be consequential. In fact, the subject of this thesis is an
example of the new technology potential to bring together the efforts of the
architect and the quantity surveyor at the earliest stages of conceptual
design. Yet, this work would be of limited impact on the whole building
process, if the construction is conducted without a formalised project
management system. It is obvious that there is no point is conducting a
design in a fraction of its ordinary time, when the construction process is
lasting as long as it usually does. Hence the importance for information
technology to extend its support to project and construction management.
157
8.2.1 Managing the whole design and construction environment.
Amid the existing applications for project and construction management,
two general categories of computer aids can be distinguished. First, systems
for strategic planning of a construction prior to formal design, and second,
systems for the monitoring and controlling of the construction operations.
Both benefit from the development of formalised computer based project
management techniques, which mainly rely on the 'Programme Evaluation
and Review Technique' (PERT) and the Critical Path Method (CPM). This
methods had their infancy in the early 1950's and considerably progressed
along side the computer technology.
Advocating the application of CAD to construction management, Atkin, B.
(1985) argues :
"In practice, tacking account of the ... constructionfactors would be difficult if the processes were of anentirely manual nature. However, the use ofpowerful computer-aided design systems,incorporating database management system, mayprovide part of the answer"(p. 146).
In fact Atkin (1986), at the Department of Construction Management at the
University of Reading has conducted a project into the use of computer
aided design systems as tools of management. Among his
recommendations, he suggests the use of inferencing mechanisms in
conjunction to CAD databases to analyse the construction process based on a
computer building model.
As fas as construction management prior to detailed design is concerned, a
concrete solution has been put forward, based on the latest information
technology techniques. This is a construction project planning Expert
158
System (ES), resulting from the unique construction industry involvement
in the Alvey program ( see section 3.1.1 ). Elsie ( it is the name of the
package ) supports The Strategic Planning of Construction Projects , and
consists of four modules representing different types of ES problems
(Brandon, P.S. 1988) :-
(1) Financial budget - to determine the cost of the structure proposed for a
given standard of building. In this module the user has to answer
approximately twenty five questions on the designed building ( the system
considers only office buildings ), from these the software gathers an
indication of quality, form and size which allows it to 'derive' a
specification for the building.
(2) Procurement - this module determines the suitable type of contractual
arrangement between the client, designers and the building team. Its
suggestion of procurement method is defined by five major strategies in
common use in the UK construction industry ( i.e.: Conventional, Two-
stage tendering, Management contracting, Construction management, and
Design and build ).
(3) Time - forecasting time is a key feature in building construction
development strategy. Consequently, this module makes an assessment of
the time required to construct the building, and tries to optimise the overall
development time.
(4) Development appraisal - finally, this module gathers up information
used in the other modules together with inputs by the user to discover the
viability and profitability of the scheme.
In a series of articles reviewing Elsie, Ashworth (1988) reports that :
"... the approach adopted (i.e.. expert systems) has ledto a simpler linkage of the four modules than could
159
have been achieved with conventional programs."(p51).
Justifying the initial 'avant gard' picture given to the RICS (Royal
Institution of Chartered Surveyors) involvement with the Alvey program,
marking the move of the profession into so-called fifth generation
computers (see Building, 15 November 1985, p 97). It is believed, for
example, that using ES makes it easier to produce more transparent and
provide better explanation to the system decision making procedure in the
case of the Financial budget module.
The performance prediction of an architectural product designed on a
computer system, will use algorithmic and knowledge-based computer
programs to support rational design decision making (Schmitt, G. 1987). The
system described above is based on knowlege-based programming
techniques, whereas the cost modelling system presented in this thesis in
based on algorithmic programming techniques. The combination of the two
techniques, as well as the interaction between graphical and non-graphical
design representations, is a forcible development in information technology
application to architecture and construction. Some issues of such
development are looked at in the next section.
8.2.2 Main issues in current C.A.A.D. development.
Throughout the development of computer aided architectural design
systems, various socio-professional and technological issues were raised.
Some of them were perceived as 'problems', and were adequately addressed,
whereas others still remain unclear and require further investigation.
These could be grouped in two main categories, social issues and
technological issues.
160
- Social issues :
(1) Changing the structure of professions.
What may be the most significant implication of CAD introduction in the
design office, is the impact it potentially has on re-shaping professional
relationships and structures. We have seen earlier, in Chapter 2, that the
complexity of modern design problems have separated designing from
making, and that professionalisation has reinforced the remoteness of
architects from builders. CAAD, and most information technology tools for
that matter, offer the possibility to dismantle the existing strong
professional barriers that have been discouraging communication between
the various members of the design and construction team (McGee, J. 1988).
There are, in CAAD, opportunities for designers to reconsider the way
information travels between the members of the design team.
(2) Computer Aided Participatory Design.
The other major social implication that computers, as a new technology,
have on our lives is their effectiveness in improving public involvement
in design. Computers as education and communication tools have the
ability to supplement and support participation such as workshops and
public meetings. This practice is called Computer Aided Participatory
Design (C.A.P.D.), it aims to improve the traditional participatory design
methods in quality and frequency. In the first place, the emphasis of CAPD
is on preparing both the public and professionals to participate more fully in
the design by having equal access to information. With later, the possibility
to provide the same public with three-dimensional images of the
consequences of environmental decisions (Quayle, M. 1987).
161
(3) The myth of Information Technology.
What is considered as the myth in this information technology era, is the
notion that we are entering a radically different stage of human history.
Masuda, Y. (1985), in his vision of 'Computopia', argues that the post-
industrial society will be an information making and consuming society,
where the production of information values and not material values will
be the driving force. This might be true, but there is no sign that such
change will have any effect on the economic, political and cultural state of
order ( or disorder ) the world is living in.
Hamelink, C.J. (1986), agues this point by writing :
"It (information revolution ) expects that theapplication of computer-steered technologies willeffectively terminate a social structure which ischaracterized by an endless struggle between winnersand losers, between rulers and ruled."(pp 7-8).
In fact, information technology retains the tendency where an innovation
or invention which ought to increase the independence of the many, tends
to become an instrument of even closer control by the few. What generally
tends to happen is that a technical discovery leads to cheaper cost. The
saving is used to make greater profits, which are then instantly reinvested
in the battle to seize an even greater share of the market (Ascherson, N.
1987). There is relatively little we architects can do about this, but it is
important to be aware of the potentials of any radical change in social order
during this period of 'paradigm' shift.
- Technical issues :
(1) Computers parallel processing capabilities.
One of the crucial points in computer development is the hardware
performance. We have seen earlier, in section 3.1.1, that computer
architecture was at the breach of a radically new implementation, using
162
parallel processing machines. This will almost certainly be of significant
influence on future developments in CAAD. It could be either by allowing
the production and processing of high resolution images at very high speed,
or also by enabling the exploration of radically new implementations, closer
to human parallel information processing, using the parallelism of these
machines.
(2) Computer user interface.
Most CAD system developers are now taking advantage of the latest
developments in personal computing and human interface research by
including icon driven, direct manipulation menus on Work Stations. This
user interface has promoted a direct manipulation approach to the process
of drawing on CAD systems, which can be as natural and as comfortable as
manual drafting.
(3) CAD data exchange in the building industry.
In a forecast made on the UK construction industry by the National
Economic Development Office (NEDO) CAD working party (Building, 14
April 1989, pp 88-89 ). It is expected that by the middle of the next decade,
most of the large construction firms will use CAD on the majority of their
projects, and it is expected that their will be need to exchange data (
graphical data essentially ) on a large proportion of these projects.
Exchanging data between different CAD systems can be in effect a
considerable burden to CAD users. The absence of a standard file exchange
format, is certainly causing a considerable confusion among CAD users and
software developers. Some attempts to arrive at a 'universally' accepted
graphics file formats were made (see section 3.3.2), but with relatively little
success. It is hoped that in the future a solution is found to this problem, as
163
it bears a large responsibility on CAD's acceptance in architectural practice
and education.
164
Chapter 9 : CONCLUSION.
The initial research proposal of this project was aimed at studying the
'combination of the analytical and generative ways of using computer-aided
design, and examining the influence of such implements on the design
process'. There was no problematic as such, but rather a general interest in
the way two main approaches to the use of computers in architectural
design could co-exist, and a concern for the impact this might have on the
traditional practice of design.
From the first readings of the Computer Aided Architectural Design
(CAAD) literature (Mitchell, W.J. (1977), Cross, N. (1977), Raynolds, R.A.
(1980) and Paterson, J. (1980)), it appeared that the undertaking of such a task
required some background knowledge of design theory and design
methodology, as well as a fair understanding of the concepts behind the
computer technology.
During the course of acquiring such knowledge, it became clear that there
were many potentials of CAAD that were yet to be exploited. It was observed
that, at a time when the increasing availability of computer aided design
tools made building model visualisation for aesthetic examination
accessible to most designers, the possibilities of computer aided building
evaluation were still very limited.
The research environment at the GABLE Research Unit, and particularly
the GABLE 4D-SERIES CAAD system governed the succeeding
developments of this research. After a period of time spent at getting
familiar with the system, along with in depth investigation of the CAAD
subject matters. It became clear that the emphasis was going to be put on
computer analytical design as against generative design. , Among the
building performance characteristics looked at, cost evaluation and cost
modelling were used as examples. The GABLE CAAD system provided the
support for the integration experiment of building modelling and cost
modelling. Software specification and development necessary to implement
a new facility was conducted, and then integrated into the existing CAAD
system.
This research project has capitalised on the capabilities of the GABLE CAAD
system to develop a Cost Modelling application. The system's data structure
and its ability to interpret building models ( i.e.: 'infer' the implicit spatial
arrangements ), were seen as GABLE strengths and were considerably drawn
on.
This thesis demonstrates the potential of integrating CAD and cost
modelling by producing a working software solution using a descriptive
model approach to cost modelling. With this technique, it has been possible
to construct a three dimensional design model, and by relying on existing
cost data databases, relating to the type of projects, cost out alternative
designs before deciding on the final solution. The production of a building
elemental model can include all described features of the geometrical model
(i.e.: located in any part of the building), or can be limited to certain selected
areas of the model. This offers the possibility of involving only a selected
number of spaces on a floor level, and/or a selected number of floors in a
building for cost modelling. This approach makes 'cost location' a very
realistic option during design costing. Thus the architect will be able for
example to cost the circulation areas independently from office spaces, or
compare the cost of two spaces located on different floors levels of a
building, or to examine the cost implications of designing the building in
166
quite different forms, a facility called 'space based building cost modelling'.
The argument in favour of such approach to design modelling and
evaluation in a CAAD environment could be taken further and extended to
any other type of building evaluation.
What can be considered as an original contribution to the field of computer
aided building modelling and evaluation is the interaction between
elemental and spatial description of a design solution. With this approach,
construction elements like walls, roofs, windows and doors are modeled
independently and subsequently associated with the spaces to which they
belong. This has a significant impact on cost modelling and more generally
building evaluation.
However, it is conceded that there are two major deficiencies in this
approach. Firstly, the accuracy of a descriptive model technique is not as
high as may be described, although there seems to be no real answer to this
at early design stages. Secondly, this system can only be used once a sensible
three dimensional building model exists in the CAAD system. With regard
to this last point, work is currently going at Sheffield University which may
give rise to automatically or semi-automatically generated building models.
Here, a brief is used together with expert knowledge of previous projects to
hypothesis a building model. Such a model may be quite worthless as a
piece of architecture but may suffice to feed cost modelling and other
evaluations such as heat load calculations at briefing design.
Looking beyond the realm of this thesis, Chapter 8 has briefly examined the
prospects and difficulties that CAD might encounter in its future
developments. The Hypermedia concept was introduced and it possible
167
application in CAAD described. It is strongly felt that a 'multimedia'
presentation facility assisting the designer to visualise and communicate his
design solution, is a commodity to expect available in the not too far future.
At the time this manuscript is written, new systems with design assistance
and generation capabilities are under development at leading CAAD
research centres throughout the world (Pohl, J. 1989). In those, the
development of expert systems applications holds a privileged research
position. As an emerging software development technology, Expert Systems
and Knowledge Based Systems promise to encapsulate the knowledge of
building construction experts (or any other expert for that matter), and make
it available to those that are less experienced.
It is hoped that this two research vectors (i.e.: Hypermedia technology and
Knowledge engineering technology) come rapidly to fruition and more
importantly get combined to provide designers with what could be
considered as the next generation design tools. Unfortunately, the novelty
of these techniques and the lack of detailed information about current
applications makes it difficult to forecast their impact on architectural
practice and education.
In conclusion, it can be said that design is certainly evolving from an
intuitive, unstructured activity, to present attempts to explicitly define and
compute certain aspects of design knowledge. This thesis has put the
emphasis on design evaluation, and made a modest contribution in
bringing closer the computer and the design in performing design
evaluation. It seems that it is inevitable that further externalisation of the
design process will occur, and that the use of computers in design will
expand. A prospect of which the out come is unknown, but will certainly
168
depend on our ability and desire to externelise design, as well as our ability
and desire to computerise design.
170
TABLE OF FIGURES
No Title (Source) Page
2.1 The three stages design process. 11
(Lawson, B.R.1980, p 28)
3.1 Generalised computer system. 30(Murray, T.J. 1985, p 83)
3.2 Types of models according to Neelamkavil. 34(Neelamkavil, F. 1987, p 32)
3.3 First graph application. 36(March, L. & Steadman, P. 1971, p 242)
3.4 A space adjacencie planar graph. (Author) 37
3.5 CAD development overview. (Author) 40
3.6 Conventional symbols used in flowcharts. 41(Wheatley, D.M. & Unwin, A.W. 1972, p 125)
3.7 Two dimensional graphical primitives. 42(Pformtmiller, L. 1987, p 178)
3.8 Graphical input of a shape and data storage. 43(Author)
3.9 Hierarchical model representing polyhedral 45computer shape (Koriba, M. 1983, p 280 & p 283)
3.10 The ABACUS approach to generate building models. 47(Author)
3.11 The GABLE approach building modelling. (Author) 47
3.12 The three-dimensional space model from a building 48model. (Author)
3.13 Data base management system processing. 49(Murray, T.J. , p 255)
171
3.14 General orgenisation of a relational data base system. 50(Murray, T.J. , p 258)
4.2 Diagrammatic representation of the ad-hoc 65approach. (Author)
4.3 Diagrammatic representation of the integrated 66approach. (Author)
4.4 Diagrammatic representation of the 'dis-integrated' 67approach. (Author)
5.1 Conceptual model of the system of building and 75people. (Markus, T. 1971, p 84)
6.1 The GABLE BMS three basic data representation. 97(Author)
7.1 GABLE 4D SERIES modules (Courtesy of GABLE 105CAD System LTD.)
7.2.1 Graphical and non-graphical modules. (Author) 107
7.2.2 2D and 3D modules. (Author) 107
7.2.3 GABLE 4D SERIES integration. (Author) 108
7.2.4 Windows and doors graphical specification. 112(Author)
7.2.5 (a) GABLE 4D-SERIES digitiser menu. (Courtesy of 114GABLE CAD System LTD.)
7.2.5 (b) GABLE 4D-SERIES pull-down menu user interface. 114(Courtesy of GABLE CAD System LTD.)
7.2.6 The ADD + CLOSED WXTERNAL WALL command 116input. (Author)
7.2.7 CLOSED EXTERNAL WALL as re-drawn on the 116screen. (Author)
7.2.8 The ADD + OPEN INTERNAL WALL command 117input. (Author)
172
7.2.9 OPEN INTERNAL WALLs as re-drawn on the 117screen. (Author)
7.2.10 Wall numbers as positioned in the data structure. 119(Author)
7.2.11 Plan view of building model with windows and 119doors fitted. (Author)
7.2.12 (a) Wireline external view of the building model. 120(Author)
7.2.12 (b) Fully-hidden line external view of the building 120model. (Author)
7.2.13 Space outlines definition during model 12.2interpretation. (Author)
7.2.14 Walls splitting at abuttements and intersections. 122(Author)
7.2.15 Graph representation of spacial adjacencies in plan. 124(Author)
7.2.16 (a) View in plan of building model with dimension 125line. (Author)
7.2.16 (b) Internal view of building model in FULLY-HIDDEN 127line. (Author)
7.2.16 (c) COULOR FULLY SORTED screen dump out put. 128(Author)
7.2.17 GABLE arrays structure. (Courtesy of GABLE CAD 129System LTD.)
7.2.18 GABLE data structure segments.(Courtesy of 130GABLE CAD System LTD.)
7.2.19 Table of elements associated to F2 values in GABLE 130modules. (Courtesy of GABLE CAD system LTD.)
7.3.1 Files involved in a module 630 building survey. 132(Author)
7.3.2 (a) Report of the building model survey file : LEVEL. 134(Author)
173
7.3.2 (b) Report of the building model survey file : ROOM. 134(Author)
7.3.2 (c) Report of the building model survey file : LAYOUT. 134(Author)
7.3.2 (d) Report of the building model survey file : OPENING. 135(Author)
7.3.2 (e) Report of the building model survey file : ISAAC. 135(Author)
7.3.3 GABLE modules pre-requisits for cost modelling. 136(Author)
7.3.4 Main features of 'Bucknall Austin' cost modelling 137system. (Author) .
7.3.5 Hierarchical tree of the elements relation to the 139building. (Author)
7.3.6 Sample the COST MODELLER - SFQ file. 140(Author)
7.3.7 (a) FFQ file for the all building model. (Author) 140
7.3.7 (b) FFQ file for the building without conservatory. 140(Author)
7.3.8 The COST MODELLER file production sequence. 141(Author)
7.4.1 (a) BEM file report for the all building model. (Author) 143
7.4.1 (b) BEM file report for the building without 144conservatory. (Author)
7.4.2 (a) Bar-chart of cost analysis for the all building model. 146(Author)
7.4.2 (b) Bar-chart of cost analysis for the building without 146conservatory. (Author)
7.4.3 Cost data bank interaction with the CAAD system. 147(Author)
174
175
BIBLIOGRAPHY:
- Akin, 0. (1986) Psychology of Architectural design,Pion Ltd, London.
- Alexander, C. (1964) Notes on the synthesis of form,Harvard University Press, Cambridge.
- Archer, B.L. (1965) "Systematic methods for designers", DesignCouncil, London.
- Aris, R. (1978) Mathematical modelling techniques, Pitman,London.
- Armour, G.C. and Buffa, E.S. (1963) "A heuristic algorithm andsimulation approach to relative location of facilities",Management Science 9(2): Jan, pp 294-309.
- Ascherson, N. (1987) "Inventions never quite set us free", TheObserver, 13 December, p 7.
- Ashworth, G.N. & Wilson, R.A. (1988) "The integration ofcomputer aided design and quantity surveying systems", Paperpresented at the Quantity Surveyors and Computers Conference,The Barbican Centre, London, 21st April.
- Asimow, M. (1962) Introduction to design,Prentice-Hall, Englewood Cliffs, N. J.
- Atkin, B.L. (1985) "Computer graphics in constructionmanagement", in Information systems in construction
management, Barton, P. (Ed), Mitchell's professionalLibrary.
- Atkin, B.L. (1986) "Time for CAD", Chartered Quantity Surveyor,Vol 8, No 2, p 13.
- Atkin, B.L. (1987) CAD Techniques : Opportunities for charteredquantity surveyors, Published by the Royal Intitution of CharteredSurveyors.
- Atkinson, R.C., Atkinson, E.R. and Hilgard, E.R. (1953),Introduction to psychology, Harcourt Brace JovanovichPublishers, New York.
176
- Baglivo, J.A. and Graver, J.E. (1983) Incidence and symmetry indesign and architecture, Cambridge University Press, Combridge.
- Barnett, J. (1965) "Computer-Aided Design and automatedworking drawings", Architectural Record, October, pp 85-97.
- Beeston, D. (1987) "A future for cost modelling", in Buildingcost modelling and computers, by Brandon, P. (Ed), Spon.
- Belhadj, T.A. and Lawson, B.R. (1989) "Computer AidedBuilding Evaluation - A cost modelling experiment", papersubmited to the "Science et Technology au Service del'Architecture" Conference, to be held in Paris in Dec 1989.
- Bennion, F. (1989) "Geographic information systems", TheComputer Bulletin, Vol 1, Part 5, June, pp 13-16.
- Berlyne, D.E. (1965) Structure and direction of thinkingJohn Wiley, New York
- Berztiss, A.T. (1975) DATA STRUCTURES theory and practice,Academic Press. London.
- Best, D. (1985) Feeling and reason in the artsGeorge Allen & Unwin, London.
- Bijl, A. (1987) "An approach to design theory" in Design theoryfor CAD, Proceeding of IFIP conference (Tokyo), Yoshikawa, H &Warman, E. A. (Eds), North-Holland.
- Bishop, P. (1986) FIFTH GENERATION COMPUTERS, concepts,implications and uses, Ellis Horwood Limited.
- Bowyer, A. and Woodwark, J. (1983) A programmer's geometry,Butterworths, London.
- Brandon, P.S. (1988) "An expert system fot the strategic planningof construction projects", Paper presented at theQuantitySurveyors and Computers Conference, The Barbican Centre,London, 21st April.
- Crosley, M. (1988) "Linking, graphics and numbers",Architectural and Engineering Systems, January, pp 29-34.
- Cross, N. (1977) The automated architect, Pion Ltd., London.
- Cross, N. (1985) "Styles of learning, designing and computing",Design Studies, Vol 6, No 3, (july).
- Curran, J. (1987) "The QS and the CAD system", ChartedQuantity Surveyor, Vol 10, No2, pp 11.
- Daley, J. (1969) "A philosophical critique of behaviourism inarchitectural design", in Broadbent, G. and Ward, A. Designmethods in architecture, Architectural Association, Paper No 4,London.
- Darke, J. (1979) "The primary generator and the design process",Design Studies, Vol 1, No 1, pp 36-44.
178
- Date, C.J. (1975) An introduction to data base systems, Addison-Wesley Publishing Company, Reading, Massachusetts.
- Date, C.J. (1983) Database : A primer, Addison-Wesley PublishingCompany, Reading, Massachusetts.
- Delisle, N. and Schwartz, M. (1986) "Neptune: A HypertextSystem for CAD applications", Proc. of AMC SIGMODInternational Conference on Management of Data. Washington,D.C., May 28-30, pp 132-143.
- Denker, J.S. (Ed) (1986) "Neural networks for computing", AIPConference proceeding 151, American Institut of Physics.
- Dent, C. (1964) Quantity surveying by computer, OxfordUniversity Press, London.
- Design Methods Group (DMG) Reference sheet Nol, June 1978.
- Deo, N. (1974) Graph theory with applications to engineering andcomputer science, Englewood Cliffs (N.J.), London, Prentice Hall.
- Donald, I. (1988) " Place evaluation", in "Environmental policyassessment and communication", Canter,D.,Krampen,M. &Stea,D. (Eds), Avebury.
- Duncker, K (1945) "On problem solving"Psychological Monographs, Edited by Dashiell, J.F.,Vol 58 No5,The American Psychology Association.
- Eastman, C.M. (1975) "The use of computers instead of drawingsin building design", American Institute of Architects Journal,March, pp 46-50.
- Eastman, C.M. (1978) "The representation of design problemsand maintenance of their structure", in Artificial intelligenceand pattern recognition in computer aided design , Latombe, J.(Ed), North-Holland Publishing Company.
- Eastman, C.M. (1987) "Fundamental problems in thedevelopment of computer-based architectural design models", inComputability of desing, Kalay, Y.E. (Ed), Wiley Interscience,John Wiley & Sons, New York.
- Evans, C. (1981) THE MAKING OF THE MICRO :A history ofthe computer, Victor Gollancz Ltd, London.
179
- Feigenbaum, E.A. & McCorduck, P.(1984) THE FIFTHGENERATION : artificial intelligence and Japan's computerchallenge to the world, Pan Books, London.
- Ferry, D.J. and Brandon, P.S. (1984) Cost planning of buildings,GRANADA, London.
- Foley, J.D. and Van Dam, A. (1984) Fundamentals of interactivecomputer graphics, Addison Wesley.
- Foque, R. (1982) "Beyond design methods-Arguments for apractical design theory." in Changing Design Edited by Evans,E.,Powell, J.A., and Talbot, R.J., John Wiley & Sons, Chichester.
- Freeman, (1987) 'The case for technological determinism".in Information technology : social issues „ Finnegan, R., Salaman,G. and Thompson, K. (Eds), The Open University, Hodder andStoughton.
- Garner, R.W. (1962) Uncertainty and structure as psychologicalconcepts, John Wiley, New York.
- George, B.W. (1988) "Project Mangement and Microcomputers",Paper presented at the Quantity Surveyors and ComputersConference, The Barbican Centre, London, 21st April.
- Gerardin, L. (1968) Bionics,World University Library, London.
- Gero, J.S. (1983) "Computer-Aided Architectural Design - past,present and future", Architectural Science Review, Vol 26, No 1,pp 2-5.
- Gill, M. & Atkin, B. (1985) "Survey of CAD systems used by theUK construction industry, Building Magazin, 28 June to 26 July.
- Goodey, K.J. & Mattew, K. (1971) "Architects and Information",Research paper No 1, Institut of Advanced Architectural Studies,University of York.
- Gregory, S. (1982) "Evaluation", Design Studies, Vol 3, No 3, july,pp 147-152.
180
- Groos, M.D., Ervin, S.M., Anderson, J.A. & Fleisher, A. (1987)"Designing with constraints", in Computability of desing, Kalay,Y.E. (Ed), Wiley Interscience, John Wiley & Sons, New York.
- Groos, M.D., Ervin, S.M., Anderson, J.A. & Fleisher, A. (1988)"Constraints : Knowledge representation in design", DesignStudies, Vol 9,No 3, July, pp 133-143.
- Guttman, A. and Stonebraker, M. (1982), "Using a RDMS forCAD data", Database Engineering, No 6, pp 21-26.
- Halprin, L. (1969) RSVO cycles: creative processes in the humanenvironment, Braziller, New York.
- Hamilton. I, & Winterkorn, E. (1985) CAD sytems evaluation forconstruction, Construction Industry Computing Association,Cambridge.
- Handler, A.B. (1970) System approach to architecture, AmericanElsevier Publishing company, Inc.
- Hassan Fathy, (1973) Architecture for the poor,University of Chicago Press, Chicago.
- Heath, T. (1984) Method in Architecture,John Wiley, New York.
- Hillier, B. and Leaman, A. (1972) "Knowledge and design", inMitchell, W.J. (Ed), Environmental Design: Research and Practice,Proceedings of the EDRA/ar8 Conference, U.C.L.A., pp 29.3.1-29.3.14.
- Hillier, B., Musgrove, J. & O'Sullivan, P. (1972), "Knowledge anddesign", in Mitchell, W.J. (Ed), EDRA 3/8 Conference Proceedings,pp 29.3.1-29.3.14.
- Hodges, A. (1983) The Enigma of intelligence,Burnett Books, London.
- Hodde, A. (1988) "Rencontre avec des architectes", Techniques &Architecture, No 380, pp 112-114.
- Hopgood, F., Duce, D., Gallop, J. & Sutcliffe, D.C. (1983)Introduction to the Graphical Kernel System (GKS), AcademicPress.
181
- Jones, J.C. (1970) Design Methods: seeds of human futures,John Wiley, New York
- Kalay, Y.E. (1983) "A relational database for non-manipulativerepresentation of solid objects", Computer Aided Design, Vol 15,No 5, pp 271-276.
- Kalay, Y.E. (1985) "Redefining the role of computers inarchitecture : fromm drafting/modelling tools to knowledge-basedesign assistant", Computer Aided Design, Vol 17, No 7, pp319-328.
- Klinger, A., Fu, K.S. and Kunii, T.L. (Eds) (1977) Data structures,computer graphics, ans pattern recognition, Academic Press, Inc.
- Koestler, A. (1964) The Act of Creation,Hutchinson, London.
- Kohler, W. (1947) Gestalt psychology An introduction to newconcepts in modern psychology, Liveright PublishingCorporation, New York.
- Koriba, M. (1983) "Database systems: their applications to CADsoftware design", Computer Aided Design, Vol 15, No 5, pp 277-287.
- Kroll, L. (1986) The Architrecture of Complexity, Translated byJones, P.B., B.T. Batsford Ltd, London.
- Kronsjo, L. (1979) Algorithms, their complexity and efficiency,Wiley, Chichester
- Lansdown, J. (1969) "Computer-aided building design - the nextstep", RIBA Journal, April, pp 138-140.
- Lansdown, J. (1982) EXPERT SYSTEMS: Their impact on theconstruction industry, RIBA conference Fund.
- Lansdown, J. (1986) "Do CAD systems fulfill designer's needs ?",Computer Aided Design, Vol 18, No 6, July/August, pp 299-300.
- Lansdown, J. (1987) "A theory of computer aided design, Apossible approach", in Graphics for designers, Earnshaw, R.A. (Ed),BCS Conference.
- Lansdown, J. (1988) "Prototype modification : creative computeraid", The Architects Journal, 21 December, pp 52-57.
182
- Lansdown, J. & Roast, C. (1987) "The possibilities and problems ofknowledge-based systems for design", Environmental & PlanningB, Vol 14, pp 255-266.
- Laszlo, E (1972) The system view of the world, Basil Blackwell,Oxford.
- Latombe, J-C. (1977) "Artificial intelligence in computer-sideddesign: the 'TOPIC' system", in CAD systems by Allan, J.J. (Ed),North-Holland Publishing Company, Amsterdam.
- Lawrence, A. (1988) "A model office", CADCAM InternationalMagazine, August, pp 13-16.
- Lawson, B.R. (1970) "Open and closed ended problem solving inarchitectural design", in Honikman, B. (Ed), AP70: Proceeding ofthe architectural psychology conference at Kingston Polytechnic,pp 87-90.
- Lawson, B.R. (1971) "Problem structure displays in computeraided architectural design", Ergonomics paper, Appliedpsychology department, University of Aston, Birmingham.
- Lawson, B.R. (1972) "Problem solving in architectural design",Ph.D. thesis, University of Aston, Birmingham, UK.
- Lawson, B. R. (1980) How designers think, Architectural Press,London.
- Lawson, B.R. (1981) "The current and future roles of thecomputer in the building design office", in Proceeding of the CIBW-65, Third Symposium of Organisation and Management ofConstruction, Dublin, pp A. 2.91-A.2.103.
- Lawson, B.R. (1985) Computer aided design for architects,Unpublished manuscript, University of Sheffield, Dept. ofArchitecture.
- Lawson, B.R and Riley, J.P. (1982) "ISAAC a technique for theautomation of spaces from drawn building floor plans",Proceeding CAD 82 conference, Butterworth, pp 663-666.
- Lera, S. (1981) "Empirical and theoritical studies of designjudgement : a review", Design Studies, Vol 2, No 1, pp 19-26.
183
- Lera, S. (1982) "At the point of decision", Building, 28 May, pp 47-48.
- Lera, S., Cooper, I., & Powell, J.A. (1984) "Information anddesigners", Design Studies, Vol 5, No 2, pp 113-120.
- Levin, P.H. (1964) "The use of graphs to decide the optimumlayout of buildings", The Architects Journal, 7 Oct, pp 809-815.
- Lyons, E. (1988) "Solids and surfaces" ,Computer GraphicsWorld, June 1988, pp 36-39.
- McGee, J. (1988) "The changing structure of the surveyingprofession", Public lecture in estate management, 2 February,Tempelton College, Oxford.
- Mackinder, M. & Marvin, H. (1982) "Design decision-making inarchitectural practice", Research paper No 19, Institute ofAdvanced Architectural Studies, University of York.
- Mainstone, R. (1977) "Brunelleschi's dome"Architectural Review No 967(Sept), pp 157-166.
- March, L. (1974) "Quantifying the environment" in Models,Evaluations & Information Systems for Planners, Perraton,J. andBaxter, R. (Eds), LUBFS Conference Proceeding No 1, MITConstruction.
- March, L. (1976) The architecture of form, Cambridge UniversityPress, Cambridge, UK.
- March, L. and Steadman, P. (1971)The geometry of environment, Methuen & Co Ltd.
- Marciszewski, W. ( Ed. ) (1981) Dictionary of Logic, MartinusNijhoff Publisher, The Hague.
- Markus, T.A. (1967) "The role of building performancemeasurement and appraisal in desing", The Architects' Journal,20, Dec 67, pp 1567-1573.
- Markus, T.A. (1970) "Optimization by evaluation in theappraisal of builsings", Building, 21 August and 18 September.
- Markus, T.A. (1971) "A doughnut model of the environmentand its design", in Design participation, Cross, N. (Ed), AcademyPress.
184
- Mathur, K. (1982) "Resources and performance optimisation",Chartered Quantity Surveyor, June.
- Mayer, T.W. (1970) "A theory of architectural design in whichthe role of the computer is identified", Building Science,Vol 4, pp199-207.
- Mayer, R.J. (1987) IGES, An answer to the problems of CADdatabase exchange, Byte Magazine, Vo112, No 7, pp 209-214.
- Meier, A. (1986) 'Applying relational database techniques tosolid modelling", Computer Aided Design, VI 18, No 6,July/August, pp 319-326.
- Michie, D. (1980) "Turing and the origins of the computer",New Scientist, 21/2/80, pp 580-583.
- Mitchell, W.J. (1977) Computer-Aided Architectural Design,Van Nostrand Reinhold Company, New York.
- Mitchell, W.J. (1986) "Solid modelling and volumetriccomposition in architecture", Design Computing, Vol 1, No 2, pp123-136.
- Moto-oka et al (1982) Fifth generation computer systemsProceeding of the International Conference on Fifth GenerationComputer Systems (JIPDEC), Tokyo, Japan, North-HollandAmsterdam.
- Murray, T.J. (1985) Computer based information systems,Richard D Irwin, Inc., Homewood, Illinois.
- Myers, G.J. (1978) Advances in computer architecture, JohnWiley & Sons, New York.
- Neelamkavil, F. (1987) Computer simulation and modelling,John Wiley & Sons.
- Nelson, T. H. "Getting It Out of Our System", in InfromationRetrieval: A Critical Review, by Schechter, G. (Ed), ThompsonBooks, Washington, D.C.
- Negroponte, N. (1970) The architecture machine, The MIT Press,Cambridge, Massachusetts.
185
- Newell, A., Shaw and Simon, H.A. (1958) "Elements of a theoryof human problem solving." Psychological Review, Vol 65, No 3.
- Newell, A. and Simon, H.A. (1972) Human Problem Solving,Prentice-Hall, Englewood Cliffs, N. J.
- Newman, M.N. and Sproull, R.F. (1981) Principles of interactivecomputer graphics, International Student Edition.
- Ornstein, R. (1987) Multimind : A new way of looking at humanbehaviour, Macmillan, London.
- O'Shaughnessy, J. (1972) Inquiry and Decision, George Allen &Unwin Ltd, London.
- Patchell, B.R.T. (1987) "The implementation of a cost modellingtheory", in Building cost modelling and computers, by Brandon,P.S. (Ed), E. & F.N. Spon, London.
- Paterson, J. (1980) Architecture and the microprocessor, JohnWiley & Sons, New York.
- Perkins, P.N. (1981) The mind's best work, Harvard UniversityPress, Cambridge, Massachusetts.
- Pfefferkorn, C.E.(1975) "The Design Problem Solver:A system fordesigning equipment or furniture layouts" in Spatial synthesis incomputer aided design , by Easteman, C.M. (Ed), Applied SciencePublisher, London.
- Pfortmiller, L. (1987) "Data structures in CAD software", ByteMagazin, Vol 12, No 7, pp 177-184.
- Pohl, J. (1989) "Artificial Intelligence in the CAD systemenvironment", Architectural & Engineering Systems, June, pp 48-50.
- Prager, F.D. and Scaglia, G. (1970) Brunelleschi : Studies of histechnology and inventions, The M.I.T. Press, Cambridge.
- Quayle, M. (1987) "Computer-Aided Participation Design :SITSEE", The Journal of Architectural and Planning Research, 4:4:,pp 335-342.
- Reid, T.R. (1985) Microchip The story of a revolution and themen who made it, Collins, London.
186
- Reynolds, A. (1980) Computer methods for architectsButterworths, London.
- Richens, P. (1983) "Dis-integrated models for building design",in Proceedings of PArC 83, pp 121-129, Oneline Conference Ltd.
- Richens, P. (1984) "What a system of the future might looklike...", pp 41-47, Proceeding of the W78 Colloquium orgranisedby the International Council for Building Research Studies (CIB),5th - 7th June, Watford, UK
- Rittel, H.W.J. (1970) "Comments : Theories of cellconfigurations", in Emerging methods in environmental designand planning , Moore, T. (Ed), The MIT Press, Cambridge,Massachusetts.
- Rittel, H.W.J. (1972) "Son of Rittelthink", Interview withPortzen, J-P. and Grant, D., in DMG Occasional paper No 1, pp 5-10.
- Roth, J. & Hashimshony, R. (1988) "Algorithms in graph theoryand their use for solving problems in architectural design",Computer Aided Design, Vol 20, No 7, pp 373-381.
- Rowe, P.G. (1987) Design Thinking, The M.I.T. Press, Cambridge.
- Shannon, C.E. (1938) "A symbolic analysis of relay and switchingcircuits", AIEE Transactions, Vol 57, pp 722.
- Shannon, C.E. and Weaver, W. (1949) The mathematical theoryof communication, Univ. of Illinois Press, Urbana.
- Shaviv, E. (1987) "Generative and evaluative CAAD tools forspatial allocation problems", in Computability of design, Kalay,Y.E. (Ed), John Wiley & Sons.
187
- Simon, H.A. (1965) The shape of automation for man andmanagement, Harper & Row, Publishers, New York.
- Simon, H.A (1981) The science of the artificial, The MIT Press,Cambridge, Massachusetts.
- Simon, H.A. (1983) "Why should machines learn ?", inMachine learning, by Michalski, R., Corbnell, J. Mitchell, T. (Eds),Tiago publishing company, Palo Alto, California.
- Smith, G. (1980) "Cost planning the design process", CharteredQuantity Surveyor, August.
- Stafford, H.M. (1957) "Standardized quantities and mechanizedbilling", The Architects Jounal, 18 April, pp 576-580.
- Steadman, P. (1976) "Graph-theoritic representation ofarchitectural arrangement", in The architecture of form, byMarch, L. (Ed), Camridge University Press, Cambridge.
- Sudbo, B. (1988) "Reports Zurich '87", The EuropeanAssociation for Architectural Education 10th InternationalForum on Architectural Education and the InformationExplosion, Zurich 5-7 Nov 97, News Sheet 21, March 1988, pp 1-3.
- Sussock, H. (1982) "GOAL : General Outline Appraisal Layouts",Occasional paper 62, ABACUS, University of Strathclyde,Glasgow.
- Sutherland, I.E. (1963) "Sketchpad: A man-machine graphicalcommunication system", Proceeding of the 1963 Spring JointComputer Conference, Baltimor, Maryland : Spartan Books.
- Sweet, P. (1989) "Mapping out a future", Database/Graphics,Computing Magazin, British Computer Society, 23 March, pp 26-27.
- Swinson, P.S.G. (1982) "Logic programming:a computing toolfor the architect of the future", Computer Aided Design, Vol 14,No2, pp 98-104.
- Teague, L.C. (1970) "Network models of configurations ofrectangular parallelepiped", in Emerging methods inenvironmental design and planning , Moore, G.(Ed), MIT Press,Cambridge, Massachusetts.
- Tovey, M. (1986) "Thinking styles and modelling systems";Design Studies, Vol 7, No 1, pp 20-30.
188
- Turing, A.M. (1947) "The automatic computing engine", Lecturedelivered at the London Mathematical Society, 20 Feb 1947,Typescripts in Turing Collection, Kings College Library,Cambridge.
- Viollet-le-Duc (1863) Discources in Architecture, Trans., B.Bucknall, Boston.
- Walker, P. (1985) "The Transputer", Byte Magazine, Vol 10, No2, pp 95-122.
- Wallace, W.A. & Kelly, J.R. (1987) "Decision taking in buildingdesign, CIB Proceeding of the fourth international symposium onbuilding economics (Session B), Copenhagen.
- Watson, J.B.(1913) "Psychology as the behaviourists view it."Psychilogical Review 20. pp158-177.
- Weizenbaum, J. (1984) Computer power and human reasonFrom jugement to calculation, Pelican Books.
- Weizenbaum, J. (1985) "The myths of artificial intelligence", inThe information technology revolution, Forester, T. (Ed), pp 84-94.
- Whithead, B. and Eldars, M.Z. (1964) "An approach to theOptimum Layout of Single-Story Building", Architects' Journal,17 june, pp 1373-1379.
- Whithead, A.N. and Russel, B. (1910-1913) Principiamat hematica , Cambridge University Press.
- Wirth, N. (1976) Algorithms + Data Structures = Programs,Prentice-Hall, Inc.
- Yessios, C.I. (1987) "The computability of void architecturalmodelling", in Computability of desing, Kalay, Y.E. (Ed), WileyInterscience, John Wiley & Sons, New York.
- Zevi, B. (1964) "History as a method of teaching architecture" inThe history, Theory and Criticism of Architecture, Whiffeneditor, The M.I.T. Press, Cambridge.