Science Innovation 2016; 4(3-1): 24-33
http://www.sciencepublishinggroup.com/j/si
doi: 10.11648/j.si.s.2016040301.14
ISSN: 2328-7861 (Print); ISSN: 2328-787X (Online)
Computer Aided Design of a Multi-Component Distillation Column-Using the Fenske-Underwood-Gilliland Short-Cut Method
Samuel Wadzani Gadzama1, *
, Emmanuel Chinwendu Ufomba1, Chimezie A. Okeugo
1,
Okwudiba Ifeanyi Nwachukwu1, Agu-Bruno Christina
2, Ogochukwu Stella Ugwueze
3,
Roland Imoh Uchechi4
1Training Department, Scientific Equipment Development Institute, Enugu, Nigeria 2Electroplating Department, Scientific Equipment Development Institute, Enugu, Nigeria 3Machine Building R & D, Scientific Equipment Development Institute, Enugu, Nigeria 4Plastic Recycling Department, Scientific Equipment Development Institute, Enugu, Nigeria
Email address [email protected] (S. W. Gadzama) *Corresponding author
To cite this article: Samuel Wadzani Gadzama, Emmanuel Chinwendu Ufomba, Chimezie A. Okeugo, Okwudiba Ifeanyi Nwachukwu, Agu-Bruno Christina,
Ogochukwu Stella Ugwueze, Roland Imoh Uchechi. Computer Aided Design of a Multi-Component Distillation Column-Using the Fenske-
Underwood-Gilliland Short-Cut Method. Science Innovation. Special Issue: Innovative Researches in Science and Engineering.
Vol. 4, No. 3-1, 2016, pp. 24-33. doi: 10.11648/j.si.s.2016040301.14
Received: January 14, 2016; Accepted: January 15, 2016; Published: March 19, 2016
Abstract: Most design calculations in multi-component distillation column are tedious and time consuming, thus the need
for the Engineer to embrace the applications of computer for the design of multi-component distillation columns design. At the
same time the need for accurate design in engineering cannot be over emphasize, meaning that the safety of lives and property
so much depend on the accuracy of design calculation, thus, the need for computer packages that will aid the design of multi-
component distillation columns to avoid such errors. The objective of this work is to develop a module that uses Fenske-
Underwood-Gilliland (FUG) shortcut method in the design of a multi-component distillation column. The FUG shortcut
method for multi-component distillation column design uses the Fenske equations for minimum number stages, the
Underwood equations for minimum reflux and the Gilliland correlation for the number of stages for a given reflux. The scope
of this design is basically development of software that could be used for the calculations involved in the design of multi-
component distillation columns. The package developed however utilizes only the FUG shortcut method. The package is built
on the Visual Basic 6++ programming language, which is a user friendly and object oriented program.
Keywords: Computer Aided Design, Multi-Component, Distillation Column, Visual Basic, Short-cut Method
1. Introduction
It is obvious that good design requires good data-
especially so, with multi-component calculations. In this
section, some basic relations and sources of data are
considered.
The reason for such a limited treatment, quite simply, is
that the estimation/prediction/extrapolation/interpolation of
equilibrium data is an immense problem with difficult
method of solution (Makama, 2001).
1.1. Equilibrium Data in Multi-Component Distillation
For multi-component systems, which can be considered
ideal, Raoult’s law can be used to determine the composition
of the vapour in equilibrium with the liquid.
�� = ���� (1.1)
Where �� is the partial pressure of component � in the
vapour in Pa (atm). �� is the vapour pressure of pure � in Pa
(atm) and �� is the mole fraction of � in the liquid. In
Science Innovation 2016; 4(3-1): 24-33 25
hydrocarbon systems, because of non-idealities, the
equilibrium data are often represented by:
�� = ���� (1.2)
Where �� is the vapour-liquid equilibrium constant or
distribution co-efficient for component � These K- values for light hydrocarbon system (methane to
decane) have been determined semi empirically and each K
is a function of temperature and pressure. It should be noted
that for ideal system;
�� = � (1.3)
The relative volatility �� for each individual component
in a multi-component mixture can be defined in a manner
similar to that for a binary mixture. If component C in a
mixture of A, B, C and D is selected as the base
component;
� = ���� , � = ���� , � =���� , � =
���� = 1.0, � = ���� (1.4)
The values of �� will be a stronger function of temperature
than the � values, since the �� values in the database
increase with temperature in a similar manner.
1.2. Boiling Point and Dew Point in Multi-Component
Distillation Boiling Point
At specified pressure, the boiling point or bubble point of a
given multi-component mixture should satisfy the relation:
∑�� = 1.0
For a mixture of A, B, C and D, with C as the base
component.
∑�� = ∑���� = Kc∑ i�� = 1.0 (1.5)
The calculation is trial and error process as follows:
� First, a temperature is assumed and the values of αi are
calculated from the values of ki at this temperature.
� Then, the value of kc is calculated from:
k� = .!
∑"�#�� (1.6)
� The temperature corresponding to the calculated value
of kc is compared to the assumed temperature.
� If the values differ, the calculated temperature is used
for the next iteration.
� After the final temperature is known, the vapour
composition is calculated from;
�� = "�#��∑("�#�) (1.7)
1.3. Dew Point
For the dew point calculation, which is also trial and error:
∑�� = ∑&'���( = & ��(∑ &'�"�( = 1.0 (1.8)
The value of kc is calculated from;
�� = ∑&'�"�( (1.9)
After the final temperature is known, the liquid
composition is calculated from:
�� = '� "�⁄∑('� "�⁄ ) (1.10)
1.4. Key Components in Multi-Component Distillation
The component separated are called the light key, which is
the more volatile (identified by the subscript LK), and the
heavy key (HK). (Geankoplis 1997).
The components more volatile than the light key are called
light components and will be present in the bottoms in small
amounts. The components less volatile than the heavy keys
are called heavy components and are present in the distillate
in small amounts. The two keys components are present in
significant amount in both the distillate and bottoms.
(Geankoplis 1997).
1.5. Total Reflux for Multi-Component Distillation:
Fenske’s Equation for Minimum Stages at Total Reflux
Just as in binary distillation, the minimum number of
theoretical stages or steps, Nm, can be determined for multi-
component distillation for total reflux. (Geankoplis, 1997).
The Fenske equation (1932) also applies to any two
components in a multi-component system. When applied to
the heavy key HK and light key LK, it becomes;
*+ = ,-./("0��/#2��)(#234/#034)5,-.("0,67) (1.11)
Where �8�= mole fraction of light key in distillate.
�84 = Mole fraction of the light component in bottoms.
�9� = Mole fraction of heavy component in bottoms.
The average value 8 ( is the relative volatility) of the
light key is calculated form the 8� at the top temperature
(dew point) of the tower and 84 at the bottoms temperature:
8,:; = < 8� 84 (1.12)
Note that, the distillate dew point and bottoms boiling-
point estimation is partially trial and error, since the
distribution of the other components in the distillate and
bottoms is known and can affect these values.
1.6. Distribution of Other Components
To determine the distribution or concentration of other
components in the distillate and the bottoms at total reflux,
Equation (1.12) can be rearranged and written for any other
component i as follows. (Geankoplis, 1997).
#���#�=4= ( 8,:;)>? #2��
#234 (1.13)
26 Samuel Wadzani Gadzama et al.: Computer Aided Design of a Multi-Component Distillation Column-Using the
Fenske-Underwood-Gilliland Short-Cut Method
1.7. Minimum Reflux Ratio for Multi-Component
Distillation
As in the case for binary distillation, the minimum reflux
ratio @+ is that reflux ratio that will require an infinite
number of trays for the given separation of the key
components (Geankoplis, 1997).
For binary distillation only one “pinch point” occurs where
the number of steps become infinite, and this is usually at the
feed tray. For multi-component distillation, two pinch points
or zones of constant composition occur; one in the section
above the feed plate and another below the feed tray. The
rigorous plate-by-plate stepwise procedure to calculate @+ is
trial and error and can be extremely tedious for hand
calculations.
1.8. Underwood’s Shortcut Method to Calculate Minimum
Reflux AB
The Underwood (1948) shortcut method to calculate @+
uses constant average values and also assumes constant
flows in both sections of the tower. This method provides a
reasonably accurate value. The two equations to be solved to
determine the minimum reflux ratio are:
1-q = ∑ "�#�C"�DE (1.14)
@++ 1=∑ "�#��"�DE (1.15)
The values of ��� for each component in the distillate in
Equation (1.15) are supposed to be the values at the
minimum reflux (Geankoplis, 1997).
However, as an approximation, the values obtained using
the Fenske total reflux equation are used. Since each � may
vary with temperature, the average value of � to use in the
proceeding equations is approximated by using � at the
average which is used in the Fenske equation or the at
the entering feed temperature. To solve for@+, the value of F
in Equation (1.15) is first obtained by trial and error. This
value of F lies between the value of the light key and of
the heavy key, which is 1.0 using this value of F in Equation
(1.15), the value @+ is obtained directly.
1.9. Number of Stages (Theoretical) at Operating Reflux
Ratio Number of Stages at Operating Reflux Ration
The determination of the minimum number of stages for total
reflux and the minimum reflux ratio as discussed subsequently
are useful for setting the allowable ranges of number of stages
and flow conditions. These ranges are helpful for selecting the
particular operating conditions for a design calculation.
1.10. Gilliland Shortcut Method for Number of Stage
Operating Reflux Ratio
Gilliland’s (1940) shortcut method, which is developed into
an equation by Molokanov (1972), is an empirical correction
considered as an approximation method. It is utilized at the
operating reflux ratio R (for flow rates at the column top) is
correlated with the minimum @+ obtained using the
Underwood method, the minimum number of stages *+
obtained by the Fenske method, and the number of stages N at
the operating R, given by (Perry and Green, 1999);
>D>?>G = 1-exp H& GIJ.JK
G L.MK( &KD KN.O(P (1.16)
Where Q = &RDR?RG (
1.11. Estimation of Feed Plate Location
Kirkbride has devised an approximate method to estimate
the number of theoretical stages above and below the feed,
which can be used to estimate the feed stage location. This
empirical relation is as follows:
log >V>W = 0.206 logXC#0C(
4� &
#03#2�(
MY (1.17)
Where *Z is the number of theoretical stages above the
feed plate and *[ the number of theoretical stages below the
feed-plate. The feed point is *Z tray above the fed point.
1.12. Computer Aided Design
CAD is an acronym for Computer Aided Design, and it is a
technology concerned with the use of computer to perform
certain functions in Design, production, and manufacture,
CAD may also be defined as the use of Computer system to
assist in the creation, modification, analysis or the
optimization of a design (Oguntoyinbo, 1993).
The evolution of Computer Aided Design has been largely
related to the developments in the Computer Graphics, and
Interactive Computer Graphics (ICG) form the essential
technological foundation of Computer Aided Design
(Oguntoyinbo, 1993).
The CAD set-up consists of the hardware and software to
perform the specialized design functions required by the
particular user, institution or firm. The hardware includes but
is not limited to the computer, Graphic Display terminals,
keyboards and other peripherals like plotters, printers, e.t.c,
whereas the software consists of computer programs to
implement computer graphics on the systems plus application
programs to facilitate Engineering functions of a particular
job (Oguntoyinbo, 1993).
As the system is a user-oriented system, the user is the
designer who communicates data and commands to the
computer through an input device (keyboard) and the
computer communicates with the user via the monitor (CRT)
(Oguntoyinbo, 1993).
2. Design Methodology
A successful program cost less to produce than the sales or
savings it generates from an industrial point of view. Naturally,
to have the best chance of generating savings, or sales, a
program should have the four qualifications as listed below:
� To be correct.
� Efficient
� Useful
� And easy to use
Science Innovation 2016; 4(3-1): 24-33 27
To these four qualifications, a good program must be cost-
effective; conversely, it also follows that a good programmer
must be cost-effective (Cannon, 1997).
2.1. Design Method
The source code was developed in visual basic
programming language and it is given in Appendix B.
The package is based on the following assumptions:
� Constant molar overflow
� Phase equilibrium between an existing vapor and single
existing liquid phase is achieved at each stage.
� Neither of the existing phases entrains the other phase.
� No chemical reaction occurs.
� Total condenser.
� Single feed point.
2.2. Development of the Module
A data bank of the physical and thermodynamic properties
(K-value) of some 20 different hydrocarbons (Geankoplis, 1997
and Schweitzer, 1979) was created. The constants were used to
evaluate relative volatility and K-value of each component, at a
temperature, particularly, the light and heavy keys respectively.
2.3. Coding Language
The design program was developed using visual basic,
because of its advanced features that are well suited for
modular programming (Onifade, 1999).
The file or module name used for the simulation is
“MULTICAD 1.0”.
2.4. Flow Chart
Figure 1. Process flow chart.
The flow for this source code is as shown below; it is a
menu oriented and user-friendly programming language.
There is an executable form of MULTICAD 1.0, which can
be run DOS environment.
The program draws data from the “equilibrium K-value
data bank”. At constant pressure.
2.5. Program Run
To operate the package successfully, the following steps
should be applied: it should be mentioned here that a visual
aid of the package is introduced to aid understanding of the
program:
Step 1: Insert the package (soft copy) into the CD drive of
your system.
Step 2: From the start menu, scroll up to my computer (this
can also be done directly from the desk top. And then click. A
box appears, displaying the drives and then click (double) on
CD-Drive.
Step 3: The program installs itself “auto run”.
Step 4: Click on the start icon on the desk top, a fly-out
appears, scroll up to multi-component distillation column and
click on the name (icon).
Step 5: A splash page appears as shown in Figure 2. Click
on “next”.
Step 6: Another information page appears showing a
typical distillation column with single feed location, on the
right side of the page are the introductory note of the
program and assumptions made, as shown in Figure 2. Click
on “next”.
Figure 2. Display of feed rate data.
Step 7: A page appears showing the program interface.
Begin by entering the feed rate as shown in Figure 2 above.
Figure 3. Display of feed rate selected.
28 Samuel Wadzani Gadzama et al.: Computer Aided Design of a Multi-Component Distillation Column-Using the
Fenske-Underwood-Gilliland Short-Cut Method
Step 8: Select feed state by clicking on arrow on the
“state” portion of the interface, a fly out appears as shown in
Figure 3. Then chose your feed state.By clicking on the
desired feed state.
Figure 4. Display of feed state selected.
Step 9: Similarly, select operating pressure, a process similar to Step 9, as shown in figure 4 above.
Figure 5. Display of selected pressure.
Step 10: Enter reflux ratio and then click on “New” as shown in Figure 5 above.
Figure 6. Display of selection for composition.
Science Innovation 2016; 4(3-1): 24-33 29
Step 11: Select composition as shown in Figure 6 above.
Figure 7. Display of the selected composition.
Step 12: enter mole fraction of the selected composition, click on “Add” as shown in Figure 7 above.
Figure 8. Display of selection for new data input.
Step 13: then click on “New” as shown in Figure 8 above.
Figure 9. Display for input of more constituents.
30 Samuel Wadzani Gadzama et al.: Computer Aided Design of a Multi-Component Distillation Column-Using the
Fenske-Underwood-Gilliland Short-Cut Method
Step 14: Fill in data for more constituents. Select light key and click on “Add” as shown in Figure 9 above.
Figure 10. Display on how to add in more components.
Step 15: Click on “New” and select the heavy key as is done in Step 13, then click on “Add” as shown in Figure 10.
Step 16: Add more constituent(s) as shown in Figure 8 above and click on “Add”.
Step 17: On reaching the specified data for a particular problem, click “Compute” or “Alt+C” as shown in Figure 11.
Figure 11. Display on how to compute data inputted.
Step 18: The results are then displayed as shown in figure 12 after a few seconds.
Science Innovation 2016; 4(3-1): 24-33 31
Figure 12. Display of the calculated result.
To recalculate in case of inputting data for a particular
constituent, click on the constituent in the composition sub-
box and click on the “Clear” button.
To calculate for the next column, click on the “Clear”
button, repeat Step (8) to (9).
To save results obtained, click on “Save”, a dialogue box
appears, results are save in note pad, similar to any MS- word
applications. When the work is saved, a dialogue box appears
indicating that the work is been saved and then click on “ok”
to proceed. Figure 14 displays a typical illustration of how
work is save in note pad. The results can also be easily
printed out by following the normal procedure of printing
any work in MS word package.
Figure 13. Display on how to save computed result.
32 Samuel Wadzani Gadzama et al.: Computer Aided Design of a Multi-Component Distillation Column-Using the
Fenske-Underwood-Gilliland Short-Cut Method
3. Results
3.1. Test Problem
A liquid feed at a pressure of 4Atm. (405.3KP ) abs is fed
to a distillation tower. The composition in mole fractions is a
follows:
n-butane (�� = 0.40), n-pentane (�� = 0.25 ), n-hexane
( �� = 0.20 ), n-heptane ( �� = 0.15 ). the feed is to be
fractionated so that 90% of n-pentane (B) is recovered in the
distillate and 90% of the n-hexane (C) in the bottom.
Calculate:
a. Moles per hour and composition of distillate and
bottoms.
b. Top temperature (dew point) of distillate and boiling
point of bottoms.
c. Minimum stages for total reflux, using Fenske
correlation and distribution of other components in the
distillate and bottoms.
d. Minimum reflux ratio, using the Underwood method.
e. Number of theoretical stages at an operating reflux ratio
R of 1.5@+ using Gilliland correlation.
f. Location of feed tray using the method of Kirkbride.
(Geankoplis, 1997).
3.2. Results from Manual Computation
The temperature (to use for determining the values of � is
the average between) the top 67 ℃ and bottom 132 ℃
temperature.
Table 1. Manually computed results.
Component Distillate, D Bottoms, W
`a =ba baa bc bcd
A(n-butane) 0.6197 39.9610 0.0011 0.0390
B(n-pentane) 0.3489 22.5000 0.0704 2.5000 C(n-hexane) 0.0310 2.0000 0.5068 18.000
D(n-heptane) 0.0004 0.0230 0.4217 14.9770
1.0000 D = 64.4840 1.0000 W = 35.5160
3.3. Results from CAD Computation
Feed = 100 mol/hr
Pressure = 4 Atm
State of feed = Saturated Liquid
__________________________
Composition: n-Butane
__________________________
Xd: 0.6198
Xd D: 39.9707 (mole fraction in the distillate)
Xw: 0.0008
Xw W: 0.0293 (mole fraction in the bottom)
Xf: 0.4 (mole fraction in the feed)
______________________________
Composition: n-Pentane (light key)
______________________________
Xd: 0.3489 (mole fraction in the distillate)
Xd D: 22.5 (amount in the distillate)
Xw: 0.0704 (mole fraction in the bottoms)
Xw W: 2.5 (amount in the bottoms)
Xf: 0.25 (mole fraction in the feed)
_____________________________
Composition: n-Hexane (heavy key)
_____________________________
Xd: 0.0310 (mole fraction in the distillate)
Xd D: 2 (amount in the bottoms)
Xw: 0.5069 (mole fraction in the bottoms)
Xw W: 18 (amount in the bottoms)
Xf: 0.2 (mole fraction in the feed)
_____________________________
Composition: n-Heptane
_____________________________
Xd: 0.0003 (mole fraction in the distillate)
Xd D: 0.0197 (amount in the distillate)
Xw: 0.4219 (mole fraction in the bottoms)
Xw W: 14.9803 (amount in the bottoms)
Xf: 0.15 (mole fraction in the feed)
_____________________________
D = 64.4904 mol/hr
W = 35.5096 mol/hr
Minimum stages at total reflux = 5.655
Minimum Reflux Rm: 0.3954
Actual Number of Trays: 13
Number of trays above feed location, Ne = 7
Number of trays below feed location, Ns = 6
The feed tray is tray from the top of the column = 7
Top temperature = 68 Degree Celsius
Bottom Temperature = 132 Degree Celsius
4. Discussions
Table 2. Results discussion figures.
Component Distillate, D Bottoms, W
`a = ba baa bc bc
d
A(n-butane) 0.6197 39.9610 0.0011 0.0390
A(n-butane)
B(n-pentane) 0.6197 39.9707 0.0008 0.0293 B(n-pentane) 0.3489 22.5000 0.0704 2.5000
C(n-hexane) 0.3489 22.5 0.0704 2.5
C(n-hexane) 0.0310 2.0000 0.5068 18.000 D(n-heptane) 0.0310 2.0 0.5069 18.8
D(n-heptane) 0.0004 0.0230 0.4217 14.9770
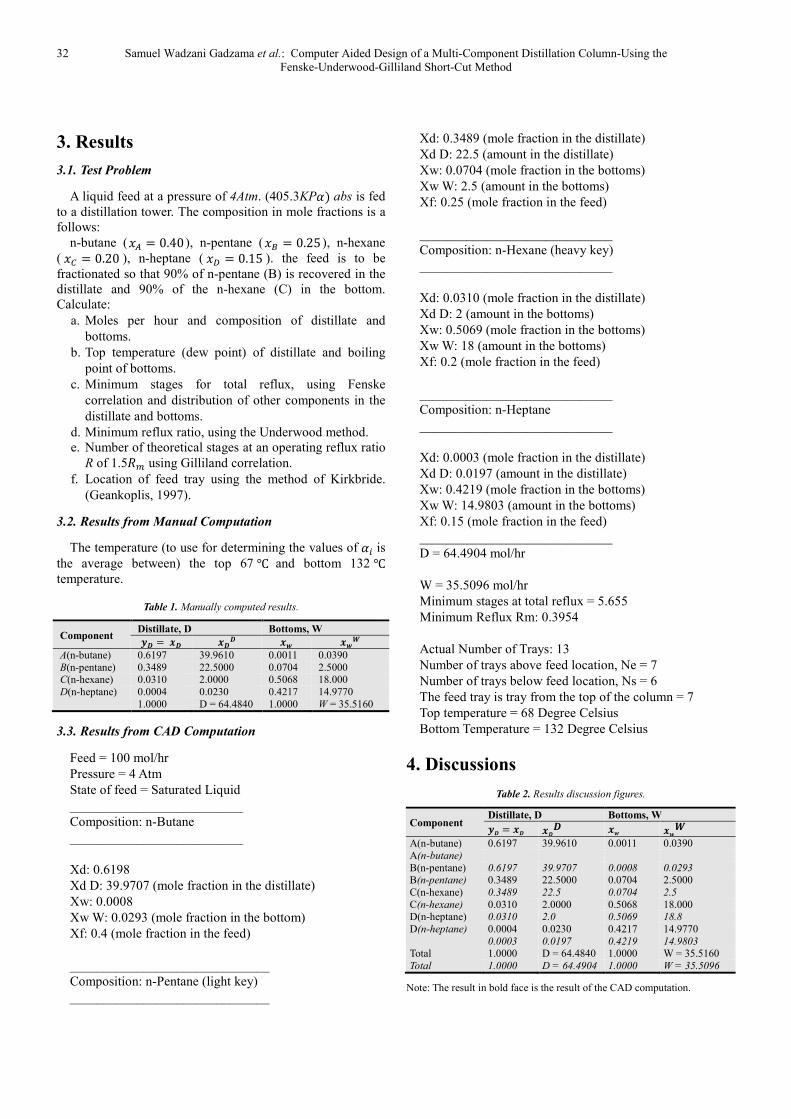
0.0003 0.0197 0.4219 14.9803 Total 1.0000 D = 64.4840 1.0000 W = 35.5160
Total 1.0000 D = 64.4904 1.0000 W = 35.5096
Note: The result in bold face is the result of the CAD computation.
Science Innovation 2016; 4(3-1): 24-33 33
From the result in Table 2 above:
1. The top composition for the manual computation is
64.4840 mol/hr and that for the CAD is 64.4904 mol/hr,
the variation in the two results is as a result of better
computation of value by the CAD result (with a
difference in value of 0.0064), which is very close.
2. The top temperature for the manual computation is 67
degrees Celsius and that of the CAD is 68 degrees
Celsius. The variation in the two results is the data
bank, meaning that more accurate result could be
obtained with closely imputed value in the data bank.
3. The bottom temperatures are the same for both
computations.
4. For the minimum stages using Fenske correlation the
manual computation is 5.404 and that of the CAD is
5.655. This is more accurate in that it the calculation
process involves iteration.
5. For the manual computation the minimum stages at
total reflux for the minimum reflux ratio using the
Underwood correlation, for the manual computation is
0.395 and that of the CAD is 0.3954, also here, the
variation is as a result of more accurate computation by
the CAD computation the results are very close.
6. Number of theoretical stages at operating reflux, using
Gilliland correlation is the same for both computations,
as 13.
7. The feed tray location is the same for both
computations, as the 7th
tray.
5. Conclusion
In conclusion, it can be said that the aim of the research
has been achieved, in that the model designed works and
more importantly, gives more accurate, time saving and
reliable results.
The following have been outlined as room for further
studies:
� The Erbar-Maddox chart should be work upon to see if
it could give more accurate results that Underwood
correlation.
� That a correlation should be generated for the Erbar-
Maddox chart as it is for Gilliland.
� The module can be further improved upon with time by
increasing more correlation in the source code to
compute for other parameters, like the tray spacing,
e.t.c.
References
[1] Cannon S. R. (1997). Understanding Programming, an Introduction to C++. West Publishing Company, U.S.A. 30.
[2] Foust A. S. (1980). Principles of Unit Operations. 2nd Edition. John Wiley and Sons. New York, 78-80.
[3] Geankoplis C. J. (1997). Transport Processes and Unit Operations. 3rd Edition. Prentice Hall. Englewood Cliffs. New Jersey. U.S.S. 679-689.
[4] Makama B. A. (2001). CAD Module for Multi-Component Distillation Column (FUG-Linear Algebra Method). A thesis presented to the Department of Chemical Engineering. Federal University of Technology, Minna, Nigeria. 1-5, 7-10 (Unpublished).
[5] Oguntoyinbo S. (1993). CAD and its Application to NITEL Research and Development. NITEL Research AND Development Journal. Vol. 1. No. 2, Oct. 1993. 41.
[6] Onifade K. R. (1999). Computer Aided Module for Binary Distillation Column. A paper Presented to the Department of Chemical Engineering. FUT, Minna, Nigeria.
[7] Onifade K. R. (2000). CAD Module for Multi-Component Distillation Column. Journal of Technology, Bangkok, Thailand 4(1) 26-38.
[8] Perry R.H and Green D.W. (1997). Perry’s Chemical Engineers Handbook. 7th Edition. McGraw Hill Book Company. U.S.A. 13-40, 13-43, 44, 45.
[9] Schweigtzer P. A. (1979). Handbook of Separation Techniques for Chemical Engineers. McGraw Hill Book Company. U.S.A. 1-39-41, 1-86, 106, 1-117.
[10] Wadzani S. G. (2005). CAD of a Multi-Component Distillation Column-using the FUG short-cut Method. A thesis presented to the Department of Chemical Engineering, University of Maiduguri, Nigeria.