Computer measurement of retinal nerve fiber layer striations Eli Peli, Thomas R. Hedges 111, and Bernard Schwartz An image analysis method to measure retinal nerve fiber layer (RNFL) striations from digitized fundus photographs was developed to improve detection and monitoring of progressive diffuse RNFL loss. Stria- tions were measured by comparing the high spatial frequency variability across with the variability along the RNFL. This locally normalized measure of striations compensates for the wide density variations both within individuals and between individuals and RNFL photographs. Five repeated measurements were taken at each of three locations from each retinal image. Measurements from five patients with recorded visual field loss due to optic nerve diseases were compared with five normal subjects and five suspect eyes. Measurements clearly distinguished the three groups when taken at the temporal arcades. Measurements above and below the arcades were also consistent, but did not distinguish normals from suspects. The measure was correlated with graded estimates of RNFL integrity of two trained observers (p = -0.57, p < 0.001 and p = -0.61, p < 0.001). 1. Introduction The diagnostic value of observing nerve fiber dam- age has been demonstrated for several diseases. 1 - 3 At- rophy of the retinal nerve fiber layer (RNFL) may be focal (i.e., wedge or slit defects) or diffuse. Diffuse atrophy, in which the striated pattern associated with healthy RNFL gradually diminishes, is seen frequent- ly in glaucoma. 4 Funduscopic and photographic evaluation of RNFL atrophy remains a difficult task, especially for diffuse atrophy, which is the focus of this paper. To improve the evaluation of RNFL photographs, various photo- graphic techniques have been suggested 5 ' 6 and com- pared. 7 ' 8 Recently, methods of enhancing RNFL sub- jective evaluation using computerized image process- ing 9 - 11 have been reported. Quantitative measurements of RNFL changes were attempted by other investigators. Tagami 12 found a high correlation between the level of visual field loss and graded atrophy of the maculopapillar bundles of the RNFL. The atrophy was estimated subjectively using densitometry of red-free fundus photographs. He classified the atrophy observed with the densitom- The authors are with Tufts-New England Medical Center, De- partment of Ophthalmology, Boston, Massachusetts 02111. Received 1 June 1988. 0003-6935/89/061128-07$02.00/0. ( 1989 Optical Society of America. etry into four levels from normal RNFL to total atro- phy. In a pilot study, Lundstrdm and Eklundh 13 mea- sured RNFL atrophy for one patient using computerized densitometry. 14 They used a variability measure defined as the mean of absolute differences between adjacent density values along arcs concentric with the optic disk as a measure of RNFL atrophy. This measure is highly sensitive to contrast and lumi- nance changes between images. We have expanded and modified this approach us- ing similar measurements and image processing. We used a measure of variability that is locally normalized to compensate for the wide range of densities between fundus photographs taken at different times. These variations arise from changes in illumination related to pupillary size and the local density variability within each photograph due to background choroidal vascula- ture and pigmentary changes. The compensation is achieved by comparing the density variability mea- sured across the RNFL with that along the RNFL within the same fundus area. 11. Materials and Methods A. Photo Selection and Digitization Black-and-white photographs of the RNFL were ob- tained from patients with optic nerve diseases and normal volunteers using a Canon CF-60Z fundus cam- era and Plus X film (Kodak ASA 100) with a green Spectrotech-540 filter. Photographs were taken sepa- rately of the inferior and the superior temporal arcades with the optic nerve head at the corner of each frame. 1128 APPLIED OPTICS / Vol. 28, No. 6 / 15 March 1989
Transcript
Computer measurement of retinal nerve fiber layerstriations
Eli Peli, Thomas R. Hedges 111, and Bernard Schwartz
An image analysis method to measure retinal nerve fiber layer (RNFL) striations from digitized fundusphotographs was developed to improve detection and monitoring of progressive diffuse RNFL loss. Stria-tions were measured by comparing the high spatial frequency variability across with the variability along theRNFL. This locally normalized measure of striations compensates for the wide density variations bothwithin individuals and between individuals and RNFL photographs. Five repeated measurements weretaken at each of three locations from each retinal image. Measurements from five patients with recordedvisual field loss due to optic nerve diseases were compared with five normal subjects and five suspect eyes.Measurements clearly distinguished the three groups when taken at the temporal arcades. Measurementsabove and below the arcades were also consistent, but did not distinguish normals from suspects. Themeasure was correlated with graded estimates of RNFL integrity of two trained observers (p = -0.57, p <0.001 and p = -0.61, p < 0.001).
1. Introduction
The diagnostic value of observing nerve fiber dam-age has been demonstrated for several diseases.1-3 At-rophy of the retinal nerve fiber layer (RNFL) may befocal (i.e., wedge or slit defects) or diffuse. Diffuseatrophy, in which the striated pattern associated withhealthy RNFL gradually diminishes, is seen frequent-ly in glaucoma. 4
Funduscopic and photographic evaluation of RNFLatrophy remains a difficult task, especially for diffuseatrophy, which is the focus of this paper. To improvethe evaluation of RNFL photographs, various photo-graphic techniques have been suggested5'6 and com-pared.7'8 Recently, methods of enhancing RNFL sub-jective evaluation using computerized image process-ing9-11 have been reported.
Quantitative measurements of RNFL changes wereattempted by other investigators. Tagami12 found ahigh correlation between the level of visual field lossand graded atrophy of the maculopapillar bundles ofthe RNFL. The atrophy was estimated subjectivelyusing densitometry of red-free fundus photographs.He classified the atrophy observed with the densitom-
The authors are with Tufts-New England Medical Center, De-partment of Ophthalmology, Boston, Massachusetts 02111.
Received 1 June 1988.0003-6935/89/061128-07$02.00/0.( 1989 Optical Society of America.
etry into four levels from normal RNFL to total atro-phy. In a pilot study, Lundstrdm and Eklundh13 mea-sured RNFL atrophy for one patient usingcomputerized densitometry.14 They used a variabilitymeasure defined as the mean of absolute differencesbetween adjacent density values along arcs concentricwith the optic disk as a measure of RNFL atrophy.This measure is highly sensitive to contrast and lumi-nance changes between images.
We have expanded and modified this approach us-ing similar measurements and image processing. Weused a measure of variability that is locally normalizedto compensate for the wide range of densities betweenfundus photographs taken at different times. Thesevariations arise from changes in illumination related topupillary size and the local density variability withineach photograph due to background choroidal vascula-ture and pigmentary changes. The compensation isachieved by comparing the density variability mea-sured across the RNFL with that along the RNFLwithin the same fundus area.
11. Materials and Methods
A. Photo Selection and Digitization
Black-and-white photographs of the RNFL were ob-tained from patients with optic nerve diseases andnormal volunteers using a Canon CF-60Z fundus cam-era and Plus X film (Kodak ASA 100) with a greenSpectrotech-540 filter. Photographs were taken sepa-rately of the inferior and the superior temporal arcadeswith the optic nerve head at the corner of each frame.
Field size was adjusted to ,30. Negatives were digi-tized with a linear array camera (Datacopy, MountainView, CA). Only retinal areas with corresponding vi-sual field defects, as observed from the patients' rec-ords, were used. Either inferior or superior quadrantswere used from the normal volunteers. All the nega-tives were positioned for digitization so that theoptic disk was at the lower left corner (to appear as aleft superior temporal arcade). The image, digitizedat a resolution of 512 X 512 pixels, included about a 150X 15° section of the negative excluding the roundedges. Illumination was adjusted to obtain the maxi-mal contrast for the presentation of the RNFL in thedigitized image, resulting in many cases in saturationof the optic disk details. Images were stored on mag-netic disks on a VAX 780 computer (Digital Corpora-tion, Maynard, MA) and displayed on a DeAnza (Bev-erly Hills, CA) IP-5000 image display system. Resultswere photographed using a Dunn MultiColor camera(Dunn Instruments, San Francisco).
B. Orientation of Measurements
Lundstrbm and Eklundh1 3 performed the densitom-etry along arcs centered at the optic disk, while Taga-mi's12 densitometric readings were taken along astraight line across the maculopapillar bundle. Wehave noted that, although the retinal nerve fiber stria-tions radiate from the optic disk, the fibers' apparentconvergence at 2-3 disk diameters from the margin ofthe optic disk appears to be much smaller than a directprojection to the center of the nerve head. When weattempted to measure the apparent center of RNFLintersection by measuring two points along two differ-ent clear nerve fiber striations and calculated the pointwhere these two lines would intersect, we found that,within the accuracy of this measurement techniqueand sampling resolution, the fibers appeared to benearly parallel 2-3 disk diameters from the optic disk.Therefore, measurements were performed for the restof this study along straight lines rather than arcs andradii.
C. Average Densitometry
Density values representing the fundus reflectivitywere taken along straight lines that were drawn across(perpendicular to) the RNFL striations. Brightnessvalues taken along each line generated a vector xi:
Xi = (XiIXi,2- ... *Xi,.)-(1)
A number of vectors were taken this way from a set ofparallel contiguous lines, separated by 1 pixel in theorthogonal direction, generating a matrix X:
/X,
X= Xili
\Xm,l,
X1,21 . .. Xl,n\...
...
...
...
...
. .. AXm,n/
In this matrix, the element xij represents the jth point
xi
X4
-4
x
(a)
ADMA%~vL
(b)
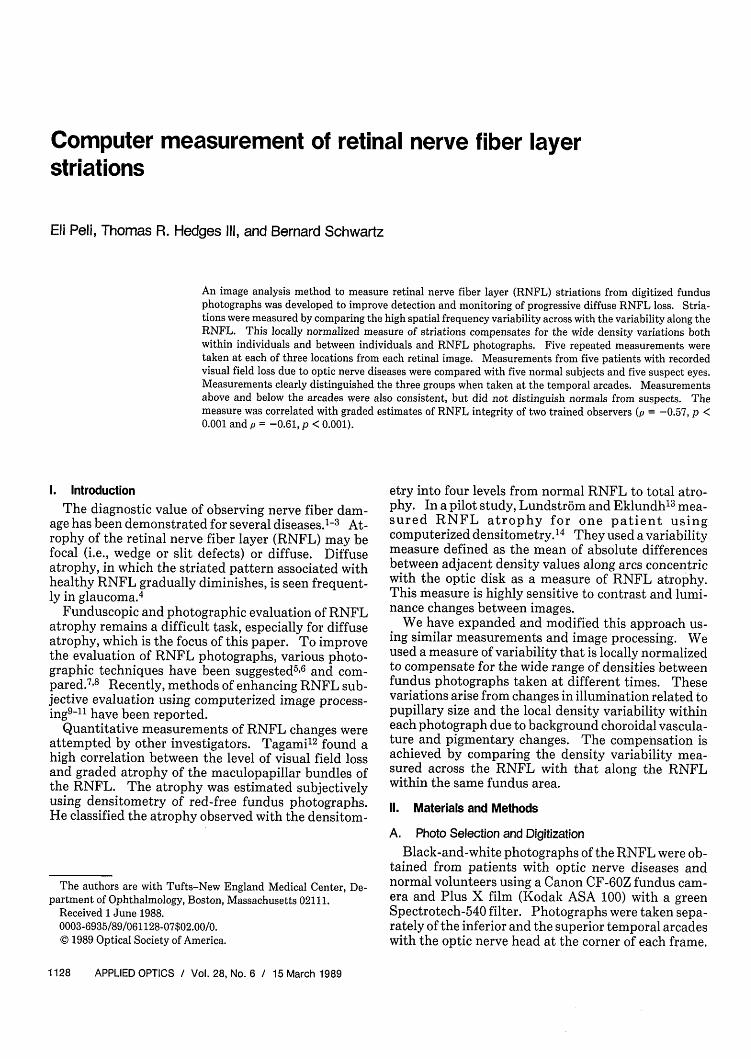
Fig. 1. Schematic presentation of the density averaging technique.(a) Schematic presentation of a retinal nerve fiber layer (RNFL)image with a wedge defect. The grey level information is sampledalong lines perpendicular to the RNFL pattern (open arrows). Thegrey levels are averaged along lines parallel to the RNFL (darkarrows). (b) The average data from four curves generate one curverepresenting the grey levels across the RNFL (black in the image isrepresented by low level on the curve and white by high). This final,lowest curve is the averaged density curve used to evaluate the
RNFL striations.
on the ith line. This method of representing data issimilar to that of Lundstrbm and Eklundh.1 3
To reduce noise effects in the image, we applied anaveraging procedure. Noise in the RNFL images maybe photographic from film grain or of electronic originarising from the digitization process, among other lessobvious sources. The averaging procedure was ap-plied assuming that the noise is randomly distributedin all orientations, i.e., isotropic, while the RNFL stria-tions are arranged orderly in almost parallel lines.The averaging was thus calculated from values takenalong the RNFL over m consecutive lines resulting in anew vector representing an average of order m:
X m { -m22 . n (3a)
where
(3b)I= M
i= 1
This average densitometry improves the signal-to-noise ratio in the same way that visually evoked re-sponse signals improve with averaging. The averagingtechnique is illustrated in Fig. 1.
Averaging was expected to reduce noise only for alimited number of lines, because curvature of theRNFL striation reduces alignment between the RNFLand the averaging direction. To find the optimalnumber of lines that should be averaged to improvesignal-to-noise ratio without undesirable deteriorationof the signal, we calculated the difference between
consecutive cumulative averages over 20 lines on anumber of images. The difference between consecu-tive cumulative averages was defined as
diff(m) = (-+l _jn-j=1
(4)
If the averaging operation is ideal, the difference,diff(m) should decrease asymptotically toward zero asm increases. However, in our experiments we foundthat diff(m) decreases up to m = 4 or 5 and thenconverges to an asymptotic value, suggesting that thebenefit of line averaging is limited to averaging of fourto five lines (Fig. 2).
D. Variability Measure
The variability measure was defined in the followingway: The operator using a cursor driven by a graphicbit-pad identified a rectangular area in the digitizedphotograph that had one side oriented along theRNFL. A series of lines across the RNFL separatedby 5 pixels and a similar series of lines along the RNFLwere then delineated automatically by the computer(Fig. 3). Note that a separate matrix X is associatedwith each of these lines. An average densitometrymeasurement for each line was calculated using twocontiguous lines on each side for a total of a five-linewidth as described in Eq. (3). This assigns a densi-tometry value to a line position centered in the areafrom which it was calculated, e.g., if the averaging inFig. 1 would be carried on only three lines, the averagedvalues assigned for the position of line 2 will be com-posed from the values of line 2 together with lines 1 and3. Similarly, the values assigned for line 3 will becalculated from densitometry measurements of lines 2,3, and 4.
A variability measure (var) was calculated for eachaveraged densitometry line in both directions acrossand along the RNFL. The variability was calculatedas:
var = E (j-x)2,j=1
(5a)
where
1 nX = - Xjmn j=1
(5b)
is the mean density for each line.The resulting two series of variability measure-
ments, one taken from all lines across the RNFL andone taken along the RNFL, were used to evaluate itsstate. It was assumed that if clear RNFL striationsexist in that section of the fundus image, the variabilityof densities measured across the RNFL should be sig-nificantly larger than those measured along it. Apaired t-test was then carried out on these two series ofmeasurements to determine the confidence level of thedifference. The q value' 5 indicating the significanceof the difference between the variabilities taken in thetwo orthogonal directions is used as the measure ofRNFL striation in this study.
110
127
104
W ~~~~~~~~~~~106162
156
217
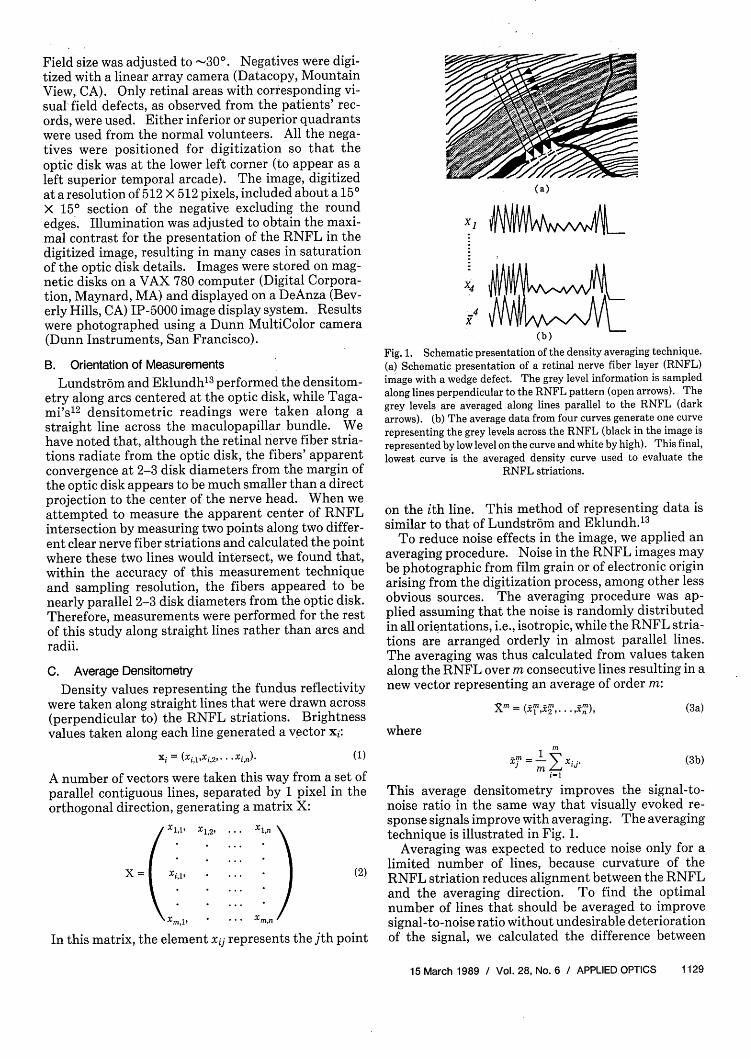
Fig. 2. Illustration of the effect of cumulative averaged density.The bright line across the retinal nerve fiber layer striations repre-sents the area from which the densitometry measures were taken.The curves on the right represent the cumulative averaged density.The lowest curve is the measurement from one line only, the secondcurve the average of two lines, the third the average of three lines,etc. Note that there are only minor changes in the curves after threeaverages. The numbers on the right represent diff(m) for the corre-
sponding pair of averaged density curves.
Fig. 3. Variability measurements illustrated for a normal retina.The rectangular area in the arcade represents the area from whichmeasurements were taken. The density curves on the right are frommeasurements across the retinal nerve fiber layer (RNFL), and the
curves on the left from measurements along the RNFL.
A preliminary set of experiments resulted in fre-quent failure to identify significant RNFL striations,although the densitometry curve displayed on thescreen appeared to have a clear high frequency oscilla-tory pattern in the density taken across the RNFL andnot in those taken along it (Fig. 3). The reason for thisapparent failure of the variability measure was identi-
fied as large, low frequency variability in the density ofall curves, which resulted from underlying variationsin choroidal pigmentation, rather than variations inthe RNFL pattern. These choroidal variations maskthe RNFL variations. The background changes indensity, although large in amplitude, are easy to distin-guish from the RNFL pattern by observation, becausethese changes are composed of significantly lower fre-quencies than the changes associated with RNFL. Wecorrect for these in the following way: each densitycurve was averaged using a running average windowthat tracked the changes representing choroidal lowfrequency noise in the curves but was unable to followthe abrupt changes resulting from the RNFL pattern.The window implemented was a raised cosine [Eq.(6b)] with a length of 17 (k = 8), while the averagewidth of a RNFL striation in our images was 3-4pixels for normal eyes. The root mean squared differ-ence of the density from the average smooth densitycurve was then calculated as the new variability mea-sure of order k, vark. This effect is illustrated in Fig. 4:
vark = 1 (m - ix)2 (6a)n -
where k represents half of the size of the averagingwindow and
E (1 + cos k )g+l
i ~(1+cosk) (6b)
E 1+ Cos k )
is the raised cosine weighted running average.
E. Subjects
To evaluate the performance of this normalizedvariability measure, two operators separately pro-cessed digitized images from five normals, five patientswith RNFL loss that was collaborated with visual fieldloss, and five suspect eyes. The normal controls werepaid volunteers ranging in age from 20 to 45 who un-derwent complete eye examinations prior to photogra-phy, except for intraocular pressure measurementsthat were deferred to follow the photographic session.The volunteers included two women and three men,one of whom was black. The patients had optic nervediseases with documented field loss with Octopus 2000R automated perimetry. The patients were a 14-yr oldgirl with secondary open-angle glaucoma, a 32-yr oldwoman with low-tension glaucoma, a 54-yr old manwith open-angle glaucoma, a 65-yr old woman withopen-angle glaucoma, and a 56-yr old woman withidiopathic optic neuropathy. The diagnosis of glauco-ma was determined clinically. Glaucoma patients hadvisual field loss by Octopus programs 7 and 31, record-ed nerve head changes characteristic of glaucoma, and,except for the low-tension case, all had pressures ofmore than 21 mm Hg on repeated evaluations. Visualfield loss was defined as a difference of 10 dB or morefrom the age-corrected normal values, at a cluster ofthree or more contiguous points. Although RNFL
Fig. 4. Illustration of the corrected variability measurements fornormal retinal nerve fiber layer (RNFL). The dark curves representthe density measurements taken as in Fig. 3. The white curves
represent the running average curve described in Eq. (6b). Thevariability is calculated from the difference between the white anddark curves. Note that the variability on the right (across the
RNFL) is larger than that on the left (along the RNFL).
evaluation is now used routinely in evaluating glauco-ma patients at our clinic, all these patients had theirdiagnoses established before we started to use RNFLphotography. Glaucomatous visual field loss general-ly correlated with observed RNFL defects both in loca-tion and severity and we analyzed only quadrants cor-responding to visual field loss.
Glaucoma suspects were defined as patients withelevated intraocular pressure >21 mm Hg on two inde-pendent measurements with no visual field loss asdetermined by Octopus programs 7 and 31. Thesepatients may or may not have had optic disk changes.
The suspect eyes were those of patients with normalvisual fields and the following reasons to suspect dis-eases: right eye of a 14-yr old girl with ocular hyper-tension, with the fellow eye diagnosed with secondaryopen-angle glaucoma; right eye with ocular hyperten-sion of a 50-yr old man with the fellow eye diagnosed asprimary open-angle glaucoma; left eye of a 74-yr oldwoman with high ocular hypertension in both eyes;right eye of a 32-yr old woman with the fellow eyediagnosed with low-tension glaucoma; and the left ocu-lar hypertensive eye of a 65-yr old woman with glauco-ma field loss in the fellow eye.
F. Location of Measurements
The processing included repeated measurement offive windows placed in the same approximate area. Ineach image, three different areas were tested, oneabove the vascular arcade, one within the temporalarcade, and one below the arcade. The operators wereinstructed as to the general area of placement of thewindow and recorded the results of statistical testingon five consecutive automated placements. The ori-
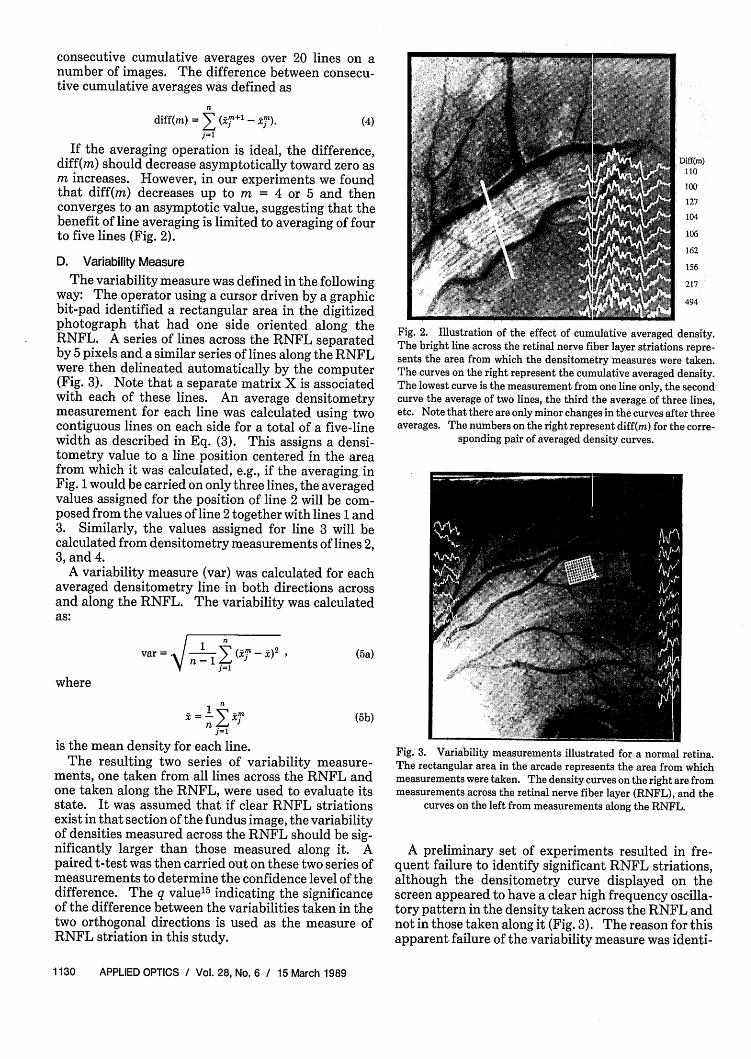
Fig. 5. Comparison of variability measurement in an apparentlynormal and damaged retinal nerve fiber layer (RNFL) in the sameeye of a patient with Leber's optic atrophy. (a) Measurementstaken outside the vascular arcade, normal RNFL. The densityalong the RNFL (bottom) and the density across the RNFL (top).Note that the high spatial frequency variability across the RNFL islarger, even at this measurement area, outside the arcade. Thedifference is even greater inside the arcade. (b) Measurement in thepapillomacular bundle area of advanced diffused atrophy results invariability along which is similar to the variability across the RNFL.Note: the density curves in (a) and (b) are not to the same scale.
entation and size of each area was slightly different.The operators indicated the initial orientation and sizeof the measurement area by selecting three points.Orientation of the NFL was determined by direct ob-servation and in relation to the vascular pattern. Mis-alignment by large degrees can affect the results in asubstantial manner. However, it is difficult to mis-judge the orientation by more than 15° by using thevascular pattern as a cue, even if there are no striationsvisible. Preliminary experiments that tested the ef-fect of orientation on the variability indicated minimaleffects of small angular deviations of <150.
During testing, the program randomly varied theposition of the three points within a 5 X 5 pixel windowaround the first position. The results of the five mea-surements were averaged. This procedure was imple-mented to reduce the sensitivity of the measurementto the exact identification of striation orientation bythe operator.
G. Comparison with Trained Human Observers
Two trained observers were presented with the fif-teen images in a random masked fashion. The areas ofautomatic measurements were indicated, and the ob-servers were asked to grade the appearance of theRNFL striations in the marked areas. The optic diskwas masked for these presentations. A scale of 0-10was used, with 10 indicating clear, highly visible, ap-parently normal RNFL, and 0 indicating total atrophywith no visible striations. The observers were asked toignore the overall appearance and base their judg-ments on the specific local appearance of striations.
Ill. Results
We assumed that healthy RNFL striations will re-sult in a variability of the striated density measureacross the nerve fibers that is significantly larger thanthat measured along the RNFL (Fig. 5). This hypoth-esis was tested for each set of measurements and theresult recorded as the q value.'5 Thus, for healthyRNFL, we expected a very low q value and for severediffuse atrophy a very high q value (q > 0.2). If thevariability across the RNFL was smaller than thatalong it, we defined the q value arbitrarily to be q = 1.0.The q values for each of the five measurements takenat each location were averaged to obtain the q valueused for comparison.
The average q values from five patients, five normalcontrols, and five suspect eyes are listed in Table I.The measurements inside the vascular arcade clearlydistinguish between diseased and normal eyes. Theaverage q value of q = 0.0009 for the normal controlsindicates high probability of RNFL striations, while q= 0.47 for the diseased eye indicates no differencebetween the variability measure taken across andalong the RNFL in the diseased eyes. The intermedi-ate results for the suspect (q = 0.15) indicate a differ-
Table 1. Measurements of Retinal Nerve Fiber Layer Striations InDiseased, Suspect, and Normal Eyes
Diseased Suspect Normal
Outside vascular 0.70 0.38 0.33arcade
In vascular 0.47 0.15 0.0009arcade
In papillomacular 0.82 0.16 0.21bundle
Averaged q values for the difference between variability measurestaken across and along the retinal nerve fiber layer (RNFL). Low qvalue indicates clear striation in the direction of the RNFL. High qvalue indicates lack of difference between the variabilities measuredin both directions. Each measurement represents the average offive eyes and five repeat measurements for each eye.
ence between the two directions, but with less appar-ent striations than the normal eyes.
With the normalization and correction for choroidaldensity variations, the measurements were consistentwith human observation on almost all informal experi-mental trials. However, occasional misclassificationsoccurred that usually were the result of including avessel within the measurement area. If the vessel wasalong the RNFL, it was identified as a strong striationthat would result in assignment of RNFL to areaswhere they could not be visualized. If the vessel waslying across the RNFL, it resulted in a measurement ofstrong variation in this direction that negated the ef-fect of the RNFL striations. In many cases, smallvessels, which were included in the measurement area,were diagonal to the RNFL, affected both measure-ments equally, and had little net effect on the finalmeasurement.
Although the measurements outside the vasculararcade and in the papillomacular bundle resulted inhigher q values for the diseased eyes than normal eyes,the results were not as conclusive. The average q valuefor the normal eyes could not be interpreted as indica-tive of measurable RNFL striations. In most cases,these measurements agree with human observers whocould not distinguish striations in the measurementarea.
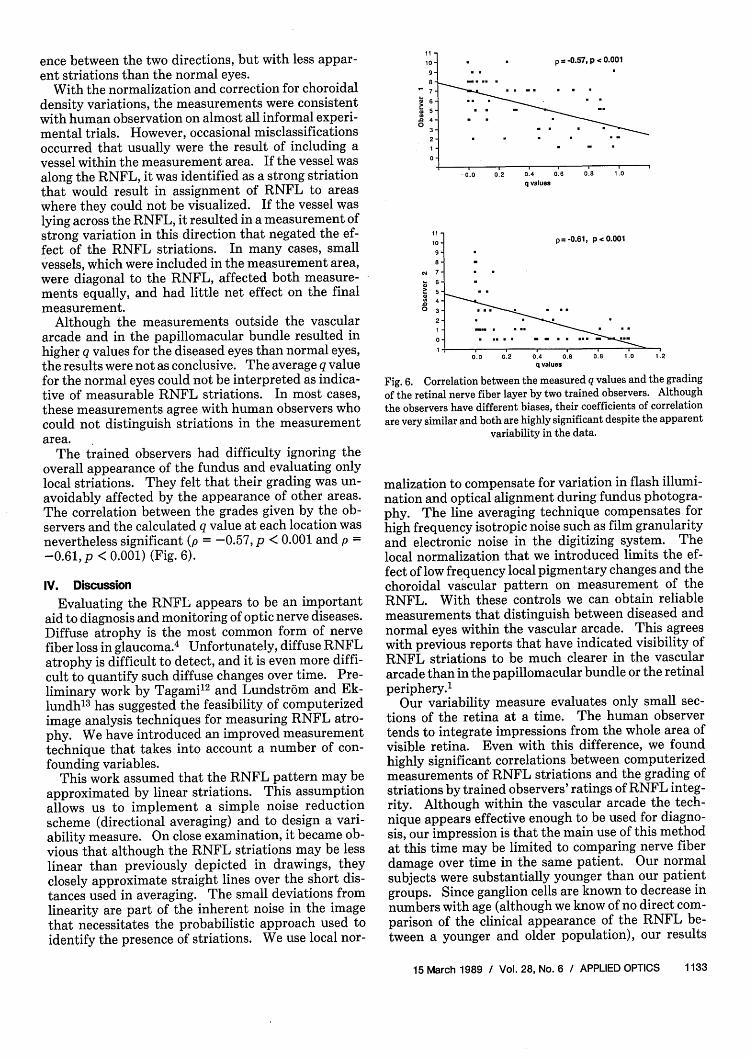
The trained observers had difficulty ignoring theoverall appearance of the fundus and evaluating onlylocal striations. They felt that their grading was un-avoidably affected by the appearance of other areas.The correlation between the grades given by the ob-servers and the calculated q value at each location wasnevertheless significant (p = -0.57, p < 0.001 and p =-0.61, p < 0.001) (Fig. 6).
IV. Discussion
Evaluating the RNFL appears to be an importantaid to diagnosis and monitoring of optic nerve diseases.Diffuse atrophy is the most common form of nervefiber loss in glaucoma.4 Unfortunately, diffuse RNFLatrophy is difficult to detect, and it is even more diffi-cult to quantify such diffuse changes over time. Pre-liminary work by Tagami12 and Lundstrbm and Ek-lundh13 has suggested the feasibility of computerizedimage analysis techniques for measuring RNFL atro-phy. We have introduced an improved measurementtechnique that takes into account a number of con-founding variables.
This work assumed that the RNFL pattern may beapproximated by linear striations. This assumptionallows us to implement a simple noise reductionscheme (directional averaging) and to design a vari-ability measure. On close examination, it became ob-vious that although the RNFL striations may be lesslinear than previously depicted in drawings, theyclosely approximate straight lines over the short dis-tances used in averaging. The small deviations fromlinearity are part of the inherent noise in the imagethat necessitates the probabilistic approach used toidentify the presence of striations. We use local nor-
11
10
X 6-8 4-
:7
.0403
2
0
1110
9
8
e. 7-6-5
I
p = -0.57, p < 0.001
0 0 00-4 0.6q alues
p = -0.61, p < 0.001
4 - .
2
- . . ..- 0. . .. 8 . 1. .201- .. . . . -
0.0 0.2 0.4 0.6 0.8 .0 12q values
Fig. 6. Correlation between the measured q values and the gradingof the retinal nerve fiber layer by two trained observers. Although
the observers have different biases, their coefficients of correlationare very similar and both are highly significant despite the apparent
variability in the data.
malization to compensate for variation in flash illumi-nation and optical alignment during fundus photogra-phy. The line averaging technique compensates forhigh frequency isotropic noise such as film granularityand electronic noise in the digitizing system. Thelocal normalization that we introduced limits the ef-fect of low frequency local pigmentary changes and thechoroidal vascular pattern on measurement of theRNFL. With these controls we can obtain reliablemeasurements that distinguish between diseased andnormal eyes within the vascular arcade. This agreeswith previous reports that have indicated visibility ofRNFL striations to be much clearer in the vasculararcade than in the papillomacular bundle or the retinalperiphery.1
Our variability measure evaluates only small sec-tions of the retina at a time. The human observertends to integrate impressions from the whole area ofvisible retina. Even with this difference, we foundhighly significant correlations between computerizedmeasurements of RNFL striations and the grading ofstriations by trained observers' ratings of RNFL integ-rity. Although within the vascular arcade the tech-nique appears effective enough to be used for diagno-sis, our impression is that the main use of this methodat this time may be limited to comparing nerve fiberdamage over time in the same patient. Our normalsubjects were substantially younger than our patientgroups. Since ganglion cells are known to decrease innumbers with age (although we know of no direct com-parison of the clinical appearance of the RNFL be-tween a younger and older population), our results
should be interpreted with caution until further test-ing is done. Indeed, a much larger study is necessaryto establish the clinical value of our method. Studiesevaluating the diagnostic value of imaging techniquesare difficult and require large patient and control pop-ulations with independent disease criteria.16 Evalua-tion of our technique may use visual field defects assuch an independent criterion. However, the ultimatevalue of RNFL evaluation for the diagnosis of glauco-ma, either by observer or computer measurement, willbe significant only if the diagnosis can precede visualfield loss.17 The lack of other independent criteria willrequire prolonged prospective evaluation of patientswith elevated intraocular pressure to obtain the re-search material for such a study.
The technique described here as well as commonclinical evaluation of the RNFL 4 is based on 2-D reti-nal images. The RNFL is known to have measurabledepth that decreases with atrophy.18 Stereoscopic im-ages of the retina were used first by Manor et al.19 toqualitatively evaluate the RNFL integrity. Recently,Takamoto and Schwartz20 showed that stereogram-metry of the RNFL is feasible and may be a sensitivemeasure of atrophy. However, automated depth mea-surements are very difficult because of the transparentappearance of the RNFL and represent a great chal-lenge to computer vision techniques.
Quantitative analysis of RNFL images is limited bythe quality of the images. Image currently obtainedthrough digitization of films taken with standard fun-dus cameras are poor in contrast and resolution. Withthe development of scanning laser ophthalmoscopes(SLO), which are specifically tuned to imaging of theRNFL,2 122 the contrast and the resolution are expect-ed to improve dramatically, resulting in increased reli-ability of all image-processing techniques. We plan toevaluate our technique using images obtained from afully confocal SLO22 in the near future.
This work was supported in part by grants EY05450and EY05957 from the National Institutes of Health,Bethesda, MD.
E. Peli also works at the Eye Research Institute andHarvard Medical School.
References1. W. F. Hoyt, L. Fris6n, and N. M. Newman, "Funduscopy of
Nerve Fiber Layer Defects in Glaucoma," Invest. Ophthalmol.12, 814 (1973).
2. A. Vannas, C. Raitta, and S. Lemberg, "Photography of theNerve Fiber Layer in Retinal Disturbances," Acta Ophthalmol.55, 79 (1977).
3. M. Lundstr6m and L. Frisen, "Atrophy of Optic Nerve Fibres inCompression of the Chiasm; Degree and Distribution of Oph-thalmoscopic Changes," Acta Ophthalmol. 54, 623 (1976).
4. A. Sommer et al., "Evaluation of Nerve Fiber Layer Assess-ment," Arch. Ophthalmol. 102, 1766 (1984).
5. A. Sommer, S. A. D'Anna, H. A. Kues, and T. George, "High-Resolution Photography of the Retinal Nerve Fiber Layer," Am.J. Ophthalmol. 96, 535 (1983).
6. A. Sommer et al., "Cross-Polarization Photography of the NerveFiber Layer," Arch. Ophthalmol. 102, 864 (1984).
7. P. J. Airaksinen, H. Nieminen, and E. Mustonen, "RetinalNerve Fiber Layer Photography with a Wide Angle FundusCamera," Acta Ophthalmol. 60, 362 (1982).
8. E. Peli et al., "Nerve Fiber Layer Photography: a ComparativeStudy," Acta Ophthalmol. 65, 71 (1987).
9. E. Peli, T. R. Hedges, and B. Schwartz, "Computerized En-hancement of Retinal Nerve Fiber Layer," Acta Ophthalmol. 64,113 (1986).
10. E. Peli, "Adaptive Enhancement Based on a Visual Model,"Opt. Eng. 26, 655 (1987).
11. S. Mitra, B. S. Nutter, T. F. Krile, and R. H. Brown, "AutomatedMethod for Fundus Image Registration and Analysis," Appl.Opt. 27, 1107 (1988).
12. Y. Tagami, "Correlations Between Atrophy of Maculo-PapillarBundles and Visual Functions in Cases of Optic Neuropathies,"Doc. Ophthalmol. Proc. Ser. 19, 17 (1979).
13. M. Lundstrbm and J-O. Eklundh, "Computer Densitometry ofRetinal Nerve Fibre Atrophy: a Pilot Study," Acta Ophthal-mol. 58, 639 (1980).
14. The term densitometry is used here for measurements of reflec-tance gray levels rather than the common use for log(1/T), whereT is the transmission fraction.
15. The q value used here is equivalent to the p value commonlyused to denote the confidence level in a difference between twomeasured variables.
16. J. A. Swets and R. M. Pickett, Evaluation of Diagnostic SystemsMethods from Signal Detection Theory (Academic, New York,1982).
17. H. A. Quigley, "Examination of the Retinal Nerve Fiber Layer inthe Recognition of Early Glaucoma Damage," Trans. Am.Ophthalmol. Soc. 84, 920 (1986).
18. H. A. Quigley and E. M. Addicks, "Quantitative Studies ofRetinal Nerve Fiber Layer Defects," Arch. Ophthalmol. 100,807(1982).
19. R. S. Manor et al., "Narrow-Band (540-nm) Green-Light Ster-eoscopic Photography of the Surface Details of the PeripapillaryRetina," Am. J. Ophthalmol. 91, 774 (1981).
20. T. Takamoto and B. Schwartz, "Photogrammetric Nerve FiberLayer (NFL) Thickness Measurements in Normal, Ocular Hy-pertensive (OH), and Glaucomatous (OAG) Eyes," Invest.Ophthalmol. Vis. Sci. 29(suppl), 421 (1988).
21. A. Plesch, U. Klingbeil, and J. Bille, "Digital Laser ScanningFundus Camera," Appl. Opt. 26, 1480 (1987).
22. R. H. Webb, G. W. Hughes, and F. C. Delori, "Confocal ScanningLaser Ophthalmoscope," Appl. Opt. 26, 1492 (1987).