Page 1
Chapter 1 :
Informatics
Practices
Class XII ( As per
CBSE Board)
Advance operations on dataframes(pivoting, sorting & aggregation/Descri-ptive statistics)
Visit : python.mykvs.in for regular updates
New
Syllabus
2019-20
Page 2
Pivoting - dataframe
Visit : python.mykvs.in for regular updates
DataFrame -It is a 2-dimensional data structure with
columns of different types. It is just similar to a
spreadsheet or SQL table, or a dict of Series objects. It
is generally the most commonly used pandas object.
Pivot –Pivot reshapes data and uses unique values from
index/ columns to form axes of the resulting dataframe.
Index is column name to use to make new frame’s
index.Columns is column name to use to make new
frame’s columns.Values is column name to use for
populating new frame’s values.
Pivot table - Pivot table is used to summarize and
aggregate data inside dataframe.
Page 3
Pivoting - dataframe
Visit : python.mykvs.in for regular updates
Example of pivot:
PIVOT
DATAFRAME
ITEM COMPANY RUPEES USD
TV LG 12000 700
TV VIDEOCON 10000 650
AC LG 15000 800
AC SONY 14000 750
COMPANY LG SONY VIDEOCON
ITEM
AC 15000 14000 NaN
TV 12000 NaN 10000
Page 4
Pivoting - dataframe
Visit : python.mykvs.in for regular updates
There are two functions available in python for pivoting dataframe.
1.Pivot()
2.pivot_table()
1. pivot() - This function is used to create a new derived
table(pivot) from existing dataframe. It takes 3 arguments : index,
columns, and values. As a value for each of these parameters we
need to specify a column name in the original table(dataframe).
Then the pivot function will create a new table(pivot), whose row
and column indices are the unique values of the respective
parameters. The cell values of the new table are taken from column
given as the values parameter.
Page 5
Pivoting - dataframe
Visit : python.mykvs.in for regular updates
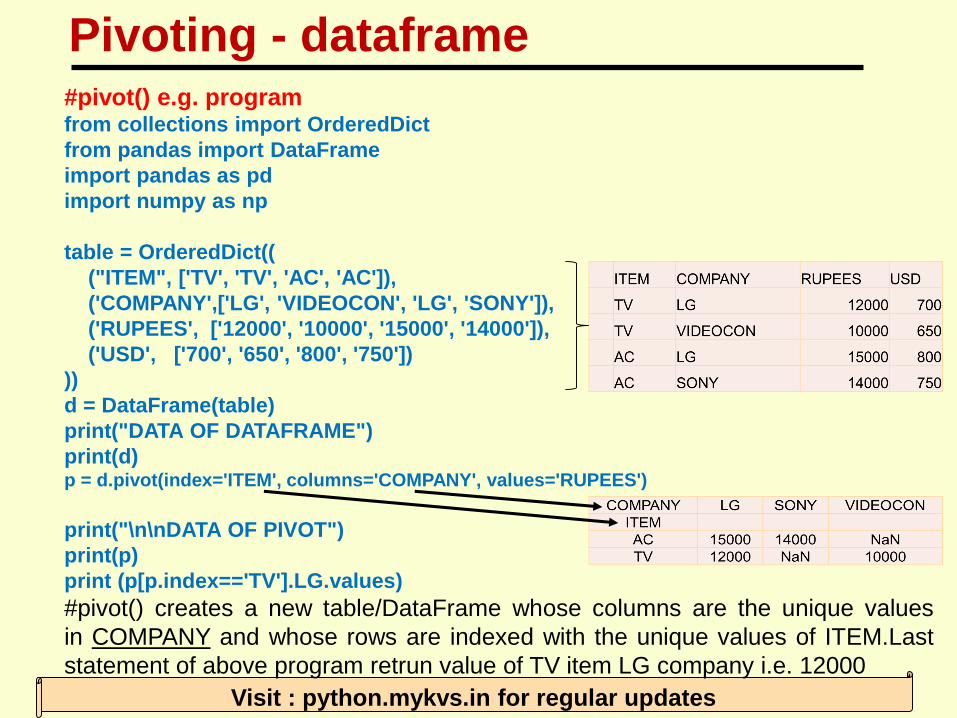
#pivot() e.g. programfrom collections import OrderedDict
from pandas import DataFrame
import pandas as pd
import numpy as np
table = OrderedDict((
("ITEM", ['TV', 'TV', 'AC', 'AC']),
('COMPANY',['LG', 'VIDEOCON', 'LG', 'SONY']),
('RUPEES', ['12000', '10000', '15000', '14000']),
('USD', ['700', '650', '800', '750'])
))
d = DataFrame(table)
print("DATA OF DATAFRAME")
print(d)p = d.pivot(index='ITEM', columns='COMPANY', values='RUPEES')
print("\n\nDATA OF PIVOT")
print(p)
print (p[p.index=='TV'].LG.values)
#pivot() creates a new table/DataFrame whose columns are the unique values
in COMPANY and whose rows are indexed with the unique values of ITEM.Last
statement of above program retrun value of TV item LG company i.e. 12000
Page 6
Pivoting - dataframe
Visit : python.mykvs.in for regular updates
#Pivoting By Multiple Columns
Now in previous example, we want to pivot the values of both RUPEES an
USD together, we will have to use pivot function in below manner.
p = d.pivot(index='ITEM', columns='COMPANY')
This will return the following pivot.
RUPEES USD
COMPANY LG
SON
Y VIDEOCON LG SONY VIDEOCON
ITEM
AC 15000 14000 NaN 800 750 NaN
TV 12000 NaN 10000 700 NaN 650
Page 7
Pivoting - dataframe
Visit : python.mykvs.in for regular updates
#Common Mistake in Pivotingpivot method takes at least 2 column names as parameters - the index and the
columns named parameters. Now the problem is that,What happens if we have
multiple rows with the same values for these columns? What will be the value of the
corresponding cell in the pivoted table using pivot method? The following diagram
depicts the problem:
d.pivot(index='ITEM', columns='COMPANY', values='RUPEES')
It throws an exception with the following message:
ValueError: Index contains duplicate entries, cannot reshape
ITEM COMPANY RUPEES USD
TV LG 12000 700
TV VIDEOCON 10000 650
TV LG 15000 800
AC SONY 14000 750
COMPANY LG SONY VIDEOCON
ITEM
AC NaN 14000 NaN
TV 12000 or 15000 ? NaN 10000
Page 8
Pivoting - dataframe
Visit : python.mykvs.in for regular updates
#Pivot Table
The pivot_table() method comes to solve this problem. It works like pivot,
but it aggregates the values from rows with duplicate entries for the
specified columns.
ITEM COMPANY RUPEES USD
TV LG 12000 700
TV VIDEOCON 10000 650
TV LG 15000 800
AC SONY 14000 750
COMPANY LG SONY VIDEOCON
ITEM
AC NaN 14000 NaN
TV 13500 = mean(12000,15000) NaN 10000
d.pivot_table(index='ITEM', columns='COMPANY', values='RUPEES‘,aggfunc=np.mean)
In essence pivot_table is a generalisation of pivot, which allows you to aggregate
multiple values with the same destination in the pivoted table.
Page 9
Sorting - dataframe
Visit : python.mykvs.in for regular updates
Sorting means arranging the contents in ascending or
descending order.There are two kinds of sorting
available in pandas(Dataframe).
1. By value(column)
2. By index
1. By value - Sorting over dataframe column/s
elements is supported by sort_values() method. We
will cover here three aspects of sorting values of
dataframe.
• Sort a pandas dataframe in python by Ascending and
Descending
• Sort a python pandas dataframe by single column
• Sort a pandas dataframe by multiple columns.
Page 10
Sorting - dataframe
Visit : python.mykvs.in for regular updates
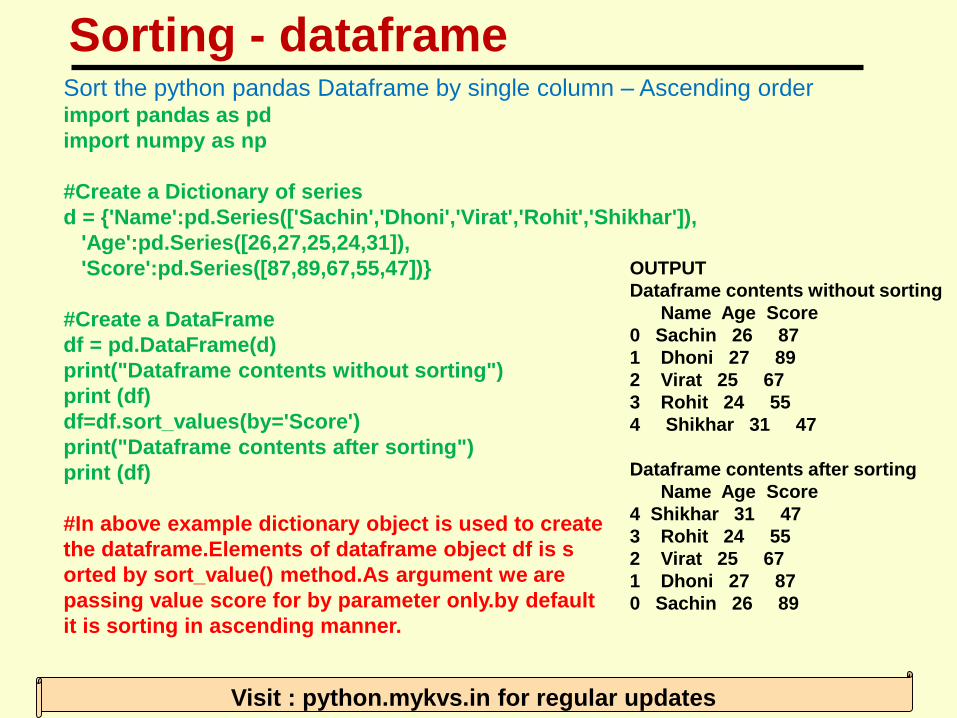
Sort the python pandas Dataframe by single column – Ascending orderimport pandas as pd
import numpy as np
#Create a Dictionary of series
d = {'Name':pd.Series(['Sachin','Dhoni','Virat','Rohit','Shikhar']),
'Age':pd.Series([26,27,25,24,31]),
'Score':pd.Series([87,89,67,55,47])}
#Create a DataFrame
df = pd.DataFrame(d)
print("Dataframe contents without sorting")
print (df)
df=df.sort_values(by='Score')
print("Dataframe contents after sorting")
print (df)
#In above example dictionary object is used to create
the dataframe.Elements of dataframe object df is s
orted by sort_value() method.As argument we are
passing value score for by parameter only.by default
it is sorting in ascending manner.
OUTPUT
Dataframe contents without sorting
Name Age Score
0 Sachin 26 87
1 Dhoni 27 89
2 Virat 25 67
3 Rohit 24 55
4 Shikhar 31 47
Dataframe contents after sorting
Name Age Score
4 Shikhar 31 47
3 Rohit 24 55
2 Virat 25 67
1 Dhoni 27 87
0 Sachin 26 89
Page 11
Sorting - dataframe
Visit : python.mykvs.in for regular updates
Sort the python pandas Dataframe by single column – Descending orderimport pandas as pd
import numpy as np
#Create a Dictionary of series
d = {'Name':pd.Series(['Sachin','Dhoni','Virat','Rohit','Shikhar']),
'Age':pd.Series([26,27,25,24,31]),
'Score':pd.Series([87,89,67,55,47])}
#Create a DataFrame
df = pd.DataFrame(d)
print("Dataframe contents without sorting")
print (df)
df=df.sort_values(by='Score',ascending=0)
print("Dataframe contents after sorting")
print (df)
#In above example dictionary object is used to create
the dataframe.Elements of dataframe object df is s
orted by sort_value() method.we are passing 0 for
Ascending parameter ,which sort the data in desce-
nding order of score.
OUTPUT
Dataframe contents without sorting
Name Age Score
0 Sachin 26 89
1 Dhoni 27 87
2 Virat 25 67
3 Rohit 24 55
4 Shikhar 31 47
Dataframe contents after sorting
Name Age Score
1 Dhoni 27 89
0 Sachin 26 87
2 Virat 25 67
3 Rohit 24 55
4 Shikhar 31 47
Page 12
Sorting - dataframe
Visit : python.mykvs.in for regular updates
Sort the pandas Dataframe by Multiple Columnsimport pandas as pd
import numpy as np
#Create a Dictionary of series
d = {'Name':pd.Series(['Sachin','Dhoni','Virat','Rohit','Shikhar']),
'Age':pd.Series([26,25,25,24,31]),
'Score':pd.Series([87,67,89,55,47])}
#Create a DataFrame
df = pd.DataFrame(d)
print("Dataframe contents without sorting")
print (df)df=df.sort_values(by=['Age', 'Score'],ascending=[True,False])
print("Dataframe contents after sorting")
print (df)
#In above example dictionary object is used to create
the dataframe.Elements of dataframe object df is s
orted by sort_value() method.we are passing two columns
as by parameter value and in ascending parameter also
with two parameters first true and second false,which
means sort in ascending order of age and descending
order of score
OUTPUT
Dataframe contents without sorting
Name Age Score
0 Sachin 26 87
1 Dhoni 25 67
2 Virat 25 89
3 Rohit 24 55
4 Shikhar 31 47
Dataframe contents after sorting
Name Age Score
3 Rohit 24 55
2 Virat 25 89
1 Dhoni 25 67
0 Sachin 26 87
4 Shikhar 31 47
Page 13
Sorting - dataframe
Visit : python.mykvs.in for regular updates
2. By index - Sorting over dataframe index sort_index() is
supported by sort_values() method. We will cover here three
aspects of sorting values of dataframe. We will cover here
two aspects of sorting index of dataframe.
• how to sort a pandas dataframe in python by index in
Ascending order
• how to sort a pandas dataframe in python by index in
Descending order
Page 14
Sorting - dataframe
Visit : python.mykvs.in for regular updates
sort the dataframe in python pandas by index in ascending order:import pandas as pd
import numpy as np
#Create a Dictionary of series
d = {'Name':pd.Series(['Sachin','Dhoni','Virat','Rohit','Shikhar']),
'Age':pd.Series([26,25,25,24,31]),
'Score':pd.Series([87,67,89,55,47])}
#Create a DataFrame
df = pd.DataFrame(d)
df=df.reindex([1,4,3,2,0])
print("Dataframe contents without sorting")
print (df)
df1=df.sort_index()
print("Dataframe contents after sorting")
print (df1)
#In above example dictionary object is used to create
the dataframe.Elements of dataframe object df is first
reindexed by reindex() method,index 1 is positioned at
0,4 at 1 and so on.then sorting by sort_index() method.
By default it is sorting in ascending order of index.
OUTPUT
Dataframe contents without sorting
Name Age Score
1 Dhoni 25 67
4 Shikhar 31 47
3 Rohit 24 55
2 Virat 25 89
0 Sachin 26 87
Dataframe contents after sorting
Name Age Score
0 Sachin 26 87
1 Dhoni 25 67
2 Virat 25 89
3 Rohit 24 55
4 Shikhar 31 47
index
Page 15
Sorting - dataframe
Visit : python.mykvs.in for regular updates
Sorting pandas dataframe by index in descending order:import pandas as pd
import numpy as np
#Create a Dictionary of series
d = {'Name':pd.Series(['Sachin','Dhoni','Virat','Rohit','Shikhar']),
'Age':pd.Series([26,25,25,24,31]),
'Score':pd.Series([87,67,89,55,47])}
#Create a DataFrame
df = pd.DataFrame(d)
df=df.reindex([1,4,3,2,0])
print("Dataframe contents without sorting")
print (df)
df1=df.sort_index(ascending=0)
print("Dataframe contents after sorting")
print (df1)
#In above example dictionary object is used to create
the dataframe.Elements of dataframe object df is first
reindexed by reindex() method,index 1 is positioned at
0,4 at 1 and so on.then sorting by sort_index() method.
Passing ascending=0 as argument for descending order.
OUTPUT
Dataframe contents without sorting
Name Age Score
1 Dhoni 25 67
4 Shikhar 31 47
3 Rohit 24 55
2 Virat 25 89
0 Sachin 26 87
Dataframe contents after sorting
Name Age Score
4 Shikhar 31 47
3 Rohit 24 55
2 Virat 25 89
1 Dhoni 25 67
0 Sachin 26 87
index
Page 16
Aggregation/Descriptive statistics - dataframe
Visit : python.mykvs.in for regular updates
Data aggregation –
Aggregation is the process of turning the values of a dataset (or a
subset of it) into one single value or data aggregation is a
multivalued function ,which require multiple values and return a
single value as a result.There are number of aggregations possible
like count,sum,min,max,median,quartile etc. These(count,sum etc.)
are descriptive statistics and other related operations on
DataFrame Let us make this clear! If we have a DataFrame like…
Name Age Score
0 Sachin 26 87
1 Dhoni 25 67
2 Virat 25 89
3 Rohit 24 55
4 Shikhar 31 47
…then a simple aggregation method is to calculate the summary of the
Score, which is 87+67+89+55+47= 345. Or a different aggregation method
would be to count the number of Name, which is 5.
Page 17
Aggregation/Descriptive statistics - dataframe
Visit : python.mykvs.in for regular updates
#e.g. program for data aggregation/descriptive statistics
import pandas as pd
import numpy as np
#Create a Dictionary of seriesd = {'Name':pd.Series(['Sachin','Dhoni','Virat','Rohit','Shikhar']),
'Age':pd.Series([26,25,25,24,31]),
'Score':pd.Series([87,67,89,55,47])}
#Create a DataFrame
df = pd.DataFrame(d)
print("Dataframe contents")
print (df)
print(df.count())
print("count age",df[['Age']].count())
print("sum of score",df[['Score']].sum())
print("minimum age",df[['Age']].min())
print("maximum score",df[['Score']].max())
print("mean age",df[['Age']].mean())
print("mode of age",df[['Age']].mode())
print("median of score",df[['Score']].median())
OUTPUTDataframe contents
Name Age Score
0 Sachin 26 87
1 Dhoni 25 67
2 Virat 25 89
3 Rohit 24 55
4 Shikhar 31 47
Name 5
Age 5
Score 5
dtype: int64
count age Age 5
dtype: int64
sum of score Score 345
dtype: int64
minimum age Age 24
dtype: int64
maximum score Score 89
dtype: int64
mean age Age 26.2
dtype: float64
mode of age Age
0 25
median of score Score 67.0
dtype: float64
Page 18
Aggregation/Descriptive statistics - dataframe
Visit : python.mykvs.in for regular updates
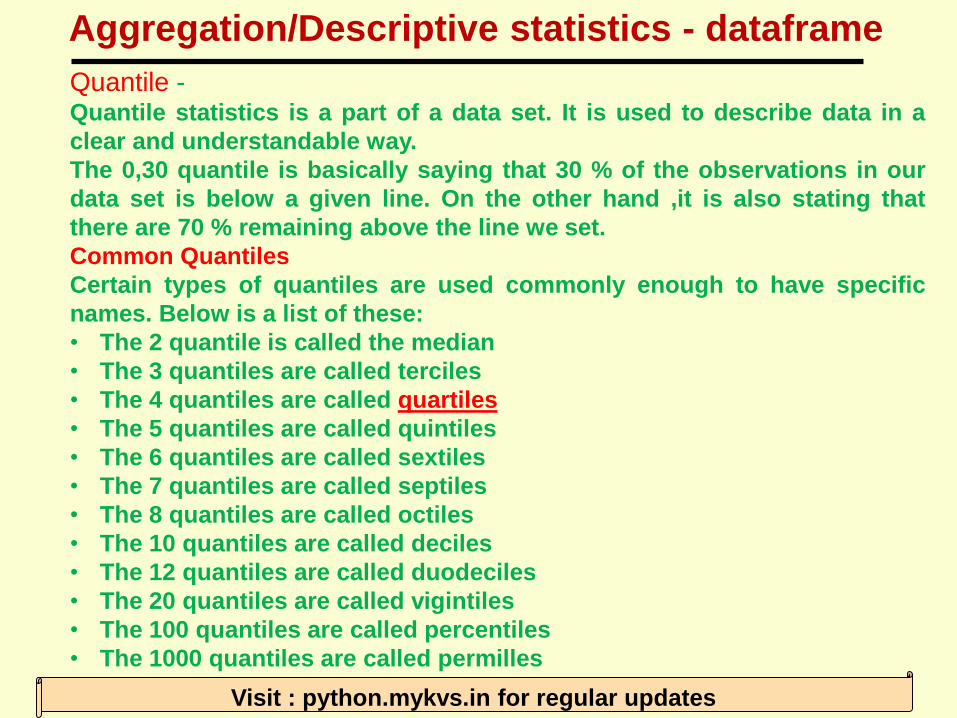
Quantile -Quantile statistics is a part of a data set. It is used to describe data in a
clear and understandable way.
The 0,30 quantile is basically saying that 30 % of the observations in our
data set is below a given line. On the other hand ,it is also stating that
there are 70 % remaining above the line we set.
Common Quantiles
Certain types of quantiles are used commonly enough to have specific
names. Below is a list of these:
• The 2 quantile is called the median
• The 3 quantiles are called terciles
• The 4 quantiles are called quartiles
• The 5 quantiles are called quintiles
• The 6 quantiles are called sextiles
• The 7 quantiles are called septiles
• The 8 quantiles are called octiles
• The 10 quantiles are called deciles
• The 12 quantiles are called duodeciles
• The 20 quantiles are called vigintiles
• The 100 quantiles are called percentiles
• The 1000 quantiles are called permilles
Page 19
Aggregation/Descriptive statistics - dataframe
Visit : python.mykvs.in for regular updates
#e.g. program on Quantile –import pandas as pd
import numpy as np
df = pd.DataFrame(np.array([[1, 1], [2, 10], [3, 100], [4, 1000]]),columns=['a', 'b'])
print(df)
print(df.quantile(0.5))
OUTPUT
a b
0 1 1
1 2 10
2 3 100
3 4 1000
a 2.5
b 55.0
Name: 0.5, dtype: float64
Page 20
Aggregation/Descriptive statistics - dataframe
Visit : python.mykvs.in for regular updates
var() – Variance Function in python pandas is used to calculate variance of a
given set of numbers, Variance of a data frame, Variance of column and
Variance of rows, let’s see an example of each.
#e.g.program
import pandas as pd
import numpy as np
#Create a Dictionary of series
d = {'Name':pd.Series(['Sachin','Dhoni','Virat','Rohit','Shikhar']),
'Age':pd.Series([26,25,25,24,31]),
'Score':pd.Series([87,67,89,55,47])}
#Create a DataFrame
df = pd.DataFrame(d)
print("Dataframe contents")
print (df)
print(df.var())
#df.loc[:,“Age"].var() for variance of specific column
#df.var(axis=0) column variance
#df.var(axis=1) row variance