40
Computer Science & Information Technology 59

Computer Science & Information Technology 59


Natarajan Meghanathan
Jan Zizka (Eds)
Computer Science & Information Technology
The Eighth International Conference on Networks & Communications
(NeCoM 2016)
Chennai, India, October 22~23, 2016
AIRCC Publishing Corporation

Volume Editors
Natarajan Meghanathan,
Jackson State University, USA
E-mail: [email protected]
Jan Zizka,
Mendel University in Brno, Czech Republic
E-mail: [email protected]
ISSN: 2231 - 5403
ISBN: 978-1-921987-57-1
DOI : 10.5121/csit.2016.61201 - 10.5121/csit.2016.61203
This work is subject to copyright. All rights are reserved, whether whole or part of the material is
concerned, specifically the rights of translation, reprinting, re-use of illustrations, recitation,
broadcasting, reproduction on microfilms or in any other way, and storage in data banks.
Duplication of this publication or parts thereof is permitted only under the provisions of the
International Copyright Law and permission for use must always be obtained from Academy &
Industry Research Collaboration Center. Violations are liable to prosecution under the
International Copyright Law.
Typesetting: Camera-ready by author, data conversion by NnN Net Solutions Private Ltd.,
Chennai, India

Preface
The Eighth International Conference on Networks & Communications (NeCoM 2016) was held
in Chennai, India, during October 22~23, 2016. The Second International Conference on
Computer Science, Information Technology (CSITEC 2016) was collocated with the NeCoM -
2016. The conferences attracted many local and international delegates, presenting a balanced
mixture of intellect from the East and from the West.
The goal of this conference series is to bring together researchers and practitioners from academia
and industry to focus on understanding computer science and information technology and to
establish new collaborations in these areas. Authors are invited to contribute to the conference by
submitting articles that illustrate research results, projects, survey work and industrial experiences
describing significant advances in all areas of computer science and information technology.
The NeCoM-2016, CSITEC-2016 Committees rigorously invited submissions for many months
from researchers, scientists, engineers, students and practitioners related to the relevant themes
and tracks of the workshop. This effort guaranteed submissions from an unparalleled number of
internationally recognized top-level researchers. All the submissions underwent a strenuous peer
review process which comprised expert reviewers. These reviewers were selected from a talented
pool of Technical Committee members and external reviewers on the basis of their expertise. The
papers were then reviewed based on their contributions, technical content, originality and clarity.
The entire process, which includes the submission, review and acceptance processes, was done
electronically. All these efforts undertaken by the Organizing and Technical Committees led to an
exciting, rich and a high quality technical conference program, which featured high-impact
presentations for all attendees to enjoy, appreciate and expand their expertise in the latest
developments in computer network and communications research.
In closing, NeCoM-2016, CSITEC-2016 brought together researchers, scientists, engineers,
students and practitioners to exchange and share their experiences, new ideas and research results
in all aspects of the main workshop themes and tracks, and to discuss the practical challenges
encountered and the solutions adopted. The book is organized as a collection of papers from the
NeCoM-2016, CSITEC-2016.
We would like to thank the General and Program Chairs, organization staff, the members of the
Technical Program Committees and external reviewers for their excellent and tireless work. We
sincerely wish that all attendees benefited scientifically from the conference and wish them every
success in their research. It is the humble wish of the conference organizers that the professional
dialogue among the researchers, scientists, engineers, students and educators continues beyond
the event and that the friendships and collaborations forged will linger and prosper for many
years to come.
Natarajan Meghanathan
Jan Zizka

Organization
General Chair
Natarajan Meghanathan Jackson State University, USA Dhinaharan Nagamalai Wireilla Net Solutions, Australia
Program Committee Members
Abd El-Aziz Ahmed Cairo University, Egypt
Aloizio Aeronautic Institute of Technology, Brasil
Ankit Chaudhary Truman State University, USA
Apai Universiti Malaysia Perlis, Malaysia
Asmaa Shaker Ashoor Babylon University, Iraq
Asoke Nath St. xavier's College, India
Brajesh Kumar Kaushik Indian Institute of Technology, India
Dinesh C Jain Sagar Institute of Research & Technology, India
Diptoneel Kayal West Bengal University of Technology, India
Doina Bein The Pennsylvania State University, USA
Emilio Jiménez Macías University of La Rioja, Spain
Erritali Mohammed Sultan Moulay Slimane University, Morocco
Faiyaz Ahmad Integral University, India
Fatih Korkmaz Çankiri Karatekin University, Turkey
Fernando Bobillo University of Zaragoza, Spain
Gelenbe Imperial College, UK
Goreti Marreiros Polytechnic of Porto, Portugal
Grzegorz Pastuszak Warsaw University of Technology, Poland
Hossein Jadidoleslamy University of Zabol, Zabol, Iran
Houcine Hassan Univeridad Politecnica de Valencia, Spain
Isa Maleki Islamic Azad University, Iran
Islam Atef Alexandria University, Egypt
Jae Kwang Lee Hannam University, South Korea
Jaime Galán Jiménez University of Extremadura, Spain
Jan Lindstrom MariaDB Corporation, Finland
Jayakumar C RMK Engineering College, India
Jayan V CDAC Trivandrum, India
Juan A. Fraire Universidad Nacional de Córdoba, Argentina
Julie M. David MES College, India
Kannan Saravanan VIT University, India
Kayhan Erciyes Izmir University, Turkey
Kishorjit Nongmeikapam Manipur University, India
Lokeswara Reddy V K.S.R.M College of Engineering, India
Lorena González Manzano University Carlos III of Madrid, Spain
Mahdi Mazinani IAU Shahreqods, Iran
Majharoddin Mumtajmiyan Kazi MGM JNEC Campus, India
Manu Sood Himachal Pradesh University, India
Maragathavalli P Pondicherry Engineering College, India

Mastaneh Mokayef UCSI University, Malaysia
Mehrdad Jalali Mashhad Azad University, Iran
Milad Azarbad University of Shahid Beheshti, Iran
Mohammad Zunnun Khan Integral University, India
Mohammed Ghanbari University of Essex, United Kingdom
Moses Ekpenyong University of Edinburgh, Nigeria
Nabila Labraoui University of Tlemcen, Algeria
Nadia Qadri University of Essex, United Kingdom
Naresh Sharma SRM University, India
Nazmus Saquib University of Manitoba, Canada
Neda Darvish Islamic Azad University, Iran
Nishant Doshi Marwadi Education Foundation, India
Ognjen Kuljaca Brodarski Institute, Croatia
Othmanibrahim Universiti Teknologi Malaysia, Malaysia
Pierluigi Siano University of Salerno, Italy
Poonam Tanwar Lingaya`s University, India
Prabukumar VIT University, India
Rafah M. Almuttairi University of Babylon, Iraq
Rajdeep Chowdhury JIS College of Engineering, India
Rajmohan R IFET College of Engineering, India
Revathi V Adhiyamaan College of Engineering, India
Ritambhra Korpal University of Pune, India
Saad M.Darwish Alexandria University, Egypt
Samarendra Nath Sur Sikkim Manipal Institute of Technology, India
Sergio Pastrana University Carlos III of Madrid, Spain
Seyyed AmirReza Abedini Islamic Azad University, Iran
Shanmugavadivu Pichai Gandhigram Rural Institute, India
Thillaikarasi Annamalai University, India
Vijay H. Mankar Govt. Polytechnic, India
Vijay Kumar Dwivedi GLA University, India
Viliam Malcher Comenius University, Europe
Wajeb Gharibi Jazan University, Saudi Arabia
Xonlink Inc Concordia University, Canada
Yacine Rebahi Fraunhofer Fokus, Germany
Yahya M. H. AL-Mayali University of Kufa, Iraq
Zoltan Mann Budapest University of Technology, Hungary

Technically Sponsored by
Networks & Communications Community (NCC)
Computer Science & Information Technology Community (CSITC)
Digital Signal & Image Processing Community (DSIPC)
Organized By
Academy & Industry Research Collaboration Center (AIRCC)

TABLE OF CONTENTS
The Eighth International Conference on Networks & Communications
(NeCoM 2016)
Parallel Sequence Spread Spectrum System Simulation with RAPP Model….. 01 - 07
Karthik KrishneGowda, Abdul Rehman Javed, Andreas C. Wolf and
Rolf Kraemer
Correlation of Eigenvector Centrality to Other Centrality Measures :
Random, Small-World and Real-World Networks….................................…….. 09 - 18
Xiaojia He and Natarajan Meghanathan
The Second International Conference on Computer Science,
Information Technology (CSITEC 2016)
A Floating Point Division Unit Based on Taylor-Series Expansion Algorithm
and Iterative Logarithmic Multiplier…...……………………………………….. 19 - 30
Riyansh K. Karani, Akash K. Rana, Dhruv H. Reshamwala and Kishore Saldanha
Natarajan Meghanathan et al. (Eds) : NeCoM, CSITEC - 2016
pp. 01– 07, 2016. © CS & IT-CSCP 2016 DOI : 10.5121/csit.2016.61201
PARALLEL SEQUENCE SPREAD
SPECTRUM SYSTEM SIMULATION WITH
RAPP MODEL
Karthik KrishneGowda1, Abdul Rehman Javed
2, Andreas C. Wolf
3 and
Rolf Kraemer4
1Brandenburg University of Technology, Cottbus, Germany
[email protected] 2Heinz Nixdorf Institut, Universität Paderborn, Paderborn Germany
[email protected] 3Dr. Wolf Wireless GmbH, Teltow, Germany
[email protected] 4IHP Microelectronics, Frankfurt (Oder), Germany
ABSTRACT
In Terahertz frequency band there is an abundant of bandwidth available to achieve ultra-high-
speed wireless communication to achieve data rates of 100 Gbps. We choose Parallel Sequence
Spread Spectrum (PSSS) as an analog friendly modulation and coding scheme that allows for
an efficient mixed-signal implementation of a 100 Gbps wireless baseband. Rapp Model is a
‘behavioural amplifier model’ which characterize the AM/AM conversion of a solid-state high
power amplifier. In this paper, a PSSS modulated signal is transmitted through a “Rapp
Model”, then through an AWGN channel and finally a PSSS demodulator which recovers the
signal and performs BER calculations. We have to investigate as on how much non-linearity
induced by PA can PSSS modulated system tolerate and still be able to recover the transmitted
data at the receiver.
KEYWORDS
PSSS, Rapp Model, 100 Gbps, PA, wireless, Terahertz
1. INTRODUCTION
Wireless systems are a big driver of new and challenging research directions. The IEEE
P802.15.3d TG3d [1] defines an application for wireless point-to-point (P2P) physical layer
operating data rates up to 100 Gbps. The emerging wireless P2P applications are data centers,
wireless backhaul/fronthaul services, intra-device communication, and close proximity P2P
application [1].
In a decade 2020-2030, projected Wireless LAN (local area network) data rates is set to increase
by 100x [2]. As in the Figure 1, the data rate requirement for WLAN in 2025 is about 1 Tb/s.

2 Computer Science & Information Technology (CS & IT)
Thus, there is a need to move for the higher end of spectrum where we have more available
bandwidth.
Figure 1 : The Wireless Roadmap: Race for Data Rate [2]
Parallel sequence Spread Spectrum (PSSS) initially published by Wolf [3, 10, 11], has promising
features with lower complexity and higher throughput. We employ a novel mixed-mode design
where baseband signal processing can be done mostly in analog domain and partly in digital
domain, which helps reducing the power consumption [4, 5]. In the 240 GHz frequency band
there is about 55 GHz of contiguous bandwidth available, such that with a spectral efficiency of
2-3 bit/s/Hz we can achieve >100 Gb/s.
RF power amplifiers (PA) are important elements in transmitter used in wireless communication.
PA saturates beyond a threshold of power which results in clipping of signals and thus causing
non-linear distortion. A general method to compensate for clipping effects is to reduce the input
drive level so that operating point falls in the linear region of the PA [6, 7]. However, by
operating PA with high back-off reduces the energy efficiency of the transmitter. Thus, there is a
tradeoff between PA’s efficiency and linearity. In this paper, we model the power amplifier
characteristics using Rapp Model [8].
2. PSSS BASEBAND
Our research in mixed-signal processing for ultra-broadband transceivers is based on the
assumption that a partitioning of digital-/ analog- signal processing in the baseband with more
focus on analog processing has the potential to outperform purely digital baseband processors in
terms of power dissipation, complexity, and cost. We chose PSSS as an analog-friendly
modulation and coding scheme. Figure 2 shows the basic concept of a PSSS transmitter and
receiver and allows explaining the advantages of a mixed-signal PSSS baseband implementation.

Computer Science & Information Technology (CS & IT) 3
Figure 2: Mixed-Signal PSSS transceiver concept [10]
In the PSSS transmitter N parallel symbols D1 to DN are encoded with N orthogonal codes and
summed up to a single quantized PAM-signal. These signals are up-converted to RF transmit-ted
over the radio channel, and down-converted to baseband. The receiver cross-correlates the PSSS
baseband signal with the N PSSS codes and recovers the symbols D1 to DN. The com-plete
spreading-/coding-process in the transmitter and despreading-/decoding-process in the receiver
can be implemented very efficiently in analog domain using fast analog circuitry, such as analog
multipliers, adders, and integrators. In the mixed-signal PSSS baseband from Figure 2 N parallel
DACs and ADCs are utilized operating at a sampling frequency equal to symbol rate. On the
contrary, in a fully digital PSSS transceiver the DAC and the ADC would have to process the
encoded PSSS signal, i.e. to operate with a sampling frequency of at least 2x the PSSS signal
bandwidth.
A further advantage of a mixed-signal PSSS transceiver is that adaptive equalization of the
received signal can be implemented in the despreading/decoding process [10] as a cross-
correlation-based equalization. Decoding the received signal with a replica of a distorted PSSS
code we obtain a perfect correlation result, effectively compensating the non-ideal channel
impulse response.
3. RAPP MODEL
A widely accepted solid state power amplifier model encompassing the amplitude clipping (i.e.,
AM-AM distortion) is the Rapp Model [8]. Rapp Model is designed according to the Equation (1)
and it produces a smooth transition for the envelope characteristic as the input amplitude
approaches saturation. Amplitude distortion (AM/AM) and Phase distortion (AM/PM) conversion
are given according to Equation (1)
(1)

4 Computer Science & Information Technology (CS & IT)
wherein Asat is the saturation output amplitude, Ain is the input amplitude, Aout is the output
amplitude, and p controls the smoothness of the transition from a linear region to a saturation
region.
Figure 3: Rapp Model
Figure 3 shows the Rapp model of the PA recommended in IEEE 802.11 [9], envelope of the
input signal is measured using “Amplitude of Envelope” which is then passed on to “RAPP
AM/AM Distortion” wherein input amplitude is clipped off according when it reaches saturation
point and the phase of the input signal is unaltered.
Figure 4: AM/AM response of Power Amplifier
Figure 4 shows the AM/AM response of the Rapp model as described in equation (1). It is clear
from the graph, as we increase the linear gain of the transmit amplifier will leads to reduction in
clipping of the input signal. For e.g., a 10 dB linear gain TX amplifier does not clip off the input
amplitudes between -5 dBm and +5 dBm and it clips off of any inputs amplitude which does not
fall in these range.

Computer Science & Information Technology (CS & IT) 5
4. SIMULATION SETUP
The PSSS system level model which includes the PSSS transmitter, PSSS receiver,
synchronisation, and channel equalizations is described in our paper [4]. Figure 5 shows
simulation model used in the experiments. The data bits are modulated by PSSS modulator and
followed by a “Rapp Model” which introduces clipping in amplitude caused due to non-linear
PA. Then, data is passed through an AWGN channel and finally demodulated by PSSS
demodulator which evaluates for BER.
Figure 5: System Simulation Model
The signal processing of the transmitter-model (as in Figure 2) generates parallel streams of data
that are encoded using m-sequences of length of 15 (PN sequences). The parallel streams were
summed up subsequently to obtain a ‘multi-level PSSS signal’. In Figure 6, the x-axis represents
the different discrete amplitude values at the output of “PSSS Modulator” (as in Figure 5) and Y-
axis shows of the number of occurrence of these amplitudes for all input combinations of data
bits. From the distribution it becomes obvious that most information (90%) in the encoded signal
is present in the lower amplitudes of ‘multi-level PSSS Signal’ and the encoded information
content goes down (10%) as we move to higher amplitudes ‘multi-level PSSS Signal’. We have
to investigate how much clipping we can perform (i.e. how much non-linearity induced by PA
can PSSS modulated system can tolerate) on this ‘multi-level PSSS Signal’ and still be able to
recover the transmitted data at the receiver.
Figure 6: Bar graph depicting different levels amplitudes and their occurrence frequency
6 Computer Science & Information Technology (CS & IT)
4. RESULTS
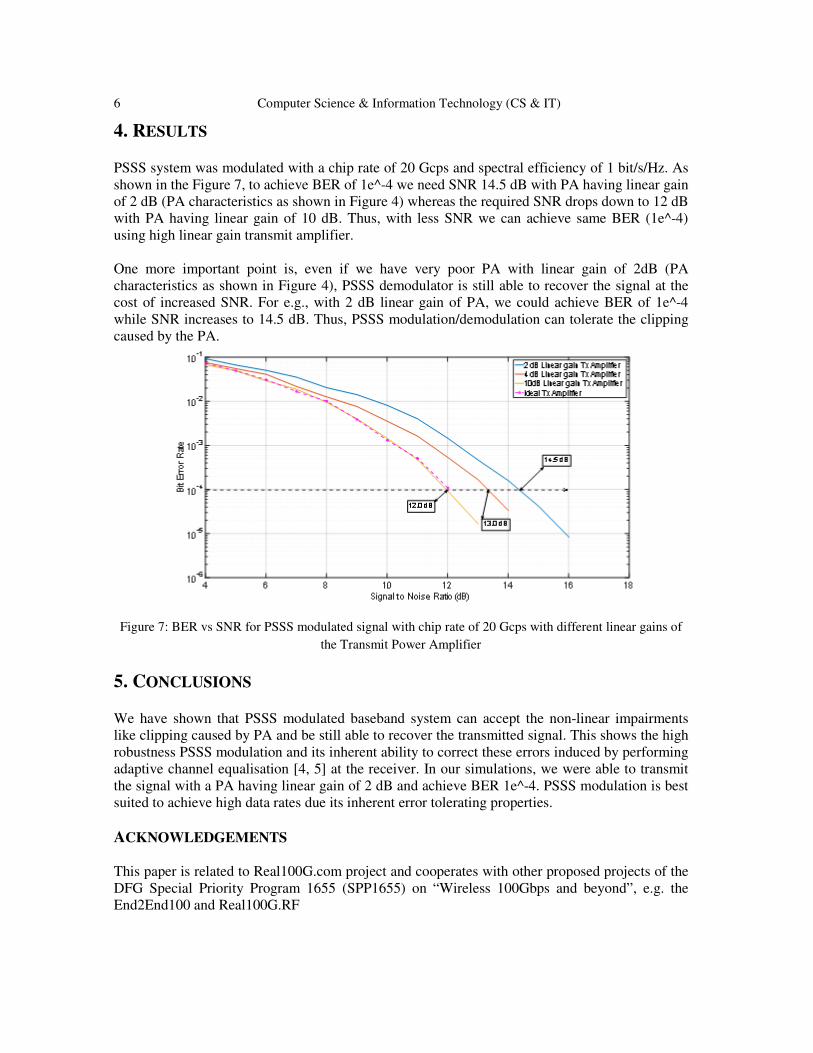
PSSS system was modulated with a chip rate of 20 Gcps and spectral efficiency of 1 bit/s/Hz. As
shown in the Figure 7, to achieve BER of 1e^-4 we need SNR 14.5 dB with PA having linear gain
of 2 dB (PA characteristics as shown in Figure 4) whereas the required SNR drops down to 12 dB
with PA having linear gain of 10 dB. Thus, with less SNR we can achieve same BER (1e^-4)
using high linear gain transmit amplifier.
One more important point is, even if we have very poor PA with linear gain of 2dB (PA
characteristics as shown in Figure 4), PSSS demodulator is still able to recover the signal at the
cost of increased SNR. For e.g., with 2 dB linear gain of PA, we could achieve BER of 1e^-4
while SNR increases to 14.5 dB. Thus, PSSS modulation/demodulation can tolerate the clipping
caused by the PA.
Figure 7: BER vs SNR for PSSS modulated signal with chip rate of 20 Gcps with different linear gains of
the Transmit Power Amplifier
5. CONCLUSIONS
We have shown that PSSS modulated baseband system can accept the non-linear impairments
like clipping caused by PA and be still able to recover the transmitted signal. This shows the high
robustness PSSS modulation and its inherent ability to correct these errors induced by performing
adaptive channel equalisation [4, 5] at the receiver. In our simulations, we were able to transmit
the signal with a PA having linear gain of 2 dB and achieve BER 1e^-4. PSSS modulation is best
suited to achieve high data rates due its inherent error tolerating properties.
ACKNOWLEDGEMENTS
This paper is related to Real100G.com project and cooperates with other proposed projects of the
DFG Special Priority Program 1655 (SPP1655) on “Wireless 100Gbps and beyond”, e.g. the
End2End100 and Real100G.RF

Computer Science & Information Technology (CS & IT) 7
REFERENCES
[1] IEEE P802.15.3d TG3d (100G), “IEEE 802.15 Documents.” [Online]. Available:
https://mentor.ieee.org/802.15/documents
[2] Fettweis, Gerhard P. "The tactile internet: applications and challenges." IEEE Vehicular Technology
Magazine 9.1 (2014): 64-70.
[3] Wolf, A.: ‘PSSS Patents EP04701288.5-1515/1584151, DE 10 2004 033 581, US 20060256850’.
[4] KrishneGowda, K.; Kraemer, R.; Wolf, A.; Scheytt, J.C.; Kallfass, I., "Wireless 100 Gb/s: PHY layer
overview and challenges in the THz frequency band," Wireless and Microwave Technology
Conference (WAMICON), 2014 IEEE 15th Annual , vol., no., pp.1,4, 6-6 June 2014 doi:
10.1109/WAMICON.2014.6857743
[5] Javed, Abdul Rehman; Scheytt, J.Christoph; KrishneGowda, Karthik; Kraemer, Rolf, "System design
considerations for a PSSS transceiver for 100Gbps wireless communication with emphasis on mixed
signal implementation," Wireless and Microwave Technology Conference (WAMICON), 2015 IEEE
16th Annual , vol., no., pp.1,4, 13-15 April 2015
[6] M. Shabany and P. G. Gulak, “Efficient Compensation of the Nonlinearity of Solid-State Power
Amplifiers Using Adaptive Sequential Monte Carlo Methods”, IEEE Trans. Circuits Syst., I: Reg.
Papers, vol. 55, no. 10, pp. 3270-3283, Nov. 2008
[7] Z. Hasan, H. Boostanimehr, and V. K. Bhargava, “Green cellular networks:A survey, some research
issues and challenges,” IEEE Commun.Surveys & Tuts., vol. 13, no. 4, pp. 524-540, Fourth Quarter,
2011
[8] C. Rapp, “Effects of HPA-nonlinearity on a 4-DPSK/OFDM signal for a digital sound broadcasting
system,” Proc. 2nd European Conf. Satellite Communications, pp. 179-184, Oct. 1991.
[9] Webster, Mark. "Suggested PA Model For 802.11 Hrb". N.p., 2000. [Online] Accessed 25 Aug. 2016
http://goo.gl/ckrDL0
[10] A. C. Wolf and C. Scheytt, “15 Gbps communication over an USB3.0 cable and even more,” in
Systems, Signals and Devices (SSD), 2012 9th International Multi-Conference on, 2012, pp. 1–3.
[11] A. Wolf, R. Kraemer, and J. C. Scheytt, “Ultra high speed wireless communication with low
complexity transceiver,” in Signals, Systems, and Electronics (ISSSE), 2012 International
Symposium on, 2012, pp. 1–6.

8 Computer Science & Information Technology (CS & IT)
INTENTIONAL BLANK

Natarajan Meghanathan et al. (Eds) : NeCoM, CSITEC - 2016
pp. 09–18, 2016. © CS & IT-CSCP 2016 DOI : 10.5121/csit.2016.61202
CORRELATION OF EIGENVECTOR
CENTRALITY TO OTHER CENTRALITY
MEASURES: RANDOM, SMALL-WORLD
AND REAL-WORLD NETWORKS
Xiaojia He1 and Natarajan Meghanathan
2
1University of Georgia, GA, USA,
2Jackson State University, MS, USA
ABSTRACT
In this paper, we thoroughly investigate correlations of eigenvector centrality to five centrality
measures, including degree centrality, betweenness centrality, clustering coefficient centrality,
closeness centrality, and farness centrality, of various types of network (random network, small-
world network, and real-world network). For each network, we compute those six centrality
measures, from which the correlation coefficient is determined. Our analysis suggests that the
degree centrality and the eigenvector centrality are highly correlated, regardless of the type of
network. Furthermore, the eigenvector centrality also highly correlates to betweenness on
random and real-world networks. However, it is inconsistent on small-world network, probably
owing to its power-law distribution. Finally, it is also revealed that eigenvector centrality is
distinct from clustering coefficient centrality, closeness centrality and farness centrality in all
tested occasions. The findings in this paper could lead us to further correlation analysis on
multiple centrality measures in the near future.
KEYWORDS
Eigenvector Centrality, Correlation Coefficient, Random Network, Small-world Network, Real-
world Network
1. INTRODUCTION
Over the past few decades, eigenvector, proposed by Bonacich in 1972 [1-2] is regarded as one of
the most popular centrality measures. The general assumption of eigenvector centrality (EVC) is
that each node's centrality in a graph is the sum of the centrality values of its neighbors [3]. It
considers not only its own degree, but also the degree of the nodes that it is connected to. The
nodes are eventually drawn with a radius, also referred as spectral radius [13], proportional to
their centrality. Owing to the fact that it is superior to degree centrality intrinsically, EVC has
been widely applied to the analysis of social network relations [4-6].

10 Computer Science & Information Technology (CS & IT)
One often asked question raises along with the application of EVC: how is the EVC correlated to
other centrality measures? It is critical to unveil the underlying relationship between EVC and
other measures [7]. With this effort, we could reduce the potential redundancy in analyzing
network relations with multiple similar centrality measures. It is also interesting to see the
importance of EVC if it is highly unrelated to other measures. Recent literature has shown a high
correlation between EVC and degree centrality with an average correlation of 0.92 on 58
networks [7]. The correlation between EVC and maximum clique size has also been examined
[8]. Some others have also investigated on eigenvector centrality and it continues to be analyzed
and developed [9-10]. However, there is still lack of thorough comparison of EVC to other
measures on multiple types of networks.
The first part of this paper briefly illustrates how eigenvector centrality is calculated. The second
part shows the results with specific comparison between EVC and other centrality measures in
random network, small-world network, and multiple real-world networks.
2. EIGENVECTOR CENTRALITY CALCULATION
Adjacency matrix is used to solve the problem of eigenvector centrality measure. On the basis of
the work done by Bonacich (1972) [1-2], the centrality of node i follows the form below:
∑=
=
n
j
jiji cRc1
λ
where R is an adjacency matrix, and λ is a constant to make the equation with a nonzero solution.
The centrality ci of a node i is thus expressed as positive multiple of the sum of adjacent
centralities. In matrix notation, we then have: Rcc =λ , where c is an eigenvector of R, and λ is
its associated eigenvalue. The solution to above equations is already well-known and shown in
Figure 1.
Figure 1. Illustration of the Computation of Eigenvector Centrality (EVC): Nodes 3 and 4 have the Highest
EVC Value
Computer Science & Information Technology (CS & IT) 11
3. ANALYSIS OF CORRELATION BETWEEN EVC AND OTHER
MEASURES
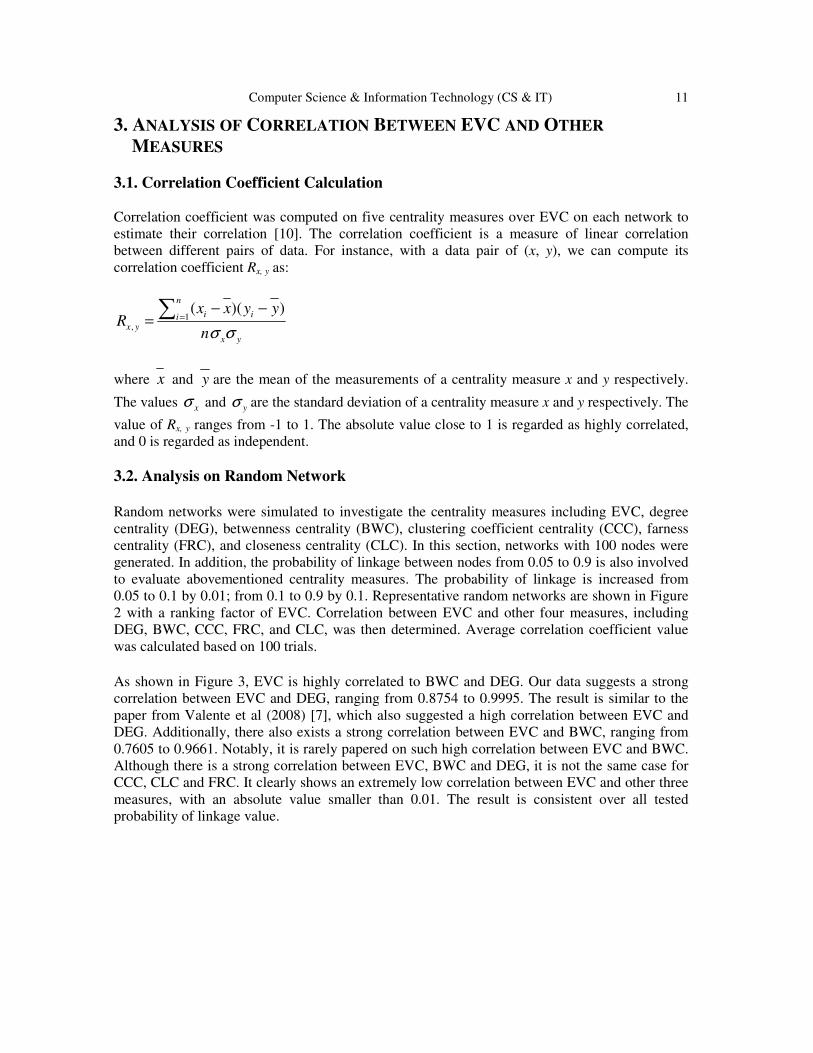
3.1. Correlation Coefficient Calculation
Correlation coefficient was computed on five centrality measures over EVC on each network to
estimate their correlation [10]. The correlation coefficient is a measure of linear correlation
between different pairs of data. For instance, with a data pair of (x, y), we can compute its
correlation coefficient Rx, y as:
yx
n
i ii
yxn
yyxxR
σσ
∑ =−−
= 1,
))((
where x and y are the mean of the measurements of a centrality measure x and y respectively.
The values xσ and yσ are the standard deviation of a centrality measure x and y respectively. The
value of Rx, y ranges from -1 to 1. The absolute value close to 1 is regarded as highly correlated,
and 0 is regarded as independent.
3.2. Analysis on Random Network
Random networks were simulated to investigate the centrality measures including EVC, degree
centrality (DEG), betwenness centrality (BWC), clustering coefficient centrality (CCC), farness
centrality (FRC), and closeness centrality (CLC). In this section, networks with 100 nodes were
generated. In addition, the probability of linkage between nodes from 0.05 to 0.9 is also involved
to evaluate abovementioned centrality measures. The probability of linkage is increased from
0.05 to 0.1 by 0.01; from 0.1 to 0.9 by 0.1. Representative random networks are shown in Figure
2 with a ranking factor of EVC. Correlation between EVC and other four measures, including
DEG, BWC, CCC, FRC, and CLC, was then determined. Average correlation coefficient value
was calculated based on 100 trials.
As shown in Figure 3, EVC is highly correlated to BWC and DEG. Our data suggests a strong
correlation between EVC and DEG, ranging from 0.8754 to 0.9995. The result is similar to the
paper from Valente et al (2008) [7], which also suggested a high correlation between EVC and
DEG. Additionally, there also exists a strong correlation between EVC and BWC, ranging from
0.7605 to 0.9661. Notably, it is rarely papered on such high correlation between EVC and BWC.
Although there is a strong correlation between EVC, BWC and DEG, it is not the same case for
CCC, CLC and FRC. It clearly shows an extremely low correlation between EVC and other three
measures, with an absolute value smaller than 0.01. The result is consistent over all tested
probability of linkage value.

12 Computer Science & Information Technology (CS & IT)
Figure 2. Simulation of Random Networks with Varying Probability of Linkage: Ranking is based on
Eigenvector Centrality
Figure 3. Correlation Coefficient between EVC and other Four Measures, including DEG, BWC, CCC,
FRC, and CLC, on Random Networks with various Probability of Linkage

Computer Science & Information Technology (CS & IT) 13
Figure 4. Simulation of Small-World Networks with various Probability of Rewiring. Ranking Factor is
Eigenvector Centrality
3.3. Analysis on Small-World Network
Moreover, we also investigated on small-world networks evolved from regular network. Similar
to random network simulation, 100 nodes with a k-regular value (initial number of links per node)
of 10 are set for small-world network simulation. In this section, the probability of rewiring was
from 0.01 to 0.09 with increment of 0.01; and from 0.1 to 0.9 with increment of 0.1.
Representative random networks are shown in Figure 4 with a ranking factor of EVC. Correlation
between EVC and other four measures, including DEG, BWC, CCC, FRC, and CLC, was then
determined. Average correlation coefficient value was calculated based on 100 trials.
On small-world networks, there still presents a strong correlation between DEG and EVC. The
correlation coefficient was larger than 0.71 when the probability of rewiring reaches 0.1. On our
previous paper, a transformation between small-world network and random network was revealed
[11]. It was found that simulated network from a regular network would be small-world network
when the probability of rewiring is from 0.01 to 0.1; however, it changes to random network
when the probability of rewiring is between 0.1 and 1.0 [13]. On the basis of this fact, the high

14 Computer Science & Information Technology (CS & IT)
correlation between DEG and EVC with a probability of rewiring value of 0.1 to 0.9 in Figure 5
can be explained and is in agreement with Figure 3. However, the correlation between EVC and
BWC is not consistent on small-world network. Overall, it is relatively low in terms of correlation
between EVC and BWC with a value less than 0.1 when probability of rewiring reaches 0.5. It is
noted that there is a clear consistency on the low correlation between EVC and other three
measures, including CCC, CLC and FRC, which is similar to random network.
Figure 5. Correlation Coefficient between EVC and other Four Measures, including DEG, BWC, CCC,
FRC, and CLC, on Small-World Networks with various Probability of Rewiring
3.4. Analysis on Real-World Network
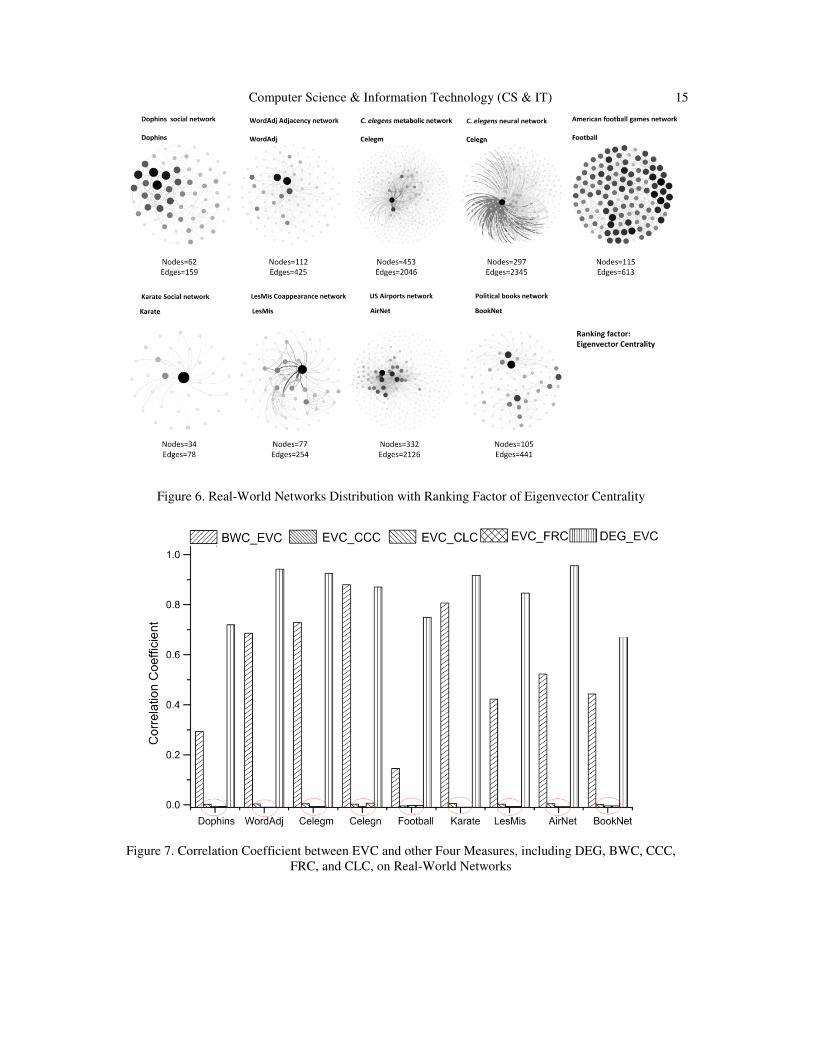
Finally, multiple real-world networks are involved in our analysis for further investigation.
Analysis on real-world networks is crucial to understanding how EVC relates to other measures
in real world. Here we selected nine real-world networks (see Figure 6), including dolphins social
network (Dolphins) [14], WordAdj Adjacency network of common adjectives and nouns in the
novel David Copperfield by Charles Dickens (WordAdj) [15], Celegensmetabolic Network
representing the metabolic network of C. elegans (Celegm), Celegensneural Network representing
the neural network of C. elegans (Celegn) [16], American football games network between
Division IA colleges during regular season Fall 2000 (Football) [17], Karate Social network of
friendships between 34 members of a karate club at a US university in the 1970 (Karate) [18],
LesMis Coappearance network of characters in the novel Les Miserables (LesMis) [19], US
Airports network (AirNet) [20], and political books network (BookNet) [21]. Average correlation
between EVC and other four measures, including DEG, BWC, CCC, FRC, and CLC, was
determined on 100 trials.
Computer Science & Information Technology (CS & IT) 15
Figure 6. Real-World Networks Distribution with Ranking Factor of Eigenvector Centrality
Figure 7. Correlation Coefficient between EVC and other Four Measures, including DEG, BWC, CCC,
FRC, and CLC, on Real-World Networks
16 Computer Science & Information Technology (CS & IT)
Similar to random and small-world network, the correlation of EVC to CCC, CLC, and FRC is
close to zero. This result supports our previous statement that EVC is independent from CCC,
CLC and FRC on any tested network. It is noticed that EVC is highly correlated to DEG with a
correlation coefficient over 0.66. In particular, the correlation coefficient is over 0.91 on four
real-world networks out of nine, including WordAdj, Celegm, Karate, and AirNet; it is over 0.71
on eight real-world networks out of nine. Furthermore, similar to small-world network, the
correlation between EVC and BWC is not consistent on all real-world networks. Data shows a
high correlation on Celegm, Celegn, and Karate networks with a value over 0.72; however it also
presents a low correlation on Dophins and Football networks with a value less than 0.3.
Intriguingly, we find that the ones with low correlation coefficient are not directed (Dophins and
Football); however, all directed networks shows a high correlation between EVC and BWC. This
suggestion is also supported by Valente et al (2008) [7].
3.5. Overall Discussion
Our data suggest that EVC is highly correlated to DEG, probably owing to the fact that both
measures are symmetric. We also find relatively strong but varied correlation between EVC and
BWC on random network and real-world networks. The high correlation between EVC and DEG
revealed on all tested networks would suggest redundancy over EVC to DEG. In addition, there
could also be a redundancy over EVC to BWC on undirected networks. However, the inconsistent
result of the correlation between EVC and BWC on small-world network could be due to its
intrinsic power-law distribution [12], differ from those of the regular and random networks [10].
It is also found that the BWC follows a power-law distribution [10]. Thus, the inconsistency
could be well explained. Lastly, the analysis on the correlation of EVC to CCC, CLC and FRC
indicates that they are distinct to EVC.
4. CONCLUSIONS
In this paper, in order to investigate correlations of EVC to other five measures, we applied
correlation coefficient analysis on various types of networks, including random network, small-
world network, as well as multiple real-world networks. We found that EVC was strongly
correlated with DEG, and the correlation was robust in the sense that the extent of correlation was
little affected by the types of the network, particularly directed network. The finding on the
correlation between EVC and BWC suggests they are independent on a network with power-law
distribution. With all tested networks, EVC is independent from CCC, CLC and FRC. This
finding has not been papered so far and could be helpful in understanding different characteristics
of networks. All findings in this paper can be used to guide our future research on correlation
analysis among centrality measures on various networks.
REFERENCES [1] P. Bonacich, "Technique for Analyzing Overlapping Memberships," Sociological Methodology, vol.
4, pp. 176-185, 1972.
[2] P. Bonacich, "Factoring and Weighting Approaches to Status Scores and Clique Identification,"
Journal of Mathematical Sociology, vol. 2, no. 1, pp. 113-120, 1972.
[3] P. Bonacich, "Some Unique Properties of Eigenvector Centrality," Social Networks, vol. 29, no. 4,
pp. 555-564, 2007.

Computer Science & Information Technology (CS & IT) 17
[4] B. Ruhnau, "Eigenvector Centrality: A Node Centrality?," Social Networks, vol. 22, no. 4, pp. 357-
365, October 2000.
[5] P. Bonacich, and P. Lloyd, "Eigenvector-like Measures of Centrality for Asymmetric Relations,"
Social Networks, vol. 23, no. 3, pp. 191-201, 2001.
[6] N. Meghanathan, "Correlation Coefficient Analysis: Centrality vs. Maximal Clique Size for Complex
Real-World Network Graphs," International Journal of Network Science, vol. 1, no. 1, pp. 3-27, 2016.
[7] T. W. Valente, K. Coronges, C. Lakon and E. Costenbader, "How Correlated are Network Centrality
Measures?," Connect (Tor), vol. 28, no. 1, pp. 16-26, January 2008.
[8] N. Meghanathan, "Correlation Analysis between Maximal Clique Size and Centrality Metrics for
Random Networks and Scale-Free Networks," Computer and Information Science, vol. 9, no. 2, pp.
41-57, May 2016.
[9] J. M. Pappas and B. Wooldridge, "Middle Managers' Divergent Strategic Activity: An Investigation
of Multiple Measures of Network Centrality," Journal of Management Studies, vol. 44, no. 3, pp. 323-
341, May 2007.
[10] C.-Y. Lee, "Correlations among Centrality Measures for Complex Networks," arXiv:physics/
0605220 [physics.soc-ph], pp. 1-18, May 2006.
[11] N. Meghanathan, "Exploiting the Discriminating Power of the Eigenvector Centrality Measure to
Detect Graph Isomorphism," International Journal in Foundations of Computer Science and
Technology, vol. 5, no. 6, pp. 1-13, November 2015.
[12] D. J. Watts and S. H. Strogatz, "Collective Dynamics of 'Small-World' Networks," Nature, vol. 393,
pp. 440-442, June 1998.
[13] N. Meghanathan, "Using Spectral Radius Ratio for Node Degree to Analyze the Evolution of
Complex Networks," International Journal of Computer Networks and Communications, vol. 7, no. 3,
pp. 1-12, May 2015.
[14] D. Lusseau, D, K. Schneider, O. J. Boisseau, P. Hasse, E. Slooten, and S. M. Dawson, "The
Bottlenose Dolphin Community of Doubtful Sound Features a Large Proportion of Long-lasting
Associations," Behavioral Ecology and Sociobiology, vol. 54, no. 3, pp. 396-405, 2003.
[15] M. Newman, "Finding Community Structure in Networks using the Eigenvectors of Matrices,"
Physical Review E, vol. 74, no. 3, 036104, 2006.
[16] J. G. White, E. Southgate, J. N. Thomson and S. Brenner, "The Structure of the Nervous System of
the Nematode Caenorhabditis Elegans," Philosophical Transactions B, vol. 314, no. 1165, pp. 1-340,
1986.
[17] M. Newman, M and M. Girvan, "Mixing Patterns and Community Structure in Networks," Statistical
Mechanics of Complex Networks: Lecture Notes in Physics, vol. 625, pp. 66-87, 2003.
[18] Zachary, W. W. (1977). An Information Flow Model for Conflict and Fission in Small Groups.
Journal of Anthropological Research, vol. 33, no. 4, pp. 452-473, 1977.
[19] D. E. Knuth, The Stanford GraphBase: A Platform for Combinatorial Computing, 1st Edition,
Addison-Wesley, 1993.

18 Computer Science & Information Technology (CS & IT)
[20] V. Batagelj and A. Mrvar, Pajek Datasets. http://vlado.fmf.uni-lj.si/pub/networks/data/, 2006.
[21] V. Krebs, "Proxy Networks: Analyzing One Network to Reveal Another," Bulletin de Méthodologie
Sociologique, vol. 79, pp. 61-70, 2003.

Natarajan Meghanathan et al. (Eds) : NeCoM, CSITEC - 2016
pp. 19–30, 2016. © CS & IT-CSCP 2016 DOI : 10.5121/csit.2016.61203
A FLOATING POINT DIVISION UNIT
BASED ON TAYLOR-SERIES EXPANSION
ALGORITHM AND ITERATIVE
LOGARITHMIC MULTIPLIER
Riyansh K. Karani, Akash K. Rana, Dhruv H. Reshamwala and
Kishore Saldanha
Electronics Department,
Dwarkadas J. Sanghvi College of Engineering, Mumbai [email protected]
ABSTRACT
Floating point division, even though being an infrequent operation in the traditional sense, is
indis-pensable when it comes to a range of non-traditional applications such as K-Means
Clustering and QR Decomposition just to name a few. In such applications, hardware support
for floating point division would boost the performance of the entire system. In this paper, we
present a novel architecture for a floating point division unit based on the Taylor-series
expansion algorithm. We show that the Iterative Logarithmic Multiplier is very well suited to be
used as a part of this architecture. We propose an implementation of the powering unit that can
calculate an odd power and an even power of a number simultaneously, meanwhile having little
hardware overhead when compared to the Iterative Logarithmic Multiplier.
KEYWORDS
Floating point division, Iterative Logarithmic Multiplier, Taylor-series
1. INTRODUCTION
Approximation methods such as Newton-Raphson and Taylor-series can be used to approximate
functions where direct computation of these functions is either computationally very expensive or
not possible. The Taylor-series expansion is an approximation method that generates a high order
polynomial approximation of a function at some value in its domain. The idea is simple; given
that a function and its first derivatives are continuous at some point in its domain, the function
can be approximated by a polynomial of degree at that point. The higher the order of this
polynomial, the better is the approximation. Following on this idea, the reciprocal of a number
can be approximated as a very simple Taylor-series polynomial, and thus the problem of division
of one number by another is essentially reduced to multiplication of one number and the Taylor-

20 Computer Science & Information Technology (CS & IT)
series polynomial of the other [6]. Calculating the terms of the Taylor-series polynomial that
approximates the reciprocal of a number involves calculating the powers of itself
where calculating each higher power generates a better approximation.
Naturally, there is a need of a multiplier unit to calculate these powers, and the performance of
the floating point division unit then depends almost solely on the performance of the multiplier
unit. There are many popular multiplier architectures in use today [3]. The Iterative Logarithmic
Multiplier is one such multiplier architecture [12]. What makes it an attractive choice is that it is
highly programmable. The accuracy of the product generated by this multiplier can be precisely
controlled, which comes in very handy when one does not need full precision multiplication, like
in the case of digital signal processing.
But perhaps what is even more important is that because of its inherent nature, its implementation
is very hardware efficient when it comes to computation of squares. This is because the
mathematical description of the Iterative Logarithmic Multiplier is quite simplified when
multiplying a number with itself, as when compared to multiplying two different numbers.
Because every even power of a number can be represented as a square of a smaller power
of the number every alternate power of is representable as a square of some other
number. Hence, the Iterative Logarithmic Multiplier is a very suitable candidate when choosing a
multiplier architecture for calculating the terms of the Taylor-series polynomial approximation of
a reciprocal.
In this paper, we present an architecture for a floating point division unit based on the Iterative
Logarithmic Multiplication algorithm, and the Taylor-series expansion algorithm. The proposed
architecture is designed to be hardware efficient, as is the requirement when designing
architectures for high speed computational units. We start by describing the Taylor-series
expansion algorithm in section II, and analyse the approximation errors generated when using this
approach. We then introduce the methodology for calculating the reciprocal of a number using
the Taylor-series approach, and derive a quantitative measure of the generated error. Since the
approach above requires an initial approximation of the reciprocal, in section III, we start by
describing and analysing linear approximation as a possible approach. We then build on this to
present the piecewise linear approximation based approach that we have employed in our
implementation of the floating point division unit. In section IV, we describe the Iterative
Logarithmic Multiplier as proposed by Babic , Avramovic and Bulic [12], followed by the
discussion and implementation of the proposed squaring unit in section V. Finally, we present the
architecture for the proposed powering unit in section VI, and discuss its implementation and
features.
2. TAYLOR-SERIES EXPANSION ALGORITHM
Computer Science & Information Technology (CS & IT) 21

22 Computer Science & Information Technology (CS & IT)
3. INITIAL APPROXIMATION
As stated in the previous section, we need an initial approximation of the inverse of a number, in
order to calculate a more precise approximation using the Taylor-series expansion algorithm, and
according to equation (7), the number of iterations required to obtain an approximation with a
desired precision depends on the initial approximation. So, it is very important to select an
appropriate method for finding an initial approximation. There are different kinds of methods [5]
based on linear approximation, direct lookup tables [7] [8] [11], table lookup followed by
multiplication [4] and polynomial approximations [9]. In our implementation, we choose a
different approach. We employ a piecewise linear approximation for generating the initial
approximation, and we show that one can obtain any desired amount of precision using this
method, without much increase in complexity.
Figure 1: Plot showing the actual and linear Figure 2: Plot showing the values of
approximation values of x-1
, m for x in the range [1,2]
for a = 1 and b = 2
Computer Science & Information Technology (CS & IT) 23

24 Computer Science & Information Technology (CS & IT)

Computer Science & Information Technology (CS & IT) 25
Figure 3: Piecewise linear approximation of x-1
for x in the range [1,2], derived for n = 5
Table I: Piecewise Linear approximation segments
4. ITERATIVE LOGARITHMIC MULTIPLIER
Logarithmic Number System (LNS) based multipliers are a good choice when there is a
possibility of trading accuracy for speed (such as in Digital Signal Processing). The main
advantage of LNS based multipliers is the substitution of multiplication with addition, which is a
much simpler operation in terms of complexity. LNS multipliers can be divided into two
categories [12], one based on methods that use lookup-tables, and the others based on Mitchell’s
algorithm [10]. The major drawback with Mitchell’s algorithm is the error in the product due to
the piecewise linear approximation of the logarithmic curve. The Iterative Logarithmic
Multiplier, as the name suggests, proposes an iterative solution to computer this error term, and
hence generate a better approximation to the product.
26 Computer Science & Information Technology (CS & IT)
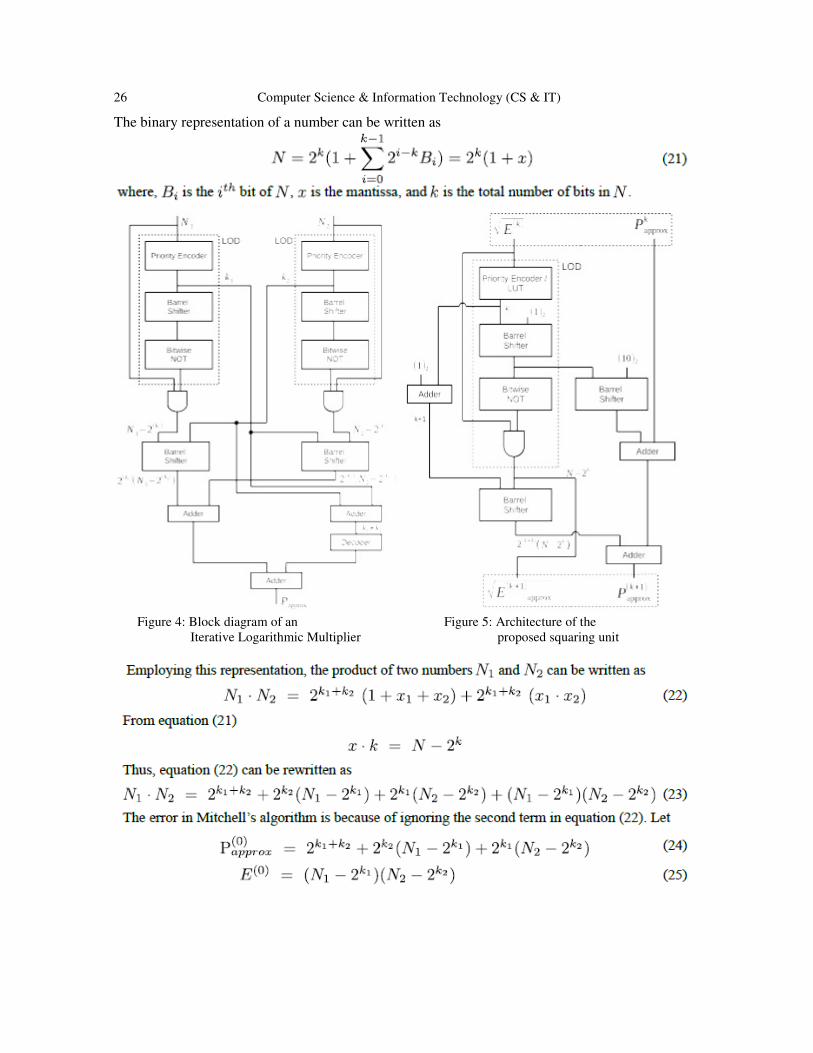
The binary representation of a number can be written as
Figure 4: Block diagram of an Figure 5: Architecture of the
Iterative Logarithmic Multiplier proposed squaring unit

Computer Science & Information Technology (CS & IT) 27
5. SQUARING UNIT
28 Computer Science & Information Technology (CS & IT)
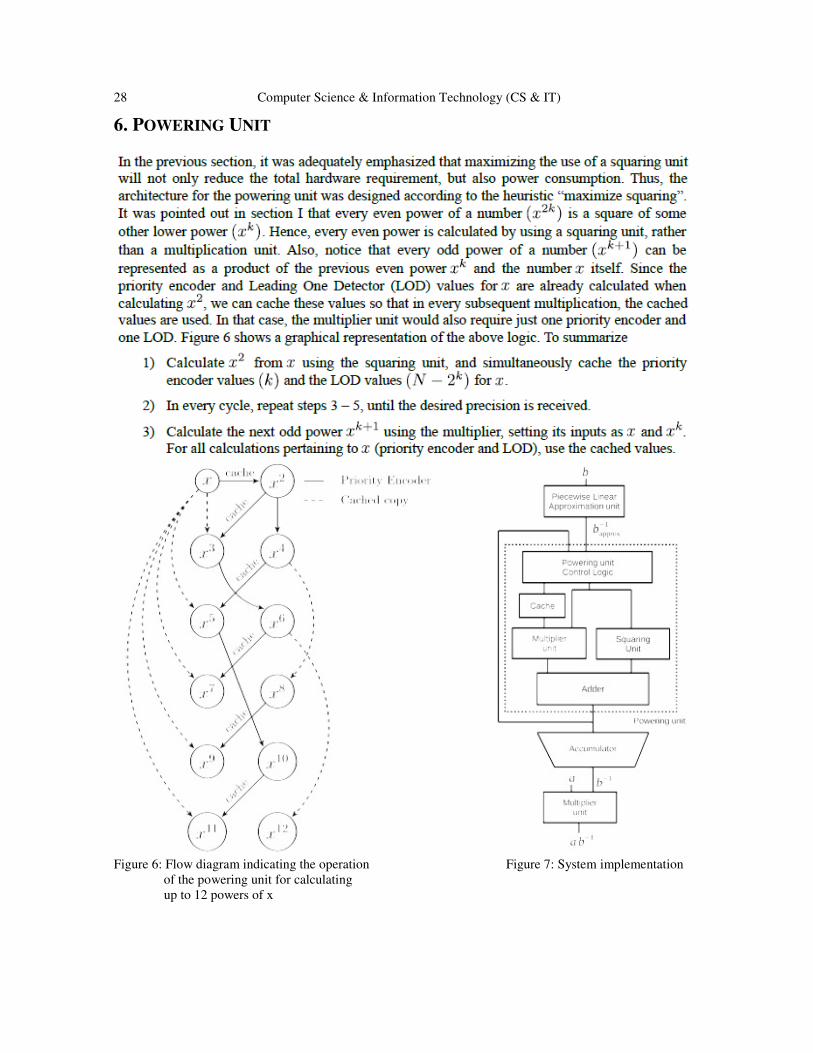
6. POWERING UNIT
Figure 6: Flow diagram indicating the operation Figure 7: System implementation
of the powering unit for calculating
up to 12 powers of x

Computer Science & Information Technology (CS & IT) 29
7. CONCLUSION
In this paper, we propose and investigate a new architecture for a floating point division unit. We
show that the Taylor-series expansion algorithm can be used to generate approximations for the
reciprocal of a number up to an arbitrary precision, and analyse the errors for the same. We
propose a new piecewise linear approximation based method to generate the first approximation
required by the Taylor-series expansion algorithm, and present an extensive analysis. We then
present the architecture for a squaring unit derived from the Iterative Logarithmic Multiplier, and
argue that it requires less than 50% hardware, as compared to the Iterative Logarithmic
Multiplier. Finally, we present a cumulative implementation of the powering unit, and discuss
some of the enhancements made in order to further boost its performance. The complete system is
illustrated in Figure 7.
The performance of the system can be improved by pipelining the architecture for the Iterative
Logarithmic Multiplier [12] and the squaring unit, but at the cost of increase in hardware
utilization.
REFERENCES
[1] Tom M. Apostol. Calculus Vol. 1. 2nd ed. 2013, pp. 272–303.
[2] Birne Binegar. “Math 4513: Numerical Analysis”. 1998.
URL:https://math.okstate.edu/people/binegar/4513-F98/4513-l01.pdf.
[3] Deepak Bordiya and Lalit Bandil. “Comparative Analysis Of Multipliers (serial and parallel with
radix based on booth algorithm)”. In: International Journal of Engineering Research and Technology
Vol.2 - Issue 9 (Sept. 2013).
[4] Zhan Guo, Dongdong Chen, Bintian Zhou and Peter Nilsson. “Design and Implementation of
Reciprocal Unit”. In: IEEE (Jan. 2007)
[5] Ankit Khandelwal and Gaurav Agarwal. A Newton Raphson Divider Based on Improved Reciprocal
Approximation Algorithm. Dec. 2006.
[6] Taek-Jun Kwon. “Floating-Point unit design using Taylor-series Expansion algorithms”. PhD thesis.
University of Southern California, 2009.
[7] Albert A. Liddicoat and Michael J. Flynn. “High Performance Floating Point Divide”. In: Digital
Systems Design, 2001. Proceedings. Euromicro Symposium on. Sept. 2001.
[8] Naofumi Takagi, Masayuki Ito, and Shuzo Yajima. “Efficient Initial Approximation and Fast
Converging Methods for Division and Square Root”. In: ARITH ’95 Proceedings of the 12th
Symposium on Computer Arithmetic. 1995.
30 Computer Science & Information Technology (CS & IT)
[9] Jean-Michel Muller, Milos Ercegovac and Arnaud Tisserand. “Simple Seed Architectures for
Reciprocal and Square Root Reciprocal”. In: INRIA RR-5720 (2005), p. 25.
[10] J.N. Mitchell. “Computer multiplication and division using binary logarithms”. In: IRE Transactions
on Electronic Computers EC-11 (Aug. 1962), pp. 512–517.
[11] Oskar Mencer, Patrick Hung, Hossam Fahmy and Michael J. Flynn. “Fast Division algorithm with a
Small Lookup Table”. In: Circuits, Systems and Computers, 1997. Conference Record. 1997 11th
Asilomar Conference on. 1997.
[12] Patricio Bulic , Zdenka Babic , Aleksej Avramovic .“An Iterative Logarithmic Multiplier”. In:
Elektrotehnis ki vestnik 77(1) (2010), pp. 25–30.

AUTHOR INDEX
Abdul Rehman Javed 01
Akash K. Rana 19
Andreas C. Wolf 01
Dhruv H. Reshamwala 19
Karthik KrishneGowda 01
Kishore Saldanha 19
Natarajan Meghanathan 09
Riyansh K. Karani 19
Rolf Kraemer 01
Xiaojia He 09


