Food Sci. Technol, Campinas, 1 Food Science and Technology ISSN 0101-2061 DI D http//dx.doi.org/10.1590/1678-457X.02616 1 Introduction Colour of foods directly affects consumers’ purchasing decision (Costa et al., 2011; Meléndez-Martínez et al., 2005). If the colour of the food is not what is expected, the consumers generally have a negative perception of quality (Francis, 1995), which makes it one of the most important selection criteria of how we purchase our food (Kays, 1991; Mendoza & Aguilera, 2004). erefore, colour of the foods must be analysed with utmost accuracy. e colour of an object can be determined either by human (visual) inspection or by using a colour measuring device because determination of colour is subjective and variable from observer to observer so it is generally recommended to determine the colour via a colour measuring instrument (Leon et al., 2006). In industry, the colour of foods has generally been measured using L * a * b * or CIELab colour space, which is an international standard accepted by the Commission Internationale d’Eclairage (CIE) in 1976 (Leon et al., 2006). In this method, L * is the lightness component or luminance ranging between 0 and 100; a * is a chromatic component ranging between -120 and +120, from green to red; and b * is a chromatic component ranging between -120 and +120, from blue to yellow. In food industry, colour is analysed using commercial colour meters such as Minolta Chroma Meter and Hunterlab Color Difference Meter (Gras et al., 1990; Holman et al., 2015). However, colorimetric results usually vary due to the fact that measurements taken by a colorimeter are based on a number of point measurements, and the average of these measurements does not represent the whole colour of the object. is approach does not reflect the colour variation throughout the object, and the variation in colour is more dramatic when especially the surface to be measured is quite non-uniform. erefore, it is hard to obtain reproducible results from the colorimetric measurements even if they are taken from the same point (Baardseth et al., 1988). Alternatively, colour of foods can rapidly and accurately be analysed by using computerised image analysis techniques, known as computer vision systems (Mendoza et al., 2006). Computer vision systems can be used to measure attributes of total appearance together with the measurement of uneven colouration (Hutchings, 1999; Brosnan & Sun, 2004; Du & Sun, 2004). Such systems provide an automated, cost-effective and non-destructive alternative to the conventional colour meter systems (Brosnan & Sun, 2004; Yam & Papadakis, 2004). Computer vision system has some specific applications in the food industry. Mohebbi et al. (2009) used the computer vision system to predict moisture content of shrimp during drying. ey found a high correlation coefficient between the colour and the change in moisture content of shrimp. Rodríguez-Pulido et al. (2012) also used the computer vision system and correlated the colour change of the grape berries with the chemical composition to determine the ripeness of grape berries. Rodríguez-Pulido et al. (2013) developed an algorithm to determine the heterogeneity in some foods including cabbage, orange, apple and tomato by assessing a relationship between chemical properties and colour, appearance and composition using the computer vision system. ey have suggested that the proposed algorithm in conjunction Computer vision system approach in colour measurements of foods: Part II. validation of methodology with real foods Fatih TARLAK 1 , Murat DZDEMİR 1 *, Mehmet MELİKDGLU 1 a Received 29 Jan., 2016 Accepted 26 May, 2016 1 Department of Chemical Engineering, Gebze Technical University, Gebze, Kocaeli, Turkey *Corresponding author [email protected]Abstract e colour of food is one of the most important factors affecting consumers’ purchasing decision. Although there are many colour spaces, the most widely used colour space in the food industry is L * a * b * colour space. Conventionally, the colour of foods is analysed with a colorimeter that measures small and non-representative areas of the food and the measurements usually vary depending on the point where the measurement is taken. is leads to the development of alternative colour analysis techniques. In this work, a simple and alternative method to measure the colour of foods known as “computer vision system” is presented and justified. With the aid of the computer vision system, foods that are homogenous and uniform in colour and shape could be classified with regard to their colours in a fast, inexpensive and simple way. is system could also be used to distinguish the defectives from the non-defectives. Quality parameters of meat and dairy products could be monitored without any physical contact, which causes contamination during sampling. Keywords: computer vision system; food; RGB; L * a * b * . Practical Application: A computer vision system, a simple and alternative way to conventional colour measurement techniques, can be used to measure colour of foods and as a quality control tool in the food industry.
Transcript
Food Sci. Technol, Campinas, 1
Food Science and Technology ISSN 0101-2061
DII:D httpI://dx.doi.org/10.1590/1678-457X.02616
1 IntroductionColour of foods directly affects consumers’ purchasing
decision (Costa et al., 2011; Meléndez-Martínez et al., 2005). If the colour of the food is not what is expected, the consumers generally have a negative perception of quality (Francis, 1995), which makes it one of the most important selection criteria of how we purchase our food (Kays, 1991; Mendoza & Aguilera, 2004). Therefore, colour of the foods must be analysed with utmost accuracy. The colour of an object can be determined either by human (visual) inspection or by using a colour measuring device because determination of colour is subjective and variable from observer to observer so it is generally recommended to determine the colour via a colour measuring instrument (Leon et al., 2006).
In industry, the colour of foods has generally been measured using L*a*b* or CIELab colour space, which is an international standard accepted by the Commission Internationale d’Eclairage (CIE) in 1976 (Leon et al., 2006). In this method, L* is the lightness component or luminance ranging between 0 and 100; a* is a chromatic component ranging between -120 and +120, from green to red; and b* is a chromatic component ranging between -120 and +120, from blue to yellow. In food industry, colour is analysed using commercial colour meters such as Minolta Chroma Meter and Hunterlab Color Difference Meter (Gras et al., 1990; Holman et al., 2015). However, colorimetric results usually vary due to the fact that measurements taken by a colorimeter are based on a number of point measurements, and the average of these measurements does not represent the whole colour of the object. This approach does not reflect the colour
variation throughout the object, and the variation in colour is more dramatic when especially the surface to be measured is quite non-uniform. Therefore, it is hard to obtain reproducible results from the colorimetric measurements even if they are taken from the same point (Baardseth et al., 1988).
Alternatively, colour of foods can rapidly and accurately be analysed by using computerised image analysis techniques, known as computer vision systems (Mendoza et al., 2006). Computer vision systems can be used to measure attributes of total appearance together with the measurement of uneven colouration (Hutchings, 1999; Brosnan & Sun, 2004; Du & Sun, 2004). Such systems provide an automated, cost-effective and non-destructive alternative to the conventional colour meter systems (Brosnan & Sun, 2004; Yam & Papadakis, 2004). Computer vision system has some specific applications in the food industry. Mohebbi et al. (2009) used the computer vision system to predict moisture content of shrimp during drying. They found a high correlation coefficient between the colour and the change in moisture content of shrimp. Rodríguez-Pulido et al. (2012) also used the computer vision system and correlated the colour change of the grape berries with the chemical composition to determine the ripeness of grape berries. Rodríguez-Pulido et al. (2013) developed an algorithm to determine the heterogeneity in some foods including cabbage, orange, apple and tomato by assessing a relationship between chemical properties and colour, appearance and composition using the computer vision system. They have suggested that the proposed algorithm in conjunction
Computer vision system approach in colour measurements of foods: Part II. validation of methodology with real foods
Fatih TARLAK1, Murat DZDEMİR1*, Mehmet MELİKDGLU1
a
Received 29 Jan., 2016 Accepted 26 May, 20161Department of Chemical Engineering, Gebze Technical University, Gebze, Kocaeli, Turkey*Corresponding authorI: [email protected]
AbstractThe colour of food is one of the most important factors affecting consumers’ purchasing decision. Although there are many colour spaces, the most widely used colour space in the food industry is L*a*b* colour space. Conventionally, the colour of foods is analysed with a colorimeter that measures small and non-representative areas of the food and the measurements usually vary depending on the point where the measurement is taken. This leads to the development of alternative colour analysis techniques. In this work, a simple and alternative method to measure the colour of foods known as “computer vision system” is presented and justified. With the aid of the computer vision system, foods that are homogenous and uniform in colour and shape could be classified with regard to their colours in a fast, inexpensive and simple way. This system could also be used to distinguish the defectives from the non-defectives. Quality parameters of meat and dairy products could be monitored without any physical contact, which causes contamination during sampling.
Practical Application: A computer vision system, a simple and alternative way to conventional colour measurement techniques, can be used to measure colour of foods and as a quality control tool in the food industry.
Colour measurement with computer vision system
Food Sci. Technol, Campinas, 2
with the computer vision system is the best way to measure the colour of food products, which have non-homogenous colour, and the system could be used for classification and prediction of chemical properties of foods. Recently, Yamamoto et al. (2015) have demonstrated that qualitative evaluation of the appearance of strawberries can be achieved based on a computer vision analysis technique.
The main objective of the present work was to implement and validate the proposed methodology given in Tarlak et al. (2016) for colour analysis of foods. The L*a*b* and RGB colour analysis of some selected foods were carried out to convert RGB colour units to L*a*b* space of real foods. The measured and predicted L*a*b* values were compared, and the accuracy of the proposed methodology in colour analysis of foods was tested.
2 Materials and methodsPrior to colour analysis with the image acquisition system, raw
meat, salami, sudjuk (Turkish style fermented sausage), cheddar cheese, potato, butter, broccoli, white cheese and cauliflower samples were cut into slices, and others (crushed red pepper flakes, biscuit, green bean, black sesame and coconut flakes) were analysed as is without any processing. Since the samples were sliced in the form of sheets, sphericity was not a concern in the colour measurements. The thickness of all the samples analysed did not exceed 2 cm. The digital camera was placed at a distance of 20 cm from the colour cards. The distance between the food samples and the camera’s lens was not less than 18 cm. Although there is a change in the number of pixels due to the zooming, this change did not affect the colour values significantly (p > 0.05). All foods used in colour analysis were purchased as fresh from a local market in Gebze, Kocaeli, Turkey.
In this study, the RGB colour analysis was done using a digital image acquisition system developed in Tarlak et al. (2016). The L*a*b* food colour analysis was performed randomly via twenty different measurements from the surfaces of the selected foods using a Konica Minolta Chroma Meter CR-400 equipped with D65 illuminant. The colour values were given as the average of twenty separate measurements. Prior to L*a*b* colour measurements, the chroma meter was calibrated with its white calibration tile (Y = 86.6, x = 0.3188, y = 0.3364).
The real RGB colour values of foods were obtained by the image segmentation. First, the digital images were read from the graphics file using the imread command of the Matlab 7.12.0 (R2011a) software (MathWorks Inc., Natick, MA, USA). Then, the digital images were filtered with a Gaussian low pass filter with a filter size [3x3] matrix and sigma 0.5, which allows pre-smoothing of noisy images (Mendoza & Aguilera, 2004; Mendoza et al., 2006). The filtered coloured images were converted to the grayscale intensity image using the rgb2gray command, and image segmentation was performed using the graythresh command of the Matlab software. Segmented images are in the form of binary images, so all pixels of these binary images are comprised of two values (0 and 1). Pixels with values of 0 and 1 represent black background and object in white colour, respectively.
The conversion from RGB colour units to L*a*b* colour space was done with a quadratic function given in Equation 1I:
* 211 12 13 14 15 16 17 18 19
* 221 22 23 24 25 26 27 28 29
* 231 32 33 34 35 36 37 38 39
ˆ
ˆ
ˆ
RGB
L RP P P P P P P P Pa P P P P P P P P P G
P P P P P P P P Pb BRGRBGB
=
(1)
In this equation, R, G and B are the digital colour variables of the samples; * L , *a and *b are the estimated *L , *a and *b colour variables, and 11 39P P− are the coefficients calculated using fminsearch command, which uses iteratively algorithm in the Matlab software.
The prediction performance of the quadratic model in colour analysis of foods was analysed using Equations 2 to 11. Mean normalized errors ( Le , ae and be ) for *L , *a and *b variables were calculated using Equation 2, Equation 3 and Equation 4, respectively.
* *
L1
1eˆn
i i
i
L Ln L=
−=
∆∑ (2)
* *
a1
1eˆn
i i
i
a an a=
−=
∆∑ (3)
* *
b1
1eˆn
i i
i
b bn b=
−=
∆∑ (4)
where *L , * ˆ a and *b are the colour values estimated with the model, and n is the number of measurements. *L values range from 0 to 100, and *a and *b values are between -120 and +120 so L∆ = 100 and a b∆ = ∆ = 240.
Percent (%) mean absolute error ( e ) was calculated by Equation 5, and the standard deviation (s) of the % mean absolute error was determined by Equation 6I:
L a be e ee *1003
+ += (5)
2n
ii 1
1 e e n =
s = −
∑ (6)
Euclidean distance ( )*abe∆ between real and estimated *L *a
and *b values was given by Equation 7I:
( ) ( ) ( )22 2* * * * * * *ab
1e ˆˆ ˆ
n
i i i i i ii
L L a a b b=
∆ = − + − + −∑ (7)
Root mean square errors ( LRMSE , aRMSE and b RMSE ) for *L , *a and *b variables were calculated using Equations 8 to 10. Average root mean square error (RMSE) was obtained by Equation 11.
Tarlak, Dzdemir, Melikoglu
Food Sci. Technol, Campinas, 3
* * 21
L( )
M Eˆ
R Sn
i iiL Ln
=−
= ∑ (8)
* * 21
a( )
M Eˆ
R Sn
i iia an
=−
= ∑ (9)
( )2* *1
bRMSEˆn
i iib b
n=
−=∑ (10)
L a bRMSE RMSE RMSERMSE 3
+ += (11)
3 Results and discussionThe prediction performance of the quadratic model for
each colour was tested on some real foods including raw meat, salami, sudjuk, crushed red pepper flakes, cheddar cheese, potato, biscuit, butter, green bean, broccoli, white cheese, cauliflower, black sesame and coconut flakes. The colour of these foods was measured by a chroma meter and the computer vision system used in this work (Figure 1).
Figure 1. RGB images for (a) raw meat, (b) salami, (c) sudjuk (Turkish style fermented sausage), (d) crushed red pepper flakes, (e) cheddar cheese, (f) potato, (g) biscuit, (h) butter, (i) green bean, (j) broccoli, (k) white cheese, (l) cauliflower, (m) black sesame and (n) coconut flakes.
Colour measurement with computer vision system
Food Sci. Technol, Campinas, 4
The quadratic model was used to convert RGB colour units to L*a*b* colour space for the data obtained from the computer vision system for the selected foods. The prediction performance of the quadratic model for the real foods was analysed by calculating e , *
abe∆ and RMSE values (Table 1). The e , *abe∆ and RMSE values
for the selected foods range from 0.36 to 1.74, 0.94 to 5.93 and 0.48 to 2.69, respectively.
The coconut flakes have the smallest e , *ab e∆ and RMSE
values while the biscuit has the highest e and RMSE values and sudjuk has the highest *
ab e∆ value. The reason why the smallest e , *
ab e∆ and RMSE values were obtained for the coconut flakes is that they have uniform colour and homogenous, resulting in obtaining more precise measurements by the chroma meter and the computer vision system. These results showed that homogeneity of the food colour was a critical factor affecting the measurement precision. If the colour contains some dark and light tones, this affects the colour measurement and causes some variation in repetitive colour measurements. This situation is observed in biscuit which has the dark and light tones of the yellow colour and sudjuk which contains fat having white tones.
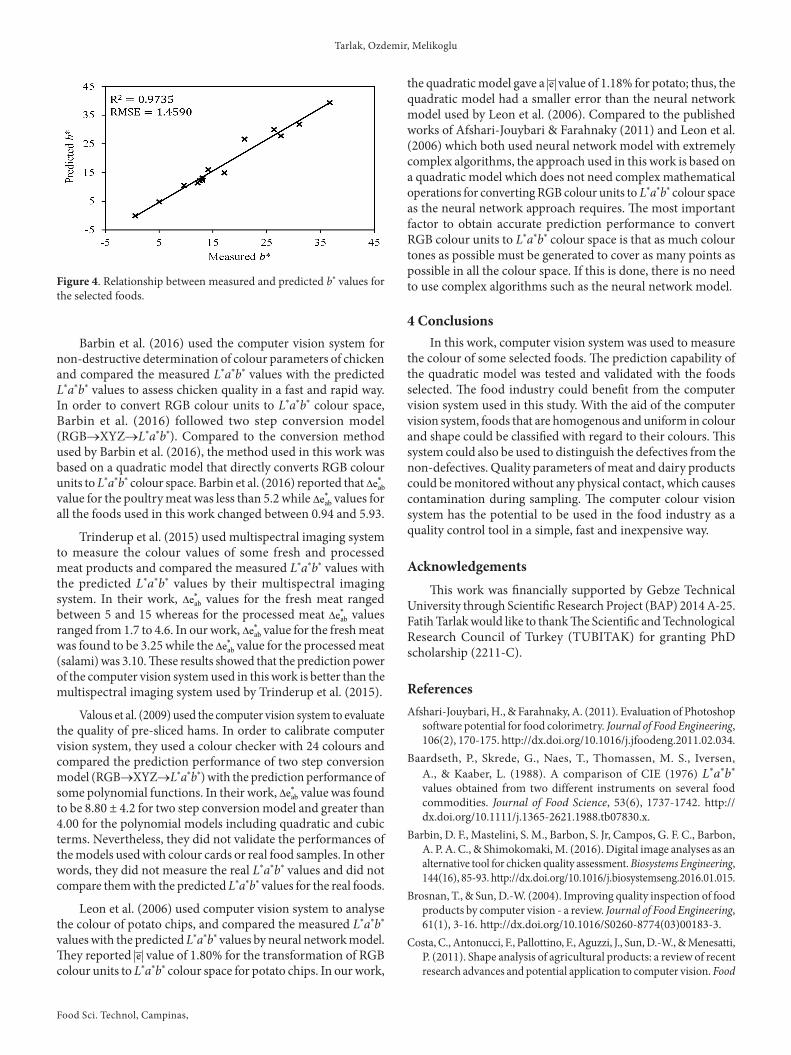
Measured L*a*b* values were also plotted against predicted L*a*b* values, and R2 values with root mean square errors ( LRMSE ,
aRMSE and bRMSE ) for *L , *a and *b variables were calculated to determine the existence of any relationship between the measured and predicted values for the selected foods (Figures 2-4). Measured and predicted * L , * a and *b values yielded R2 higher than 0.9735 and RMSE smaller than 1.7465. This indicated that the quadratic model has very high prediction performance for each * L , * a and *b variables. Mendoza et al. (2006) used the computer vision system for the classification of ripening bananas and compared the measured L*a*b* values with the predicted L*a*b* values by two step conversion model from RGB to XYZ and XYZ to L*a*b* (RGB→XYZ→L*a*b*). They found R2 values of 0.804, 0.972 and 0.609 for * L , *a and *b , respectively. All the R2 values were less than the R2 values found in our work for *L ,
* a and *b variables. Higher R2 and smaller RMSE values showed
considerable improvement in the prediction performance of the quadratic models used in the transformation of RGB colour units to L*a*b* colour space compared to the prediction performance of the models used by Mendoza et al. (2006).
Table 1. Measured and predicted L*a*b* values with the quadratic model for some selected foods.
Figure 2. Relationship between measured and predicted L* values for the selected foods.
Figure 3. Relationship between measured and predicted a* values for the selected foods.
Tarlak, Dzdemir, Melikoglu
Food Sci. Technol, Campinas, 5
Barbin et al. (2016) used the computer vision system for non-destructive determination of colour parameters of chicken and compared the measured L*a*b* values with the predicted L*a*b* values to assess chicken quality in a fast and rapid way. In order to convert RGB colour units to L*a*b* colour space, Barbin et al. (2016) followed two step conversion model (RGB→XYZ→L*a*b*). Compared to the conversion method used by Barbin et al. (2016), the method used in this work was based on a quadratic model that directly converts RGB colour units to L*a*b* colour space. Barbin et al. (2016) reported that *
abe∆ value for the poultry meat was less than 5.2 while *
abe∆ values for all the foods used in this work changed between 0.94 and 5.93.
Trinderup et al. (2015) used multispectral imaging system to measure the colour values of some fresh and processed meat products and compared the measured L*a*b* values with the predicted L*a*b* values by their multispectral imaging system. In their work, *
abe∆ values for the fresh meat ranged between 5 and 15 whereas for the processed meat *
abe∆ values ranged from 1.7 to 4.6. In our work, *
abe∆ value for the fresh meat was found to be 3.25 while the *
abe∆ value for the processed meat (salami) was 3.10. These results showed that the prediction power of the computer vision system used in this work is better than the multispectral imaging system used by Trinderup et al. (2015).
Valous et al. (2009) used the computer vision system to evaluate the quality of pre-sliced hams. In order to calibrate computer vision system, they used a colour checker with 24 colours and compared the prediction performance of two step conversion model (RGB→XYZ→L*a*b*) with the prediction performance of some polynomial functions. In their work, *
abe∆ value was found to be 8.80 ± 4.2 for two step conversion model and greater than 4.00 for the polynomial models including quadratic and cubic terms. Nevertheless, they did not validate the performances of the models used with colour cards or real food samples. In other words, they did not measure the real L*a*b* values and did not compare them with the predicted L*a*b* values for the real foods.
Leon et al. (2006) used computer vision system to analyse the colour of potato chips, and compared the measured L*a*b* values with the predicted L*a*b* values by neural network model. They reported e value of 1.80% for the transformation of RGB colour units to L*a*b* colour space for potato chips. In our work,
the quadratic model gave a e value of 1.18% for potato; thus, the quadratic model had a smaller error than the neural network model used by Leon et al. (2006). Compared to the published works of Afshari-Jouybari & Farahnaky (2011) and Leon et al. (2006) which both used neural network model with extremely complex algorithms, the approach used in this work is based on a quadratic model which does not need complex mathematical operations for converting RGB colour units to L*a*b* colour space as the neural network approach requires. The most important factor to obtain accurate prediction performance to convert RGB colour units to L*a*b* colour space is that as much colour tones as possible must be generated to cover as many points as possible in all the colour space. If this is done, there is no need to use complex algorithms such as the neural network model.
4 ConclusionsIn this work, computer vision system was used to measure
the colour of some selected foods. The prediction capability of the quadratic model was tested and validated with the foods selected. The food industry could benefit from the computer vision system used in this study. With the aid of the computer vision system, foods that are homogenous and uniform in colour and shape could be classified with regard to their colours. This system could also be used to distinguish the defectives from the non-defectives. Quality parameters of meat and dairy products could be monitored without any physical contact, which causes contamination during sampling. The computer colour vision system has the potential to be used in the food industry as a quality control tool in a simple, fast and inexpensive way.
AcknowledgementsThis work was financially supported by Gebze Technical
University through Scientific Research Project (BAP) 2014 A-25. Fatih Tarlak would like to thank The Scientific and Technological Research Council of Turkey (TUBITAK) for granting PhD scholarship (2211-C).
ReferencesAfshari-Jouybari, H., & Farahnaky, A. (2011). Evaluation of Photoshop
software potential for food colorimetry. Journal of Food Engineering, 106(2), 170-175. httpI://dx.doi.org/10.1016/j.jfoodeng.2011.02.034.
Baardseth, P., Skrede, G., Naes, T., Thomassen, M. S., Iversen, A., & Kaaber, L. (1988). A comparison of CIE (1976) L*a*b* values obtained from two different instruments on several food commodities. Journal of Food Science, 53(6), 1737-1742. httpI://dx.doi.org/10.1111/j.1365-2621.1988.tb07830.x.
Barbin, D. F., Mastelini, S. M., Barbon, S. Jr, Campos, G. F. C., Barbon, A. P. A. C., & Shimokomaki, M. (2016). Digital image analyses as an alternative tool for chicken quality assessment. Biosystems Engineering, 144(16), 85-93. httpI://dx.doi.org/10.1016/j.biosystemseng.2016.01.015.
Brosnan, T., & Sun, D.-W. (2004). Improving quality inspection of food products by computer vision - a review. Journal of Food Engineering, 61(1), 3-16. httpI://dx.doi.org/10.1016/S0260-8774(03)00183-3.
Costa, C., Antonucci, F., Pallottino, F., Aguzzi, J., Sun, D.-W., & Menesatti, P. (2011). Shape analysis of agricultural productsI: a review of recent research advances and potential application to computer vision. Food
Figure 4. Relationship between measured and predicted b* values for the selected foods.
Du, C.-J., & Sun, D.-W. (2004). Recent developments in the applications of image processing techniques for food quality evaluation. Trends in Food Science & Technology, 15(5), 230-249. httpI://dx.doi.org/10.1016/j.tifs.2003.10.006.
Francis, F. J. (1995). Quality as influenced by color. Food Quality and Preference, 6(3), 149-155. httpI://dx.doi.org/10.1016/0950-3293(94)00026-R.
Gras, P. W., Bason, M. L., & Esteves, L. A. (1990). Evaluation of a portable colour meter for assessment of the colour of milled rice. Journal of Stored Products, 26(2), 71-75. httpI://dx.doi.org/10.1016/0022-474X(90)90003-B.
Holman, B. W. B., Ponnampalam, E. N., van de Ven, R. J., Kerr, M. G., & Hopkins, D. L. (2015). Lamb meat colour values (HunterLab CIE and reflectance) are influenced by aperture size (5 mm v. 25 mm). Meat Science, 100, 202-208. httpI://dx.doi.org/10.1016/j.meatsci.2014.10.006. PMidI:25460126.
Hutchings, J. B. (1999). Food colour and appearance (2nd ed.). New YorkI: Springer.
Kays, S. J. (1991). Postharvest physiology of perishable plant products. New YorkI: Van Nostrand Reinhold.
Leon, K., Mery, D., Pedreschi, F., & Leon, J. (2006). Color measurement in L*a*b* units from RGB digital images. Food Research International, 39(10), 1084-1091. httpI://dx.doi.org/10.1016/j.foodres.2006.03.006.
Meléndez-Martínez, A. J., Vicario, I. M., & Heredia, F. J. (2005). Instrumental measurement of orange juice colourI: a review. Journal of the Science of Food and Agriculture, 85(6), 894-901. httpI://dx.doi.org/10.1002/jsfa.2115.
Mendoza, F., & Aguilera, J. M. (2004). Application of Image Analysis for Classification of Ripening Bananas. Journal of Food Science, 69(9), 471-477. httpI://dx.doi.org/10.1111/j.1365-2621.2004.tb09932.x.
Mendoza, F., Dejmek, P., & Aguilera, J. M. (2006). Calibrated color measurements of agricultural foods using image analysis. Postharvest Biology and Technology, 41(3), 285-295. httpI://dx.doi.org/10.1016/j.postharvbio.2006.04.004.
Mohebbi, M., Akbarzadeh-T, M.-R., Shahidi, F., Moussavi, M., & Ghoddusi, H.-B. (2009). Computer vision systems (CVS) for moisture content estimation in dehydrated shrimp. Computers and Electronics in Agriculture, 69(2), 128-134. httpI://dx.doi.org/10.1016/j.compag.2009.07.005.
Rodríguez-Pulido, F. J., Gomez-Robledo, L., Melgosa, M., Gordillo, B., Gonzalez-Miret, M. L., & Heredia, F. J. (2012). Ripeness estimation of grape berries and seeds by image analysis. Computers and Electronics in Agriculture, 82, 128-133. httpI://dx.doi.org/10.1016/j.compag.2012.01.004.
Rodríguez-Pulido, F. J., Gordillo, B., Lourdes González-Miret, M., & Heredia, F. J. (2013). Analysis of food appearance properties by computer vision applying ellipsoids to colour data. Computers and Electronics in Agriculture, 99, 108-115. httpI://dx.doi.org/10.1016/j.compag.2013.08.027.
Tarlak, F., Dzdemir, M., & Melikoglu, M. (2016). Computer vision system approach in colour measurements of foodsI: Part I. development of methodology. Food Science and Technology, 36(2), In press. httpI://dx.doi.org/10.1590/1678-457X.11615.
Trinderup, C. H., Dahl, A., Jensen, K., Carstensen, J. M., & Conradsen, K. (2015). Comparison of a multispectral vision system and a colorimeter for the assessment of meat color. Meat Science, 102, 1-7. httpI://dx.doi.org/10.1016/j.meatsci.2014.11.012. PMidI:25498302.
Valous, N. A., Mendoza, F., Sun, D.-W., & Allen, P. (2009). Colour calibration of a laboratory computer vision system for quality evaluation of pre-sliced hams. Meat Science, 81(1), 132-141. httpI://dx.doi.org/10.1016/j.meatsci.2008.07.009. PMidI:22063973.
Yam, K. L., & Papadakis, S. E. (2004). A simple digital imaging method for measuring and analyzing color of food surfaces. Journal of Food Engineering, 61(1), 137-142. httpI://dx.doi.org/10.1016/S0260-8774(03)00195-X.
Yamamoto, K., Ninomiya, S., Kimura, Y., Hashimoto, A., Yoshioka, Y., & Kameoka, T. (2015). Strawberry cultivar identification and quality evaluation on the basis of multiple fruit appearance features. Computers and Electronics in Agriculture, 110, 233-240. httpI://dx.doi.org/10.1016/j.compag.2014.11.018.