HAL Id: hal-00810604 https://hal.archives-ouvertes.fr/hal-00810604 Submitted on 23 Apr 2012 HAL is a multi-disciplinary open access archive for the deposit and dissemination of sci- entific research documents, whether they are pub- lished or not. The documents may come from teaching and research institutions in France or abroad, or from public or private research centers. L’archive ouverte pluridisciplinaire HAL, est destinée au dépôt et à la diffusion de documents scientifiques de niveau recherche, publiés ou non, émanant des établissements d’enseignement et de recherche français ou étrangers, des laboratoires publics ou privés. Concentrated Spectrogram of audio acoustic signals - a comparative study Krzysztof Czarnecki, Marek Moszyński, Miroslaw Rojewski To cite this version: Krzysztof Czarnecki, Marek Moszyński, Miroslaw Rojewski. Concentrated Spectrogram of audio acoustic signals - a comparative study. Société Française d’Acoustique. Acoustics 2012, Apr 2012, Nantes, France. 2012. <hal-00810604>
Transcript
HAL Id: hal-00810604https://hal.archives-ouvertes.fr/hal-00810604
Submitted on 23 Apr 2012
HAL is a multi-disciplinary open accessarchive for the deposit and dissemination of sci-entific research documents, whether they are pub-lished or not. The documents may come fromteaching and research institutions in France orabroad, or from public or private research centers.
L’archive ouverte pluridisciplinaire HAL, estdestinée au dépôt et à la diffusion de documentsscientifiques de niveau recherche, publiés ou non,émanant des établissements d’enseignement et derecherche français ou étrangers, des laboratoirespublics ou privés.
Concentrated Spectrogram of audio acoustic signals -a comparative study
Krzysztof Czarnecki, Marek Moszyński, Miroslaw Rojewski
To cite this version:Krzysztof Czarnecki, Marek Moszyński, Miroslaw Rojewski. Concentrated Spectrogram of audioacoustic signals - a comparative study. Société Française d’Acoustique. Acoustics 2012, Apr 2012,Nantes, France. 2012. <hal-00810604>
Concentrated Spectrogram of audio acoustic signals -a comparative study
K. Czarnecki, M. Moszynski and M. Rojewski
Gdansk University of Technology, 11/12 Gabriela Narutowicza Street, 80-233 Gdansk, [email protected]
Proceedings of the Acoustics 2012 Nantes Conference 23-27 April 2012, Nantes, France
405
The paper presents results of time-frequency analysis of audio acoustic discrete-time signals using the method ofConcentrated Spectrograph also known as ”Reassignment method” or ”Cross-spectral method”. This approachinvolves signal’s local group delay and channelized instantaneous frequency to relevantly redistribute all Short-time Fourier transform lines over time-frequency plain. The main intention of the paper is to compare variousguitar playing techniques including legato, staccato, vibrato etc. Additionally, the advantages of ConcentratedSpectrograms especially high energy concentration in comparison with classical spectrogram based directly onShort-time Fourier transform are presented. Moreover, the vibrato playing technique is considered also for anothermusical instruments including flute and violin.
1 IntroductionThe time-frequency (TF) energy distribution referred to
as Concentrated Spectrogram is employed to illustrate thedecomposition of audio acoustic signals and investigate theunique features of various playing techniques. In the paper,zoomed fragments of spectrograms to emphasize some typ-ical details such as local instantaneous frequency evolution,a way of birth and death of partials etc. are especially pre-sented. The similar subject is reported in few papers includ-ing [6, 3].
The proposed method of TF analysis is one of the Ga-bor transforms that have many advantages. Firstly, they arelinear, which simplifies interpretation of the transform anddevelopment of analysis systems. Secondly, cells (also re-ferred to as: TF bins, Heisenberg boxes, Gabor atoms etc.)of time-frequency representation (TFR) have the same sizein the whole domain (in contrast to scalograms). Specificallyfor Short-time Fourier transform (STFT), shapes of the cellsare determined by a window function. Thirdly, there existsan inverse transformation, that ensures the possibility of theanalysed signal reconstruction. Moreover, Gabor transfor-mations do not cause so-called cross-terms – artefacts thatare serious problem in many nonlinear transforms [1].
The method of calculating the concentrated spectrogramhas been introduced by several authors under various names,including the modified moving window method publishedfirstly in [4], the cross-spectral method [5], the time-frequencyreassignment [2], method of reassignment, remapping, relo-cation, replacement, displacement etc. Kodera et al. pro-posed the usage of local group delay (LGD) and channel-ized instantaneous frequency (CIF) to redistribute energy ofSTFT in TF plain. In case of discrete signals and its trans-forms, both LGD and CIF perform new TF coordinates ofSTFT lines. Similarly to STFT, imaging obtained in this wayis subject to the Heisenberg-Gabor uncertainty principle, butnew locations are more precise compared to those obtainedby classical STFT. It is mainly caused by the reduction ofDFT leakage effect for discrete transforms [1].
2 Concentrated SpectrogramThe concentrated spectrogram is calculated using the modi-
fied moving window method (MMWM). Firstly, STFT of thecausal time-dependent and discrete-time signal x[n] is ob-tained using following formula:
X[l, k] :=M−1∑m=0
x[lD + m] exp(
j2πm(k/K − 1/2))
(1)
where k = 0, 1, ...,K − 1; l = 0, 1, ..., L − 1; n = 0, 1, ...,N − 1; D,K, L,M,N ∈ I . M is the width of the windowh[m] (single frame) and the obtained transform X[l, k] has
size of L × K. L depends on the entire signal length N,and K is the length of the single running DFT which is con-tained in each column of the transform. Each single DFTcarries information about negative and positive frequencies:(−Fs/2, Fs/2), where Fs means the sampling rate (in Sa/s)of discrete-time signal. D is the time step (in Sa) betweenneighbouring frames.
The next step of MMWM is calculation of relocated TFcoordinates for each STFT line. The new locations are ob-tained by calculating of local group delay as:
T [l, k] :=K
2πFsArg(X[l, k]X∗[l, k − 1]) (2)
and channelized instantaneous frequency as:
F[l, k] :=Fs
2πArg(X[l, k]X∗[l − 1, k]) (3)
where X∗[l, k] is the complex conjugation of X[l, k] and Argmeans the principal argument of a complex number. The re-located coordinates are obtained by:
(tl, ωk)→ (tl − T [l, k], F[l, k]) (4)
where tl is delay of l-th frame and ωk is center frequency ofk-th channel.
Simultaneously, the energy of each STFT line is calcu-lated as follows:
E[l, k] = |X[l, k]|2 (5)
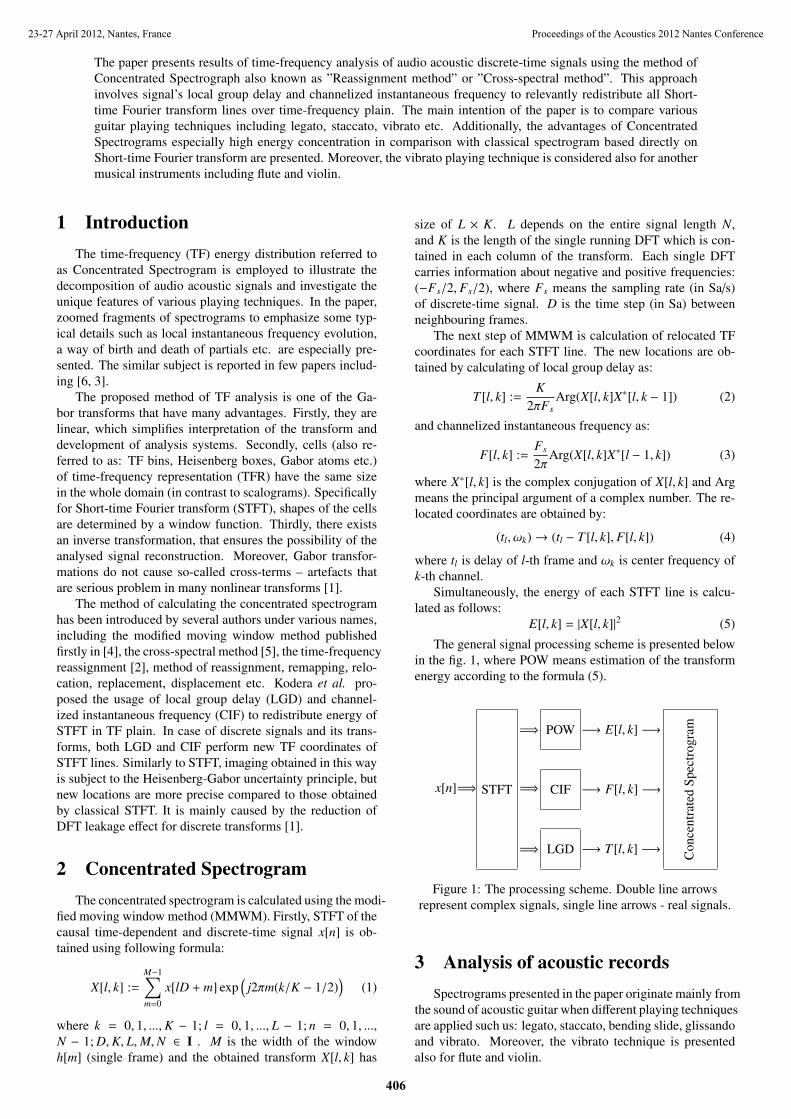
The general signal processing scheme is presented belowin the fig. 1, where POW means estimation of the transformenergy according to the formula (5).
x[n]=⇒ STFT
=⇒ POW −→ E[l, k] −→
=⇒ CIF −→ F[l, k] −→
=⇒ LGD −→ T [l, k] −→ Con
cent
rate
dSp
ectr
ogra
m
Figure 1: The processing scheme. Double line arrowsrepresent complex signals, single line arrows - real signals.
3 Analysis of acoustic recordsSpectrograms presented in the paper originate mainly from
the sound of acoustic guitar when different playing techniquesare applied such us: legato, staccato, bending slide, glissandoand vibrato. Moreover, the vibrato technique is presentedalso for flute and violin.
Proceedings of the Acoustics 2012 Nantes Conference23-27 April 2012, Nantes, France
406
3.1 LegatoLegato is a form of a musical articulation, where notes
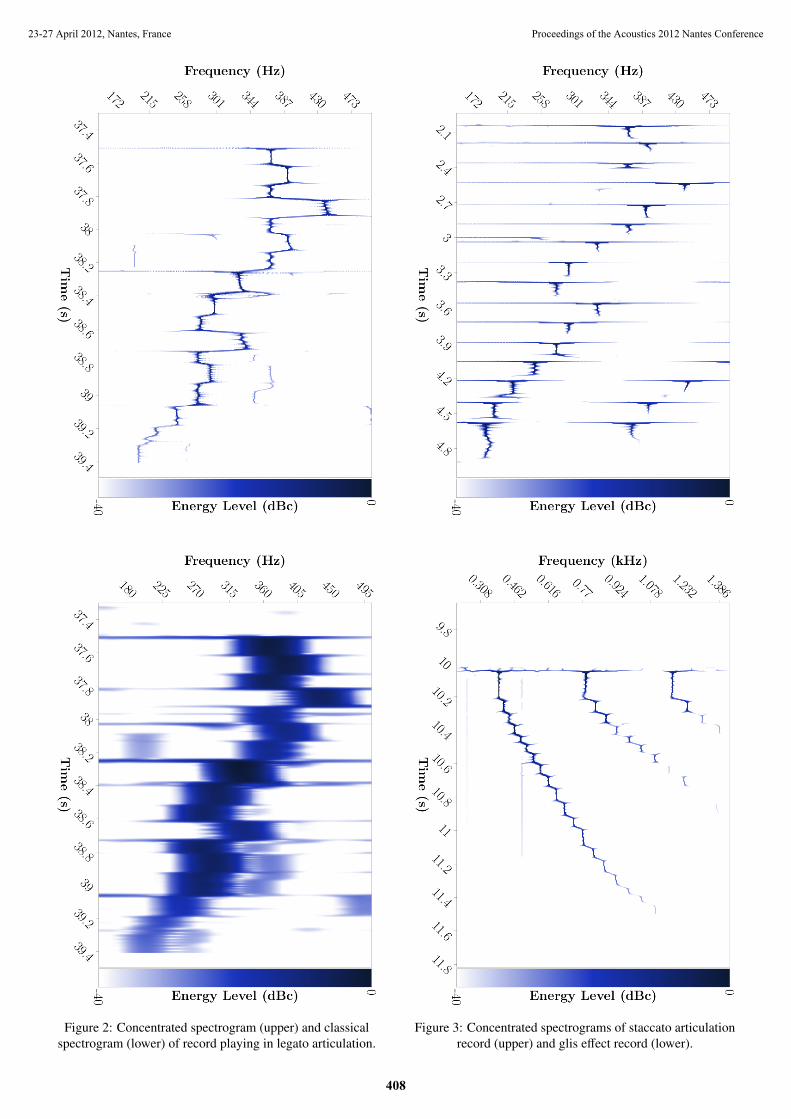
are played fluently and smoothly. A listener should havean impression that sounds are connected. There are varioustechniques of legato playing on the acoustic guitar, e.g. ham-mering, pull-off, tapping. On the whole a player can achievethis effect by rapid changes of the strings pressing on the fin-gerboard and simultaneously by the coherent synchronisedstrings striking by fingers or by guitar pick. Intervals be-tween the sounds should be as short as possible. The im-portant factor in legato techniques is also proper damping ofstrings oscillation. The spectrograms of the legato articula-tion sample is presented in the fig. 2.
3.2 StaccatoStaccato, like legato, is a kind of musical articulation.
However, as opposed to legato technique, sounds are playedclearly separately. Additionally, in staccato technique, dura-tion of sounds is visibly reduced in order to emphasize a dis-tinct changes of pitch. Guitar player can force such effect bysudden suppression of strings vibration by fingers soon afterhitting the strings. The separation of sounds is well visibleon the spectrogram in the fig. 3, where staccato techniqueanalysed is presented.
3.3 GlissandoGlissando is a kind of a smooth transition from one pitch
to another playing all sounds between. When playing the gui-tar, this effect is produced pushing all frets by sliding fingeralong fingerboard after the single hit in the string. In slangthis effect is referred to as glis. The record spectrogram ofsuch effect is presented in the fig. 3.
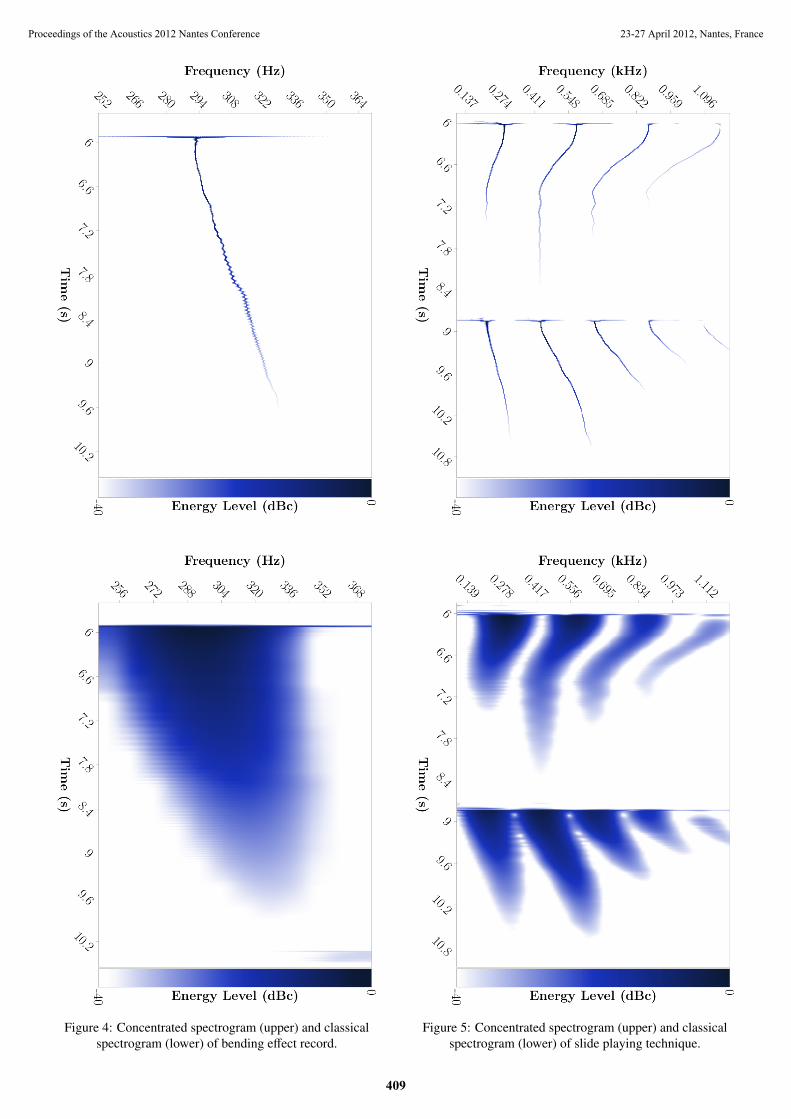
3.4 BendingBending is a kind of guitar lick. However, it can be played
also on another string instruments. Banding can be producedby pulling or pushing the string across the fingerboard. Thusplayer raises the tension in the vibrating string and as a resultalways raises the pitch of a note. This is clearly visible inthe fig. 4, where concentrated and classical spectrograms arecompared.
3.5 SlideSmooth transition of pitch obtained by using so-called
bottleneck (or another flat and hard items) is referred to asthe slide. It is applied by raising and lowering of instanta-neous frequency of sound. The bottleneck is fluently movedduring the performance along the guitar fingerboard touch-ing the strings. This effect is used mainly as some kind ofmusical ornament. Slides whose spectrograms are presentedin the paper in the fig. 5, were produce using a plastic bottle-neck.
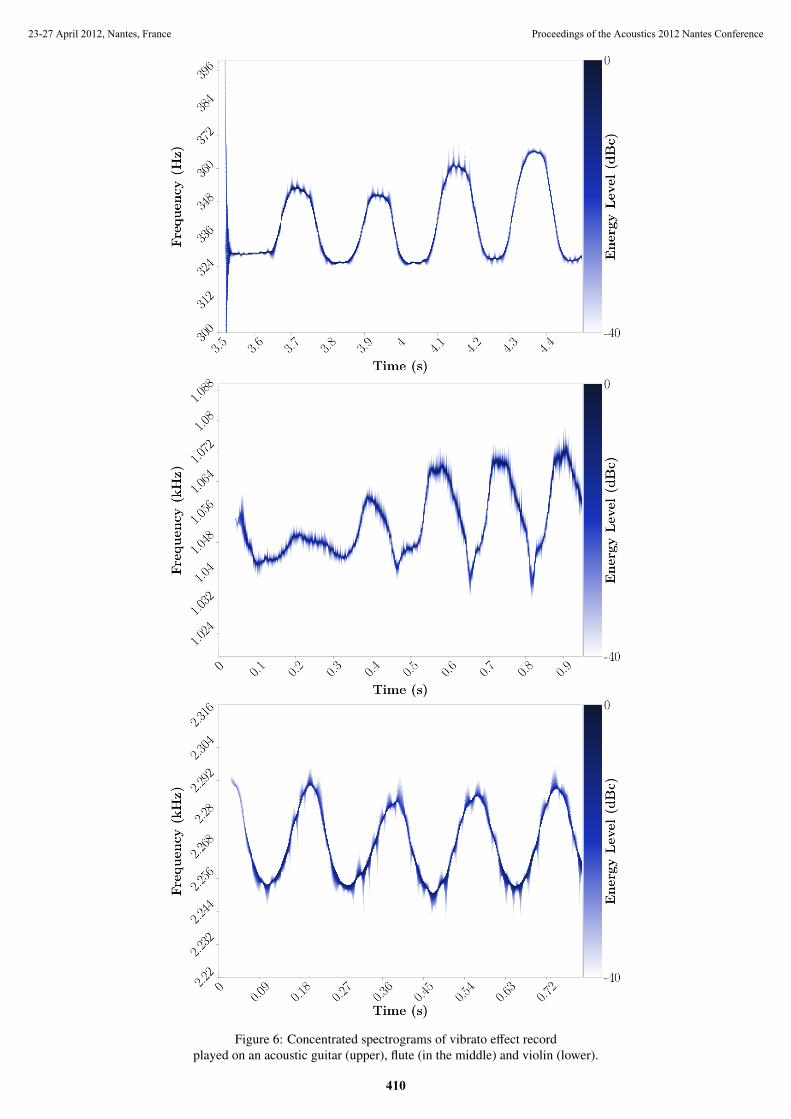
3.6 VibratoVibrato is a technique of playing musical instruments.
For violin, vibrato is created by the rhythmic motion of per-former’s wrist across the fingerboard. This causes changeof the strings tension and, consequently, the modulation of
both amplitude and frequency of the sound. Similarly forguitar, the player can produce the vibrato by turns push andpull strings across the fretboard simultaneously pressing thestring to the fret. However for flute, the vibrato is obtaineddue to a proper pulsation of the windstream controlled byplayer’s muscles in the throat and diaphragm. The com-parison of vibrato effect records spectrograms is presentedin fig. 6.
4 ConclusionThe presented method of analysis is precise and it can
be applied for careful identification of sounds, melody, in-struments and various techniques or effects. Characteristicfeatures of various playing techniques and effects containedin the analysed records are clearly visible on presented spec-trograms. For staccato musical articulations, energy on thespectrogram is distributed vertically over time-frequency plainin the initial stage of sounds duration, that indicates rapid es-calation of sound intensity. Similarly, suppressions of soundsare fairly determined that makes signal emission interrup-tions. That is in opposed to legato musical articulations,where the signal seems to be continuous. On the other hand,for bending, slide and vibrato effects, the spectrograms presentunambiguously modulation depth and deviation of signal in-stantaneous frequency.
AcknowledgmentsThe sincere thanks from the authors to Łukasz Lazer and
Joanna Czarnecka for providing professional records of acous-tic guitar and another musical instruments.
References[1] K. Czarnecki, M. Kaniewska, M. Moszynski, M. Ro-
jewski, ”Concentrated Spectrogram of Acoustic Sig-nals”, Archives of Acoustics (in review)
[2] P. Flandrin, F. Auger, E. Chassande-Mottin, Time-frequency reassignment: From principles to algo-rithms, Applications in Time-Frequency Signal Pro-cessing, A. Papandreou-Suppappola [Ed.], 179-203,CRC Press. (2003)
[3] P. Guillemain, R. Kronland-Martinet, ”Characteriza-tion of acoustic signals through continuous linear time-frequency representations”, Proceedings of the IEEE84(9), 1216-1230, (1996)
[4] K. Kodera, C. De Villedary, R. Gendrin, ”A newmethod for the numerical analysis of non-stationarysignals”, Physics of The Earth and Planetary Interiors,12(2-3), 142-150, (1976).
[5] D.J. Nelson, ”Cross-spectral methods for processingspeech”, J. Acoust. Soc. Am., 110(5), 2575-2592,(2001)
[6] W.J. Pielemeier, G.H. Wakefield, ”A high-resolutiontime-frequency representation for musical instrumentsignals”, J. Acoust. Soc. Am. 99(4), 2382-2396 (1996)
Proceedings of the Acoustics 2012 Nantes Conference 23-27 April 2012, Nantes, France
407
Figure 2: Concentrated spectrogram (upper) and classicalspectrogram (lower) of record playing in legato articulation.
Figure 3: Concentrated spectrograms of staccato articulationrecord (upper) and glis effect record (lower).
Proceedings of the Acoustics 2012 Nantes Conference23-27 April 2012, Nantes, France
408
Figure 4: Concentrated spectrogram (upper) and classicalspectrogram (lower) of bending effect record.
Figure 5: Concentrated spectrogram (upper) and classicalspectrogram (lower) of slide playing technique.
Proceedings of the Acoustics 2012 Nantes Conference 23-27 April 2012, Nantes, France
409
Figure 6: Concentrated spectrograms of vibrato effect recordplayed on an acoustic guitar (upper), flute (in the middle) and violin (lower).
Proceedings of the Acoustics 2012 Nantes Conference23-27 April 2012, Nantes, France


![[Clement Hal] Clement, Hal - Iceworld](https://static.documents.pub/doc/80x56/577cb1001a28aba7118b67ac/clement-hal-clement-hal-iceworld.jpg)


