Concentration and distribution of pesticide residues in soil: Non-dietary human health risk assessment
Govinda Bhandari a, b, *, Kishor Atreya c, Paul T.J. Scheepers d, Violette Geissen a
a Soil Physics and Land Management (SLM), Wageningen University and Research, the Netherlandsb Progressive Sustainable Developers Nepal (PSD-Nepal), P.O. Box 23883, Kathmandu 31, Nepalc PHASE Nepal, P.O. Box 12888, Suryabinayak 4, Dadhikot, Bhaktapur, Nepald Radboudumc, Radboud Institute for Health Sciences, Nijmegen, the Netherlands
h i g h l i g h t s
* Corresponding author. Soil Physics and Land ManUniversity and Research, the Netherlands.
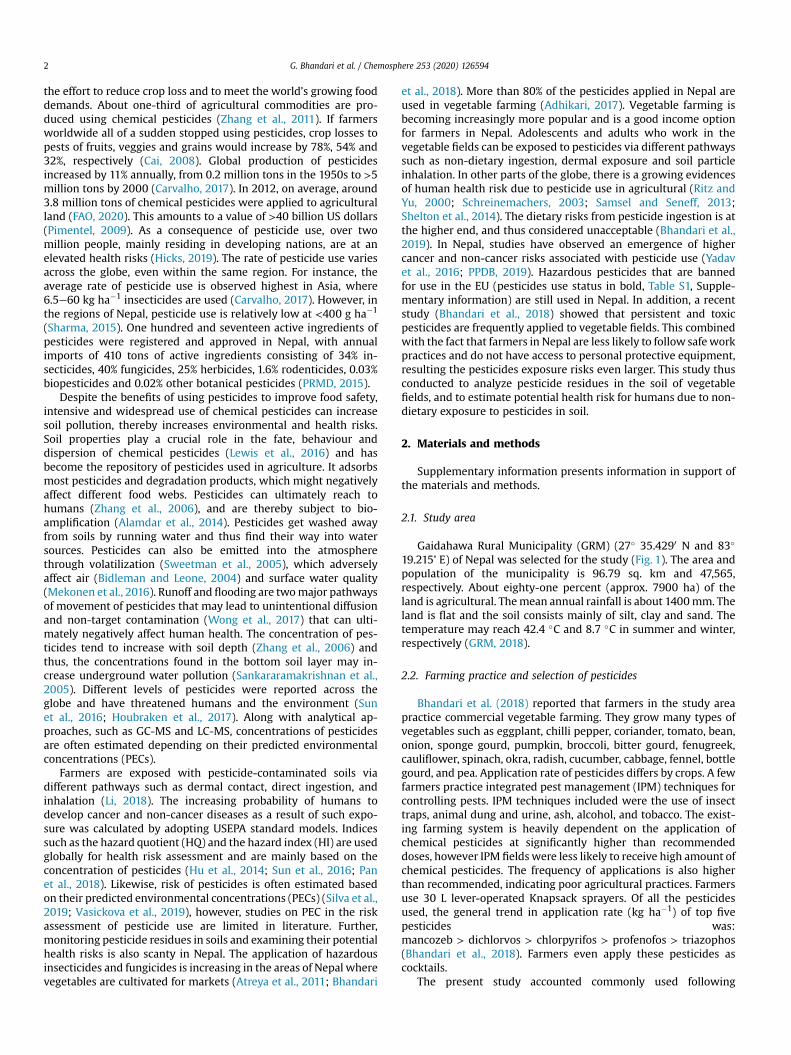
� 3,5,6-trichloro-2-pyridinol andchlorantraniliprole were the mostfrequently detected.
� Chlorpyrifos and p,p’-DDT had thehighest concentrations in soil.
� Health risk of soil pollutants tohumans was negligible.
� Soils from integrated pest manage-ment fields had the lowest concen-tration of residues
a r t i c l e i n f o
Article history:Received 24 January 2020Received in revised form16 March 2020Accepted 21 March 2020Available online 27 March 2020
Handling Editor: Myrto Petreas
Keywords:Cancer and non-cancer risk assessmentNepalese agricultural soilsPesticide residuesPredicted environmental concentrations(PECs) in soil
a b s t r a c t
Soil contamination by pesticide residues is a primary concern because of the high soil persistence ofpesticides and their toxicity to humans. We investigated pesticide concentration and distribution at 3 soildepths in 147 soil samples from agricultural land and assessed potential health risks due to non-dietaryhuman exposure to pesticides in Nepal. About sixty percent of the soil samples had pesticides (25% of thesoil samples had single residue, 35% of the soil samples had mixtures of 2 or more residues) in 39different pesticide combinations. Pesticide residues were found more frequently in topsoil. Overall, theconcentration of pesticides ranged from 1.0 mg kg�1 to 251 mg kg�1, with a mean of 16 mg kg�1. Theconcentration of the primary group, organophosphates (OPs), ranged from 1.23 mg kg�1 to 239 mg kg�1,with a mean of 23 mg kg�1. Chlorpyrifos and 3,5,6-trichloro-2-pyridinol (TCP) were the predominantcontaminants in soils. The ionic ratio of DDT and its degradation products suggested a continuing use ofDDT in the area. Human health risk assessment of the observed pesticides in soil suggested negligiblecancer risks and negligible non-cancer risks based on ingestion as the primary route of exposure. Thepredicted environmental concentrations (PECs) of pesticides were higher than the values found in theguidance for soil contamination used internationally. Low concentrations of residues in the soils fromagricultural farms practicing integrated pest management (IPM) suggest that this farming system couldreduce soil pollution in Nepal.
G. Bhandari et al. / Chemosphere 253 (2020) 1265942
the effort to reduce crop loss and to meet the world’s growing fooddemands. About one-third of agricultural commodities are pro-duced using chemical pesticides (Zhang et al., 2011). If farmersworldwide all of a sudden stopped using pesticides, crop losses topests of fruits, veggies and grains would increase by 78%, 54% and32%, respectively (Cai, 2008). Global production of pesticidesincreased by 11% annually, from 0.2 million tons in the 1950s to >5million tons by 2000 (Carvalho, 2017). In 2012, on average, around3.8 million tons of chemical pesticides were applied to agriculturalland (FAO, 2020). This amounts to a value of >40 billion US dollars(Pimentel, 2009). As a consequence of pesticide use, over twomillion people, mainly residing in developing nations, are at anelevated health risks (Hicks, 2019). The rate of pesticide use variesacross the globe, even within the same region. For instance, theaverage rate of pesticide use is observed highest in Asia, where6.5e60 kg ha�1 insecticides are used (Carvalho, 2017). However, inthe regions of Nepal, pesticide use is relatively low at <400 g ha�1
(Sharma, 2015). One hundred and seventeen active ingredients ofpesticides were registered and approved in Nepal, with annualimports of 410 tons of active ingredients consisting of 34% in-secticides, 40% fungicides, 25% herbicides, 1.6% rodenticides, 0.03%biopesticides and 0.02% other botanical pesticides (PRMD, 2015).
Despite the benefits of using pesticides to improve food safety,intensive and widespread use of chemical pesticides can increasesoil pollution, thereby increases environmental and health risks.Soil properties play a crucial role in the fate, behaviour anddispersion of chemical pesticides (Lewis et al., 2016) and hasbecome the repository of pesticides used in agriculture. It adsorbsmost pesticides and degradation products, which might negativelyaffect different food webs. Pesticides can ultimately reach tohumans (Zhang et al., 2006), and are thereby subject to bio-amplification (Alamdar et al., 2014). Pesticides get washed awayfrom soils by running water and thus find their way into watersources. Pesticides can also be emitted into the atmospherethrough volatilization (Sweetman et al., 2005), which adverselyaffect air (Bidleman and Leone, 2004) and surface water quality(Mekonen et al., 2016). Runoff and flooding are twomajor pathwaysof movement of pesticides that may lead to unintentional diffusionand non-target contamination (Wong et al., 2017) that can ulti-mately negatively affect human health. The concentration of pes-ticides tend to increase with soil depth (Zhang et al., 2006) andthus, the concentrations found in the bottom soil layer may in-crease underground water pollution (Sankararamakrishnan et al.,2005). Different levels of pesticides were reported across theglobe and have threatened humans and the environment (Sunet al., 2016; Houbraken et al., 2017). Along with analytical ap-proaches, such as GC-MS and LC-MS, concentrations of pesticidesare often estimated depending on their predicted environmentalconcentrations (PECs).
Farmers are exposed with pesticide-contaminated soils viadifferent pathways such as dermal contact, direct ingestion, andinhalation (Li, 2018). The increasing probability of humans todevelop cancer and non-cancer diseases as a result of such expo-sure was calculated by adopting USEPA standard models. Indicessuch as the hazard quotient (HQ) and the hazard index (HI) are usedglobally for health risk assessment and are mainly based on theconcentration of pesticides (Hu et al., 2014; Sun et al., 2016; Panet al., 2018). Likewise, risk of pesticides is often estimated basedon their predicted environmental concentrations (PECs) (Silva et al.,2019; Vasickova et al., 2019), however, studies on PEC in the riskassessment of pesticide use are limited in literature. Further,monitoring pesticide residues in soils and examining their potentialhealth risks is also scanty in Nepal. The application of hazardousinsecticides and fungicides is increasing in the areas of Nepal wherevegetables are cultivated for markets (Atreya et al., 2011; Bhandari
et al., 2018). More than 80% of the pesticides applied in Nepal areused in vegetable farming (Adhikari, 2017). Vegetable farming isbecoming increasingly more popular and is a good income optionfor farmers in Nepal. Adolescents and adults who work in thevegetable fields can be exposed to pesticides via different pathwayssuch as non-dietary ingestion, dermal exposure and soil particleinhalation. In other parts of the globe, there is a growing evidencesof human health risk due to pesticide use in agricultural (Ritz andYu, 2000; Schreinemachers, 2003; Samsel and Seneff, 2013;Shelton et al., 2014). The dietary risks from pesticide ingestion is atthe higher end, and thus considered unacceptable (Bhandari et al.,2019). In Nepal, studies have observed an emergence of highercancer and non-cancer risks associated with pesticide use (Yadavet al., 2016; PPDB, 2019). Hazardous pesticides that are bannedfor use in the EU (pesticides use status in bold, Table S1, Supple-mentary information) are still used in Nepal. In addition, a recentstudy (Bhandari et al., 2018) showed that persistent and toxicpesticides are frequently applied to vegetable fields. This combinedwith the fact that farmers in Nepal are less likely to follow safeworkpractices and do not have access to personal protective equipment,resulting the pesticides exposure risks even larger. This study thusconducted to analyze pesticide residues in the soil of vegetablefields, and to estimate potential health risk for humans due to non-dietary exposure to pesticides in soil.
2. Materials and methods
Supplementary information presents information in support ofthe materials and methods.
2.1. Study area
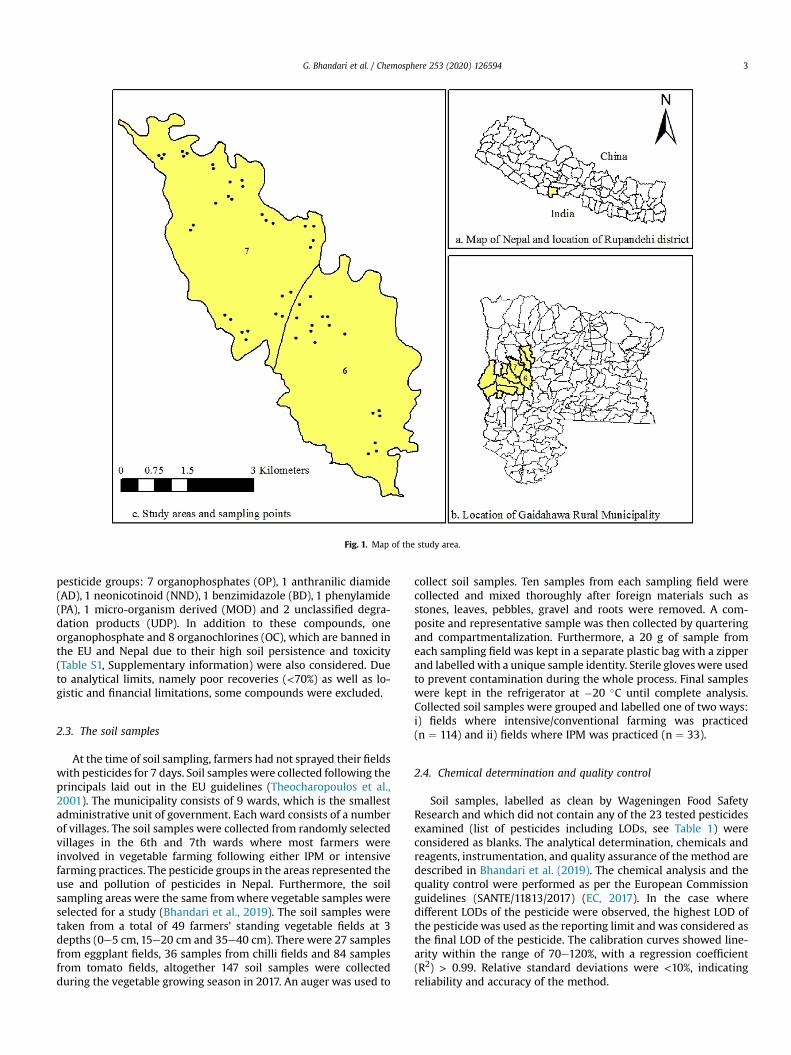
Gaidahawa Rural Municipality (GRM) (27� 35.4290 N and 83�
19.215’ E) of Nepal was selected for the study (Fig. 1). The area andpopulation of the municipality is 96.79 sq. km and 47,565,respectively. About eighty-one percent (approx. 7900 ha) of theland is agricultural. Themean annual rainfall is about 1400mm. Theland is flat and the soil consists mainly of silt, clay and sand. Thetemperature may reach 42.4 �C and 8.7 �C in summer and winter,respectively (GRM, 2018).
2.2. Farming practice and selection of pesticides
Bhandari et al. (2018) reported that farmers in the study areapractice commercial vegetable farming. They grow many types ofvegetables such as eggplant, chilli pepper, coriander, tomato, bean,onion, sponge gourd, pumpkin, broccoli, bitter gourd, fenugreek,cauliflower, spinach, okra, radish, cucumber, cabbage, fennel, bottlegourd, and pea. Application rate of pesticides differs by crops. A fewfarmers practice integrated pest management (IPM) techniques forcontrolling pests. IPM techniques included were the use of insecttraps, animal dung and urine, ash, alcohol, and tobacco. The exist-ing farming system is heavily dependent on the application ofchemical pesticides at significantly higher than recommendeddoses, however IPM fields were less likely to receive high amount ofchemical pesticides. The frequency of applications is also higherthan recommended, indicating poor agricultural practices. Farmersuse 30 L lever-operated Knapsack sprayers. Of all the pesticidesused, the general trend in application rate (kg ha�1) of top fivepesticides was:mancozeb > dichlorvos > chlorpyrifos > profenofos > triazophos(Bhandari et al., 2018). Farmers even apply these pesticides ascocktails.
The present study accounted commonly used following
Fig. 1. Map of the study area.
G. Bhandari et al. / Chemosphere 253 (2020) 126594 3
pesticide groups: 7 organophosphates (OP), 1 anthranilic diamide(AD), 1 neonicotinoid (NND), 1 benzimidazole (BD), 1 phenylamide(PA), 1 micro-organism derived (MOD) and 2 unclassified degra-dation products (UDP). In addition to these compounds, oneorganophosphate and 8 organochlorines (OC), which are banned inthe EU and Nepal due to their high soil persistence and toxicity(Table S1, Supplementary information) were also considered. Dueto analytical limits, namely poor recoveries (<70%) as well as lo-gistic and financial limitations, some compounds were excluded.
2.3. The soil samples
At the time of soil sampling, farmers had not sprayed their fieldswith pesticides for 7 days. Soil samples were collected following theprincipals laid out in the EU guidelines (Theocharopoulos et al.,2001). The municipality consists of 9 wards, which is the smallestadministrative unit of government. Each ward consists of a numberof villages. The soil samples were collected from randomly selectedvillages in the 6th and 7th wards where most farmers wereinvolved in vegetable farming following either IPM or intensivefarming practices. The pesticide groups in the areas represented theuse and pollution of pesticides in Nepal. Furthermore, the soilsampling areas were the same fromwhere vegetable samples wereselected for a study (Bhandari et al., 2019). The soil samples weretaken from a total of 49 farmers’ standing vegetable fields at 3depths (0e5 cm, 15e20 cm and 35e40 cm). There were 27 samplesfrom eggplant fields, 36 samples from chilli fields and 84 samplesfrom tomato fields, altogether 147 soil samples were collectedduring the vegetable growing season in 2017. An auger was used to
collect soil samples. Ten samples from each sampling field werecollected and mixed thoroughly after foreign materials such asstones, leaves, pebbles, gravel and roots were removed. A com-posite and representative sample was then collected by quarteringand compartmentalization. Furthermore, a 20 g of sample fromeach sampling field was kept in a separate plastic bag with a zipperand labelledwith a unique sample identity. Sterile gloveswere usedto prevent contamination during the whole process. Final sampleswere kept in the refrigerator at �20 �C until complete analysis.Collected soil samples were grouped and labelled one of two ways:i) fields where intensive/conventional farming was practiced(n ¼ 114) and ii) fields where IPM was practiced (n ¼ 33).
2.4. Chemical determination and quality control
Soil samples, labelled as clean by Wageningen Food SafetyResearch and which did not contain any of the 23 tested pesticidesexamined (list of pesticides including LODs, see Table 1) wereconsidered as blanks. The analytical determination, chemicals andreagents, instrumentation, and quality assurance of the method aredescribed in Bhandari et al. (2019). The chemical analysis and thequality control were performed as per the European Commissionguidelines (SANTE/11813/2017) (EC, 2017). In the case wheredifferent LODs of the pesticide were observed, the highest LOD ofthe pesticide was used as the reporting limit and was considered asthe final LOD of the pesticide. The calibration curves showed line-arity within the range of 70e120%, with a regression coefficient(R2) > 0.99. Relative standard deviations were <10%, indicatingreliability and accuracy of the method.
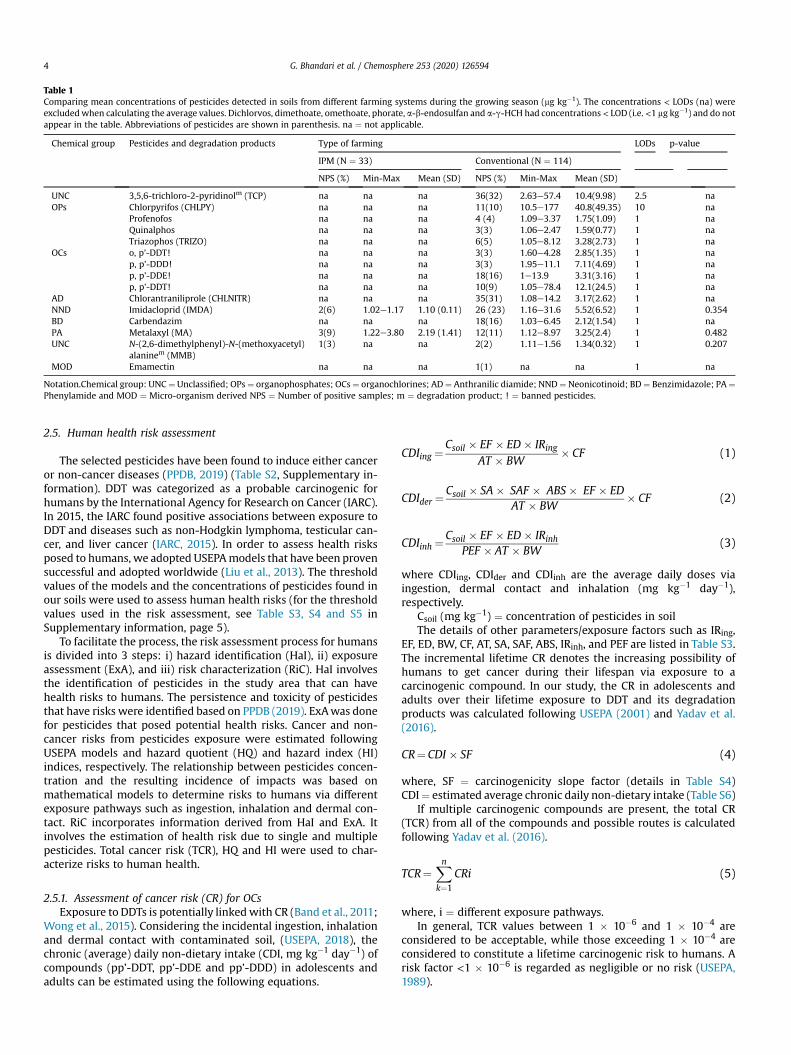
Table 1Comparing mean concentrations of pesticides detected in soils from different farming systems during the growing season (mg kg�1). The concentrations < LODs (na) wereexcludedwhen calculating the average values. Dichlorvos, dimethoate, omethoate, phorate, a-b-endosulfan and a-g-HCH had concentrations< LOD (i.e. <1 mg kg�1) and do notappear in the table. Abbreviations of pesticides are shown in parenthesis. na ¼ not applicable.
Chemical group Pesticides and degradation products Type of farming LODs p-value
IPM (N ¼ 33) Conventional (N ¼ 114)
NPS (%) Min-Max Mean (SD) NPS (%) Min-Max Mean (SD)
UNC 3,5,6-trichloro-2-pyridinolm (TCP) na na na 36(32) 2.63e57.4 10.4(9.98) 2.5 naOPs Chlorpyrifos (CHLPY) na na na 11(10) 10.5e177 40.8(49.35) 10 na
Profenofos na na na 4 (4) 1.09e3.37 1.75(1.09) 1 naQuinalphos na na na 3(3) 1.06e2.47 1.59(0.77) 1 naTriazophos (TRIZO) na na na 6(5) 1.05e8.12 3.28(2.73) 1 na
OCs o, p’-DDT! na na na 3(3) 1.60e4.28 2.85(1.35) 1 nap, p’-DDD! na na na 3(3) 1.95e11.1 7.11(4.69) 1 nap, p’-DDE! na na na 18(16) 1e13.9 3.31(3.16) 1 nap, p’-DDT! na na na 10(9) 1.05e78.4 12.1(24.5) 1 na
AD Chlorantraniliprole (CHLNITR) na na na 35(31) 1.08e14.2 3.17(2.62) 1 naNND Imidacloprid (IMDA) 2(6) 1.02e1.17 1.10 (0.11) 26 (23) 1.16e31.6 5.52(6.52) 1 0.354BD Carbendazim na na na 18(16) 1.03e6.45 2.12(1.54) 1 naPA Metalaxyl (MA) 3(9) 1.22e3.80 2.19 (1.41) 12(11) 1.12e8.97 3.25(2.4) 1 0.482UNC N-(2,6-dimethylphenyl)-N-(methoxyacetyl)
alaninem (MMB)1(3) na na 2(2) 1.11e1.56 1.34(0.32) 1 0.207
MOD Emamectin na na na 1(1) na na 1 na
Notation.Chemical group: UNC¼ Unclassified; OPs¼ organophosphates; OCs¼ organochlorines; AD¼ Anthranilic diamide; NND¼ Neonicotinoid; BD¼ Benzimidazole; PA¼Phenylamide and MOD ¼ Micro-organism derived NPS ¼ Number of positive samples; m ¼ degradation product; ! ¼ banned pesticides.
G. Bhandari et al. / Chemosphere 253 (2020) 1265944
2.5. Human health risk assessment
The selected pesticides have been found to induce either canceror non-cancer diseases (PPDB, 2019) (Table S2, Supplementary in-formation). DDT was categorized as a probable carcinogenic forhumans by the International Agency for Research on Cancer (IARC).In 2015, the IARC found positive associations between exposure toDDT and diseases such as non-Hodgkin lymphoma, testicular can-cer, and liver cancer (IARC, 2015). In order to assess health risksposed to humans, we adopted USEPAmodels that have been provensuccessful and adopted worldwide (Liu et al., 2013). The thresholdvalues of the models and the concentrations of pesticides found inour soils were used to assess human health risks (for the thresholdvalues used in the risk assessment, see Table S3, S4 and S5 inSupplementary information, page 5).
To facilitate the process, the risk assessment process for humansis divided into 3 steps: i) hazard identification (HaI), ii) exposureassessment (ExA), and iii) risk characterization (RiC). HaI involvesthe identification of pesticides in the study area that can havehealth risks to humans. The persistence and toxicity of pesticidesthat have risks were identified based on PPDB (2019). ExAwas donefor pesticides that posed potential health risks. Cancer and non-cancer risks from pesticides exposure were estimated followingUSEPA models and hazard quotient (HQ) and hazard index (HI)indices, respectively. The relationship between pesticides concen-tration and the resulting incidence of impacts was based onmathematical models to determine risks to humans via differentexposure pathways such as ingestion, inhalation and dermal con-tact. RiC incorporates information derived from HaI and ExA. Itinvolves the estimation of health risk due to single and multiplepesticides. Total cancer risk (TCR), HQ and HI were used to char-acterize risks to human health.
2.5.1. Assessment of cancer risk (CR) for OCsExposure to DDTs is potentially linkedwith CR (Band et al., 2011;
Wong et al., 2015). Considering the incidental ingestion, inhalationand dermal contact with contaminated soil, (USEPA, 2018), thechronic (average) daily non-dietary intake (CDI, mg kg�1 day�1) ofcompounds (pp’-DDT, pp’-DDE and pp’-DDD) in adolescents andadults can be estimated using the following equations.
CDIing ¼Csoil � EF � ED� IRing
AT � BW� CF (1)
CDIder ¼Csoil � SA� SAF � ABS� EF � ED
AT � BW� CF (2)
CDIinh ¼Csoil � EF � ED� IRinh
PEF � AT � BW(3)
where CDIing, CDIder and CDIinh are the average daily doses viaingestion, dermal contact and inhalation (mg kg�1 day�1),respectively.
Csoil (mg kg�1) ¼ concentration of pesticides in soilThe details of other parameters/exposure factors such as IRing,
EF, ED, BW, CF, AT, SA, SAF, ABS, IRinh, and PEF are listed in Table S3.The incremental lifetime CR denotes the increasing possibility ofhumans to get cancer during their lifespan via exposure to acarcinogenic compound. In our study, the CR in adolescents andadults over their lifetime exposure to DDT and its degradationproducts was calculated following USEPA (2001) and Yadav et al.(2016).
CR¼CDI � SF (4)
where, SF ¼ carcinogenicity slope factor (details in Table S4)CDI¼ estimated average chronic daily non-dietary intake (Table S6)
If multiple carcinogenic compounds are present, the total CR(TCR) from all of the compounds and possible routes is calculatedfollowing Yadav et al. (2016).
TCR¼Xn
k¼1
CRi (5)
where, i ¼ different exposure pathways.In general, TCR values between 1 � 10�6 and 1 � 10�4 are
considered to be acceptable, while those exceeding 1 � 10�4 areconsidered to constitute a lifetime carcinogenic risk to humans. Arisk factor <1 � 10�6 is regarded as negligible or no risk (USEPA,1989).
G. Bhandari et al. / Chemosphere 253 (2020) 126594 5
2.5.2. Assessment of non-cancer risk (NCR)The NCRwas calculated following USEPA (2019), which was also
adopted in a past study (Pan et al., 2018). The NCR for the pesticidesof interest for a specific exposure route can be expressed as HazardQuotient (HQ). HQ of a pesticide is the ratio of CDI, and RfD(reference dose) of the pesticide.
HQ ¼CDIRfD
(6)
The total NCR of pesticides belonging to OPs via two primaryroutes such as soil ingestion and dermal contact can be denoted asHI, which was estimated by following Equation (7).
day�1) ¼ daily maximum permissible concentration of OPs,including the reference doses for exposures such as ingestion(RfDing) and dermal contact (RfDder). The RfDing ¼ RfD andRfDder ¼ RfD x ABSGI. ABSGI is the gastrointestinal absorption factor(dimensionless). Pesticides belonging to OPs have their commonmode of action (Table S1), therefore HI was estimated for only theOPs.
The details of parameters such as RfD and ABSGI used in NCRassessment are listed in Table S5. HQ or HI greater than one showspotential NCR, while HQ or HI � 1 means negligible or no risk. Ourstudy could not estimate the potential NCR via inhalation becausereference concentration (RfC) values for the pesticides of interestwere not available in the PPDB (2019).
2.6. Predicted environmental concentration (PEC)
PEC is an indicator of the expected pesticide concentrations insoil, taking into account the default values (Ockleford et al., 2017).The PEC was estimated with the default values (otherwise stated)using Equations (8)e(12). For multiple applications of chemicalpesticides, the maximum time-weighted average (TWA) concen-trations for exposure days of 1, 2, 4, 7, 14, 28, 50, and 100 wereestimated using a moving time-frame (MTF) Excel spreadsheet. Fora given exposure period, the spreadsheet calculates the TWA con-centrations for period starting times ranging from day of firstapplication to day of last application (MTF), and scans for thehighest value (EC, 2004).
PECs; ini ¼Að1� fitnÞ
100 DEPTHSoilbdSoil(8)
PECs;act ¼ PECs;inie�ksoilt (9)
PECs;twa ¼ PECs;inið1� e�ksoiltÞ
ksoilt(10)
PCECs;ini;n ¼PECs;ini;1ð1� e�nksoiliÞ
ð1� e�ksoiliÞ (11)
PECs;act;n ¼ PECs;int;ne�ksoil t (12)
where, A ¼ application rate (g/ha); fint ¼ fraction intercepted bycrop cover; DEPTHsoil ¼ depth of soil (cm); bdsoil ¼ bulk density ofsoil (g cm�3); PECs;ini;1 ¼ initial PECs after one application;n ¼ number of applications; i ¼ application interval (d); ksoil ¼
degradation rate in soil (d�1) ¼ ln(2)/half-life.PECs of pesticides are estimated for the different farms at three
different time points (after pesticide application) for each pesticideprediction: the initial PECs (immediately), the short-term PECs(1e4 days) and the long-term PECs (7e100 days). Since the farmersin our study hadn’t applied pesticides for a week prior to our firstsample measurement, predicted concentrations (PECs,act,7 days after
pesticide application) of pesticides would be suitable for makingpossible comparisons with their measured environmental con-centrations (MECs). Likewise, since farmers followed poor agri-cultural practices, we used the initial PECs of pesticides in order tocompare measurements with the international guidelines of soilquality standard. All the tested pesticides had a 90% degradationtime under a year, thus the background concentrations and thePECs that accumulated were not considered in this study. Humanhealth risk (HR) was evaluated by comparing the PECs of the pes-ticides in soils with international guidelines of soil quality such aspesticide soil regulatory guidance values (PSRGVs), the maximumconcentrations of pesticides present in soil without hampering theenvironmental balance (Li and Jennings, 2017) and Chinese SoilQuality Standard (GB 15618e2018) (MoEP, 2018). Past studies(Wang, 2007; Qu et al., 2015) also followed similar methods for theevaluation of the health risk.
2.7. Statistical analysis
The data analysis was performed using Canoco 5 and SPSS 23. Toavoid underestimating soil concentrations of pesticides, onlypesticide residue concentrations � LODs were considered in dataanalysis. Concentrations below the LOD were not included in theanalysis (Sun et al., 2016). The normality of the data was tested bythe KolmogoroveSmirnov test. In the cases of normal distribution,a one-way ANOVA was used to compare the number of pesticideresidues and the total pesticide concentrations in soil betweenconventional and IPM farming practices, vegetable farms (eggplant,chilli and tomato), and three depths of soil. In case of significanteffects at the 95% confidence level (p < 0.05), the Bonferroni posthoc test was conducted. Principal component analysis (PCA) andPearson correlation coefficients were used to study relationshipsbetween the pesticide concentrations and the pesticide properties.
3. Results
3.1. Number of pesticides in soil
Pesticide residues analysis in soils revealed the presence of avariety of pesticide combinations. Thirty-nine pesticide combina-tions were detected in soils. One single pesticide residue wasdetected in 25% of the soil samples, while multiple residues werepresent in 35% of the soil samples (Fig. 2A). The number of residuesvaried significantly with soil depths, vegetable fields, and farmingpractices (Fig. 2B). Pesticide residues were found less frequently inthe depth 35e40 cm and more frequently in the top soil (0e5 cm)(p ¼ 0.001). A large number of pesticide residues (up to 7 residues)was detected in 2% of the tested top soils.
The number of pesticide residues detected in soils from eggplantfields was significantly lower than tomato fields (p¼ 0.025; Fig. 2B).Seventy-three percent of soil samples from tomato fields and half ofthe soil samples from chilli fields contained detectable pesticideresidues.
Soils from IPM fields had a significantly smaller number ofobserved pesticide residues > LOD than the soils from conventionalfields (p < 0.01; Fig. 2B and LODs in Table 1). Only fifteen percent ofthe soil samples from the IPM fields contained detectable pesticideresidues. On the other hand, about seventy-three percent of soil
Fig. 2. Number of residues of different pesticides and their degradation products at different soil depths and the percentage of soil samples (A); and box plots for comparison ofmean number of residues at different soil depths detected in different vegetable fields of two farming types and the p-values (B).
G. Bhandari et al. / Chemosphere 253 (2020) 1265946
samples from the conventional fields contained detectable residuesof pesticides.
The concentrations of residues of dichlorvos, dimethoate,omethoate, phorate, a-b-endosulfan and a-g-HCH were < LOD anddo not appear in Fig. 3A.
3.2. Types of pesticide residues and their combinations
Fifteen different pesticide residues (approximately 65% of thetested pesticides) were observed in the soils (Table 1). Residues ofdichlorvos, dimethoate, omethoate, phorate, a-g-HCH and a-b-endosulfan were below LOD (<1 mg kg�1). The six most commonpesticide mixtures (for abbreviations of pesticides, see Table 1)detected in soils were:
Chlorantraniliprole and imidacloprid residues were the mostprominent with 11% and 5% of the total soil samples with detectableresidue levels, respectively, and found frequently at the soil depth15e20 cm. The most common pesticide, CHLNITR, was found in 17%of the soil samples from tomato fields. In IPM fields, most soilsamples (85%) were residues free however, residues of MA, IMDA,and MA þ MMB were detected.
Of all the detected pesticides in our samples, about 60% of thepesticides were non-persistent or moderately persistent com-pounds. Persistent and very persistent compounds representedabout 13% and 27% of the detected pesticides, respectively. Four ofthe compounds such as o,p’-p,p’-DDTs; p,p’-DDE and p,p’-DDD,detected in soils were degradation products of active substancesthat are currently banned in Nepal. Overall, eight percent of thesoils contained quantifiable residues of DDT and its degradationproducts.
Fig. 3. Distribution of pesticide concentrations and pesticide degradation products in soils (A); and box plots for comparison of mean concentration of pesticide residues at differentsoil depths detected in different vegetable fields of two farming types and the p-values (B).
G. Bhandari et al. / Chemosphere 253 (2020) 126594 7
3.3. Hazard identification
Our study found 4 organophosphates (chlorpyrifos, profenofos,quinalphos and triazophos), 4 organochlorines (o,p’-DDT, p,p’-DDT,
G. Bhandari et al. / Chemosphere 253 (2020) 1265948
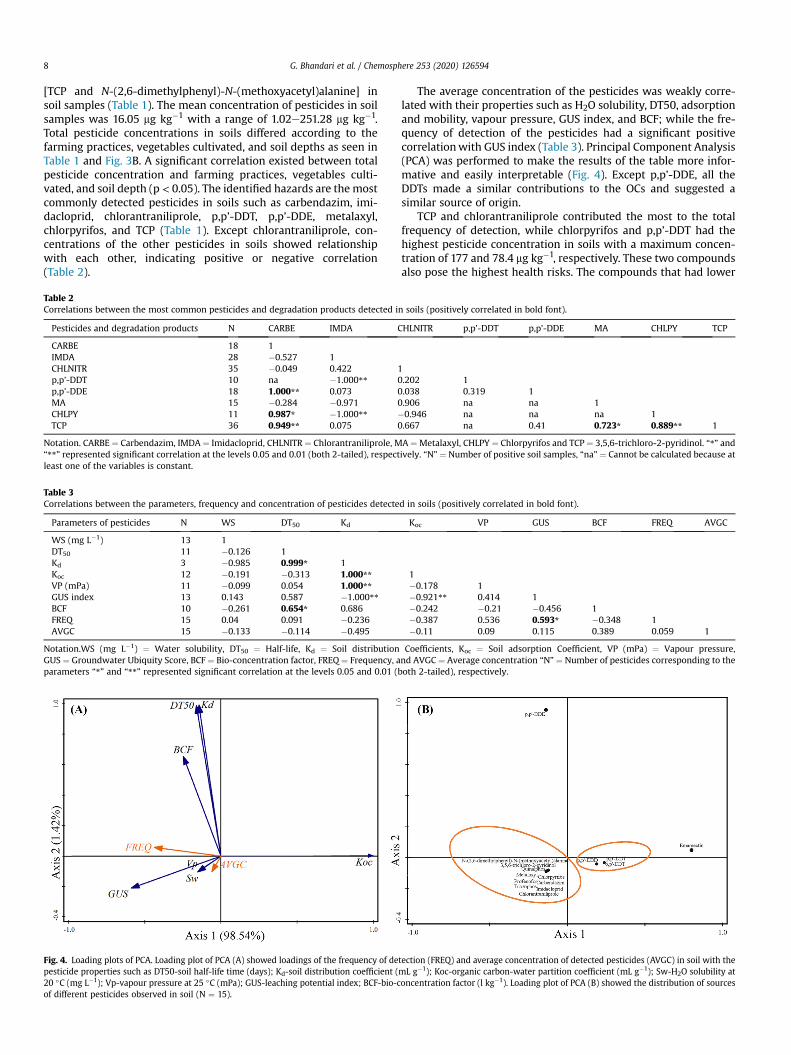
[TCP and N-(2,6-dimethylphenyl)-N-(methoxyacetyl)alanine] insoil samples (Table 1). The mean concentration of pesticides in soilsamples was 16.05 mg kg�1 with a range of 1.02e251.28 mg kg�1.Total pesticide concentrations in soils differed according to thefarming practices, vegetables cultivated, and soil depths as seen inTable 1 and Fig. 3B. A significant correlation existed between totalpesticide concentration and farming practices, vegetables culti-vated, and soil depth (p < 0.05). The identified hazards are the mostcommonly detected pesticides in soils such as carbendazim, imi-dacloprid, chlorantraniliprole, p,p’-DDT, p,p’-DDE, metalaxyl,chlorpyrifos, and TCP (Table 1). Except chlorantraniliprole, con-centrations of the other pesticides in soils showed relationshipwith each other, indicating positive or negative correlation(Table 2).
Table 3Correlations between the parameters, frequency and concentration of pesticides detecte
Notation.WS (mg L�1) ¼ Water solubility, DT50 ¼ Half-life, Kd ¼ Soil distributionGUS ¼ Groundwater Ubiquity Score, BCF ¼ Bio-concentration factor, FREQ ¼ Frequency, aparameters “*” and “**” represented significant correlation at the levels 0.05 and 0.01 (b
Fig. 4. Loading plots of PCA. Loading plot of PCA (A) showed loadings of the frequency of depesticide properties such as DT50-soil half-life time (days); Kd-soil distribution coefficient (20 �C (mg L�1); Vp-vapour pressure at 25 �C (mPa); GUS-leaching potential index; BCF-bio-cof different pesticides observed in soil (N ¼ 15).
Table 2Correlations between the most common pesticides and degradation products detected i
Pesticides and degradation products N CARBE IMDA C
Notation. CARBE ¼ Carbendazim, IMDA ¼ Imidacloprid, CHLNITR ¼ Chlorantraniliprole, M“**” represented significant correlation at the levels 0.05 and 0.01 (both 2-tailed), respectleast one of the variables is constant.
The average concentration of the pesticides was weakly corre-lated with their properties such as H2O solubility, DT50, adsorptionand mobility, vapour pressure, GUS index, and BCF; while the fre-quency of detection of the pesticides had a significant positivecorrelationwith GUS index (Table 3). Principal Component Analysis(PCA) was performed to make the results of the table more infor-mative and easily interpretable (Fig. 4). Except p,p’-DDE, all theDDTs made a similar contributions to the OCs and suggested asimilar source of origin.
TCP and chlorantraniliprole contributed the most to the totalfrequency of detection, while chlorpyrifos and p,p’-DDT had thehighest pesticide concentration in soils with a maximum concen-tration of 177 and 78.4 mg kg�1, respectively. These two compoundsalso pose the highest health risks. The compounds that had lower
Coefficients, Koc ¼ Soil adsorption Coefficient, VP (mPa) ¼ Vapour pressure,nd AVGC ¼ Average concentration “N” ¼ Number of pesticides corresponding to theoth 2-tailed), respectively.
tection (FREQ) and average concentration of detected pesticides (AVGC) in soil with themL g�1); Koc-organic carbon-water partition coefficient (mL g�1); Sw-H2O solubility atoncentration factor (l kg�1). Loading plot of PCA (B) showed the distribution of sources
n soils (positively correlated in bold font).
HLNITR p,p’-DDT p,p’-DDE MA CHLPY TCP
.202 1
.038 0.319 1
.906 na na 10.946 na na na 1.667 na 0.41 0.723* 0.889** 1
A ¼Metalaxyl, CHLPY ¼ Chlorpyrifos and TCP ¼ 3,5,6-trichloro-2-pyridinol. “*” andively. “N” ¼ Number of positive soil samples, “na” ¼ Cannot be calculated because at
G. Bhandari et al. / Chemosphere 253 (2020) 126594 9
concentrations such as carbendazim and p,p’-DDE were compara-ble to those of metalaxyl and chlorantraniliprole, respectively. Forall the DDTs, the concentration of p,p’-DDT (40 mg kg�1) and p,p’-DDD (11.1 mg kg�1) was higher in the depth 35e40 cm. Likewise, theconcentration of p,p’-DDE (5.70 mg kg�1) and o,p’-DDT(4.28 mg kg�1) was higher in the depth 15e20 cm.
Predicted concentrations (PECs,act,7 days after pesticide application) ofpesticides in soils from tomato, eggplant and chilli farms are pre-sented in the Supplementary information, Table S7. PECs,act,7 ofmost of the pesticides were much higher than their measuredenvironmental concentrations (MECs). Carbendazim, dichlorvos,imidacloprid and profenofos showed higher initial PECs of pesti-cides than their global pesticide soil regulatory guidance maximumvalues, indicating that farmers might be at greater risks from thepesticides (Table S7 and Table S8).
3.4. Exposure assessment for farm workers
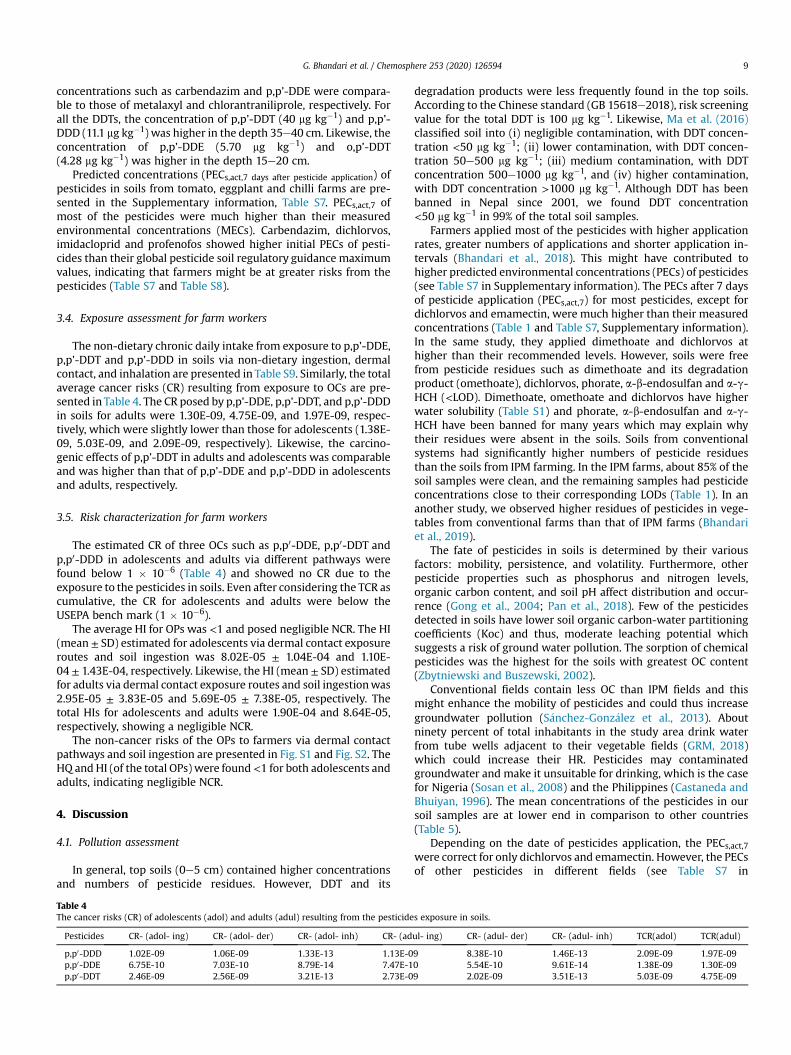
The non-dietary chronic daily intake from exposure to p,p’-DDE,p,p’-DDT and p,p’-DDD in soils via non-dietary ingestion, dermalcontact, and inhalation are presented in Table S9. Similarly, the totalaverage cancer risks (CR) resulting from exposure to OCs are pre-sented in Table 4. The CR posed by p,p’-DDE, p,p’-DDT, and p,p’-DDDin soils for adults were 1.30E-09, 4.75E-09, and 1.97E-09, respec-tively, which were slightly lower than those for adolescents (1.38E-09, 5.03E-09, and 2.09E-09, respectively). Likewise, the carcino-genic effects of p,p’-DDT in adults and adolescents was comparableand was higher than that of p,p’-DDE and p,p’-DDD in adolescentsand adults, respectively.
3.5. Risk characterization for farm workers
The estimated CR of three OCs such as p,p0-DDE, p,p0-DDT andp,p0-DDD in adolescents and adults via different pathways werefound below 1 � 10�6 (Table 4) and showed no CR due to theexposure to the pesticides in soils. Even after considering the TCR ascumulative, the CR for adolescents and adults were below theUSEPA bench mark (1 � 10�6).
The average HI for OPs was <1 and posed negligible NCR. The HI(mean ± SD) estimated for adolescents via dermal contact exposureroutes and soil ingestion was 8.02E-05 ± 1.04E-04 and 1.10E-04 ± 1.43E-04, respectively. Likewise, the HI (mean ± SD) estimatedfor adults via dermal contact exposure routes and soil ingestionwas2.95E-05 ± 3.83E-05 and 5.69E-05 ± 7.38E-05, respectively. Thetotal HIs for adolescents and adults were 1.90E-04 and 8.64E-05,respectively, showing a negligible NCR.
The non-cancer risks of the OPs to farmers via dermal contactpathways and soil ingestion are presented in Fig. S1 and Fig. S2. TheHQ and HI (of the total OPs) were found <1 for both adolescents andadults, indicating negligible NCR.
4. Discussion
4.1. Pollution assessment
In general, top soils (0e5 cm) contained higher concentrationsand numbers of pesticide residues. However, DDT and its
Table 4The cancer risks (CR) of adolescents (adol) and adults (adul) resulting from the pesticide
degradation products were less frequently found in the top soils.According to the Chinese standard (GB 15618e2018), risk screeningvalue for the total DDT is 100 mg kg�1. Likewise, Ma et al. (2016)classified soil into (i) negligible contamination, with DDT concen-tration <50 mg kg�1; (ii) lower contamination, with DDT concen-tration 50e500 mg kg�1; (iii) medium contamination, with DDTconcentration 500e1000 mg kg�1, and (iv) higher contamination,with DDT concentration >1000 mg kg�1. Although DDT has beenbanned in Nepal since 2001, we found DDT concentration<50 mg kg�1 in 99% of the total soil samples.
Farmers applied most of the pesticides with higher applicationrates, greater numbers of applications and shorter application in-tervals (Bhandari et al., 2018). This might have contributed tohigher predicted environmental concentrations (PECs) of pesticides(see Table S7 in Supplementary information). The PECs after 7 daysof pesticide application (PECs,act,7) for most pesticides, except fordichlorvos and emamectin, were much higher than their measuredconcentrations (Table 1 and Table S7, Supplementary information).In the same study, they applied dimethoate and dichlorvos athigher than their recommended levels. However, soils were freefrom pesticide residues such as dimethoate and its degradationproduct (omethoate), dichlorvos, phorate, a-b-endosulfan and a-g-HCH (<LOD). Dimethoate, omethoate and dichlorvos have higherwater solubility (Table S1) and phorate, a-b-endosulfan and a-g-HCH have been banned for many years which may explain whytheir residues were absent in the soils. Soils from conventionalsystems had significantly higher numbers of pesticide residuesthan the soils from IPM farming. In the IPM farms, about 85% of thesoil samples were clean, and the remaining samples had pesticideconcentrations close to their corresponding LODs (Table 1). In ananother study, we observed higher residues of pesticides in vege-tables from conventional farms than that of IPM farms (Bhandariet al., 2019).
The fate of pesticides in soils is determined by their variousfactors: mobility, persistence, and volatility. Furthermore, otherpesticide properties such as phosphorus and nitrogen levels,organic carbon content, and soil pH affect distribution and occur-rence (Gong et al., 2004; Pan et al., 2018). Few of the pesticidesdetected in soils have lower soil organic carbon-water partitioningcoefficients (Koc) and thus, moderate leaching potential whichsuggests a risk of ground water pollution. The sorption of chemicalpesticides was the highest for the soils with greatest OC content(Zbytniewski and Buszewski, 2002).
Conventional fields contain less OC than IPM fields and thismight enhance the mobility of pesticides and could thus increasegroundwater pollution (S�anchez-Gonz�alez et al., 2013). Aboutninety percent of total inhabitants in the study area drink waterfrom tube wells adjacent to their vegetable fields (GRM, 2018)which could increase their HR. Pesticides may contaminatedgroundwater and make it unsuitable for drinking, which is the casefor Nigeria (Sosan et al., 2008) and the Philippines (Castaneda andBhuiyan, 1996). The mean concentrations of the pesticides in oursoil samples are at lower end in comparison to other countries(Table 5).
Depending on the date of pesticides application, the PECs,act,7were correct for only dichlorvos and emamectin. However, the PECsof other pesticides in different fields (see Table S7 in
Table 5Comparison of pesticide levels in soils from conventional farming in this study with past studies across the globe. To find the relevant literature, Web of Science database wasconsidered by using the search phrase pesticide and soil and *concentration*. Hyphens indicate that no information was available. Pesticides concentration in mg kg�1. Themean concentration of the most pesticides in this study is lower than the other studies abroad.
PesticidesAbroad Nepalese agricultural soil
Place, country/land use/mean concentration Reference Mean concentration(this study)
3,5,6-trichloro�2-pyridinol e e 10.4Chlorpyrifos Okara, Pakistan/cotton, wheat/1393 Rafique et al. (2016) 40.8
China/persimmons and jujubes/17.15 Liu et al. (2016)China/nuts/42.2 Han et al. (2017)Dormaa West, Ghana/cocoa/30 (Fosu-Mensah et al., 2016)
Profenofos Okara, Pakistan/cotton, wheat/89.79 Rafique et al. (2016) 1.75Dormaa West, Ghana/cocoa/30 (Fosu-Mensah et al., 2016)
Quinalphos e e 1.59Triazophos Okara, Pakistan/cotton, wheat/99.74 Rafique et al. (2016) 3.28o,p0-DDT Nagaon, India/paddy fields, tea gardens and others/150 Mishra et al. (2012) 2.85
Hong Kong/different types of land use/0.05 Zhang et al. (2006)Shanghai, China/agriculture/1.66 Jiang et al. (2009)Beijing, China/school yards/42.38 Wang et al. (2008)Moldavia, Romania/forest/0.7 Tarcau et al. (2013)
p,p0-DDD Limuru, Kenya/rural and semi urban areas/1.71 Sun et al. (2016) 7.11Nagaon, India/paddy fields, tea gardens and others/73 Mishra et al. (2012)Hong Kong/farmland/0.05 Zhang et al. (2006)Shanghai, China/agriculture/4.56 Jiang et al. (2009)Beijing, China/school yards/6.47 Wang et al. (2008)Moldavia, Romania/forest/1.2 Tarcau et al. (2013)
p,p0-DDE Limuru, Kenya/rural and semi urban areas/0.97 Sun et al. (2016) 3.31Nagaon, India/paddy fields, tea gardens and others/276 Mishra et al. (2012)Hong Kong/farmland/1.73 Zhang et al. (2006)Shanghai, China/agriculture/16.14 Jiang et al. (2009)Beijing, China/school yards/27.29 Wang et al. (2008)Moldavia, Romania/forest/10 Tarcau et al. (2013)
p,p0-DDT Limuru, Kenya/rural and semi urban areas/11.76 Sun et al. (2016) 12.1Nagaon, India/paddy fields, tea gardens and others/351 Mishra et al. (2012)Hong Kong/farmland/0.02 Zhang et al. (2006)Shanghai, China/agriculture/3.26 Jiang et al. (2009)Beijing, China/school yards/17.54 Wang et al. (2008)Moldavia, Romania/forest/8.1 Tarcau et al. (2013)
Chlorantraniliprole e e 3.17Imidacloprid Okara, Pakistan/cotton, wheat/548.7 Rafique et al. (2016) 5.52Carbendazim Basrah, Iraq/agricultural soil/1259 Raheem et al. (2017) 2.12Metalaxyl Spain/agricultural areas/3.82 S�anchez-Gonz�alez et al. (2013) 3.25N-(2,6-dimethylphenyl)-N-
(methoxyacetyl)alanine- - 1.34
Emamectin e e e
G. Bhandari et al. / Chemosphere 253 (2020) 12659410
Supplementary information) were much higher than their MECs(measured environmental concentrations or the mean concentra-tion) (Table 1) and pesticide soil regulatory guidance values(Table S8, Supplementary information). The farmers’ pesticide usebehaviours such as the application rates were self-reported andobserved higher than recommended (Bhandari et al., 2018). Thedifferences between MECs and PECs are several orders of magni-tude that might be due to the estimation of PECs from the realisticworst-case scenario. Since PSRGVs might be risk-based, the valuescould more accurately reflect the potential environmental andhealth risks which are worth consideration. In addition, immediatepredicted environmental concentrations (PECs,act,0) of contami-nated soils and their effects on human health should not beneglected.
Our predicted environmental concentration in soil (PECs) fordimethoate on tomato after multiple applications was much higherthan their respective values in the draft assessment report (DAR) ofthe European Commission (EC, 2004). The possible reason forhigher PECs for dimethoate might be due to the fact that thepesticide was applied at level higher than its recommended dose(Bhandari et al., 2018). Likewise, the PECs for other pesticides fromeggplant and chilli farms could not be compared due to unavail-ability of their DARs.
4.2. Source identification of DDT
DDT is a mixture of its degradation products: 15% o,p’-DDT and85% p,p’-DDT (Zheng et al., 2009), and the half-life has been esti-mated >15 years in the environment. Parent DDT disintegrates toDDE and DDD, more stable compounds than their parent. The ratioo,p’-DDT/p,p’-DDT is used to differentiate dicofol from DDT. Theratio between 0.2 and 0.3 corresponds to the occurrence of tech-nical DDT, while the ratio between 1.9 and 9.3 or higher corre-sponds to the presence of dicofol (Qiu et al., 2005). In our study, theratio ranged between 0.03 and 0.17, except in one sample, signi-fying the application of technical DDT. One sample showed the ratiocomparatively higher which corresponds with dicofol use in thearea. The ratio (p,p’-DDE þ p,p’-DDD)/p,p’-DDT assesses the timeand degree of disintegration of p,p’-DDT in soil (Qiu et al., 2004).Ratios greater than one indicate aged mixtures, while ratios <1indicate fresh applications of the parent DDT in soil. In our study,the ratios ranged from 0.21 to 2.20. The ratio was less than one intwo samples, specifying the ongoing use of DDT and the ratio was>1 in another sample, indicating its historical use (Dhimal et al.,2014). The current use of DDT might be due to conventionalfarming and/or expansion of diseases such as malaria fever anddengue (Shah et al., 2012; Awasthi et al., 2017). Similar findingshave been reported from other regions of Nepal (Yadav et al., 2016;
G. Bhandari et al. / Chemosphere 253 (2020) 126594 11
Yadav et al., 2017). Potential source analysis indicated that DDT andrelated compounds mainly originated from a recently applied DDT,possibly due to: (i) the illegal entry due to the porous India-Nepalborder; (ii) inadequate execution of the ban and/or (iii) applica-tion of DDT for dengue control.
DDT disintegrates to DDD from anaerobic degradations while itchanges to DDE from aerobic degradations. The ratio DDD/DDEindicates whether DDT is degraded aerobically or anaerobically. Inour study, the ratio DDD/DDE ranged from 0.30 to 2. The ratio wasless than one in a higher number of samples, indicating higherpercentages of DDE than DDD and thus, DDT was aerobicallydegraded. Our results were different from those in soils from China(Ma et al., 2016), where the ratio was >1 in a higher number ofsamples, indicating higher percentages of DDD than DDE and thus,DDT was anaerobically degraded. The disintegration of DDT-DDE-DDD can occur directly or indirectly (Wenzel et al., 2002). The ra-tios of DDE:DDT, DDD:DDE, and DDD:DDT decide dechlorinationpaths in soils. DDT to DDEwas themajor disintegration route, as theratios were: DDE:DDT (1.73) > DDD:DDE (0.96) > DDD:DDT (0.33).These results coincide with Zhang et al. (2006), but differed withMa et al. (2016). This differences can be explained by dissimilaritiesin the precipitation, temperature, humidity, soil moisture, soiltexture, microbes, CEC, and OM, which affect the conversion of DDTinto DDE-DDD (Aislabie et al., 2010; Chattopadhyay andChattopadhyay, 2015).
PCA estimates the source and disintegration behaviour of pes-ticides (Yang et al., 2012). In our study, pesticides belonging to thegroups such as organophosphates, anthranilic diamide, neon-icotinoid, benzimidazole, phenylamide and unclassified degrada-tion products were aligned together indicating similar source anddegradation behaviour, while OCs were separated, suggestingdifferent source and fate of the pesticides.
4.3. Carcinogenic and non-carcinogenic risk
TCR and CR via dermal and ingestion pathways of exposure toDDTs for adolescents and adults were below 1 � 10�6, indicatingnegligible cancer risk (Table 4). Adolescent and adult exposure tosingle non-carcinogenic pesticides (HQ) and multiple pesticides(HI) was <1, suggesting no appreciable non-cancer health risk.Likewise, HIs of pesticides via ingestion and dermal exposure foradolescents and adults were also negligible (<1) (Fig. S2 andFig. S3). However, other pathways of exposure such as inhalationcould still exist in Nepal and cannot be excluded for a non-cancerrisk assessment. The risk via inhalation was not considered in thisstudy because essential parameters were unavailable. Furthermore,metabolism and excretion of pesticides in humans were excludedfrom this study. All soil samples came from farmers’ fields close totheir houses thus, children may have had direct contact with thesesoils on a daily basis.
Overall, the cancer and non-cancer risks of pesticides for ado-lescents were relatively higher than those for adults. Previousstudies (Landrigan and Goldman, 2011; Pan et al., 2018) also indi-cated relatively higher risks for children than adults. The possiblereason for higher risks for adolescents might be due to their higherexposure to given doses of OCs and OPs. The soil ingestion was themain pathway of OP exposure and added to 58% and 66% of the totalrisks in adolescents and adults, respectively [Fig. S2 (b) and Fig. S3(b), Supplementary information]. Even though the soil samples ofGRM were contaminated with pesticides, a negligible health riskfrom the exposure to the pesticide contaminated soil was observedin this study.
This study considered the worst case scenario (only positivesamples and their total average concentrations): replacing the non-detects with 0 (Yadav et al., 2016) would even further decrease the
CR, HQ and HI values. However, children are more likely to unin-tentionally ingest significant amounts of contaminated soil becauseof their childish behaviour such as putting contaminated hand orfingers in their mouths (Rasmussen et al., 2001). Henceforth, thisstudy warrants further research to investigate the implications ofexposure for children through all of the possible pathways.
4.4. Limitations and future recommendations
Pesticide residues could move from neighbouring fields viawater and wind and be deposited in surrounding environments(Silva et al., 2018) and accumulate in higher concentrations on thetopsoil (1e2 cm) than deeper soil (Yang et al., 2015). Futureresearch should consider soil samples and the distribution of resi-dues in the topmost surface layer. We used conservative riskassessment methods that are generally used for risk assessment ofcontaminated sites and their applications in farmland needs furtherresearch. The PECs of pesticides in soils were based on informationrelated to the pesticide application history in our earlier study(Bhandari et al., 2018) and thus, the results may not be represen-tative of other areas and the latest pesticides use statistics. Thetwenty-three prioritized pesticides and degradation productsassessed in Nepalese soil correspond to <20% of the active in-gredients imported for use, indicating that the total pesticides insoils might even be higher than detected in our study and thepesticide mixtures may even be more complicated. Referenceconcentrations (RfC) of the pesticides and degradation products forthe estimation of inhalation exposure were not available thus, risksdue to the exposure to pesticides could not be estimated. World-wide PSRGVs (Table S8) were not calculated comprehensively inhumans (Li and Jennings, 2017) and comparison of the PECs withthe global values for pesticides in soil may be inadequate for theassessment of HR. Further, whether or not the PECs are reasonableto evaluate the risk of pesticides in the area compared with thePSRGVs could not be answered. Despite such limitations, we haveused widely accepted models and indices for the risk assessment.
5. Conclusion
Pesticides applied to vegetables farming in Nepal pollutes soils.Adoption of IPM techniques could reduce pesticide pollution insoils, as this study showed a notably smaller number of pesticideresidues and their minimum concentration in the soil samplescollected from IPM fields, compared to conventional farming. OCsconcentration were sufficiently low in most soil samples (<LOD).However, DDTs were detected with p,p’-DDE being the predomi-nant compound. There is no appreciable health risk from pesticidesresidues in soils, based on direct dermal contact and/or ingestion inadults or adolescents. The focus should be placed on DDT pollutionand the recommendations from the United Nations treaty, theStockholm Convention should be implemented. A few pesticidesdetected in soils have a potential of leaching thus, there is a risk ofground water pollution.
Predicted environmental concentrations (PECs) for most of thefrequently applied pesticides used on vegetables in Nepal did notappear in the European Commission (EC) draft assessment reportsthus, the estimated PECs is of minimal use. The PECs 7 (PECs,act,7 days
after pesticide application) for almost all of the pesticides were muchhigher than their measured environmental concentrations (MECs).The initial PECs of carbendazim, dichlorvos, imidacloprid andprofenofos were much higher than their guidance values in soil.The PECs scenario based on the poor agricultural practices isinsufficient to claim an increasing health risk of farm workerswhich warrants future research on PECs and health risk from pes-ticides in soils from other locations.
G. Bhandari et al. / Chemosphere 253 (2020) 12659412
We are thankful to the Nuffic for supporting this work throughproject No. PhD-5160957247. We would like to thank the farmersfor their help in fields. We thank the students who supported re-searchers carrying out the sample collection: Dinesh Ghimire,Ramesh Lodh, Prashant Chaudhary, and Santosh Gupta. We wouldalso like to thank Robin Palmer, Ad Peijnenburg, Ron Hoogenboomand Paul Zomer for their support of this study, reviewing themanuscript and helping with the laboratory work, respectively.
Appendix A. Supplementary data
Supplementary data to this article can be found online athttps://doi.org/10.1016/j.chemosphere.2020.126594.
References
Adhikari, P.R., 2017. An overview of pesticide management in Nepal. J. Agric. En-viron. 18, 95e105.
Aislabie, J.M., Richards, N.K., Boul, H.L., 2010. Microbial degradation of DDT and itsresiduesda review. N. Z. J. Agric. Res. 40, 269e282.
Alamdar, A., Syed, J.H., Malik, R.N., Katsoyiannis, A., Liu, J., Li, J., et al., 2014.Organochlorine pesticides in surface soils from obsolete pesticide dumpingground in Hyderabad City, Pakistan: contamination levels and their potentialfor air-soil exchange. Sci. Total Environ. 470e471, 733e741.
Atreya, K., Johnsen, F.H., Sitaula, B.K., 2011. Health and Environmental Costs ofPesticide Use in Vegetable Farming in Nepal. Environ. Dev. Sustain. vol. 14,477e493.
Awasthi, K.R., Adefemi, K., Awasthi, M.S., Chalise, B., 2017. Public health in-terventions for control of malaria in the population living in the terai region ofNepal. J. Nepal Health Res. Council 15, 202e207.
Band, P.R., Abanto, Z., Bert, J., Lang, B., Fang, R., Gallagher, R.P., et al., 2011. Prostatecancer risk and exposure to pesticides in British Columbia farmers. Prostate 71,168e183.
Bhandari, G., Atreya, K., Yang, X., Fan, L., Geissen, V., 2018. Factors affecting pesticidesafety behaviour: the perceptions of Nepalese farmers and retailers. Sci. TotalEnviron. 631e632, 1560e1571.
Bhandari, G., Zomer, P., Atreya, K., Mol, H.G.J., Yang, X., Geissen, V., 2019. Pesticideresidues in Nepalese vegetables and potential health risks. Environ. Res. 172,511e521.
Bidleman, T.F., Leone, A.D., 2004. Soileair exchange of organochlorine pesticides inthe Southern United States. Environ. Pollut. 128, 49e57.
Cai, D.W., 2008. Understand the role of chemical pesticides and prevent misuses ofpesticides. Bull. Agric. Sci. Technol. 1, 36e38.
Carvalho, F.P., 2017. Pesticides, environment, and food safety. Food Energy Security6, 48e60.
Castaneda, A.R., Bhuiyan, S.I., 1996. Groundwater contamination by ricefield pesti-cides and some influencing factors. J. Environ. Sci. Health . Part A: Environ. Sci.Eng. Toxicol. 31, 83e99.
Chattopadhyay, S., Chattopadhyay, D., 2015. Remediation of DDT and its metabolitesin contaminated sediment. Current Pollut. Rep. 1, 248e264.
Dhimal, M., Ahrens, B., Kuch, U., 2014. Malaria control in Nepal 1963-2012: chal-lenges on the path towards elimination. Malar. J. 13, 1e14.
EC, 2017. Guidance Document on Analytical Quality Control and Method ValidationProcedures for Pesticide Residues and Analysis in Food and Feed, p. 42.
EC, 2004. Draft Assessment Report (DAR) for Dimethomorph, Rapporteur MemberState (Germany) as in Article 8(2) of Council Directive 91/414/EEC. 3.
FAO, 2020. Agricultural pollution: pesticides. Retrieved on: 12 January, 2020, pp. 6.http://documents.worldbank.org/curated/en/689281521218090562/pdf/124345-BRI-p153343-PUBLIC-march-22-9-pm-WB-Knowledge-Pesticides.pdf.
Gaidahawa Rural Municipality (GRM), G.R.M., 2018. Village profile 2018. GaidahawaRural Municipality, p. 68.
Gong, Z.M., Tao, S., Xu, F.L., Dawson, R., Liu, W.X., Cui, Y.H., et al., 2004. Level anddistribution of DDT in surface soils from Tianjin, China. Chemosphere 54,1247e1253.
Han, Y., Mo, R., Yuan, X., Zhong, D., Tang, F., Ye, C., et al., 2017. Pesticide residues innut-planted soils of China and their relationship between nut/soil. Chemo-sphere 180, 42e47.
Hicks, B., 2019. Agricultural pesticides and human health, department of earthsciences, Montana state university, USA. Retrieved on. https://serc.carleton.edu/NAGTWorkshops/health/case_studies/pesticides.html. (Accessed 28 April2019).
Houbraken, M., Habimana, V., Senaeve, D., Lopez-Davila, E., Spanoghe, P., 2017.Multi-residue determination and ecological risk assessment of pesticides in thelakes of Rwanda. Sci. Total Environ. 576, 888e894.
Hu, W., Huang, B., Zhao, Y., Sun, W., Gu, Z., 2014. Distribution, sources and potentialrisk of HCH and DDT in soils from a typical alluvial plain of the Yangtze RiverDelta region, China. Environ. Geochem. Health 36, 345e358.
IARC., 2015. DDT, Lindane, and 2,4-D. In: IARC Monographs on the Evaluation ofCarcinogenic Risks to Humans, vol. 113. France, Lyon, p. 513.
Jiang, Y.F., Wang, X.T., Jia, Y., Wang, F., Wu, M.H., Sheng, G.Y., et al., 2009. Occurrence,distribution and possible sources of organochlorine pesticides in agriculturalsoil of Shanghai, China. J. Hazard Mater. 170, 989e997.
Landrigan, P.J., Goldman, L.R., 2011. Children’s vulnerability to toxic chemicals: achallenge and opportunity to strengthen health and environmental policy.Health Aff. 30, 842e850.
Lewis, S.E., Silburn, D.M., Kookana, R.S., Shaw, M., 2016. Pesticide behavior, fate, andeffects in the tropics: an overview of the current state of knowledge. J. Agric.Food Chem. 64, 3917e3924.
Li, Z., 2018. The use of a disability-adjusted life-year (DALY) metric to measurehuman health damage resulting from pesticide maximum legal exposures. Sci.Total Environ. 639, 438e456.
Li, Z., Jennings, A., 2017. Worldwide regulations of standard values of pesticides forhuman health risk control: a review. Int. J. Environ. Res. Publ. Health 14, 1e41.
Liu, X., Song, Q., Tang, Y., Li, W., Xu, J., Wu, J., et al., 2013. Human health riskassessment of heavy metals in soilevegetable system: a multi-medium analysis,463e464, 530e540.
Liu, Y., Li, S., Ni, Z., Qu, M., Zhong, D., Ye, C., et al., 2016. Pesticides in persimmons,jujubes and soil from China: residue levels, risk assessment and relationshipbetween fruits and soils. Sci. Total Environ. 542, 620e628.
Ma, J., Pan, L.B., Yang, X.Y., Liu, X.L., Tao, S.Y., Zhao, L., et al., 2016. DDT, DDD, and DDEin soil of Xiangfen County, China: residues, sources, spatial distribution, andhealth risks. Chemosphere 163, 578e583.
Mekonen, S., Argaw, R., Simanesew, A., Houbraken, M., Senaeve, D., Ambelu, A.,et al., 2016. Pesticide residues in drinking water and associated risk to con-sumers in Ethiopia. Chemosphere 162, 252e260.
Mishra, K., Sharma, R.C., Kumar, S., 2012. Contamination levels and spatial distri-bution of organochlorine pesticides in soils from India. Ecotoxicol. Environ. Saf.76, 215e225.
MoEP, 2018. Environmental Quality Standard for Soils (GB 15618-2018). Ministry ofEnvironmental Protection, China.
Ockleford, C., Adriaanse, P., Berny, P., Brock, T., Duquesne, S., Grilli, S., et al., 2017.Scientific Opinion addressing the state of the science on risk assessment ofplant protection products for in-soil organisms. EFSA J. 15 (2), 4690.
Fosu-Mensah BY, Okoffo, E.D., Darko, G., Gordon, C., 2016. Organophosphoruspesticide residues in soils and drinking water sources from cocoa producingareas in Ghana. Environ. Syst. Res. 5, 1e12.
Pan, L., Sun, J., Li, Z., Zhan, Y., Xu, S., Zhu, L., 2018. Organophosphate pesticide inagricultural soils from the Yangtze River Delta of China: concentration, distri-bution, and risk assessment. Environ. Sci. Pollut. Res. Int. 25, 4e11.
Pimentel, D., 2009. Pesticides and pest control. In: Peshin, R., Dhawan, A.K. (Eds.),Integrated Pest Management: Innovation-Development Process. Springer,Dordrecht., pp. 83e87
PPDB, 2019. Pesticide properties database, agriculture & environment research unit(AERU), university of hertfordshire, UK. Retrieved on. https://sitem.herts.ac.uk/aeru/ppdb/en/atoz.htm. (Accessed 15 September 2019).
PRMD, 2015. Pesticide Statistic Book. Pesticide Registration and Management Di-vision. Plant Protection Directorate, Department of Agriculture, Ministry ofAgricultural Development, Government of Nepal, pp. 1e50.
Qiu, X.H., Zhu, T., Li, J., Pan, H.S., Li, Q.L., Miao, G.F., et al., 2004. Organochlorinepesticides in the air around the taihu lake, China. Environ. Sci. Technol. 38,1368e1374.
Qiu, X.H., Zhu, T., Yao, B., Hu, J., Hu, S., 2005. Contribution of dicofol to the currentDDT pollution in China. Environ. Sci. Technol. 39, 4385e4390.
Qu, C., Qi, S., Yang, D., Huang, H., Zhang, J., Chen, W., et al., 2015. Risk assessmentand influence factors of organochlorine pesticides (OCPs) in agricultural soils ofthe hill region: a case study from Ningde, southeast China. J. Geochem. Explor.149, 43e51.
Rafique, N., Tariq, S.R., Ahmed, D., 2016. Monitoring and distribution patterns ofpesticide residues in soil from cotton/wheat fields of Pakistan. Environ. Monit.Assess. 188, 1e12, 695.
Raheem, S., Al-Dossary, M., Al-Saad, H., 2017. Determination of carbendazimfungicide and oxymatrine insecticide residues in the soils of four agriculturestations in basrah governorate by HPLC. J. Biol. Agric. Healthcare 7, 10e16.
Rasmussen, P.E., Subramanian, K.S., Jessiman, B.J., 2001. A multi-element profile ofhousedust in relation to exterior dust and soils in the city of Ottawa, Canada.Sci. Total Environ. 267, 125e140.
G. Bhandari et al. / Chemosphere 253 (2020) 126594 13
Ritz, B., Yu, F., 2000. Parkinson’s disease mortality and pesticide exposure in Cali-fornia 1984e1994. Int. J. Epidemiol. 29, 323e329.
Samsel, A., Seneff, S., 2013. Glyphosate’s suppression of cytochrome P450 enzymesand amino acid biosynthesis by the gut microbiome: pathways to moderndiseases. Entropy 15, 1416e1463.
S�anchez-Gonz�alez, S., Pose-Juan, E., Herrero-Hern�andez, E., �Alvarez-Martín, A.,S�anchez-Martín, M.J., Rodríguez-Cruz, S., 2013. Pesticide residues in ground-waters and soils of agricultural areas in the �Agueda River Basin from Spain andPortugal. Int. J. Environ. Anal. Chem. 93, 1585e1601.
Sankararamakrishnan, N., Kumar Sharma, A., Sanghi, R., 2005. Organochlorine andorganophosphorous pesticide residues in ground water and surface waters ofKanpur, Uttar Pradesh, India. Environ. Int. 31, 113e120.
Schreinemachers, D., 2003. Birth malformations and other adverse perinatal out-comes in four U.S. Wheat-producing states. Environ. Health Perspect. 111,1259e1264.
Shah, Y., Katuwal, A., Pun, R., Pant, K., Sherchand, S.P., Pandey, K., et al., 2012.Dengue in western terai region of Nepal. J. Nepal Health Res. Council 10,152e155.
Sharma, D.R., 2015. Use of pesticides and its residue on vegetable crops in Nepal.J. Agric. Environ. 16, 33e42.
Shelton, J.F., Geraghty, E.M., Tancredi, D.J., Delwiche, L.D., Schmidt, R.J., Ritz, B., et al.,2014. Neurodevelopmental disorders and prenatal residential proximity toagricultural pesticides: the CHARGE study. Environ. Health Perspect. 122,1103e1109.
Silva, V., Montanarella, L., Jones, A., Fernandez-Ugalde, O., Mol, H.G.J., Ritsema, C.J.,et al., 2018. Distribution of glyphosate and aminomethylphosphonic acid(AMPA) in agricultural topsoils of the European Union. Sci. Total Environ. 621,1352e1359.
Silva, V., Mol, H.G.J., Zomer, P., Tienstra, M., Ritsema, C.J., Geissen, V., 2019. Pesticideresidues in European agricultural soils - a hidden reality unfolded. Sci. TotalEnviron. 653, 1532e1545.
Sosan, M.B., Akingbohungbe, A.E., Ojo, I.A., Durosinmi, M.A., 2008. Insecticide res-idues in the blood serum and domestic water source of cacao farmers inSouthwestern Nigeria. Chemosphere 72, 781e784.
Sun, H., Qi, Y., Zhang, D., Li, Q.X., Wang, J., 2016. Concentrations, distribution,sources and risk assessment of organohalogenated contaminants in soils fromKenya, Eastern Africa. Environ. Pollut. 209, 177e185.
Sweetman, A.J., Valle, M.D., Prevedouros, K., Jones, K.C., 2005. The role of soilorganic carbon in the global cycling of persistent organic pollutants (POPs):interpreting and modelling field data. Chemosphere 60, 959e972.
Tarcau, D., Cucu-Man, S., Boruvkova, J., Klanova, J., Covaci, A., 2013. Organochlorinepesticides in soil, moss and tree-bark from North-Eastern Romania. Sci. TotalEnviron. 456e457, 317e324.
Theocharopoulos, S.P., Wagner, G., Sprengart, J., Mohr, M.E., Desaules, A.,Muntau, H., et al., 2001. European soil sampling guidelines for soil pollutionstudies. Sci. Total Environ. 264, 51e62.
USEPA, 2018. Regional screening level (RSL) summary table. Retrieved on. https://epa-prgs.ornl.gov/chemicals/download/master_sl_table_run_JUN2011.pdf.(Accessed 25 December 2018).
USEPA, 2019. Regional Screening Table - User’s Guide, Mid-Atlantic Risk Assess-ment. Retrieved on: https://www.epa.gov/risk/regional-screening-levels-rsls-generic-tables. (Accessed 20 March 2019).
USEPA, 1989. Risk assessment guidance for superfund volume I, human healthevaluation manual (Part A), interim final. U.S. Environmental protection agencyWashington, D.C. Office of Emergency and Remedial Response, p. 291.
USEPA, 2001. Risk Assessment Guidance for Superfund. Volume III - Part A, Processfor Conducting Probabilistic Risk Assessment. Office of Emergency and Reme-dial Response. U.S. Environmental Protection Agency, Washington, DC, p. 385.
Vasickova, J., Hvezdova, M., Kosubova, P., Hofman, J., 2019. Ecological risk assess-ment of pesticide residues in arable soils of the Czech Republic. Chemosphere216, 479e487.
Wang, Z., 2007. Regional Study on Soil Polycyclic Aromatic Hydrocarbons inLiaoning: Patterns, Sources and Cancer Risks. Ph.D. Thesis. Dalian University ofTechnology, Dalian, China.
Wang, X., Wang, D., Qin, X., Xu, X., 2008. Residues of organochlorine pesticides insurface soils from college school yards in Beijing, China. J. Environ. Sci. 20,1090e1096.
Wenzel, K.D., Manz, M., Hubert, A., Schuurmann, G., 2002. Fate of POPs (DDX, HCHs,PCBs) in upper soil layers of pine forests. Sci. Total Environ. 143e154.
Wong, L.I., Labrecque, M.P., Ibuki, N., Cox, M.E., Elliott, J.E., Beischlag, TV. p, p’-Dichlorodiphenyltrichloroethane (p, p’-DDT, 2015. ) and p,p’-dichlorodiphenyldichloroethylene (p,p’-DDE) repress prostate specific antigenlevels in human prostate cancer cell lines. Chem. Biol. Interact. 230, 40e49.
Wong, H.L., Garthwaite, D.G., Ramwell, C.T., Brown, C.D., 2017. How does exposureto pesticides vary in space and time for residents living near to treated or-chards? Environ. Sci. Pollut. Res. Int. 24, 26444e26461.
Yadav, I.C., Devi, N.L., Li, J., Zhang, G., Shakya, P.R., 2016. Occurrence, profile andspatial distribution of organochlorines pesticides in soil of Nepal: implicationfor source apportionment and health risk assessment. Sci. Total Environ. 573,1598e1606.
Yadav, I.C., Devi, N.L., Li, J., Zhang, G., Breivik, K., 2017. Possible emissions of POPs inplain and hilly areas of Nepal: implications for source apportionment andhealth risk assessment. Environ. Pollut. 220, 1289e1300.
Yang, D., Qi, S.-H., Zhang, J.-Q., Tan, L.-Z., Zhang, J.-P., Zhang, Y., et al., 2012. Residuesof organochlorine pesticides (OCPs) in agricultural soils of Zhangzhou city,China. Pedosphere 22, 178e189.
Yang, X., Wang, F., Bento, C.P.M., Xue, S., Gai, L., van Dam, R., et al., 2015. Short-termtransport of glyphosate with erosion in Chinese loess soil–a flume experiment.Sci. Total Environ. 512e513, 406e414.
Zbytniewski, R., Buszewski, B., 2002. Sorption of pesticides in soil and compost. Pol.J. Environ. Stud. 11, 179e184.
Zhang, H.B., Luo, Y.M., Zhao, Q.G., Wong, M.H., Zhang, G.L., 2006. Residues oforganochlorine pesticides in Hong Kong soils. Chemosphere 63, 633e641.
Zhang, W., Jiang, F., Ou, J., 2011. Global pesticide consumption and pollution: withChina as a focus. Int. Acad. Ecol. Environ. Sci. 1, 125e144.
Zheng, X., Liu, X., Liu, W., Jiang, G., Yang, R., 2009. Concentrations and sourceidentification of organochlorine pesticides (OCPs) in soils from Wolong NaturalReserve. Sci. Bull. 54, 743e751.