Page 1
Atmospheric Research 74 (2005) 507–524
www.elsevier.com/locate/atmos
Concentrations of nitrous acid, nitric acid, nitrite and
nitrate in the gas and aerosol phase at a site in the
emission zone during ESCOMPTE 2001 experiment
K. Acker*, D. Mfller, R. Auel, W. Wieprecht, D. Kalag
Brandenburg Technical University Cottbus, Department of Air Chemistry, Volmer-Str. 13,
D-12489 Berlin, Germany
Received 1 July 2003; received in revised form 1 February 2004; accepted 1 April 2004
Abstract
Ground-based measurements were performed at the bExperience sur Site pour COntraindre les
Modeles de Pollution atmospherique et de Transport d‘EmissionsQ (ESCOMPTE) field site E3
(Realtor) about 30 km north of the urban environment of Marseille and east of the industrial centre
Berre pond to investigate the formation of nitrous and nitric acid and to detect the distribution of
reactive N-species between the gas and particle phase during photochemical pollution events. A wet
denuder sampling for gases followed by a steam jet collection for aerosols was both coupled to anion
chromatographic analysis. The analytical system provided data continuously with 30-min time
resolution between June 13 and July 13, 2001. Indications for heterogeneous formation of nitrous
acid during nighttime and daytime on ground and aerosol surfaces were found, the average HNO2/
NO2 ratio was 6%. Highest concentrations were observed during two episodes of strong pollution
accumulation when sea breeze transported industrial, traffic and urban pollution land-inwards. After
nocturnal heterogeneous formation (about 0.1 ppbv h�1 were estimated corresponding to increasing
HNO2/NO2 ratios) and accumulation processes up to 1.2 ppbv HNO2 were observed. Their
photolysis produces up to 5–9�106 OH cm�3 s�1 and will contribute significantly to initiation of the
daily photochemistry in the lowest part of the troposphere. For the key tropospheric species, HNO3
daily peaks up to 4 ppbv were detected.
D 2004 Elsevier B.V. All rights reserved.
Keywords: Atmospheric chemistry; Aerosol; Nitrous acid; Nitric acid; Wet denuder; Steam jet
* Corresponding author.
0169-8095/$ -
doi:10.1016/j.
E-mail add
see front matter D 2004 Elsevier B.V. All rights reserved.
atmosres.2004.04.009
ress: [email protected] (K. Acker).
Page 2
K. Acker et al. / Atmospheric Research 74 (2005) 507–524508
1. Introduction
A major field experiment took place in the southeast of France within the frame of
bExperience sur Site pour COntraindre les Modeles de Pollution atmospherique et de
Transport d‘EmissionsQ (ESCOMPTE) from June to July 2001 to produce a relevant set of
emission, meteorological and chemical data for testing and evaluating regional pollution
models. The chemical and dynamical process studies were done over a 120�120-km area
in the region Marseille–Berre pond with numerous industrial and urban sources of
pollutants. Five pollution episodes were documented by a large set of instruments,
involving ozone lidars, wind profiler, radiosonde systems, a network of ground stations,
ship-borne, balloon-born and airplane measurements (Durand et al., 2002). Eighteen
chemical stations were located in the emission, intermediate or remote zone to follow the
pollutant plume and to investigate its chemical time evolution in a dlagrangian modeT. Thecampaign strategies and experimental set up are described in detail in Cros et al. (2004). In
the present paper, we focus on chemical measurements done by our group at the emission
station E3 Realtor. High-pollution levels were observed there not only during periods of
sea breeze, transporting coastal industrial and urban pollution land-inwards, but also under
moderate wind and channelled plume regimes. This leads to intense photochemical
activity, evidenced by elevated ozone concentrations, aerosol levels and photochemical
active species like nitrous and nitric acid. In addition, the emission of traffic in Marseille
and on the highways around is an important contributor to atmospheric pollution in open
areas. Besides, NO2 is transferred to a complex mixture of other nitrogen compounds
which have great variability in their atmospheric stability. The concentration and
composition of NOy compounds show a wide variation and are dependent on
meteorological and atmospheric chemical conditions. The chemistry and atmospheric
behaviour of reactive nitrogen compounds is detailed and described among others in
Finlayson-Pitts and Pitts (2000) and Lammel and Cape (1996).
An important mechanism for the removal of nitrogen oxides and odd hydrogen from
the atmosphere is the gas phase formation of HNO3, beside O3 and H2O2 one of the most
important photochemical reaction product. In reaction with ammonia. NH4NO3 is formed,
until removal by deposition a major contributor to the degradation of visibility. The aerosol
formation is affected by ambient temperature, relative humidity and the concentration of
ammonia. The deposition of HNO3 and nitrates contributes to acidification of sensitive
ecosystems (e.g., Nielsen et al., 1996).
Nitrous acid is an important trace species for understanding the tropospheric oxidant
chemistry and already, since more than 20 years, models have shown that HNO2 is
accumulated during nights and that after sunrise the HNO2 photolysis can cause an bOHpushQ (e.g., Platt and Perner, 1980; Platt, 1986; Jenkin et al., 1988; Harrison and Kitto,
1994; Calvert et al., 1994; Staffelbach et al., 1997). Recent estimations show also a
possible permanent OH-contribution during the day (Aumont et al., 2003). Results from
the BERLIOZ experiment around Berlin, Germany, showed clearly that the peak OH
formation rate by HNO2 photolysis is comparable to the one by ozone photolysis at noon
and the integrated OH production over 24 h showed that the photolysis of HNO2 can
contribute up to 20% of the total hydroxyl radical amount (Alicke et al., 2003).
Measurements in Milan (Febo, 1999; Alicke et al., 2002) and Rome (Wiesen, 2002)
Page 3
K. Acker et al. / Atmospheric Research 74 (2005) 507–524 509
confirm that during the first 4 to 6 h after sunrise, HNO2 photolysis is the most important
OH source in the lowest part of the troposphere.
The HNO2 formation process is of crucial interest and is not completely clear up to
now. The observed high HNO2 concentration in the atmosphere cannot be explained by
homogeneous formation and direct emission from combustion processes (Kurtenbach et
al., 2001). As a main source of HNO2, the heterogeneous reaction of NO2 with water on
surfaces is assumed:
ðNO2 þ NO2 þ H2OÞadsYðHNO2 þ HNO3ÞadsYðHþ þ NO3�Þaq þ ðHNO2Þgas:
ð1Þ
Laboratory studies and field measurements have shown that available surfaces have
different catalytic properties (e.g., Svensson et al., 1987; Kleffmann et al., 1998; TenBrink
and Spoelstra, 1998; Kalberer et al., 1999; Stadler and Rossi, 2000; Schurath, 2001;
Gutzwiller et al., 2002; Geiger et al., 2002). Present available models (e.g., Sahm et al.,
1997; Stockwell et al., 1997; Kuhn et al., 1998; Vogel et al., 2002; Aumont et al., 2003)
significantly underestimate the daytime concentration of HNO2. For a correct description
of the chemical processes that lead to ozone formation, the inclusion of the heterogeneous
HNO2 chemistry in photochemical models is essential.
A variety of analytical methods for both HNO3 and HNO2 have been developed and an
overview is given in Genfa et al. (2003). HNO2 was first time detected in the atmosphere
by Perner and Platt (1979), but methods for detection in the lower pptv range are
developed only recently.
Research on the temporal variation in both composition and concentration and on the
interaction of reactive gases and aerosols in the atmosphere requires sampling and analysis
systems for the determination of gases and particles with high time resolution. An
automated monitoring system, applicable for measurements at urban and rural sites and for
both gases and particulate matter was developed and used in the ESCOMPTE experiment.
This was based on a wet denuder and a particle collection system in combination with an
ion chromatography (IC) unit which allows among others the simultaneous determination
of HNO2, HNO3, HCl, chloride, nitrite, nitrate and sulfate.
2. Experimental
The site Realtor (43829VN, 5820VE) near the village Calas belongs to the best-equipped
chemical stations located along trajectories generally followed by the air masses during
meteorological conditions investigated during the ESCOMPTE campaign. Aerosol size
distribution, optical, chemical and physical properties of the aerosol, peroxides and,
aldehydes were measured at this site. Results will be given in Cachier et al. (2004) and
Cousin et al. (2004).
From June 13 through July 13, 2001 measurements were also done by our group at the
site Realtor. We measured NO, NO2, NOy, O3, SO2 (time resolution: 30 s), HNO2, HNO3,
aerosol nitrite, nitrate, sulfate and chloride (time resolution: 30 min), meteorological
parameter (wind velocity, wind direction, temperature, relative humidity (RH), photolysis
Page 4
K. Acker et al. / Atmospheric Research 74 (2005) 507–524510
frequency of NO2 ( J(NO2), starting at 28 June), global radiation/albedo with time resolution
of 30 s, aerosol mass/inorganic composition of total suspended particles (TSP, time
resolution: 12 h), NMHC (airmoVOC) and vertical ozone profiles (LIDAR). Beside the
LIDAR van, all equipment was located on top of a hill (208 m above sea level) covered by
Mediterranean natural landscape. The vertical ozone profiles and the concentrations of
VOC were measured during the Intensive Observation Periods (IOPs), the data will not be
discussed in this paper. For calibration of VOC measurements, a certified 74 compound
standard (NCAR, USA) was used. The LIDAR data were in very good agreement with the
results from ozone measurements obtained during two quality control aircraft measure-
ments over the field site. Results will be presented elsewhere. All other parameter were
recorded continuously during the whole experiment with a data completeness of 90%. All
data for the IOPs had been transferred to the ESCOMPTE database.
Before the ESCOMPTE campaign, the analysers for O3 (Dasibi Model 1108, UV
absorption, detection limit 1 ppbv), NO/NOx (Ecophysics CLD 770 ppt and photolytical
converter, detection limit 50 pptv), NO/NOy (Ecophysics CLD 770 ppt and gold converter,
detection limit 50 pptv) and SO2 (Thermo Environmental Instruments, detection limit 50
pptv) had been checked and inter-calibrated against transfer standards at the IMK-IFU
calibration centre, (Germany). The IFU system is calibrated against primary U.S. NIST
standards. For the daily calibration procedures during the experiment, a calibrator (S 100
Environics with ozone generator) was used. The zero air was produced by Ecophysics
Pure Air Generators (PAG 03). The analysers were housed in a van and operated in air
conditioned environment.
The use of a denuder system allows the diffusion-based collection of trace gases with a
separation from their particulate counterparts (Acker et al., 2003). Continuously wetted
denuder are especially attractive because the collection surface is constantly renewed. This
offers the possibility to perform the analysis continuously or semi-continuously on-line
with a suitable analyser/detector. Among others available, wet denuder techniques are
major reviewed in Dasgupta (2002) and Slanina et al. (1992).
A wet effluent diffusion denuder (WEDD) in the parallel plate design was operated at
Realtor continuously to sample nitrous and nitric acid. The approach for this WEDD was
adopted from Simon and Dasgupta (1993), Neftel et al. (1996), Zellweger et al. (1999) and
Loflund et al. (2001). A silica-coated glass surface realised continuously a thin
homogeneous water film (about 0.5 ml pure deionised water/min). The effluent flows
down by gravity and is collected by a ring-shaped frit before transportation to the ion
chromatography (IC) system (Acker et al., 2001).
In the WEDD, the sample air residence time is very short (b0.5 s) and the solution
residence time is short as well (b2 min), interferences by NO2 and SO2 will not be
expected. For artefact discussion of this denuder type, see Neftel et al. (1996) and Genfa et
al. (2003). The use of pre-concentration columns necessitate the use of water as the
denuder liquid, the use of carbonate in the denuder liquid (as proposed by Zellweger et al.,
1999) leads to incomplete capture of desired analyte ions during pre-concentration.
The wet denuder system was extended by a steam jet chamber to detect the nitrite and
nitrate (and sulphate and chloride) concentrations in the atmospheric aerosol phase also
with a high time resolution. The aerosol chamber is constructed according to systems
described by Simon and Dasgupta (1995), Khlystov et al. (1995) and Loflund et al. (2001).
Page 5
K. Acker et al. / Atmospheric Research 74 (2005) 507–524 511
At the top of the aerosol chamber, water steam is added to the air flow and the aerosol
particles grow to little droplets. The growth chamber is spiral, hosted in a vacuum vessel to
hold the temperature and followed by a tubular flow reactor and than by a cyclone to
separate the droplets.
The solutions (deionised water) containing the scavenged acids and aerosol compounds
are collected in flow through cells. Via a low-pressure valve, the analytes are pumped
Fig. 1. Schematic diagram of the BTU-Cottbus wet effluent diffusion denuder/steam jet collector/ion
chromatography system.
Page 6
K. Acker et al. / Atmospheric Research 74 (2005) 507–524512
peristaltically through one of the two pre-concentration columns (TAC-LP1) that are
connected with a high-pressure 8-port valve. Alternately, one of this pre-columns is used
for pre-concentration while the other is eluted by the eluent (1.8 mM Na2CO3/1.7 mM
NaHCO3) for ion chromatographic analysis (IC, DIONEX DX500 with conductivity
detection after suppression, AS4A/AG4A 4 mm columns).
The airflow through the denuder/jet steam is 10 l/min and realised constant by
calibrated mass flow controllers. Using 30-min sampling time, concentrations of 0.010 Agm�3 of HNO2/NO2
� and HNO3/NO3� can be reliably recorded (limit of quantification). To
avoid sampling losses, our system had a very short Teflon inlet in the height of about 3 m
above ground as proposed by Neumann et al. (1999). For stable analytical conditions, the
whole system is operated in an air-conditioned environment at about 20 8C and combined
with an uninterruptible power supply. The collection efficiency of the wet denuder was
determined using gas-standards generated via a HNO3 permeation source or a HNO2
generation system similar to that of Febo et al. (1995). For different volume flows (5–10 l/
min) of the calibration gas through the denuder, the collection efficiency was found to be
between 95.6% and 99.5%. A schematic diagram of the WEDD-steam jet-IC system is
given in Fig. 1.
Our WEED method was successfully proven by intercomparisons with other wet
chemistry techniques: (a) rotating annular wet denuder coupled with IC (as described in Oms
et al., 1996) and (b) scrubbing in mixing coils coupled with a dual channel DNPH
derivatisation/High-Performance Liquid Chromatography technique (as described in Zhou
et al., 2002) during international field campaigns (INTERCOMP2000 inMelpitz, Germany;
NITROCAT in Rome, Italy). The very good agreement in structure and concentration levels
during nighttime and daytime between our WEED HNO2 measurements and the HNO2 data
obtained with Differential Optical Absorption Spectroscopy (DOAS, e.g., Alicke et al.,
2002) during the NITROCAT Rome campaign in May–June 2001 just before ESCOMPTE
is another positive result in quality assurance discussion for available atmospheric nitrous
acid measurements, see Acker et al. (2004).
The High Volume Sampler (Digitel) used for TSP aerosol characteristics at the
ESCOMPTE site Realtor was compared earlier with identical devices running side by side
during the INTERCOMP2000 experiment and during the Berlin city aerosol project 2001/
2002 with excellent results. The quality of our analytical work is certified also in reports of
the laboratory intercomparisons of synthetic rain samples organized within the Global
Atmospheric Watch Program of the World Meteorological Organisation (GAW WMO), in
which we take part annually.
3. Results and discussion
During the ESCOMPTE experiment, different pollution episodes were observed, the
meteorological conditions are described in detail in Cros et al. (2004). The concentrations
of gaseous HNO2 and HNO3 were recorded continuously at the site Realtor with a time
resolution of 30 min over a period of 4 weeks. An overview of these results of the
complete campaign can be seen in Fig. 2. Daily peaks in HNO3 were observed at noon
ranging between 0.2 ppbv under mistral conditions and 4 ppbv in periods with high photo-
Page 7
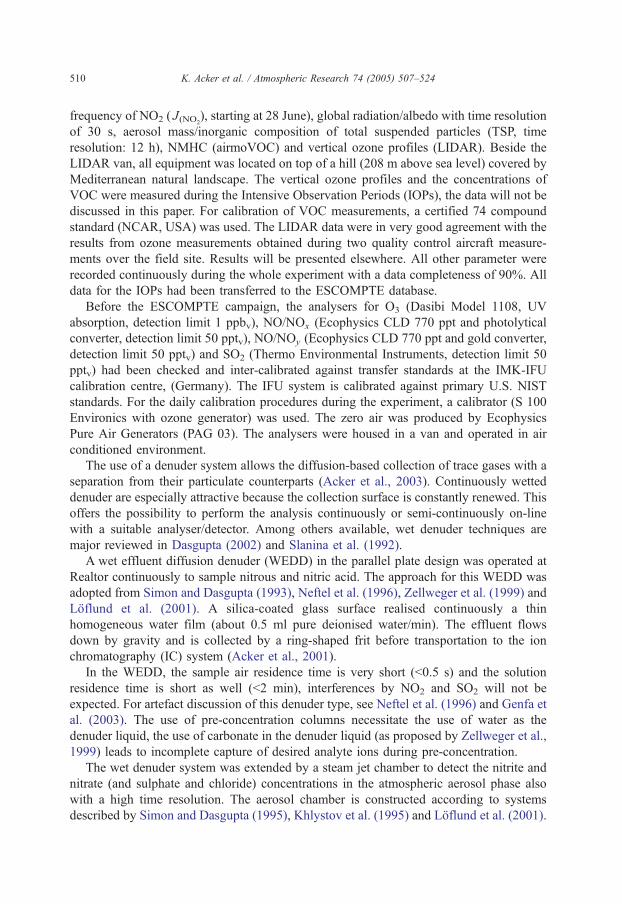
Fig. 2. Gas phase HNO2 and HNO3 concentrations measured with the WEDD at the site Realtor during the whole
experiment time (time resolution: 30 min).
K. Acker et al. / Atmospheric Research 74 (2005) 507–524 513
chemical activity. The concentration of HNO2 is generally in low pptv levels during the
day and rises to low ppbv levels during the night. Dependent on the NO2 concentration
around the investigated site Realtor, different high values for HNO2 were observed. A
strong formation and accumulation of HNO2 was observed after 2000 UTC until about
0700 UTC. The HNO2 concentration is close connected with meteorological conditions
(day and night chemistry, vertical mixing processes). The morning break up of the mixing
layer causes dilution of HNO2-rich air by entrainment of fresh air from layers above the
boundary layer. Besides, the photolysis of HNO2 becomes important. In Fig. 3, the average
diurnal pattern of HNO2 for the whole experiment time is given. On average, a maximum
of 0.5 ppbv between 0100 and 0600 UTC was found. The high scattering (0.15–0.85 ppbv)
Fig. 3. Diurnal variation in HNO2 concentration at the station Realtor averaged over 3 weeks.
Page 8
K. Acker et al. / Atmospheric Research 74 (2005) 507–524514
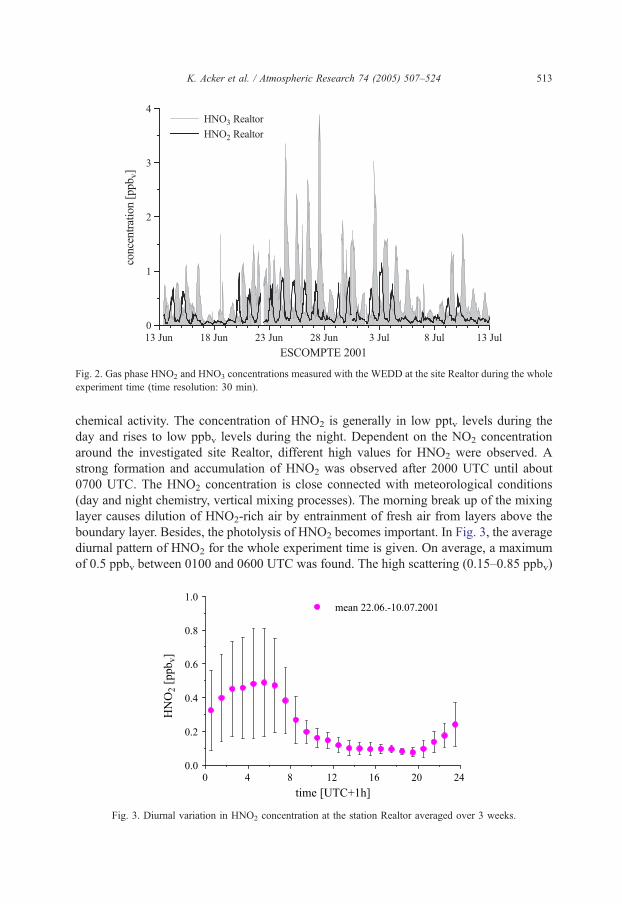
around this value is caused by different levels of the precursor NO2 (2–35 ppbv) and of the
relative humidity (62–100%) as well as by differences in the stability of the boundary layer
(see also Fig. 4). Investigations in Milan and Rome (Febo, 1999; Wiesen, 2002) have
Fig. 4. (a) Correlation between nitrous acid and its precursor nitrogen dioxide at the site Realtor on 17 and 18 June
2001. Under Mistral conditions, high wind speeds occurred during day and night (5–12 m s�1). The best fits for
the correlation between both compounds are given as dashed (daytime) and solid (night time) line. (b) Correlation
between nitrous acid and its precursor nitrogen dioxide at the site Realtor on 24 June 2001. During the pollution
event (IOP2), low wind speeds occurred (0.5–4 m s�1). The best fit for the correlation between both compounds
(day and night) is given as solid line.
Page 9
K. Acker et al. / Atmospheric Research 74 (2005) 507–524 515
shown that the diurnal variation of HNO2 is well correlated to the diurnal variation of the
natural radioactivity element Radon.
The HNO2 concentrations were positively correlated with those of NO2, with r2=0.72 if
all data (day and night) are used. A separation of the data into sunlight and darkness hours
did not improve the correlation. But different meteorological regimes cause significant
differences in the source receptor relationship. Fig. 4 illustrates this behaviour. On 17 and
18 June 2001, air masses connected with strong NW winds (Mistral situation) reached the
Realtor site causing high turbulence and a low correlation between HNO2 and its
precursor. The relative humidity reached only 50% and 75% during the nights. Winds of
~5 m s�1 were observed between 1900 and 0900 UTC; during the day, wind speeds were
higher (~10–12 m s�1). Much lower wind speeds were measured on June 24 and HNO2
and NO2 are highly correlated (night and day). Very moderate winds (~1 m s�1) during the
night reached the site from SE directions with RH between 80% and 100%; the wind
direction changed to SW during the day with velocities of ~5 m s�1.
Despite a high variation in the HNO2 to NO2 ratio, on average it reached few percent
(6F5), similar to values found by Stutz et al. (2002) in Milan (5%) but significantly higher
than the contribution from direct emissions. At a high traffic density on average, a HNO2
to NOx ratio of 0.8% is observed (Kurtenbach et al., 2001). As expected, the influence of
NO was found to be negligible on the HNO2 formation at Realtor site (correlation between
HNO2 and NO, r2=0.17).
Highest concentrations in nitrous and nitric acid and of their particulate counterparts
were observed during two episodes of strong pollution accumulation when sea-breeze
transported industrial, traffic and urban pollution land-inwards. One of the Intensive
Operating Periods of the ESCOMPTE experiment was of 6 days duration (21 June to 26
June, IOP2) and began with a moderate NW/W wind (an end of Mistral situation), clear
skies and hot temperature (N30 8C). Marseille and Berre plumes extended towards the east
and over the sea. The highest surface ozone concentrations were found in the most eastern
part of the ESCOMPTE domain. In the afternoon of June 23, the meteorological
conditions changed significantly. Three days of very hot temperature (N34 8C) and high
surface concentration in ozone (about 100 ppbv in the whole domain) were observed. On
June 25, the southerly flow was well developed and an about 1-km-deep sea breeze front
extends from 428N to 44.28N. Around noon, 30 km inland downwind Marseille, an ozone
plume was clearly identified with ozone concentrations as high as 130 ppbv. In the same
area, a plume of NOx and NOy was observed. A map of the ESCOMPTE domain and
more details of meteorological and pollution situation are given in Cros et al. (2004) and
Cachier et al. (2004). At the Realtor site, 118 ppbv O3 on June 24 and 130 ppbv O3 on
June 27 were found at noon. Maximum in NO2 and NOy occurred between midnight and
noon reaching 20 and 30 ppbv, respectively. Peaks in NO were found between 0500 and
0900 UTC, presenting fresh emissions from morning traffic at highways few kilometres
around the site. While up to 5 ppbv NO were registered on the weekend days June 23 and
24, in the morning hours of the following workdays up to 20 ppbv were observed. In
addition, a significant change in the aerosol mass (derived from High Volume TSP
sampling) was found, increasing from 30 Ag m�3 (12 h mean 0500–1700 UTC) on June
21 to 53 Ag m�3 on June 26, 2001. The pollution situation at Realtor for this IOP2 is
documented in Fig. 5.
Page 10
Fig. 5. Time series of O3, NO, NO2, NOz (calculated from NOy�NOx and as a sum of selected measured NOz
parameters (nitrite and nitrate data were bconvertedQ into ppbv)) and SO2 during a photochemical pollution event
(IOP2) observed at the site Realtor.
K. Acker et al. / Atmospheric Research 74 (2005) 507–524516
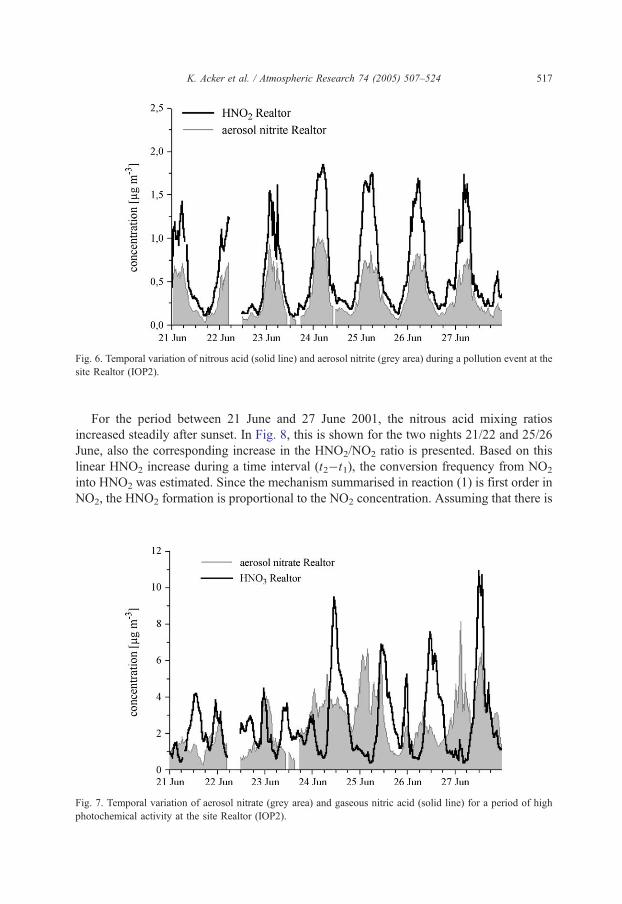
Evidence for a photochemical episode was found also because of increasing nitric and
nitrous acid concentrations, see Figs. 2, 6 and 7). While in the beginning of the event on 21
June 0.6 ppbv HNO2 and 1.5 ppbv HNO3 were measured, on June 24 concentrations of
0.9 ppbv nitrous acid and 3.5 ppbv nitric acid were observed at 0500 and 1100 UTC,
respectively.
Page 11
Fig. 6. Temporal variation of nitrous acid (solid line) and aerosol nitrite (grey area) during a pollution event at the
site Realtor (IOP2).
K. Acker et al. / Atmospheric Research 74 (2005) 507–524 517
For the period between 21 June and 27 June 2001, the nitrous acid mixing ratios
increased steadily after sunset. In Fig. 8, this is shown for the two nights 21/22 and 25/26
June, also the corresponding increase in the HNO2/NO2 ratio is presented. Based on this
linear HNO2 increase during a time interval (t2�t1), the conversion frequency from NO2
into HNO2 was estimated. Since the mechanism summarised in reaction (1) is first order in
NO2, the HNO2 formation is proportional to the NO2 concentration. Assuming that there is
Fig. 7. Temporal variation of aerosol nitrate (grey area) and gaseous nitric acid (solid line) for a period of high
photochemical activity at the site Realtor (IOP2).
Page 12
Fig. 8. Formation of HNO2 during the nights of 21/22 and 25/26 June 2001 at the site Realtor. The lower graph
shows the monotonic increase of HNO2 from 1800 to 0100 UTC. The upper graph shows the corresponding
increase in the HNO2/NO2 ratio.
K. Acker et al. / Atmospheric Research 74 (2005) 507–524518
no dependency on gas phase water as suggested by Kleffmann et al. (1998), the average
nighttime conversion frequency was determined by:
FHNO2night ¼ ð½HNO2�ðt2Þ � ½HNO2�ðt1ÞÞ=ðt2 � t1Þ½NO2�night:
The calculated value was 0.009 (ppbHNO2)/(h(ppbNO2)) between 2000 and 0100
UTC. Because of very low NO concentrations (see Fig. 5), a contribution from direct
HNO2 emission can be neglected. The efficiency of heterogeneous NO2-to-HNO2
conversion found at Realtor is comparable to those observed at different other urban
and rural sites (e.g., Stutz et al., 2002; Alicke et al., 2002; Acker et al., 2003).
It is assumed that nitrous acid is formed during the day by the same mechanism as
during the night, but owing to the fast photolysis into OH with sHNO2~10 min at noon the
measured mixing ratios are much lower. The lifetime of HNO2 can be considerably longer
during cloudy periods, or at high solar zenith angles (Stutz et al., 2000; Acker et al., 2001).
Unexpected (from the photostationary state) high mixing ratios of 100–400 pptv were
found in the daytime in urban (e.g., Febo, 1999; Wiesen, 2002) as well in rural regions
(e.g., Zhou et al., 2002), indicating that an effective heterogeneous HNO2 formation is
occurring also at daytime. Until now, it is not clear which special surface characteristics of
the ground and aerosol particles may support the formation (Stutz et al., 2002). During the
ESCOMPTE 2001 experiment also at noon about 100 pptv nitrous acid were measured, 20
times higher than the quantification limit of the used WEDD method.
A sensor to measure the photolysis frequency of NO2 was installed at the site Realtor
on 28 June being in operation until the end of the campaign. The photolysis frequency of
Page 13
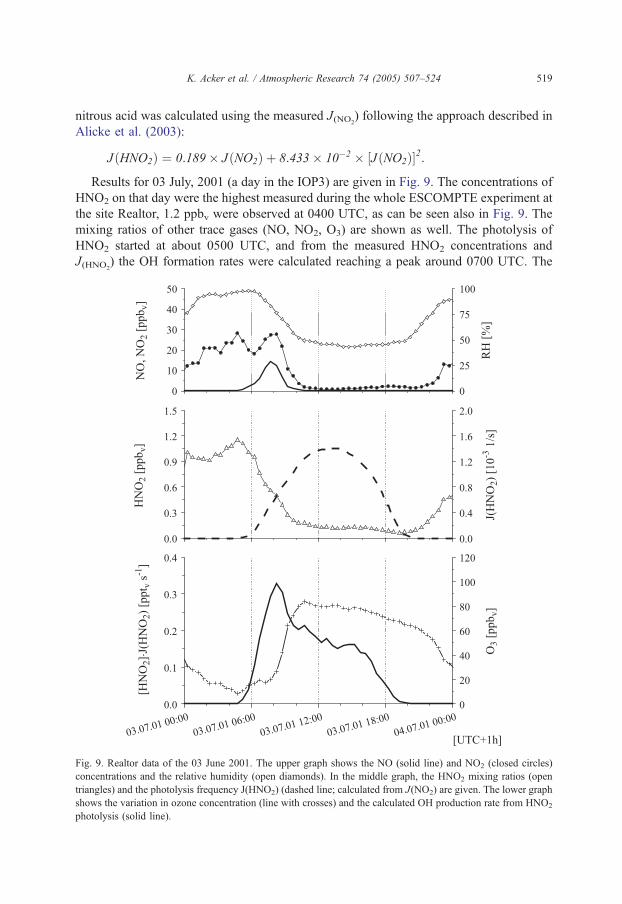
K. Acker et al. / Atmospheric Research 74 (2005) 507–524 519
nitrous acid was calculated using the measured J(NO2) following the approach described in
Alicke et al. (2003):
JðHNO2Þ ¼ 0:189� JðNO2Þ þ 8:433� 10�2 � ½JðNO2Þ�2:
Results for 03 July, 2001 (a day in the IOP3) are given in Fig. 9. The concentrations of
HNO2 on that day were the highest measured during the whole ESCOMPTE experiment at
the site Realtor, 1.2 ppbv were observed at 0400 UTC, as can be seen also in Fig. 9. The
mixing ratios of other trace gases (NO, NO2, O3) are shown as well. The photolysis of
HNO2 started at about 0500 UTC, and from the measured HNO2 concentrations and
J(HNO2) the OH formation rates were calculated reaching a peak around 0700 UTC. The
Fig. 9. Realtor data of the 03 June 2001. The upper graph shows the NO (solid line) and NO2 (closed circles)
concentrations and the relative humidity (open diamonds). In the middle graph, the HNO2 mixing ratios (open
triangles) and the photolysis frequency J(HNO2) (dashed line; calculated from J(NO2) are given. The lower graph
shows the variation in ozone concentration (line with crosses) and the calculated OH production rate from HNO2
photolysis (solid line).
Page 14
K. Acker et al. / Atmospheric Research 74 (2005) 507–524520
morning photolysis can form up to 5–9�106 OH cm�3 s�1 (in Milan 1–3�107 were found
by Alicke et al., 2002) and lasts few hours after sunrise. Because of its lower dissociation
threshold, the photolysis of HNO2 accumulated during the night is the first mechanism
forming OH in the morning, followed by the photolysis of formaldehyde (in polluted
regions the most important source of OH, see Alicke et al. (2002); but not measured at
Realtor). The photolysis of O3 becomes important later in the day, when actinic fluxes in
the lower UVoccur. But it should also be noted that HNO2 photolysis is important only in
the lowest few hundred metres of the atmosphere. While morning photolysis is often
restricted to the nighttime boundary layer, the fast photolysis later during the day does not
permit a transport of HNO2 into the upper part of the daytime boundary layer (Alicke et
al., 2002). Using our 3 m HNO2 mixing ratios as a representation of the whole boundary
layer (at night ~100 m) will lead to an overestimation of the nitrous acid formed by about
60% (Stutz et al., 2002), and micrometeorological data should be considered when
analysing trace gases that interact with the ground, because a combination of a deposition
of NO2 and HNO2 and a conversion of NO2 to HNO2 at the ground is expected.
However, it is also considered that the local ozone production is a major contribution to
the ozone plume concentration and the photolysis of the nitrous acid after sunrise is
expected to be of major importance for initiating the daily photochemistry.
Thus, atmospheric budget research of reactive nitrogen compounds and developments
of sampling and analytical methods are of big interest. Special attention was given to the
distribution between nitrous and nitric acid respectively and their particulate counterparts.
After separation of the acids from the gas phase—the WEED works as a selective sink—
the particles were scavenged by a jet steam and aerosol nitrite and nitrate measurements
have been carried out continuously.
It was observed that at the station Realtor most of the nitrite (~65%) is present as HNO2
in the gas phase (see Fig. 6). The amount of aerosol nitrite found (~35% of the total) also
indicated that wet aerosols have to be taken into consideration as a surface for the
heterogeneous formation of HNO2, although formation on the ground surface is expected
to be the main source of HNO2 (Veitel, 2002; Febo, 1999; Wiesen, 2002). The release of
nitrous acid into the gas phase depends mainly on particle surface characteristics. The
formation on atmospheric aerosols is very difficult to quantify. Under stable atmospheric
conditions, the contribution is hidden by the generation flux from the ground, under strong
vertical mixing by the change of the mixing height.
The results of the simultaneous measurements of gaseous nitric acid and particulate
nitrate are presented in Fig. 7. A formation of HNO3 parallel to that of HNO2 concerning
Eq. (1) could not been seen and it has to be assumed that nitric acid, because of its high
solubility and adsorption ability, will remain in or scavenge into the condensed phase. The
relative humidity was between 63% and 100% in the time periods 2000–0600 UTC. Du-
ring the day, other production mechanisms for nitric acid are more important. On average
10 times more soluble nitrate was found in the aerosol phase compared to nitrite. The in-
crease in nitrite during the nights is attended by a slight increase in nitrate (or adsorbed
HNO3), indicating the postulated heterogeneous formation reaction for nitrous acid courses.
The differences in the correlation of HNO2 and HNO3 to their particulate counterparts
can be explained by differences in main formation mechanism (oxidation, gas-to-particle
conversion, heterogeneous processes on surfaces), deposition velocities, photolysis rates,
Page 15
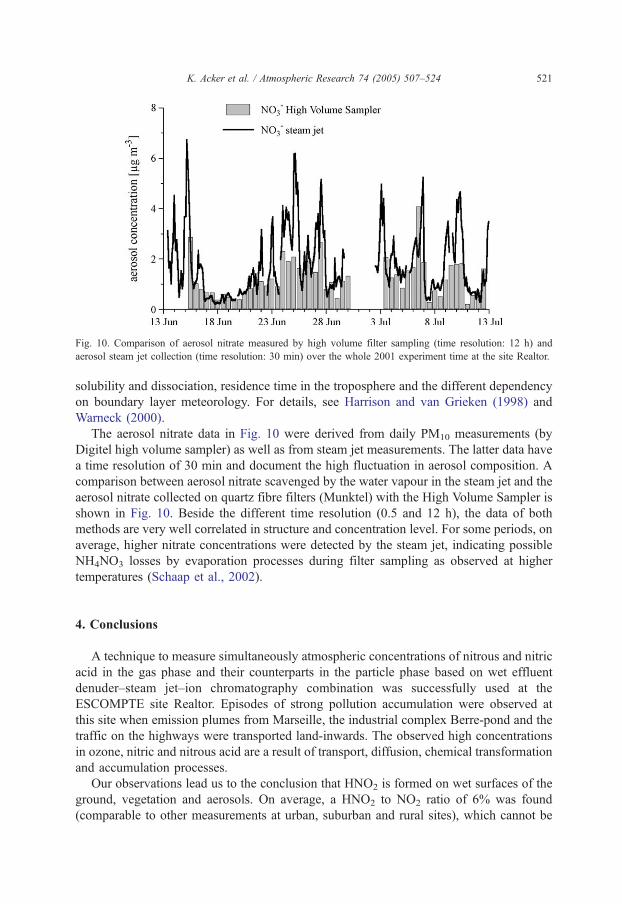
Fig. 10. Comparison of aerosol nitrate measured by high volume filter sampling (time resolution: 12 h) and
aerosol steam jet collection (time resolution: 30 min) over the whole 2001 experiment time at the site Realtor.
K. Acker et al. / Atmospheric Research 74 (2005) 507–524 521
solubility and dissociation, residence time in the troposphere and the different dependency
on boundary layer meteorology. For details, see Harrison and van Grieken (1998) and
Warneck (2000).
The aerosol nitrate data in Fig. 10 were derived from daily PM10 measurements (by
Digitel high volume sampler) as well as from steam jet measurements. The latter data have
a time resolution of 30 min and document the high fluctuation in aerosol composition. A
comparison between aerosol nitrate scavenged by the water vapour in the steam jet and the
aerosol nitrate collected on quartz fibre filters (Munktel) with the High Volume Sampler is
shown in Fig. 10. Beside the different time resolution (0.5 and 12 h), the data of both
methods are very well correlated in structure and concentration level. For some periods, on
average, higher nitrate concentrations were detected by the steam jet, indicating possible
NH4NO3 losses by evaporation processes during filter sampling as observed at higher
temperatures (Schaap et al., 2002).
4. Conclusions
A technique to measure simultaneously atmospheric concentrations of nitrous and nitric
acid in the gas phase and their counterparts in the particle phase based on wet effluent
denuder–steam jet–ion chromatography combination was successfully used at the
ESCOMPTE site Realtor. Episodes of strong pollution accumulation were observed at
this site when emission plumes from Marseille, the industrial complex Berre-pond and the
traffic on the highways were transported land-inwards. The observed high concentrations
in ozone, nitric and nitrous acid are a result of transport, diffusion, chemical transformation
and accumulation processes.
Our observations lead us to the conclusion that HNO2 is formed on wet surfaces of the
ground, vegetation and aerosols. On average, a HNO2 to NO2 ratio of 6% was found
(comparable to other measurements at urban, suburban and rural sites), which cannot be
Page 16
K. Acker et al. / Atmospheric Research 74 (2005) 507–524522
explained by homogeneous formation and direct emission. After nighttime formation and
accumulation of this heterogeneous formed species (up to 1.2 ppbv) and when OH pro-
duction rates from other sources (photolysis of O3 and formaldehyde) are slow, the
photolysis of HNO2 can be an OH source of greatest importance in the lowest part of the
troposphere (up to 5–9�106 OH cm�3 s�1 were estimated for Realtor site) and will con-
tribute considerably to the initiation of the day photo-chemistry. The diurnal variation in
HNO2 mixing ratios is dominated by NO2 levels, photolysis, and vertical mixing. The pre-
sence of HNO2 at concentrations higher than that predicted by most models and its low but
persistent presence in the daytime require inclusion of heterogeneous HNO2 chemistry in
chemistry transport models. Our measurements are highly valuable within the frame of the
ESCOMPTE campaign, which is mainly devoted to study photochemical pollution
episodes.
Acknowledgement
The work of the BTU Cottbus group within the ESCOMPTE project was supported by
the German Ministry for Science and Research (07TFS60). We would like to thank our
French and German colleagues for excellent co-operation in the field measurements and
the two anonymous reviewers for their careful revision of the manuscript.
References
Acker, K., Mfller, D., Wieprecht, W., Auel, R., Kalag, D., Tscherwenka, W., 2001. Nitrous and nitric acid
measurements inside and outside of clouds at Mt. Brocken. J. Water Air Soil Pollut. 130, 331–336.
Acker, K., Wieprecht, W., Mfller, D., 2003. Distribution of reactive nitrogen compounds between atmospheric
gas and aerosol phase. In: ten Brink, H., Baltensberger, U. (Eds.), Composition and Size Evolution of the
Secondary Aerosol. EUROTRAC-2 Subproject AEROSOL Final Report. GSF, Munich, pp. 197–203.
Acker, K., Spindler, G., Brqggemann, E., 2004. Nitrous and nitric acid measurements during the
INTERCOMP2000 campaign in Melpitz. Atmos. Environ. 38, 6497–6505.
Alicke, B., Platt, U., Stutz, J., 2002. Impact of nitrous acid photolysis on the total hydroxyl radical budget during
the limitation of oxidant production/pianura padana produzione di ozono study in Milan. J. Geophys. Res. 107
(D22), 8196.
Alicke, B., Geyer, A., Hofzumahaus, A., Holland, F., Konrad, S., P7tz, H.W., Sch7fer, J., Stutz, J., Volz-Thomas,
A., Platt, U., 2003. OH formation by HNO2 photolysis during the BERLIOZ experiment. J. Geophys. Res.
108 (D4), 8247.
Aumont, B., Chervier, F., Laval, S., 2003. Contribution of HNO2 sources to the NOx/HOx/O3 chemistry in the
polluted boundary layer. Atmos. Environ. 37, 487–498.
Cachier, H., Aulagnier, F., Sarda, R., Gautier, F., Masclet, P., Besombes, J.L., Marchand, N., Despiau, S., Croci,
D., Mallet, M., Laj, P., Marinoni, A., Deveau, P.A., Roger, J.C., Putaud, J.Ph., van Dingen, R., Dell’acqua, A.,
Viidanoja, J., Martind-dos Santos, S., Liousse, C., Cousin, F., Rosset, R., Gardat, E., Galy-Lacaux, C., 2004.
Aerosol studies during the ESCOMPTE experiment: an overview. Atmos. Res. 74, 547–563 (this issue).
Calvert, J.G., Yarwood, G., Dunker, A.M., 1994. An evaluation of the mechanism of nitrous acid formation in the
urban atmosphere. Res. Chem. Intermed. 20 (3–5), 463–502.
Cousin, F., Tulet, P., Rosset, R., 2004. Interaction between local and regional polluted layers in the low
troposphere: impact on surface concentrations during ESCOMPTE 2001, IOP2. Atmos. Res. 74, 117–137
(this issue).
Page 17
K. Acker et al. / Atmospheric Research 74 (2005) 507–524 523
Cros, B., Durand, P., Cachier, H., Drobinski, Ph., Frejafon, E., Kottmeier, C., Perros, P., Peuch, V.-H., Ponche,
J.L., Robin, D., SaRd, F., Toupance, G., Wortham, H., 2004. The ESCOMPTE program: an overview. Atmos.
Res. 69, 241–279.
Dasgupta, P.K., 2002. Sampling and sample preparation techniques for field and laboratory. In: Pawliszyn,
J. (Ed.), Automated Diffusion Based Collection and Measurement of Atmospheric Trace Gases, Wilson and
Wilson’s Comprehensive Analytical Chemistry Series, vol. XXXVII. Elsevier, pp. 97–160.
Durand, P., Cros, B., Peuch, V.-H., Kottmeier, C., SaRd, F., Perros, P., Robin, D., 2002. The ESCOMPTE program:
an overview of the field experiment. EGSO2-A-06423, EGS XXVII General Assembly 22–26 April 2002,
Nice, France.
Febo, A. (scientific coordinator), 1999. Formation and occurrence of nitrous acid in the atmosphere
(FORMONA), final EU project report (ENV4-CT95-0055).
Febo, A., Perrino, C., Gherardi, M., Sparapani, R., 1995. Evaluation of a high-purity and high-stability
continuous generation system for nitrous acid. Environ. Sci. Technol. 29, 2390–2395.
Finlayson-Pitts, B.J., Pitts, J.N., 2000. Chemistry of the Upper and Lower Atmosphere: Theory, Experiments and
Applications vol. xxii. Academic Press, San Diego, Calif. 969 pp.
Geiger, H., Kleffmann, J., Wiesen, P., 2002. Smog chamber studies on the influence of diesel exhaust on
photosmog formation. Atmos. Environ. 36, 1737–1747.
Genfa, Z., Slanina, S., Boring, C.B., Jongejan, P.A.C., Dasgupta, P.K., 2003. Continuous wet denuder
measurements of atmospheric nitric and nitrous acids during the 1999 Atlanta Supersite. Atmos. Environ. 37,
1351–1364.
Gutzwiller, L., Arens, F., Baltensperger, U., G7ggeler, H.W., Ammann, M., 2002. Significance of semivolatile
diesel exhaust organics for secondary HNO2 formation. Environ. Sci. Technol. 36, 677–682.
Harrison, R.M., Kitto, N., 1994. Evidence for a surface source of atmospheric nitrous acid. Atmos. Environ. 28,
1089–1094.
Harrison, R.M., van Grieken, R. (Eds.), 1998. Atmospheric Particles, IUPAC Series on Analytical and Physical
Chemistry of Environmental Systems, vol. 5. John Wiley & Sons, Chichester, p. 610.
Jenkin, M.E., Cox, R.A., Williams, D.J., 1988. Laboratory studies of the kinetics of formation of nitrous acid
from the thermal reaction of nitrogen dioxide and water vapour. Atmos. Environ. 22, 487–498.
Kalberer, M., Ammann, M., Arens, F., Gaggeler, H.W., Baltensperger, U., 1999. Heterogeneous formation of
nitrous acid (HNO2) on soot aerosol particles. J. Geophys. Res. 104 (D11), 13825–13832.
Khlystov, A., Wyers, G.P., Slanina, J., 1995. The steam-jet aerosol collector. Atmos. Environ. 29,
2229–2234.
Kleffmann, J., Becker, K.H., Wiesen, P., 1998. Heterogeneous NO2 conversion processes on acid surfaces:
possible atmospheric implications. Atmos. Environ. 32, 2721–2729.
Kuhn, M., Builtjes, P.J.H., Poppe, D., Simpson, D., Stockwell, W.R., Andersson-Skold, Y., Baart, A., Das, M.,
Fiedler, F., Hov, O., Kirchner, F., Makar, P.A., Milford, J.B., Roemer, M.G.M., Ruhnke, R., Strand, A., Vogel,
B., Vogel, H., 1998. Intercomparison of the gas-phase chemistry in several chemistry and transport models.
Atmos. Environ. 32, 693–709.
Kurtenbach, R., Becker, K.H., Gomes, J.A.G., Kleffmann, J., Lfrzer, J.C., Spittler, M., Wiesen, P., Ackermann,
R., Geyer, A., Platt, U., 2001. Investigations of emissions and heterogeneous formation of HNO2 in a road
traffic tunnel. Atmos. Environ. 35, 3385–3394.
Lammel, G., Cape, N.J., 1996. Nitrous acid and nitrite in the atmosphere. Chem. Soc. Rev. 25, 361–369.
Lfflund, M., Kasper-Giebl, A., Tscherwenka, W., Schmid, M., Giebl, H., Hitzenberger, R., Reischl, G., Puxbaum,
H., 2001. The performance of a gas and a aerosol monitoring system (GAMS) fort he determination of acidic
water soluble organic and inorganic gases and ammonia as well as related particles from the atmosphere.
Atmos. Environ. 35, 2861–2869.
Neftel, A., Blatter, A., Hesterberg, R., Staffelbach, T., 1996. Measurements of concentration gradients of HNO2
and HNO3 over a semi-natural ecosystem. Atmos. Environ. 30, 3017–3025.
Neumann, J.A., Huey, L.G., Ryerson, T.B., Fahey, D.W., 1999. Study of inlet materials for sampling atmospheric
nitric acid. Environ. Sci. Technol. 33, 1133–1136.
Nielsen, T., Pilegaard, K., Egelbv, A.H., Granby, K., Hummelshbj, P., Jensen, N.O., Skov, Henrik, 1996.
Atmospheric nitrogen compounds: occurrence composition and deposition. Sci. Total Environ. 189/190,
459–465.
Page 18
K. Acker et al. / Atmospheric Research 74 (2005) 507–524524
Oms, M.T., Jongejan, P.A.C., Veltkamp, A.C., Wyers, G.P., Slanina, J., 1996. Continuous monitoring of
atmospheric HCl, HNO2, HNO3 and SO2 by wet-annular denuder air sampling with on-line chromatographic
analysis. Int. J. Environ. Anal. Chem. 62, 207–218.
Perner, D., Platt, U., 1979. Detection of nitrous acid in the atmosphere by differential optical absorption.
Geophys. Res. Lett. 6, 917–920.
Platt, U., 1986. The origin of nitrous and nitric acid in the atmosphere. In: Jaeschke, W. (Ed.),
Chemistry of Multiphase Atmospheric Systems, NATO ASI Series, vol. G6. Springer Verlag, Berlin,
Heidelberg, pp. 299–319.
Platt, U., Perner, D., 1980. Direct measurements of atmospheric CH2O, HNO2, O3, NO2 and SO2 by differential
optical absorption in the near UV. J. Geophys. Res. 85, 7453–7458.
Sahm, P., Kirchner, F., Moussiopoulos, N., 1997. Development and validation of the multilayer model MUSE—
the impact of the chemical reaction mechanism on the air quality predictions. 22nd NATO/CCMS
International Technical Meeting on air Pollution Modelling and its Applications. Clermont-Ferrand, France.
Schaap, M., Mueller, K., ten Brink, H.M., 2002. Constructing the European aerosol nitrate concentration field
from quality analysed data. Atmos. Environ. 36, 1323–1335.
Schurath, U., 2001. Heterogeneous chemistry on soot and oxidation of surface molecules on soot. J. Aerosol Sci.
32, S93.
Slanina, J., de Wild, P.J., Wyers, G.P., 1992. The application of denuder systems to the analysis of atmospheric
components. In: Nriagu, J.O. (Ed.), Gaseous Pollutants—Characterization and Cycling. John Wiley & Sons,
New York, pp. 129–154.
Simon, P.K., Dasgupta, P.K., 1993. Wet effluent denuder coupled liquid/ion chromatography systems: annular and
parallel plate denuders. Anal. Chem. 65, 1134–1139.
Simon, P.K., Dasgupta, P.K., 1995. Continuous automated measurement of the soluble fraction of atmospheric
particulate matter. Anal. Chem. 67, 71–78.
Stadler, D., Rossi, M.J., 2000. The reactivity of NO2 and HNO2 on flame soot at ambient temperature: the
influence of combustion conditions. Phys. Chem. Chem. Phys. 2, 5420–5429.
Staffelbach, T., Neftel, A., Horowitz, L.W., 1997. Photochemical oxidant formation over Southern Switzerland: 2.
Model results. J. Geophys. Res. 102, 23363–23373.
Stockwell, W.R., Kirchner, F., Kuhn, M., Seefeld, S., 1997. A new mechanism for regional atmospheric chemistry
modelling. J. Geophys. Res. 102, 25847–25879.
Stutz, J., Kim, E.S., Platt, U., Bruno, P., Perrino, C., Febo, A., 2000. UV–visible absorption cross section of
nitrous acid. J. Geophys. Res. 105, 14585–14592.
Stutz, J., Alicke, B., Neftel, A., 2002. Nitrous acid formation in the urban atmosphere: Gradient measurements of
NO2 and HNO2 over grass in Milan, Italy. J. Geophys. Res. 107 (D22), 8192.
Svensson, R., Ljungstrfm, E., Lindqvist, O., 1987. Kinetics of the reaction between nitrogen dioxide and water
vapour. Atmos. Environ. 21, 1529–1539.
TenBrink, H.M., Spoelstra, H., 1998. The dark decay of HNO2 in environmental (SMOG) chambers. Atmos.
Environ. 32, 247–251.
Veitel, H., 2002. Vertical profiles of NO2 and HNO2 in the planetary boundary layer. PhD thesis, Universit7tHeidelberg.
Vogel, B., Vogel, H., Kleffmann, J., Kurtenbach, R., 2002. Quantification of the sources of (HNO2) in the
planetary boundary layer by numerical simulations. In: Midgley, P., Reuter, M. (Eds.), Transport and
Chemical Transformation in the Troposphere, Proceedings of EUROTRAC2 Symposium 2002. Margraf
Verlag Weikersheim, Germany. (CMD-51).
Warneck, P., 2000. Chemistry of the Natural Atmosphere, (2nd ed.). Academic Press, San Diego, p. 923.
Wiesen, P. (scientific coordinator), 2002. Nitrous Acid and its Influence on the Oxidation Capacity of the
Atmosphere (NITROCAT), final EU project report (EVK2-CT-1999-00025).
Zellweger, C., Amman, M., Hofer, P., Baltensperger, U., 1999. NOy speciation with a combined wet effluent
diffusion denuder-aerosol collector coupled to ion chromatography. Atmos. Environ. 33, 1131–1140.
Zhou, X., Civerolo, K., Dai, H., Huang, G., Schwab, J., Demerjian, K., 2002. Summertime nitrous acid chemistry
in the atmospheric boundary layer at a rural site in New York State. J. Geophys. Res. 107, 4590.


![Wednesday 1 February 2012 – Morning - A-Level Chemistry€¦ · a, of nitrous acid, HNO 2? [1] (iii) Calculate the pH of 0.375 mol dm–3 nitrous acid, HNO 2. Give your answer to](https://static.documents.pub/doc/80x56/60619fe98f46d91d590bd8b7/wednesday-1-february-2012-a-morning-a-level-chemistry-a-of-nitrous-acid-hno.jpg)


