127
Concept design of steel bottom founded support structures for offshore wind turbines Bachelor Thesis Martijn van Wijngaarden June 7 th 2013
| Date post: | 13-Mar-2018 |
| Category: |
Documents |
| Upload: | trinhquynh |
| View: | 228 times |
| Download: | 1 times |

Concept design of steel
bottom founded support structures for offshore
wind turbines
Bachelor Thesis
Martijn van Wijngaarden June 7th 2013


BSc thesis
Delft University of Technology
Faculty of Civil Engineering and Geosciences
Concept design of steel bottom founded support structures for
offshore wind turbines
Martijn van Wijngaarden
June 7th, 2013
Supervisors: Ir. P.G.F. Sliggers TU Delft Dr. Ir. P.C.J. Hoogenboom TU Delft


I
Preface
To meet growing energy demands wind energy has become an important source of energy. In the last decade wind turbines have been installed offshore to accommodate even more wind power. The offshore wind resource is of a better quality, resulting in higher electricity output. On the other hand, the costs of constructing and installing support structures for these turbines offshore is higher than onshore. Therefore offshore turbines are being made larger to economize in the support structure and installation costs. As the technology for wind turbines improves, the industry has developed wind turbines with rotor diameters as large as 150 m and power ratings of 8.0 MW. It is the intention to build wind farms in water depths of even 60 meters. The combination of increasing water depths, increasing wind tower heights and rotor blade diameters creates loads that complicate the foundation design. All of these factors pose significant challenges in the design and construction of wind turbine support structures and foundations.
This report has been written as a final work of my bachelor Civil Engineering. My interest in offshore and structural engineering leads to a subject which combines both: the comparison of different types of support structures and its foundation for large offshore wind turbines. The application limits of the mono pile, tripod and tower structure are determined and their suitability for deeper waters and larger turbines is investigated. The installation costs and installing time are taken into account for their application in an offshore wind farm. This report was written by Siebe Dorrepaal and me, our individual work is marked in the titles. Because of the required individual review, each of us had to deliver his own report. Therefore, another report with the same content has been published.
This subject was proposed by Frank Sliggers for which I would like to thank him. Furthermore we couldn’t have had a better mentor with his experience in offshore engineering. Besides Frank, I would like to thank Pierre Hoogenboom for his help with the dynamic calculations and the modeling in Scia Engineer. In spite of the fact that this bachelor thesis had to be finished in seven weeks, I enjoyed it very much and I think the development of large offshore wind turbines has a lot to offer for future sustainable energy production.
Martijn van Wijngaarden
Delft, June 7th 2013

II
Table of Contents
Preface ...................................................................................................................................................... I
Table of Contents .................................................................................................................................... II
1. Literature Study ................................................................................................................................... 1
1.1 Introduction S ................................................................................................................................. 1
1.2 Definitions S ................................................................................................................................... 1
1.3 Currently used support structures S .............................................................................................. 2
1.4 Support structures in offshore oil- and gas industry S ................................................................... 4
1.5 Bottom founded oil- and gas support structures for offshore wind S ........................................... 5
1.6 Foundation types S ......................................................................................................................... 8
1.7 Installation aspects M ..................................................................................................................... 9
1.8 Offshore wind developments M ................................................................................................... 12
1.9 Thesis outline M ........................................................................................................................... 13
2. Loads and Limit states M .................................................................................................................... 14
2.1 Ultimate limit state M ............................................................................................................... 14
2.2 Serviceability limit state M ....................................................................................................... 15
2.3 Fatigue limit state S .................................................................................................................. 16
2.4 Load and resistance factors M .................................................................................................. 17
2.5 Load combinations for ULS M ................................................................................................... 18
3. Design Basis S ..................................................................................................................................... 19
3.1 Site specific data S ........................................................................................................................ 19
3.2 Turbine characteristics M ............................................................................................................. 21
3.3 Soil characteristics M .................................................................................................................... 22
3.4 Extreme wave loads S .................................................................................................................. 22
3.5 Extreme current loads S ............................................................................................................... 24
3.6 Extreme wind loads S ................................................................................................................... 25
4. Mono Pile Support Structure M.......................................................................................................... 28
4.1 Static analysis M ........................................................................................................................... 28
4.2 Dynamic analysis M ...................................................................................................................... 34
4.3 Mono pile design M ...................................................................................................................... 40
5. Tripod Support Structure S ................................................................................................................ 48
5.1 Design inputs S ............................................................................................................................. 48
5.2 Ultimate limit state S.................................................................................................................... 49

III
5.3 Static analysis S ............................................................................................................................ 51
5.4 Dynamic analysis M ...................................................................................................................... 56
5.5 The tripod design M ...................................................................................................................... 59
6. Tower Support Structure S ................................................................................................................. 67
6.1 Design inputs S ............................................................................................................................. 67
6.2 Static analysis S ............................................................................................................................ 69
6.3 Dynamic analysis M ...................................................................................................................... 75
6.4 Tower design M ............................................................................................................................ 76
7. Cost Analysis M ................................................................................................................................... 83
7.1 Manufacturing costs M ................................................................................................................. 83
7.2 Installation costs M ....................................................................................................................... 83
7.3 Transport costs M ......................................................................................................................... 85
7.4 Support structure installation M .................................................................................................. 86
7.5 Results S ....................................................................................................................................... 87
7.6 Conclusion S ................................................................................................................................. 92
8. Conclusion and Recommendations M ................................................................................................ 94
8.1 Summary of the results M ............................................................................................................ 94
8.2 Conclusion M ................................................................................................................................ 95
8.3 Recommendations M ................................................................................................................... 96
References ............................................................................................................................................. 98
List of Figures ......................................................................................................................................... 99
List of Tables ........................................................................................................................................ 101
Appendix 1 Manual Spreadsheet Mono Pile M .................................................................................... 103
Appendix 2 Manual Spreadsheet Tripod M .......................................................................................... 107
Appendix 3 Manual Spreadsheet Tower S ........................................................................................... 111
Appendix 4 Spreadsheet Mono pile M ................................................................................................. 114
Appendix 5 Spreadsheet Tripod M ....................................................................................................... 115
Appendix 6 Spreadsheet Tower S ........................................................................................................ 116
Appendix 7 Results of the Mono Pile Calculations M ........................................................................... 117
Appendix 8 Results of the Tripod Calculations S .................................................................................. 118
Appendix 9 Deformations of the Tower Structures M ......................................................................... 119
Appendix 10 Spreadsheet for Cost Analysis M ..................................................................................... 120

1
1. Literature Study
1.1 Introduction S
To meet the growing demand of sustainable energy, an increasing number of wind turbines is planned to be installed offshore. The power output of offshore wind turbines is higher compared to onshore turbines due to the better wind quality. Another advantage is the low visual impact. A major part of the costs for offshore wind turbines are the installation costs of the support structure. To increase the benefit in terms of power output per installed wind turbine, the turbine size is increased, currently even up to 8MW. This requires larger support structures which poses a main challenge to the offshore engineer. For offshore wind turbines to be installed in shallow waters, bottom founded support structures will probably be used. Nearly all bottom founded wind turbines have up to now been installed in moderate water depths (say 10-30 meter) and then usually a mono pile foundation including a transition piece has been preferred.
Looking for other solutions in deeper water (say 30-60 meter) and larger turbines several new foundation concepts have been proposed. Most of the design concepts have been adapted from the offshore oil- and gas industry. For instance a steel jacket structure or a steel tower structure might be a more economical support structure for offshore wind turbines in deeper water. Although loads on a turbine are very different than loads on an oil- and gas topside facility, the concepts might be adapted to suit the needs of offshore wind energy production. Furthermore, the requirements for application in offshore wind farms will be different than the requirements for oil- and gas industry. In this first chapter a literature study is performed on the support structures for offshore wind turbines. First of all some definitions will be given. The currently used support structures such as the mono pile and tripod support structure will be discussed. Furthermore, the offshore oil- and gas support structures will be compared and some remarks will be made on the developments of offshore wind energy in deeper waters and with larger wind turbines. Finally, the outline of this thesis will be given.
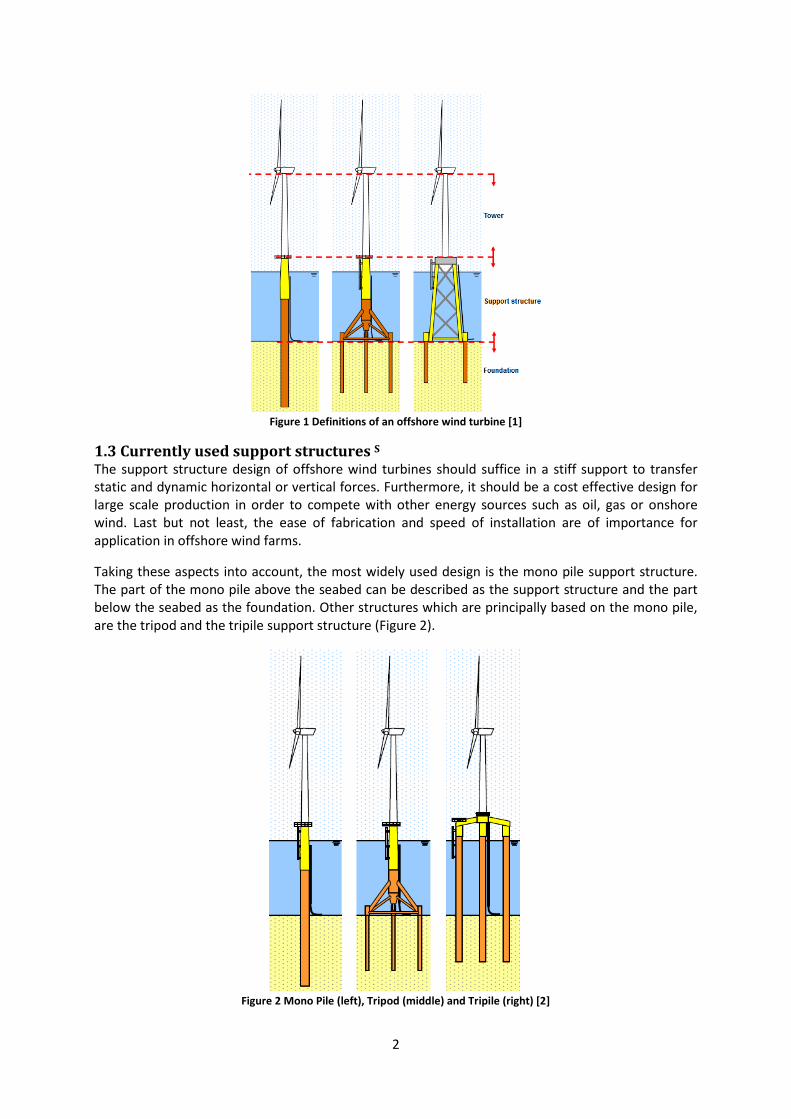
1.2 Definitions S
The support structure of offshore wind turbines connects the tower with the foundation pile, as can be seen in Figure 1. In general, the support structure can be described as the part of the wind turbine that supports the turbine and transfers all the loads to the seabed, often in combination with a foundation of steel tubular piles or suction piles. The turbine tower on the other hand, is designed by the turbine manufacturer and most of the time not influenced by the support structure design, although it is possible to combine the tower and support structure in one large truss as well. In most cases the tower is a standard steel tubular section which is connected by bolts to the transition piece. The nacelle, the hub and the rotor together form the turbine.
Currently, the commercial wind turbine is of the horizontal axis type, although a vertical axis wind turbine is possible as well. In this research, only the horizontal axis turbine will be taken into account.
The main functions of the support structure are:
• Transfer of loads from the turbine to the ground • Allow access to the turbine for maintenance and control • Support power cables from the tower down to the seabed
2
1.3 Currently used support structures S
The support structure design of offshore wind turbines should suffice in a stiff support to transfer static and dynamic horizontal or vertical forces. Furthermore, it should be a cost effective design for large scale production in order to compete with other energy sources such as oil, gas or onshore wind. Last but not least, the ease of fabrication and speed of installation are of importance for application in offshore wind farms.
Taking these aspects into account, the most widely used design is the mono pile support structure. The part of the mono pile above the seabed can be described as the support structure and the part below the seabed as the foundation. Other structures which are principally based on the mono pile, are the tripod and the tripile support structure (Figure 2).
Figure 1 Definitions of an offshore wind turbine [1]
Figure 2 Mono Pile (left), Tripod (middle) and Tripile (right) [2]

3
Besides the mentioned supports above, other support structures could be used as well, for instance jackets and gravity based structures, both adapted from the oil- and gas industry, as can be seen in Figure 3. Another example could be floating structures, which are still in the development phase and not widely used for offshore wind.
Figure 3 Partition of different types of support structures in offshore wind in 2011 [3]
1.3.1 Mono pile S
The mono pile consists of simply tubular sections which are driven into the seabed, resulting in the main benefits of this foundation type (Figure 2) [2]:
• easy fabrication • easy installation; in general if the pile diameter is <5 m. • low construction risks and proven support method
The vertical loads are transferred to the seabed by shaft friction and tip resistance. The vertical bearing capacity is therefore largely determined by the diameter of the mono pile, which influences the horizontal loads due to wind, waves and current. These horizontal loads will be transferred to the soil by bending moments. The passive soil resistance should therefore be large enough, which can be reached by a large pile diameter, influencing the horizontal and vertical forces again. In general, the horizontal forces on wind turbines will be much larger compared to topsides of oil- and gas platforms.
1.3.2 Tripod S
An alternative design of the mono pile support structure is known as the tripod support structure (Figure 2). The main part consists of a mono pile tubular section, but the lower part consists of braces and legs. The tubular steel foundation piles are driven through the sleeves in the three legs.
The main advantages of the tripod support structures compared to the mono pile are [2]: • Larger base surface and therefore more resistance to overturning moments • Shallower foundation piles required because there are three piles instead of only one • Less scour protection is needed because the three piles are mainly axially loaded
The main disadvantages of the tripod foundation compared to the mono pile are:
• Complex joint required to connect the three legs to the upper mono pile • The directionality of wind and waves need to be taken into account in the design stage • The joint between the three legs is highly susceptible to fatigue • The transportation is more difficult because the tripod requires more space on deck

4
1.3.3 Tripile S
The tripile support structure consists of three mono piles and a transition piece which fits exactly in these piles (Figure 2). This structure could be suitable for deeper waters [2]. The main advantages of this type of support structure are:
• The simple mono piles can easily be adjusted to fit different water levels • When the piles are placed further away from the center of the transition piece, a high
stiffness can be created with relatively slender piles. Furthermore, the hydrodynamic loads on each pile will be lower
On the other hand, there are some disadvantages of this structure compared to the mono pile: • The transition piece is quite complex because it has to fit exactly within the mono piles. • The transition piece is sensitive for fatigue
The foundation type of the three support structures named above, can be steel tubular piles driven into the ground and connected to the base of the support structure. The horizontal loads will be resisted with passive earth pressure, while the vertical loads will be resisted with shaft resistance and end bearing. These other possibility is a suction pile, these are used for offshore oil- and gas platforms and might be used for larger wind turbines.
1.4 Support structures in offshore oil- and gas industry S
The offshore oil- and gas industry has developed some well-established support structures, which could be adapted to suit for offshore wind applications. Offshore wind turbines with a lifetime of about 20 to 25 years can be considered as permanent structures. For the temporary structures the lifetime will only be days to several months, which is for instance the case for jack-ups. The temporary structures in offshore oil- and gas industry are not suitable for offshore wind applications.
Furthermore, a subdivision can be made according to: • The way the loads are transferred
Bottom founded or floating structures • The material from which it is constructed
Steel, concrete or even polymers
Permanent oil- and gas platforms
Compliant tower
Fixed structures
Tension leg platform
Floating platforms
Gravity base
Tower structure
Jacket structure
Figure 4 Offshore Oil- & Gas Platforms
Within the permanent structures there are some subgroup divisions, namely the fixed tower, the compliant tower, the tension leg platform and floating platforms (Figure 4). The floating platforms can be spars, semi-submersibles and submersibles. Within the fixed (bottom founded) structures, there are two truss type structures (jacket and tower) and the gravity base structures.

5
This research focuses on the bottom founded support structures for offshore wind energy production. The floating support structures will not be taken into account, although it could be a suitable structure for wind turbines in very deep waters. A major advantage of floating structures is the full fabrication of the structure onshore, and the floating transport to the location. The main disadvantages which leads to the decision not to take them into account, are:
• Very expensive in relatively shallow waters compared to bottom founded structures, because the anchoring system will be complicated
• Connection of the power cable to the wind turbine will be difficult considering the movements of the structure
The main bottom founded support structures for offshore oil- and gas industry might be used for the larger offshore wind turbines in water depths between 30 and 60 meters or even more; hence an investigation of possibilities will be made.
1.5 Bottom founded oil- and gas support structures for offshore wind S
As can be concluded from Figure 4, the permanent bottom founded support structures from oil- and gas industry can be subdivided into the following types:
• The fixed structures (gravity base, tower and jacket structures) • The compliant tower
The fixed structures can be subdivided into the gravity base, the jacket type and the truss tower type [4]. The gravity base structures are in most cases made of concrete because of its high density, but in theory it could be made from steel with internal ballast as well. The high weight and low point of gravity of this type ensures the rotational stability, but it also requires a careful seabed preparation preventing liquefaction of the soil. In this research, the gravity base will not be taken further into account. Often the tower and jacket structure are both used for steel space frames structures in general, although there is an important difference in the type of foundation. For the jacket type, the foundation piles are driven through the legs and connected to the legs by a weld at the top. For the truss tower structure, the piles are connected to pile sleeves at the base of the structure, for instance by grouting. In most cases the support structure is first placed on the seabed, after which the pile driving takes place. It should be noted that the tower support structure is not related to the tower of the wind turbine itself. The main difference between the fixed and the compliant tower structure is the load distribution [5]: for a fixed tower this means that the static and dynamic forces are all transmitted to the seafloor. For the compliant tower (Figure 4) on the other hand, the horizontal dynamic loads are counteracted by the inertia forces. This reduces the internal forces in the structure as well as the support reactions. The vertical dynamic loads are transferred to the seafloor like a fixed tower, because the platform is vertically constrained from appreciable movement, although these forces are less common appreciated. The static loads are transferred to the seabed in the same way as for the fixed structure.
1.5.1 Jacket S
A jacket support structure is a fixed structure consisting of a welded tubular space frame with three or more legs. The bracing system between the legs gives the stiffness to the structure, because it actually acts as a buckling resistor of the steel tubular piles inside the legs. The forces are transferred to the seabed by axial forces in the members.

6
The main advantages of the jacket structure for the application in offshore wind foundations are: • The large base of the jacket offers a large resistance to overturning moments • The jacket is a light and efficient construction (axial forces) and saves material compared to
the mono pile in case of deeper waters The main disadvantages are:
• Every node of the trusses needs to be designed, resulting in high design costs • Transportation of the jacket requires a lot more space compared to a mono pile support
Figure 5 Jacket support structure: piles are driven through the legs [6]
The jacket support structure can be built in various types, for instance with three or four legs (Figure 5). The most widely used support structure is the four leg jacket, but the three leg jacket can be beneficial because less material is required. On the other hand, a three legged jacket needs some extra detailing work because the angle between the legs becomes smaller and the joints gets more difficult. In this study, only the four legged jacket will be taken into account. For a jacket type support, the piles are driven through the legs and connected at the top by shim plates (Figure 6). The connection can therefore be made above water, which makes it easier and better accesible for maintenance. The piles need to be very long, even when a relatively small jacket is considered. For instance for a water depth of 45 meters, the jacket will be up to 60 or 70 meters long, requiring piles of even 100 meter. The pile sections have to be welded offshore, resulting in less welding quality, making this an uneconomical choice.
Figure 6 Connection of pile and leg with shim plates at the top of a jacket [7]

7
1.5.2 Truss tower S
The truss tower design could be used for the whole structure between foundation and turbine or only for the part below the tower of the wind turbine. Usually the latter one is preferable, because in this case a standard tubular tower can be used. On the other hand, a braced structure is lighter and has the same stiffness as a large diameter steel tube of the standard wind turbine tower. The main disadvantage of a full truss tower is the difficulty with the design of the joints, which results in high design and manufacturing costs. One of the main challenges in this design will be the connection between the truss tower and the rotor. This type of truss tower is also called the lattice tower, which has been used in history for onshore wind turbines (Figure 7). The tower structures can be designed with three or four legs.
As can be seen, for both tower structures the piles are driven through the pile sleeves and connected at the base of the structure. This can be done with pre piled piles or with post piled piles, as will be discussed in chapter 1.7.3, as well as the grouted connection between pile and leg at the seabed.
Figure 7 Offshore three legged tower (left) and full truss tower (right) [2]
1.5.3 Compliant tower S
The compliant tower can be used for oil- & gas production in water depths between 300 and 600 meter (Figure 8) [2]. The intention is to have the first natural frequency below the wave frequencies with high energy, in order to avoid resonance. In turn, this implies that a light and slender structure can be achieved. There are some reasons why this type of structure is currently not used in offshore wind turbine foundations in relatively shallow waters (30 - 70 meters):
• For relatively shallow water the system becomes too stiff • The interaction between the compliant tower and the turbine exerts large forces on the top
of the relatively flexible tower compared to oil- or gas structures • The wind contains the most energy at low frequencies, interfering with the natural frequency
of the tower and eventually leading to resonance
Therefore, the compliant tower is not further taken into account.
8
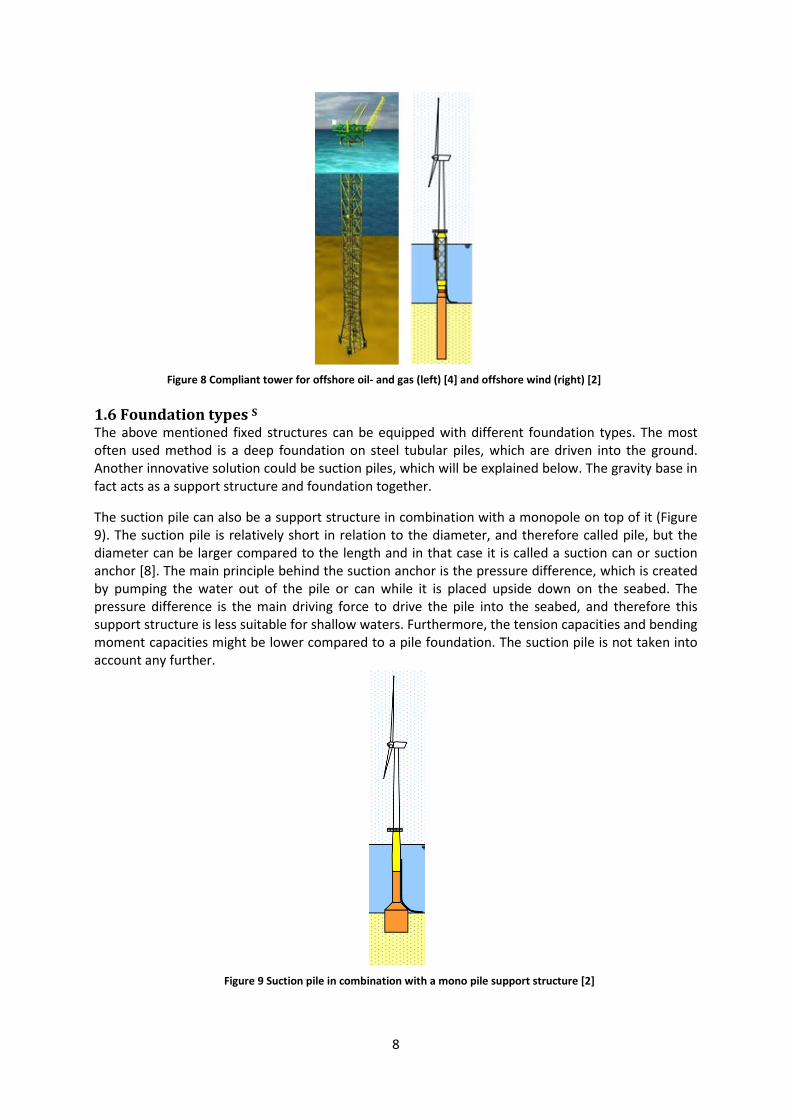
Figure 9 Suction pile in combination with a mono pile support structure [2]
1.6 Foundation types S
The above mentioned fixed structures can be equipped with different foundation types. The most often used method is a deep foundation on steel tubular piles, which are driven into the ground. Another innovative solution could be suction piles, which will be explained below. The gravity base in fact acts as a support structure and foundation together.
The suction pile can also be a support structure in combination with a monopole on top of it (Figure 9). The suction pile is relatively short in relation to the diameter, and therefore called pile, but the diameter can be larger compared to the length and in that case it is called a suction can or suction anchor [8]. The main principle behind the suction anchor is the pressure difference, which is created by pumping the water out of the pile or can while it is placed upside down on the seabed. The pressure difference is the main driving force to drive the pile into the seabed, and therefore this support structure is less suitable for shallow waters. Furthermore, the tension capacities and bending moment capacities might be lower compared to a pile foundation. The suction pile is not taken into account any further.
Figure 8 Compliant tower for offshore oil- and gas (left) [4] and offshore wind (right) [2]
9
1.7 Installation aspects M
In this paragraph the installation sequence will be discussed for a mono pile, tripod and tower structure.
1.7.1 Mono pile M
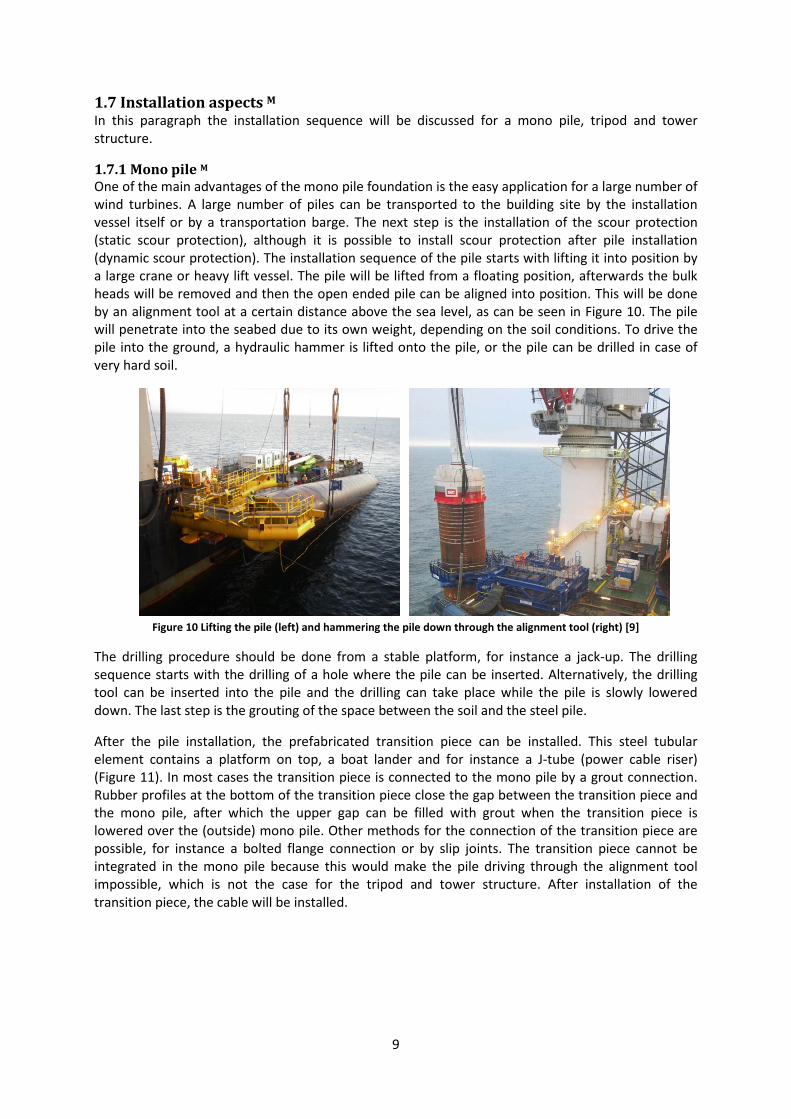
One of the main advantages of the mono pile foundation is the easy application for a large number of wind turbines. A large number of piles can be transported to the building site by the installation vessel itself or by a transportation barge. The next step is the installation of the scour protection (static scour protection), although it is possible to install scour protection after pile installation (dynamic scour protection). The installation sequence of the pile starts with lifting it into position by a large crane or heavy lift vessel. The pile will be lifted from a floating position, afterwards the bulk heads will be removed and then the open ended pile can be aligned into position. This will be done by an alignment tool at a certain distance above the sea level, as can be seen in Figure 10. The pile will penetrate into the seabed due to its own weight, depending on the soil conditions. To drive the pile into the ground, a hydraulic hammer is lifted onto the pile, or the pile can be drilled in case of very hard soil.
Figure 10 Lifting the pile (left) and hammering the pile down through the alignment tool (right) [9]
The drilling procedure should be done from a stable platform, for instance a jack-up. The drilling sequence starts with the drilling of a hole where the pile can be inserted. Alternatively, the drilling tool can be inserted into the pile and the drilling can take place while the pile is slowly lowered down. The last step is the grouting of the space between the soil and the steel pile.
After the pile installation, the prefabricated transition piece can be installed. This steel tubular element contains a platform on top, a boat lander and for instance a J-tube (power cable riser) (Figure 11). In most cases the transition piece is connected to the mono pile by a grout connection. Rubber profiles at the bottom of the transition piece close the gap between the transition piece and the mono pile, after which the upper gap can be filled with grout when the transition piece is lowered over the (outside) mono pile. Other methods for the connection of the transition piece are possible, for instance a bolted flange connection or by slip joints. The transition piece cannot be integrated in the mono pile because this would make the pile driving through the alignment tool impossible, which is not the case for the tripod and tower structure. After installation of the transition piece, the cable will be installed.

10
Figure 11 Mono pile/transition piece connection with other elements [10]
The installation of the turbine tower will be done in several steps. First the tower which is bolted to the transition piece will be installed. The rotor and nacelle might be installed separately or with the so called bunny ear method. The sequence can be summarized as follows:
• Scour protection • Foundation pile • Transition piece • Cable installation • Turbine tower, nacelle and rotor/blades
Furthermore, a transformation station has to be placed (on the seabed) and a grid connection to the shore will be installed. Eventually, the cable can be installed after the tower, nacelle and blades have been placed.
1.7.2 Tripod M
The tripod installation starts with the transportation of the prefabricated tripod on a barge. A major difference between mono piles and tripods is the required space one deck to transport several structures in one time. In case of a wind farm designed with tripods, the transportation will be more complicated and a governing parameter for this will be the distance to the shore. This will be taken into account in chapter 7.
For the currently installed tripods, the post piled method has only been used. In this case the tripod will be placed on the seabed first, therefore mud mats are necessary to ensure a stable settling. The lowering is done by a heavy lift vessel (HLV). Then the foundation piles (steel tubular piles; post driven) can be driven through the pile sleeves at the corners of the tripod by a (submersible) hydraulic hammer. This pile driving will probably be done from the heavy lift vessel as well, or can be done from a smaller crane vessel or jack up as was done for the Alpha Ventus wind farm in Germany [9]. When the pile top has reached the same level as the pile sleeve, both can be connected by grout. When a tripod is used, no transition piece is strictly necessary. The transition piece can actually be integrated in the tripod design, which saves installation time and therefore money. The J-tube, boat lander and platform may be connected to the upper part of the tripod (Figure 12).

11
Figure 12 Tripod and truss tower support structure with some details indicated [10]
1.7.3 Truss tower M
There are two main options for installing the tower support structure: with pre driven or post driven foundation piles. For the Alpha Ventus Test Field in Germany the first option was chosen, and therefore the pile sleeves of the tower structure had to fit exactly over the pre driven piles. This was accomplished by driving the piles through a temporary template, which was retrieved after driving the four piles. This template contains mudmats and sleeves through which the piles are driven and can be used up to about 50 times again.
In offshore wind industry, the piles are nearly always pre piled or pre driven. In offshore oil- and gas, the post piling or post driven method is used more frequently because there is often only one support structure to be installed. An important aspect in the application of pre driven piles for tower structures in offshore wind farms is the time between installing the piles and the tower structure. If this is a large time span, marine growth at the pile top may undermine the connection between pile and pile sleeve with grout. Therefore, in offshore wind farms it should be avoided to first drive all the piles and placing the tower structures afterwards.
The pile driving can be executed by an auxiliary vessel. This is a relatively small vessel with a crane on deck to lift the piling template to the seabed and to lift the foundation piles into position. Furthermore, it has to carry the hydraulic hammer as well. The tower installation has to be executed by a heavy lift vessel due to the large weight. In case of post piling, the pile driving will also be done from the heavy lift vessel.
The main advantages of pre piling are: • The heavy lift vessel is not used for pile driving, reducing costs • The activities can be planned separately, i.e. first pile driving and then tower placement,
which has to be done all behind each other in case of post piling • Mudmats are not necessary, while for post piling they have to be connected to the tower
structure
The main disadvantages of pre piling are: • A piling template is required • A survey of the driven piles is required afterwards, to ensure that the tower fits over the piles • It demands a high accuracy of the tower placement • The complete installation time will be higher than post piling, due to the longer time it takes
for installation of the tower with pre driven piles
12
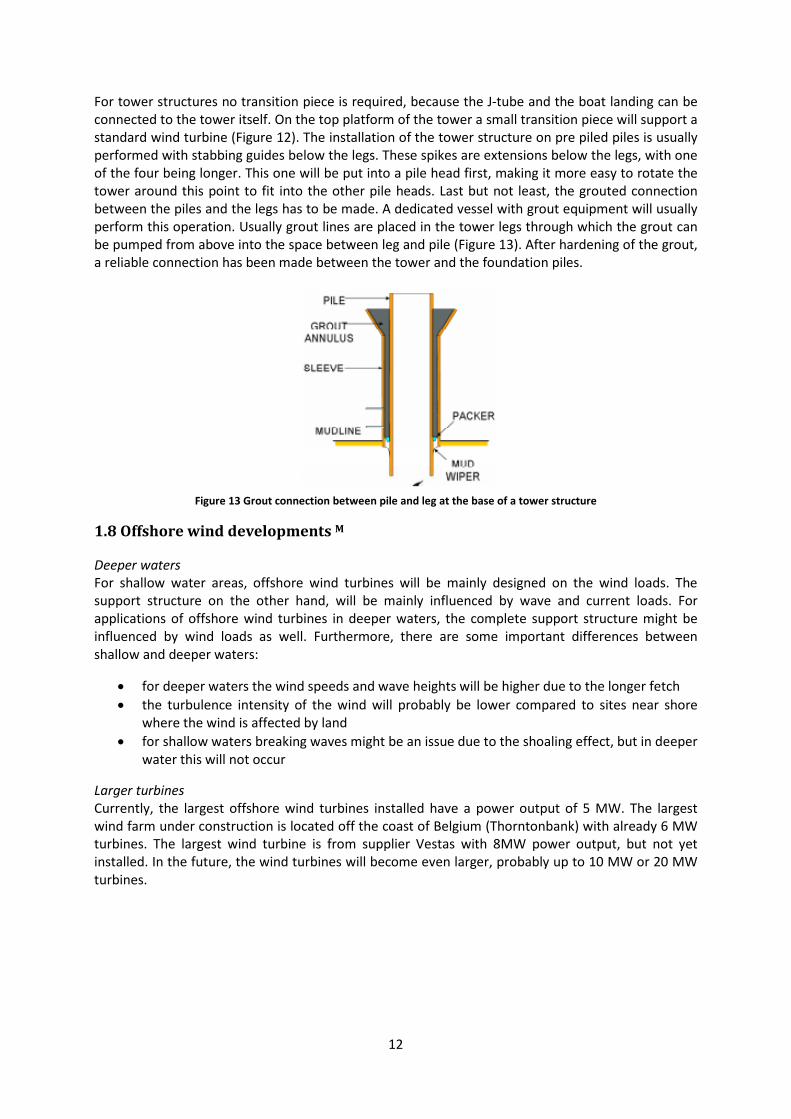
For tower structures no transition piece is required, because the J-tube and the boat landing can be connected to the tower itself. On the top platform of the tower a small transition piece will support a standard wind turbine (Figure 12). The installation of the tower structure on pre piled piles is usually performed with stabbing guides below the legs. These spikes are extensions below the legs, with one of the four being longer. This one will be put into a pile head first, making it more easy to rotate the tower around this point to fit into the other pile heads. Last but not least, the grouted connection between the piles and the legs has to be made. A dedicated vessel with grout equipment will usually perform this operation. Usually grout lines are placed in the tower legs through which the grout can be pumped from above into the space between leg and pile (Figure 13). After hardening of the grout, a reliable connection has been made between the tower and the foundation piles.
Figure 13 Grout connection between pile and leg at the base of a tower structure
1.8 Offshore wind developments M
Deeper waters For shallow water areas, offshore wind turbines will be mainly designed on the wind loads. The support structure on the other hand, will be mainly influenced by wave and current loads. For applications of offshore wind turbines in deeper waters, the complete support structure might be influenced by wind loads as well. Furthermore, there are some important differences between shallow and deeper waters:
• for deeper waters the wind speeds and wave heights will be higher due to the longer fetch • the turbulence intensity of the wind will probably be lower compared to sites near shore
where the wind is affected by land • for shallow waters breaking waves might be an issue due to the shoaling effect, but in deeper
water this will not occur
Larger turbines Currently, the largest offshore wind turbines installed have a power output of 5 MW. The largest wind farm under construction is located off the coast of Belgium (Thorntonbank) with already 6 MW turbines. The largest wind turbine is from supplier Vestas with 8MW power output, but not yet installed. In the future, the wind turbines will become even larger, probably up to 10 MW or 20 MW turbines.
13
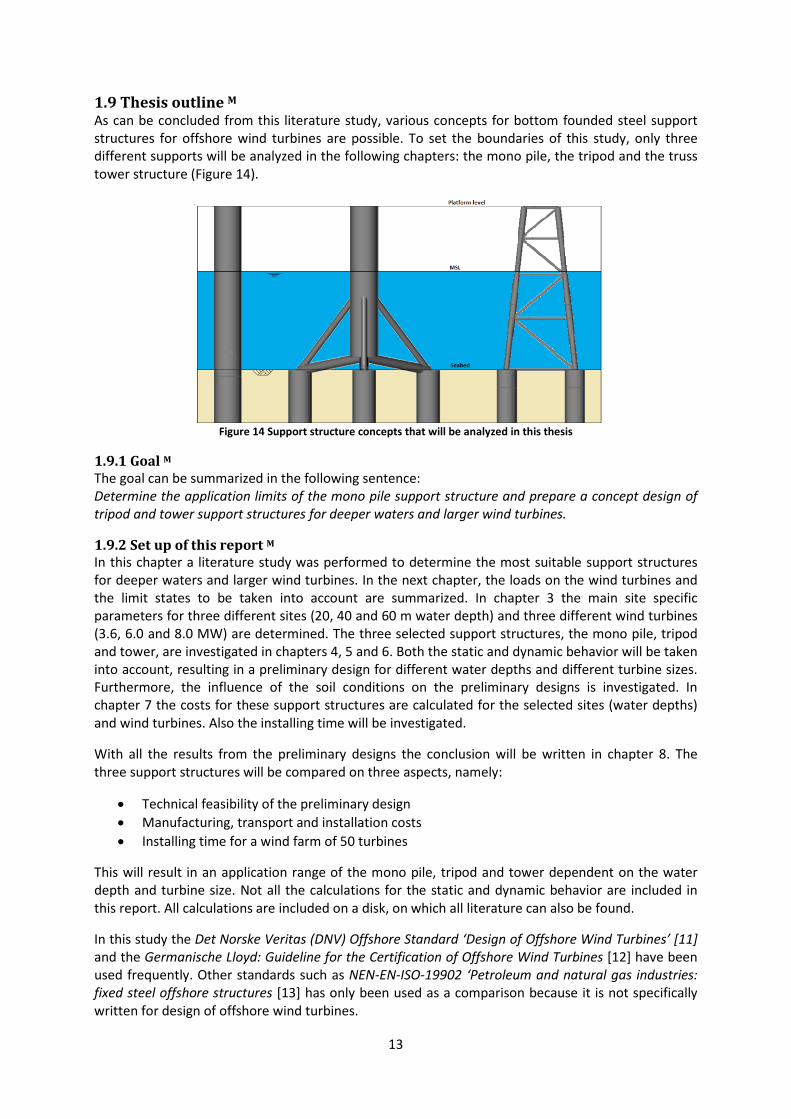
1.9 Thesis outline M
As can be concluded from this literature study, various concepts for bottom founded steel support structures for offshore wind turbines are possible. To set the boundaries of this study, only three different supports will be analyzed in the following chapters: the mono pile, the tripod and the truss tower structure (Figure 14).
Figure 14 Support structure concepts that will be analyzed in this thesis
1.9.1 Goal M
The goal can be summarized in the following sentence: Determine the application limits of the mono pile support structure and prepare a concept design of tripod and tower support structures for deeper waters and larger wind turbines.
1.9.2 Set up of this report M
In this chapter a literature study was performed to determine the most suitable support structures for deeper waters and larger wind turbines. In the next chapter, the loads on the wind turbines and the limit states to be taken into account are summarized. In chapter 3 the main site specific parameters for three different sites (20, 40 and 60 m water depth) and three different wind turbines (3.6, 6.0 and 8.0 MW) are determined. The three selected support structures, the mono pile, tripod and tower, are investigated in chapters 4, 5 and 6. Both the static and dynamic behavior will be taken into account, resulting in a preliminary design for different water depths and different turbine sizes. Furthermore, the influence of the soil conditions on the preliminary designs is investigated. In chapter 7 the costs for these support structures are calculated for the selected sites (water depths) and wind turbines. Also the installing time will be investigated.
With all the results from the preliminary designs the conclusion will be written in chapter 8. The three support structures will be compared on three aspects, namely:
• Technical feasibility of the preliminary design • Manufacturing, transport and installation costs • Installing time for a wind farm of 50 turbines
This will result in an application range of the mono pile, tripod and tower dependent on the water depth and turbine size. Not all the calculations for the static and dynamic behavior are included in this report. All calculations are included on a disk, on which all literature can also be found.
In this study the Det Norske Veritas (DNV) Offshore Standard ‘Design of Offshore Wind Turbines’ [11] and the Germanische Lloyd: Guideline for the Certification of Offshore Wind Turbines [12] have been used frequently. Other standards such as NEN-EN-ISO-19902 ‘Petroleum and natural gas industries: fixed steel offshore structures [13] has only been used as a comparison because it is not specifically written for design of offshore wind turbines.

14
2. Loads and Limit states M
Considering the loads, there are three different categories (load classes) according to DNV [11]: Permanent loads, denoted with G, including:
• mass of structure (rotor, hub, nacelle, tower, support structure and foundation) • mass of permanent ballast and equipment • external and internal hydrostatic pressure of a permanent nature • reaction to the above, e.g. articulated tower base reaction
Environmental loads, denoted with E, including:
• wind loads • hydrodynamic loads induced by waves and current • earthquake loads • tidal effects • marine growth • snow and ice loads
Variable Functional loads, denoted with Q. These loads affect the structure due to operations and normal use of the structure, including:
• actuation loads due to operation and control of the wind turbine • loads on access platforms and internal structures such as ladders and platforms • ship impacts from service vessels • crane operational loads
Accidental loads such as dropped objects, ship collisions and explosions are not taken into account. As these loads are not taken into account, the accidental limit state (ALS) will not be discussed any further. All the loads above will result in deformations of the structure. For these loads, a separate load class exists which is denoted with D.
The following limit states should be analyzed after the determination of the design inputs: • Ultimate limit state (ULS) • Serviceability limit state (SLS) • Fatigue limit state (FLS)
2.1 Ultimate limit state M
For the ULS analysis the following should be checked in this preliminary design:
• Yielding: yield stress check for axially loaded steel cross sections • Global buckling: global buckling check for the piles above the mudline • D/t ratio for unstiffened cross sections should stay <120 according to DNV • Foundation stability: check of the horizontal and vertical equilibrium of the pile foundation
The checks can be executed with the following formulas, according to DNV [11]:
Yielding: 𝜎𝑓𝑦𝑦𝑚
≤ 1 [-]
Global buckling: 𝑁𝑑𝜒 ∗ 𝑁𝑝
+ ß ∗ 𝑀𝑑𝑀𝑝
+ ∆𝑛 ≤ 1 [-]

15
Where: 𝑓𝑦 = yield stress of steel, dependent on wall thickness 𝑦𝑚 = safety factor for steel 𝑁𝑑 = design value of axial force 𝑁𝑝 = plastic compression resistance = 𝐴 ∗ 𝑓𝑦
𝑦𝑚
𝜒 = reduction factor for buckling capacity, dependent on imperfections and relative slenderness
ß = moment coefficient, dependent on moment diagram (= 1,0) 𝑀𝑑 = design value of the bending moment 𝑀𝑝 = plastic moment resistance = 𝑊𝑝 ∗
𝑓𝑦𝑦𝑚
and 𝑊𝑝 = plastic section modulus (1.698 * 𝑊𝑒 ) [12]
∆𝑛 = 0.25 ∗ 𝜒 ∗ 𝜆2 ≤ 0,1
𝜆 = relative slenderness = �𝑁𝑝 ∗ 𝑦𝑚𝐹𝑒𝑢𝑙𝑒𝑟
𝐹𝑒𝑢𝑙𝑒𝑟 = Euler buckling load = 𝜋2 𝐸𝐼4 (𝐿𝑓𝑖𝑥𝑒𝑑+ 𝑤𝑎𝑡𝑒𝑟𝑑𝑖𝑒𝑝𝑡𝑒+ℎ𝑢𝑏 ℎ𝑒𝑖𝑔ℎ𝑡)2
Two forms of buckling can be identified: global buckling and local buckling. Global buckling leads to failure of the complete structure, while local buckling is only locally but could develop into failure of the complete structure as well. The local buckling of the pipe due to a combination of axial forces, bending moments and compressive hoop stresses will be neglected, because the hoop stresses will be negligible due to the absence of a pressure difference at the inside and outside of the pile. The moment will increase first due to wave, wind and current loads, but below the seabed it will decrease when the loads are transmitted to the soil. The buckling test should be performed in a critical cross section, where the bending moment and axial force are largest. For the mono pile, this critical cross section will be located below the seabed, and therefore the pile will be stiffened by the surrounding soil. It could therefore be argued that buckling is not likely to occur in this zone, although it should be checked for a final design. The last term, the buckling load according to Euler, is determined using a schematised load diagram of an one sided fixed beam with a length equal to the estimated fixed depth (the depth at which the fixed support can be schematised, which is 3.5 times the pile diameter, see chapter 4) plus the water depth (MSL) and the height of the hub above the water level (MSL). The foundation stability can be checked after the pile diameter and the required embedded length have been determined. These two parameters largely influence the stiffness of the structure, and will be relevant to prevent resonance. These parameters will be determined in the next chapter.
2.2 Serviceability limit state M
There are two requirements for deformation of the support structure at the mudline (seabed), which are according to the DNV [11]:
• Lateral deflection at mudline (seabed) less than 0.03 * Dpile • Rotation at mudline (seabed) less than 0.5 ̊
As can be seen, no settlement requirements are taken into account. The main reason is the high lateral load compared to the vertical load on the support structures of offshore wind turbines. The axial resistance by the soil furthermore needs some settlement to develop, which makes the settlements of less importance compared to lateral displacements and rotations of the structure. In the SLS, only the mean environmental loads are taken into account.

16
2.3 Fatigue limit state S
Fatigue loads are caused by continuous stress differences in a structural component. Every time a stress difference occurs, a new crack will be formed or an existing crack will be enlarged. At some point, the crack is that big, that the structure will fail. Because of the wind and wave loads, especially offshore structures will encounter this problem, mainly near joints where stress accumulates. Therefore, a separate limit state has to be taken into account according to DNV [11], namely the Fatigue Limit State (FLS). This means that the design fatigue lifetime has to be longer than the design lifetime, which is expressed in the number of stress cycles. In this study, the design lifetime of a wind turbine is assumed to be 25 years. The number of cycles in 25 years depends on the period of the loading, which easily results in the number of cycles:
𝑁𝑟𝑒𝑓 = 𝑇𝑑𝑒𝑠𝑖𝑔𝑛 𝑙𝑖𝑓𝑒
𝑇𝑝 [-]
For offshore wind turbines there are two loads to be considered for fatigue: mean wind and mean wave loads. No extreme environmental loads should be considered in the FLS, because this will not lead to fatigue. These mean wind and wave load will add up to a total fatigue loading, which is higher than when they are considered separately. Due to the random phase relation between wind and curves, an approximation should be made of the combined fatigue load of waves and wind on a wind turbine. According to [7] the equivalent stress range of combined mean wind and mean wave loads can be approximated with:
∆𝜎𝑒𝑞 = �∆𝜎𝑤𝑖𝑛𝑑2 + ∆𝜎𝑤𝑎𝑣𝑒2 [N/mm2]
Furthermore, it is preferred to analyze fatigue for different combination of wind and wave directions. This leads to a very large number of calculations, therefore it is assumed that both wind and wave act in the same direction. This is a conservative approach because it leads to an accumulation of fatigue loads in a single location. The fatigue analysis should be performed for different stages of operation. Especially the startup and stoppages can result in high fatigue loads. In this study, only the operational (power producing) state is considered. Next to this, only global fatigue analyses in the most critical cross section (largest bending moment) is performed, i.e. no fatigue checks for welds and other local connections are taken into account.
The design fatigue lifetime can be determined with the S-N curve. These empirically determined curves give a log-log relationship between the allowed number of cycles N at which failure occurs and the stress range Δσ. Only the stress range is important, not the actual mean stress. This gives a relation between the number of cycles to failure N and the stress range Δσ:
log10 𝑁𝑒𝑞 = log10 𝑎 − 𝑚 log10 �∆𝜎𝑒𝑞 �𝑡𝑡𝑟𝑒𝑓
�𝑘
�
Where: 𝑁𝑟𝑒𝑓 = number of stress cycles to failure at stress range ∆𝜎𝑒𝑞 ∆𝜎𝑒𝑞 = equivalent stress range due to wind and wave loads (MPa) 𝑚 = negative slope of S-N curve on log N – log S plot log𝑎 = intercept of log N axis 𝑡𝑟𝑒𝑓 = reference thickness, tref = 32 mm for tubular joints, tref = 25 mm for welded
connections other than tubular joints, such as girth welds 𝑡 = thickness through which the potential fatigue crack will grow; t=tref shall be used in
expression when 𝑡 < 𝑡𝑟𝑒𝑓 𝑘 = thickness exponent, also known as scale exponent

17
According to the Miner rule [1], the total number of stress cycles should be calculated for different stress ranges with different periods of mean wind and mean wave loads. When all stress ranges are known, the total fatigue damage can be calculated as the sum of the number of cycles per stress range divided by the maximum allowable number of cycles. In this research only a simplified method has been used, in which only the period with the largest fatigue influence has been used (10 s.) [7]. No other periods of mean wind and wave loads have been into account. The total number of stress has to stay below the number of stress cycles at which failure occurs, which is expressed as the equivalent fatigue damage 𝐷𝑓𝑎𝑡𝑖𝑔𝑢𝑒:
𝐷𝑓𝑎𝑡𝑖𝑔𝑢𝑒 =𝑁𝑟𝑒𝑓𝑁𝑒𝑞
< 1,0
The different coefficients m, log(a) and k can be determined according to the DNV offshore standard [11]. The coefficients are given in Table 1 for welds in tubular joints in seawater with cathodic protection, as considered in this study.
Weld in tubular joint
In seawater with cathodic protection log(a) m Range of validity k
11.764 3 N <10^5 0.25 15.606 5 N >10^6 0.25
Table 1 Coefficients for S-N curves, according to the DNV offshore standard
For mono pile foundations, the equivalent stress range may be used for the fatigue assessment. For fatigue analysis of tubular joints of the tripod and tower structure, a Stress Concentration Factor (SCF) is used to determine the stress range in a local joint. For the mono pile, no local fatigue analysis will be performed. For the tripod, only the main joint will be analyzed. For the tower structure all joint between braces, legs and horizontal members are taken into account. The SCF can be used to determine the stress range in a local joint with the already determined equivalent stress range:
∆𝜎𝑗𝑜𝑖𝑛𝑡 = 𝑆𝐶𝐹 ∗ ∆𝜎𝑒𝑞 [N/mm2]
The SCF will vary from joint to joint and depends on the local geometry. The SCF for joints in the tripod and tower design are assumed to be 3.0 for joints of all geometries.
2.4 Load and resistance factors M
For permanent loads (G) and variable functional loads (Q), the load factor in the ULS shall normally be taken as γf = 1.0. When a permanent load (G) or a variable functional load (Q) is a favorable load, then a load factor γf = 0.9 shall be applied.
Load State Load Factors γf (DNV-OS-J101) G E
1 ULS Extreme permanent loads and normal environmental loads 1.25 1.00 2 ULS Normal permanent loads and extreme environmental loads 1.00 1.35 3 SLS 1.00 1.00 4 FLS 1.00 1.00
Table 2 Load factors for the ultimate limit state, according to the DNV Offshore standard
Under normal circumstances, the overburden soil pressure works favorable for foundation designs, and should be calculated with a combination factor of 0.9. According to DNV [11], this combination factor should not be taken into account (taken as 1.0) in geotechnical calculations. Therefore, all the permanent loads are unfavorable, which results in a load factor of 1.0 for permanent loads in ULS 2.
18
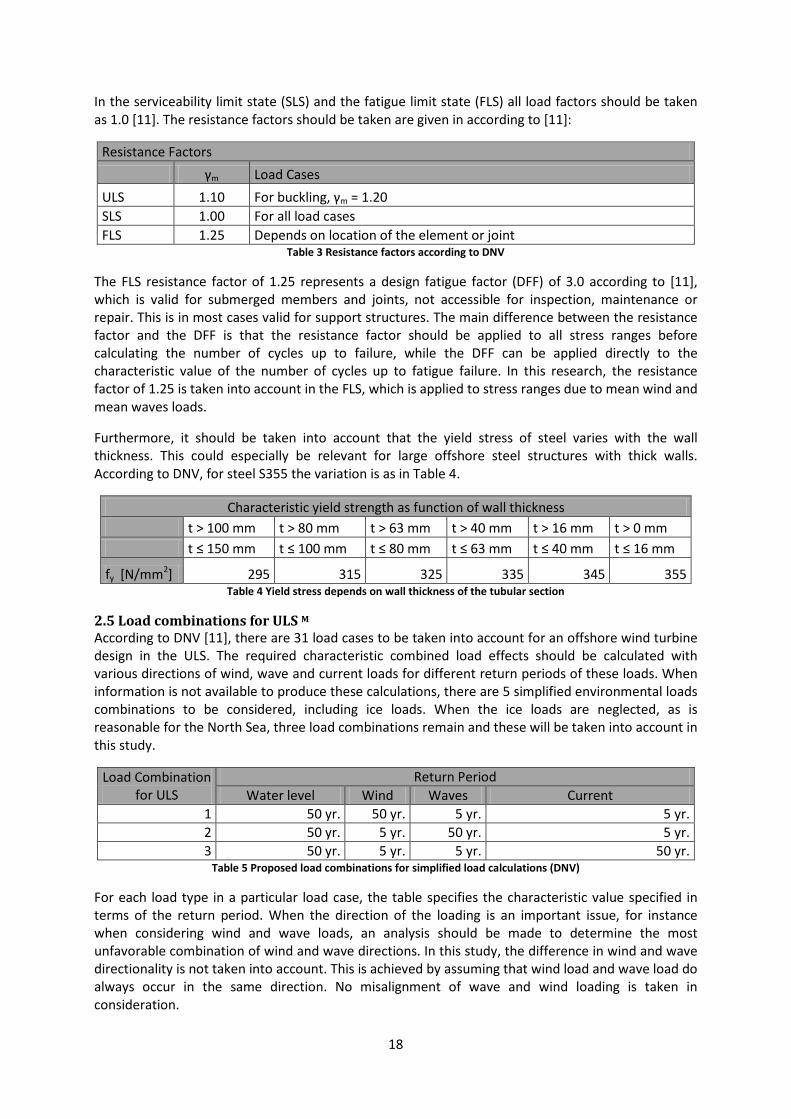
In the serviceability limit state (SLS) and the fatigue limit state (FLS) all load factors should be taken as 1.0 [11]. The resistance factors should be taken are given in according to [11]:
Resistance Factors γm Load Cases ULS 1.10 For buckling, γm = 1.20 SLS 1.00 For all load cases FLS 1.25 Depends on location of the element or joint
Table 3 Resistance factors according to DNV
The FLS resistance factor of 1.25 represents a design fatigue factor (DFF) of 3.0 according to [11], which is valid for submerged members and joints, not accessible for inspection, maintenance or repair. This is in most cases valid for support structures. The main difference between the resistance factor and the DFF is that the resistance factor should be applied to all stress ranges before calculating the number of cycles up to failure, while the DFF can be applied directly to the characteristic value of the number of cycles up to fatigue failure. In this research, the resistance factor of 1.25 is taken into account in the FLS, which is applied to stress ranges due to mean wind and mean waves loads.
Furthermore, it should be taken into account that the yield stress of steel varies with the wall thickness. This could especially be relevant for large offshore steel structures with thick walls. According to DNV, for steel S355 the variation is as in Table 4.
Characteristic yield strength as function of wall thickness t > 100 mm t > 80 mm t > 63 mm t > 40 mm t > 16 mm t > 0 mm t ≤ 150 mm t ≤ 100 mm t ≤ 80 mm t ≤ 63 mm t ≤ 40 mm t ≤ 16 mm
fy [N/mm2] 295 315 325 335 345 355 Table 4 Yield stress depends on wall thickness of the tubular section
2.5 Load combinations for ULS M
According to DNV [11], there are 31 load cases to be taken into account for an offshore wind turbine design in the ULS. The required characteristic combined load effects should be calculated with various directions of wind, wave and current loads for different return periods of these loads. When information is not available to produce these calculations, there are 5 simplified environmental loads combinations to be considered, including ice loads. When the ice loads are neglected, as is reasonable for the North Sea, three load combinations remain and these will be taken into account in this study.
Load Combination for ULS
Return Period Water level Wind Waves Current
1 50 yr. 50 yr. 5 yr. 5 yr. 2 50 yr. 5 yr. 50 yr. 5 yr. 3 50 yr. 5 yr. 5 yr. 50 yr.
Table 5 Proposed load combinations for simplified load calculations (DNV)
For each load type in a particular load case, the table specifies the characteristic value specified in terms of the return period. When the direction of the loading is an important issue, for instance when considering wind and wave loads, an analysis should be made to determine the most unfavorable combination of wind and wave directions. In this study, the difference in wind and wave directionality is not taken into account. This is achieved by assuming that wind load and wave load do always occur in the same direction. No misalignment of wave and wind loading is taken in consideration.

19
3. Design Basis S
The main design inputs for offshore wind turbines can be summarized as follows:
• Water depth at specific location • Turbine loads, dependent on size and weight • Soil properties at specific location • Site specific loads due to waves, current and tide • Design, construction and installation costs • Installation time for a complete wind farm
As can be seen, there can be some conflicting requirements considering the site specific conditions such as water depth, soil properties and site specific loads and the requirements for a large number of wind turbines. It should be avoided to design, construct and install different support structures for every wind turbine within one wind farm, and therefore there should be an optimization for the local site conditions and for the large number of installations.
Mostly only one season a year is suitable to use for the installation of wind turbines. This asks a fast and easy installation phase if a whole wind farm has to be constructed. Every delay at the construction site will slow the construction process. The same counts for the eventual installation where maybe two instead of one lifting vessel or crane has to be used.
Large wind farms are built for commercial reasons, so it has to be economic feasible. That means that the goal is to produce electricity at the lowest possible cost per produced kWh. Therefore, every cost increasing part of the construction has to be lowered in such a manner that an optimal method for the construction and installation will be established.
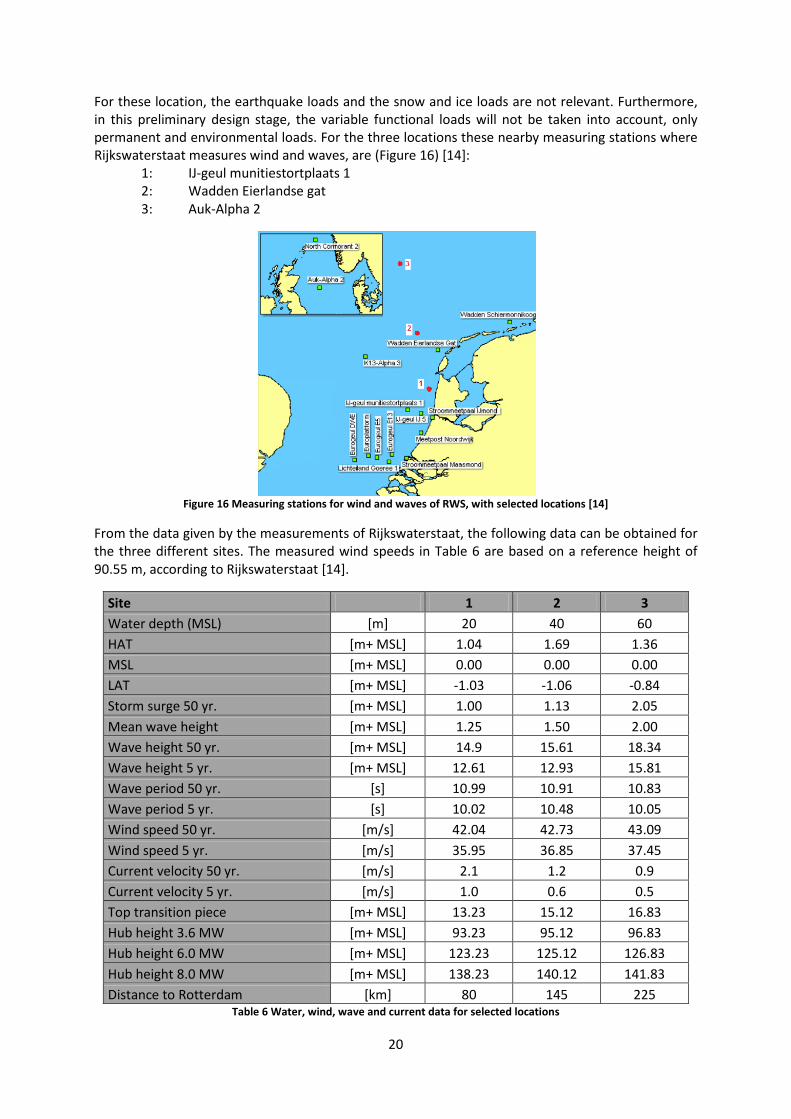
3.1 Site specific data S
The water depth is one of the main parameters influencing the support structure design. To include the effect of the water depth in this study, three different locations in the Dutch sector of the North Sea have been selected as can be seen in Figure 15. The locations are outside any sailing routes and have average water depths of approximately 20, 40 and 60 meters. To determine the meteorological condition, for every location a nearby measuring station of Rijkswaterstaat has been found.
Figure 15 Three different locations in the North Sea have been selected
20
For these location, the earthquake loads and the snow and ice loads are not relevant. Furthermore, in this preliminary design stage, the variable functional loads will not be taken into account, only permanent and environmental loads. For the three locations these nearby measuring stations where Rijkswaterstaat measures wind and waves, are (Figure 16) [14]: 1: IJ-geul munitiestortplaats 1 2: Wadden Eierlandse gat 3: Auk-Alpha 2
Figure 16 Measuring stations for wind and waves of RWS, with selected locations [14]
From the data given by the measurements of Rijkswaterstaat, the following data can be obtained for the three different sites. The measured wind speeds in Table 6 are based on a reference height of 90.55 m, according to Rijkswaterstaat [14].
Site 1 2 3 Water depth (MSL) [m] 20 40 60 HAT [m+ MSL] 1.04 1.69 1.36 MSL [m+ MSL] 0.00 0.00 0.00 LAT [m+ MSL] -1.03 -1.06 -0.84 Storm surge 50 yr. [m+ MSL] 1.00 1.13 2.05 Mean wave height [m+ MSL] 1.25 1.50 2.00 Wave height 50 yr. [m+ MSL] 14.9 15.61 18.34 Wave height 5 yr. [m+ MSL] 12.61 12.93 15.81 Wave period 50 yr. [s] 10.99 10.91 10.83 Wave period 5 yr. [s] 10.02 10.48 10.05 Wind speed 50 yr. [m/s] 42.04 42.73 43.09 Wind speed 5 yr. [m/s] 35.95 36.85 37.45 Current velocity 50 yr. [m/s] 2.1 1.2 0.9 Current velocity 5 yr. [m/s] 1.0 0.6 0.5 Top transition piece [m+ MSL] 13.23 15.12 16.83 Hub height 3.6 MW [m+ MSL] 93.23 95.12 96.83 Hub height 6.0 MW [m+ MSL] 123.23 125.12 126.83 Hub height 8.0 MW [m+ MSL] 138.23 140.12 141.83 Distance to Rotterdam [km] 80 145 225
Table 6 Water, wind, wave and current data for selected locations

21
The hub height is defined as the vertical distance from the bolted flange connection between the tower/transition piece and the height of the hub itself. To be able to calculate the hub height relative to MSL, the height of the transition piece should be determined. The top of the transition piece will be the platform level, which has to be safe during extreme weather conditions. Therefore, the still water level with an exceedence frequency of 50 years and a wave height with the same exceedence frequency should be used to calculate the platform level. The still water level can be calculated with the maximum tidal amplitude and a storm surge set up.
Figure 17 Water levels determining platform level [15]
The platform level can be calculated using [12], see Figure 17:
𝑍𝑝𝑙𝑎𝑡𝑓𝑜𝑟𝑚 = 𝐿𝐴𝑇 + ∆𝑍𝑡𝑖𝑑𝑒 + ∆𝑍𝑠𝑢𝑟𝑔𝑒 + ∆𝑍𝑎𝑖𝑟 + 𝜉 [m] Where: Z platform = platform level [m + MSL] LAT = lowest astronomical tide [m + MSL] ∆Z tide = tidal amplitude [m] ∆Z surge = storm surge level [m] ∆𝑍𝑎𝑖𝑟 = air gap between wave crest and platform [m] ξ = Extreme wave elevation [m]
The top of the transition piece is calculated in Table 7 with the formula above, using an air gap of 1.5 m and an extreme wave elevation ξ of 0.65 [15] times the wave height with a 50 yr. return period.
3.2 Turbine characteristics M
Furthermore, three different turbine types have been selected to compare the support structures on this point as well. In Table 7, some required data of the turbines can be found. These turbines are currently available, only the 8.0 MW turbine has never been applied before.
Turbine 1 [16] 2 [17] 3 [18] Manufacturer [-] Siemens Siemens Vestas Rated power [MW] 3.6 MW 6.0 MW 8.0 MW Rotor diameter [m] 107 154 164 Swept area [m2] 9000 18600 21124 Hub height [m] 80 110 125 Rotor/hub/nacelle mass [ton] 220 360 425 Tower mass [ton] 345 400 480 Diameter tower top [m] 3.5 4.0 4.7 Diameter tower bottom [m] 4.7 5.6 6.0 Cut out wind speed [m/s] 25 25 25
Table 7 Three different offshore wind turbines have been selected

22
3.3 Soil characteristics M
A major parameter for the application range of different types of support structures will be the soil conditions. In order to compare different types of support structures, two types of homogeneous soil are considered: sand and clay. The properties are given below:
Soil properties homogeneous Sand Value
Volumetric weight y' 20 [kN/m3]
Effective volumetric weight y' 10 [kN/m3]
Angle of internal friction φ 35 [°]
Angle of soil/pipe friction δ 25 [°]
Bearing capacity factor Nq 15 (see Figure 24) [-] Table 8 Soil properties for support structure design in homogeneous sand
Soil properties homogeneous Clay Value
Volumetric weight y' 16 [kN/m3]
Effective volumetric weight y' 6 [kN/m3]
Angle of internal friction φ 22 [°]
Angle of soil/pipe friction δ 15 [°]
Bearing capacity factor Nc 9 [-]
Undrained shear strength Su 75 [kPa] Table 9 Soil properties for support structure design in homogeneous clay
3.4 Extreme wave loads S
For the water depths at the three location, the maximum wave heights H and the wave periods T with a return period of 50 and 5 years are shown in Table 7. For the calculation of the wave loads, the Morison formula for slender structures will be used, as proposed in the DNV Offshore Standard [11]. This load consists of two parts: an inertia part that is caused by the acceleration of the water particles and a drag part caused by the flow velocities. The drag and inertia part of the wave load will be 90⁰ out of phase. Both forces should be added as vectors for a detailed calculation. In this study this is not taken into account. The formula for the maximum force is [16]:
𝐹𝑚𝑎𝑥 = 𝐹𝐼 + 𝐹𝐷 = 𝐶𝐼𝐾𝐼𝐻𝜌𝑤𝑎𝑡𝑒𝑟𝑔𝜋𝐷2
4+ 𝐶𝐷𝐾𝐷𝐻2 1
2𝜌𝑤𝑎𝑡𝑒𝑟𝑔𝐷 [N]
Where: 𝐶𝐼 = inertia coefficient [-] 𝐶𝐷 = drag coefficient [-] 𝐾𝐼 = correction for extent of inertia force [-] 𝐾𝐷 = correction for extent of drag force [-] 𝐻 = wave height [m] 𝐷 = pile diameter [m] The four coefficients depend on the water depth, the wave height relative to the breaking wave height (H/Hb), and the wave period. Using the design graphs provided with the formula in [16], the coefficients could be determined when the ratio of the wave height over the breaking wave height (H/Hb) is known. This ratio can be calculated with Figure 18, by entering the graph at the horizontal axis (with d = water depth), and determine the value at the vertical axis (with H = breaking height of the wave) at the intersection with the ‘breaking limit’ line. Now the breaking wave height is known, and the ratio can be calculated in order to determine the coefficients in the Morison formula.

23
Figure 18 Application range of various wave theories
According to [16] waves will break when the ratio of wave height over breaking wave height exceeds 0.78. At sites with a steep seabed or relatively shallow water breaking waves could occur. When this is the case, the Morison formula cannot be used anymore, because a breaking wave will exert a far larger force on the structure. When a breaking wave is considered, the accelerations of the water particles will be subordinate to the velocity of the water, and consequently the inertia force is negligible relative to the drag force, as can be seen in the formula below. DNV [11] proposes to use the following formula to calculate the force of breaking waves on a rigid structure:
𝐹 = 𝐶𝐷∗ 𝐾𝐷 𝐻𝑏212𝜌𝑤𝑎𝑡𝑒𝑟𝑔 𝐷 [N]
Where: 𝐶𝐷∗ = drag coefficient in breaking waves = 2.5 ∗ 𝐶𝐷 [-] 𝐾𝐷 = correction for extent of drag force [-] 𝐻𝑏 = breaking height of the wave [m] 𝐷 = pile diameter [m] As can be seen, the coefficients can be determined from the coefficients in the Morison formula. The coefficients are shown in Table 10, where also the ratio H/Hb is calculated. As can be seen, for location 1 (water depth 20 m.) this ratio is > 0.78 and the wave will break. Therefore, the drag coefficient is multiplied by 2.5 (*) and the wave force should be determined using the formula above.
Site Return Period d/(gT2) H/Hbreak CI CD KI KD
1 50 yr 0,017 0,84 2 3,0* 0,41 0,50 5 yr 0,020 0,75 2 1,2 0,42 0,45 2 50 yr 0,034 0,70 2 1,2 0,45 0,36 5 yr 0,037 0,60 2 1,2 0,46 0,30 3 50 yr 0,052 0,64 2 1,2 0,28 0,47 5 yr 0,061 0,69 2 1,2 0,47 0,28
Table 10 Coefficients needed for the Morison formula

24
In order to apply Morison’s formula, it should be verified that the structure is still a slender structure compared to the wave length, because the basic assumption behind Morison formula is that the wave is not affected by the structure. When the structure becomes relatively large, diffraction of the wave may occur. This could especially be the case for large diameter mono piles. This is taken into account by another correction factor for the magnitude of the inertia coefficient 𝐶𝐼 according to [17], which is given in as a function of the pile diameter over the wave length (Figure 19).
Figure 19 Corrected inertia factor, to be applied for non-slender structures
For the three locations in this study, the wave length L can be approximated with the following formula for transitional water depths 1
20< d
𝐿𝑤𝑎𝑣𝑒< 1
2 :
𝐿 = 𝑔𝑇2
2𝜋∗ tanh (2𝜋𝑑
𝐿) [m]
For a wave period of about 10 s., which is considered to be a mean value for the waves at the three locations (Table 6), the wave length will be largest for the largest water depth (60 m.), namely about 160 meters. For the most critical situation of a very large pile diameter (15 meters), the ratio at the horizontal axis in Figure 18 becomes 0.09 and the corrected intertie coefficient becomes 2.1 instead of 2.0. This small correction is not taken into account any further. 3.5 Extreme current loads S
The current velocity in the North Sea will cause a load on the pile under water. This load is not constant under water, but will be highest at the surface level and zero at the seabed due to friction. Three different schematizations can be used to determine this distribution: the linear, bilinear and the power law distribution (Figure 20). For the ease of calculation, a linear distribution will be assumed. This means that the point of action of the current load is on 2/3 of the water depth, calculated from the bottom.

25
Figure 20 Different current distributions [1]
The maximum current velocity will occur during spring tide, just between high and low water. The data provided by the measuring stations of Rijkswaterstaat showed the current velocities with a return period of 5 and 50 years in Table 6. The load as consequence of the current velocity can be derived using the following formula for flow around slender structures. This formula consists of a static and a dynamic part of the drag force [18]:
𝐹𝐷 = 12𝜌𝑤𝑢2(𝐶𝐷 + 𝐶′𝐷)𝐴 [N]
With the following coefficients determined using the provided design graphs:
CD = static drag coefficient = 1 [-] C’D = dynamic drag coefficient = 0,25 [-] A = area facing flow [m2] In this research, no relation between waves and current is taken into account. For detailed calculations, the waves and current forces should be summed up by vectorial addition. In this case all load directions of waves and current and the frequencies of occurrence should be taken into account. Here it is assumed that wave and current can be considered separately. 3.6 Extreme wind loads S
The rotation of the turbine will cause a horizontal load on the support structure. This load depends on the wind speed and the rotor diameter. All of the different wind turbines have a cut out speed of 25 m/s. This is the speed at which the turbine will be shut down. It is assumed that the thrust force will be highest when this wind speed occurs and the turbine is still in operation. With a higher wind speed and a non producing turbine the thrust force is assumed to be lower, but the drag force on the tower and blades in parking stand during high wind speed might be even higher.
The calculation of the wind load is based on the momentum balance. This means that the energy in front of the rotor is equal to the sum of the energy generated by the turbine and the energy after the rotor. A thrust force will lead to the power generated by the turbine. Therefore the different velocities in front of the rotor and at the rotor are needed to calculate the thrust force.

26
Figure 21 Thrust force on a wind turbine [19]
The following formulas apply for the wind load D and power P (Figure 21) [19]:
𝐷 = 12𝜌𝑎𝑢2𝐴 4 𝑎(1 − 𝑎) [N]
𝑃 = 12𝜌𝑎𝑢3𝐴 4 𝑎(1 − 𝑎)2 [W]
Where 𝜌𝑎 is the density of air and A is the swept area of the wind turbine (Figure 22). This is simply the circle which the rotors describes and given by the turbine parameters. Parameter a is a dimensionless induction factor depending on the wind speed in front of the rotor and the wind speed within the rotor (Figure 21):
𝑎 = 𝑢−𝑣1𝑢
[-]
Figure 22 Wind velocities before, in and after passing the turbine [19]
The wind speed in front of the rotor is known (cut out wind speed), but within the rotor it is unknown. As can be seen, the maximum of the last term of the drag force of 4𝑎(1 − 𝑎) is reached at an induction factor a = 0.5. This maximum is 1.0, which means that the maximum thrust force is equal to the wind load on an wall with area A (swept area). When a calculation of wind loads on the wind turbine is made, it should be made for two different stages, namely:
• Wind turbine in operation (thrust load) • Parked wind turbine (drag load)
The wind velocities when parked will be above 25 m/s, which is the cut-out wind speed, but there will be still a force on the tower caused by the wind. This has to be taken into account when it is higher than the maximum thrust force. The drag force on the tower can be compared with water flow on slender structures. The main difference is the density of air, which is much smaller than the density of water.
𝐹𝐷 = 12𝜌𝑎𝑢2(𝐶𝐷 + 𝐶′𝐷)𝐴 [N]

27
With the following coefficients determined using the provided design graphs in [18]:
U = extreme wind speed [m/s] CD = static drag coefficient (1) C’D = dynamic drag coefficient (0.25) A = area facing flow (h*D) [m2] Because the tower has a tapered cross section, the average diameter of the tower will be used to determine the drag force. Furthermore, the wind velocity at half of the hub height will be used as an approximation of the drag force. The mentioned wind velocity in Table 6 is obtained for a height of 90.55 m + MSL, according to Rijkswaterstaat [14]. The three different wind turbines have different hub heights, and therefore different wind velocities and different drag loads. The velocities can be translated to another height with the following formula:
𝑉 = 𝑉𝑟𝑒𝑓 ∗ln ( 𝑧
0.002)
ln (𝑧𝑟𝑒𝑓0.002)
[m/s]
Where Vref is the reference wind speed at reference height zref. The largest load of the thrust force or the drag force shall be used for design. In general, the thrust load on a wind turbine is far larger than the drag force, although this might not be clear immediately. The wind turbine will only be operational up to the cut-out wind speed (specified by the turbine manufacturer) which is used to calculate the thrust force. The cut-out wind speed will be far lower than a wind speed used to calculate the drag force when the turbine is not operational, for instance a wind speed with a 50 year return period. On the other hand, the wind load will work over a larger swept area in operation stage than compared to the parked situation, when only the wind facing surface should be taken into account. The latter difference has a larger influence, which means that the governing state is a wind turbine in operation (thrust load).

28
4. Mono Pile Support Structure M
The main goal of this study is a comparison of different types of support structures for offshore wind turbines, namely a mono pile, tripod and tower structure. To start this comparison, the currently most often used support structure, the mono pile, will be analyzed to determine the structural and practical limits. First of all, a static analysis will be developed and later on a dynamic analysis as well. For the static analysis is referred to the spreadsheet in Appendix 3.
The main parameter which determines the application range of a support structure is the stiffness of the foundation/soil system. The complete wind turbine and mono pile can be schematized as a laterally loaded pile which is embedded in the soil. The lateral loads consist of wind, waves and current (environmental loads) and must be in equilibrium with the soil resistance. Due to the lateral deflection of the tower and support structure, the soil will develop a passive soil wedge located at the downwind side of the pile with a lateral force compensating the environmental loads.
4.1 Static analysis M
4.1.1 Horizontal equilibrium M
There are different methods available to determine the soil resistance for a laterally loaded piles. According to NEN-EN-ISO 19902 and DNV Offshore standard a finite element model should be used based on so called p-y curves. The p-y curves display the resistance (p) of the soil versus the lateral deflection of the pile (y). The pile is modeled as a number of beams supported by non-linear springs applied at the nodal points of the beams. For every spring support, a p-y curve determines the stiffness. This method is rather complicated and time consuming, and will therefore not be used to determine the stiffness of the soil/pile system. Instead, the simplified and fast method of dr. Blum will be used [20]. The passive soil pressures are working over the entire length of the pile below the seabed. Blum assumes that the pile will rotate around a point above the pile toe, and replaces the passive soil pressure below this point with a lateral force (C), which is the resultant of the passive soil pressure below the rotation point. Because of the 3D model (compared to a sheet pile wall) the passive soil pressures will also develop around the pile, increasing the soil resistance. Blum calculated that this passive soil wedge will develop linearly with increasing depth. At a depth d below seabed the passive soil wedge (shell model) will have a width of ½*d at both sides of the pile, as can be seen in Figure 23.
Figure 23 Blum's method with the replaced passive soil pressure below the rotation point (left)
and passive soil wedge (right) [20]
29
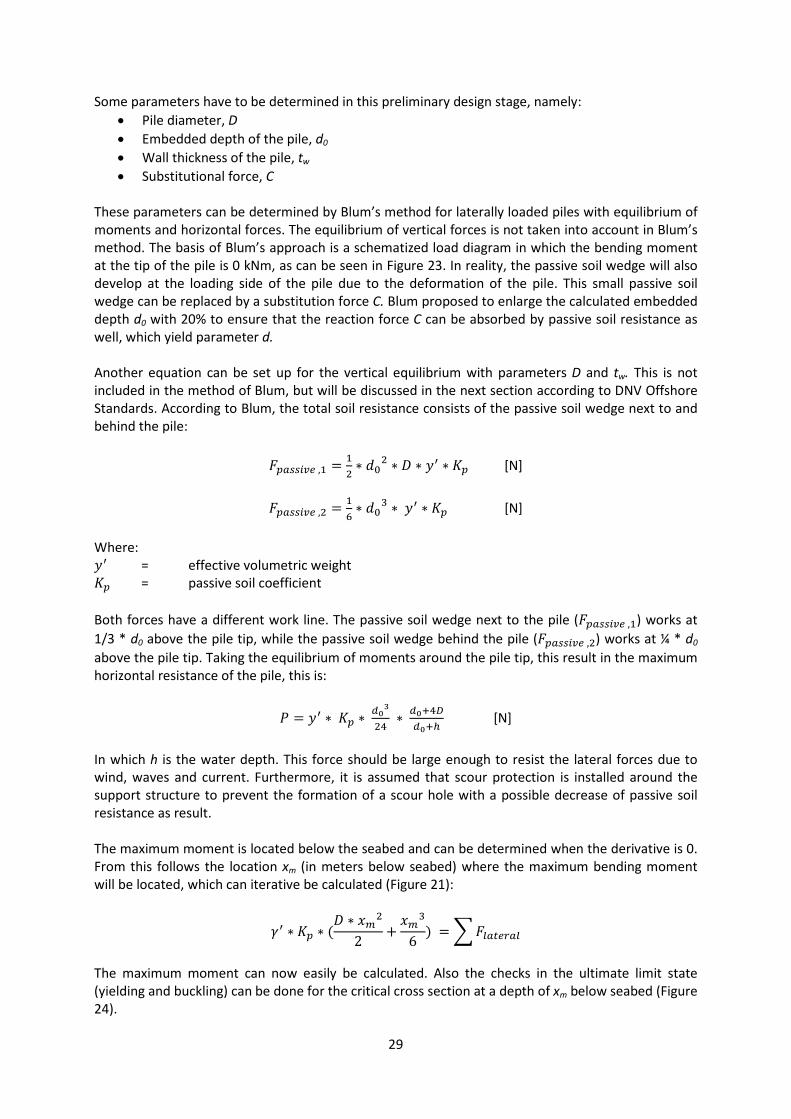
Some parameters have to be determined in this preliminary design stage, namely: • Pile diameter, D • Embedded depth of the pile, d0 • Wall thickness of the pile, tw • Substitutional force, C
These parameters can be determined by Blum’s method for laterally loaded piles with equilibrium of moments and horizontal forces. The equilibrium of vertical forces is not taken into account in Blum’s method. The basis of Blum’s approach is a schematized load diagram in which the bending moment at the tip of the pile is 0 kNm, as can be seen in Figure 23. In reality, the passive soil wedge will also develop at the loading side of the pile due to the deformation of the pile. This small passive soil wedge can be replaced by a substitution force C. Blum proposed to enlarge the calculated embedded depth d0 with 20% to ensure that the reaction force C can be absorbed by passive soil resistance as well, which yield parameter d. Another equation can be set up for the vertical equilibrium with parameters D and tw. This is not included in the method of Blum, but will be discussed in the next section according to DNV Offshore Standards. According to Blum, the total soil resistance consists of the passive soil wedge next to and behind the pile:
𝐹𝑝𝑎𝑠𝑠𝑖𝑣𝑒 ,1 = 12∗ 𝑑0
2 ∗ 𝐷 ∗ 𝑦′ ∗ 𝐾𝑝 [N]
𝐹𝑝𝑎𝑠𝑠𝑖𝑣𝑒 ,2 = 16∗ 𝑑0
3 ∗ 𝑦′ ∗ 𝐾𝑝 [N] Where: 𝑦′ = effective volumetric weight 𝐾𝑝 = passive soil coefficient Both forces have a different work line. The passive soil wedge next to the pile (𝐹𝑝𝑎𝑠𝑠𝑖𝑣𝑒 ,1) works at 1/3 * d0 above the pile tip, while the passive soil wedge behind the pile (𝐹𝑝𝑎𝑠𝑠𝑖𝑣𝑒 ,2) works at ¼ * d0 above the pile tip. Taking the equilibrium of moments around the pile tip, this result in the maximum horizontal resistance of the pile, this is:
𝑃 = 𝑦′ ∗ 𝐾𝑝 ∗ 𝑑03
24 ∗ 𝑑0+4𝐷
𝑑0+ℎ [N]
In which h is the water depth. This force should be large enough to resist the lateral forces due to wind, waves and current. Furthermore, it is assumed that scour protection is installed around the support structure to prevent the formation of a scour hole with a possible decrease of passive soil resistance as result. The maximum moment is located below the seabed and can be determined when the derivative is 0. From this follows the location xm (in meters below seabed) where the maximum bending moment will be located, which can iterative be calculated (Figure 21):
𝛾′ ∗ 𝐾𝑝 ∗ (𝐷 ∗ 𝑥𝑚2
2+𝑥𝑚3
6) = �𝐹𝑙𝑎𝑡𝑒𝑟𝑎𝑙
The maximum moment can now easily be calculated. Also the checks in the ultimate limit state (yielding and buckling) can be done for the critical cross section at a depth of xm below seabed (Figure 24).
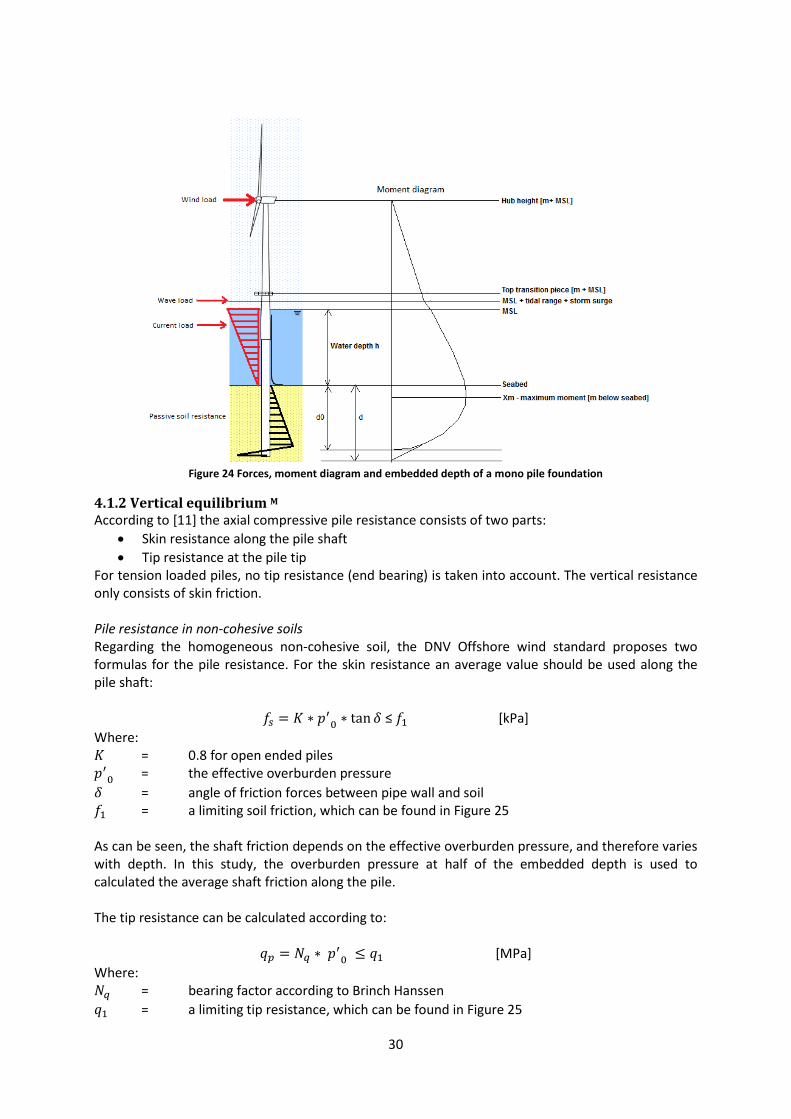
30
Figure 24 Forces, moment diagram and embedded depth of a mono pile foundation
4.1.2 Vertical equilibrium M
According to [11] the axial compressive pile resistance consists of two parts: • Skin resistance along the pile shaft • Tip resistance at the pile tip
For tension loaded piles, no tip resistance (end bearing) is taken into account. The vertical resistance only consists of skin friction. Pile resistance in non-cohesive soils Regarding the homogeneous non-cohesive soil, the DNV Offshore wind standard proposes two formulas for the pile resistance. For the skin resistance an average value should be used along the pile shaft:
𝑓𝑠 = 𝐾 ∗ 𝑝′0 ∗ tan𝛿 ≤ 𝑓1 [kPa] Where: 𝐾 = 0.8 for open ended piles 𝑝′0 = the effective overburden pressure 𝛿 = angle of friction forces between pipe wall and soil 𝑓1 = a limiting soil friction, which can be found in Figure 25 As can be seen, the shaft friction depends on the effective overburden pressure, and therefore varies with depth. In this study, the overburden pressure at half of the embedded depth is used to calculated the average shaft friction along the pile. The tip resistance can be calculated according to:
𝑞𝑝 = 𝑁𝑞 ∗ 𝑝′0 ≤ 𝑞1 [MPa] Where: 𝑁𝑞 = bearing factor according to Brinch Hanssen 𝑞1 = a limiting tip resistance, which can be found in Figure 25
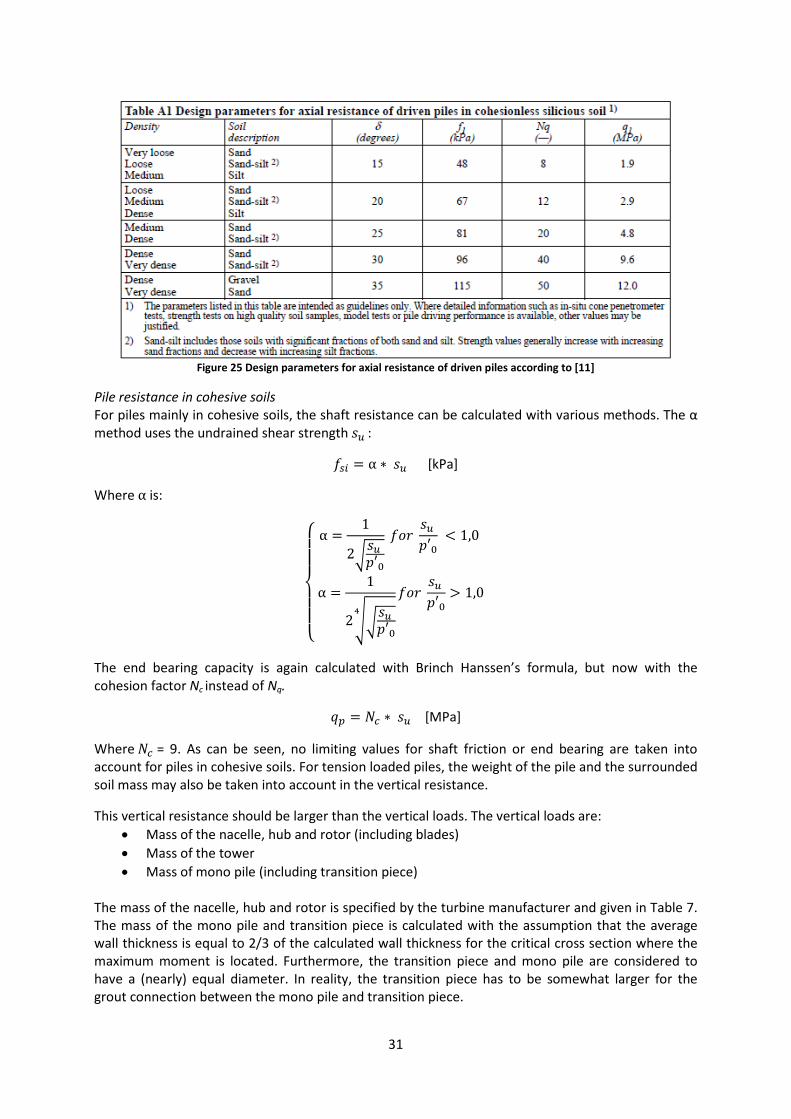
31
Figure 25 Design parameters for axial resistance of driven piles according to [11]
Pile resistance in cohesive soils For piles mainly in cohesive soils, the shaft resistance can be calculated with various methods. The α method uses the undrained shear strength 𝑠𝑢 :
𝑓𝑠𝑖 = α ∗ 𝑠𝑢 [kPa]
Where α is:
⎩⎪⎪⎨
⎪⎪⎧ α =
1
2�𝑠𝑢 𝑝′0
𝑓𝑜𝑟 𝑠𝑢
𝑝′0 < 1,0
α =1
2��𝑠𝑢 𝑝′0
4
𝑓𝑜𝑟 𝑠𝑢
𝑝′0> 1,0
The end bearing capacity is again calculated with Brinch Hanssen’s formula, but now with the cohesion factor Nc instead of Nq.
𝑞𝑝 = 𝑁𝑐 ∗ 𝑠𝑢 [MPa]
Where 𝑁𝑐 = 9. As can be seen, no limiting values for shaft friction or end bearing are taken into account for piles in cohesive soils. For tension loaded piles, the weight of the pile and the surrounded soil mass may also be taken into account in the vertical resistance.
This vertical resistance should be larger than the vertical loads. The vertical loads are: • Mass of the nacelle, hub and rotor (including blades) • Mass of the tower • Mass of mono pile (including transition piece)
The mass of the nacelle, hub and rotor is specified by the turbine manufacturer and given in Table 7. The mass of the mono pile and transition piece is calculated with the assumption that the average wall thickness is equal to 2/3 of the calculated wall thickness for the critical cross section where the maximum moment is located. Furthermore, the transition piece and mono pile are considered to have a (nearly) equal diameter. In reality, the transition piece has to be somewhat larger for the grout connection between the mono pile and transition piece.

32
Some other vertical loads may play a role as well, such as marine growth on the steel pile below sea level and elements on the transition piece (J-tube, boatlander, platform). In this preliminary design stage, these loads are not taken into account. The transition piece is considered to be a steel tubular pipe with the same dimensions as the mono pile. 4.1.3 Deformations M
One of the main parameters of the support structure and soil system is the stiffness. The stiffness can be determined when the support structure and soil are together schematized as a linear spring:
𝐹 = 𝑘 ∗ 𝑢 [N] The lateral deflection u is defined at the top of the support structure. For a mono pile this is at the top of the transition piece, and for a tower or tripod structure this is at the top of the tower or the tripod structure. When the lateral forces due to wind, waves and current are known, the stiffness of the system can be determined. In the next step of this preliminary design, the stiffness will be used to analyze the dynamics.
According to Blum, the pile can be schematized as a beam which is embedded at a depth of 0,65 * t0 below the seabed. Experience in offshore wind turbines shows that the embedded depth can be estimated better as a function of the diameter of the pile, due to the large diameter piles used in offshore wind foundations. The embedded depth can be calculated as 3.5 * Dpile according to [21].
Figure 26 Lateral displacements of the support structure due to wave and current
The displacement at the top of the support structure has to be calculated using simple deflection formulas. The support structure will be influenced by waves and current, while the tower structure will be affected by wind (Figure 26). For a single sided embedded beam, these formulas are:
𝑢1 = 𝐹𝑐𝑢𝑟𝑟𝑒𝑛𝑡∗𝑙13
3𝐸𝐼 [m]
𝑢2 = 𝑢1 + 𝐹𝑐𝑢𝑟𝑟𝑒𝑛𝑡 𝑙12
2𝐸𝐼𝑙2 + 𝐹𝑤𝑎𝑣𝑒∗𝑙23
3𝐸𝐼 [m]
And the rotation at the point of the seabed can be approximated by the rotation at the current load. This is a conservative approximation. The rotation can be calculated with:
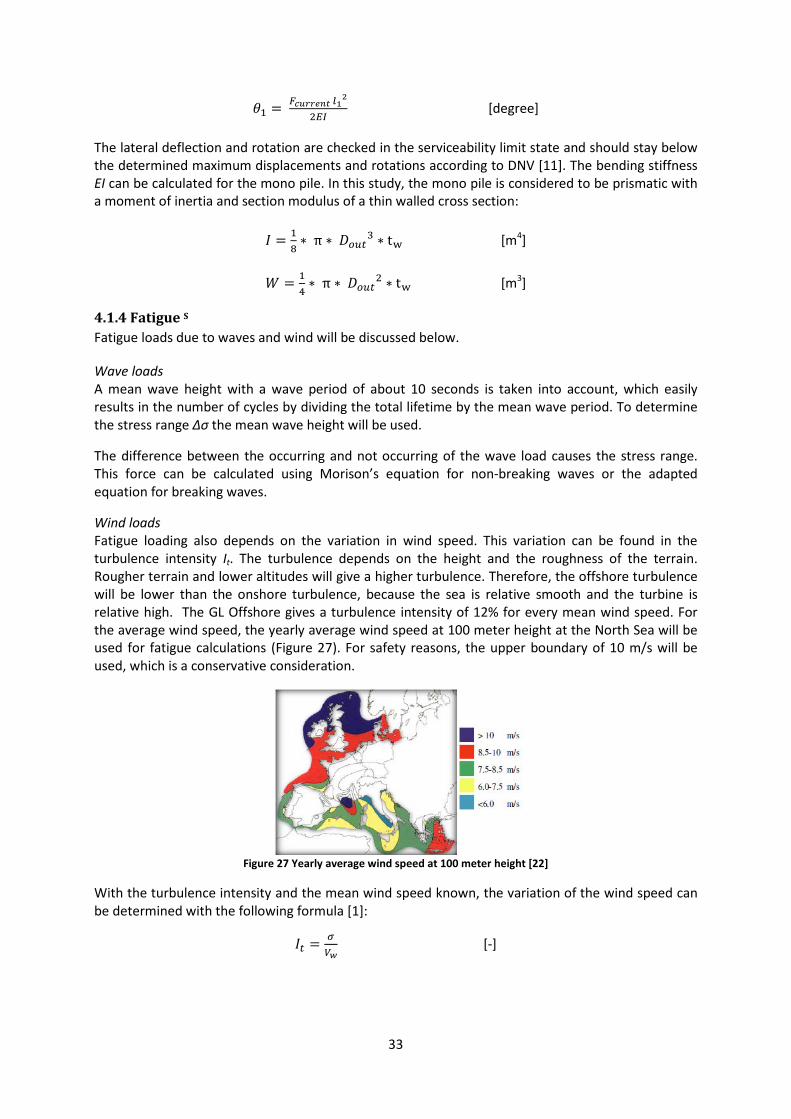
33
𝜃1 = 𝐹𝑐𝑢𝑟𝑟𝑒𝑛𝑡 𝑙12
2𝐸𝐼 [degree]
The lateral deflection and rotation are checked in the serviceability limit state and should stay below the determined maximum displacements and rotations according to DNV [11]. The bending stiffness EI can be calculated for the mono pile. In this study, the mono pile is considered to be prismatic with a moment of inertia and section modulus of a thin walled cross section:
𝐼 = 18∗ π ∗ 𝐷𝑜𝑢𝑡3 ∗ tw [m4]
𝑊 = 1
4∗ π ∗ 𝐷𝑜𝑢𝑡2 ∗ tw [m3]
4.1.4 Fatigue S
Fatigue loads due to waves and wind will be discussed below.
Wave loads A mean wave height with a wave period of about 10 seconds is taken into account, which easily results in the number of cycles by dividing the total lifetime by the mean wave period. To determine the stress range Δσ the mean wave height will be used.
The difference between the occurring and not occurring of the wave load causes the stress range. This force can be calculated using Morison’s equation for non-breaking waves or the adapted equation for breaking waves.
Wind loads Fatigue loading also depends on the variation in wind speed. This variation can be found in the turbulence intensity It. The turbulence depends on the height and the roughness of the terrain. Rougher terrain and lower altitudes will give a higher turbulence. Therefore, the offshore turbulence will be lower than the onshore turbulence, because the sea is relative smooth and the turbine is relative high. The GL Offshore gives a turbulence intensity of 12% for every mean wind speed. For the average wind speed, the yearly average wind speed at 100 meter height at the North Sea will be used for fatigue calculations (Figure 27). For safety reasons, the upper boundary of 10 m/s will be used, which is a conservative consideration.
Figure 27 Yearly average wind speed at 100 meter height [22]
With the turbulence intensity and the mean wind speed known, the variation of the wind speed can be determined with the following formula [1]:
𝐼𝑡 = 𝜎𝑉𝑤
[-]

34
The variation will be schematized as a sinusoidal function of the time, which means that the turbulence varies symmetrical around the mean wind speed with a certain period and amplitude, as shown in Figure 28.
Figure 28 Variation of the mean wind speed
The range in load will be the difference between the load due to the upper boundary of the wind speed and the lower boundary of the wind speed. With the known formulas for the thrust force and the drag force of the wind, this load range can be calculated:
∆𝐹𝑡ℎ𝑟𝑢𝑠𝑡 = 12𝜌𝑎 ��𝑢𝑚𝑒𝑎𝑛 + 1
2𝐼𝑢𝑚𝑒𝑎𝑛�
2− �𝑢𝑚𝑒𝑎𝑛 −
12𝐼𝑢𝑚𝑒𝑎𝑛�
2�𝐴 4 𝑎(1 − 𝑎) [N]
∆𝐹𝐷𝑟𝑎𝑔 = 12𝜌𝑎 ��𝑢𝑚𝑒𝑎𝑛 + 1
2𝐼𝑢𝑚𝑒𝑎𝑛�
2− �𝑢𝑚𝑒𝑎𝑛 −
12𝐼𝑢𝑚𝑒𝑎𝑛�
2� (𝐶𝐷 + 𝐶′𝐷)𝐴 [N]
Now the total varying force in time can be calculated as the sum of the fatigue wave force and the fatigue wind force. This force will result in a cyclically varying bending moment, which results in a varying stress, as can be seen in the formula below. In order to calculate the bending moment of the wave loads, it is assumed that the wave works at MSL-level on the pile, i.e. no storm surges or tidal ranges are taken into account. The stress range can be used to calculate the number of equivalent cylcles (Neq) of wind and wave loads up to failure according to DNV. It should then be checked that the occurring number of cycles within the total life time (Nref) of the wind turbine stays below this number.
∆𝜎 = ∆𝑀𝑤𝑎𝑣𝑒+∆𝑀𝑤𝑖𝑛𝑑𝑊𝑝𝑖𝑙𝑒
[N/mm2]
4.2 Dynamic analysis M
4.2.1 Basic dynamics of a mono pile M
An offshore wind turbine with a mono pile foundation can be schematized as a 2-mass-spring-dashpot system. The parameters to solve this equation are the mass, the dampening coefficient and the stiffness of the system, as can be seen in the second order differential equation and Figure 29:
[𝑀]𝑑2𝑢𝑑𝑡2
+ [𝐶]𝑑𝑢𝑑𝑡
+ [𝐾]𝑢 = [𝐹] cos (𝜔𝑡 − 𝜃)
Where: M = Mass matrix [kg] C = dampening matrix [Ns/m] K = stiffness matrix [N/m] 𝑑2𝑢𝑑𝑡2
= acceleration vector [m/s2] 𝑑𝑢𝑑𝑡
= velocity vector [m/s] 𝑢 = displacement vector [m]

35
Figure 29 Schematized 2-mass-spring-dashpot system
There are two main forces with a harmonic character to be taken into account in the dynamic analysis, namely the wave and wind forces. Current forces are not considered because of their very low frequency.
Masses The upper schematized mass represents the nacelle, hub and rotor mass, which is located at hub height. The lower mass represents the mass of the support structure above the schematized fixed support, which is located at 3.5*Dpile for sand and 4.5*Dpile for clay (see section 4.3.4). The mass of the pile below this schematized support is not taken into account, because it won’t take part in the dynamic vibrations. In this study, the mass of the support structure, either a mono pile (including mass of the transition piece), tripod or tower structure, is concentrated at mean sea level (MSL). The mass of the tower will be divided over the two schematized masses, which will not be exactly a 50-50 partition. According to [1] the representative mass of 𝑚2 can be calculated as follows:
𝑚2 = 0.227 𝑚𝑡𝑜𝑤𝑒𝑟 + 𝑚𝑡𝑜𝑝 [kg]
In which 𝑚𝑡𝑜𝑝 stands for the total mass of the nacelle, hub and rotor. The other part of the tower mass is assumed to be located at 𝑚1, which also consists of the mass of the support structure. Furthermore, the lower mass 𝑚1 consists of the enclosed soil within the mono pile and the water column within the mono pile.
The top mass 𝑚2 will be loaded with a harmonic force due to the wind. The lower mass 𝑚1 will be loaded with the harmonic wave load. Both forces will be discussed in the next section.
Springs The connecting elements between the two masses can be schematized as linear springs. For the support structure, which is the part below 𝑚1, the spring stiffness 𝑘1 (Figure 29) can be determined from the soil/structure interaction. The horizontal wave and current forces result in a static displacement 𝑈2 of the support structure, already calculated in the previous section, from which this stiffness can be calculated:
𝑘𝑠𝑢𝑝𝑝𝑜𝑟𝑡 = 𝑘1 = 𝐹𝑤𝑎𝑣𝑒 + 𝐹𝑐𝑢𝑟𝑟𝑒𝑛𝑡𝑈2
[N/m]
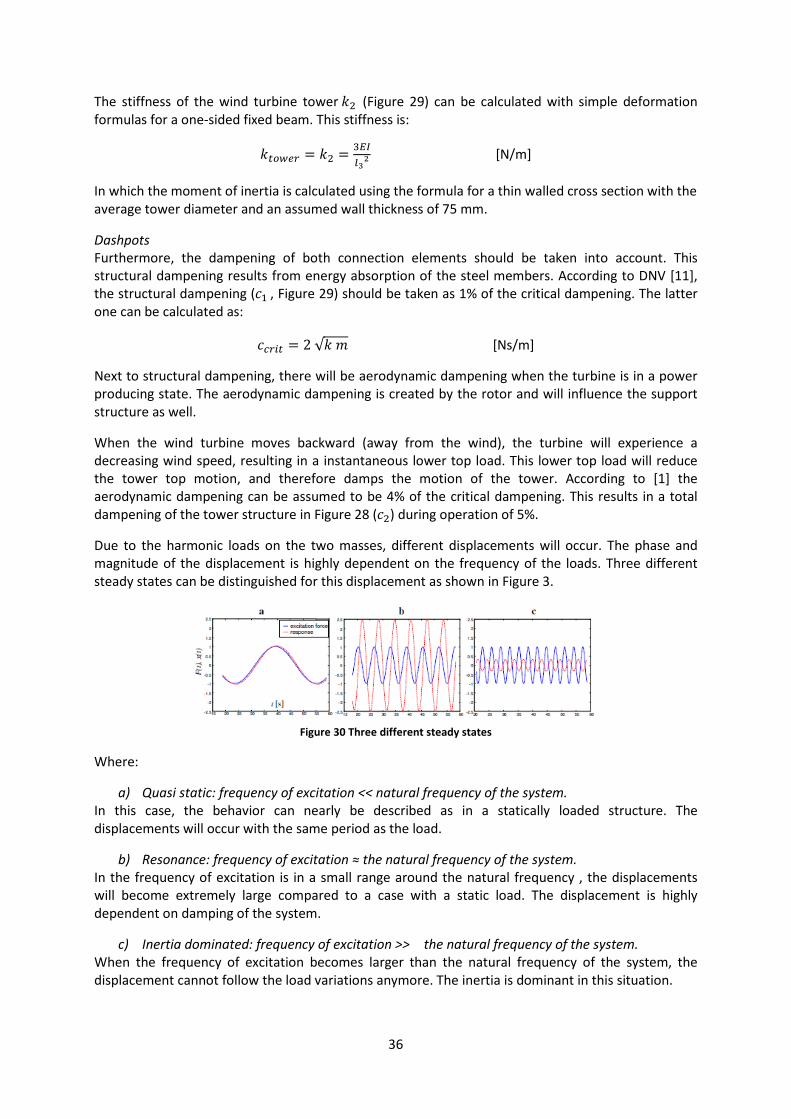
36
The stiffness of the wind turbine tower 𝑘2 (Figure 29) can be calculated with simple deformation formulas for a one-sided fixed beam. This stiffness is:
𝑘𝑡𝑜𝑤𝑒𝑟 = 𝑘2 = 3𝐸𝐼𝑙32
[N/m]
In which the moment of inertia is calculated using the formula for a thin walled cross section with the average tower diameter and an assumed wall thickness of 75 mm.
Dashpots Furthermore, the dampening of both connection elements should be taken into account. This structural dampening results from energy absorption of the steel members. According to DNV [11], the structural dampening (𝑐1 , Figure 29) should be taken as 1% of the critical dampening. The latter one can be calculated as:
𝑐𝑐𝑟𝑖𝑡 = 2 √𝑘 𝑚 [Ns/m]
Next to structural dampening, there will be aerodynamic dampening when the turbine is in a power producing state. The aerodynamic dampening is created by the rotor and will influence the support structure as well.
When the wind turbine moves backward (away from the wind), the turbine will experience a decreasing wind speed, resulting in a instantaneous lower top load. This lower top load will reduce the tower top motion, and therefore damps the motion of the tower. According to [1] the aerodynamic dampening can be assumed to be 4% of the critical dampening. This results in a total dampening of the tower structure in Figure 28 (𝑐2) during operation of 5%.
Due to the harmonic loads on the two masses, different displacements will occur. The phase and magnitude of the displacement is highly dependent on the frequency of the loads. Three different steady states can be distinguished for this displacement as shown in Figure 3.
Figure 30 Three different steady states
Where:
a) Quasi static: frequency of excitation << natural frequency of the system. In this case, the behavior can nearly be described as in a statically loaded structure. The displacements will occur with the same period as the load.
b) Resonance: frequency of excitation ≈ the natural frequency of the system. In the frequency of excitation is in a small range around the natural frequency , the displacements will become extremely large compared to a case with a static load. The displacement is highly dependent on damping of the system.
c) Inertia dominated: frequency of excitation >> the natural frequency of the system. When the frequency of excitation becomes larger than the natural frequency of the system, the displacement cannot follow the load variations anymore. The inertia is dominant in this situation.
37
It is clear that resonance has to be prevented, because the structure is likely to fail due to the large sinusoidal deformations resulting in fatigue. The natural frequencies of the 2-mass-spring-dashpot system needs to be determined and should stay well away from the frequencies of wave and wind loads. This will be discussed in the next section.
4.2.2 Excitation frequencies S
Wind The dynamic loads due to wind can be divided into two different excitation frequencies. The first one, named P1, is the rotor’s rotational frequency. The second excitation frequency is the blade passing frequency, called P3 in case of a three bladed rotor. Currently, the most wind turbines have a variable rotor speed and therefore a P1 and P3 frequency range, instead of a single frequency. According to [1] the following formula counts for the 1P and 3P frequency:
𝑓1𝑃 = 𝜆𝑉𝑤𝜋𝐷𝑟𝑜𝑡𝑜𝑟
= 𝑉𝑡𝑖𝑝𝜋𝐷𝑟𝑜𝑡𝑜𝑟
= 𝑟𝑝𝑚∗𝜋∗𝐷𝑟𝑜𝑡𝑜𝑟60∗𝜋∗𝐷𝑟𝑜𝑡𝑜𝑟
= 𝑟𝑝𝑚60
[Hz]
𝑓3𝑃 = 3 ∗ 𝑓1𝑃 [Hz]
Where: 𝜆 = Vtip/Vw [-] 𝑉𝑤 = the velocity of wind [m/s] 𝑉𝑡𝑖𝑝 = the velocity of the tip of the blades [m/s] 𝑟𝑝𝑚 = revolutions per minute (wind turbine parameter) [min-1] 𝐷𝑟𝑜𝑡𝑜𝑟 = the diameter of the rotor [m] Due to the ranges in rpm in the different wind turbines, the excitation frequencies 1P and 3P are two regions of frequencies. These are shown in Table 11 for the three different wind turbines.
Turbine Rpm range P1 min P1 max P3 min P3 max 3,6 MW 8.0-13.0 0,133 0,217 0,400 0,650
6 MW 5.0-11.0 0,083 0,183 0,250 0,550 8 MW 4.8-12.1 0,080 0,202 0,240 0,605
The natural frequency of the support structure should not infer with 1P or 3P frequencies. There are three regions in which the natural frequency can fall; below the 1P frequency, which is considered to be a soft-soft structure, between 1P and 3P, which is a soft-stiff structure, or above the 3P, which is a stiff-stiff structure, as can be seen in Figure 31, in which an indication of the 1P and 3P frequency range is given. Waves In general waves will not have a specific frequency as a rotor/turbine system has. Waves will come with different frequencies, in general in a range below and in the 1P frequency range of the wind turbine. This is indicated with the dark blue line in Figure 31.
Table 11 Excitation frequencies for the selected wind turbines

38
Figure 31 Frequency ranges of wind turbine (1P and 3P) and waves
The most economical wind turbine design will result in a natural frequency in the soft-soft domain. This will generally lead to the lowest amount of steel necessary, and therefore an economically attractive design. As can be seen in Figure 31 this might lead to resonance as the wave frequencies are spread over the soft-soft region. Therefore, it is assumed in this study that the natural frequency of the support structure should stay within the soft-stiff (between 1P and 3P) or in the stiff-stiff region (above 3P), taking the safety margin of 10% into account.
4.2.3 Natural frequency M
A main parameter in the design of support structures for offshore wind turbines is the natural frequency of the turbine/support-structure system. This can be determined with the schematized 2-mass-spring-dashpot system as was discussed in section 4.2.1.
First of all, the mass, damping and stiffness matrix have to be determined to solve the differential equation. This is done by analyzing the free body diagram of the 2-mass spring dashpot system with Newton’s law of motion.
Figure 32 Free body diagrams of both masses

39
For mass 𝑚1 the law of motion results in:
𝑚2 𝑑2𝑢2𝑑𝑡2
= 𝐹𝑤𝑖𝑛𝑑 − 𝐹𝑑𝑎𝑠ℎ𝑝𝑜𝑡 2 − 𝐹𝑠𝑝𝑟𝑖𝑛𝑔 2
𝑚2 𝑑2𝑢2𝑑𝑡2
+ 𝑐2 �𝑑𝑢2𝑑𝑡
−𝑑𝑢1𝑑𝑡
� + 𝑘2(𝑢2 − 𝑢1) = 𝐹𝑤𝑖𝑛𝑑
For mass 𝑚2 this results in:
𝑚1 𝑑2𝑢1𝑑𝑡2
= 𝐹𝑤𝑎𝑣𝑒 + 𝐹𝑑𝑎𝑠ℎ𝑝𝑜𝑡 2 + 𝐹𝑠𝑝𝑟𝑖𝑛𝑔 2 − 𝐹𝑑𝑎𝑠ℎ𝑝𝑜𝑡 1 − 𝐹𝑠𝑝𝑟𝑖𝑛𝑔 1
𝑚1 𝑑2𝑢1𝑑𝑡2
− 𝑐2 �𝑑𝑢2𝑑𝑡
−𝑑𝑢1𝑑𝑡
� − 𝑘2(𝑢2 − 𝑢1) + 𝑐1𝑑𝑢1𝑑𝑡
+ 𝑘1𝑢1 = 𝐹𝑤𝑎𝑣𝑒
This system of coupled equations can be rewritten in matrix form:
�𝒎𝟏 𝟎𝟎 𝒎𝟐
� �𝒖�̈�𝒖�̈�� + �
𝒄𝟏 + 𝒄𝟐 −𝒄𝟐−𝒄𝟐 𝒄𝟐
� �𝒖�̇�𝒖�̇�� + �𝒌𝟏 + 𝒌𝟐 −𝒌𝟐
−𝒌𝟐 𝒌𝟐� �𝒖𝟏𝒖𝟐� = �𝑭
�𝒘𝒊𝒏𝒅𝑭�𝒘𝒂𝒗𝒆
� 𝐜𝐨𝐬 (𝝎𝒕 − 𝜽)
Now the mass, dampening and stiffness matrix are determined and can be filled with the values of the individual springs and dashpots. In order to determine the natural frequencies of the 2-mass-spring-dashpot system, the right hand side is set at 0. The displacement will be of a harmonic type with amplitude 𝑢�, radial velocity 𝜔 and phase angle θ . The first and second derivative can be determined, and put into the matrix equation:
𝑢 (𝑡) = 𝑢� cos (𝜔𝑡 − 𝜃)
�̇� (𝑡) = −𝑢� 𝜔 sin (𝜔𝑡 − 𝜃)
�̈� (𝑡) = −𝑢� 𝜔2 cos (𝜔𝑡 − 𝜃)
Which leads to the following matrix equation:
�−𝑚1𝜔2 + 𝑘1 + 𝑘2 −𝑘2−𝑘2 −𝑚2𝜔2 + 𝑘2
� �𝑢�1𝑢�2� cos (𝜔𝑡 − 𝜃) + �−𝜔(𝑐1 + 𝑐2) 𝜔𝑐2
𝜔𝑐2 −𝜔𝑐2� �𝑢�1𝑢�2
� sin (𝜔𝑡 − 𝜃) = �00�
This equation can be solved with an in-phase (cos(𝜔𝑡 − 𝜃)) and out-of-phase (sin(𝜔𝑡 − 𝜃)) part. The in-phase (cos(𝜔𝑡 − 𝜃)) part leads to an equation from which the natural frequency can be determined. Therefore, only the in-phase part is relevant in this case. The dampening is neglected, as this will have a minor influence on the natural frequency. A trivial solution can directly be seen, namely when the amplitude of the harmonic equation is 0, which is not very interesting. In that case the structure will not move at all. The in-phase part can only satisfy the 0 vector, if the determinant of the matrix on the left hand side is 0, because the harmonic time-function cannot be 0 for all of the time. The determinant of the left hand side matrix can easily be determined, which yields an equation from which the natural frequency can be determined:
𝑚1𝑚2𝜔4 − 𝜔2(𝑚1𝑘2 + 𝑚2(𝑘1 + 𝑘2) ) + 𝑘1 𝑘2 = 0
From this equation four angular velocities can be determined, but two will be of a negative sign and do not have any physical meaning, so only two angular frequencies remain: 𝝎1 and 𝝎2 (rad/s). Now the two natural frequencies can be determined as well:

40
𝑓1,2 = 𝜔1,22𝜋
[Hz]
The two masses and two stiffness parameters have been determined in the spreadsheet (Appendix 3) as well, and are shown below:
m1 [tons] m2 [tons] k1 [N/m] k2 [N/m] 3.6 MW Site 1 (20m.) 2.8*10^3 3.0*10^2 1.28*10^8 1.58*10^6 Site 2 (40m.) 4.3*10^3 3.0*10^2 5.91*10^7 1.51*10^6 Site 3 (60m.) 1.2*10^4 3.0*10^2 4.72*10^7 1.41*10^6 6.0 MW Site 1 (20m.) 5.5*10^3 4.5*10^2 1.43*10^8 1.10*10^6 Site 2 (40m.) 8.5*10^3 4.5*10^2 1.15*10^8 1.06*10^6 Site 3 (60m.) 2.0*10^4 4.5*10^2 1.00*10^8 1.00*10^6 8.0 MW Site 1 (20m.) 6.5*10^3 5.3*10^2 1.64*10^8 1.08*10^6 Site 2 (40m.) 1.1*10^4 5.3*10^2 1.44*10^8 1,04*10^6 Site 3 (60m.) 2.2*10^4 5.3*10^2 1.15*10^8 9.96*10^5
Table 12 Parameters to determine the natural frequencies of the mono piles
4.3 Mono pile design M
The formulas from chapter 4 have been put into a spreadsheet (Appendix 3) to determine the main dimensions of the pile, namely the pile diameter D, the embedded depth d and the wall thickness tw at the most critical cross section. Furthermore, the spreadsheet can be used to calculate these dimensions for different load states and different load combinations. How this spreadsheet should be used is described in Appendix 1.
The calculations for the three selected wind turbines (3.6, 6.0 and 8.0 MW) and the three locations (20, 40 and 60m. water depth) have been made with the spreadsheet. As can be concluded form the calculations in Appendix 7 the ultimate limit state (ULS) 2 with load combination 2 is in all cases governing for the design of the pile dimensions. ULS 2 includes a load factor of 1.35 on the environmental loads and load combination 2 includes a 50 year wave height and a 5 year wind and current velocity.
With the spreadsheet in Appendix 3, the parameters for the 2-mass-spring-dashpot system have also been calculated. These values are used to determine the first two natural frequencies.
4.3.1 Results and conclusions of the static analysis M
The results of the mono pile calculations are shown in the table below.
Diameter [m] Pile length below seabed [m] tw [mm] D/t [-] Site 1 3.6 MW 6,20 27,48 105,00 59 20 m. 6.0 MW 8,20 30,00 124,00 66 8.0 MW 8,70 30,48 132,00 66 Site 2 3.6 MW 6,60 29,16 121,00 55 40 m. 6.0 MW 8,80 33,00 150,00 59 8.0 MW 9,90 34,20 160,00 62 Site 3 3.6 MW 9,60 35,04 97,00 99 60 m. 6.0 MW 12,60 38.64 110,00 115 8.0 MW 13,10 39,37 115,00 114
Table 13 Results of the calculations for the mono pile support structure

41
As can be seen in Table 13, the pile diameter increases for larger water depths and larger wind turbines. Also the embedded depth d increases for larger turbines and larger water depths. The wall thickness will also increase for larger water depths, only not when the water depth increases from 40 to 60 meters (site 2 to site 3). This is due to the large pile diameter which is already required for prevention of buckling in a water depth of 60 m., which results in an already large cross sectional area required for axial and bending stresses. This leads to a relatively small wall thickness compared to site 1 and 2.
Using the spreadsheet, some conclusions can be drawn on the governing pile parameters for the different checks in the ULS.
• The horizontal equilibrium is in all cases governing due to the large horizontal loads of wind, waves and current. The main parameter to influence or correct the horizontal equilibrium is the embedded pile length d. Using a larger pile length, the passive soil resistance becomes larger, resulting in a higher horizontal resistance of the pile. The pile diameter can also be adjusted to enlarge the passive soil wedge behind the pile, but in this case the wave and current loads will also increase. This increase will void the larger horizontal resistance for the relatively large offshore pile diameters (> 5m.)
• The vertical equilibrium is in all cases guaranteed due to the already large pile diameters and embedded depths, resulting in a large shaft friction. The shaft friction represent the largest part of the vertical resistance of the pile, the tip resistance only plays a minor role. For a pile diameter of 5 meter with an embedded length of 28 meter, the tip resistance is already only 12%, which reduces even more for larger diameters and longer piles.
• The other checks in the ULS for yielding and buckling can be influenced by wall thickness and pile diameter. These checks are performed in the most critical cross section, namely at a depth xm below the seabed where the bending moment in the pile is largest. A larger wall thickness and a larger diameter will increase the cross sectional area of the pile, which leads to a higher capacity for the axial and bending stresses.
• For large water depths, buckling plays an important role. For instance at location 3 with 60 m. water depth, the buckling check will not reduce anymore with increasing wall thicknesses. In that case, the increase in weight of the pile (increasing Nd) due to the larger wall thickness will be larger than the increase of the axial capacity of the pile (increasing Np), which reduces the buckling check. The bending capacity of the pile Mp will also increase, but this is a minor influence. When this is the case, the buckling capacity can be increased by a larger pile diameter, which highly increases the section modulus and therefore the bending capacity Mp. In this situation, the pile diameter largely determines the buckling check, and the wall thickness largely determines the yield check.
• There are also some relationships between the yield and buckling check and the horizontal equilibrium. When for instance the yield or buckling capacity should be enlarged, while the horizontal equilibrium is not guaranteed, then the wall thickness has to be enlarged. A larger pile diameter is no solution at all, because this will increase wave and current loads which voids the increase in soil resistance. This further reduces the horizontal equilibrium. The pile diameter can only be used to increase the yield or buckling capacity when the horizontal equilibrium is guaranteed.
• Furthermore, it can be concluded that fatigue is not governing at all for the pile dimensions and the D/t ratio stays below the threshold of 120.
• The deformations in the SLS are not governing at all: the deflections u1 and 𝜃1 stay both well below the limits set by the DNV standard.

42
4.3.2 Results and conclusions of the dynamic analysis M
The results of the calculations are shown in the figures below, sorted to turbine type. In these figures, the 1P and 3P frequencies are also shown. For the frequencies in 20 m. water depth (site 1) red is used, for 40 m. water depth (site 2) violet, and for 60. water depth (site 3) green.
Figure 33 Results for 3.6 MW turbine for 20 m. (red) 40 m. (violet) and 60 m. (green) water
Figure 34 Results for 6.0 MW turbine for 20 m. (red) 40 m. (violet) and 60 m. (green) water
Figure 35 Results for 8.0 MW turbine for 20 m. (red) 40 m. (violet) and 60 m. (green) water
The lower natural frequencies 𝑓1 are mainly determined by the turbine characteristics (mass 2 and stiffness 2 in the 2-mass spring dashpot system depicted in Figure 28). The upper natural frequencies 𝑓2 are mainly determined by the support structure characteristics (mass 1 and stiffness 1 in Figure 29). These latter parameters can be influenced by the support structure design, but in most cases the turbine characteristics cannot be influenced because the turbine will already be designed by the manufacturer.

43
The exact values and conclusions of the natural frequencies can be found below:
Frequency 1 [Hz] Frequency 2 [Hz] 3.6 MW Site 1 (20m.) 0,36385 1,01011 Site 2 (40m.) 0,35878 0,60054 Site 3 (60m.) 0,29700 0,35796 6.0 MW Site 1 (20m.) 0,24754 0,80181 Site 2 (40m.) 0,24350 0,58915 Site 3 (60m.) 0,23573 0,35406 8.0 MW Site 1 (20m.) 0,22542 0,80379 Site 2 (40m.) 0,22203 0,57527 Site 3 (60m.) 0,21600 0,36346
Table 14 First natural frequencies of the mono pile support structure
• The lower natural frequency 𝑓1 is largely determined by the wind turbine characteristics (mass and stiffness). As can be seen, this frequency goes down for larger turbines at the same water depth. This is because for a larger turbine, the hub height will be higher and therefore the tower longer. This results in a lower stiffness, according to the formula given in section 4.2.1, resulting in a lower natural frequency. Furthermore, the mass will increase if the turbine size increases, which reduces the frequency even more. As can be concluded from Figure 33, Figure 34 and Figure 35, this lower natural frequency stays above the 1P range of the wind turbine, so there won’t be any resonance.
• The lower natural frequency 𝑓1 also depends on water depth. For larger water depths, the frequency will go down because the total system of wind turbine and support structure becomes less stiff.
• From the results can be concluded that the upper natural frequency 𝑓2 (which represents the support structure properties) goes down for larger water depths . The main reason for this is a lower stiffness of the mono pile in larger water depths and the larger mass of the pile and enclosed soil and water. This frequency gets into the range of the 3P frequencies, which will lead to resonance and should be avoided by adjusting the design, which will be discussed in the next section.
There are three combinations of water depth (sites) and turbine type which give some resonance problems. These combinations are summed up below, and the design will be adjusted in the next section:
• 3.6 MW turbine at site 2 (40 m. water depth), which gives a 𝑓2 frequency in the 3P range • 6.0 MW turbine at site 3 (60 m. water depth), which gives a 𝑓2 frequency in the 3P range • 8.0 MW turbine at site 2 (40 m. water depth), which gives a 𝑓2 frequency in the 3P range • 8.0 MW turbine at site 3 (60 m. water depth), which gives a 𝑓2 frequency in the 3P range
4.3.3 Adjusting the mono pile design M
There are several possibilities to adjust the mono pile design to avoid resonance in the 3P frequency range. The basic relation between frequency, stiffness and mass is still valid, although the complete wind turbine and support structure is a 2-mass-spring-dashpot system:
2𝜋𝑓 = 𝜔 = �𝑘𝑚
[rad/s]

44
This means, in case of a too low frequency (for instance when the lower natural frequency 𝑓1 falls in the 1P range or the upper natural frequency 𝑓2 falls in the 3P range) the stiffness should be enlarged or the mass should be decreased, to reach a higher 𝑓1 frequency. Because in most cases the mass cannot be influenced (especially for the wind turbine), the stiffness should be influenced by the design parameters. It will not be preferable to adjust the design in the other way, by decreasing the 𝑓1 frequency, because in that case it might infer with the natural frequencies of the waves.
When the natural frequency of the support structure (𝑓2) falls in the 3P range, the design can be adjusted to increase or decrease the natural frequency, respectively above or below the 3P range. It will be preferable to decrease the natural frequency to the range below the 3P frequencies (but still above the 1P frequencies), because in that case a soft-stiff system is reached, which will reduce costs compared to a stiff-stiff system in case of an increased frequency above the 3P range. This will be illustrated for the 3.6 MW turbine in 40 meter water depth below.
3.6 MW turbine at site 2 (40 m. water depth) The 𝑓2 frequency was determined for this combination at 0.60054 Hz, which falls into the 3P range of the wind turbine. Therefore, the design should be adjusted by decreasing the natural frequency just below the 3P range (0.40 Hz), to obtain an economical result in the soft-stiff area. To lower the frequency, the mass of the support structure can be increased or the stiffness decreased. To increase the mass, a larger pile diameter can be chosen, which leads to more steel weight and more important: a larger volume of soil and water enclosed within the pile. On the other hand, the larger pile diameter will also increase the horizontal wave and current loads, which requires a larger embedded depth to obtain horizontal equilibrium. Using the spreadsheet, it can be concluded that an upper natural frequency of 0.40 Hz is reached with the following adjusted properties:
Diameter [m] Pile length below seabed [m] tw [mm] Frequency 2 [Hz] Steel [m3] First design 6,60 29,16 121,00 0,60054 114,30 Adjusted design 11,00 33,00 60,00 0,40034 100,50
Table 15 Results of the adjusted design for the 3.6 MW turbine in 40 m. water depth
As can be seen, the pile diameter becomes very large, but the total amount of steel is less due to the possible reduction of the wall thickness. Therefore, it might still be an economical solution, although the pile diameter becomes impractically large (>9 m.).
Two other solutions could be: • To decrease the frequency to 0.40 Hz with increasing the weight of the support structure by
a concrete block. The necessary mass can be calculated, which is 10500 tons. This is an increase of 5685 tons, which is impossible.
• Furthermore, an increase of the frequency 𝑓2 into the stiff-stiff range could be considered to be a possible solution to prevent resonance. To enlarge the upper natural frequency, the stiffness should be increased and the mass decreased. To increase the stiffness, the pile diameter should be enlarged, which lowers the schematized fixed support of the pile (which is at 3.5 * Dpile). But this will also increase the weight of the pile and the enclosed soil, which voids the increase in stiffness in the calculation of the natural frequency: it will nearly stay the same. Therefore, the natural frequency can hardly be increased by a higher stiffness to reach to stiff-stiff region above the 3P range.
Other turbines It can be concluded from the analyses of the 3.6 MW turbine in 40 m. water depth, that the upper natural frequency can hardly be increased or decreased. To decrease the frequency, an uneconomical pile diameter is required or an impossible increase in mass is required. To increase the frequency, the required increase in stiffness by a larger pile diameter will be voided by the increase in mass of the pile, soil and water.

45
4.3.4 Influence of the soil stiffness M
All calculations for the mono pile design are based on a homogeneous sand layer with a schematized fixed support at a depth of 3.5 times the pile diameter below seabed. In reality, an inhomogeneous soil will be present with sand and clay layers. The main difference between these two types of soils is the stiffness and the presence of cohesion in clay. It is expected that the foundation in clay will require larger pile diameters and longer piles to satisfy horizontal and vertical equilibrium. Furthermore, it is expected that the natural frequency of the support structure will be lower compared to a pile in sand, because the pile and soil interaction will be less stiff. This might lead to more dynamic problems, i.e. resonance.
The influence of the stiffness of the soil on the static and dynamic design of the mono pile will be analyzed by making design calculations for a homogeneous clay layer as well. These calculations will be made for all three locations for the Siemens wind turbine of 3.6 MW.
The main soil parameters that will change are presented in Table 8 and Table 9 already. Furthermore, the location of the schematized fixed support will change due to the lower stiffness of the clay. According to Blum, for different soil types the fixed support can be estimated with Table 16.
Soil type Depth of fixed support below seabed
Stiff clay 3.5 D – 4.5 D
Very soft silt 7 D – 8 D
General calculations 6 D
Experience with offshore wind turbines 3.3 D – 3.7 D Table 16 Location of the fixed support below seabed for different soil types
For the homogeneous sand layer, a value of 3.5 D was used. For the homogeneous clay layer, a value of 4.5 D will be used. This will influence the lateral deformations of the mono pile, which results in a lower stiffness and different dynamic behavior. Below the results of the calculations are presented for the foundation of a 3.6 MW turbine in clay with 20, 40 and 60 meter water depth.
Location 1 3.6 MW Soil Diameter [m] Pile length below seabed [m] tw [mm] D/t [-] Sand 6,20 27,48 105,00 59,05 Clay 6,00 39,00 116,00 51,72
Table 17 Design outputs of a mono pile foundation for 20 meter water depth and 3.6 MW turbine
Location 2 3.6 MW Soil Diameter [m] Pile length below seabed [m] tw [mm] D/t [-] Sand 6,60 29,16 121,00 54,55 Clay 6,20 33,20 130,00 47,69
Table 18 Design outputs of a mono pile foundation for 40 meter water depth and 3.6 MW turbine
Location 3 3.6 MW Soil Diameter [m] Pile length below seabed [m] tw [mm] D/t [-] Sand 9,60 35,04 97,00 98,97 Clay 9,00 40,00 115,00 78,26
Table 19 Design outputs of a mono pile foundation for 60 meter water depth and 3.6 MW turbine

46
As can be seen, the pile diameter can be decreased while the pile length needs to be increased. The main conclusions on the design of a mono pile foundation in clay are:
• To satisfy the horizontal equilibrium, the pile length should be highly increased compared to a homogeneous sand layer. This increase is necessary because of the lower passive soil coefficient due to the lower angle of internal friction. This results in a lower passive soil pressure, and therefore the length of the pile should be increased to enlarge the passive soil wedge. This parameter is governing in the design of the mono pile in clay.
• Due to the enlarged pile length, the vertical equilibrium is already satisfied at relatively small pile diameters compared to a foundation in sand. The vertical soil resistance in clay will be lower due to the far lower tip resistance of clay compared to sand. The shaft friction of clay is only little less compared to sand, because op the influence of the high undrained shear strength of clay which is not present in sand. The reduced vertical resistance of clay is voided by the enlarged pile length, which makes it possible to reduce the pile diameter compared to a foundation in sand, although this leads to a decrease in soil resistance. As was discussed before in 4.3.1 , the decrease of wave and current loads will be higher than the decrease of soil resistance and therefore the horizontal equilibrium is still guaranteed.
• The wall thickness of the pile needs to be increased to satisfy the yield and buckling check due to the smaller diameter of the pile. The D/t ratio is therefore highly decreased compared to the mono piles in sand, where the D/t ratio was in some cases a governing factor in the design of the piles. The smaller pile diameter, larger wall thickness and longer pile still leads to a reduced mass of the total support structure, as can be seen in the dynamic analysis below.
The presence of a homogeneous clay layer will largely influence the stiffness of the soil. The stiffness of the support and soil in total is again modeled as a lateral linear spring with the calculated lateral loads and resulting lateral displacements.
Location 1 3.6 MW Soil m1 [tons] m2 [tons] k1 [N/m] k2 [N/m] Frequency 1 [Hz] Frequency 2 [Hz] Sand 2.826*10^3 3.0*10^2 1.28*10^8 1.58*10^6 0,36385 1,01011 Clay 2.748*10^3 3.0*10^2 8.55*10^7 1.58*10^6 0,36243 0,89798
Table 20 Parameters for the mono pile support in clay at 20 m water depth
Location 2 3.6 MW Soil m1 [tons] m2 [tons] k1 [N/m] k2 [N/m] Frequency 1 [Hz] Frequency 2 [Hz] Sand 4.321*10^3 3.0*10^2 5.91*10^7 1.51*10^6 0,35878 0,60054 Clay 3.928*10^3 3.0*10^2 4.26*10^7 1.51*10^6 0,34762 0,54072
Table 21 Parameters for the mono pile support in clay at 40 m water depth
Location 3 3.6 MW Soil m1 [tons] m2 [tons] k1 [N/m] k2 [N/m] Frequency 1 [Hz] Frequency 2 [Hz] Sand 1.158*10^4 3.0*10^2 4.72*10^7 1.41*10^6 0,29700 0,35796 Clay 1.028*10^4 3.0*10^2 5.16*10^7 1.41*10^6 0,28436 0,34274
Table 22 Parameters for the mono pile support in clay at 60 m water depth
As can be seen, the longer pile and smaller pile diameter leads to a lower stiffness of the soil/support structure as in sand (k1), because the level of the fixed support is lowered to 4.5 times the pile diameter. This also leads to a slight decrease in mass of the pile (and enclosed soil and water). It can be concluded that in case of homogeneous clay layer the dynamic behavior of the support structure design becomes softer, which was also expected: the second natural frequency decreases slightly. The first natural frequency nearly stays the same as it is only determined by the wind turbine.

47
For location 2 the second natural frequency still lies within the 3P range, which can hardly be adjusted as was concluded in section 4.3.3. For this location, the mono pile foundation for a 3.6 MW turbine is still not suitable in homogeneous clay. For the other two 3.6 MW turbines at 40 and 60 m water depth, the clay layer will not pose any resonance problems at all, although the second natural frequency is close to the 3P range of the wind turbine. For other turbines (6.0 and 8.0 MW) and water depths in homogeneous clay, resonance may be a problem and limit the application range of the mono pile as was also concluded for a homogeneous sand layer.
4.3.5 Technical limitations of the mono pile M
From the static and dynamic calculations is can be concluded that the pile diameters become very large (>10 m.) for application of mono piles in water depths of 60 meter. Furthermore, the upper natural frequency of turbine/support structure system falls into the 3P range of the wind turbine. This frequency is hardly adjustable as was concluded in section 4.3.3.
For the determination of the technical limits of the mono pile foundation, the following boundaries are set:
• Pile diameter should stay below 9 meters • Wall thickness should stay below 150 mm
No boundary for the pile length is given, because the tubular sections can be welded together by the steel industry without any technical limitations. For water depths of 40 meters, the dynamic analysis showed out that the 3.6 MW and 8.0 MW turbine give a natural frequency in the 3P range, which results in resonance. Only the 6.0 MW turbine on the mono pile support gives a natural frequency outside the 3P range, but the pile diameter is 8.80 m. This might still be possible from a fabrication and installation point of view, although it will not be the most economical support structure.
The 60 m. water depth location will result in very large pile diameters, above the boundary of 9 meters. Furthermore, the 6.0 and 8.0 MW turbine leads to resonance in the 3P range of the turbine, which can hardly be adjusted with the design. Therefore, the mono pile is not suitable for 60 m. water depths.
The technical limitation of the mono pile is therefore set at a water depth of 20 m. For this water depth, all three wind turbines of 3.6, 6.0 and 8.0 MW can be installed on the mono pile support structure with a pile diameter below 9 meter. For larger water depth, the technical limitations of large pile diameters and wall thicknesses leads to fabrication problems. Furthermore, the dynamic behavior of the support results in resonance, which can hardly be adjusted by the mono pile design.
The dimensions of the mono pile are largely influenced by the soil conditions. For soft soils the stiffness of the pile and soil system decreases, which causes resonance problems for mono piles in larger water depths with already low stiffness’s. For water depths around 20 meter, the mono pile in clay is still a feasible support structure for the 3.6 MW wind turbine.
48
5. Tripod Support Structure S
Besides the mono pile support structure, also the tripod support structure will be analyzed. Like the analysis for the mono pile, first of all a static analysis will be done. After that the stiffness of the support structure and soil will be determined, which is used for the dynamic analysis. The analysis will show a lot of similarities with the mono pile. The main differences between these two are the number of joints and the foundation method. The tripod consists of three foundation piles which are mainly axially loaded.
5.1 Design inputs S
A tripod can be designed in many different ways. For this research, a specific design will be analyzed and only the dimensions will be changed according to the environmental loads. Therefore this lay out has to be defined. This is determined by the following elements of the support structure, which are shown in Figure 36.
• Main joint: upper joint between the legs and column (I) • Bottom joint: lower joint between braces and the bottom of column (II) • Column (I): central tubular pipe between the main joint and the bottom joint • Column (II): central tubular pipe from the main joint to the bottom of the tower • Leg: tubular pipe which connects the pile sleeve to the main joint at the column • Brace: tubular pipe which connects the pile sleeve to the bottom joint
Figure 36 Elements of the analysed tripod [23]
Column The column is embedded between the main joint and the bottom joint, which makes it impossible to rotate. The column (II) will therefore be schematized as a mono-pile with a fixed support at the level of the main joint. The position of the main joint above the seafloor is determined by the leg angle and the horizontal length of the legs (base width r). This length is determined by the overturning moment which has to be transmitted to the seafloor. When the overturning moment is larger, the base width has to be larger as well to increase the section modulus of the tripod base. For column (II) the D/t ratio is not fixed, only limited according to DNV [11]. The cross-section with the largest bending moment (right above the main joint) will be normative for yield- and buckling checks in the Ultimate Limit State, these checks will only be performed at this location. The tapered cross section of the column below the main joint is not taken into account in this analysis.

49
Braces and legs The brace- and leg- angle with the horizontal axis is set at a fixed value. This angle is not considered to be a design parameter in this research, because this would lead to a very large number of possible designs. For larger water depths, the leg angle will probably need to be larger to reduce the unsupported column length. Therefore, for water depths of 20 meter the leg angle will be 50° and for water depths of 40 and 60 meter this will be increased to 60°. The braces have an angle of 10° for all locations. Furthermore, the tripod will be symmetrical, which means that the angle in the horizontal plane 120°.
The base width r is defined, which is the center to center distance from the column to one of the foundation piles (Figure 36). The base width will largely influence the axial forces in the braces and legs, and therefore needs to be larger for larger water depths, to prevent uneconomically large dimensions of the braces and legs. For 20, 40 and 60 m. water depth (locations 1, 2 and 3) the base width is set at 15, 20 and 25 m. respectively. The braces and legs are assumed to be only axially loaded, as they have a hinge support on both sides with the column and the pile sleeves. This welded connection will not transfer any moments. Due to the large axial forces in the braces and the legs, both the yield and buckling check are performed for these members. The ratio between the diameter and the wall thickness is 50 for both the legs and the braces to reduce the number of possible designs.
Foundation piles The foundation piles are both laterally and axially loaded. The lateral loads are evenly distributed across the three piles and are transferred from the tripod to the foundation piles at the grout connection between the pile sleeves and the foundation piles. The vertical loads are also evenly distributed over three piles. Only the bending moment around the center of gravity will result in different tension or compression forces within the foundation piles. The D/t ratio of the foundation piles is not pre-determined but will follow form the design of the foundation piles. This ratio has to stay below 120 according to DNV [11].
Summarizing, the pre-determined design parameters are:
Water depth Base width Brace angle Leg angle D/t ratio braces/legs [m] [m] [°] [°] [-] Location 1 20 15 10 50 50 Location 2 40 20 10 60 50 Location 3 60 25 10 60 50
Table 23 Pre-determined design parameters for the tripod
5.2 Ultimate limit state S
Because of the triangle formed base of the tripod, the force distribution within the members depends on the load direction. Two extreme situations can be determined, shown in Figure 37. It is assumed that the extreme wind, wave and current loads occur in the same direction and that they can occur in each direction. Only load situations 1 and 2 are taken into account in this research, as the tripod will be mainly designed and installed for load directions 1 and 2 as depicted in Figure 37.

50
Figure 37 Load situations for a tripod support structure
Different members and connections have to be checked to determine the dimensions of the tripod. In this preliminary design, only the most important members and connections will be checked in the ULS, which will be described below.
Column The column is checked on yielding and buckling in the ULS. The maximum axial force and bending moment will be present right above the main joint, therefore the yield check is performed right there. For the buckling check, the column is schematized as a one sided fixed support with a Euler buckling length of 2 times the total length of turbine and column (down to the main joint). The rest of the buckling check is performed according to the DNV formulas as does not differ from the mono pile.
𝐹𝐸𝑢𝑙𝑒𝑟 = 𝜋2 𝐸𝐼
(2𝑙)2 [N]
Braces and legs The braces and legs are designed to resist the governing tension and compression force in the ULS. They should all be able to resist the largest possible tension and compression forces, because the wind, wave and current loads may occur in every direction. Therefore the maximum of the compression or tension force is used to perform the yield check. For the buckling check, no term for the bending moment is taken into account, because there won’t be a bending moment in the braces and legs due to the hinges on both sides, which is a simplification of the reality. In reality there will be a bending moment in the braces and legs. The formula for the buckling check without bending moment becomes:
𝑁𝑑𝜒 ∗ 𝑁𝑝
+ ∆𝑛 ≤ 1 [-]
For the buckling check, a two sided hinged beam is used to determine the Euler buckling force, which is necessary to calculate the reduction factor 𝜒. The buckling length is equal to the system length for a two sided hinge supported tube. This is a conservative approach because in reality the braces and legs will be partly fixed support, which results in a smaller buckling length and higher buckling load. The formula becomes, with l the brace or leg length:
𝐹𝐸𝑢𝑙𝑒𝑟 = 𝜋2 𝐸𝐼𝑙2
[N]

51
Foundation piles The foundation piles should also be checked on yielding. The maximum moment will be spread over the foundation piles, which results in tension stresses at the upwind piles and compression stresses at the downwind side. To perform the yield check, the largest tension or compression force is used because all piles should be able to resist both compression and tension. The total stress in one foundation pile is the sum of the stress due to the bending moment and the stress due to the mass of the wind turbine and support structure on top of the piles. The maximum stress in the ULS should stay below the yield stress of steel. The buckling check is not relevant for the foundation piles, as they are completely embedded in the soil.
5.3 Static analysis S
The legs and the braces are axially loaded members. Because the leg- and brace- angles with the horizontal axis are already determined, the horizontal and vertical forces in the piles can be written as functions of the axial forces in the braces (angle 𝛼 with horizontal axis) and the legs (angle ß with horizontal axis):
𝐹𝑉 = sin ß 𝐹𝑙𝑒𝑔 + sin𝛼 𝐹𝑏𝑟𝑎𝑐𝑒 [N]
𝐹𝐻 = cos ß𝐹𝑙𝑒𝑔 + cos𝛼 𝐹𝑏𝑟𝑎𝑐𝑒 [N]
The horizontal force 𝐹𝐻,𝑝𝑖𝑙𝑒 on each foundation pile are known, these are equal to the sum of the wave, wind and current loads divided over the three piles. The vertical load in a pile is determined by the total downward forces due to the mass of the complete structure (∑𝐹𝑣𝑒𝑟𝑡𝑖𝑐𝑎𝑙 divided over three piles), as well as by the tension or compression forces due to the overturning moment.
𝐹𝐻 = 13
(𝐹𝑤𝑎𝑣𝑒 + 𝐹𝑤𝑖𝑛𝑑 + 𝐹𝑐𝑢𝑟𝑟𝑒𝑛𝑡) [N]
The overturning moment is transmitted to the soil by an axial force in the foundation pile. The total moment is generated by the pile forces times the distance to the center of gravity of the tripod base in the horizontal plane. Using Figure 37 and Figure 38 the following formulas can be derived for the axial force in pile 1 and pile 2 and 3 due to the bending moment and gravity forces, dependent on the load situation:
Figure 38 Loads in foundation piles due to bending moment
and gravity forces for load situation 1

52
Load situation 1:
𝐹𝑣, 𝑝𝑖𝑙𝑒 1 = 𝑀𝑜𝑣𝑒𝑟𝑡𝑢𝑟𝑛𝑖𝑛𝑔
sin(30)𝑟+𝑟− ∑𝐹𝑣𝑒𝑟𝑡𝑖𝑐𝑎𝑙
3 (tension, N)
𝐹𝑣, 𝑝𝑖𝑙𝑒 2,3 = −12𝑀𝑜𝑣𝑒𝑟𝑡𝑢𝑟𝑛𝑖𝑛𝑔
sin(30)𝑟+𝑟− ∑𝐹𝑣𝑒𝑟𝑡𝑖𝑐𝑎𝑙
3 (compression, N)
Load situation 2:
𝐹𝑣, 𝑝𝑖𝑙𝑒 1 = 𝑀𝑜𝑣𝑒𝑟𝑡𝑢𝑟𝑛𝑖𝑛𝑔
sin(30)𝑟+𝑟 − ∑𝐹𝑣𝑒𝑟𝑡𝑖𝑐𝑎𝑙
3 (compression, N)
𝐹𝑣, 𝑝𝑖𝑙𝑒 2,3 = 12𝑀𝑜𝑣𝑒𝑟𝑡𝑢𝑟𝑛𝑖𝑛𝑔
sin(30)𝑟+𝑟 − ∑𝐹𝑣𝑒𝑟𝑡𝑖𝑐𝑎𝑙
3 (tension, N)
The overturning moment should be calculated at seabed level, which can be done with the horizontal forces and the arms to the top of the foundation piles. It can be concluded that the maximum tension or compression forces due to the bending moments are the same when both load situations (1 and 2) are taken into account. All three foundation piles should be able to resist these maximum compression and tension forces. It depends on the total turbine and tripod mass 𝐹𝐺 if the upwind foundation pile will be tension loaded.
Now both the 𝐹𝐻,𝑝𝑖𝑙𝑒 and 𝐹𝑣,𝑝𝑖𝑙𝑒 are known, and the upper system of equation with the unknown forces in the braces and the legs can be solved as a function of the horizontal and vertical forces in the foundation piles. These forces will be governing on the design of the braces and the legs:
𝐹𝑙𝑒𝑔 = 𝐹𝐻−
𝐹𝑉tan𝛼
cosß− sinßtan𝛼
[N]
𝐹𝑏𝑟𝑎𝑐𝑒 = 𝐹𝑉− tanß𝐹𝐻sin𝛼− tanß cos𝛼
[N]
5.3.1 Horizontal equilibrium S
The horizontal loads consist wave, wind and current loads. Above the legs and braces, the tripod support structure will be subject to the same loads as a mono pile, only dependent on the dimensions of the tower and column (II). The current load will be different due to the braces and legs.
The current loads on columns (I) and (II) can be calculated in the same manner as for a mono pile support structure. Because the trapezoidal form of the flow above the bottom joint, this will be divided into two different forces. For the braces and the legs itself this load is different. It is assumed that the structure will behave as a slender structure. Therefore the total area of the structure (braces, legs and pile sleeves) perpendicular to the flow will be calculated and used in the formula for drag force. The velocity is assumed to be linear with the height. Therefore the point of action for the load is expected to be at 1/3 of top, but because the area of the braces and legs is mainly near the bottom, the point of action of the current load at the braces and legs will be assumed at half the height of the main joint.
The interaction between wave and current is not taken into account. For detailed calculations the current load and drag wave load should be summed up as vectors. Therefore, the current load is only determined up to MSL and the wave crest is not included.
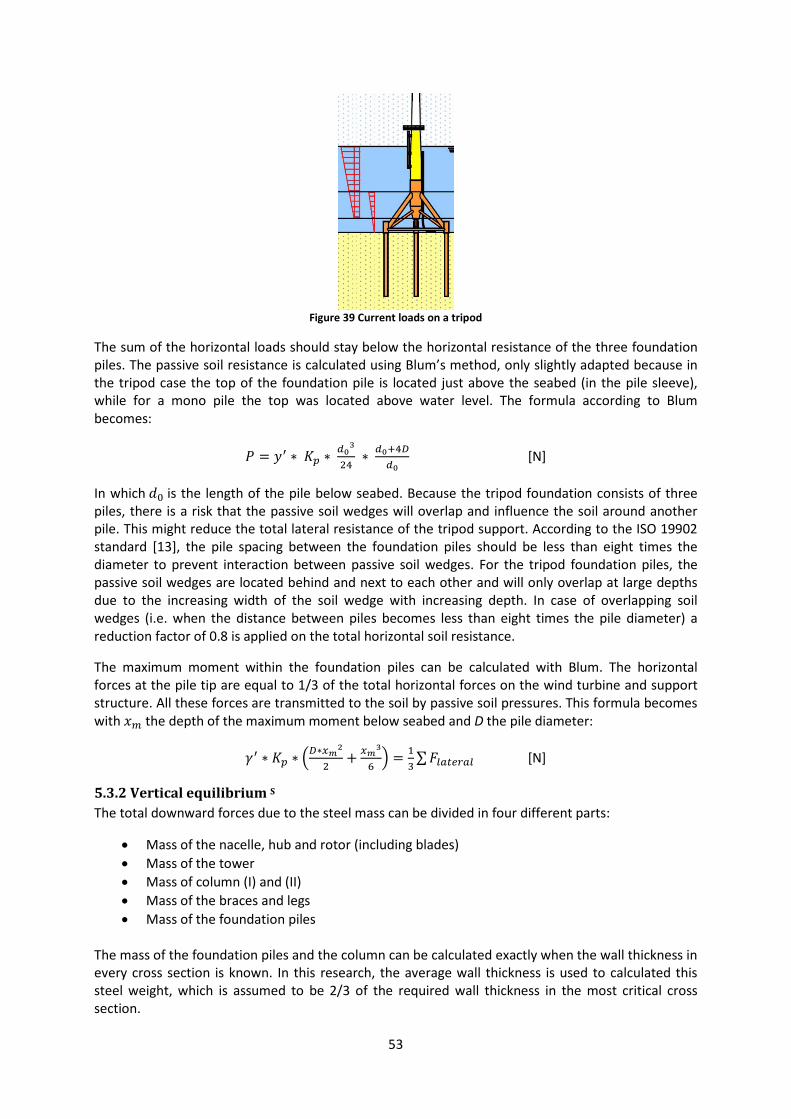
53
Figure 39 Current loads on a tripod
The sum of the horizontal loads should stay below the horizontal resistance of the three foundation piles. The passive soil resistance is calculated using Blum’s method, only slightly adapted because in the tripod case the top of the foundation pile is located just above the seabed (in the pile sleeve), while for a mono pile the top was located above water level. The formula according to Blum becomes:
𝑃 = 𝑦′ ∗ 𝐾𝑝 ∗ 𝑑03
24 ∗ 𝑑0+4𝐷
𝑑0 [N]
In which 𝑑0 is the length of the pile below seabed. Because the tripod foundation consists of three piles, there is a risk that the passive soil wedges will overlap and influence the soil around another pile. This might reduce the total lateral resistance of the tripod support. According to the ISO 19902 standard [13], the pile spacing between the foundation piles should be less than eight times the diameter to prevent interaction between passive soil wedges. For the tripod foundation piles, the passive soil wedges are located behind and next to each other and will only overlap at large depths due to the increasing width of the soil wedge with increasing depth. In case of overlapping soil wedges (i.e. when the distance between piles becomes less than eight times the pile diameter) a reduction factor of 0.8 is applied on the total horizontal soil resistance.
The maximum moment within the foundation piles can be calculated with Blum. The horizontal forces at the pile tip are equal to 1/3 of the total horizontal forces on the wind turbine and support structure. All these forces are transmitted to the soil by passive soil pressures. This formula becomes with 𝑥𝑚 the depth of the maximum moment below seabed and D the pile diameter:
𝛾′ ∗ 𝐾𝑝 ∗ �𝐷∗𝑥𝑚2
2+ 𝑥𝑚3
6� = 1
3∑𝐹𝑙𝑎𝑡𝑒𝑟𝑎𝑙 [N]
5.3.2 Vertical equilibrium S
The total downward forces due to the steel mass can be divided in four different parts:
• Mass of the nacelle, hub and rotor (including blades) • Mass of the tower • Mass of column (I) and (II) • Mass of the braces and legs • Mass of the foundation piles
The mass of the foundation piles and the column can be calculated exactly when the wall thickness in every cross section is known. In this research, the average wall thickness is used to calculated this steel weight, which is assumed to be 2/3 of the required wall thickness in the most critical cross section.

54
The total downward force is transmitted by the three foundation piles. This results in a compression force in each pile of 1/3 of the total weight of the turbine and support structure. Furthermore the axial tension or compression forces due to the overturning moment should be taken into account, as was discussed in the static analysis. The vertical resistance of each pile is calculated according to DNV [11] as was already discussed in detail for the mono pile support. The pile resistance for the vertical equilibrium of forces consists of two parts: the tip resistance and the shaft resistance. When tension forces occur in one of the foundation piles, which is plausible in case of a tripod, the tip resistance may not be taken into account according to [11]. The formulas according to DNV are already discussed in the mono pile analysis. Furthermore, the length of the foundation piles required for the vertical equilibrium should be enlarged with 2 times the pile diameter to be able to make to grout connection in the pile sleeve.
5.3.3 Deformations M
The deformations of the tripod will significantly differ from the mono pile. The braces and legs (between the main joint and the pile sleeves) were first schematized as a rigid structure, therefore only two different sections deformed due to the horizontal loads, namely the soil and foundation piles, and the column (II) above the upper joint. This resulted in a very stiff structure and deformation of only several millimeters. Therefore, the assumption of the rigid braces and legs was not appropriate and the deformations were calculated in Scia Engineer. A further elaboration on the stiffness of the tripod is included in chapter 5.5.3 where it was also concluded that the rigid braces and legs gives an overestimation of the natural frequency due to the high stiffness.
To model the tripod in Scia Engineer, the supports op the foundation piles should be analyzed. The foundation piles deform between the pile sleeves and the schematized fixed support. The rotation at the connection with the pile sleeve will be 0, because it won’t be possible to rotate within the pile sleeve due to the grout connection. Therefore, the foundation pile will be stiffer compared to the mono pile. The rotation of the assumed rigid tripod should be calculated to check if this assumption is appropriate. The tension loaded pile will be enlarged due to the axial force, while the compression loaded pile will be shortened. This leads to a rotation around the center of gravity according to:
𝜙 = ɛ1+ ɛ2sin(30)∗𝑅+𝑅
[degree] with ɛ1 = 𝑁𝑡𝑒𝑛𝑠𝑖𝑜𝑛𝐸𝐴
and ɛ2 = 𝑁𝑐𝑜𝑚𝑝𝑟𝑒𝑠𝑠𝑖𝑜𝑛
𝐸𝐴 [-]
In which 𝑁𝑡𝑒𝑛𝑠𝑖𝑜𝑛 and 𝑁𝑐𝑜𝑚𝑝𝑟𝑒𝑠𝑠𝑖𝑜𝑛 are the average pile forces, i.e. half of the pile force on top of the pile. The calculation of the rotation angle results in very low values in order of 10−5. The stains in the foundation piles are of the same order and can also be neglected. Therefore, the rotation of the tripod on the foundation piles can be neglected as well.
The support at the top of the foundation piles is therefore entered in Scia with fixed rotations in all directions and only translations possible along the seabed, in x- and y-direction, and no displacement in z-direction. The latter assumption means that the settlement of the piles is neglected as can be concluded from the strains in the piles calculated above. The support at the pile toe will be modeled as a fixed support for all translations and all rotations. The pile length is entered as 3.5 * Dpile for sand layers and 4.5 * Dpile for clay layers. The other connections between the braces, legs and column have been modeled as hinges. The deformation at seabed level should stay below 0.03 * Dpile and the rotation should stay below 0.5° according to DNV [11]. The rotation at seabed can be neglected, because the foundation pile cannot rotate within the pile sleeve.

55
5.3.4 Fatigue S
The fatigue due to mean wind and wave load variations is taken into account as was done for the mono pile. For the wave loads a return period of 10 s. is used to determine the mean wave height. The cyclic stress range is now calculated as the difference in stress when a mean wave is present and when it is not present. For the wind loads, the turbulence intensity is used to determine an upper and lower value of the mean thrust force on the wind turbine, which also results in a cyclic varying stress. Because for the tripod the joints between braces, legs, column and foundation piles are especially sensitive to fatigue (Figure 40), a Stress Concentration Factor of 3 is applied to these joint. The SCF is in this research assumed to be independent on the local joint geometry.
Figure 40 Fatigue damage of the main joints of the tripod support [23]
In this research only 2 joints are taken into account: the main joint between column and the legs and the joint between the braces, legs and pile sleeve. The joint between braces and column is not taken into account. Furthermore, the foundation piles are checked on fatigue in a critical cross section. Column-leg connection (main joint) For the column the normative section has to be checked on fatigue. The maximum moment in the column will be right above the main joint at the connection with the legs, so this connection has to be checked. The variation in equivalent stress can be calculated in the same way as the mono pile with the known variations in wind and wave loads and the section modulus of the cross section.
The equivalent stress range is multiplied with the Stress Concentration Factor (SCF) for the local stress accumulation. The SCF is assumed to be 3 and not calculated for the exact geometry of the joint. This results in a number of equivalent cycles up to failure of the column.
Braces-legs-pile sleeve connection The forces in both the braces and legs may vary as the mean wind and mean wave loads occur in different directions. The varying wind and wave loads will result in a varying bending moment at the seabed, which results in a varying axial load in the foundation piles. This load is used to determine the varying axial load in the braces and legs. The only difference with a static analysis of the brace and leg forces is the gravity load, which will not vary and will not be taken into account. No bending moment will occur in the braces and the legs, so for the stress variation not the section modulus, but the cross-section area will be used. The Stress Concentration Factor is also applied to the local joint of braces, legs and pile sleeve.
∆𝜎𝑙𝑒𝑔 = 𝛥𝐹𝑙𝑒𝑔𝐴𝑙𝑒𝑔
∆𝜎𝑏𝑟𝑎𝑐𝑒 = 𝛥𝐹𝑏𝑟𝑎𝑐𝑒𝐴𝑏𝑟𝑎𝑐𝑒
[N/mm2]

56
Foundation pile The normative cross-section for the foundation pile is located at a depth below seabed where the maximum bending moment occurs. This depth can be calculated where the derivative of both the moments of the environmental loads and moments of passive soil pressure is 0, as was already discussed above. With this depth known, both the stress variations due to wind and wave loads are calculated, which results in an equivalent stress range. This stress range is used to determine the equivalent number of cycles up to failure.
5.4 Dynamic analysis M
5.4.1 Basic dynamics of a tripod M
As was discussed in the dynamic analysis of the mono pile, every wind turbine and support structure combination can be schematized as a multiple mass-spring-dashpot system. The tripod will behave like a two mass-spring-dashpot system. The main difference between the mono pile and tripod lies in the foundation and support structure: for a mono pile, both the foundation and support structure consist of the same steel tubular pipe, while for a tripod the foundation piles will behave different than the support structure (braces, legs and column). Therefore, the foundation piles will have a different stiffness than the support structure (braces, legs and column). It is expected that the second natural frequency is higher compared to the mono piles due to the larger stiffness of the tripod. The first natural frequency will probably stay the same (in between the 1P and 3P range) because this is mainly influenced by the turbine design and not by the support design.
Masses The upper mass consists of the rotor, nacelle and hub mass. The lower mass consists of the column, braces and legs and for a more detailed analysis the mass of the platform, boatlander and J-tube may also be added to this mass. Furthermore, the lower mass consist of the mass of the foundation piles and the enclosed soil within the piles, both up to the schematized fixed support at 1.75 times the pile diameter below seabed for sand. The tower mass is again partly added to the top mass and partly added to the lower mass, as was already discussed in the mono pile section.
The water mass between the legs and braces of the tripod will also take part in the dynamic vibrations of the completer support structure. Therefore an approximated water volume will be included, which is calculated as the surface are of the tripod base times one third of the height of the leg-column connection above seabed 1
3 ℎ. This water volume represents the enclosed water
between the braces, legs and the seabed.
𝑉𝑤 = (sin(30) ∗ 𝑟 + 𝑟) ∗ sin(60) 𝑟 ∗ 13
ℎ [m3]
Springs The upper spring represents the tower of the wind turbine and can be calculated with the formula given in the mono pile analysis. The stiffness of the lower spring is completely different than for a mono pile. The tripod will behave like a multiple spring system with a rotation and translation stiffness. The translation stiffness acts in lateral directions and is generated by the foundation piles. The rotation stiffness is determined by the column. The braces and legs are assumed to be rigid and will provide a fixed support at the bottom of the column.
The lateral stiffness of the foundation piles can be calculated with the pile top displacement 𝑢1 and the lateral loads acting on the support structure, namely the wave and current loads. The wind loads are not taken into account the support structure stiffness, because this load will determine the stiffness of the wind turbine.
𝑘𝑙𝑎𝑡 = 𝐹𝑤𝑎𝑣𝑒 + 𝐹𝑐𝑢𝑟𝑟𝑒𝑛𝑡𝑢1
[N/m]

57
The rotational stiffness can be found when the bending moment (at the top of the platform, which is the top of the column) and the top rotation of the column of the tripod structure are known:
𝑘𝑟𝑜𝑡 = 𝑀𝑝𝑙𝑎𝑡𝑓𝑜𝑟𝑚
𝜑 [Nm/rad]
According to [24] an equivalent stiffness can be determined which can be used in the two mass-spring dashpot system as discussed in the mono pile section. This equivalent stiffness is:
𝐾𝑒𝑞 = 𝐾𝑟𝑜𝑡 𝐾𝑙𝑎𝑡 𝐿2
𝐾𝑟𝑜𝑡+ 𝐾𝑙𝑎𝑡 𝐿2 [N/m]
In which L is the length of the total support structure including both the lateral and rotation spring, which is the distance from the schematized embedded depth (at 1.75 times Dpile below seabed) up to the platform level above MSL. The schematized embedded depth is half of the approximation of Blum (3.5 times the pile diameter) because of the fixed rotations of the pile top at seabed level. This length both includes the rotation spring (braces, legs and column) and the lateral spring (foundation piles).
Dashpots The dampening in this system will be neglected, because this will have a minor influence on the natural frequency. In this case only the natural frequency needs to be determined to design a wind turbine support structure outside the 1P or 3P range. In a more detailed analysis the deflections and eigen-modes of the wind turbine also need to be calculated, this will be largely influenced by the aerodynamic and structural dampening. In that case the dampening should not be neglected.
5.4.2 Natural frequency of a tripod M
Because the dampening is neglected, the solution of the 2-mass spring damper system is the same as for a mono pile, only with different stiffness’s and different masses. The formula to determine the natural frequencies as a function of the total support mass (𝑚1), the tower mass (𝑚2), the equivalent spring stiffness of the support structure (𝑘eq) and the stiffness of the tower 𝑘2 is:
𝑚1𝑚2𝜔4 − 𝜔2�𝑚1𝑘2 + 𝑚2�𝑘eq + 𝑘2� � + 𝑘eq𝑘2 = 0
The parameters for this equation are determined with the spreadsheet which is included in Appendix 5. The results are given below:
m1 [tons] m2 [tons] k1 [N/m] k2 [N/m] 3.6 MW Site 1 (20m.) 3,1*10^3 3,0*10^2 3,47*10^9 1,57*10^6 Site 2 (40m.) 7,5*10^3 3,0*10^2 1,44*10^9 1,52*10^6 Site 3 (60m.) 1,4*10^4 3,0*10^2 3,48*10^8 1,41*10^6 6.0 MW Site 1 (20m.) 4,0*10^3 4,5*10^2 2,43*10^10 1,10*10^6 Site 2 (40m.) 8,6*10^3 4,5*10^2 8,52*10^9 1,06*10^6 Site 3 (60m.) 1,5*10^4 4,5*10^2 1,58*10^9 1,01*10^6 8.0 MW Site 1 (20m.) 4,3*10^3 5,3*10^2 3,86*10^10 1,07*10^6 Site 2 (40m.) 9,0*10^3 5,3*10^2 1,27*10^10 1,05*10^6 Site 3 (60m.) 1,6*10^4 5,3*10^2 2,77*10^9 9,96*10^5
Table 24 Parameters to determine the natural frequencies of the tripods

58
As can be seen, for larger water depths the total support structure mass increases (m1). The stiffness will decrease with increasing water depths. The stiffness of the tower decreases for larger turbines due to the longer tower. The exact results of the natural frequency calculations by hand can be found below:
Frequency 1 [Hz] Frequency 2 [Hz] 3.6 MW Site 1 (20m.) 0,36634 5,38615 Site 2 (40m.) 0,35943 2,20763 Site 3 (60m.) 0,34551 0,80454 6.0 MW Site 1 (20m.) 0,24895 12,41147 Site 2 (40m.) 0,24411 5,01523 Site 3 (60m.) 0,23822 1,62401 8.0 MW Site 1 (20m.) 0,22561 15,00487 Site 2 (40m.) 0,22328 5,98190 Site 3 (60m.) 0,21743 2,11548
Table 25 First natural frequencies of the tripod support structure
As can be seen in Table 25 and Table 14, the tripod support structure seems to be very stiff compared to the mono pile support structure. Due to the uncertainty about the calculations of the soil- and support structure stiffness, a dynamic analysis has been made in Scia Engineer to check if the results from the hand calculations are reliable. It is expected that the hand calculations overestimate the stiffness of the tripod due to the rigid schematization of the braces and legs. Scia will probably give lower natural frequencies because it takes the brace and leg stiffness into account.
The tripod support structure has been modeled in Scia Engineer’s student version using the dimensions from the static analysis (Table 26). The dimensions of the tower are not calculated as a part of the static analysis, but are given by the turbine manufacturer. The average value of the top and bottom diameter of the tower are used to enter in Scia. The structure can be seen below.
Figure 41 Model of the tripod in Scia Engineer
The connections between the braces/legs and the column are modeled in Scia with hinges. The connections between the braces, legs and pile sleeves have been modeled with hinges as well. The pile sleeves are schematized as a fixed support in vertical direction, while it can move in x and y direction over the seabed. The rotations at the pile sleeves are prevented. In chapter 5.3.3 it was concluded that the rotations of the pile sleeves are negligible, and therefore only the translation in x and y direction are taken into account. The fixed supports of the foundation piles (no rotations or translation at all) are schematized at a depth of 3.5 times the pile diameter below seabed.
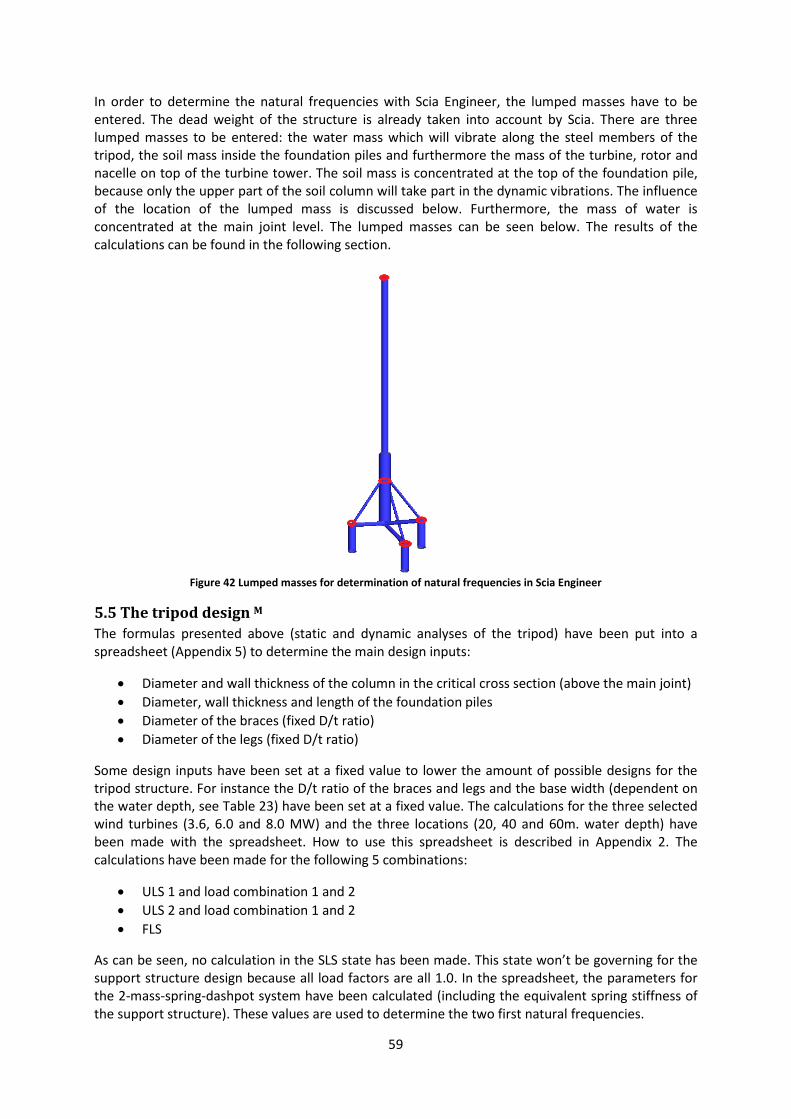
59
In order to determine the natural frequencies with Scia Engineer, the lumped masses have to be entered. The dead weight of the structure is already taken into account by Scia. There are three lumped masses to be entered: the water mass which will vibrate along the steel members of the tripod, the soil mass inside the foundation piles and furthermore the mass of the turbine, rotor and nacelle on top of the turbine tower. The soil mass is concentrated at the top of the foundation pile, because only the upper part of the soil column will take part in the dynamic vibrations. The influence of the location of the lumped mass is discussed below. Furthermore, the mass of water is concentrated at the main joint level. The lumped masses can be seen below. The results of the calculations can be found in the following section.
Figure 42 Lumped masses for determination of natural frequencies in Scia Engineer
5.5 The tripod design M
The formulas presented above (static and dynamic analyses of the tripod) have been put into a spreadsheet (Appendix 5) to determine the main design inputs:
• Diameter and wall thickness of the column in the critical cross section (above the main joint) • Diameter, wall thickness and length of the foundation piles • Diameter of the braces (fixed D/t ratio) • Diameter of the legs (fixed D/t ratio)
Some design inputs have been set at a fixed value to lower the amount of possible designs for the tripod structure. For instance the D/t ratio of the braces and legs and the base width (dependent on the water depth, see Table 23) have been set at a fixed value. The calculations for the three selected wind turbines (3.6, 6.0 and 8.0 MW) and the three locations (20, 40 and 60m. water depth) have been made with the spreadsheet. How to use this spreadsheet is described in Appendix 2. The calculations have been made for the following 5 combinations:
• ULS 1 and load combination 1 and 2 • ULS 2 and load combination 1 and 2 • FLS
As can be seen, no calculation in the SLS state has been made. This state won’t be governing for the support structure design because all load factors are all 1.0. In the spreadsheet, the parameters for the 2-mass-spring-dashpot system have been calculated (including the equivalent spring stiffness of the support structure). These values are used to determine the two first natural frequencies.
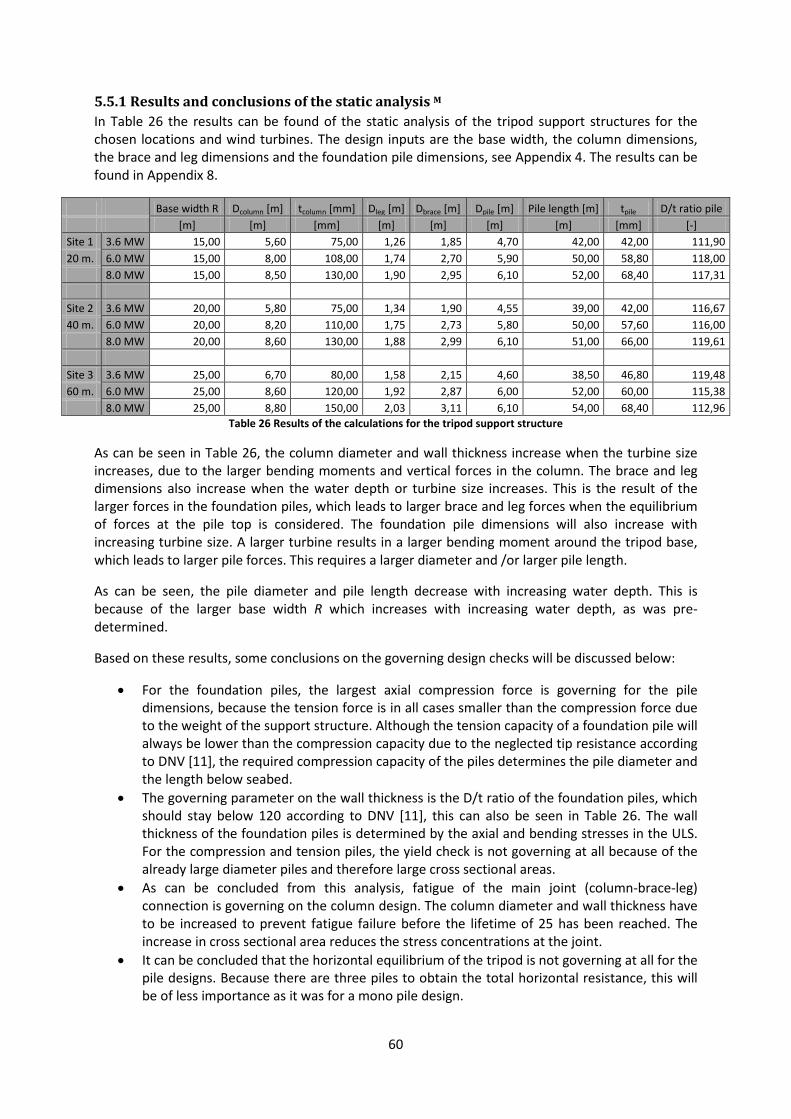
60
5.5.1 Results and conclusions of the static analysis M
In Table 26 the results can be found of the static analysis of the tripod support structures for the chosen locations and wind turbines. The design inputs are the base width, the column dimensions, the brace and leg dimensions and the foundation pile dimensions, see Appendix 4. The results can be found in Appendix 8.
Base width R Dcolumn [m] tcolumn [mm] Dleg [m] Dbrace [m] Dpile [m] Pile length [m] tpile D/t ratio pile [m] [m] [mm] [m] [m] [m] [m] [mm] [-] Site 1 3.6 MW 15,00 5,60 75,00 1,26 1,85 4,70 42,00 42,00 111,90 20 m. 6.0 MW 15,00 8,00 108,00 1,74 2,70 5,90 50,00 58,80 118,00 8.0 MW 15,00 8,50 130,00 1,90 2,95 6,10 52,00 68,40 117,31 Site 2 3.6 MW 20,00 5,80 75,00 1,34 1,90 4,55 39,00 42,00 116,67 40 m. 6.0 MW 20,00 8,20 110,00 1,75 2,73 5,80 50,00 57,60 116,00 8.0 MW 20,00 8,60 130,00 1,88 2,99 6,10 51,00 66,00 119,61 Site 3 3.6 MW 25,00 6,70 80,00 1,58 2,15 4,60 38,50 46,80 119,48 60 m. 6.0 MW 25,00 8,60 120,00 1,92 2,87 6,00 52,00 60,00 115,38 8.0 MW 25,00 8,80 150,00 2,03 3,11 6,10 54,00 68,40 112,96
Table 26 Results of the calculations for the tripod support structure
As can be seen in Table 26, the column diameter and wall thickness increase when the turbine size increases, due to the larger bending moments and vertical forces in the column. The brace and leg dimensions also increase when the water depth or turbine size increases. This is the result of the larger forces in the foundation piles, which leads to larger brace and leg forces when the equilibrium of forces at the pile top is considered. The foundation pile dimensions will also increase with increasing turbine size. A larger turbine results in a larger bending moment around the tripod base, which leads to larger pile forces. This requires a larger diameter and /or larger pile length.
As can be seen, the pile diameter and pile length decrease with increasing water depth. This is because of the larger base width R which increases with increasing water depth, as was pre-determined.
Based on these results, some conclusions on the governing design checks will be discussed below:
• For the foundation piles, the largest axial compression force is governing for the pile dimensions, because the tension force is in all cases smaller than the compression force due to the weight of the support structure. Although the tension capacity of a foundation pile will always be lower than the compression capacity due to the neglected tip resistance according to DNV [11], the required compression capacity of the piles determines the pile diameter and the length below seabed.
• The governing parameter on the wall thickness is the D/t ratio of the foundation piles, which should stay below 120 according to DNV [11], this can also be seen in Table 26. The wall thickness of the foundation piles is determined by the axial and bending stresses in the ULS. For the compression and tension piles, the yield check is not governing at all because of the already large diameter piles and therefore large cross sectional areas.
• As can be concluded from this analysis, fatigue of the main joint (column-brace-leg) connection is governing on the column design. The column diameter and wall thickness have to be increased to prevent fatigue failure before the lifetime of 25 has been reached. The increase in cross sectional area reduces the stress concentrations at the joint.
• It can be concluded that the horizontal equilibrium of the tripod is not governing at all for the pile designs. Because there are three piles to obtain the total horizontal resistance, this will be of less importance as it was for a mono pile design.

61
• The compression capacity of a foundation pile can be increased by increasing the pile diameter or increasing the pile length. In both cases the shaft area will increase, which increases the shaft friction and therefore the vertical resistance. Due to a larger pile diameter or longer pile, the weight of the pile will also increase. This will be voided by the increase in shaft resistance.
• For tension piles, a larger diameter or longer pile will increase the tension capacity. Furthermore, the tension load is reduced due to the higher pile mass, which lowers the tension design force.
• The base width R influences the forces in the foundation piles as well as the forces in the braces and legs. When the base width R is increased, the compression and tension forces in the foundation piles decrease, due to the larger distance from the pile to the center of gravity of the tripod base. This results in lower brace and leg forces.
• Furthermore, the column forces are reduced in case of a larger base width. A larger base width will result in a higher located connection of the braces and legs on the column (when the brace and leg angle is kept constant). This results in a shorter column and therefore lower mass, which lower the compression force at the main joint.
• There are several ways to design the pile foundations, namely a large pile diameter and a short pile, or a small diameter and a long pile. Both piles may satisfy in the vertical equilibrium of the foundation, which is mainly determined by the shaft friction along the pile. In this study, the most economical design is obtained by minimalizing the required amount of steel mass for the foundation piles.
• The deformations in the SLS are not governing for the design at all. The deformations have been calculated in Scia Engineer as described in section 5.3.3 where it was concluded that the braces and legs could not be schematized as a rigid support for the column, and therefore could not be calculated easily by hand. The results with Scia are shown below, and it can be concluded that all deformations stay well below the limit of a lateral deflection of 0.03 times the pile diameter at seabed as set by DNV. The deformations have only been calculated for the 8.0 MW turbines at site 1,2 and 3. For this turbine the wind loads will be largest and therefore the deformations extreme. The connection numbers can be found in the figure below and the results in the table: K1, K2 and K3 are the connections at the pile sleeve, K4 and K5 at the main- and bottom joint respectively and K12 at MSL level.
Figure 43 Connection numbers in Scia Engineer
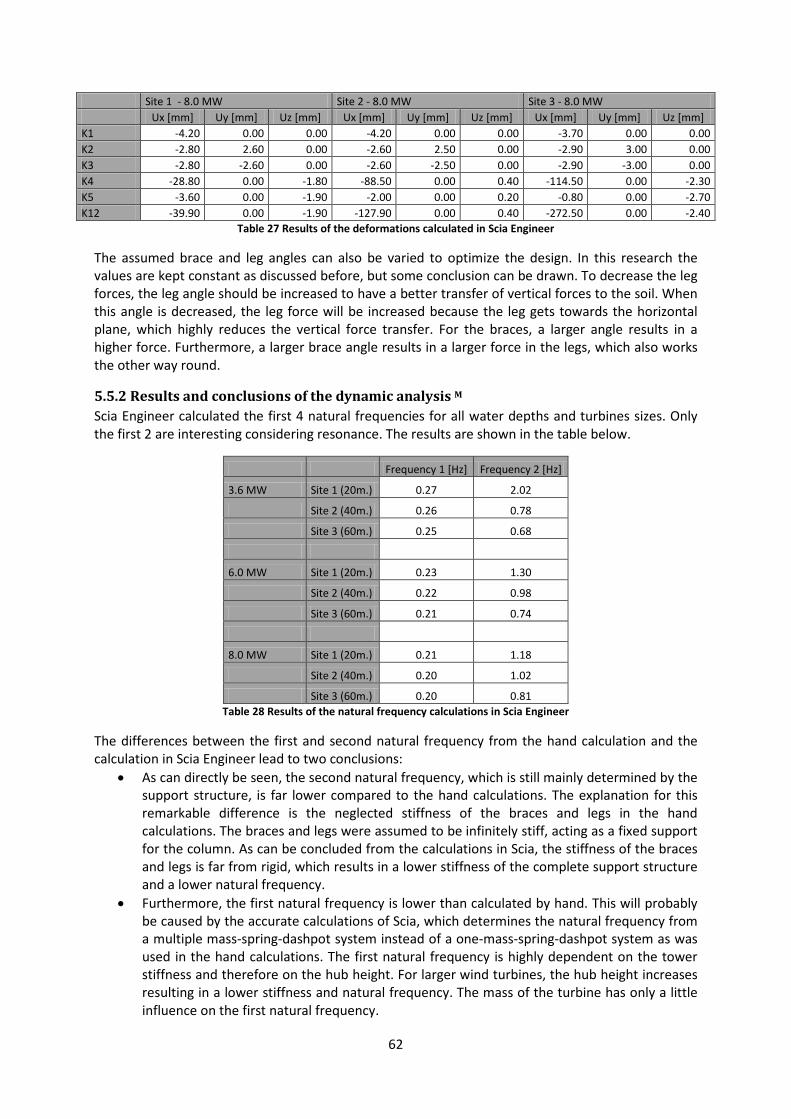
62
Site 1 - 8.0 MW Site 2 - 8.0 MW Site 3 - 8.0 MW Ux [mm] Uy [mm] Uz [mm] Ux [mm] Uy [mm] Uz [mm] Ux [mm] Uy [mm] Uz [mm] K1 -4.20 0.00 0.00 -4.20 0.00 0.00 -3.70 0.00 0.00 K2 -2.80 2.60 0.00 -2.60 2.50 0.00 -2.90 3.00 0.00 K3 -2.80 -2.60 0.00 -2.60 -2.50 0.00 -2.90 -3.00 0.00 K4 -28.80 0.00 -1.80 -88.50 0.00 0.40 -114.50 0.00 -2.30 K5 -3.60 0.00 -1.90 -2.00 0.00 0.20 -0.80 0.00 -2.70 K12 -39.90 0.00 -1.90 -127.90 0.00 0.40 -272.50 0.00 -2.40
Table 27 Results of the deformations calculated in Scia Engineer
The assumed brace and leg angles can also be varied to optimize the design. In this research the values are kept constant as discussed before, but some conclusion can be drawn. To decrease the leg forces, the leg angle should be increased to have a better transfer of vertical forces to the soil. When this angle is decreased, the leg force will be increased because the leg gets towards the horizontal plane, which highly reduces the vertical force transfer. For the braces, a larger angle results in a higher force. Furthermore, a larger brace angle results in a larger force in the legs, which also works the other way round.
5.5.2 Results and conclusions of the dynamic analysis M
Scia Engineer calculated the first 4 natural frequencies for all water depths and turbines sizes. Only the first 2 are interesting considering resonance. The results are shown in the table below.
Frequency 1 [Hz] Frequency 2 [Hz]
3.6 MW Site 1 (20m.) 0.27 2.02
Site 2 (40m.) 0.26 0.78
Site 3 (60m.) 0.25 0.68
6.0 MW Site 1 (20m.) 0.23 1.30
Site 2 (40m.) 0.22 0.98
Site 3 (60m.) 0.21 0.74
8.0 MW Site 1 (20m.) 0.21 1.18
Site 2 (40m.) 0.20 1.02
Site 3 (60m.) 0.20 0.81 Table 28 Results of the natural frequency calculations in Scia Engineer
The differences between the first and second natural frequency from the hand calculation and the calculation in Scia Engineer lead to two conclusions:
• As can directly be seen, the second natural frequency, which is still mainly determined by the support structure, is far lower compared to the hand calculations. The explanation for this remarkable difference is the neglected stiffness of the braces and legs in the hand calculations. The braces and legs were assumed to be infinitely stiff, acting as a fixed support for the column. As can be concluded from the calculations in Scia, the stiffness of the braces and legs is far from rigid, which results in a lower stiffness of the complete support structure and a lower natural frequency.
• Furthermore, the first natural frequency is lower than calculated by hand. This will probably be caused by the accurate calculations of Scia, which determines the natural frequency from a multiple mass-spring-dashpot system instead of a one-mass-spring-dashpot system as was used in the hand calculations. The first natural frequency is highly dependent on the tower stiffness and therefore on the hub height. For larger wind turbines, the hub height increases resulting in a lower stiffness and natural frequency. The mass of the turbine has only a little influence on the first natural frequency.
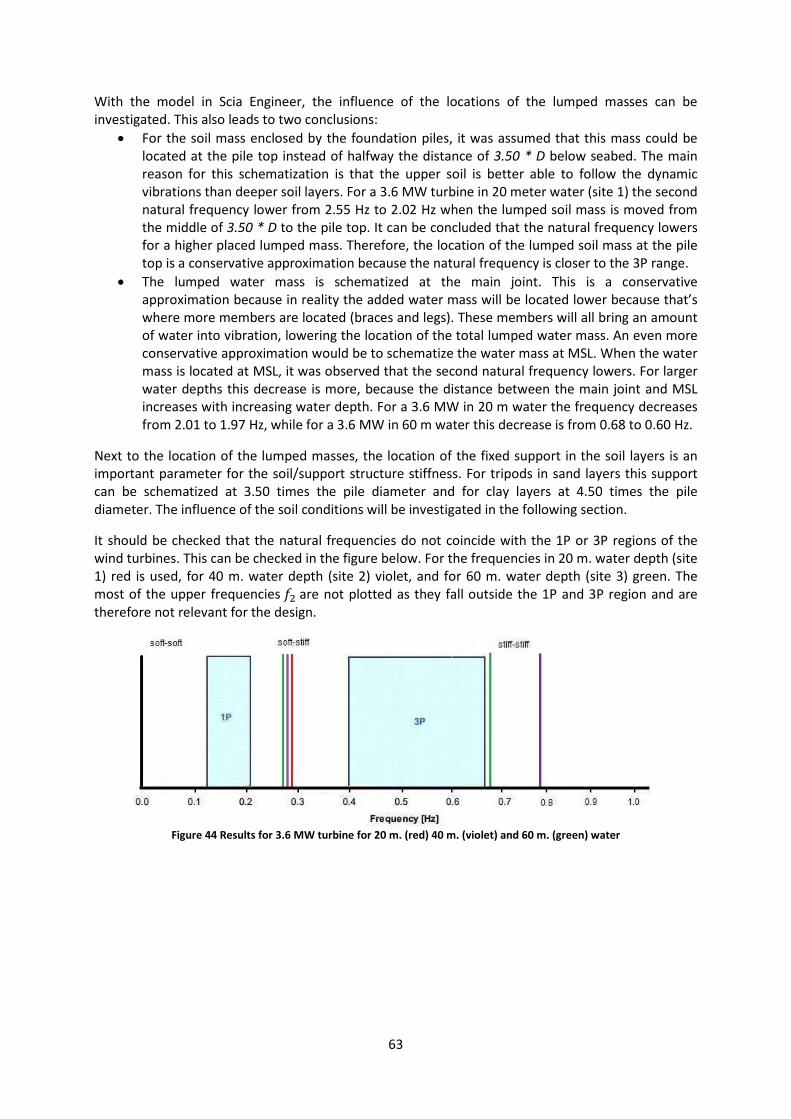
63
With the model in Scia Engineer, the influence of the locations of the lumped masses can be investigated. This also leads to two conclusions:
• For the soil mass enclosed by the foundation piles, it was assumed that this mass could be located at the pile top instead of halfway the distance of 3.50 * D below seabed. The main reason for this schematization is that the upper soil is better able to follow the dynamic vibrations than deeper soil layers. For a 3.6 MW turbine in 20 meter water (site 1) the second natural frequency lower from 2.55 Hz to 2.02 Hz when the lumped soil mass is moved from the middle of 3.50 * D to the pile top. It can be concluded that the natural frequency lowers for a higher placed lumped mass. Therefore, the location of the lumped soil mass at the pile top is a conservative approximation because the natural frequency is closer to the 3P range.
• The lumped water mass is schematized at the main joint. This is a conservative approximation because in reality the added water mass will be located lower because that’s where more members are located (braces and legs). These members will all bring an amount of water into vibration, lowering the location of the total lumped water mass. An even more conservative approximation would be to schematize the water mass at MSL. When the water mass is located at MSL, it was observed that the second natural frequency lowers. For larger water depths this decrease is more, because the distance between the main joint and MSL increases with increasing water depth. For a 3.6 MW in 20 m water the frequency decreases from 2.01 to 1.97 Hz, while for a 3.6 MW in 60 m water this decrease is from 0.68 to 0.60 Hz.
Next to the location of the lumped masses, the location of the fixed support in the soil layers is an important parameter for the soil/support structure stiffness. For tripods in sand layers this support can be schematized at 3.50 times the pile diameter and for clay layers at 4.50 times the pile diameter. The influence of the soil conditions will be investigated in the following section.
It should be checked that the natural frequencies do not coincide with the 1P or 3P regions of the wind turbines. This can be checked in the figure below. For the frequencies in 20 m. water depth (site 1) red is used, for 40 m. water depth (site 2) violet, and for 60 m. water depth (site 3) green. The most of the upper frequencies 𝑓2 are not plotted as they fall outside the 1P and 3P region and are therefore not relevant for the design.
Figure 44 Results for 3.6 MW turbine for 20 m. (red) 40 m. (violet) and 60 m. (green) water
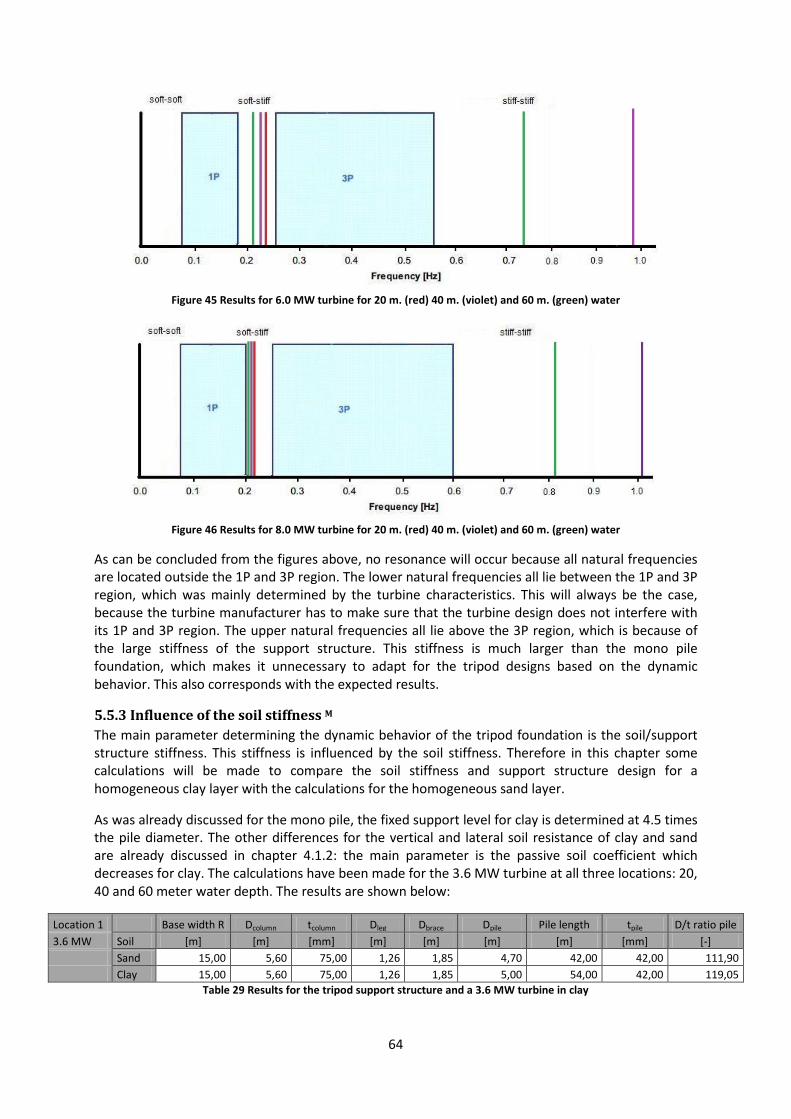
64
Figure 45 Results for 6.0 MW turbine for 20 m. (red) 40 m. (violet) and 60 m. (green) water
Figure 46 Results for 8.0 MW turbine for 20 m. (red) 40 m. (violet) and 60 m. (green) water
As can be concluded from the figures above, no resonance will occur because all natural frequencies are located outside the 1P and 3P region. The lower natural frequencies all lie between the 1P and 3P region, which was mainly determined by the turbine characteristics. This will always be the case, because the turbine manufacturer has to make sure that the turbine design does not interfere with its 1P and 3P region. The upper natural frequencies all lie above the 3P region, which is because of the large stiffness of the support structure. This stiffness is much larger than the mono pile foundation, which makes it unnecessary to adapt for the tripod designs based on the dynamic behavior. This also corresponds with the expected results.
5.5.3 Influence of the soil stiffness M
The main parameter determining the dynamic behavior of the tripod foundation is the soil/support structure stiffness. This stiffness is influenced by the soil stiffness. Therefore in this chapter some calculations will be made to compare the soil stiffness and support structure design for a homogeneous clay layer with the calculations for the homogeneous sand layer.
As was already discussed for the mono pile, the fixed support level for clay is determined at 4.5 times the pile diameter. The other differences for the vertical and lateral soil resistance of clay and sand are already discussed in chapter 4.1.2: the main parameter is the passive soil coefficient which decreases for clay. The calculations have been made for the 3.6 MW turbine at all three locations: 20, 40 and 60 meter water depth. The results are shown below:
Location 1 Base width R Dcolumn tcolumn Dleg Dbrace Dpile Pile length tpile D/t ratio pile 3.6 MW Soil [m] [m] [mm] [m] [m] [m] [m] [mm] [-] Sand 15,00 5,60 75,00 1,26 1,85 4,70 42,00 42,00 111,90 Clay 15,00 5,60 75,00 1,26 1,85 5,00 54,00 42,00 119,05
Table 29 Results for the tripod support structure and a 3.6 MW turbine in clay

65
Location 2 Base width R Dcolumn tcolumn Dleg Dbrace Dpile Pile length tpile D/t ratio pile 3.6 MW Soil [m] [m] [mm] [m] [m] [m] [m] [mm] [-] Sand 20,00 5,80 75,00 1,34 1,90 4,55 42,00 39,00 108,33 Clay 20,00 5,80 75,00 1,36 1,90 5,00 52,32 39,00 119,05
Table 30 Results for the tripod support structure and a 3.6 MW turbine in clay
Location 3 Base width R Dcolumn tcolumn Dleg Dbrace Dpile Pile length tpile D/t ratio pile 3.6 MW Soil [m] [m] [mm] [m] [m] [m] [m] [mm] [-] Sand 25,00 6,70 80,00 1,58 2,15 4,60 38,50 38,50 119,48 Clay 25,00 6,70 80,00 1,58 2,15 4,80 46,80 41,00 117,07
Table 31 Results for the tripod support structure and a 3.6 MW turbine in clay
As can be concluded from the results, the presence of clay results in longer foundation piles and larger pile diameters. For the mono pile it as observed that the presence of clay layers results in longer piles but a reduced pile diameter. For the mono pile, the longer piles due to the weak passive soil resistance of clay already provided the vertical equilibrium, which made a reduction of the pile diameter possible. For the tripod support, not the horizontal equilibrium is governing for the design of the tripod support but the vertical equilibrium is governing. Due to the lower vertical resistance of the pile in clay, both the pile length and the pile diameter should be increased.
Furthermore, it can be seen that the other members of the tripod such as braces, legs and the column still have the same dimensions and are not influenced by the clay layer. Below, the dynamic analysis is again performed in Scia Engineer for a 3.6 MW turbine.
Location 1 Location 2 Location 3
Soil Frequency 1 [Hz] Frequency 2 [Hz] Frequency 1 [Hz] Frequency 2 [Hz] Frequency 1 [Hz] Frequency 2 [Hz]
Sand 0.27 2.02 0.26 0.78 0.25 0.68
Clay 0.27 1.78 0.26 0.61 0.25 0.58 Table 32 Results of the dynamic calculations with Scia for a 3.6 MW turbine in clay
The total mass of the support structure is increased due to the longer piles and larger pile diameters. In case of the mono pile foundation, this increase was voided by a decrease in pile diameter. For the tripod support, an increase of the pile diameter is necessary to obtain vertical equilibrium as explained above. The stiffness of the support structure decreases compared to sand, because of the lower level of the fixed support. The increase of the pile diameter and pile length will also result in a higher stiffness, but this is (partly) voided by the lower level of the fixed support. Due to this decrease in stiffness and the increase in mass, the natural frequency decreases. The second natural frequency gets into the 3P range for site 2 and site 3. Therefore resonance becomes a problem in case of a tripod foundation in clay for the 3.6 MW in 40 and 60 m. water depth. To increase the frequency again to prevent resonance, the tripod should be designed stiffer. The braces, legs and column diameters can be enlarged to increase the stiffness of the support, but eventually this will lead to longer foundation piles and larger pile diameters which again decreases the stiffness of the foundation. It should be further investigated which influence on the stiffness is larger and if the natural frequency can be increased.

66
5.5.4 Technical limitations of the tripod support structure M
To determine the technical limitations for the tripod support structure, both the static and dynamic results should be taken into account. From the static analysis, the dimensions of the column might limit the application range of the tripod support structure due to the large influence of fatigue loads on the main joint. The column diameter and wall thickness at the main joint result in the largest cross sections of the tripod and will therefore be governing. The diameter and wall thicknesses of the braces, legs and foundation piles are all lower than the column dimensions.
For the mono pile, the following boundaries were set:
• Pile diameter should stay below 9 meters • Wall thickness should stay below 150 mm
When these boundaries are taken into account, it can be concluded that the tripod dimensions are all feasible from a technical point of view. Therefore, the tripods can be applied at all three sites of 20, 40 and 60 meter water depths in combination with all three wind turbines of 3.6, 6.0 and 8.0 MW.
The dynamic behavior does not pose any problems for the tripods in sandy (stiff) soils. For soft clay layers on the other hand, the natural frequency decreases into the 3P range of the 3.6 MW wind turbine for water depths of 40 and 60 meters. Therefore the tripod design should be optimized by increasing the stiffness to prevent resonance, which was not part of this study. It can be concluded that the tripod design is highly depended on the soil conditions, especially for larger water depths where the stiffness of the tripod support structure is already relatively low.
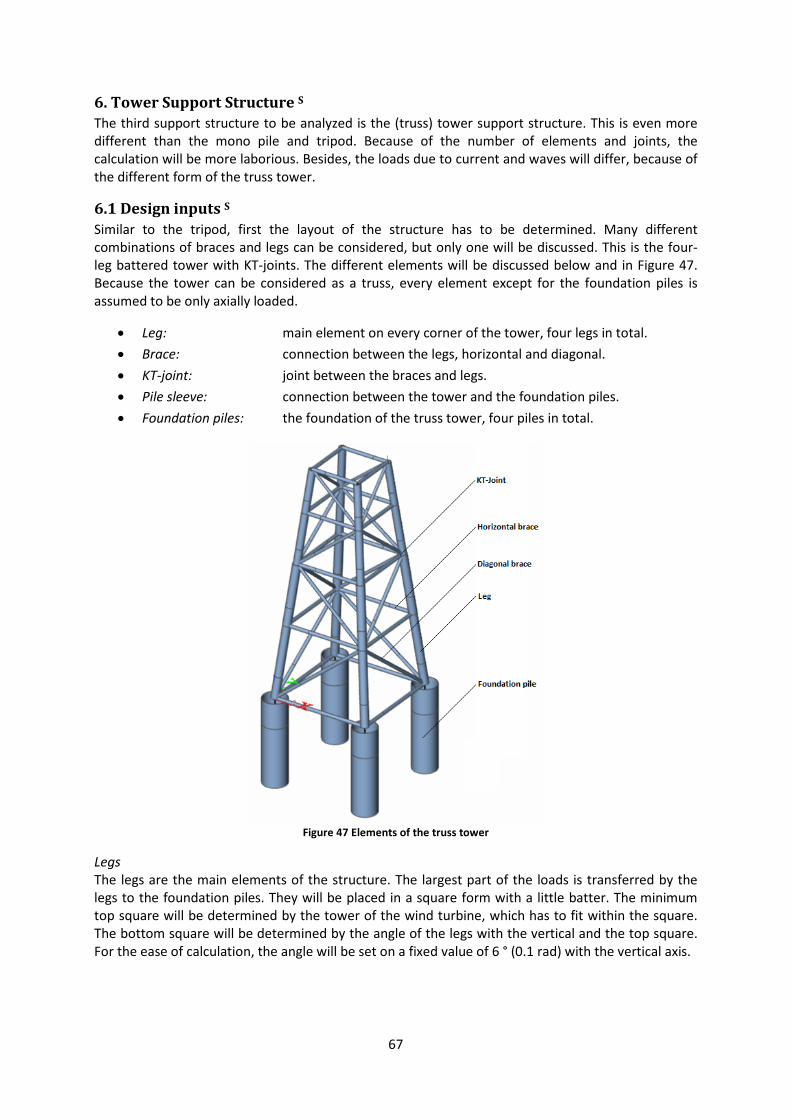
67
6. Tower Support Structure S
The third support structure to be analyzed is the (truss) tower support structure. This is even more different than the mono pile and tripod. Because of the number of elements and joints, the calculation will be more laborious. Besides, the loads due to current and waves will differ, because of the different form of the truss tower.
6.1 Design inputs S
Similar to the tripod, first the layout of the structure has to be determined. Many different combinations of braces and legs can be considered, but only one will be discussed. This is the four-leg battered tower with KT-joints. The different elements will be discussed below and in Figure 47. Because the tower can be considered as a truss, every element except for the foundation piles is assumed to be only axially loaded.
• Leg: main element on every corner of the tower, four legs in total. • Brace: connection between the legs, horizontal and diagonal. • KT-joint: joint between the braces and legs. • Pile sleeve: connection between the tower and the foundation piles. • Foundation piles: the foundation of the truss tower, four piles in total.
Figure 47 Elements of the truss tower
Legs The legs are the main elements of the structure. The largest part of the loads is transferred by the legs to the foundation piles. They will be placed in a square form with a little batter. The minimum top square will be determined by the tower of the wind turbine, which has to fit within the square. The bottom square will be determined by the angle of the legs with the vertical and the top square. For the ease of calculation, the angle will be set on a fixed value of 6 ° (0.1 rad) with the vertical axis.

68
Braces The braces will form the connection between the legs. It is assumed that these are only axially loaded. Two different braces can be derived: horizontal and diagonal. The diagonal braces are placed between the horizontal braces to form triangles. The angle of the brace with the leg may not be lower than 30°, due to the manufacturability of the joints. The target angle will be 45°, but the number of braces has to fit exactly between the top and the bottom of the structure. The truss tower will be designed from the seabed to the platform level above the mean sea level. The height of the platform level is discussed before in section 3.1. With this parameter the height of the tower is already determined.
The number of panels has to be chosen in order to determine the angle of the braces. In side view, every panel is a trapezium and all of the trapezoids are geometrically the same (Figure 48). From the top down each panel is a multiplication factor m larger than the panel above it:
𝑚 = �𝑏𝑠𝑏𝑡�1𝑁 = �1 + 2 tan(𝛼)ℎ
𝑏𝑡�1𝑁 [-]
𝑚 = �𝑏𝑠𝑏𝑡�1𝑁 = �1 − 𝑏𝑠
2 tan(𝛼)ℎ�1𝑁 [-]
With: m = multiplication factor [-] N = amount of panels [-] bs = bottom width [m] bt = top width [m] α = leg angle with the vertical [degree]
Figure 48 Lay-out parameters of the truss tower [25]
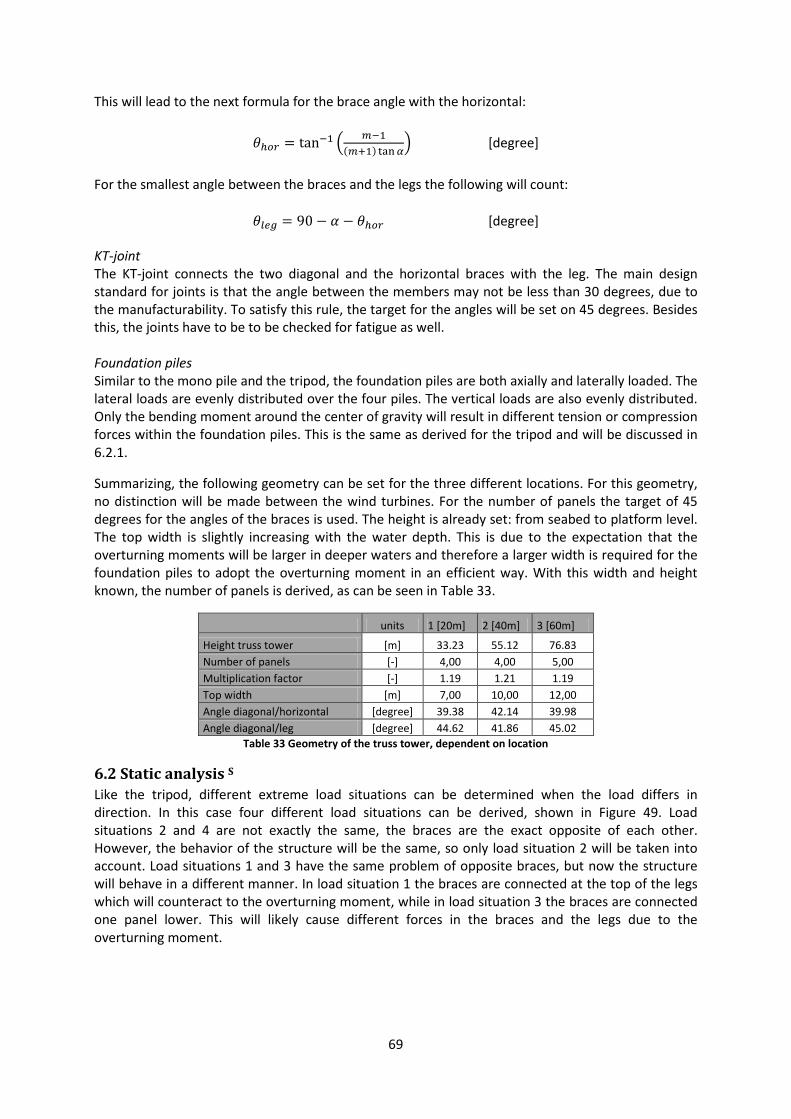
69
This will lead to the next formula for the brace angle with the horizontal:
𝜃ℎ𝑜𝑟 = tan−1 � 𝑚−1(𝑚+1) tan𝛼
� [degree]
For the smallest angle between the braces and the legs the following will count:
𝜃𝑙𝑒𝑔 = 90 − 𝛼 − 𝜃ℎ𝑜𝑟 [degree]
KT-joint The KT-joint connects the two diagonal and the horizontal braces with the leg. The main design standard for joints is that the angle between the members may not be less than 30 degrees, due to the manufacturability. To satisfy this rule, the target for the angles will be set on 45 degrees. Besides this, the joints have to be to be checked for fatigue as well. Foundation piles Similar to the mono pile and the tripod, the foundation piles are both axially and laterally loaded. The lateral loads are evenly distributed over the four piles. The vertical loads are also evenly distributed. Only the bending moment around the center of gravity will result in different tension or compression forces within the foundation piles. This is the same as derived for the tripod and will be discussed in 6.2.1.
Summarizing, the following geometry can be set for the three different locations. For this geometry, no distinction will be made between the wind turbines. For the number of panels the target of 45 degrees for the angles of the braces is used. The height is already set: from seabed to platform level. The top width is slightly increasing with the water depth. This is due to the expectation that the overturning moments will be larger in deeper waters and therefore a larger width is required for the foundation piles to adopt the overturning moment in an efficient way. With this width and height known, the number of panels is derived, as can be seen in Table 33.
units 1 [20m] 2 [40m] 3 [60m]
Height truss tower [m] 33.23 55.12 76.83 Number of panels [-] 4,00 4,00 5,00 Multiplication factor [-] 1.19 1.21 1.19 Top width [m] 7,00 10,00 12,00 Angle diagonal/horizontal [degree] 39.38 42.14 39.98 Angle diagonal/leg [degree] 44.62 41.86 45.02
Table 33 Geometry of the truss tower, dependent on location
6.2 Static analysis S
Like the tripod, different extreme load situations can be determined when the load differs in direction. In this case four different load situations can be derived, shown in Figure 49. Load situations 2 and 4 are not exactly the same, the braces are the exact opposite of each other. However, the behavior of the structure will be the same, so only load situation 2 will be taken into account. Load situations 1 and 3 have the same problem of opposite braces, but now the structure will behave in a different manner. In load situation 1 the braces are connected at the top of the legs which will counteract to the overturning moment, while in load situation 3 the braces are connected one panel lower. This will likely cause different forces in the braces and the legs due to the overturning moment.
70
Figure 49 Load situations
The vertical load on a pile is determined by the total downward forces due to the mass of the complete structure (∑𝐹𝑣𝑒𝑟𝑡𝑖𝑐𝑎𝑙 ) divided over four piles, as well as by the tension or compression forces due to the overturning moment. The total moment is generated by the pile forces times the distance to the center of gravity of the tower base in the horizontal plane. Load situation 1 will cause the same pile forces as load situation 3. The piles in the middle of the base, (2 and 4 for load situation 1, see Figure 49) do not contribute to the overturning moment. The following formulas can be derived for the axial force in the piles due to the bending moment and gravity forces, depending on the load situation:
Load situation 1:
𝐹𝑣, 𝑝𝑖𝑙𝑒 1 = 1√2
𝑀𝑜𝑣𝑒𝑟𝑡𝑢𝑟𝑛𝑖𝑛𝑔
bs− ∑𝐹𝑣𝑒𝑟𝑡𝑖𝑐𝑎𝑙
4 (tension, N)
𝐹𝑣, 𝑝𝑖𝑙𝑒 3 = − 1√2
𝑀𝑜𝑣𝑒𝑟𝑡𝑢𝑟𝑛𝑖𝑛𝑔
bs− ∑𝐹𝑣𝑒𝑟𝑡𝑖𝑐𝑎𝑙
4 (compression, N)
𝐹𝑣, 𝑝𝑖𝑙𝑒 2,4 = ∑𝐹𝑣𝑒𝑟𝑡𝑖𝑐𝑎𝑙4
(compression, N)
Load situation 2:
𝐹𝑣, 𝑝𝑖𝑙𝑒 1,2 = 12𝑀𝑜𝑣𝑒𝑟𝑡𝑢𝑟𝑛𝑖𝑛𝑔
bs − ∑𝐹𝑣𝑒𝑟𝑡𝑖𝑐𝑎𝑙
4 (tension, N)
𝐹𝑣, 𝑝𝑖𝑙𝑒 3,4 = −12𝑀𝑜𝑣𝑒𝑟𝑡𝑢𝑟𝑛𝑖𝑛𝑔
bs − ∑𝐹𝑣𝑒𝑟𝑡𝑖𝑐𝑎𝑙
4 (compression, N)
It could be expected by the factor 1/√2 that load situation 1 is normative for the axial pile forces. This is however not sure, because the environmental loads may be different in another load situation. This will be discussed in the next section.
6.2.1 Extreme wave and current loads S
The horizontal loads consist of wave, wind and current loads. The horizontal force 𝐹𝐻,𝑝𝑖𝑙𝑒 on each foundation pile is equal to a quarter of the sum of the horizontal forces.
𝐹𝐻,𝑝𝑖𝑙𝑒 = 14
(𝐹𝑤𝑎𝑣𝑒 + 𝐹𝑤𝑖𝑛𝑑 + 𝐹𝑐𝑢𝑟𝑟𝑒𝑛𝑡) [N]

71
The wind loads will be the same as for the mono pile and tripod. The wave and current loads will differ due to the different shape of the structure. The truss tower consists of more elements and more slender elements, which causes that the normal formulas for slender structures are not valid anymore for the whole tower. However, according to [21] these formulas can still be applied when the truss tower is translated to a mono pile as can be seen in Figure 50.
Figure 50 Truss tower translated to a mono pile with an equivalent diameter [21]
Two different equivalent diameters can be found for the mono pile, one equivalent diameter for the inertia and one for the drag force (Table 34). The formula for the wave force will then be:
𝐹𝑚𝑎𝑥 = 𝐹𝐼 + 𝐹𝐷 = 𝐶𝐼𝐾𝐼𝐻𝜌𝑔𝜋𝐷𝑒𝑞;𝑖𝑛𝑒𝑟𝑡𝑖𝑎;𝑡𝑜𝑡
2
4+ 𝐶𝐷𝐾𝐷𝐻2 1
2𝜌𝑔𝐷𝑒𝑞;𝑑𝑟𝑎𝑔;𝑡𝑜𝑡 [N]
With: 𝐷𝑒𝑞;𝑑𝑟𝑎𝑔;𝑡𝑜𝑡 = ∑ 𝐷𝑒𝑞;𝑑𝑟𝑎𝑔;𝑖
𝑛𝑖=1 [m]
𝐷𝑒𝑞;𝑖𝑛𝑒𝑟𝑡𝑖𝑎;𝑡𝑜𝑡2 = ∑ 𝐷𝑒𝑞;𝑖𝑛𝑒𝑟𝑡𝑖𝑎;𝑖
2𝑛𝑖=1 [m]
Orientation Parallel to wave direction Perpendicular to wave direction drag inertia drag Inertia Vertical 𝐷𝑒𝑞 = 𝐷 𝐷𝑒𝑞 = 𝐷 𝐷𝑒𝑞 = 𝐷 𝐷𝑒𝑞 = 𝐷 Horizontal 0 0 𝐷𝑒𝑞 = 𝐿 𝐷𝑒𝑞 = √𝐷𝐿 diagonal 𝐷𝑒𝑞 = 𝐷 𝐷𝑒𝑞 = 𝐷 𝐷𝑒𝑞 = 𝐷/ sin𝜃 𝐷𝑒𝑞 = 𝐷/√sin𝜃
Table 34 Equivalent diameters elements
θ = the angle of the element with the horizontal [degree] L = the length of the element [meter]
The area facing the flow is increasing with the water depth due to the battered legs. Therefore the average equivalent diameter over the water depth is used for the current load:
𝐹𝐷 = 12𝜌𝑤𝑢2(𝐶𝐷 + 𝐶′𝐷)𝑑𝐷𝑒𝑞;𝑑𝑟𝑎𝑔;𝑡𝑜𝑡;𝑎𝑣𝑔 [N]
As said before in the last section, one would expect that the equivalent diameter will differ with other load directions. For load situation 1 the equivalent diameter is calculated by using the average between the perpendicular and parallel members. It appears that this equivalent diameter will be exactly the same as for load situation 2. So there will be no difference between the environmental loads in load situation 1 and 2.

72
6.2.2 Governing load direction S
The load directions 1 and 3 (LD 1 and LD 3) are considered for a 3.6 and 8.0 MW turbine at location 1. The results of the design parameters for both load situations are given in the table below.
Site 1 (20 m.) 3.6 MW - LD 1 3.6 MW - LD 3 8.0 MW - LD 1 8.0 MW - LD 3
D [mm] t [mm] D [mm] t [mm] D [mm] t [mm] D [mm] t [mm] Leg1 1130,00 41,00 1200,00 41,00 2150,00 50,00 2020,00 51,00 Leg2 1170,00 38,00 1170,00 35,00 2030,00 53,00 1830,00 63,00 Leg3 1020,00 36,00 1010,00 41,00 1940,00 63,00 1640,00 71,00
Leg4 1170,00 30,00 1220,00 34,00 1670,00 74,00 1720,00 82,00
Brace1 460,00 15,00 460,00 15,00 470,00 15,00 470,00 15,00 Brace2 440,00 15,00 440,00 15,00 450,00 15,00 460,00 25,00 Brace3 430,00 15,00 430,00 15,00 420,00 15,00 410,00 30,00 Brace4 360,00 15,00 380,00 15,00 500,00 15,00 520,00 42,00 Horizontal 460,00 15,00 480,00 9,00 490,00 15,00 590,00 15,00 Total weight 177 ton 180 ton 606 ton 612 ton
Table 35 Results of the calculations for 3.6 and 8.0 MW turbine for load direction (LD) 1 and 3
As can be concluded from Table 35, load direction 1 and 3 does not lead to a significant difference in the dimensions of the members. The horizontal member at the top will become governing for all panels in situation 3, because in this case the horizontal force at the top cannot be absorbed by braces. Furthermore, the diameter of leg 4 and brace 4 needs to be increased due to the larger forces in the upper joint of the tower. From now on, only load direction 3 will be taken into account for the design of the tower structures because this is governing for the design of the braces, legs and horizontal members in the upper elevation. In the figures below, the load distribution for load direction 1 and 3 can be seen.
Figure 51 Load distribution for load direction 1 (left) and 3 (right)
6.2.3 Internal forces S
Scia Engineer is used to derive the cross-sections of the members with its auto-design function. The inputs in the program are the environmental loads, the geometry of the truss tower and an estimation of the element dimensions. The program will check whether the element is sufficiently designed and will adjust the dimensions to the yield and buckling check.

73
Geometry The coordinates of the connection points have to be determined before the structure can be analyzed in Scia. This is done with help of the geometry as determined in section 6.1. Subsequently, the elements are put into the program. Every element is schematized with a hinge on both sides, where only the rotation around the axis of the element is fixed. After this is done, the complete structure as shown in Figure 47 is set. The foundation pile is schematized as completely fixed on a depth of 3.50 * Dpile (fixed rotation and translation), which was also assumed for the tripod and mono pile. Blum’s approximation is only valid for piles with a free rotation at the pile top, which is not the case for the foundation piles of the tower structure with the pile sleeves. The foundation piles will not be able to rotate in the pile sleeves, only translation along the seabed on the x- and y-axis is possible. Therefore, the foundation piles are modeled in Scia with a support at seabed level with a fixed rotation and a fixed translation in vertical direction. The dimensions of the foundation piles however are not determined with Scia, but by hand with the method of Blum. Only for the dynamics and the deformations the pile dimensions are used as input in Scia. Different dimensions are used for the different panels. Every element consists of a tubular pipe with a diameter D and wall thickness t. In one panel, the diagonal brace and leg can be derived. Because of the different load directions, all elements in one panel need to have the same (maximum) dimensions as determined in the ULS. For each panel the loads in the elements will be different, so therefore these dimensions for the legs and braces are derived for each panel apart. The forces in the horizontal brace are not likely to differ much in the different panels according to [25]. Besides this, these forces due to horizontal environmental loads are expected to be very small compared to the legs and the braces; therefore only one dimension in the whole structure will be used for this horizontal.
Figure 52 Numbered elements
Summarizing, the following elements are determined with help of Scia Engineer, with the numbers according to Figure 52:
• Braces 1 up to 4 or 5 (dependent on the number of panels) • Legs 1 up to 4 or 5 (dependent on the number of panels) • Horizontal brace
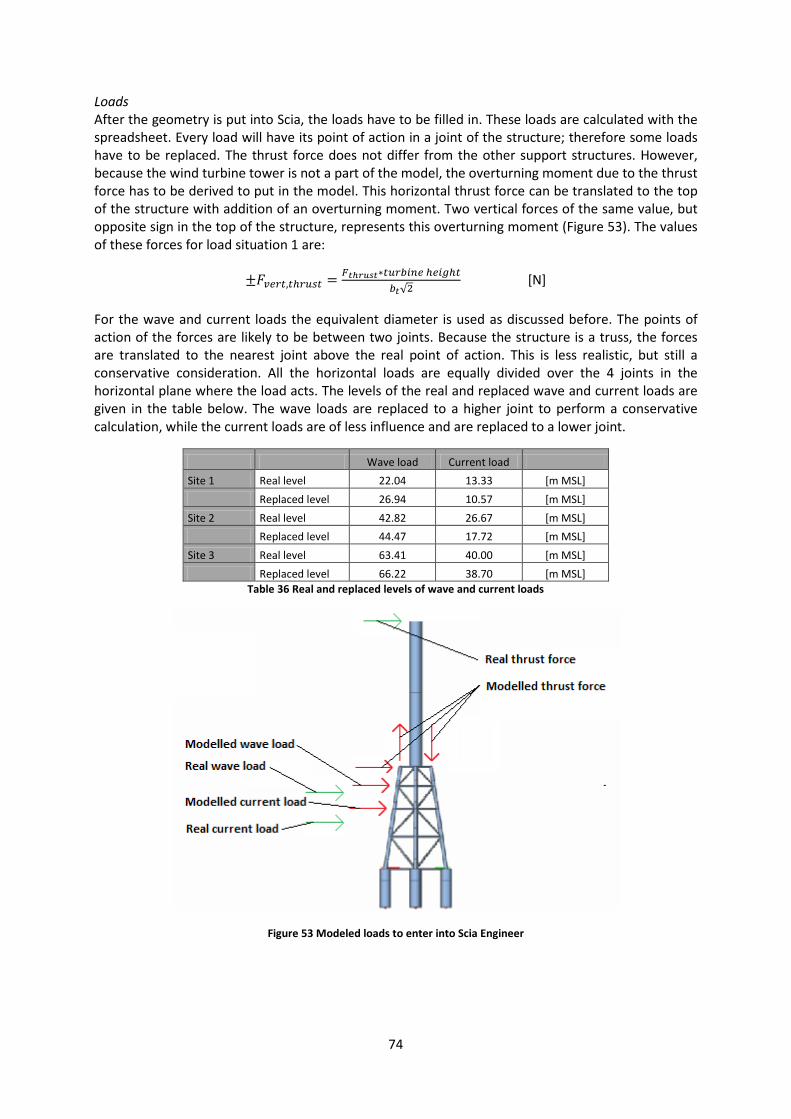
74
Loads After the geometry is put into Scia, the loads have to be filled in. These loads are calculated with the spreadsheet. Every load will have its point of action in a joint of the structure; therefore some loads have to be replaced. The thrust force does not differ from the other support structures. However, because the wind turbine tower is not a part of the model, the overturning moment due to the thrust force has to be derived to put in the model. This horizontal thrust force can be translated to the top of the structure with addition of an overturning moment. Two vertical forces of the same value, but opposite sign in the top of the structure, represents this overturning moment (Figure 53). The values of these forces for load situation 1 are:
±𝐹𝑣𝑒𝑟𝑡,𝑡ℎ𝑟𝑢𝑠𝑡 = 𝐹𝑡ℎ𝑟𝑢𝑠𝑡∗𝑡𝑢𝑟𝑏𝑖𝑛𝑒 ℎ𝑒𝑖𝑔ℎ𝑡𝑏𝑡√2
[N]
For the wave and current loads the equivalent diameter is used as discussed before. The points of action of the forces are likely to be between two joints. Because the structure is a truss, the forces are translated to the nearest joint above the real point of action. This is less realistic, but still a conservative consideration. All the horizontal loads are equally divided over the 4 joints in the horizontal plane where the load acts. The levels of the real and replaced wave and current loads are given in the table below. The wave loads are replaced to a higher joint to perform a conservative calculation, while the current loads are of less influence and are replaced to a lower joint.
Wave load Current load Site 1 Real level 22.04 13.33 [m MSL] Replaced level 26.94 10.57 [m MSL] Site 2 Real level 42.82 26.67 [m MSL] Replaced level 44.47 17.72 [m MSL] Site 3 Real level 63.41 40.00 [m MSL] Replaced level 66.22 38.70 [m MSL]
Table 36 Real and replaced levels of wave and current loads
Figure 53 Modeled loads to enter into Scia Engineer

75
The weight of the tower has to be taken into consideration as well. For the support structure itself, Scia can derive these loads within the program; only the weight of the complete turbine has to be put into the program, because this is not part of the model. This is modeled as four vertical forces in the upper 4 joints.
Iteration With the auto-design function in Scia Engineer the dimensions can be determined. Within this option the program will check all the members for buckling and yield. When this is done, the construction has to be calculated again for the new dimensions. Besides this, the wave and current forces are calculated with the spreadsheet, but based on the previous diameters of the truss tower. Therefore, the loads should be recalculated with the spreadsheet in Appendix 6 and entered again in the program. This iteration step is maximally two times performed.
Fatigue Scia does not check for fatigue loads implicitly. This is done by hand in the same way as the other support structures with the SN-curve. The stress variations due to wind and waves are given by Scia, which yields an equivalent stress range for each connection. Every joint will be checked on the equivalent number of cycles up to failure. When this does not satisfy the required amount of cycles for a lifetime of 25 years, the joints will be locally thickened so the required number of cycles is achieved. Only at the joint the wall thickness of an element will be higher.
6.2.4 Deformations M
The total horizontal force on each foundation pile should stay below the lateral bearing capacity of one pile. The bearing capacity is calculated using Blum’s method. As was also discussed in the tripod section, the rotation of the pile top is prevented by the pile sleeve. The pile will behave stiffer compared to a foundation pile which is free to rotate at its top. The fixed supports and the levels are put into Scia Engineer to calculate the deformations of the tower structure at seabed and at its top (platform level). The results are presented in Appendix 8. As can be concluded from the deformations at seabed, the towers all satisfy the boundary of a lateral deflection at seabed which should be less than 0.03 times the pile diameter according to DNV (chapter 2.2).
6.3 Dynamic analysis M
The dynamic analysis has been made in Scia Engineer as well. Scia creates lumped masses from the determined design of the tower structure and adds these masses to specific joints of the truss. Some other lumped masses have to be added:
• Soil mass enclosed in the foundation piles • Hydrodynamic added water mass • Turbine mass
The soil mass inside the pile is taken into account up to the fixed support level of 3.50 * Dpile for homogeneous sand and up to 4.50 * Dpile for homogeneous clay [20]. The water mass is assumed to be equal to the displaced water mass of the tower. The soil mass is added to the top of the foundation pile, see also section 5.5.2. The water mass is located at the joint which is closest to half of the water level (MSL). The hydrodynamic added water mass can be calculated with the following equation [2]:
𝑚𝑎𝑑𝑑𝑒𝑑 = (𝐶𝐼 − 1) 𝑝𝑤𝑎𝑡𝑒𝑟 𝑉𝑏𝑜𝑑𝑦 [kg]

76
The added water mass is equal to the displaced volume of water of a structural element times the density of water, multiplied with a mass coefficient which is equal to (𝐶𝐼 − 1) . The coefficient 𝐶𝐼 is equal to the inertia coefficient from the Morison equation. In this study the mass coefficient (𝐶𝐼 − 1) is set at 1.0, i.e. the added hydrodynamic mass is equal to the displaced volume of water by the structure. This mass is added at the nearest joint above the level of half the tower height to perform a conservative calculation.
6.4 Tower design M
The main design inputs have been calculated in Scia Engineer as discussed above:
• Diameter and wall thickness of the legs of all panels (4 or 5) • Diameter and wall thickness of the braces of all panels (4 or 5) • Diameter and wall thickness of the horizontal members (same for all panels) • Diameter and wall thickness of the foundation piles
The load calculations for the three selected wind turbines (3.6, 6.0 and 8.0 MW) and the three locations (20, 40 and 60m. water depth) have been made with the spreadsheet in Appendix 5 in the ULS. The design calculations have been made in Scia Engineer in the ULS. Furthermore, fatigue is taken into account in a separate limit state (FLS) in Scia. The results are shown in the next section.
6.4.1 Results and conclusions of the static analysis M
The towers have been designed in Scia Engineer. The results and conclusions can be found in the tables below.
Site 1 (20 m.) 3.6 MW Turbine 6.0 MW Turbine 8.0 MW Turbine Diameter D [mm] Wall th. t [mm] Diameter D [mm] Wall th. t [mm] Diameter D [mm] Wall th. t [mm]
Leg1 1130,00 41,00 1980,00 55,00 2150,00 50,00 Leg2 1170,00 38,00 1860,00 49,00 2030,00 53,00 Leg3 1020,00 36,00 1750,00 50,00 1940,00 63,00 Leg4 1170,00 30,00 1840,00 52,00 1670,00 74,00 Brace1 460,00 15,00 460,00 15,00 470,00 15,00 Brace2 440,00 15,00 440,00 15,00 450,00 15,00 Brace3 430,00 15,00 430,00 15,00 420,00 15,00 Brace4 360,00 15,00 360,00 15,00 500,00 15,00 Horizontal 460,00 9,00 510,00 9,00 490,00 9,00 Total weight 177 ton 335 ton 606 ton
Table 37 Results of the static analysis of the tower support for wind turbines in 20 m. water depth
Site 2 (40 m.) 3.6 MW Turbine 6.0 MW Turbine 8.0 MW Turbine
Diameter D [mm] Wall th. t [mm] Diameter D [mm] Wall th. t [mm] Diameter D [mm] Wall th. t [mm] Leg1 1120,00 30,00 1560,00 47,00 1750,00 52,00 Leg2 1160,00 27,00 1880,00 36,00 2120,00 40,00
Leg3 1020,00 28,00 1790,00 39,00 2230,00 39,00
Leg4 1370,00 19,00 1500,00 47,00 1510,00 60,00 Brace1 360,00 15,00 370,00 15,00 480,00 15,00 Brace2 360,00 15,00 360,00 15,00 460,00 15,00 Brace3 330,00 15,00 340,00 15,00 420,00 15,00 Brace4 340,00 15,00 490,00 15,00 540,00 15,00 Horizontal 440,00 15,00 500,00 15,00 510,00 15,00 Total weight 216 ton 468 ton 646 ton
Table 38 Results of the static analysis of the tower support for wind turbines in 40 m. water depth

77
Site 3 (60 m.) 3.6 MW Turbine 6.0 MW Turbine 8.0 MW Turbine
Diameter D [mm] Wall th. t [mm] Diameter D [mm] Wall th. t [mm] Diameter D [mm] Wall th. t [mm] Leg1 1300,00 46,00 1580,00 47,00 1830,00 40,00
Leg2 1310,00 38,00 1670,00 38,00 1800,00 39,00
Leg3 1310,00 36,00 1710,00 36,00 1830,00 37,00 Leg4 1300,00 29,00 1450,00 37,00 1780,00 37,00 Leg5 1270,00 29,00 1480,00 35,00 1790,00 36,00 Brace1 580,00 15,00 590,00 15,00 530,00 15,00 Brace2 550,00 15,00 560,00 15,00 500,00 15,00 Brace3 520,00 15,00 530,00 15,00 460,00 15,00 Brace4 490,00 15,00 500,00 15,00 450,00 15,00 Brace5 490,00 15,00 470,00 15,00 430,00 21,00 Horizontal 520,00 15,00 570,00 15,00 590,00 15,00 Total weight 461 ton 669 ton 713 ton
Table 39 Results of the static analysis of the tower support for wind turbines in 60 m. water depth
As can be seen, the leg dimensions increase for larger turbine sizes at the same location. The braces and horizontal member dimensions also increase for increasing turbine size at the same water depth. For the foundation piles the same holds, this is all in the range of expectations. The lengths of the foundation piles are:
Foundation piles
3.6 MW Turbine 6.0 MW Turbine 8.0 MW Turbine
D [mm] Wall th. t
[mm] Length
[m] D [mm] Wall th. t
[mm] Length
[m] D [mm] Wall th. t
[mm] Length
[m] Site 1 4000.00 37.00 48.60 5500.00 46.00 70.80 6000.00 50.00 78.40 Site 2 3400.00 30.00 43.20 4500.00 38.00 60.60 5000.00 42.00 68.40 Site 3 4500.00 38.00 42.60 5000.00 42.00 57.60 5500.00 47.00 61.20
Table 40 Dimensions of the foundation piles (pile length is given in meters below seabed)
A comparison between sites 1 and 2 leads to some conclusions concerning the dimensions. The brace diameter and wall thickness decrease when the water depth increases from 20 to 40 meters. This remarkable change is due to the increase in top width of the tower structures. This was set at 7 meters for site 1, and at 10 meters for site 2. This leads to lower axial forces in the leg at the top (leg 4) when the same wind turbine is considered. In that case the total bending moment at platform level is spread over two piles at a larger distance, reducing axial forces. These axial forces are distributed along the tower towards the seabed and largely determine the dimensions of the braces and horizontal members. The wave force will be larger at site 2 than at site 1, but this has a minor influence on the dimensions of the tower as can be seen from the decreasing brace dimensions for site 2 compared to site 1.
A comparison between sites 2 and 3 shows that only the braces and horizontal members increase in dimensions. The legs at the top (leg 5) are again further away from each other (top width of 12 meter at site 3), which reduces the axial forces in the legs due to the bending moment, for the same wind turbine. The braces and horizontal members need to be increased for all panels due to the increased weight of the structure for larger water depths. Furthermore, the wave loads are larger for site 3 compared to site 2. Some other conclusion on the governing design aspects are:
• The dimensions for the legs are determined from the governing ones: the legs which are at the upwind and downside. Due to the bending moment, these legs will experience axial tension and compression forces and are governing for the design. For these legs the buckling check will be governing on the diameter and wall thickness. The yielding check is not governing.
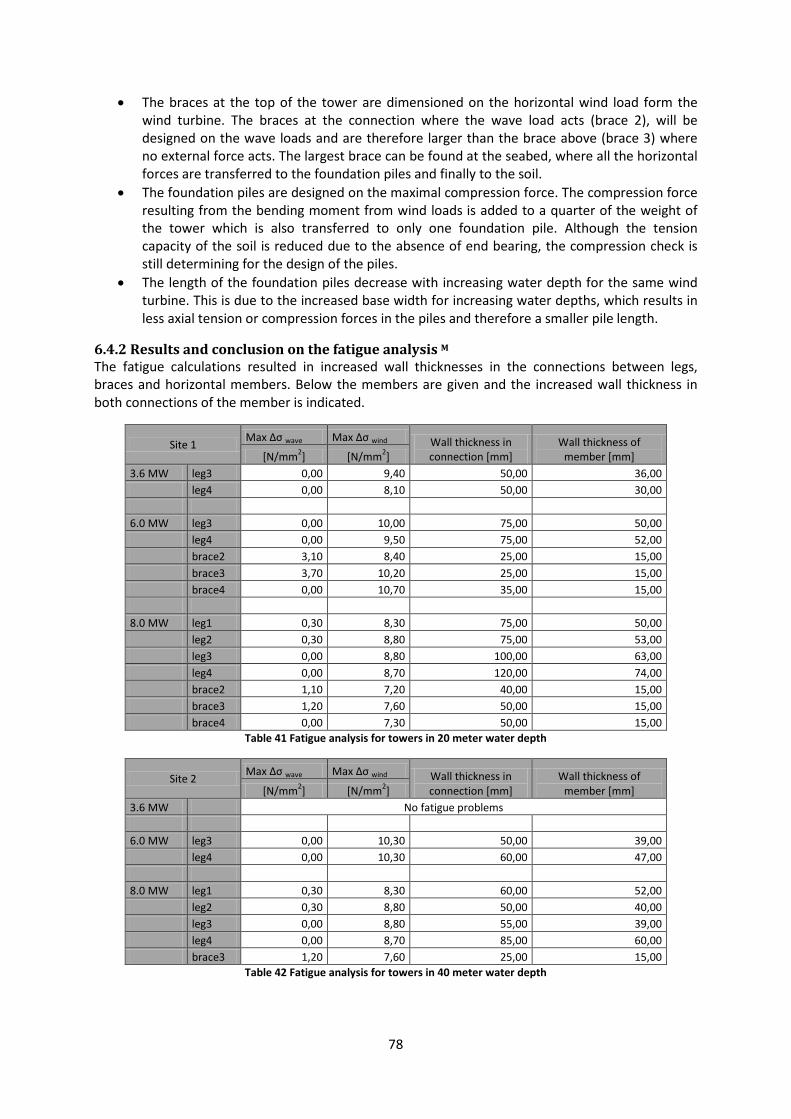
78
• The braces at the top of the tower are dimensioned on the horizontal wind load form the wind turbine. The braces at the connection where the wave load acts (brace 2), will be designed on the wave loads and are therefore larger than the brace above (brace 3) where no external force acts. The largest brace can be found at the seabed, where all the horizontal forces are transferred to the foundation piles and finally to the soil.
• The foundation piles are designed on the maximal compression force. The compression force resulting from the bending moment from wind loads is added to a quarter of the weight of the tower which is also transferred to only one foundation pile. Although the tension capacity of the soil is reduced due to the absence of end bearing, the compression check is still determining for the design of the piles.
• The length of the foundation piles decrease with increasing water depth for the same wind turbine. This is due to the increased base width for increasing water depths, which results in less axial tension or compression forces in the piles and therefore a smaller pile length.
6.4.2 Results and conclusion on the fatigue analysis M
The fatigue calculations resulted in increased wall thicknesses in the connections between legs, braces and horizontal members. Below the members are given and the increased wall thickness in both connections of the member is indicated.
Site 1 Max Δσ wave Max Δσ wind Wall thickness in connection [mm]
Wall thickness of member [mm] [N/mm2] [N/mm2]
3.6 MW leg3 0,00 9,40 50,00 36,00 leg4 0,00 8,10 50,00 30,00 6.0 MW leg3 0,00 10,00 75,00 50,00 leg4 0,00 9,50 75,00 52,00 brace2 3,10 8,40 25,00 15,00 brace3 3,70 10,20 25,00 15,00 brace4 0,00 10,70 35,00 15,00 8.0 MW leg1 0,30 8,30 75,00 50,00 leg2 0,30 8,80 75,00 53,00 leg3 0,00 8,80 100,00 63,00 leg4 0,00 8,70 120,00 74,00 brace2 1,10 7,20 40,00 15,00 brace3 1,20 7,60 50,00 15,00 brace4 0,00 7,30 50,00 15,00
Table 41 Fatigue analysis for towers in 20 meter water depth
Site 2 Max Δσ wave Max Δσ wind Wall thickness in connection [mm]
Wall thickness of member [mm] [N/mm2] [N/mm2]
3.6 MW No fatigue problems 6.0 MW leg3 0,00 10,30 50,00 39,00 leg4 0,00 10,30 60,00 47,00 8.0 MW leg1 0,30 8,30 60,00 52,00 leg2 0,30 8,80 50,00 40,00 leg3 0,00 8,80 55,00 39,00 leg4 0,00 8,70 85,00 60,00 brace3 1,20 7,60 25,00 15,00
Table 42 Fatigue analysis for towers in 40 meter water depth

79
Site 3 Max Δσ wave Max Δσ wind Wall thickness in connection [mm]
Wall thickness of member [mm] [N/mm2] [N/mm2]
3.6 MW leg5 0,00 8,50 60,00 29,00 6.0 MW leg4 0,00 9,50 50,00 37,00 leg5 0,00 13,00 60,00 35,00 8.0 MW leg3 0,70 8,40 50,00 37,00 leg4 0,00 8,20 60,00 37,00 leg5 0,00 8,20 60,00 36,00
Table 43 Fatigue analysis for towers in 60 meter water depth
From the fatigue analysis, some basic conclusions result: • For larger turbines, fatigue results in more increased wall thicknesses in the connections. Due
to the larger wind loads on larger turbines, and therefore the increased stress range due to constantly changing wind speeds, the fatigue is more determining on the design for larger wind turbines.
• The stress range due to wind variations is much larger than the stress range due to the presence and absence of a mean wave height. Therefore, fatigue loads are mainly caused by wind loads and only little by wave loads.
• The fatigue in the upper part of the elevation is mainly determined by the wind loads from the turbine, while the fatigue in the lower part is mainly influenced by the wave loads.
• The fatigue loads for the upper elevation is in most cases governing for the design of the can section thickness in the joints in the upper panel section. The lowest panel (at seabed) experiences the lowest fatigue stresses and therefore often has the largest fatigue life.
6.4.3 Results and conclusions on the dynamic analysis M
The dynamic analysis is performed in Scia Engineer, resulting in the first two natural frequencies as can be seen below.
frequency 1 [Hz] frequency 2 [Hz] 3.6 MW Site 1 (20m.) 0,33 1,06 Site 2 (40m.) 0,34 0,78 Site 3 (60m.) 0,28 0,80 6.0 MW Site 1 (20m.) 0,24 1,00 Site 2 (40m.) 0,21 0,94 Site 3 (60m.) 0,21 0,79
8.0 MW Site 1 (20m.) 0,21 0,99 Site 2 (40m.) 0,20 0,81 Site 3 (60m.) 0,19 0,82
Table 44 Results of the dynamic analysis of the tower support structure
Again, the first natural frequency is largely determined by the wind turbine and the second natural frequency is largely determined by the tower support structure. The first natural frequency of the wind turbine decreases for larger wind turbines, due to the lower stiffness of the longer turbine tower and larger mass in top of it. The hub height largely influences the first frequency with the turbine tower stiffness, while the turbine mass has a lower influence. Furthermore, the water depth influences the first natural frequency as well.
From the results it can also be seen that the tower stiffness decreases with increasing water depth, independent of the wind turbine size. Therefore, the second natural frequency f2 decreases with increasing water depth.

80
For a certain water depth, the frequency of the tower f2 decreases with increasing water depth which is because of the lower stiffness of the turbine. This reduces the stiffness of the tower support structure as well and lowers f2. As can be concluded from the figure Figure 53, Figure 54 and Figure 55, no resonance will occur because the second natural frequency falls above the 3P range. The natural frequencies will be compared with the frequencies of the tripod and mono pile in chapter 8. Some conclusions on the influence of the added lumped masses and its location can be given:
• The location of the soil and water mass highly influences the second natural frequency. When the masses are located at a higher joint of the truss, the natural frequency will decrease. Therefore, the location of masses should be as high as reasonable to make a conservative calculation of the natural frequency to prevent resonance.
• The amount of mass from added soil or water does only slightly influence the second natural frequency. The masses of soil and water are of the same order of the own steel weight of the tower structure. An increase in mass of soil or water leads to a decrease of the natural frequency.
Figure 54 Results for 6.0 MW turbine for 20 m. (red) 40 m. (violet) and 60 m. (green) water
Figure 55 Results for 6.0 MW turbine for 20 m. (red) 40 m. (violet) and 60 m. (green) water
Figure 56 Results for 6.0 MW turbine for 20 m. (red) 40 m. (violet) and 60 m. (green) water

81
As can be seen in the figures above, all the natural frequencies of the tower support structures are above the 3P range of the wind turbine. This was also expected because of the higher stiffness of the tower structures compared to the mono pile and tripod. The tower supports will not lead to any resonance problems in the 1P or 3P range.
6.4.4 Influence of the soil stiffness M
The soil stiffness will only determine the dimensions of the foundation piles. The dimensions of the tower structure will not be influenced by the soil properties. For a homogeneous clay layer, the pile dimensions were again determined with Blum’s method. The main parameters which determines the difference between the horizontal and vertical bearing capacity in sand and clay is the volumetric weight, the angle of internal friction (and therefore the passive soil coefficient) and the reduced in bearing in clay. Dependent on the undrained shear strength of clay, the shaft friction along the pile might be higher than the shaft friction in sand. The results of the calculations are shown below.
Foundation piles
Site 1 (20 m.)- 3.6 MW Site 2 (40 m.)- 3.6 MW Site 3 (60 m.)- 3.6 MW
D [mm] Wall th. t
[mm] Length
[m] D [mm] Wall th. t
[mm] Length
[m] D [mm] Wall th. t
[mm] Length
[m] Sand 4000.00 37.00 48.60 3400.00 30.00 43.20 4500.00 38.00 42.60 Clay 5100.00 43.00 57.60 4000.00 35.00 51.36 5000.00 42.00 53.40
Table 45 Pile dimensions for 3.6 MW turbine and different water depths in homogeneous clay
As can be seen, the pile diameter, wall thickness and pile length need to be increased for all water depths due to the reduced vertical and horizontal bearing capacity of clay. The influence of clay on the natural frequency has been calculated as well. The results are given below.
Site 1 (20 m.)- 3.6 MW Site 2 (40 m.)- 3.6 MW Site 3 (60 m.)- 3.6 MW frequency 1
[Hz] frequency 2
[Hz] frequency 1
[Hz] frequency 2
[Hz] frequency 1
[Hz] frequency 2
[Hz] Sand 0.33 1.06 0.34 0.78 0.28 0.80 Clay 0.33 0.89 0.34 0.72 0.28 0.79
Table 46 Results of the natural frequencies for 3.6 MW turbines in sand and clay
The second natural frequency again decreases for a homogeneous clay layer due to the lower stiffness, which was also expected. The lower stiffness of the soil was modelled by a lower level of the fixed support, which is assumed to be at 4.5 * Dpile for clay. With the increased pile diameter and pile length, the stiffness of the foundation piles will increase, but the added soil mass in the dynamic model will also increase as a result. The combined effect still leads to a lower stiffness of the total soil and foundation pile system. The second natural frequencies still lie above the 3P range and no resonance is expected, which was actually the case for the tripod structures.
Therefore it can be concluded that the tower structure is less soil dependent in terms of dynamic behaviour. The tower structure itself appears to be stiffer than the mono pile and tripod support, and therefore resonance does not play a major role. In case resonance occurs, the stiffness should be enlarged to enlarge the frequencies above the 3P range. The foundation pile diameters and lengths might be enlarged to increase the foundation/support stiffness, although this increases the dynamic added soil mass as well and should both be taken into account concerning the effect on the natural frequency. This should be further investigated.
Another option could be an increase in base width of the tower itself. Other tower specific options could be to apply X-braces instead of K-braces. Although this will lead to more difficulties and costs concerning the connection and welds to be made, it might improve the dynamic behaviour. When no horizontal members are applied in the design, this could also be done to increase the tower stiffness. Eventually, the tower weight will also increase which leads to a new foundation design. This should be taken into account in the total stiffness of the support structure.

82
6.4.5 Technical limitations of the tower structure M
From the static analysis it can be concluded that there are no limitations concerning the dimensions of the tower structure. Due to its open design, the truss tower results in a relatively light structure with relatively small dimensions. Due to its high stiffness, the tower does not pose any resonance problems. All natural frequencies lie outside the 3P range.
For application of towers in soft clay layers, the dimensions of the foundation piles need to be enlarged. The stiffness of the foundation and tower structure is still relatively high and only little influenced by the reduced stiffness of the soil. Therefore the natural frequency still lies well above the 3P range. It can be concluded that the tower structure is less dependent on the soil conditions compared to the mono pile and tripod support structure. In general, the tower support structure is technically suitable for all three wind turbines (up to 8.0 MW) and all three locations with water depths up to 60 meters.
83
7. Cost Analysis M
In general, the costs for offshore wind farms can be subdivided into the capital and operational costs. The capital costs consist of:
• Manufacturing costs for the support structure • Manufacturing costs for the turbine • Installation costs • Decommissioning costs
The operational costs consist of:
• Seabed rent • Transmission charge • Operating costs
The installation costs can be subdivided into the support structure installation (excluding tower), the cable installation and the turbine installation. A typical distribution of these costs for a mono pile is 60% foundation installation, 20% cable installation and 20% turbine installation [7]. In this study we will compare different type of support structures and therefore focus on the installing and manufacturing (material and labor) costs for the support structures. The manufacturing and installing costs for the tower, rotor and blades are not taken into account. The cost analysis is performed for the chosen support structures: mono pile, tripod and tower structure. The spreadsheet is included in Appendix 7.
7.1 Manufacturing costs M
The manufacturing costs depend on the labor intensity of the joints and the size of the elements. For the mono pile, the elements are large and heavy, but the assemblance is straightforward, resulting in relatively low costs. For the tripod support, the elements are also large and have a difficult shape to weld. The jacket structure the elements are relatively small and light, but this type requires a lot of joint and has therefore higher costs, as can be seen below [2].
Manufacturing costs: • Mono pile: € 2/kg • Tripod: € 3/kg • Tower: € 4/kg
7.2 Installation costs M
The equipment for installation of support structures is a major part of the installation costs. Below, this equipment will be described and the day rate for a cost approximation will be given [7]. For the tripod support structures it is assumed that the foundation piles are post piled. The main reason is that the currently installed tripods in the Alpha Ventus Test field have been post piled. Because these are the only installed tripods at this moment and the cost analysis does not take any risks of new techniques into account, the post piled technique is chosen for the tripods. For the tower structures however, the pre piled technique is only considered because of the main advantages as discussed in section 1.7.3.
Heavy Lift Vessel (HLV) For the installation one will need an offshore installation vessel; the operating day rate will be one of the major costs of the installation phase. Currently, there is only a relatively small number of installation vessels available, which will be even more problematic looking at deeper waters and larger support structures. Often these vessels are oil- and gas jack-up structures because dynamic positioning (DP) vessels do not have the required stability and lifting capacity to install large wind turbines.

84
EWEA calculated that 12 offshore wind installation vessels will be necessary to reach 40 MW capacity in Europa in 2020 [26]. For the future offshore wind energy market, the use of specific installation vessels instead of general oil- and gas vessels is required. These vessels should be able to withstand a wide range of weather circumstances to enlarge the operational time during the year.
Dependent on the pile or tower dimensions, the lifting capacity and the lift radius will determine the most suitable installation equipment. It should be checked that the available lift capacity and radius is suited for the designed tripods and towers. The required lift capacity for the largest designed tripod in this study for 60 meter water depth is 1750 tons, which can easily be lifted with current heavy lift vessels. With the designed base width of 25 meters, the crane radius should also be at least 30 meters. This combination of lift radius and capacity is currently available. The following heavy lift vessels are taken into account depending of the weight of the designed support structure (mono pile, tripod or tower) [7]:
Heavy Lift Vessel Lift capacity [tons] Lift radius [m] Day rate [€ / day] 1 1000 70 € 250.000 2 1800 35 € 300.000 3 4500 34 € 400.000
Table 47 Heavy Lift Vessels with lift capacity, lift radius and day rate
Another main parameter is the weather window of the vessel: the weather circumstances in which it can perform lifting operations. For the common heavy lift vessels it can be assumed that in 75% (corresponding to a wave height of 2.0 meter) of the weather conditions in the North Sea it can perform lifting operations [7].
Auxiliary Vessel In case of a tower structure, it would be economically unattractive to use the heavy lift vessel for the foundation pile driving after installing the tower (post piling). Therefore, an auxiliary vessel is used to drive the foundation piles before the placement of the tower structure. As discussed before, the piles can also be post-driven: in that case the tower is first lowered down in the right position by the heavy lift vessel, after which the piles are driven by the heavy lift vessel as well. In this study, it is assumed that the piles are pre driven.
The auxiliary vessel will first lower down the piling template (with mudmats and pile sleeves on it) to drive the piles in the right position. The crane on the auxiliary vessel therefore needs to lift three objects: the piling template, the piles and the hydraulic hammer. The lift capacity needs to be about 200 tons, which is much less compared to the heavy lift vessel. After the pile driving, the piling template can be removed and a survey can be executed by a remotely operated vessel, to ensure that the piles fit in the pile sleeves of the tower structure. The auxiliary vessel will continue with pile driving at the other location, while the heavy lift vessel will place the tower structures and connect them by grouting. The weather window of the auxiliary vessel will be assumed to be 60% (corresponding to a wave height of 1.5 meter), which is lower than the HVL because it will be a less stable ship [7].
Mudmats and piling template For post-driven structures (such as the tripod in this study) some extra investments have to be made: mudmats and pile sleeves are required. The mudmats will ensure that the tripod has a stable settling on the seabed. The weight of these mudmats is considered to be constant and independent on the tripod design: 35 tons and because it is a complex element regarding the required stiffness, the costs will be assumed to be €4/kg. Because these mudmats are attached to the structure they cannot be reused, like the piling template can be up to 50 times for pre-driven structures. This piling template weights 200 ton and will also cost €4/kg, but it is used for the whole wind farm installation. These costs can be amortized over all support structure installations.

85
Table 48 Estimated day rates for transport and installation equipment
7.3 Transport costs M
The transport of towers, foundation piles, mono piles and transition pieces will be performed on a tugged barge. For this purpose, two different transports should be considered for the installation of a tower structure or tripod, namely the transport of towers and the transport of foundation piles. For the mono pile on the other hand, only the mono piles have to be transported and no separate foundation piles are required. In this study, the number of barges for foundation piles of tripod and tower structures is assumed to be two, independent of the distance to the shore.
The number of barges for support structures is mainly influenced by the distance to the harbor where the support structures are made and the number of barges required (dependent on the base area of the support structures). Because the water depth is related to the distance from shore, more barges will be needed because the supports structures become larger for larger water depths. For the largest tripod that was designed, with a base width of 25 meter, this requires a barge width of 43 meters. This barge is still available, but larges barges and more barges are needed to transport all tripods, because the installing sequence of the HLV should not be interrupted by supply problems. The influence of the support structure size is taken into account with the barge dimensions and the related day rate of the barge. The tripod and tower structures will require a larger barge than a standard North Sea barge (90ft x 300 ft), therefore a larger day rate is taken into account for the tripod and tower barges:
Mono pile barge: € 15.000 /day Tripod/Tower barge: € 20.000 /day
The HLV should not be interrupted by supply problems of support structures. This automatically leads to a minimum of two barges for all support structures. One barge will be loaded with support structures and deliver them at the HLV, but this barge cannot leave the HLV before all support structures are installed (it is assumed that there is no storage area available on deck of the HLV). Therefore another barge should arrive at the HLV after the last support structure is lifted from the previous one. It can be concluded from [7] that for different types of support structure the number of barges is as follows, which will be used as reference in this study:
Distance to shore Mono pile Tripod 4-legged tower < 110 km 2 2 2 110-160 km 2 2 3 >160 km 2 3 3
Table 49 Number of required barges for offshore transportation
In this study, the distance to the shore is defined as the distance to the Port of Rotterdam.
Equipment Day rate [€ / day] Heavy Lift Vessel € 250.000 - € 400.000 Auxiliary Vessel € 150.000 Remotely Operated Vessel € 10.000 Grouting Equipment € 50.000 Hydraulic piling hammer € 15.000 Transport barge € 15.000 Tug € 25.000

86
7.4 Support structure installation M
The procedure of support structure installation differs for different types (mono pile, tripod or truss tower) as was discussed below. Therefore also the assessment of working times will defer. Below, the estimated working times for the mono pile, the tripod and the tower structure are given. The installation time for the complete wind farm is also calculated. This wind farm consists of 50 wind turbines. The main requirement for the installation time is to fit in one summer season.
Mono pile foundation The installation sequence of the mono pile can be seen in Table 12. The sequence is as follows:
• Pile driving from the Heavy Lift Vessel (HLV) using a hydraulic hammer • Installation of transition piece by the HLV • Connect the transition piece and mono pile with a grout connection, also by HLV • Sail to the next location to install the next support structure
Only 2 transportation barges are required to transport the mono piles from the shore to the installation site. The rated time is calculated using the weather window of 75% for the HLV.
Installation time (one monopile) Time Rated Time Activity Equipment [hours] [hours] Pile driving HLV + hammer 12 16 Installation transition piece and grouting HLV + grouting equipment 6 8 Sailing to next location HLV (+ hammer and grouting equipment) 2 3 total installation time per monopile [hours] 20 27 total installation time wind farm [days] 42 56
Table 50 Installation sequence and estimated times for a wind farm of 50 mono piles
Tripod installation The foundation piles of the tripod are post piled. First the tripod is lowered down to the seabed, landing on the mudmats, after which the piles are driven through the pile sleeves. The only difference between the mono pile installation and the tripod is the installation of three foundation piles, which is assumed to be executed by the heavy lift vessel as well, after installing the tripod structure. The sequence is then as follows:
• Installation of the tripod structure on the seabed by the HLV • Drive three piles trough the pile sleeves using a hydraulic hammer, also with the HLV • Connect the three piles to the tripod by a grout connection from the HLV • Sail to the next location to install the next support structure
To provide a stable lowering of the tripod on the seabed, mutmads have to be mounted on the tripod base. This will be taken into account in the cost analysis. The rated time is calculated using the weather window of 75% for the HLV. Installation time (one tripod) Time Rated Time Activity Equipment [hours] [hours] Tripod installation Heavy lift vessel 6 8 Pile driving (3x) Heavy lift vessel + hammer 18 24 Grouting Heavy lift vessel + grouting equipment 3 4 Sailing to next location HLV (+ hammer and grouting equipment) 2 3 total installation time per tower [hours] 29 39 total installation time wind farm [days] 60 81
Table 51 Installation sequence and estimated time for a wind farm of 50 tripods
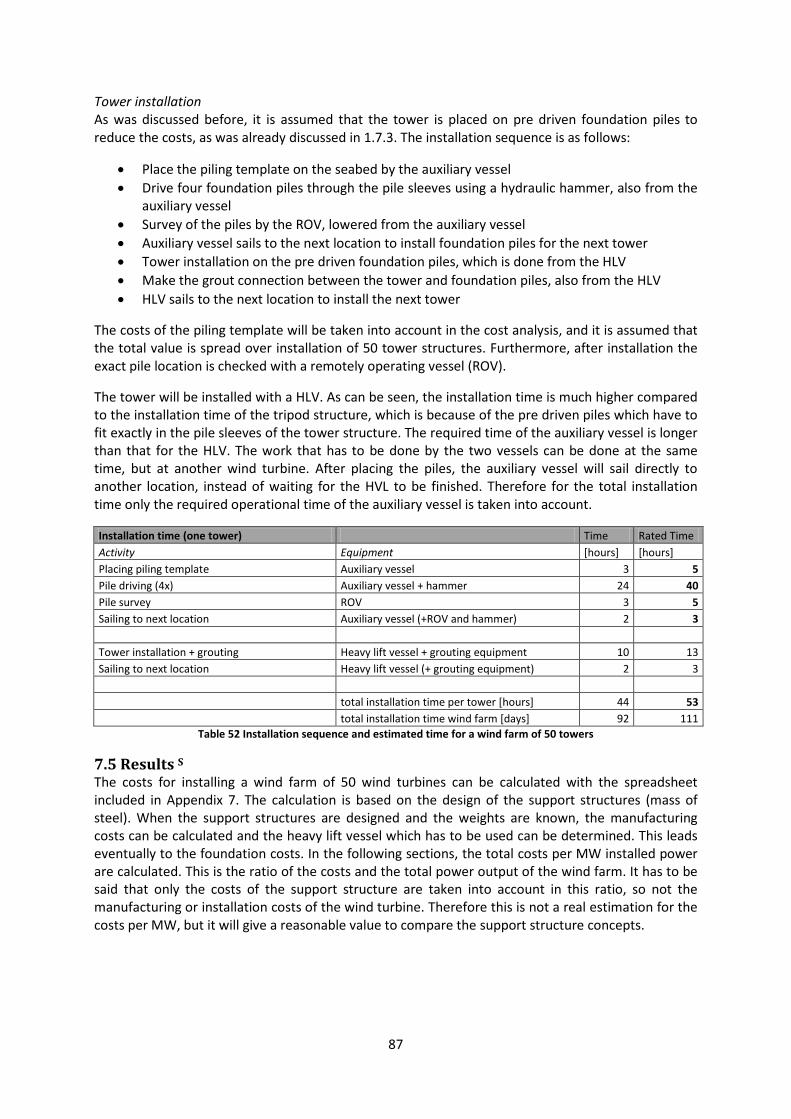
87
Tower installation As was discussed before, it is assumed that the tower is placed on pre driven foundation piles to reduce the costs, as was already discussed in 1.7.3. The installation sequence is as follows:
• Place the piling template on the seabed by the auxiliary vessel • Drive four foundation piles through the pile sleeves using a hydraulic hammer, also from the
auxiliary vessel • Survey of the piles by the ROV, lowered from the auxiliary vessel • Auxiliary vessel sails to the next location to install foundation piles for the next tower • Tower installation on the pre driven foundation piles, which is done from the HLV • Make the grout connection between the tower and foundation piles, also from the HLV • HLV sails to the next location to install the next tower
The costs of the piling template will be taken into account in the cost analysis, and it is assumed that the total value is spread over installation of 50 tower structures. Furthermore, after installation the exact pile location is checked with a remotely operating vessel (ROV).
The tower will be installed with a HLV. As can be seen, the installation time is much higher compared to the installation time of the tripod structure, which is because of the pre driven piles which have to fit exactly in the pile sleeves of the tower structure. The required time of the auxiliary vessel is longer than that for the HLV. The work that has to be done by the two vessels can be done at the same time, but at another wind turbine. After placing the piles, the auxiliary vessel will sail directly to another location, instead of waiting for the HVL to be finished. Therefore for the total installation time only the required operational time of the auxiliary vessel is taken into account.
Installation time (one tower) Time Rated Time Activity Equipment [hours] [hours] Placing piling template Auxiliary vessel 3 5 Pile driving (4x) Auxiliary vessel + hammer 24 40 Pile survey ROV 3 5 Sailing to next location Auxiliary vessel (+ROV and hammer) 2 3 Tower installation + grouting Heavy lift vessel + grouting equipment 10 13 Sailing to next location Heavy lift vessel (+ grouting equipment) 2 3
total installation time per tower [hours] 44 53 total installation time wind farm [days] 92 111
Table 52 Installation sequence and estimated time for a wind farm of 50 towers
7.5 Results S
The costs for installing a wind farm of 50 wind turbines can be calculated with the spreadsheet included in Appendix 7. The calculation is based on the design of the support structures (mass of steel). When the support structures are designed and the weights are known, the manufacturing costs can be calculated and the heavy lift vessel which has to be used can be determined. This leads eventually to the foundation costs. In the following sections, the total costs per MW installed power are calculated. This is the ratio of the costs and the total power output of the wind farm. It has to be said that only the costs of the support structure are taken into account in this ratio, so not the manufacturing or installation costs of the wind turbine. Therefore this is not a real estimation for the costs per MW, but it will give a reasonable value to compare the support structure concepts.

88
Weight MP Weight TPTotal manufacturing
costsTotal transport
costsTotal foundation
costs Total costsTotal costs per MW
installed powerTotal installation time wind farm
[tons] [tons] [k€] [k€] [k€] [k€] [€/MW] [days]
Site 1 3.6 MW 502 189 69139 4444 17500 91083 506 56
20 m. 6.0 MW 827 295 112289 4444 17500 134233 447 56
8.0 MW 943 334 127715 4444 17500 149659 374 56
Site 2 3.6 MW 897 253 115025 4444 17500 136969 761 56
40 m. 6.0 MW 1566 419 198527 4444 20278 223249 744 56
8.0 MW 1912 503 241466 4444 25833 271743 679 56
Site 3 3.6 MW 1445 346 179077 4444 20278 203799 1132 56
60 m. 6.0 MW 2235 515 274941 4444 25833 305218 1017 56
8.0 MW 2447 559 300607 4444 25833 330884 827 56
Mono pile
7.5.1 Costs analysis of the mono pile S
The results of the cost analysis for the mono pile are given in Table 53 for a 3.6 MW turbine in 20 meter water depth. For the mono pile, only the total weight of the support structure (MP and TP) is of importance to calculate the manufacturing costs. The standard North Sea barge with dimensions of 300ft. x 90 ft. will be big enough to transport the mono piles for all water depths, therefore the transport costs will be the same for every combination of site 1, or 3 and wind turbine size because in all cases 2 barges are required.
Table 53 Cost analysis for the mono pile support structure
The results in Table 53 are obtained from Table 50 where the total installation time was calculated. This time determined the time the HLV is needed for installation operations and therefore has a large influence on the costs. As can be seen, for all manufacturing costs the steel price of €2/kg is taken into account.
Table 54 Results of the cost analysis for a wind farm of 50 mono piles
The foundation costs will increase due to the increase in weight of the mono pile, which determines the HLV to be used and therefore the day rate. The foundation and the transport costs are however of little influence. The majority of the costs are determined due to the manufacturing costs. The transport costs stay the same and the foundation costs only increase when a HLV with a larger lift capacity is needed. The total costs leads eventually to the total costs per MW installed power.
Total costs Material Time Unit Price/Day rate Total costs[tons] [days] [€/ton, €/day] [k€]
Material and manufacturing weight mono pile 502 € 2000 € 1005weight transition piece 189 € 2000 € 378
total manuf. costs for one installation € 1383total manuf. costs for wind farm € 69139
Transport offshore transport barges 1.11 € 15000 € 17tug 1.11 € 25000 € 28
total transport costs for one installation € 89total transport costs for wind farm € 4444
Foundation installation heavy lift vessel 1.11 € 250000 € 278hydraulic hammer 1.11 € 15000 € 17grouting equipment 1.11 € 50000 € 56
total foundation costs for one installation € 350total foundation costs for wind farm € 17500
total costs for wind farm € 91083total costs per MW installed power € 506

89
Looking at every location separately, this ratio will decrease with increasing wind turbines. The increase of the manufacturing costs is more than voided due to the increase in the total amount of installed power. Looking at the different locations, the total costs per MW installed power will logically increase. Due to the greater water depth, the dimensions of the support structure have to increase, which leads to a higher weight. Next to the installation costs, the installing time of a wind farm of 50 wind turbines have been calculated. This resulted in 56 days for the mono pile support structures. The installing time is independent of the size of the mono piles and is therefore the same for every location.
7.5.2 Cost analysis of the tripod S
For a tripod support structure in 20 meter water depth and a 3.6 MW turbine, the total installation costs are estimated below.
Table 55 Cost analysis for the tripod support structure
The calculations in Table 55 are based on the calculations for the installing time of one tripod in Table 51. As can be seen, for the foundation piles only €2/kg is taken into account, while for the tripod itself €3/kg is taken into account due to the complex welds to be made. Furthermore, a separation has been made in transport barges for foundation piles and tripods. The mudmats are also included. Similar to the mono pile, the total costs are mainly determined due to the manufacturing costs, the influence of the foundation costs are however slightly bigger.
At site 1 it can be seen (Table 56) that the weight of the foundation piles is large compared to the weight of the tripods, because there are three piles required for one tripod. For the transportation of the foundation piles, it is assumed that there are 2 barges needed for the transportation of the foundation piles, independent of the distance to the shore.
Material Time Unit Price/Day rate Total costs[tons] [days] [€/ton, €/day] [k€]
weight tripod 339 € 3000 € 1016weight foundation piles 497 € 2000 € 995
total manuf. costs for one installation € 2011total manuf. costs for wind farm € 100536
transport barges tripods 1.61 € 20000 € 64tug tripods 1.61 € 25000 € 81transport barge foundation piles 1.61 € 20000 € 64tug foundation piles 1.61 € 25000 € 81
total transport costs for one installation € 290total transport costs for wind farm € 14500
heavy lift vessel 1.61 € 250000 € 403mudmats 35 € 4000 € 140hydraulic hammer 1.61 € 15000 € 24grouting equipment 1.61 € 50000 € 81
total foundation costs for one installation € 648total foundation costs for wind farm € 32375
total costs for wind farm € 147411total costs per MW installed power € 819
Total costs
Material and manufacturing
Transport offshore
Foundation installation

90
Weight tripod
Weight piles
Total manufacturing costs
Total transport costs
Total foundation costs Total costs
Total costs per MW installed power
Total installation time wind farm
[tons] [tons] [k€] [k€] [k€] [k€] [€/MW] [days]
Site 1 3.6 MW 339 497 100536 14500 32375 147411 819 81
20 m. 6.0 MW 697 1021 206658 14500 36403 257561 859 81
8.0 MW 864 1254 255024 14500 36403 305927 765 81
Site 2 3.6 MW 572 445 130215 14500 32375 177090 984 81
40 m. 6.0 MW 1146 984 270281 14500 36403 321184 1071 81
8.0 MW 1395 1193 328594 14500 36403 379497 949 81
Site 3 3.6 MW 984 486 196289 18125 32375 246789 1371 81
60 m. 6.0 MW 1788 1102 378340 18125 36403 432868 1443 81
8.0 MW 2209 1302 461483 18125 44458 524066 1310 81
Tripod
Table 56 Results of the cost analysis for a wind farm of 50 tripods
Furthermore, the total installation time has been calculated for a wind farm of 50 turbines: 81 days. This is without the installation of the wind turbines on top of the support structures. This could be performed parallel to the support structure installation and will therefore not influence the installation time much. Looking at the size of the wind turbines only, the total costs per MW installed power are not always decreasing with increasing wind turbine size. Between 3.6 and 6.0 MW only a slightly difference can be observed, which is almost negligible. The differences between the 6.0 and 8.0 MW are far bigger. The 8.0 MW wind turbine is more cost-efficient than the other two.
7.5.3 Cost analysis truss tower S
Below the installation costs of a truss tower in for a site with 20 m. water depth and a 3.6 MW turbine are shown:
Table 57 Cost analysis for the tower support structure
Material Time Unit Price/Day rate Total costs[tons] [days] [€/ton, €/day] [k€]
weight tower 177 € 4000 € 708weight foundation piles 558 € 2000 € 1116
total manuf. costs for one installation € 1824total manuf. costs for wind farm € 91200
transport barges towers 0.67 € 20000 € 27tug towers 0.67 € 25000 € 33transport barge foundation piles 2.22 € 20000 € 89tug foundation piles 2.22 € 25000 € 111
total transport costs for one installation € 260total transport costs for wind farm € 13000
auxiliary vessel 2.22 € 100000 € 222pile template 200 € 4000 € 16hydraulic hammer 2.22 € 15000 € 33ROV 2.22 € 10000 € 22
heavy lift vessel 0.67 € 250000 € 167grouting equipment 0.67 € 50000 € 33
total foundation costs for one installation € 494total foundation costs for wind farm € 24689
total costs for wind farm € 128889total costs per MW installed power € 716
Material and manufacturing
Total costs
Transport offshore
Foundation installation
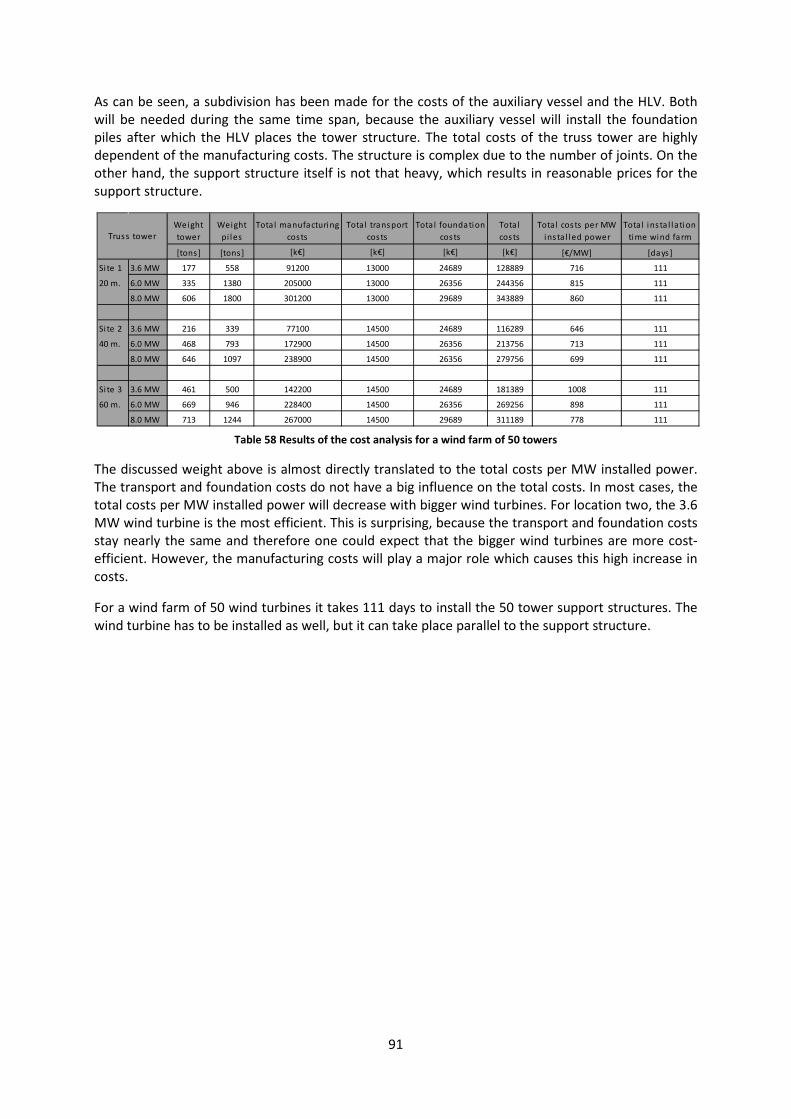
91
Weight tower
Weight pi les
Tota l manufacturing costs
Tota l transport costs
Tota l foundation costs
Tota l costs
Tota l costs per MW insta l led power
Tota l ins ta l lation time wind farm
[tons] [tons] [k€] [k€] [k€] [k€] [€/MW] [days]
Si te 1 3.6 MW 177 558 91200 13000 24689 128889 716 111
20 m. 6.0 MW 335 1380 205000 13000 26356 244356 815 111
8.0 MW 606 1800 301200 13000 29689 343889 860 111
Si te 2 3.6 MW 216 339 77100 14500 24689 116289 646 111
40 m. 6.0 MW 468 793 172900 14500 26356 213756 713 111
8.0 MW 646 1097 238900 14500 26356 279756 699 111
Si te 3 3.6 MW 461 500 142200 14500 24689 181389 1008 111
60 m. 6.0 MW 669 946 228400 14500 26356 269256 898 111
8.0 MW 713 1244 267000 14500 29689 311189 778 111
Truss tower
As can be seen, a subdivision has been made for the costs of the auxiliary vessel and the HLV. Both will be needed during the same time span, because the auxiliary vessel will install the foundation piles after which the HLV places the tower structure. The total costs of the truss tower are highly dependent of the manufacturing costs. The structure is complex due to the number of joints. On the other hand, the support structure itself is not that heavy, which results in reasonable prices for the support structure.
Table 58 Results of the cost analysis for a wind farm of 50 towers
The discussed weight above is almost directly translated to the total costs per MW installed power. The transport and foundation costs do not have a big influence on the total costs. In most cases, the total costs per MW installed power will decrease with bigger wind turbines. For location two, the 3.6 MW wind turbine is the most efficient. This is surprising, because the transport and foundation costs stay nearly the same and therefore one could expect that the bigger wind turbines are more cost-efficient. However, the manufacturing costs will play a major role which causes this high increase in costs.
For a wind farm of 50 wind turbines it takes 111 days to install the 50 tower support structures. The wind turbine has to be installed as well, but it can take place parallel to the support structure.
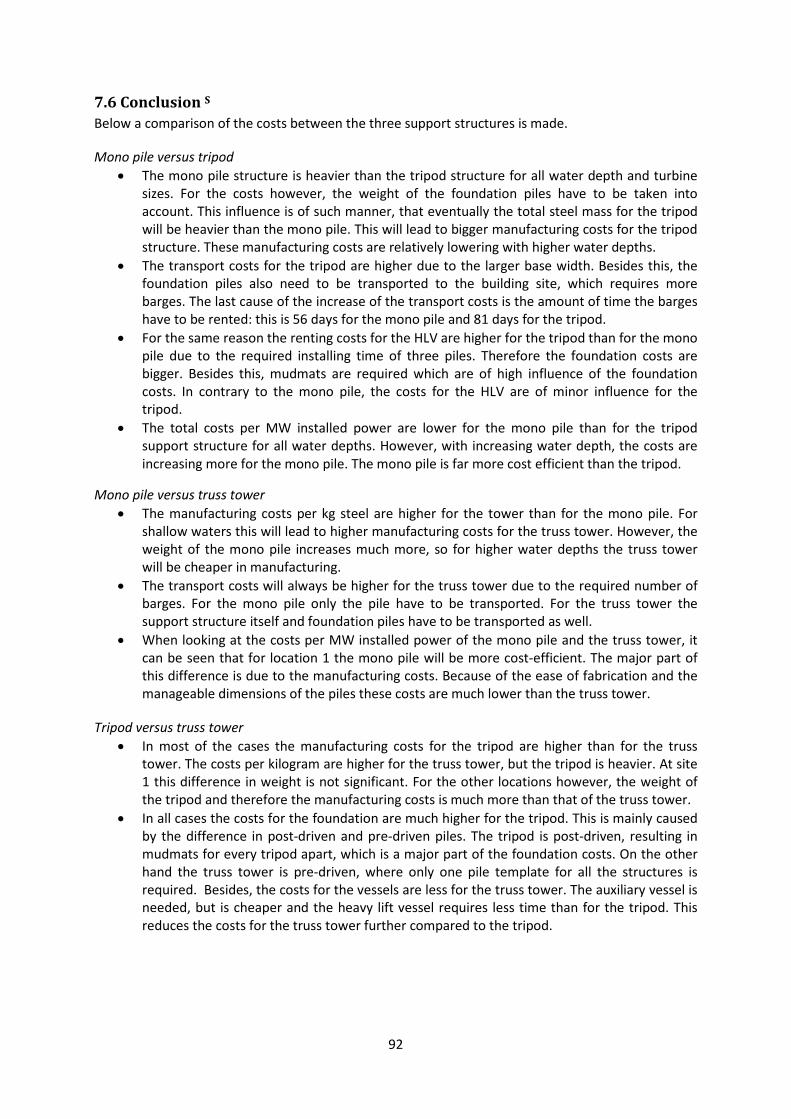
92
7.6 Conclusion S
Below a comparison of the costs between the three support structures is made.
Mono pile versus tripod • The mono pile structure is heavier than the tripod structure for all water depth and turbine
sizes. For the costs however, the weight of the foundation piles have to be taken into account. This influence is of such manner, that eventually the total steel mass for the tripod will be heavier than the mono pile. This will lead to bigger manufacturing costs for the tripod structure. These manufacturing costs are relatively lowering with higher water depths.
• The transport costs for the tripod are higher due to the larger base width. Besides this, the foundation piles also need to be transported to the building site, which requires more barges. The last cause of the increase of the transport costs is the amount of time the barges have to be rented: this is 56 days for the mono pile and 81 days for the tripod.
• For the same reason the renting costs for the HLV are higher for the tripod than for the mono pile due to the required installing time of three piles. Therefore the foundation costs are bigger. Besides this, mudmats are required which are of high influence of the foundation costs. In contrary to the mono pile, the costs for the HLV are of minor influence for the tripod.
• The total costs per MW installed power are lower for the mono pile than for the tripod support structure for all water depths. However, with increasing water depth, the costs are increasing more for the mono pile. The mono pile is far more cost efficient than the tripod.
Mono pile versus truss tower • The manufacturing costs per kg steel are higher for the tower than for the mono pile. For
shallow waters this will lead to higher manufacturing costs for the truss tower. However, the weight of the mono pile increases much more, so for higher water depths the truss tower will be cheaper in manufacturing.
• The transport costs will always be higher for the truss tower due to the required number of barges. For the mono pile only the pile have to be transported. For the truss tower the support structure itself and foundation piles have to be transported as well.
• When looking at the costs per MW installed power of the mono pile and the truss tower, it can be seen that for location 1 the mono pile will be more cost-efficient. The major part of this difference is due to the manufacturing costs. Because of the ease of fabrication and the manageable dimensions of the piles these costs are much lower than the truss tower.
Tripod versus truss tower • In most of the cases the manufacturing costs for the tripod are higher than for the truss
tower. The costs per kilogram are higher for the truss tower, but the tripod is heavier. At site 1 this difference in weight is not significant. For the other locations however, the weight of the tripod and therefore the manufacturing costs is much more than that of the truss tower.
• In all cases the costs for the foundation are much higher for the tripod. This is mainly caused by the difference in post-driven and pre-driven piles. The tripod is post-driven, resulting in mudmats for every tripod apart, which is a major part of the foundation costs. On the other hand the truss tower is pre-driven, where only one pile template for all the structures is required. Besides, the costs for the vessels are less for the truss tower. The auxiliary vessel is needed, but is cheaper and the heavy lift vessel requires less time than for the tripod. This reduces the costs for the truss tower further compared to the tripod.
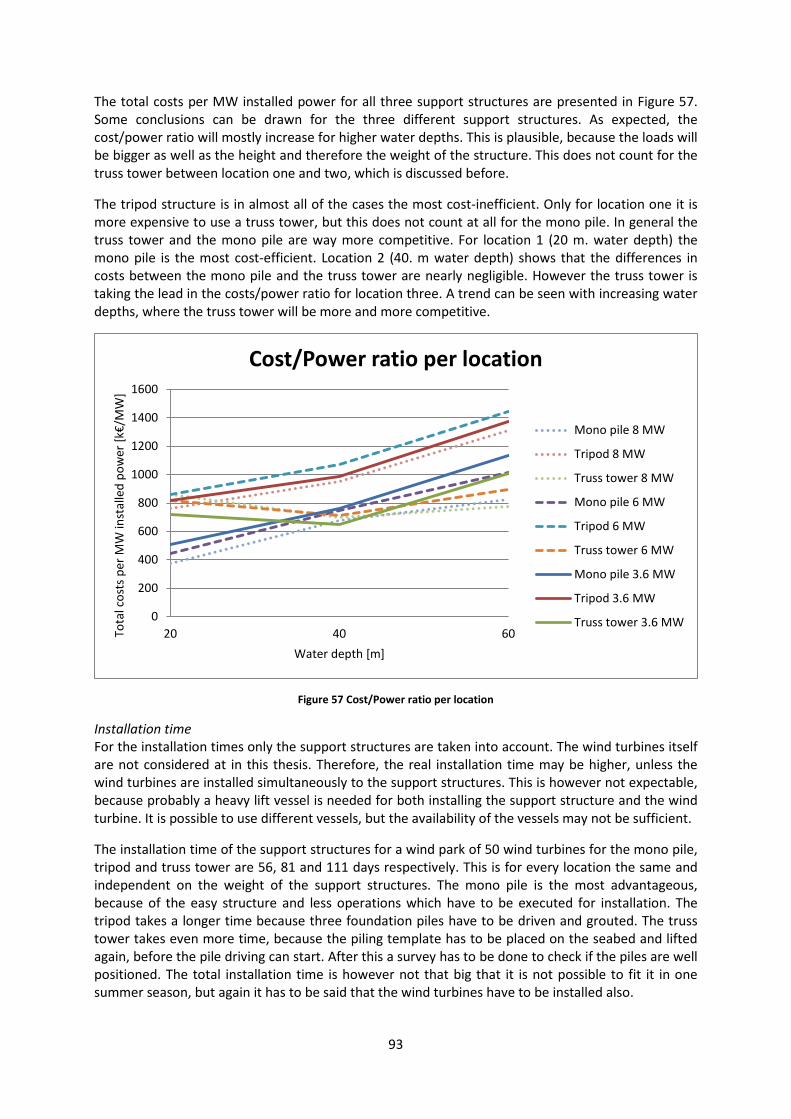
93
The total costs per MW installed power for all three support structures are presented in Figure 57. Some conclusions can be drawn for the three different support structures. As expected, the cost/power ratio will mostly increase for higher water depths. This is plausible, because the loads will be bigger as well as the height and therefore the weight of the structure. This does not count for the truss tower between location one and two, which is discussed before.
The tripod structure is in almost all of the cases the most cost-inefficient. Only for location one it is more expensive to use a truss tower, but this does not count at all for the mono pile. In general the truss tower and the mono pile are way more competitive. For location 1 (20 m. water depth) the mono pile is the most cost-efficient. Location 2 (40. m water depth) shows that the differences in costs between the mono pile and the truss tower are nearly negligible. However the truss tower is taking the lead in the costs/power ratio for location three. A trend can be seen with increasing water depths, where the truss tower will be more and more competitive.
Figure 57 Cost/Power ratio per location
Installation time For the installation times only the support structures are taken into account. The wind turbines itself are not considered at in this thesis. Therefore, the real installation time may be higher, unless the wind turbines are installed simultaneously to the support structures. This is however not expectable, because probably a heavy lift vessel is needed for both installing the support structure and the wind turbine. It is possible to use different vessels, but the availability of the vessels may not be sufficient.
The installation time of the support structures for a wind park of 50 wind turbines for the mono pile, tripod and truss tower are 56, 81 and 111 days respectively. This is for every location the same and independent on the weight of the support structures. The mono pile is the most advantageous, because of the easy structure and less operations which have to be executed for installation. The tripod takes a longer time because three foundation piles have to be driven and grouted. The truss tower takes even more time, because the piling template has to be placed on the seabed and lifted again, before the pile driving can start. After this a survey has to be done to check if the piles are well positioned. The total installation time is however not that big that it is not possible to fit it in one summer season, but again it has to be said that the wind turbines have to be installed also.
0
200
400
600
800
1000
1200
1400
1600
20 40 60Tota
l cos
ts p
er M
W in
stal
led
pow
er [k
€/M
W]
Water depth [m]
Cost/Power ratio per location
Mono pile 8 MW
Tripod 8 MW
Truss tower 8 MW
Mono pile 6 MW
Tripod 6 MW
Truss tower 6 MW
Mono pile 3.6 MW
Tripod 3.6 MW
Truss tower 3.6 MW
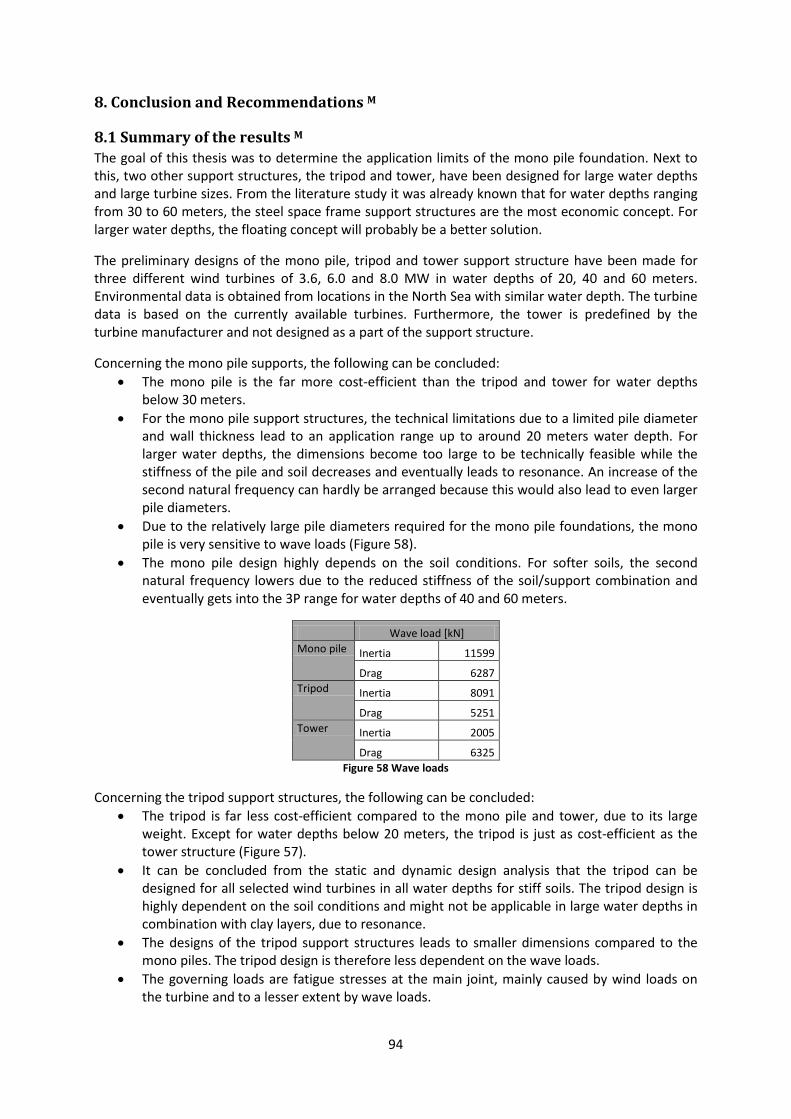
94
8. Conclusion and Recommendations M
8.1 Summary of the results M
The goal of this thesis was to determine the application limits of the mono pile foundation. Next to this, two other support structures, the tripod and tower, have been designed for large water depths and large turbine sizes. From the literature study it was already known that for water depths ranging from 30 to 60 meters, the steel space frame support structures are the most economic concept. For larger water depths, the floating concept will probably be a better solution.
The preliminary designs of the mono pile, tripod and tower support structure have been made for three different wind turbines of 3.6, 6.0 and 8.0 MW in water depths of 20, 40 and 60 meters. Environmental data is obtained from locations in the North Sea with similar water depth. The turbine data is based on the currently available turbines. Furthermore, the tower is predefined by the turbine manufacturer and not designed as a part of the support structure.
Concerning the mono pile supports, the following can be concluded: • The mono pile is the far more cost-efficient than the tripod and tower for water depths
below 30 meters. • For the mono pile support structures, the technical limitations due to a limited pile diameter
and wall thickness lead to an application range up to around 20 meters water depth. For larger water depths, the dimensions become too large to be technically feasible while the stiffness of the pile and soil decreases and eventually leads to resonance. An increase of the second natural frequency can hardly be arranged because this would also lead to even larger pile diameters.
• Due to the relatively large pile diameters required for the mono pile foundations, the mono pile is very sensitive to wave loads (Figure 58).
• The mono pile design highly depends on the soil conditions. For softer soils, the second natural frequency lowers due to the reduced stiffness of the soil/support combination and eventually gets into the 3P range for water depths of 40 and 60 meters.
Wave load [kN] Mono pile Inertia 11599
Drag 6287 Tripod Inertia 8091
Drag 5251 Tower Inertia 2005
Drag 6325 Figure 58 Wave loads
Concerning the tripod support structures, the following can be concluded: • The tripod is far less cost-efficient compared to the mono pile and tower, due to its large
weight. Except for water depths below 20 meters, the tripod is just as cost-efficient as the tower structure (Figure 57).
• It can be concluded from the static and dynamic design analysis that the tripod can be designed for all selected wind turbines in all water depths for stiff soils. The tripod design is highly dependent on the soil conditions and might not be applicable in large water depths in combination with clay layers, due to resonance.
• The designs of the tripod support structures leads to smaller dimensions compared to the mono piles. The tripod design is therefore less dependent on the wave loads.
• The governing loads are fatigue stresses at the main joint, mainly caused by wind loads on the turbine and to a lesser extent by wave loads.
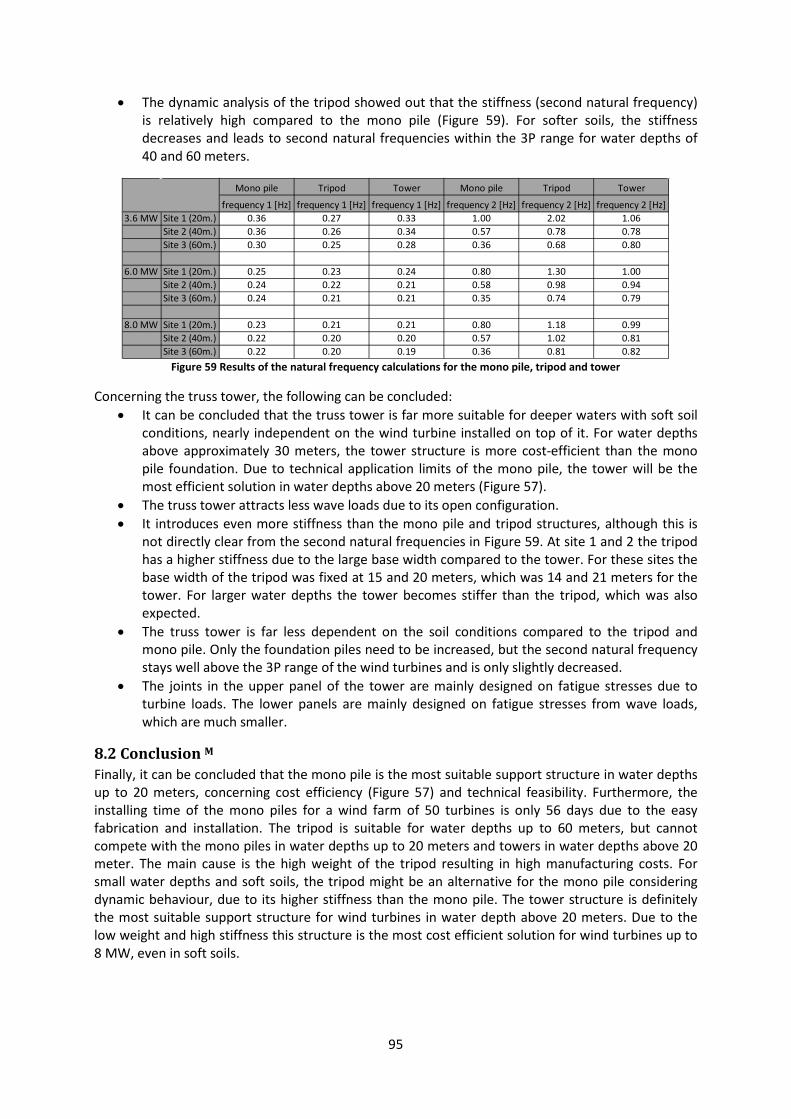
95
• The dynamic analysis of the tripod showed out that the stiffness (second natural frequency) is relatively high compared to the mono pile (Figure 59). For softer soils, the stiffness decreases and leads to second natural frequencies within the 3P range for water depths of 40 and 60 meters.
Figure 59 Results of the natural frequency calculations for the mono pile, tripod and tower
Concerning the truss tower, the following can be concluded: • It can be concluded that the truss tower is far more suitable for deeper waters with soft soil
conditions, nearly independent on the wind turbine installed on top of it. For water depths above approximately 30 meters, the tower structure is more cost-efficient than the mono pile foundation. Due to technical application limits of the mono pile, the tower will be the most efficient solution in water depths above 20 meters (Figure 57).
• The truss tower attracts less wave loads due to its open configuration. • It introduces even more stiffness than the mono pile and tripod structures, although this is
not directly clear from the second natural frequencies in Figure 59. At site 1 and 2 the tripod has a higher stiffness due to the large base width compared to the tower. For these sites the base width of the tripod was fixed at 15 and 20 meters, which was 14 and 21 meters for the tower. For larger water depths the tower becomes stiffer than the tripod, which was also expected.
• The truss tower is far less dependent on the soil conditions compared to the tripod and mono pile. Only the foundation piles need to be increased, but the second natural frequency stays well above the 3P range of the wind turbines and is only slightly decreased.
• The joints in the upper panel of the tower are mainly designed on fatigue stresses due to turbine loads. The lower panels are mainly designed on fatigue stresses from wave loads, which are much smaller.
8.2 Conclusion M
Finally, it can be concluded that the mono pile is the most suitable support structure in water depths up to 20 meters, concerning cost efficiency (Figure 57) and technical feasibility. Furthermore, the installing time of the mono piles for a wind farm of 50 turbines is only 56 days due to the easy fabrication and installation. The tripod is suitable for water depths up to 60 meters, but cannot compete with the mono piles in water depths up to 20 meters and towers in water depths above 20 meter. The main cause is the high weight of the tripod resulting in high manufacturing costs. For small water depths and soft soils, the tripod might be an alternative for the mono pile considering dynamic behaviour, due to its higher stiffness than the mono pile. The tower structure is definitely the most suitable support structure for wind turbines in water depth above 20 meters. Due to the low weight and high stiffness this structure is the most cost efficient solution for wind turbines up to 8 MW, even in soft soils.
Mono pile Tripod Tower Mono pile Tripod Tower
frequency 1 [Hz] frequency 1 [Hz] frequency 1 [Hz] frequency 2 [Hz] frequency 2 [Hz] frequency 2 [Hz]3.6 MW Site 1 (20m.) 0.36 0.27 0.33 1.00 2.02 1.06
Site 2 (40m.) 0.36 0.26 0.34 0.57 0.78 0.78Site 3 (60m.) 0.30 0.25 0.28 0.36 0.68 0.80
6.0 MW Site 1 (20m.) 0.25 0.23 0.24 0.80 1.30 1.00Site 2 (40m.) 0.24 0.22 0.21 0.58 0.98 0.94Site 3 (60m.) 0.24 0.21 0.21 0.35 0.74 0.79
8.0 MW Site 1 (20m.) 0.23 0.21 0.21 0.80 1.18 0.99Site 2 (40m.) 0.22 0.20 0.20 0.57 1.02 0.81Site 3 (60m.) 0.22 0.20 0.19 0.36 0.81 0.82

96
8.3 Recommendations M The following recommendations result from this study.
Structural design • Fatigue loads have a large influence on the design of joints of offshore support structures. It
should be further investigated how large the stress concentrations in these joints are, i.e. which stress concentration factor should be applied in relation with the joint geometry. Furthermore, the influence of dynamic vibrations on the fatigue life time should be further investigated.
• The transition piece should be designed in detail, because it highly influences the transfer of loads to the support structure. Furthermore, the stiffness of the transition piece might be of a large influence on the dynamic behavior, especially for the mono pile. This should be further investigated.
• The foundation pile design should be performed in more detail with a spring-model of the soil. Blum’s method might not be suitable for large diameter foundation piles because it assumes a linear increasing stiffness over depth.
• For the tripod and the truss tower a fixed base width is used for a certain water depth. This is done to reduce the amount of parameters to make the calculation more manageable. The influence of the base width on the total weight and costs as well as on the dynamic behavior should be further investigated.
• The leg and brace angles of tripods and the leg angles for the truss towers were fixed in this preliminary design. For the tripod this determines the base width and the height of the structure. For the truss tower the angle determines the width. This width is important for the calculation of the foundation piles for both structures. A changing height of the tripod will also change the loads on the structure. Therefore varying these parameters may lead to an optimized design.
• The cross sections of the braces and legs of the tripod support were considered to be prismatic. The application of tapered cross sections might lead to an optimized design in terms of weight and stiffness. This should be further investigated.
• The influence of joint geometry on the stiffness of tower structures should be further investigated. The X-braces instead of K-braces might result in a higher stiffness of the tower and will influence the fatigue lifetime and buckling lengths as well.
• The accident limit state should be taken into account in the next design step of the support structures.
Dynamic behavior • A parameter study should be performed to investigate the size of the added soil mass and
hydrodynamic added water mass. The soil mass around the foundation piles might also be taken into account and it should be investigated to which distance from the pile. It should be investigated if the mass of the displaced water volume is a right approximation for the tower structure.
• The level of the schematized fixed support in the soil should be studied carefully, because it has a large influence on the stiffness of the soil/support structure and the dynamic behavior. The proposed values of the method of Blum might not be suitable for the large piles used for offshore.
• The dynamic behavior of the mono pile was performed with a hand calculation of a 1-mass-spring-dashpot system. It should be further investigated if the complete structure can be subdivided in more lumped masses with their own stiffness, which yields a multiple mass spring dashpot system. This might lead to a more accurate approximation of the natural frequencies.
97
• The deflections of the dynamic vibrations should be calculated. Therefore, the aerodynamic and structural dampening should be further taken into account, because this largely influences the displacements. The natural frequency will not be influenced that much, but for a final design the influence of the dampening on the natural frequencies should be taken into account.
Costs and installation time • For the calculation of the manufacturing costs, a constant price per kilogram steel was used
only dependent on the difficulties with joints and welds. This price is constant for the three structures, which might not be the case in reality. This should be taken into account in the final design.
• The installation time for all mono piles, tripods and towers is assumed to be independent on the size and weight of the support structure. The installation time should analyzed in more detail.

98
References
[1] J. van der Tempel, "Design of Support Structures for Offshore Wind Turbines," PhD, TU Delft, 2006.
[2] W. de Vries, "Final report WP 4.2 Support Structure Concepts for Deep Water Sites," TU Delft, 2007.
[3] J. K. Kaldellis and M. Kapsali, "Shifting towards offshore wind energy—Recent activity and future development," Energy Policy, vol. 53, pp. 136-148, February 2013.
[4] J. Vugts, Handbook of Bottom Founded Offshore Structures vol. 1. Delft: TU Delft, 2002. [5] J. Pike. (2011, 24-04). Compliant Tower. Available:
http://www.globalsecurity.org/military/systems/ship/platform-compliant-tower.htm [6] Faculty of Civil Engineering, TU Delft. (2013) ESDEP Course - Offshore Structures. Available:
http://www.fgg.uni-lj.si/kmk/esdep/master/wg15a/l0100.htm [7] F. van Gerven, "Optimising the Design of a Steel Substructure for Offshore Wind Turbines in
Deeper Waters," MSc. Thesis, CiTG, TU Delft, Delft, 2011. [8] B. Byrne, G. Houlsby, C. Martin, and P. Fish, "Suction Caisson Foundations for Offshore Wind
Turbines," Wind Engineering, vol. 26, pp. 145-155, 2002. [9] O. Biz. (2013). Germany: Seafox Group Successfully Starts Operations in Offshore Wind
Industry. Available: http://www.offshorewind.biz/2013/03/05/germany-seafox-group-successfully-starts-operations-in-offshore-wind-industry/
[10] H. J. de Ridder and S. de Vriend. (2010). Wind Energy The Facts - Offshore Support Structures. Available: http://www.wind-energy-the-facts.org/en/part-i-technology/chapter-5-offshore/wind-farm-design-offshore/offshore-support-structures.html
[11] Det Norske Veritas (DNV), "Design of Offshore Wind Turbine Structures," in DNV-OS-J101, ed. Norway, 2013.
[12] Germanischer Lloyd GmbH, "Guideline for the Certification of Offshore Wind Turbines ", ed. Hamburg: Germanischer Lloyd, 2005.
[13] European Commission for Standardisation, "Petroleum and natural gas industries - Fixed steel offshore structures (ISO 19902:2007)," ed. Brussel, 2007.
[14] H. Braam and P. J. Eecen, "Assessment of wind and wave data measured at IJmuiden Munitiestortplaats," Rijkswaterstaat, Utrecht, 2005.
[15] T. Fischer, W. de Vries, and B. Schmidt, "Upwind Design Basis," UPWIND, Stuttgart, Germany, 2010.
[16] J. K. Vrijling, H. K. T. Kuijper, and S. van Baars, Manual Hydraulic Structures CT3330, pp. 112-115, Delft: TU Delft, 2011.
[17] S. K. Chakrabarti, Hydrodynamics of offshore structures: Mathematical theory and its applications in structures. Springer-Verlag New York Inc.,New York, 2008.
[18] J. K. Vrijling, H. K. T. Kuijper, and S. van Baars, Manual Hydraulic Structures - CT3330, pp. 136-140, Delft: TU Delft, 2011.
[19] M. Zaaijer, Introduction to wind energy, relevant to offshore wind farm design. Delft: TU Delft, 2007-2008.
[20] A. Verruijt, "Laterally loaded pile", TU Delft, March 1999. [21] M.L.A. Segeren, Support Structure Design - Offshore Wind Farm Design. Delft: VSSD, 2013. [22] H. G. M. et al, "Study of Offshore Wind Energy in the EC," Verlag Naturliche Energie, vol. 72,
1995. [23] W. E. de Vries, "Assessment of bottom-mounted support structure types with conventional
design stiffness and installation techniques for typical deep water sites " TU Delft, Delft, 2007.
[24] L. Harland and J. Vugts, "Analytic expression for the first natural period of a stepped tower," Delft: TU Delft, 1996.
[25] J. Vugts, Handbook of Bottom Founded Offshore Structures Volume 1. Delft: TU Delft, 2002. [26] J. K. Matt and H. Ivan, "Offshore Wind Cost Reduction Pathways Study," London2012.

99
List of Figures
Figure 1 Definitions of an offshore wind turbine [1] ............................................................................... 2 Figure 2 Mono Pile (left), Tripod (middle) and Tripile (right) [2] ............................................................ 2 Figure 3 Partition of different types of support structures in offshore wind in 2011 [3] ....................... 3 Figure 4 Offshore Oil- & Gas Platforms ................................................................................................... 4 Figure 5 Jacket support structure: piles are driven through the legs [6] ................................................ 6 Figure 6 Connection of pile and leg with shim plates at the top of a jacket [7] ..................................... 6 Figure 7 Offshore three legged tower (left) and full truss tower (right) [2] ........................................... 7 Figure 8 Compliant tower for offshore oil- and gas (left) [4] and offshore wind (right) [2] ................... 8 Figure 9 Suction pile in combination with a mono pile support structure [2] ........................................ 8 Figure 10 Lifting the pile (left) and hammering the pile down through the alignment tool (right) [9] .. 9 Figure 11 Mono pile/transition piece connection with other elements [10] ....................................... 10 Figure 12 Tripod and truss tower support structure with some details indicated [10] ........................ 11 Figure 13 Grout connection between pile and leg at the base of a tower structure ............................ 12 Figure 14 Support structure concepts that will be analyzed in this thesis ........................................... 13 Figure 15 Three different locations in the North Sea have been selected............................................ 19 Figure 16 Measuring stations for wind and waves of RWS, with selected locations [14] .................... 20 Figure 17 Water levels determining platform level [15] ....................................................................... 21 Figure 18 Application range of various wave theories .......................................................................... 23 Figure 19 Corrected inertia factor, to be applied for non-slender structures ...................................... 24 Figure 20 Different current distributions [1] ......................................................................................... 25 Figure 21 Thrust force on a wind turbine [19] ...................................................................................... 26 Figure 22 Wind velocities before, in and after passing the turbine [19]............................................... 26 Figure 23 Blum's method with the replaced passive soil pressure below the rotation point (left) ...... 28 Figure 24 Forces, moment diagram and embedded depth of a mono pile foundation ....................... 30 Figure 25 Design parameters for axial resistance of driven piles according to [11] ............................. 31 Figure 26 Lateral displacements of the support structure due to wave and current ........................... 32 Figure 27 Yearly average wind speed at 100 meter height [22] ........................................................... 33 Figure 28 Variation of the mean wind speed ........................................................................................ 34 Figure 29 Schematized 2-mass-spring-dashpot system ........................................................................ 35 Figure 30 Three different steady states ................................................................................................ 36 Figure 31 Frequency ranges of wind turbine (1P and 3P) and waves ................................................... 38 Figure 32 Free body diagrams of both masses ...................................................................................... 38 Figure 33 Results for 3.6 MW turbine for 20 m. (red) 40 m. (violet) and 60 m. (green) water ............ 42 Figure 34 Results for 6.0 MW turbine for 20 m. (red) 40 m. (violet) and 60 m. (green) water ............ 42 Figure 35 Results for 8.0 MW turbine for 20 m. (red) 40 m. (violet) and 60 m. (green) water ............ 42 Figure 36 Elements of the analysed tripod [23] .................................................................................... 48 Figure 37 Load situations for a tripod support structure ...................................................................... 50 Figure 38 Loads in foundation piles due to bending moment .............................................................. 51 Figure 39 Current loads on a tripod ...................................................................................................... 53 Figure 40 Fatigue damage of the main joints of the tripod support [23] ............................................. 55 Figure 41 Model of the tripod in Scia Engineer ..................................................................................... 58 Figure 42 Lumped masses for determination of natural frequencies in Scia Engineer ........................ 59 Figure 43 Connection numbers in Scia Engineer ................................................................................... 61 Figure 44 Results for 3.6 MW turbine for 20 m. (red) 40 m. (violet) and 60 m. (green) water ............ 63 Figure 45 Results for 6.0 MW turbine for 20 m. (red) 40 m. (violet) and 60 m. (green) water ............ 64 Figure 46 Results for 8.0 MW turbine for 20 m. (red) 40 m. (violet) and 60 m. (green) water ............ 64 Figure 47 Elements of the truss tower .................................................................................................. 67 Figure 48 Lay-out parameters of the truss tower [25] .......................................................................... 68 Figure 49 Load situations ...................................................................................................................... 70 Figure 50 Truss tower translated to a mono pile with an equivalent diameter [21] ............................ 71
100
Figure 51 Load distribution for load direction 1 (left) and 3 (right) ...................................................... 72 Figure 52 Numbered elements .............................................................................................................. 73 Figure 53 Modeled loads to enter into Scia Engineer ........................................................................... 74 Figure 54 Results for 6.0 MW turbine for 20 m. (red) 40 m. (violet) and 60 m. (green) water ............ 80 Figure 55 Results for 6.0 MW turbine for 20 m. (red) 40 m. (violet) and 60 m. (green) water ............ 80 Figure 56 Results for 6.0 MW turbine for 20 m. (red) 40 m. (violet) and 60 m. (green) water ............ 80 Figure 57 Cost/Power ratio per location ............................................................................................... 93 Figure 58 Wave loads ............................................................................................................................ 94 Figure 59 Results of the natural frequency calculations for the mono pile, tripod and tower............. 95
101
List of Tables
Table 1 Coefficients for S-N curves, according to the DNV offshore standard ..................................... 17 Table 2 Load factors for the ultimate limit state, according to the DNV Offshore standard ................ 17 Table 3 Resistance factors according to DNV ........................................................................................ 18 Table 4 Yield stress depends on wall thickness of the tubular section ................................................. 18 Table 5 Proposed load combinations for simplified load calculations (DNV) ....................................... 18 Table 6 Water, wind, wave and current data for selected locations .................................................... 20 Table 7 Three different offshore wind turbines have been selected .................................................... 21 Table 8 Soil properties for support structure design in homogeneous sand ........................................ 22 Table 9 Soil properties for support structure design in homogeneous clay ......................................... 22 Table 10 Coefficients needed for the Morison formula ........................................................................ 23 Table 11 Excitation frequencies for the selected wind turbines ........................................................... 37 Table 12 Parameters to determine the natural frequencies of the mono piles ................................... 40 Table 13 Results of the calculations for the mono pile support structure ............................................ 40 Table 14 First natural frequencies of the mono pile support structure ................................................ 43 Table 15 Results of the adjusted design for the 3.6 MW turbine in 40 m. water depth ...................... 44 Table 16 Location of the fixed support below seabed for different soil types ..................................... 45 Table 17 Design outputs of a mono pile foundation for 20 meter water depth and 3.6 MW turbine . 45 Table 18 Design outputs of a mono pile foundation for 40 meter water depth and 3.6 MW turbine . 45 Table 19 Design outputs of a mono pile foundation for 60 meter water depth and 3.6 MW turbine . 45 Table 20 Parameters for the mono pile support in clay at 20 m water depth ...................................... 46 Table 21 Parameters for the mono pile support in clay at 40 m water depth ...................................... 46 Table 22 Parameters for the mono pile support in clay at 60 m water depth ...................................... 46 Table 23 Pre-determined design parameters for the tripod ................................................................. 49 Table 24 Parameters to determine the natural frequencies of the tripods .......................................... 57 Table 25 First natural frequencies of the tripod support structure ...................................................... 58 Table 26 Results of the calculations for the tripod support structure .................................................. 60 Table 27 Results of the deformations calculated in Scia Engineer ....................................................... 62 Table 28 Results of the natural frequency calculations in Scia Engineer .............................................. 62 Table 29 Results for the tripod support structure and a 3.6 MW turbine in clay ................................. 64 Table 30 Results for the tripod support structure and a 3.6 MW turbine in clay ................................. 65 Table 31 Results for the tripod support structure and a 3.6 MW turbine in clay ................................. 65 Table 32 Results of the dynamic calculations with Scia for a 3.6 MW turbine in clay .......................... 65 Table 33 Geometry of the truss tower, dependent on location ........................................................... 69 Table 34 Equivalent diameters elements .............................................................................................. 71 Table 35 Results of the calculations for 3.6 and 8.0 MW turbine for load direction (LD) 1 and 3 ........ 72 Table 36 Real and replaced levels of wave and current loads .............................................................. 74 Table 37 Results of the static analysis of the tower support for wind turbines in 20 m. water depth. 76 Table 38 Results of the static analysis of the tower support for wind turbines in 40 m. water depth. 76 Table 39 Results of the static analysis of the tower support for wind turbines in 60 m. water depth. 77 Table 40 Dimensions of the foundation piles (pile length is given in meters below seabed) ............... 77 Table 41 Fatigue analysis for towers in 20 meter water depth ............................................................ 78 Table 42 Fatigue analysis for towers in 40 meter water depth ............................................................ 78 Table 43 Fatigue analysis for towers in 60 meter water depth ............................................................ 79 Table 44 Results of the dynamic analysis of the tower support structure ........................................... 79 Table 45 Pile dimensions for 3.6 MW turbine and different water depths in homogeneous clay ....... 81 Table 46 Results of the natural frequencies for 3.6 MW turbines in sand and clay ............................. 81 Table 47 Heavy Lift Vessels with lift capacity, lift radius and day rate ................................................. 84 Table 48 Estimated day rates for transport and installation equipment .............................................. 85 Table 49 Number of required barges for offshore transportation ....................................................... 85 Table 50 Installation sequence and estimated times for a wind farm of 50 mono piles ...................... 86

102
Table 51 Installation sequence and estimated time for a wind farm of 50 tripods .............................. 86 Table 52 Installation sequence and estimated time for a wind farm of 50 towers .............................. 87 Table 53 Cost analysis for the mono pile support structure ................................................................. 88 Table 54 Results of the cost analysis for a wind farm of 50 mono piles ............................................... 88 Table 55 Cost analysis for the tripod support structure ....................................................................... 89 Table 56 Results of the cost analysis for a wind farm of 50 tripods ..................................................... 90 Table 57 Cost analysis for the tower support structure ........................................................................ 90 Table 58 Results of the cost analysis for a wind farm of 50 towers ...................................................... 91

103
Appendix 1 Manual Spreadsheet Mono Pile M
The spreadsheet ‘Mono Pile’ was made to design a mono pile foundation and is included in Appendix 4. The basic assumptions, theories and formulas are described in chapter 3 and 4. Below the design inputs and design outputs are described:
1.1 Design Input The design inputs are given in red and are all placed in the left column, except cell G32, which is the location xm of the maximum bending moment. The red cells should all be filled.
Limit state and Load factors: Select load state: This determines the load factors for permanent and environmental
loads (Table 2) Select load combination: With this input the combination of environmental loads is selected
(Table 5) Steel yield stress: The steel yield stress depends on the wall thickness of the mono pile
(Table 4). The load factors and resistance factor are automatically given. These should not be entered. The permanent load factors are applied to the masses of the turbine, tower, column, braces and legs and foundation piles. The environmental load factors are applied to the wind, wave and current loads. The resistance factors are applied to the steel yield strength. The resistance factor is also applied to the equivalent stress range for fatigue analysis as discussed in 2.4. Furthermore, the values of the density of water and air and the gravity acceleration should be entered. Pile parameters: The values of the pile parameters should be filled in and changed until all checks in ULS, SLS and FLS are satisfied.
• Embedded depth do Blum’s method is used to determine the horizontal pile capacity. • Diameter pile D The pile diameter is constant over the pile length. • Wall thickness tw The wall thickness for the critical cross section should be determined,
which is located at a depth xm below seabed.
Site specific parameters: These parameters mainly determine the platform level of the transition piece.
Turbine characteristics: These parameters will be supplied by the turbine manufacturer.
Soil parameters: First of all, the type of soil should be selected: sand or clay. This separation is made to determine the influence of the soil stiffness on the support structure design. All soil parameters should be filled in.
Wave parameters: The wave parameters should be filled in according to the Morison formula for slender non-breaking waves (chapter 3.4 Extreme wave loads). Because there are different load states to be taken into account (selected above), the factors should be entered for both 50yr and 5yr return waves. In case of breaking waves, which is the case if the entered ratio between wave height and breaking wave height exceeds 0.84, the drag coefficient C*d should be entered.
Current parameters: The current parameters should also be entered for a 50yr and 5yr return current.

104
Wind parameters: The reference height z is automatically set at 90.55 meters, as this is the height at which the measurements from Rijkswaterstaat [14] are taken. The reference height should correspond with the wind speeds.
Fatigue parameters: The cyclic period of the fatigue loads can be entered. The fatigue loads are caused by mean wind and wave loads, which requires that the cyclically varying mean wind and wave load correspond with the entered cyclic period. In this research, only a period of 10 s. is taken into account because this data is available.
Depth of maximum moment: To determine the depth of the maximum moment, the third order equation of Blum should be solved as described in chapter 4.1.1. Therefore, cell H34 should be selected and the ‘Goal Seeker’ under ‘What if Analyses’ in the tab ‘Data’ should be used to calculate this depth. The set value of cell G34 should be entered, which can be obtained by changing cell G33.
1.2 Design Output The design outputs are automatically calculated and given in the middle column.
Checks: The basic ULS, SLS and FLS checks are calculated here. If the check is satisfactory, ‘accepted’ is displayed, if not, ‘not accepted’ is displayed and the design should be changed by changing the pile parameters.
Ultimate Limit State: • Horizontal equilibrium: the sum of the horizontal forces should stay below the horizontal
resistance. • Vertical equilibrium: the sum of the vertical forces should stay below the vertical resistance • The shaft bearing should stay below its limiting value according to DNV [11]. • The end bearing should stay below its limiting value according to DNV [11]. • Yield check: the stress due to bending and axial loadings should stay below the yield stress,
which results in a yield check that should be < 1.0 • Buckling check: the buckling capacity should be higher than the axial loads and bending
moment occurring, resulting in a buckling check that should be <1.0 • D/t ratio of the pile should be below 120 according to DNV [11].
Fatigue Limit State:
• The number of fatigue cycles during the lifetime should stay below the number of cycles up to fatigue failure. The number of cycles occurring is based on a lifetime of 25 years.
Serviceability Limit State: • The lateral displacement at seabed level should stay below 0.03 * Dpile according to DNV [11]. • The rotation at seabed should stay below 0.50 meters.
Pile parameters: • The embedded depth is calculated as 1.2 * do according to the method of Blum. This is the
actual design pile length and is taken into account for weight calculations. • The top of the mono pile is considered to be at MSL, where the transition piece is connected.
The top of the transition piece is located at the platform level (Chapter 3.1). • The hub height is calculated using the level of the top of the transition piece plus the tower
length.

105
• For the calculation of the section modulus and moment of inertia of the tower, an average wall thickness of 75 mm is assumed.
• The resistance force C is calculated according to Blum, which the force due to the passive soil wedges at the pile bottom.
• The maximum moment below the seabed can be calculated using the depth xm described above.
Axial loads: • For weight calculations of the mono pile, 2/3 of the wall thickness in the critical cross section
is used as an average value. • The weight of the transition piece is calculated with the assumption that the average
diameter is the same as for the mono pile. The grout layer is neglected. The wall thickness is assumed to be 2/3 of the wall thickness in the critical cross section of the mono pile.
Wave loads: The selected load state determines which factors (50 or 5yr) are taken into account in the calculations done in the spreadsheet. These values are depicted as governing values. In case of breaking waves the inertia term will be 0 and the drag force will be calculated with the entered value of C*d.
Current loads: The static and dynamic drag coefficients are set at 1.00 and 0.25.
Wind loads: • To calculate the drag and thrust forces on the wind turbine, the wind speed is recalculated to
half the height of the tower for the drag force. The cut out speed of the wind turbine is used to calculate the thrust force.
• The thrust force is calculated using an induction factor. As discussed in chapter 3.6, the maximum thrust force is generated with an induction factor of 0.5. This value is taken into account in this research.
Deflections: The schematized embedded depth is located at 3.5 times the pile diameter below seabed. The deflection can then be calculated with formulas according to Figure 25 in chapter 4.1.3.
1.3 Calculations The calculations are automatically performed in the column at the right.
Soil resistance: • The horizontal soil resistance is calculated using the method of Blum. • The vertical pile resistance is calculated according to DNV.
ULS checks:
• To perform the ULS check for yielding, both the axial and bending stress are calculated. The axial force in the critical cross section at xm below seabed is calculated using the weight of the part of the mono pile above this point and the weight of the transition piece and the turbine. The bending moment was already calculated with Blum.
• All parameters for the buckling check are calculated according to the formulas given in chapter 2.1.

106
Fatigue: • The fatigue calculations are based on the formulas given in chapter 2.3. • For fatigue loads the main wind speed and main wave height are taken into account with a
reference period of 10 s. This period can be adjusted but should correspond to the wind and wave parameters.
• The fatigue design is based on a lifetime of 25 years. Parameters for dynamic calculations: The masses and stiffness of the 2 mass spring dashpot system are calculated in this section. These formulas in which these parameters are used, are given in chapter 4.2.3.
107
Appendix 2 Manual Spreadsheet Tripod M
The spreadsheet ‘Tripod’ was made to determine the basic dimensions of a tripod and is included in Appendix 5. The basic assumptions, theories and formulas are described in chapter 3 and chapter 5. Below the inputs and output are described, as well as some important remarks concerning the calculations:
2.1 Design Input The design inputs are given in red and are all placed in the left column, except cell G53, which is the location xm of the maximum bending moment.
Limit state and Load factors: The limit states and load factors should be entered as described in Appendix 1.
Tripod parameters: The parameters below should be entered and changed until all the checks in ULS, SLS and FLS are satisfied:
• Base width R • Embedded depth foundation piles d0
• Diameter foundation pile Dpile • Wall thickness foundation piles tpile
• Diameter column Dcolumn • Wall thickness column tcolumn • Diameter legs Dlegs • Diameter braces Dbraces
For the other design inputs such as site specific parameters, turbine characteristics, soil parameters and wave, current, wind and fatigue parameters is referred to Appendix 1.
2.2 Design Output The design outputs are automatically calculated and given in the middle column.
Checks: The basic ULS, SLS and FLS checks are calculated here. If the check is satisfactory, ‘accepted’ is displayed, if not, ‘not accepted’ is displayed and the design should be changed.
Foundation piles • Horizontal equilibrium: the sum of the horizontal forces should stay below the horizontal
resistance. • Compression check: the occurring compression force in the foundation piles should stay
below the compression resistance of the piles. • Tension check: the occurring tension force in the foundation piles should stay below the
tension resistance of the piles. • The shaft bearing should stay below its limiting value according to DNV [11]. • The end bearing should stay below its limiting value according to DNV [11]. • The number of fatigue cycles during the lifetime should stay below the number of cycles up
to fatigue failure. The number of cycles occurring is based on a lifetime of 25 years. • Yield check: the stress due to bending and axial loadings should stay below the yield stress,
which results in a yield check that should be < 1.0 • D/t ratio of the pile should be below 120 according to DNV [11].
108
Column • The number of fatigue cycles during the lifetime should stay below the number of cycles up
to fatigue failure. The number of cycles occurring is based on a lifetime of 25 years. • Yield check: the stress due to bending and axial loadings should stay below the yield stress,
which results in a yield check that should be < 1.0 • Buckling check: the buckling capacity should be higher than the axial loads and bending
moment occurring, resulting in a buckling check that should be <1.0 • D/t ratio of the column should be below 120 according to DNV [11].
Braces and legs
• The number of fatigue cycles during the lifetime should stay below the number of cycles up to fatigue failure. The number of cycles occurring is based on a lifetime of 25 years.
• Yield check: the stress due to axial loading should stay below the yield stress, which results in a yield check that should be < 1.0
• Buckling check: the buckling capacity should be higher than the axial loads occurring, resulting in a buckling check that should be <1.0
Serviceability Limit State: • The lateral displacement at seabed level should stay below 0.03 * Dpile according to DNV [11].
Pile parameters: • The embedded depth is calculated as 1.2 * do (Blum). This is the actual design pile length and
is taken into account for weight calculations. • The pile length is enlarged with the assumed length of the pile sleeves, which is
approximated as 2 times the pile diameter. • For the calculation of the section modulus and moment of inertia in the critical cross section
of the foundation piles and the column, the entered wall thickness in the critical cross section is used (tpile and tcolumn).
• The length of the column is determined from the distance between the brace-column level up to platform level.
• The hub height is calculated using the level of the top of the transition piece plus the tower length.
• For the calculation of the section modulus and moment of inertia of the tower, an average wall thickness of 75 mm is assumed.
• The resistance force C is calculated according to Blum, which the force due to the replaced passive soil wedges at the pile bottom.
• The maximum moment below the seabed can be calculated using the depth xm described above.
Brace and leg parameters: • The D/t ratio is fixed for both the braces and legs at 50 to reduce the number of possible
designs. This value might be changed. • The brace angle is fixed at 10 ° for all water depths (20, 40 and 60 m.) but might be changed
as well. • The leg angle is 50 ° for 20 m water depth and 60 ° for 40 and 60 m water depth, but might
be changed as well. • The length of the braces and legs is determined by the angle with the horizontal axis and the
base width. • The braces and legs are considered to be prismatic tubular sections with a constant wall
thickness.
109
Axial loads: • For weight calculations, 2/3 of the wall thickness in the critical cross section is used as an
average value. This is assumed for the foundation piles and the column. The braces and legs have a constant wall thickness in this calculation.
• First of all, the governing tension and compression forces in the foundation piles are calculated using the formulas presented in chapter 5.3. With the forces in the foundation piles, the forces in the braces and legs are calculated. This is both done for a tension and compression loaded brace or leg.
For wave and wind loads is referred to Appendix 1.
Current loads: • The static and dynamic drag coefficients are set at 1.00 and 0.25. • The current loads are calculated according to Morison. The current load is subdivided over
three parts of the tripod structure as can be seen in Figure 38. Therefore, different current velocities at different water depths are calculated. Furthermore, the total vertical surface area of the braces and legs is calculated to determine the current load on these members.
Deflections: The deflection are calculated with Scia engineer using an embedded depth for the foundation piles of 3.5*D. At seabed level, the rotations are fixed and translations are only possible in x and y direction. At the schematized fixed support all rotations and translations are fixed.
2.3 Calculations The calculations are automatically performed in the column at the right.
Soil resistance: • The horizontal soil resistance is calculated using the method of Blum. • The vertical pile resistance is calculated according to DNV.
ULS checks: Column:
• To perform the ULS check for yielding, both the axial and bending stress are calculated. The critical cross section is located just above the main joint. For the axial force, only the part of the column above the main joint is taken into account. The bending moment is also calculated at the main joint, which results in the bending stress.
• All parameters for the buckling check are calculated according to the formulas given in chapter 2.1. For the critical Euler buckling load, a length of 2 times the length from main joint up to hub height is used. This is a schematized one sided fixed beam.
Braces and legs:
• The maximum axial force of the compression and tension loaded brace and leg is taken into account for the yield and buckling check.
• No bending moments are taken into account in the braces and legs. • The buckling check is performed with the formulas given in chapter 2.1. The critical Euler
buckling load is equal to the system length, because it is schematized as a hinged support on both sides.

110
Foundation piles: • Within the foundation piles the yield check is performed in the critical cross section located
at a depth xm below seabed. Buckling is not taken into account. Fatigue:
• The fatigue calculations are based on the formulas given in chapter 2.3. • For fatigue loads the main wind speed and main wave height are taken into account with a
reference period of 10 s. This period can be adjusted but should correspond to the wind and wave parameters.
• The fatigue design is based on a lifetime of 25 years. • The fatigue calculations are made for three points: In the legs at the connection with the
main joint, in the column at the connection with the braces and the legs and in the foundation piles at the cross section where the maximum bending moment occurs.
• A Stress Concentration Factor of 3 is taken into account for the local joint geometries of the brace-leg-column connection and for the brace-leg-pile sleeve connection. For the foundation piles no SCF is taken into account, because are no local joint geometries which could lead to stress accumulation.
Parameters for dynamic calculations: The masses and stiffness of the 2 mass spring dashpot system are calculated in this section. The formula in which these parameters are used, are given in chapter 4.2.3.
111
Appendix 3 Manual Spreadsheet Tower S
The spreadsheet ‘Truss tower’ was made to determine the loads and basic dimensions of the foundation piles of the truss tower and is included in Appendix 6. The basic assumptions, theories and formulas are described in chapter 6. Below the inputs and output are described, as well as some important remarks concerning the calculations.
3.1 Design Input The design inputs are given in red and are almost all placed in the left column. The exceptions are:
• Cell H28: this is the location xm of the maximum bending moment. • The diameters of the legs and braces. These are derived with Scia Engineer and used to
determine the wave and current loads in the spreadsheet. • The weight of the truss tower. This is also derived with Scia Engineer and used to determine
the size of the foundation piles.
Limit state and Load factors: The limit states and load factors should be entered as described in Appendix 1.
Truss tower parameters: The parameters below should be entered and changed until all the checks in ULS, SLS and FLS are satisfied:
• Top width bt • Number of panels • Embedded depth foundation piles d0
• Diameter foundation pile Dpile • Wall thickness foundation piles tpile
For the other design inputs such as site specific parameters, turbine characteristics, soil parameters and wave, current, wind and fatigue parameters is referred to Appendix 1.
3.2 Design Output The design outputs are automatically calculated and given in the middle column. The outputs given in green in the column at the right side are the parameters which have to be used to design the tower in Scia Engineer. This mainly concerns the environmental loads on the tower structure.
Checks: The basic ULS, SLS and FLS checks are calculated here. If the check is satisfactory, ‘accepted’ is displayed, if not, ‘not accepted’ is displayed and the design should be changed. For the elaboration on the performed checks is referred to appendix 2.2.
Pile parameters: For the pile parameters is also referred to appendix 2.2. Brace and leg parameters:
• The leg angle is fixed at 6 ° for all water depths (20, 40 and 60 m.) but might be changed as well to optimize the design.
• The brace angle is calculated with the number of panels and the top width. This angle with the horizontal and the angle with the leg have to satisfy the minimum of 30°.
• The braces and legs are considered to be prismatic tubular sections with a constant wall thickness.
112
• The points of action of the wave and current loads are calculated to quickly see in which joint at the truss tower the forces have to be replaced. This was discussed in section 6.2.3. For site 1 (20 meter water depth), the current load is placed at the joint of horizontal 1 in Figure 52. The wave load is replaced to the joint of horizontal 3. For site 2 the exactly the same joints have been selected. For site 3, the current loads is replaced to horizontal 2 and the wave load is replaced to horizontal 4. The results of the replacement are shown in Table 36.
Axial loads: • First of all, the governing tension and compression forces in the foundation piles are
calculated using the formulas presented in chapter 6.2. With the loads on the foundation piles, the diameter and pile length can be calculated.
Wave loads: • The wave loads are calculated using the Morison formula and an equivalent diameter of the
tower structure. The equivalent diameters are calculated with the diameters from the calculations in Scia Engineer.
Current loads: • The static and dynamic drag coefficients are set at 1.00 and 0.25. • The current loads are calculated according to Morison with the same equivalent diameter.
The diameters were calculated in Scia Engineer.
Deflections: The deflection are calculated with Scia engineer using an embedded depth for the foundation piles of 3,5*D. At seabed level, the rotations are fixed and translations are only possible in x and y direction. At the schematized fixed support all rotations and translations are fixed. The maximum deflection of joint K1 to K4 from Scia Engineer should be entered under ‘checks’ and compared with the requirements from DNV.
3.3 Calculations The calculations are automatically performed in the column at the right. For soil resistance and the calculations on the foundation piles is referred to appendix 3.3.
Iteration: Together with Scia, the dimensions of the truss tower are determined. Some iteration steps have to be performed, considering the following parameters:
• Coordinates of the joints, these are fixed from the first moment and used in Scia to make the truss tower model.
• An estimation of the diameters of the members should be entered in the spreadsheet to calculate the wave and current load with the spreadsheet. These loads can be found in the column at the right and have to be entered in the model in Scia.
• Diameters and wall thickness of the optimized members are calculated in Scia for the previously entered wave and current loads. These diameters and wall thicknesses have to be filled into the spreadsheet again under ‘results’. This will determine the wave and current load again.
• The wave and current load should be entered in Scia again and the dimensions will be adjusted by the autodesign function. After this, the difference between the wave and current load in Scia and the adjusted wave and current load in the spreadsheet has to be small enough. If not, another optimization step should be performed.
• After the last step, the weight of the tower structure has to be adjusted in the Excel, which leads to the design of the foundation piles in the spreadsheet. All ULS checks should be accepted.
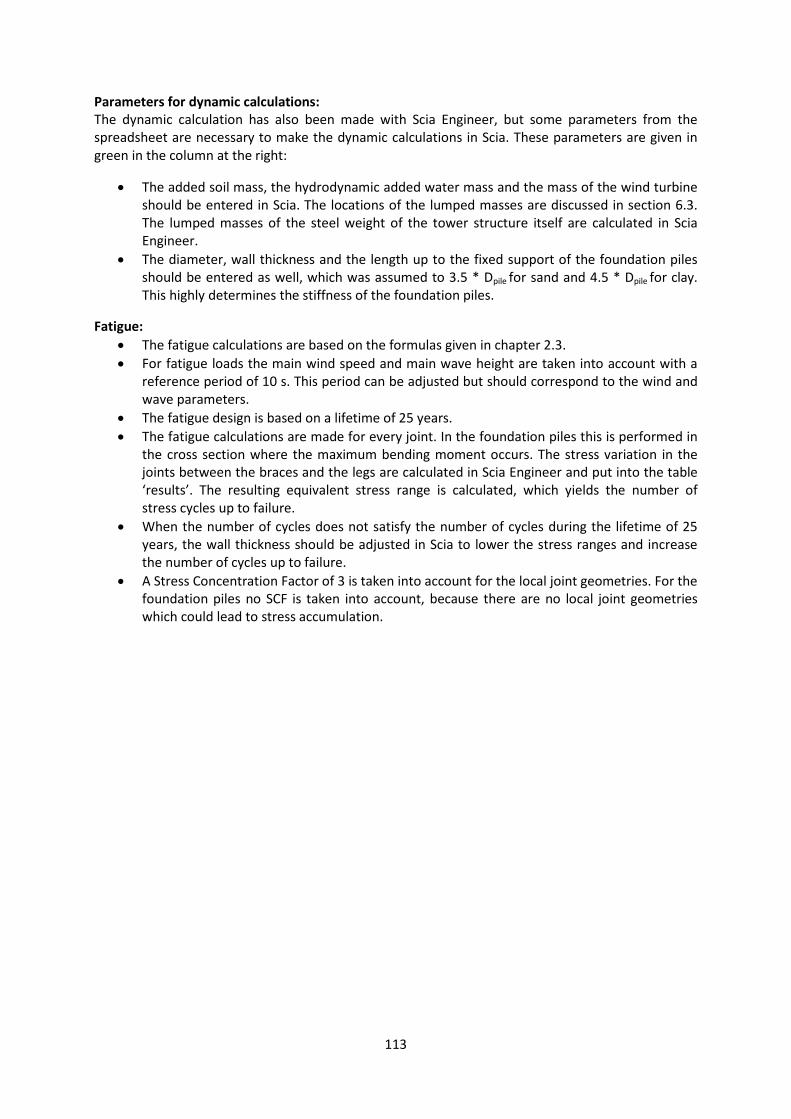
113
Parameters for dynamic calculations: The dynamic calculation has also been made with Scia Engineer, but some parameters from the spreadsheet are necessary to make the dynamic calculations in Scia. These parameters are given in green in the column at the right:
• The added soil mass, the hydrodynamic added water mass and the mass of the wind turbine should be entered in Scia. The locations of the lumped masses are discussed in section 6.3. The lumped masses of the steel weight of the tower structure itself are calculated in Scia Engineer.
• The diameter, wall thickness and the length up to the fixed support of the foundation piles should be entered as well, which was assumed to 3.5 * Dpile for sand and 4.5 * Dpile for clay. This highly determines the stiffness of the foundation piles.
Fatigue: • The fatigue calculations are based on the formulas given in chapter 2.3. • For fatigue loads the main wind speed and main wave height are taken into account with a
reference period of 10 s. This period can be adjusted but should correspond to the wind and wave parameters.
• The fatigue design is based on a lifetime of 25 years. • The fatigue calculations are made for every joint. In the foundation piles this is performed in
the cross section where the maximum bending moment occurs. The stress variation in the joints between the braces and the legs are calculated in Scia Engineer and put into the table ‘results’. The resulting equivalent stress range is calculated, which yields the number of stress cycles up to failure.
• When the number of cycles does not satisfy the number of cycles during the lifetime of 25 years, the wall thickness should be adjusted in Scia to lower the stress ranges and increase the number of cycles up to failure.
• A Stress Concentration Factor of 3 is taken into account for the local joint geometries. For the foundation piles no SCF is taken into account, because there are no local joint geometries which could lead to stress accumulation.
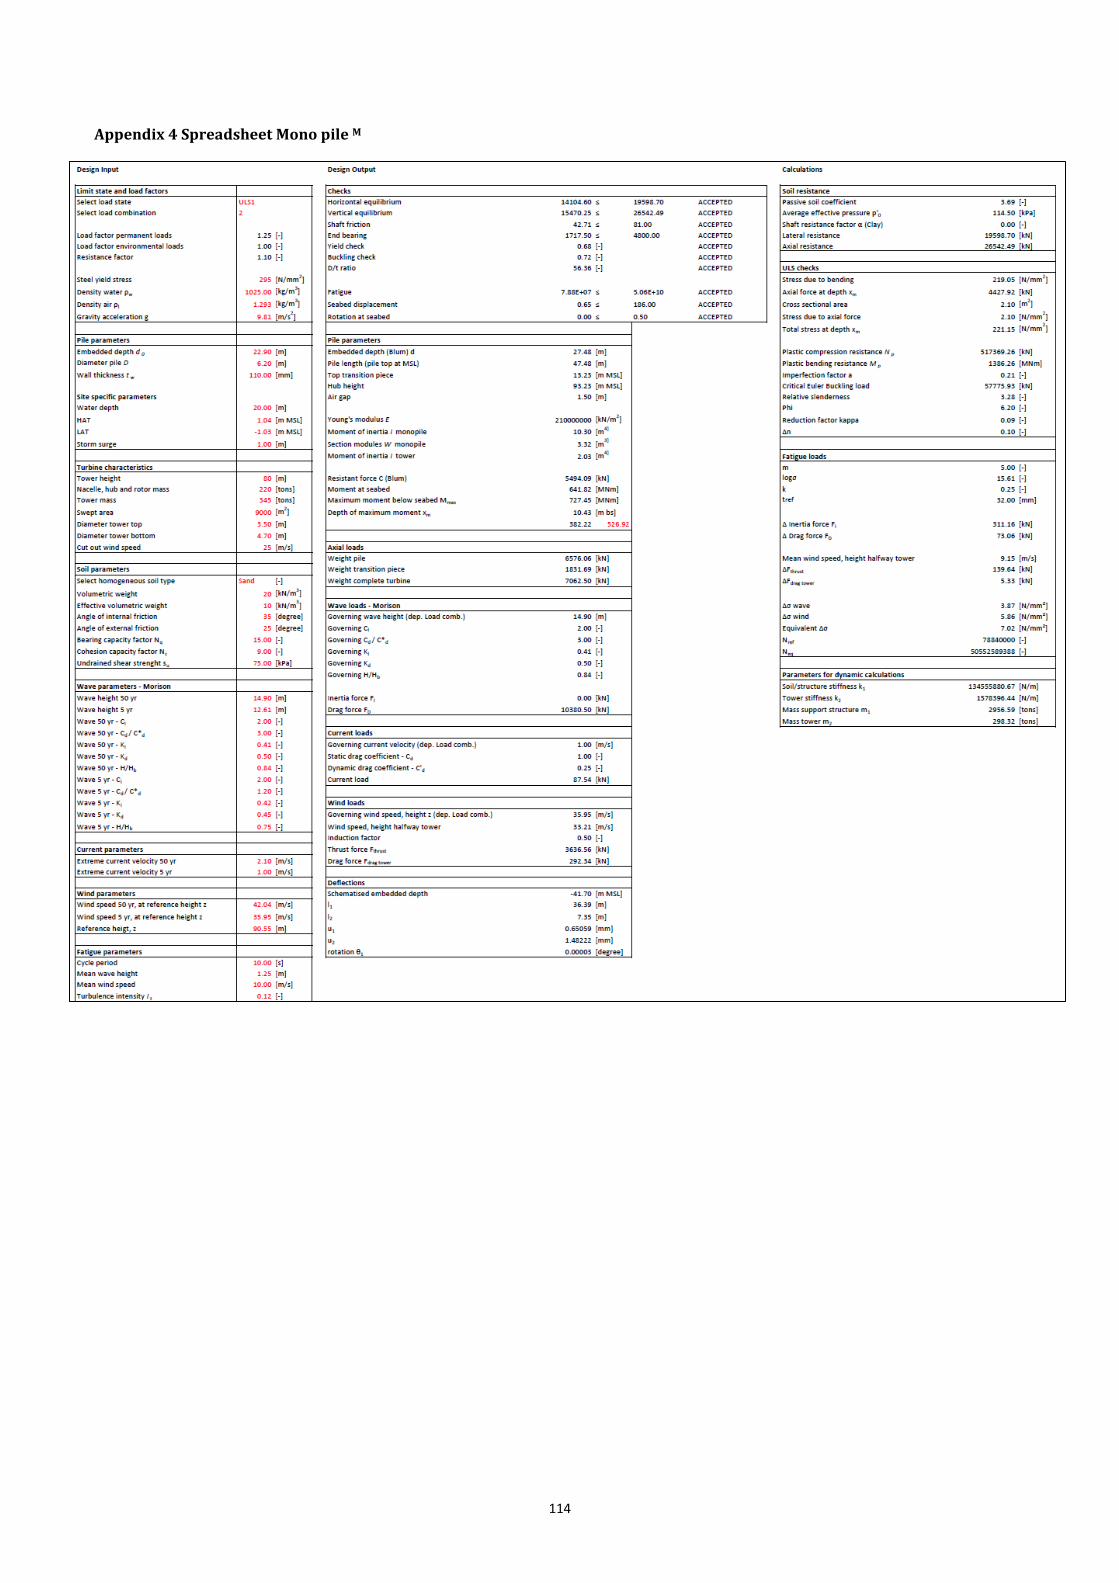
114
Appendix 4 Spreadsheet Mono pile M
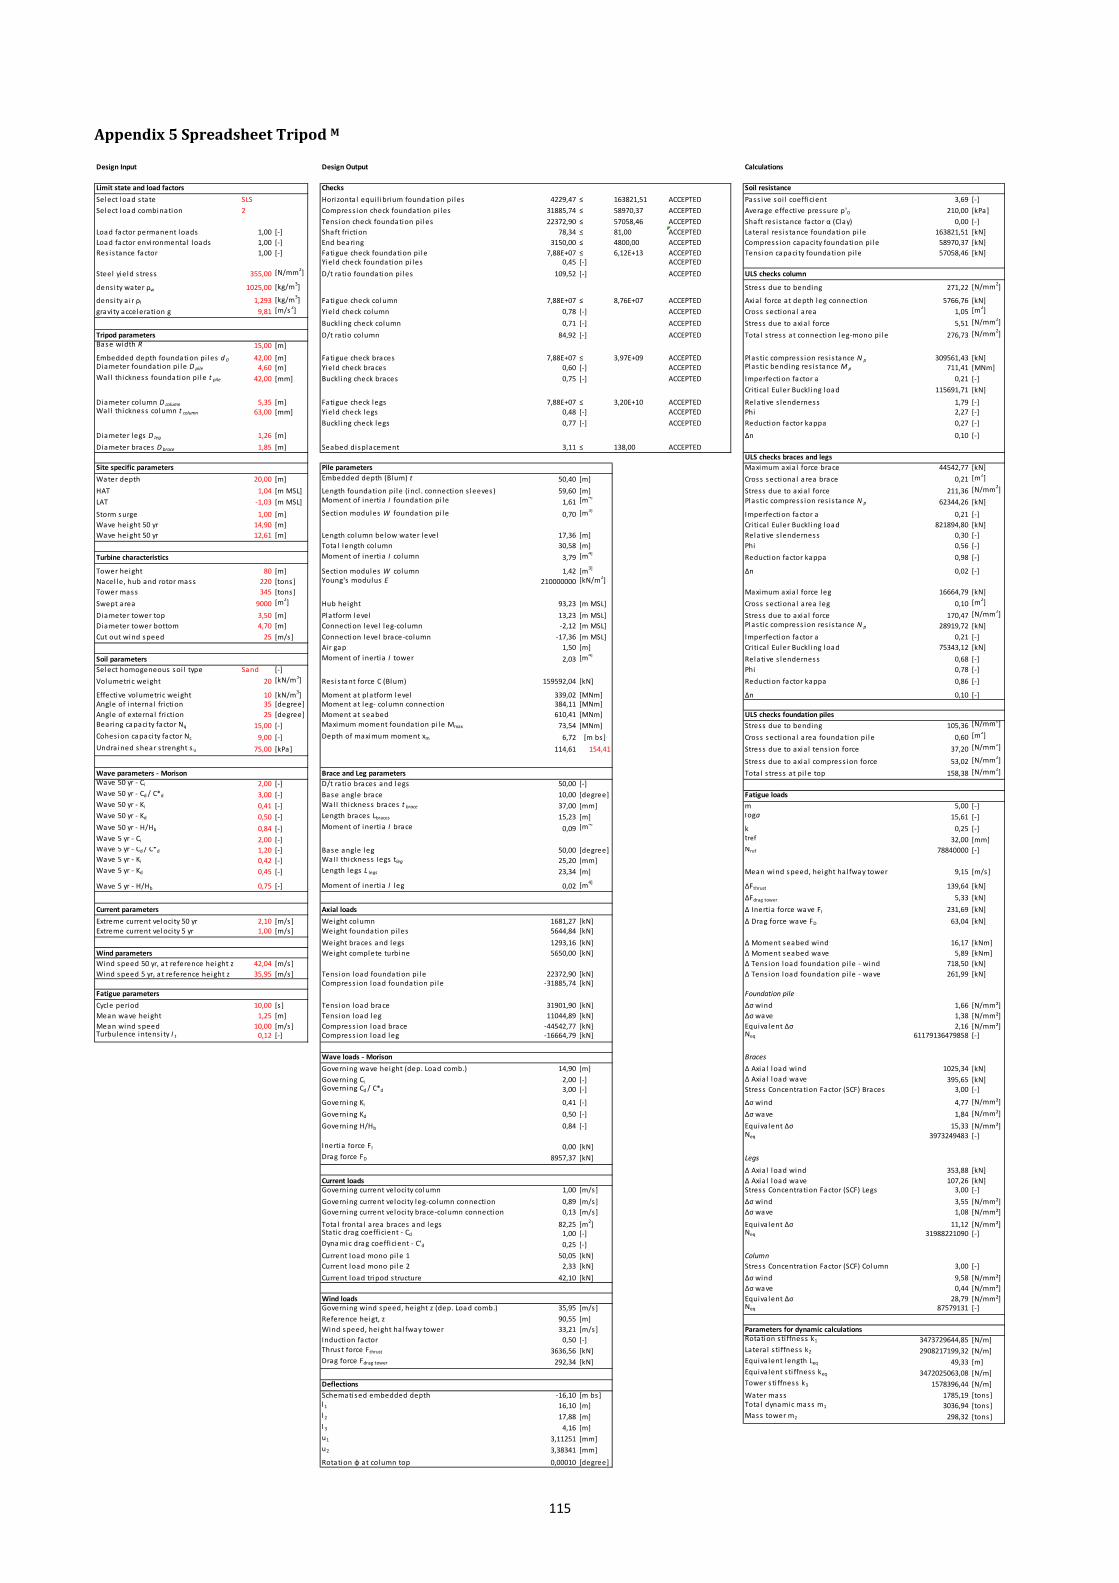
115
Appendix 5 Spreadsheet Tripod M
Design Input Design Output Calculations
Limit state and load factors Checks Soil resistanceSelect load s tate SLS Horizonta l equi l ibrium foundation pi les 4229,47 ≤ 163821,51 ACCEPTED Pass ive soi l coefficient 3,69 [-]Select load combination 2 Compress ion check foundation pi les 31885,74 ≤ 58970,37 ACCEPTED Average effective pressure p'0 210,00 [kPa]
Tens ion check foundation pi les 22372,90 ≤ 57058,46 ACCEPTED Shaft res is tance factor α (Clay) 0,00 [-]Load factor permanent loads 1,00 [-] Shaft friction 78,34 ≤ 81,00 ACCEPTED Latera l res is tance foundation pi le 163821,51 [kN]Load factor envi ronmenta l loads 1,00 [-] End bearing 3150,00 ≤ 4800,00 ACCEPTED Compress ion capaci ty foundation pi le 58970,37 [kN]Res is tance factor 1,00 [-] Fatigue check foundation pi le 7,88E+07 ≤ 6,12E+13 ACCEPTED Tens ion capaci ty foundation pi le 57058,46 [kN]
Yield check foundation pi les 0,45 [-] ACCEPTEDSteel yield s tress 355,00 [N/mm2] D/t ratio foundation pi les 109,52 [-] ACCEPTED ULS checks column
dens i ty water ρw 1025,00 [kg/m3] Stress due to bending 271,22 [N/mm2]
dens i ty a i r ρl 1,293 [kg/m3] Fatigue check column 7,88E+07 ≤ 8,76E+07 ACCEPTED Axia l force at depth leg connection 5766,76 [kN]gravi ty acceleration g 9,81 [m/s 2] Yield check column 0,78 [-] ACCEPTED Cross sectional area 1,05 [m2]
Buckl ing check column 0,71 [-] ACCEPTED Stress due to axia l force 5,51 [N/mm2]
Tripod parameters D/t ratio column 84,92 [-] ACCEPTED Tota l s tress at connection leg-mono pi le 276,73 [N/mm2]Base width R 15,00 [m]
Embedded depth foundation pi les d 0 42,00 [m] Fatigue check braces 7,88E+07 ≤ 3,97E+09 ACCEPTED Plastic compress ion res is tance N p 309561,43 [kN]Diameter foundation pi le D pile 4,60 [m] Yield check braces 0,60 [-] ACCEPTED Plastic bending res is tance M p 711,41 [MNm]Wal l thickness foundation pi le t pile 42,00 [mm] Buckl ing check braces 0,75 [-] ACCEPTED Imperfection factor a 0,21 [-]
Cri tica l Euler Buckl ing load 115691,71 [kN]
Diameter column D column 5,35 [m] Fatigue check legs 7,88E+07 ≤ 3,20E+10 ACCEPTED Relative s lenderness 1,79 [-]Wal l thickness column t column 63,00 [mm] Yield check legs 0,48 [-] ACCEPTED Phi 2,27 [-]
Buckl ing check legs 0,77 [-] ACCEPTED Reduction factor kappa 0,27 [-]
Diameter legs D leg 1,26 [m] ∆n 0,10 [-]Diameter braces D brace 1,85 [m] Seabed displacement 3,11 ≤ 138,00 ACCEPTED
ULS checks braces and legsSite specific parameters Pile parameters Maximum axia l force brace 44542,77 [kN]Water depth 20,00 [m] Embedded depth (Blum) t 50,40 [m] Cross sectional area brace 0,21 [m2]
HAT 1,04 [m MSL] Length foundation pi le (incl . connection s leeves) 59,60 [m] Stress due to axia l force 211,36 [N/mm2]
LAT -1,03 [m MSL] Moment of inertia I foundation pi le 1,61 [m4] Plastic compress ion res is tance N p 62344,26 [kN]
Storm surge 1,00 [m] Section modules W foundation pi le 0,70 [m3]Imperfection factor a 0,21 [-]
Wave height 50 yr 14,90 [m] Cri tica l Euler Buckl ing load 821894,80 [kN]Wave height 50 yr 12,61 [m] Length column below water level 17,36 [m] Relative s lenderness 0,30 [-]
Tota l length column 30,58 [m] Phi 0,56 [-]Turbine characteristics Moment of inertia I column 3,79 [m4]
Reduction factor kappa 0,98 [-]
Tower height 80 [m] Section modules W column 1,42 [m3] ∆n 0,02 [-]Nacel le, hub and rotor mass 220 [tons] Young's modulus E 210000000 [kN/m2]Tower mass 345 [tons] Maximum axia l force leg 16664,79 [kN]Swept area 9000 [m2] Hub height 93,23 [m MSL] Cross sectional area leg 0,10 [m2]
Diameter tower top 3,50 [m] Platform level 13,23 [m MSL] Stress due to axia l force 170,47 [N/mm2]Diameter tower bottom 4,70 [m] Connection level leg-column -2,12 [m MSL] Plastic compress ion res is tance N p 28919,72 [kN]Cut out wind speed 25 [m/s] Connection level brace-column -17,36 [m MSL] Imperfection factor a 0,21 [-]
Ai r gap 1,50 [m] Cri tica l Euler Buckl ing load 75343,12 [kN]Soil parameters Moment of inertia I tower 2,03 [m4]
Relative s lenderness 0,68 [-]Select homogeneous soi l type Sand [-] Phi 0,78 [-]Volumetric weight 20 [kN/m3] Res is tant force C (Blum) 159592,04 [kN] Reduction factor kappa 0,86 [-]
Effective volumetric weight 10 [kN/m3] Moment at platform level 339,02 [MNm] ∆n 0,10 [-]Angle of internal friction 35 [degree] Moment at leg- column connection 384,11 [MNm]Angle of external friction 25 [degree] Moment at seabed 610,41 [MNm] ULS checks foundation pilesBearing capaci ty factor Nq 15,00 [-] Maximum moment foundation pi le Mmax 73,54 [MNm] Stress due to bending 105,36 [N/mm2]
Cohes ion capaci ty factor Nc 9,00 [-] Depth of maximum moment xm 6,72 [m bs] Cross sectional area foundation pi le 0,60 [m2]
Undra ined shear s trenght s u 75,00 [kPa] 114,61 154,41 Stress due to axia l tens ion force 37,20 [N/mm2]
Stress due to axia l compress ion force 53,02 [N/mm2]
Wave parameters - Morison Brace and Leg parameters Tota l s tress at pi le top 158,38 [N/mm2]Wave 50 yr - Ci 2,00 [-] D/t ratio braces and legs 50,00 [-]Wave 50 yr - Cd / C*d 3,00 [-] Base angle brace 10,00 [degree] Fatigue loadsWave 50 yr - Ki 0,41 [-] Wal l thickness braces t brace 37,00 [mm] m 5,00 [-]Wave 50 yr - Kd 0,50 [-] Length braces Lbraces 15,23 [m] loga 15,61 [-]Wave 50 yr - H/Hb 0,84 [-] Moment of inertia I brace 0,09 [m4]
k 0,25 [-]Wave 5 yr - Ci 2,00 [-] tref 32,00 [mm]Wave 5 yr - Cd / C*d 1,20 [-] Base angle leg 50,00 [degree] Nref 78840000 [-]Wave 5 yr - Ki 0,42 [-] Wal l thickness legs tleg 25,20 [mm]Wave 5 yr - Kd 0,45 [-] Length legs L legs 23,34 [m] Mean wind speed, height ha l fway tower 9,15 [m/s]
Wave 5 yr - H/Hb 0,75 [-] Moment of inertia I leg 0,02 [m4] ΔFthrust 139,64 [kN]ΔFdrag tower 5,33 [kN]
Current parameters Axial loads Δ Inertia force wave FI 231,69 [kN]Extreme current veloci ty 50 yr 2,10 [m/s] Weight column 1681,27 [kN] Δ Drag force wave FD 63,04 [kN]Extreme current veloci ty 5 yr 1,00 [m/s] Weight foundation pi les 5644,84 [kN]
Weight braces and legs 1293,16 [kN] Δ Moment seabed wind 16,17 [kNm]Wind parameters Weight complete turbine 5650,00 [kN] Δ Moment seabed wave 5,89 [kNm]Wind speed 50 yr, at reference height z 42,04 [m/s] Δ Tens ion load foundation pi le - wind 718,50 [kN]Wind speed 5 yr, at reference height z 35,95 [m/s] Tens ion load foundation pi le 22372,90 [kN] Δ Tens ion load foundation pi le - wave 261,99 [kN]
Compress ion load foundation pi le -31885,74 [kN]Fatigue parameters Foundation pileCycle period 10,00 [s ] Tens ion load brace 31901,90 [kN] Δσ wind 1,66 [N/mm²]Mean wave height 1,25 [m] Tens ion load leg 11044,89 [kN] Δσ wave 1,38 [N/mm²]Mean wind speed 10,00 [m/s] Compress ion load brace -44542,77 [kN] Equiva lent Δσ 2,16 [N/mm²]Turbulence intens i ty I t 0,12 [-] Compress ion load leg -16664,79 [kN] Neq 61179136479858 [-]
Wave loads - Morison BracesGoverning wave height (dep. Load comb.) 14,90 [m] Δ Axia l load wind 1025,34 [kN]Governing Ci 2,00 [-] Δ Axia l load wave 395,65 [kN]Governing Cd / C*d 3,00 [-] Stress Concentration Factor (SCF) Braces 3,00 [-]
Governing Ki 0,41 [-] Δσ wind 4,77 [N/mm²]
Governing Kd 0,50 [-] Δσ wave 1,84 [N/mm²]
Governing H/Hb 0,84 [-] Equiva lent Δσ 15,33 [N/mm²]Neq 3973249483 [-]
Inertia force FI 0,00 [kN]Drag force FD 8957,37 [kN] Legs
Δ Axia l load wind 353,88 [kN]Current loads Δ Axia l load wave 107,26 [kN]Governing current veloci ty column 1,00 [m/s] Stress Concentration Factor (SCF) Legs 3,00 [-]Governing current veloci ty leg-column connection 0,89 [m/s] Δσ wind 3,55 [N/mm²]Governing current veloci ty brace-column connection 0,13 [m/s] Δσ wave 1,08 [N/mm²]
Tota l fronta l area braces and legs 82,25 [m2] Equiva lent Δσ 11,12 [N/mm²]Static drag coefficient - Cd 1,00 [-] Neq 31988221090 [-]Dynamic drag coefficient - C'd 0,25 [-]Current load mono pi le 1 50,05 [kN] ColumnCurrent load mono pi le 2 2,33 [kN] Stress Concentration Factor (SCF) Column 3,00 [-]Current load tripod s tructure 42,10 [kN] Δσ wind 9,58 [N/mm²]
Δσ wave 0,44 [N/mm²]Wind loads Equiva lent Δσ 28,79 [N/mm²]Governing wind speed, height z (dep. Load comb.) 35,95 [m/s] Neq 87579131 [-]Reference heigt, z 90,55 [m]Wind speed, height ha l fway tower 33,21 [m/s] Parameters for dynamic calculationsInduction factor 0,50 [-] Rotation s ti ffness k1 3473729644,85 [N/m]Thrust force Fthrust 3636,56 [kN] Latera l s ti ffness k2 2908217199,32 [N/m]Drag force Fdrag tower 292,34 [kN] Equiva lent length Leq 49,33 [m]
Equiva lent s ti ffness keq 3472025063,08 [N/m]Deflections Tower s ti ffness k3 1578396,44 [N/m]Schematised embedded depth -16,10 [m bs] Water mass 1785,19 [tons]l 1 16,10 [m] Tota l dynamic mass m1 3036,94 [tons]l 2 17,88 [m] Mass tower m2 298,32 [tons]l 3 4,16 [m]u1 3,11251 [mm]u2 3,38341 [mm]
Rotation φ at column top 0,00010 [degree]

116
Appendix 6 Spreadsheet Tower S
Design Input Design Output Calculations
Limit state and load factors Checks Panel heightSelect load s tate ULS2 Horizonta l equi l ibrium foundation pi les 4837,43 ≤ 162617,90 ACCEPTED h1 10,57 [m] b1 13,98 [m]Select load combination 2 Compress ion check foundation pi les 47613,95 ≤ 47702,67 ACCEPTED h2 8,89 [m] b2 11,76 [m]
Tens ion check foundation pi les 40679,85 ≤ 46156,08 ACCEPTED h3 7,48 [m] b3 9,89 [m]Load factor permanent loads 1,00 [-] Shaft friction 80,20 ≤ 81,00 ACCEPTED h4 6,29 [m] b4 8,32 [m]Load factor envi ronmenta l loads 1,35 [-] End bearing 3225,00 ≤ 4800,00 ACCEPTED top width 7,00 [m]Res is tance factor 1,10 [-] Fatigue check foundation pi le 7,88E+07 ≤ 3,16E+12 ACCEPTED
Yield check foundation pi les 0,98 [-] ACCEPTED CoördinatesSteel yield s tress 355,00 [N/mm2] D/t ratio foundation pi les 77,17 [-] ACCEPTED x [m] y [m] z [m]
dens i ty water ρw 1025,00 [kg/m3] Max seabed displacement K1 up to K4 5,00 ≤ 106,50 ACCEPTED K1 0,00 0,00 0,00
dens i ty a i r ρl 1,293 [kg/m3] K2 13,98 13,98 0,00gravi ty acceleration g 9,81 [m/s 2] Pile parameters K3 13,98 0,00 0,00
Embedded depth (Blum) d 51,60 [m] K4 0,00 13,98 0,00Truss tower parameters Length foundation pi le (incl . connection s le 58,70 [m]Top width bt 7,00 [m] Section modules W foundation pi le 0,46 [m3]
K5 1,11 1,11 10,57Number of panels 4,00 [-] K6 12,87 12,87 10,57
Hub height 93,23 [m MSL] K7 12,87 1,11 10,57Embedded depth foundation pi les d 0 43,00 [m] Platform level 13,23 [m MSL] K8 1,11 12,87 10,57Diameter foundation pi le D pile 3,55 [m] Air gap 1,50 [m]Wal l thickness foundation pi le t pile 46,00 [mm] K9 2,05 2,05 19,46
Res is tant force C (Blum) 157780,47 [kN] K10 11,94 11,94 19,46Site specific parameters Moment at seabed 873,08 [MNm] K11 11,94 2,05 19,46Water depth 20,00 [m] Maximum moment foundation pi le Mmax 131,80 [MNm] K12 2,05 11,94 19,46HAT 1,04 [m MSL] Depth of maximum moment xm 7,56 [m bs]LAT -1,03 [m MSL] 174,79 173,36 K13 2,83 2,83 26,94Storm surge 1,00 [m] K14 11,15 11,15 26,94Wave height 50 yr 14,90 [m] Brace and Leg parameters K15 11,15 2,83 26,94Wave height 50 yr 12,61 [m] Tower height 33,23 [m] K16 2,83 11,15 26,94
Leg/vertica l angle 6,00 [degree]Turbine characteristics Multipl ication factor 1,19 [-] K17 3,49 3,49 33,23Tower height 80 [m] Brace/horizonta l angle 39,38 [degree] K18 10,49 10,49 33,23Nacel le, hub and rotor mass 220 [tons] Brace/leg angle 44,62 [degree] K19 10,49 3,49 33,23Tower mass 345 [tons] Base width 13,98 [m] K20 3,49 10,49 33,23Swept area 9000 [m2] Point of action current above seabed 13,33 [m]Diameter tower top 3,50 [m] Point of action wave above seabed 22,04 [m] SCIA input loads ULSDiameter tower bottom 4,70 [m] Wave/pi le 3579,90 [kN]Cut out wind speed 25 [m/s] Axial loads Current/pi le 30,19 [kN]
Weight truss tower 1968,70 [kN] Turbine weight/pi le 1412,50 [kN]Soil parameters Weight foundation pi les 6249,49 [kN] Thrust/pi le 1227,34 [kN]Select homogeneous soi l type Sand [-] Weight complete turbine 5650,00 [kN] Mthrust +/- 39673,61 [kN]Volumetric weight 20 [kN/m3] FLS
Effective volumetric weight 10 [kN/m3] Tens ion load foundation pi le, s i tuation 1 40679,85 [kN] ΔF wave 39,36 [kN]Angle of internal friction 35 [degree] Compress ion load foundation pi le, s i tuatio -47613,95 [kN] ΔF wind 48,93 [kN]Angle of external friction 25 [degree] Tens ion load foundation pi le, s i tuation 2 27749,52 [kN] Mwind +/- 1552,54 [kN]Bearing capaci ty factor Nq 15,00 [-] Compress ion load foundation pi le, s i tuatio -34683,62 [kN]Cohes ion capaci ty factor Nc 9,00 [-] SCIA input dynamicsUndrained shear s trenght s u 75,00 [kPa] Wave loads - Morison Dpi le 3550,00 [mm]
Governing wave height (dep. Load comb.) 14,90 [m] t pi le 46,00 [mm]Wave parameters - Morison Governing Ci 2,00 [-] Depth fixed support 12,43 [m]Wave 50 yr - Ci 2,00 [-] Governing Cd / C*d 3,00 [-] Mass soi l 245964,81 [kg]Wave 50 yr - Cd / C*d 3,00 [-] Governing Ki 0,41 [-] Mass water 71292,55 [kg]Wave 50 yr - Ki 0,41 [-] Governing Kd 0,50 [-] Mass turbine 220000,00 [kg]Wave 50 yr - Kd 0,50 [-] Governing H/Hb 0,84 [-] Diameter tower 4,10 [m]Wave 50 yr - H/Hb 0,84 [-] Deq,drag 6,34 [m] Hub height above seabe 113,23 [m]Wave 5 yr - Ci 2,00 [-] Deq,inertia 2,28 [m]Wave 5 yr - Cd / C*d 1,20 [-] Fatigue parameters
Wave 5 yr - Ki 0,42 [-] Inertia force FI 0,00 [kN] ΔFthrust 188,52 [kN]
Wave 5 yr - Kd 0,45 [-] Drag force FD 14319,59 [kN] ΔFdrag tower 7,20 [kN]Wave 5 yr - H/Hb 0,75 [-] Δ Inertia force wave FI 56,65 [kN]
Current loads Δ Drag force wave FD 100,78 [kN]Current parameters Governing current veloci ty column 1,00 [m/s]Extreme current veloci ty 50 yr 2,10 [m/s] Static drag coefficient - Cd 1,00 [-] Mean wind, ha l fway tow 9,15 [m/s]Extreme current veloci ty 5 yr 1,00 [m/s] Dynamic drag coefficient - C'd 0,25 [-] SCF 3,00 [-]
Current load 120,76 [kN] m 5,00 [-]Wind parameters loga 15,61 [-]Wind speed 50 yr, at reference height z 42,04 [m/s] Wind loads k 0,25 [-]Wind speed 5 yr, at reference height z 35,95 [m/s] Governing wind speed, height z (dep. Load c 35,95 [m/s] tref 32,00 [mm]
Reference heigt, z 90,55 [m] Nref 7,88E+07 [-]Fatigue parameters Wind speed, height ha l fway tower 33,21 [m/s]Cycle period 10,00 [s ] Induction factor 0,50 [-] Δ Moment sb - wind 21,82 [kNm]Mean wave height 1,25 [m] Thrust force Fthrust 4909,36 [kN] Δ Moment sb - wave 3,15 [kNm]Mean wind speed 10,00 [m/s] Drag force Fdrag tower 394,67 [kN] Δ Tens ion Pi le - wind 1103,55 [kN]Turbulence intens i ty I t 0,12 [-] Δ Tens ion Pi le - wave 159,21 [kN]
Soil resistancePass ive soi l coefficient 3,69 [-] Foundation pile
Average effective pressure p'0 215,00 [kPa] Δσ wind 3,59 [N/mm²]Shaft res is tance factor α (Clay) 0,00 [-] Δσ wave 1,30 [N/mm²]Latera l res is tance foundation pi le 162617,90 [kN] Δσeq 3,82 [N/mm²]Compress ion capaci ty foundation pi le 47702,67 [kN] Neq 3,16E+12 [-]Tens ion capaci ty foundation pi le 46156,08 [kN]
ULS checks foundation pilesStress due to bending 289,48 [N/mm2]
Cross sectional area foundation pi le 0,51 [m2]
Stress due to axia l tens ion force 80,34 [N/mm2]
Stress due to axia l compress ion force 94,03 [N/mm2]
Tota l s tress at pi le top 383,51 [N/mm2]
Results D [mm] t [mm] D/t Δσ wave Δσ wind Δσeq Neq Adjustud t [mm]Leg1 1130,00 41,00 27,56 1,00 8,70 26,27 2,37E+08Leg2 1180,00 38,00 31,05 1,10 9,00 27,20 2,19E+08Leg3 1030,00 44,00 23,41 0,00 10,60 31,80 8,34E+07Leg4 1200,00 38,00 31,58 0,00 10,50 31,50 1,05E+08Brace1 480,00 15,00 32,00 2,00 3,10 11,07 6,27E+10Brace2 440,00 15,00 29,33 2,60 4,10 14,56 1,59E+10Brace3 430,00 15,00 28,67 3,20 5,00 17,81 5,81E+09Brace4 360,00 15,00 24,00 0,00 7,10 21,30 2,37E+09Hor 470,00 15,00 31,33 0,30 1,60 4,88 3,75E+12Foundation pi les 3,55 46,00 77,17 1,30 3,59 3,82 3,16E+12
Embedded depth (Blum) d 51,60 [m]Tota l Mass 200,68 [ton]
Panel width
117
Appendix 7 Results of the Mono Pile Calculations M

118
Appendix 8 Results of the Tripod Calculations S
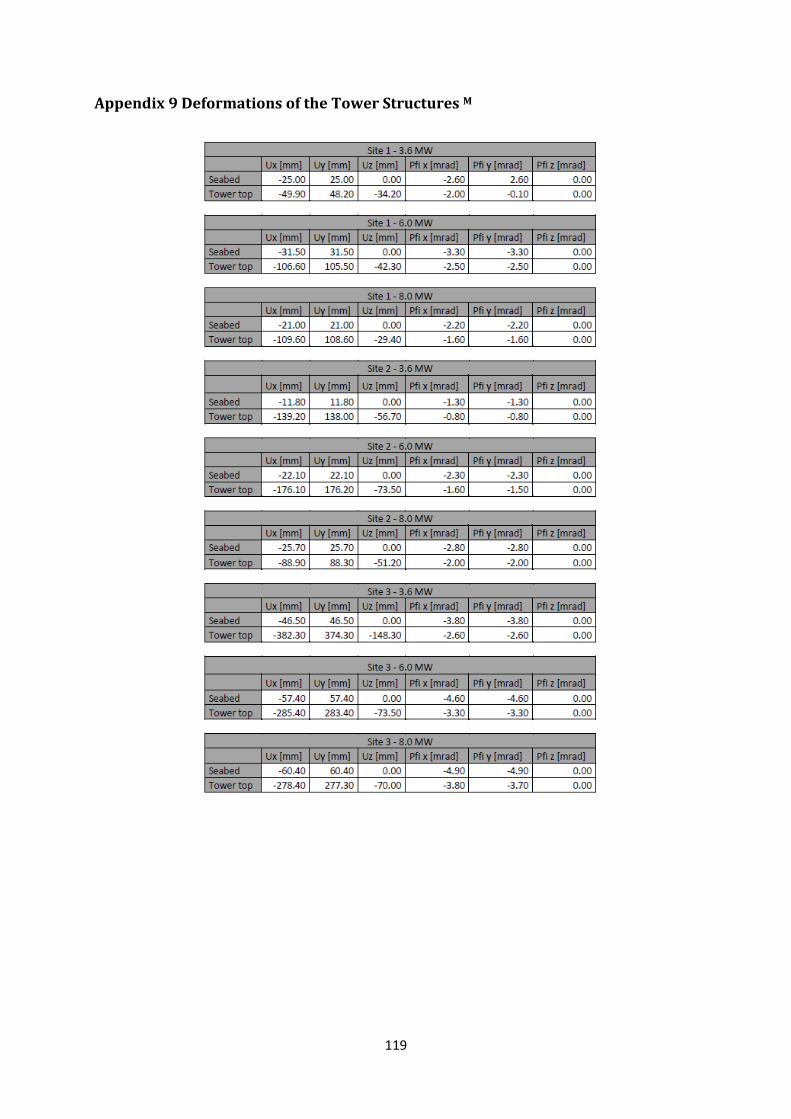
119
Appendix 9 Deformations of the Tower Structures M

120
Appendix 10 Spreadsheet for Cost Analysis M
Mono pile foundation Total costs Materia l Time Unit Price/Day rate Tota l costs
[tons] [days] [€/ton, €/day] [k€]
Parameters Material and manufacturing weight mono pi le 502 € 2000 € 1004
Number of wind turbines in wind farm 50 [-] weight trans i tion piece 189 € 2000 € 378
Distance to port of Rotterdam 80 [km] tota l manuf. costs for one insta l lation € 1382
Power output per wind turbine 3,6 [MW] tota l manuf. costs for wind farm € 69100
Tota l power output wind farm 180 [MW] Transport offshore transport barges 1,11 € 15000 € 17
tug 1,11 € 25000 € 28
Material and manufacturing costs tota l transport costs for one insta l lation € 89
mono pi le € 2,00 [€/kg] tota l transport costs for wind farm € 4444
trans i tion piece € 2,00 [€/kg] Foundation installation heavy l i ft vessel 1,11 € 250000 € 278
hydraul ic hammer 1,11 € 15000 € 17
Specification heavy lift vessel grouting equipment 1,11 € 50000 € 56
weather window heavy l i ft vessel 0,75 [-] tota l foundation costs for one insta l lation € 350
day rate vessel € 250000 [€/day] tota l foundation costs for wind farm € 17500
Transport barge tota l costs for wind farm € 91044
estimated number of barges 2 [barges] tota l costs per MW insta l led power € 506
day rate barge € 15000 [€/day]
day rate tug € 25000 [€/day] Installation time (one monopile) Time Rated Time
Activity Equipment [hours ] [hours ]
Equipment Pi le driving HLV + hammer 12 16
hydraul ic hammer € 15000 [€/day] Insta l lation trans i tion piece and grouting HLV + grouting equipment 6 8
grouting equipment € 50000 [€/day] Sa i l ing to next location HLV (+ hammer and grouting equipment) 2 3
tota l ins ta l lation time per monopi le [hours ] 20 27
tota l ins ta l lation time wind farm [days] 42 56
Tripod foundation with post driven piles Total costs Materia l Time Unit Price/Day rate Tota l costs
[tons] [days] [€/ton, €/day] [k€]
Parameters Material and manufacturing weight tripod 339 € 3000 € 1017
Number of wind turbines in wind farm 50 [-] weight foundation pi les 497 € 2000 € 994
Distance to port of Rotterdam 80 [km] tota l manuf. costs for one insta l lation € 2011
Power output per wind turbine 3,6 [MW] tota l manuf. costs for wind farm € 100550
Tota l power output wind farm 180 [MW] Transport offshore transport barges tripods 1,61 € 20000 € 64
tug tripods 1,61 € 25000 € 81
Material and manufacturing costs transport barge foundation pi les 1,61 € 20000 € 64
tripod € 3,00 [€/kg] tug foundation pi les 1,61 € 25000 € 81
foundation pi les € 2,00 [€/kg] tota l transport costs for one insta l lation € 290
tota l transport costs for wind farm € 14500
Specification heavy lift vessel Foundation installation heavy l i ft vessel 1,61 € 250000 € 403
weather window heavy l i ft vessel 0,75 [-] mudmats 35 € 4000 € 140
day rate vessel € 250000 [€/day] hydraul ic hammer 1,61 € 15000 € 24
grouting equipment 1,61 € 50000 € 81
Transport barge tota l foundation costs for one insta l lation € 648
number of barges for tripod 2 [barges] tota l foundation costs for wind farm € 32375
number of barges for foundation pi les 2 [barges]
tota l costs for wind farm € 147425
day rate barge € 20000 [€/day] tota l costs per MW insta l led power € 819
day rate tug € 25000 [€/day]
Installation time (one tripod) Time Rated Time
Equipment Activity Equipment [hours ] [hours ]
hydraul ic hammer € 15000 [€/day] Tripod insta l lation Heavy l i ft vessel 6 8
grouting equipment € 50000 [€/day] Pi le driving (3x) Heavy l i ft vessel + hammer 18 24
Grouting Heavy l i ft vessel + grouting equipment 3 4
Sai l ing to next location HLV (+ hammer and grouting equipment) 2 3
tota l ins ta l lation time per tower [hours ] 29 39
tota l ins ta l lation time wind farm [days] 60 81
Tower foundation with pre driven piles Total costs Materia l Time Unit Price/Day rate Tota l costs
[tons] [days] [€/ton, €/day] [k€]
Parameters Material and manufacturing weight tower 177 € 4000 € 708
Number of wind turbines in wind farm 50 [-] weight foundation pi les 558 € 2000 € 1116
Distance to port of Rotterdam 60 [km] tota l manuf. costs for one insta l lation € 1824
Power output per wind turbine 3,6 [MW] tota l manuf. costs for wind farm € 91200
Tota l power output wind farm 180 [MW] Transport offshore transport barges towers 0,67 € 20000 € 27
tug towers 0,67 € 25000 € 33
Material and manufacturing costs transport barge foundation pi les 2,22 € 20000 € 89
tower € 4,0 [€/kg] tug foundation pi les 2,22 € 25000 € 111
foundation pi les € 2,00 [€/kg] tota l transport costs for one insta l lation € 260
tota l transport costs for wind farm € 13000
Specification auxiliary vessel Foundation installation auxi l iary vessel 2,22 € 100000 € 222
weather window auxi l iary vessel 0,6 [-] pi le template 200 € 4000 € 16
day rate vessel € 100000 [€/day] hydraul ic hammer 2,22 € 15000 € 33
ROV 2,22 € 10000 € 22
Specification heavy lift vessel heavy l i ft vessel 0,67 € 250000 € 167
weather window heavy l i ft vessel 0,75 [-] grouting equipment 0,67 € 50000 € 33
day rate vessel € 250000 [€/day] tota l foundation costs for one insta l lation € 494
tota l foundation costs for wind farm € 24689
Transport barge
number of barges for tower 2 [barges] tota l costs for wind farm € 128889
number of barges for foundation pi les 2 [barges] tota l costs per MW insta l led power € 716
day rate barge € 20000 [€/day] Installation time (one tower) Time Rated Time
day rate tug € 25000 [€/day] Activity Equipment [hours ] [hours ]
Placing pi l ing template Auxi l iary vessel 3 5
Equipment Pi le driving (4x) Auxi l iary vessel + hammer 24 40
hydraul ic hammer € 15000 [€/day] Pi le survey ROV 3 5
grouting equipment € 50000 [€/day] Sa i l ing to next location Auxi l iary vessel (+ROV and hammer) 2 3
ROV € 10000 [€/day]
Tower insta l lation + grouting Heavy l i ft vessel + grouting equipment 10 13
Sai l ing to next location Heavy l i ft vessel (+ grouting equipment) 2 3
tota l ins ta l lation time per tower [hours ] 44 53
tota l ins ta l lation time wind farm [days] 92 111


