Page 1
Concept Development of Smoothie Machine
for Convenience Stores
by
Fernando Febres
A Research Paper Submitted in Partial Fulfillment of the
Requirements for the Master of Science Degree
m
Technology Management
The Graduate School
University of Wisconsin-Stout
May, 2011
1
Page 2
The Graduate School University of Wisconsin-Stout
Menomonie, WI
2
Author: Febres, Fernando.
Title: Concept Development of Smoothie Machine for Convenience Stores
Graduate Degree/ Major: MS Technology Management
Research Adviser: Jim Keyes, Ph.D.
MonthFVear: May, 2011
Number of Pages: 72
Style Manual Used: American Psychological Association, 6th edition
Abstract
Today, the smoothie industry is a multi-billion dollar industry, where just in the United
States reached more than $2 billion in sales in 2006, which meant a growth of 80 percent
compared with the last five years. On the other side of the spectrum, the Convenience Stores
market represents 60 percent ofthe entire Mass Grocery Retail market in the U.S., having sales
of 507 billion in 2010, and that number is expected to growth to 800 billion in 2013 driven
primary for the foodservice segments.
Nevertheless, the food and drink market have experienced significant changes toward
healthy products, especially toward smoothies. Due to these changes, customers are demanding
fresher quality products ready-to-go at convenience stores. However, the problem existing with
Convenience Stores is the lack of natural options offered, which exposed an unexplored niche
where a machine capable of producing ready-to-go natural fruit smoothies can be developed.
Page 3
3
Throughout this research was performed a five step process of concept development, that
addressed the best arrangement of parts, as well as details design and recommendation to further
studies.
It can be concluded that the smoothie machine developed in this project represents a huge
business opportunity, since there are almost no technologies available that serves this growing
market at convenience stores.
Page 4
The Graduate School University of Wisconsin Stout
Menomonie, WI
Acknowledgments
4
First of all, I want to record that this project it is entirely dedicated to my grand mother,
as I just to called her "Mi Abila," who had diabetes most of her life until she passed away right
before I started this master. It was always her wish for me to come abroad to get a master
diploma.
Later I want to thank my parents for all their unconditional support throughout my life.
They are always have been my role model and I really wish they can feel proud of all the work
done so far.
I also want to thanks my fiance Ana, because without her support and commitment
toward me, this research would have not been possible.
My sincere thanks to Dr. Jim Keyes for being my research advisor. It was a hard task for
me to explain the entire creation of this machine, but thanks to his guide and support it was
possible to achieve it.
I would like thanks Dr. Tom Lacksonen, for having me in the program and for his support
with all the international students. Also, I would like to thanks Dr. John Dzissah for being an
incredible professor who works really hard to make students understand the content. It was a
placer to meet him.
Finally I would like to thank god for giving me the spiritual strength throughout this
journey.
Page 5
5
Table of Contents .
................................................................................................................................... Page
Abstract ........................................................................................................................................... 2
List of Tables .................................................................................................................................. 8
List of Figures ................................................................................................................................. 9
Chapter I: Introduction .................................................................................................................. 11
Statement of the Problem .................................................................................................. 12
Purpose of the Study ......................................................................................................... 12
Assumptions of the Study ................................................................................................. 13
Limitations of the Study .................................................................................................... 13
Methodology ..................................................................................................................... 13
Chapter II: Literature Review ....................................................................................................... 14
Overview of food industry ................................................................................................ 14
Natural Products vs. Organic Products ............................................................................. 16
Organic Food in the U.S. Market ...................................................................................... 17
The Smoothie Industry ...................................................................................................... 18
Smoothie bar categories ................................................................................................ 21
Juice bars ................................................................................................................. 21
Smoothie Store ........................................................................................................ 21
Smoothies at Convenience Stores ................................................................................. 22
Page 6
6
Smoothie bars equipment. ............................................................................................. 23
Blender .................................................................................................................... 23
The basic machine ................................................................................................. 24
Smoothie blender .................................................................................................. 24
Smoothie machine ................................................................................................. 24
Automatic smoothie machine ............................................................................... 25
Other features ........................................................................................................ 25
Refrigeration equipment ......................................................................................... 26
Convenience Stores ........................................................................................................... 27
United States ................................................................................................................. 27
International Market Overview ..................................................................................... 31
Convenience Store's Equipment ................................................................................... 32
Hot dispensed beverages ......................................................................................... 32
Frozen dispensed beverages .................................................................................... 33
Product concept development ........................................................................................... 34
Step 1: Clarify the problem ........................................................................................... 35
Step 2: Search Externally .............................................................................................. 36
Step 3: Search Internally ............................................................................................... 36
Step 4: Explore systematically ...................................................................................... 37
Step 5: Product concept selection ................................................................................. 37
Summary ........................................................................................................................... 38
Chapter III: Methodology ............................................................................................................. 39
Page 7
7
Concept Development Process ......................................................................................... 41
Clarify the problem ....................................................................................................... 41
External Search ............................................................................................................. 41
Internal search ............................................................................................................... 41
Explore systematically .................................................................................................. 42
Summary ........................................................................................................................... 42
Chapter IV: Results ....................................................................................................................... 43
Clarify the Problem ........................................................................................................... 45
External search .................................................................................................................. 46
Internal search ................................................................................................................... 49
Explore systematically ...................................................................................................... 51
Summary ........................................................................................................................... 65
Chapter V: Discussion .................................................................................................................. 66
Limitations ........................................................................................................................ 66
Conclusions ... '" ................................................................................................................. 66
Recommendations ............................................................................................................. 67
Summary ........................................................................................................................... 67
References ..................................................................................................................................... 68
Page 8
8
List of Tables
Table 1: US Food vs. Totalfood Sales .......... ......................................................... 17
Table 2: Commercial Refrigeration Equipment ....... ..................................................... 27
Table 3: Automatic Hot Beverage dispenser ............................................................. 33
Table 4: Frozen Beverage Dispenser ............... ...................................................... 34
Table 5: Mission Statement ........... ...................................................................... 40
Table 6: Blender types and prices ......................................................................... 47
Table 7: Benchmarking activity BDI Blendtec ® ...........•............................................ 48
Table 8: Benchmarking activity F'real ® ................................................................. 49
Table 9: Levell: Solution to sub-problem product dispensing ....................................... 50
Table 10: Level 1: Solution to sub-problem of product handling .... ............ '" ......... '" ..... , 50
Table 11: Level 11: Solution to Sub-problem Hot water ............ .................................... 51
Table 12: Level 11: Solution to Sub-problem Apply Energy ........................................... 51
Table 13: Pros and cons, Frozen Fruit ................................................................... 53
Table 14: Pros and cons, Cool Water .............. ...................................................... 54
Table 15: Pros and Cons, Automatically Powder Dispensing ........................................ 55
Table 16: Pros and cons, Tankless Water Heater and Store Pressure .............................. 56
Table 17: Material Cost ..................................................................................... 65
Page 9
9
List of Figures
Figure 1: U.S. Organic Food Sales by Product ........................................................... 18
Figure 2: Smoothie franchise bars in the U.S ............................................................ 22
Figure 3: U.S. Convenience Stores ........................................................................ 28
Figure 4: U.S. Top states for convenience Stores ........................................................ 28
Figure 5: U.S. Channel Count Comparison .............................................................. 29
Figure 6: Convenience Store Metrics ...................................................................... 30
Figure 7: Foodservice Sales in Convenience Stores .................................................... 31
Figure 8: International Market- Convenience Stores ..................................................... 31
Figure 9: International Sales- Convenience Stores ....................................................... 32
Figure 10: Convenience Stores-Hot Dispensed Beverages Category ................................. 33
Figure 11: Level I, Problem Decomposition ............................................................ .45
Figure 12: Level II, Problem Decomposition ............................................................ .45
Figure 13: Level I, Functional Decomposition ............................................................ 46
Figure 14: Level II, Functional Decomposition ......................................................... .46
Figure 15: Clasification tree, subfunction energy ....................................................... 52
Figure 16: Combination table, Frozen fruit ............................................................... 52
Figure 17: Combination table, cool water ................................................................ 54
Figure 18: Combination table, Automatically Powder dispensing .................................... 55
Figure 19: Combination table, Tankless water heater and store pressure ........................... 56
Figure 20: Clasification tree, subfunction Apply energy to Blender Lid ............................ 57
Figure 21: Clasification tree, subfunction Apply Energy to Blender ................................. 57
Figure 22: Clasification tree, subfunction Dispensing Process ....................................... 57
Page 10
10
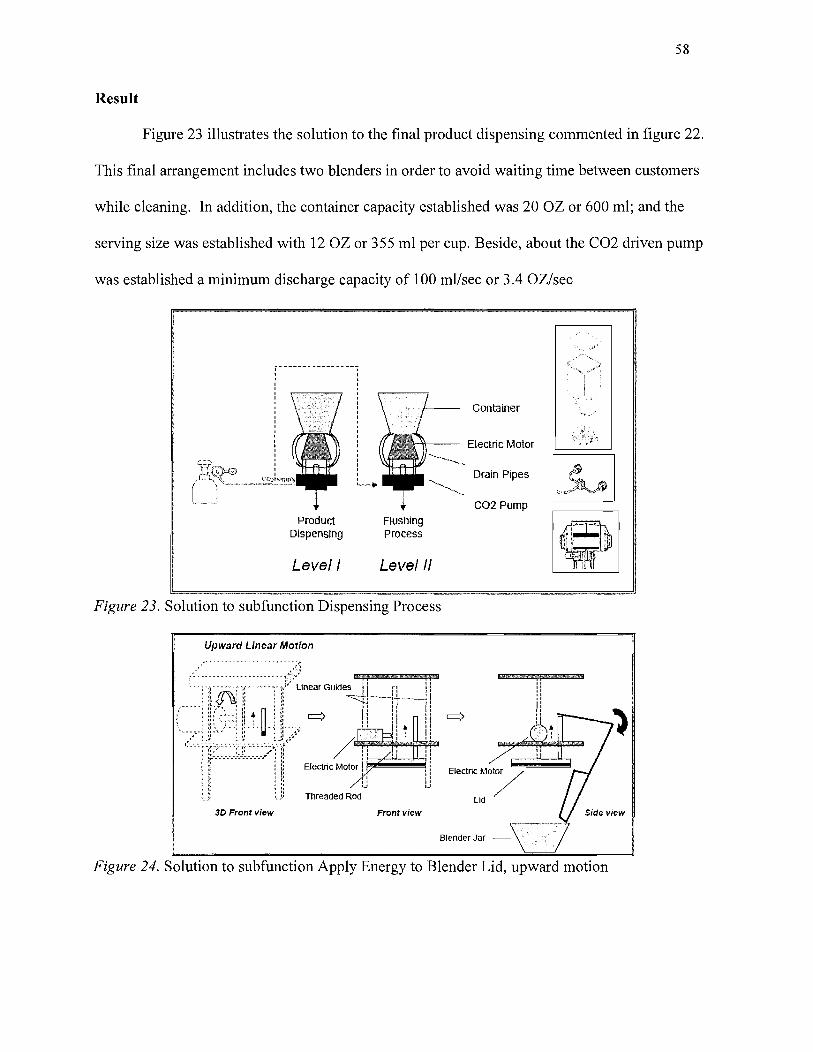
Figure 23: Solution to subfunction Dispensing Process ................................................ 58
Figure 24: Solution to subfunction Apply Energy to Blender Lid, upward motion ................. 58
Figure 25: Solution to subfunction Apply Energy to Blender Lid, downward motion ............. 59
Figure 26: Solution to subfunction Apply Energy to Blender Lid, Lid description .................. 59
Figure 27: Solution to sub function Hot Water ........................................................... 60
Figure 28: Solution to subfunction cool Water .......................................................... 60
Figure 29: Solution to subfunction Powder Dispensing ................................................ 61
Figure 30: Noise Control Arrangement ................................................................... 61
Figure 31: Solution to Process Level I .................................................................... 62
Figure 32: Solution to Process Level II ................................................................... 63
Figure 33: Flow chart of the entire process ................................................................ 63
Figure 34: Machine External appearance ................................................................. 64
Page 11
11
Chapter I: Introduction
In recent times, customer preferences have experienced changes toward good-for-you
products. However, customers have found a wide range of differences and similarities, in terms
of benefits and added functionalities among healthy products. One example is the debate
generated in regards to organic and natural products (Berry, 2010).
According to Mintel International, products labeled as "Natural" are the main trend in
marketing product introduction within the refrigerated juice category in the U.S., where 65 out of
170 products used the all-natural designation on their labels ("Changes in the Big Beverage
Market," 2008). Simultaneously, The Organic Trade Association (OTA) reported that despite the
world economic downturn experienced in United States by 2009, the organic segment has shown
a stable growth of 5.1 percent, being a $26.6 billion market (OTA, 2010).
This raise in the demand for these types of products has made the smoothie very popular
all across the country, despite the premium prices tagged on them. One of the reasons for their
success is because smoothies across time have called the attention to those customers looking for
new exiting products; given the exotic flavor options and endless combinations in which
smoothies can be served (Bendall, 2005).
The frenetic rhythm of modern society has pushed businesses to create better and faster
alternatives to customers, in order to provide what they want, in the moment they need it, and at
convenient locations. For those reasons, since the 1950's, industries such as the "Fast Food" has
been influencing other industries to become more efficient. That is the case of convenience
stores, where a regular customer has an average time from the moment they walk in, until they
depart of3 to 4 minutes ("Convenience Store Count," 2010).
Page 12
12
In our time, convenience stores playa remarkable role in the market, since most shoppers
stop at convenience stores to get what they need in the daily basis ("Big retailers think small,
2004). That is why this industry represents 60 percent of the entire Mass Grocery Retail market
in the U.S. ("Convenience Store Count," 2010), with approximate sales of$507 billion in 2009
("U.S. c-stores," 2009), and nearly 160 million customers served every day ("Convenience Store
Sell Time," 2009).
This market outlook represents a huge business opportunity, since there are an increasing
demand for healthy products and technologies capable to provide those products in a more
effective way. Therefore, this study has the mission to develop a smoothie machine concept
capable to fulfill both trends, in an affordable way.
Statement of the Problem
Customers are demanding fresher quality products ready-to-go at convenience stores.
The lack of natural options at these stores has addressed an unexplored niche, where ready-to-go
natural fruit smoothies can be developed. The study will address this through the development of
a smoothie machine.
Purpose of the Study
The purpose of this study is to develop a product concept for an automatic smoothie
machine, through the simplification and optimization of processes for smoothie production at
convenience stores all over the United States, as well as other countries where healthy products
are demanded. This study involves a comprehensive overview of the industry trends, concept
development process, terms and definitions, as well as the technologies in which the machine
should be build to. Finally, this study provides recommendations to assess, manage, and create
further studies that will lead improvements in the design.
Page 13
13
Assumptions of the Study
1. The information is provided by reliable sources.
2. The existence of a supplier capable to provide 100 % just-blended frozen fruit
required, with no preservative and any kind of complex industrial process to treat the
fruits.
3. The meaning of customer refers to convenience stores' operators, as well as the end
users.
Limitations of the Study
The study was limited only to the concept development process, which is the main
creative process of product development. In addition, across this research the process performed
was made individually, even though in some references were performed using teams to develop
certain methods.
Methodology
The study was focused on the necessary inputs to begin the concept development process.
Later, the concept was developed by performing a five step process that assures a strong
understanding of the challenges to design a smoothie machine; as well as, the exploration and
evaluation of technologies available in the market. In the research, graphical representations
were used to illustrate each part of the product, and then the concepts were synthesized until the
final decision was made, with the inputs being taken into consideration. Finally, the final concept
was drawn in 2D and 3D to perceive the dimensions, as well as was calculated an estimated of
the machine material cost and the machine price.
Page 14
14
Chapter II: Literature Review
Overview of food industry
In recent years there have been witnessed an exponential growth in the demand of natural
product. Although, it seems an old fashion idea, it is important to consider some facts of the
food industry evolution, in order to understand the "whys" of this asseveration.
At the late of the 19th century, along the American continent, it was common seeing rural
societies where families ate what they harvested, also where freshness was prerequisite.
However, the dramatic growth that occurred in the twentieth century in the United States
generated a great impact on the societies of the time, stimulating technological innovation to
satisfy the new demands of early modern societies (Toops, 2007).
In 1913, Henry Ford started a revolution which changed the world economy forever with
the creation of the mass production system, which proved being successfully applicable for many
industries. By that time, this production system helped to manufacture affordable cars and
products for the growing middle class (Ford Motors Company ®, 2010).
Also in 1913, the first electric refrigerator was offered (Frigidaire ®, 2008), as a
consequence of this innovation, the food industry began to adapt its products, developing frozen
food, satisfying the increasing demand of refrigerated products (Toops, 2007).
Furthermore, governments in the U.S. began massive transportation projects, in order to
support the economy growth for the coming decades. As a result, cities grew larger because
distance became shorter thanks to accessible cars, which eventually stimulated the migration to
suburban areas, changing people habits forever.
During the 50's, the food industry watched the birth of a new industry, where its main
character was McDonalds ®. This industry was driven by efficiency and fast preparation, and
Page 15
15
eventually this concept was well-known as "Fast Food." Altogether with the invention of the
"drive-through," allowed customers to spend even more time in their cars (McDonalds ®, n.d).
Nevertheless, it was not until some scientific research made by the FDA, among other
institutions, regarding health problems associated with high consumption of saturated fats and
high sugar contents, when customers decided to look again into natural products (Toops, 2007).
In present times, in the U.S. has been noticed an increasing number of illnesses
associated with diet problem. For instance, the American Diabetes Association (2011) shown
that by 2011 around 18.8 million people were diagnosed with Diabetes in the USA, and this
number is projected to rise to 48 million by 2050" (Oza-Frank & Narayan, 2010, para. 1).
Despite these facts, retailers consider products, such as packaged juices and snacks, very
popular among customers. However, often times those products contain high levels of sugar,
artificial flavors and preservatives; and even the natural options offered at the retailer level have
certain amount of these additives.
This situation has created an intense debate about what is considered healthy, natural and
organic, reshaping old wisdoms into a more complex reality, where customers' awareness is
leading and redefining firms' strategies (Toops, 2007).
Therefore, many business initiatives are trying to develop healthier products, in order to
supply the new demand for the coming years. In this matter Toops (2007) affirmed, "We know
the food industry does not lead trends, it responds to world events and customers needs by
developing technologies and foods that solve problems and deliver what the customers wants"
(p. 15).
Page 16
16
Natural Products vs. Organic Products
Recently, the discussion about organic or natural products is no longer simple, because
both concepts intersect and overlap each others with attributes, such as: local, fresh, sustainable,
safe, green, quality, lack of additives, among others (Berry, 2010).
The Hartman Group Inc. explains that organic and natural products are seem as
complementary attributes by the time of costumer's decision making; That is why the perception
of healthy products is driving them to purchase products that might be more expensive, but with
better benefits in the long term (Berry, 2010).
The United States Department of Agriculture (USDA) through the National Organic
Program (1990), defines organic production "as a production system that is managed in
accordance with the Act and regulations in this part to respond to site-specific conditions by
integrating cultural, biological, and mechanical practices that foster cycling of resources,
promote ecological balance, and conserve biodiversity" (para. 1).
Also the USDA through the National Organic Standards Board (2005) defines "Organic"
is a labeling term that notes products produced under the authority of the Organic Foods
Production Act. The principal guidelines for organic production are to use materials and
practices that enhance the ecological balance of natural systems and that integrate the parts of the
farming system into an ecological whole" (para. 2).
In contrast, consumers understand the term "natural" as what happens to food after has
been grown. In other words, it refers to food processes involved during the products preparation.
That is why, often time consumers remain skeptical about the term "natural"; since in products
labeled as "All-natural" it is possible to find ingredients with complex chemical terms, such as:
stabilizers, emulsifiers and preservatives (Berry, 2010).
Page 17
17
The U.S Food and Drugs Administration (FDA) has not developed a definition to allow
the use of the term "Natural". However, the FDA has not rejected to the use of the "Natural"
term if the food does not contain added color, artificial flavors, or synthetic substances (FDA,
n.d).
As a consequence, more than ever before the uses of terms as "organic" and "natural" in
food products are under controversy, because despite the apparent similarities that can be seen at
first, both terms have big differences, in which customer's awareness will playa key role once
the decision have to be made (Berry, 2010).
Organic Food in the U.S. Market
The Organic Trade Association (OTA) reported that despite the world economic
downturn experienced in United States by 2009, the organic market reached $26.6 billion in
sales, showing a growth of 5,1 %. As shown in the table below (OT A, 2010).
Table 1.
US Foodvs. Totalfood Sales
Category 2000 2001 2002 2003 2004 2005 2006 2007 2008 2009
Organic Food 6,100 7,360 8,635 10,381 12,002 14,223 17,221 20,410 23,607 24,804
Growth % 21.0% 29.7% 17.3% 20.2% 15.6% 18.5% 21.1% 18.5% 15.7% 5.1%
Total Food 498 521 530 535 544 566 598 628 659 669
(bn$)
Growth 5.0% 4.7% 1.7% 0.9% 1.6% 4.2% 5.5% 5.0% 4.9% 1,6%
Organic as % 1.2% 1.4% 1.6% 1.9% 2.2% 2.5% 2.9% 3.2% 3.6% 3.7%
of Total
Source: "U.S Organic Industry Overview," by OTA, Copyright © 2010. Retrieved from: http://www.ota.com/organic/mt/ consumer .html
Page 18
18
Comparatively, based upon a survey conducted by OTA in the industry in 2010, fruits
and vegetables represent the main organic segment, leading with 38 percent or $9.5 billion
market. However, the organic beverage market represents the fourth most important with 13
percent (OTA, 2010).
Meat, Poultry & Fish 2%
Beverages 13%
Snack foods Breads & Grains
11%
I-nllt& vegetables 38%
Figure 1. U.S. Organic Food Sales by Product, 2009
5% Packaged! Prepared
Foods
14%
Condiments 2%
Source: "U.S Organic Industry Overview", by OTA, Copyright © 2010. Retrieved from: http://www.ota.com/organic/mt/ consumer .html
The Smoothie Industry
Fruit Juice Smoothies or "Smoothies" are healthy beverages made from blended fruits.
Smoothies for some people are considered healthy meals served in cups, however for others can
also be considered more as snacks or desserts. Due to this versatility smoothies are called "the
new beverage and drinkable meal for the future" (JASA, 2000, para. 1).
Nevertheless, in South America, Native American civilizations have known about the
benefits of natural fruits for centuries, therefore this region is well known as the "fruit capital of
the world". Currently, Brazil is the biggest supplier of exotic fruits in the world (JASA).
Smoothies became popular in the United States, specifically in the west coast, by the mid
60's, with the renaissance of vegetarianism, where restaurants and bars, as a result of this trend,
had to adapt their menus to attract these new customers, evolving quickly in order to be able to
Page 19
19
supply customers with new exotic tastes and products. By that time, one of the popular choices
was the fruit juices or smoothies, an idea borrowed from its American neighbors of the south
(JASA, 2000).
According to a specialize publication, a regular smoothie preparation includes (Doucette,
1998):
• Fruit.
• Fruit Juice.
• Ice.
• Sometimes Ice cream or yogurt and fortifying powder.
Nonetheless, contrary to common belief, the term "Smoothie" was not always related to
fruit juices, in fact the term was used in several other businesses as a trade name, from car paint
to gloves. The first known reference to frozen beverage came during the 70's with the name
California Smoothie. However, a juice bar called Smoothie King was the one that imposed the
word "smoothie" as is known presently (JASA).
Today, the smoothie industry is a multi-billion dollar industry, that according to Mintel in
2006, just in the United States, smoothie makers reached more than $2 billion in sales, comprised
both categories made-to-order and packaged smoothies, which meant a growth of 80 percent
compared with the last five years (LaFave, 2008). In addition, Global Industry Analyst (GIA) is
expecting that the global market could reach $9 Billion Dollar by 2015 ("Global Smoothies
Market," 2010).
Conversely, some experts assure that the smoothie market is not a fast moving trend.
They argue that the smoothie market has grown gradually across the years, specifically since the
Page 20
20
70's (Doucette, 1998). Despite the diversity of opinions, most experts agree that the raise of
smoothies is the result of three foodservice trends (Bendall, 2005).
The first trend is the healthy trend, in which customers reject artificial flavors, demanding
real things. In the smoothie case, that meant an increasing demand for fresh fruit smoothies,
making it attractive for businesses due to the higher profit margin in comparison to traditional
beverages (Bendall, 2005).
The second trend is for customized products, where despite healthy properties, customers
demand more variety and functionality, from number of ingredients, such as: combination of
exotic fruits, as well as, vitamins and proteins; in order to make unique drinks or signature items
(Bendall,2005).
Finally, the third important trend comes from traditional bars, specifically from cocktails
preparation, where alcoholic smoothies are considered popular choices among young adult
drinkers, as well as to female customers. Also, smoothies represent an attractive alternative to
nonalcoholic drinkers and designated drivers (Bendall, 2005).
Additionally, The Juice and Smoothie Association (JASA), has ranked smoothies in order
to categorize the quality levels of the different types of smoothie products. The ranking uses
four categories: platinum, gold, silver and bronze.
Platinum Smoothie. It is considered the highest rank of smoothies, and it comprises
"made to order" smoothies prepared with organic ingredients. Also, Platinum Smoothies contain
fresh squeezed juice and real fresh fruit cuts in its preparation.
Gold Smoothie. This ranking also comprises "made to order" smoothies, with the
difference being that theses smoothies are prepared with all-natural ingredients, such as: 100
percent frozen fruit and fruit juice from concentrates.
Page 21
21
Silver Smoothie. This type of smoothie uses ingredients based on pre-smoothie mixes or
starter bases. In addition, it is considered a Silver Smoothie, if it is made from 100 percent fruit
purees. These products are generally served through dispenser machines and slushy machines.
And sometimes different bases are blended to create flavor combinations.
Bronze Smoothie. It is considered a Bronze Smoothie if the smoothie does not contain
natural ingredients in its preparation, such as pre-packaged or canned smoothies usually found in
grocery stores, which contain high amounts of sugar and preservatives.
Smoothie bar categories
Juice bars
The most famous Smoothie franchises are within this category, and it comprises all quick
service restaurant operations which specialize in "made to order" smoothies that use fresh
squeezed fruit juices in their preparations (JASA, 2000). The United States operates a bit less
than 2200 juices bars (IFA, 2010). Companies like, Planet Smoothie, Jamba Juice, and Smoothie
King are the major players in the U.S. Smoothie franchise industry (JASA, 2000).
This category of bars does not require extensive space; because equipment's dimensions
for the smoothie preparation are generally small; in fact the average size of these Juice bars is
about 1000 square feet (Doucette, 1998).
Smootllie Store
This is other main category of Smoothie Bars. This category is basically the same as
juice bars, it is specialized in made-to-order smoothies, but with the only difference being that it
does not use fresh fruit and fresh squeezed juice in its preparation (JASA, 2000). An illustrative
example of this type of smoothie bar is the restaurant McDonald's ®, since each smoothie served
in those restaurants is made from 100 percent frozen fruit. In addition, McDonald's ® is the
Page 22
22
biggest player under this category with 13,000 restaurants around the country (McDonald's
Corp, 2010).
The figure below illustrates more clearly the market share Smoothie Bars franchises in
the U.S.
Smoothie Franchises
$ 14000 s::: C'G 12000 ... ::J C'G 10000 -til 8000 Q) ... .... 6000 0 ... 4000 Q)
740 610 ..c 2000 275 200 165 125 60 E 0 ::J Z '" '" '"
do - do B'o,. '" E .~
., 0 '0 .D do :E d:£ VI U ~ ...,::E CJ\
;;; E 0 ~ CJ\ t·2.~ -5 do ~ c: g .!;; 00. g ':1! 't: ~ c: 0 '" c: ~~ .D E 2 0 ~ 0 :2: 0 E:>:: ~EU :::l cr o do lL 0 0.. E 0 I-(J) (J)(J) 0:0:: E -0
0 (J) (J) ., :2: (J) 0:
Restaurant
Figure 2. Smoothie franchise bars in the U.S Adapted from International Franchise Association (IFA) and McDonald's Corp, 2010
Smoothies at Convenience Stores
Convenience stores, due to their importance as the biggest retailer channel in the U.S., are
sensitive to all changes in customer preference toward healthy product; for this reason,
convenience stores around the country have increased the use of slushy machines that offers 100
percent juices. However, some beverage bars in this business are moving beyond the traditional
frozen drinks, by adding new tastes and technologies in order to attract more customers.
That is the case of f'Real ®, a company that has developed an innovative automatic
smoothie and milkshake machine, in which customers just select the product from the under
counter fridge, where all frozen flavors are located; once the seal is removed, the cup is placed in
Page 23
23
a holder that automatically moves upward into the blender until the product is blended in same
cup, by using hot water to meltdown the frozen product (Pape, 2010).
Moreover, some stores also are experimenting with made-to-order smoothie style drinks
that contain real fruit cuts. However, the addition of natural fruits require extra cleaning and
maintenance, and that is something unacceptable for most convenience stores due to the
demanding environment in which these stores operate (Pape, 2010).
Smoothie bars equipment
Blender
Smoothies' popularity has led an innovation trend toward a new variety of blenders in
order to supply the increasing demand for these products. In the Smoothie business each operator
has its niche, because fruit juices can have endless combinations and consistencies. For that
reason, blenders are considered as the most important decision to make for operators, since this
equipment is the one that makes the product itself (Doucette, 1998).
Therefore, before any decision making, operators should take into consideration several
product details to purchase the equipment that best fits their particular niche. For instance, it is
important to know what kind of product is intended to blend, whether fresh fruit, frozen fruit or
concentrate, since this sort of detail awareness can affect largely the final operator's investment.
In addition, it is necessary to know the consistency required of the product, because the use of
ice cubes can change the texture to grainy rather than homogenized (Doucette, 1998).
In today's market a wide variety of blenders are available that serve different needs. That
is why, it is important to explore the existing categories and features, in order to understand why
some blenders are better for some works than others (Bendall, 2005).
Page 24
24
The basic machine
In the past basic blenders were the only choice available in the market. These blenders
seem to be the type used in household; however, the main difference lies in the quality of the
electric motor, since these units use the commercial version of these motors that lasts longer
under much tougher use. Even though sometimes the motor's specifications can show the same
horsepower as the regular one, but the differences are noticeable (Bendall, 2005).
Among the specifications, these units possess a two-speed motor with 1/3 horsepower, a
~
Jar of 44-ounce or 1.3Lts capacity. Also, these equipments are capable to blend beverages in
moderately low quantities, and the cost rounds $100 to $250 (Bendall, 2005).
Smoothie blender
The next levels are more powerful machines. These machines satisfy the needs of most
Smoothie Bars. These units possess a one to two horsepower motors; and are built with heavy-
duty construction materials, such as: all-metal drive gears and stronger cutting blades. These
types of machines are around the $300-500 price range and are capable of blending ice and
frozen fruit to an extremely fine consistency without separation of ingredients (Bendall, 2005).
Smoothie machine
The next level up involves powerful blenders with 3 to 5 horsepower. These blenders are
built to produce a perfectly mixed smoothie drinks in a matter of seconds. Some of these
blenders can be programmable depending on the ingredients, and are capable to sense the strain
in the motor to assure the same consistency every time is needed. These machines can cost from
$600 to $900 (Bendall, 2005).
Page 25
25
Automatic smoothie machine
The latest technology in the blender market comprises of blenders that use high tech
features, such as, a microprocessor to control ingredients, mix time, as well as the speed. Those
features eventually allow operators to have the same product every time they want it, saving as
well labor cost (Bendall, 2005).
In the market can be found the BDI Blendtec ® , this machine is able to manage up to
eight different ingredients as well as controlling 64 different preparations. The BDI Blendtec ®
operates by using fruit purees, water inlet, and ice dispenser. Once the product is selected the
ingredients are dispensed into the container automatically and blended within the same machine.
The only manual task is basically the container changing (Blendtec, 2011).
In addition, other simpler equipments are designed to automatically dispense all the
liquid ingredients in the jar, by using pre-programmed recipes and later on are blended in a
regular unit. In addition, there are some blenders that are capable to clean the container after the
smoothie preparation. The cost of this kind of equipment could reach $3,000 to 6,000 (Bendall,
2005).
Nevertheless, one of the most interesting technologies in today's market is the already
mentioned fReal ® automatic smoothie and milkshake machine, which include an under counter
fridge, with a cost of $8,000 (Mack, 2010).
Other features
The type of container is one of the choices to be considered while selecting blender.
Currently, there are two main container options, the stainless steel one and the polymeric one.
The stainless steel containers are durable. However, polycarbonate containers are considered
Page 26
useful, since they allow operators to see the product inside, controlling better the final
consistency (Bendall, 2005).
26
Whichever, the operator preference about container materials, every smoothie bar must
purchase at least twice the number of containers than blenders, in order to avoid stops in
smoothie production while cleaning the jars (Doucette, 1998).
On the other side, the feature to be taken into consideration is the use of noise isolation.
The noise isolation or Muffler is a polymeric box that covers the entire blender while is working.
The average smoothie bar serves approximately 300 people every day, where 5 blenders are
usually used at the same time. However, during peak times that number could reach from 8 to 10
blenders running at once. As a result, noise can be issue to everyone around (Doucette, 1998).
For that reason the use of Mufflers is considered a solution to customers and employees,
as well as for quiet bars and restaurants, however some operators disagree with that; because
some assure that noise attract customer's attention (Doucette, 1998).
Additionally, another popular solution in noise control available in the market is blenders
with motors under the counter. These arrangements have several advantages to operators due to
its clean appearance and safety features. Under the counter blenders make the bar look much
cleaner and less noisy, but on top ofthat, the blender container tends to be at a better height for
easier operation (Bendall, 2005).
Refrigeration equipment
Aside from blenders, most smoothie operators require several types of refrigeration units,
in order to be able to manage the wide range of ingredients required in the smoothie preparation.
The table below shows the necessary refrigeration equipment in smoothie bars, as well as the
costs involved (Doucette, 1998).
Page 27
Table 2.
Commercial Refrigeration Equipment
Equipment
Ice maker
Glass door under counter unit
Refrigerated table unit
Dip Boxes
Total
Adapted from Ebay Inc. (2011)
Convenience Stores
United States
Use
Ice
To store perishable product
To hold frequently used cold ingredients
To store fresh fruit and Ice Cream
Price
$1,500.00
$1,500.00
$1,500.00
$1,500.00
$6,000.00
27
The U.S. Census Bureau defines Convenience stores, NAICS Code 44512, as:
"establishments primarily engaged in retailing a limited line of goods that generally includes
milk, bread, soda, and snacks". In addition, the same Bureau defines Gas Stations with
Convenience Stores, NAICS Code 44711 as "establishments engaged in retailing automotive
fuels, in combination with convenience store or food mart items" (U.S Census Bureau, 2010).
The National Association for Convenience Stores (NACS) highlights that this industry
serve nearly 160 million customers per day or 58 billion customers every year in the U.S.
Moreover, 79 percent of the convenience stores sell gas, being the primary source for fuel in this
country, representing 80 percent of all the gasoline purchased ("Convenience Store Sell Time,"
2009).
By the end of2009, the number of convenience stores in the U.S reached the 144,541,
reporting a decrease of 0.2 percent ("Convenience Store Sell Time," 2009). The same year,
Page 28
28
convenience stores overall sales reached $507 billion. This industry is expected to grow in the
near future, according to Convenience Store News, despite the economic downturn faced in the
U.S. in 2008, sales could reach $800 billion in 2013, driven primarily by changes in customer
preferences for foodservice ready-to-go ("U.S. c-stores," 2009).
In the chart below is the growth of convenience stores throughout the last five years.
148.000
146.000 144.000
142.000 140.000
138.000 136.000
2006
Figure 3. U.S. Convenience Stores Adapted from NACS (2010)
US Convenience Stores
2007 2008 2009
Year
IIIIIIIIIIIII Quantity -+- Behavior I
2010
4,00% 3,00%
2,00% 1,00%
0,00% -1,00%
-2,00%
In the next chart it is shown the top ten states, in terms of number of active convenience
stores in each of these locations.
..
Top States for Convenience Stores (12/31/09)
16.000 14.000 12.000
1l 10.000 E 8.000 i 6.000
4.000 2.000
o
Figure 4. U.S. Top states for convenience Stores Adapted from NACS, 2010
Page 29
29
According to Country Monitor convenience stores have become more important
throughout the years; because most shoppers go to large supermarket chains in order to get what
they need for their weekly shopping, most of those shoppers prefer convenience stores to buy
what they need on a daily basis, such as: snacks, newspapers, food and drinks, gas, among others
(Big retailers think small, 2004).
It is unquestionable the importance of Convenience Stores, since this segment represents
60% of the entire Mass Grocery Retail market in the U.S, as is shown in figure 5.
US Channel Count Comparison (12/31/09)
37.654; 1
iii Convenience Stores
o Drug Stores
• Wholesale Clubs
144.541; 60%
IIlI Supennarkets
IIlI Mass Merchandiser/Dollar Stores
Figure 5. U.S. Channel Count Comparison Adapted from NACS, 2010
For those reasons, convenience stores are considered a solution for modern life since they
offer convenient locations and speedy service. In a study made by the NACS, called "NACS
Speed Metrics Research, 2002," a regular convenience store customer has an average time from
the moment they walk in, until they depart of 3 to 4 minutes ("Convenience Store Sell time,"
2010).
In chart 6 is presented the breakdown of the results obtained by this research.
Page 30
Convenience Store Metrics (NACS)
80,-------------~--------70 +--------60 +--------
Q) 50,----E 40,----j:: 30
20 10 o
Walk Select Wait Pay Lea\e in Item in Line store
Figure 6. Convenience Stores Metrics Adapted from NACS, 2010
Activities
[IJ SECONDS I
30
Despite the high oil prices, more convenience stores are seeking to become restaurants in
order to be more profitable, because contrary to common belief, convenience stores do not see
significant profit from selling gas. For example, according to NACS, the average retailer sells
4,000 gallons a day, with an estimated 1.5 cents profits per gallon, that leaves a grand total of
$60 profit per day from gasoline sales ("Convenience Store Sell Time," 2009).
Therefore, NACS highlights the key importance of food and drink categories for these
retailers, since most of their revenues come from these products. An average convenience store
makes about $20,000 a month just in foodservice sales ("Convenience Store Sell time," 2009).
The chart below intends to present the foodservices sales distribution, in which can be noticed
that beverage sales comprise 44 percent of the overall sales (figure 7).
Page 31
Foodservice Sales in Convenience Stores in the U.S
Prepared Hot Packaged Cold Frozen Food Beverages SanctMches Beverage Beverages
Product Type
Figure 7. Foodservice Sales in Convenience Stores Adapted from NACS, 2009
International Market Overview
From the international market standpoint, Japan is the unquestionable leader in
31
convenience stores in the world after the United States. However, it is important to highlight the
impressive growth experienced in china within five years (BMI, 2010). The charts below
illustrate better the evolution of this sector in the international playground, in terms of quantity
and sales.
International Market-Convenience Stores
40. 000 .,....-,·~·--·--~T"""'~~··::-·..,......,....-:.,..·-~·~~~·~·T~~·-··...,.:~·T~-.·7'T:c,..:-: •• :,... .• ";" •. ,...,.:,..~~~-~ •. ~ . ...., 35.000 30.000
~ 25.000 lij 20.000 a 15.000
10.000 5.000
o 2003 2004 2005 2006 2007 2008
Q Japan II China 0 Gennany 0 UK II Brazil fEl France III Spain 0 Mexico II Australia II India
Figure 8. International Market- Convenience Stores Adapted from Business Monitor International, 2010
Page 32
International Sales-Convenience Stores
90,00,----------------------, ,-----, 80,00 lSI Japan
70,00 II Germany
60,00 0 France
~ 50,00 0 Mexico c al 40,00 II Australia
30,00 IE.! Brazil
20,00 II Spain
10,00 0 India 0,00 +-""' ....... --""""'---,-J~ .............. -,-L
2005 2006
Figure 9. International Sales- Convenience Stores Adapted from Business Monitor International, 2010
Convenience Store's Equipment
Hot dispensed beverages
2007 2008
32
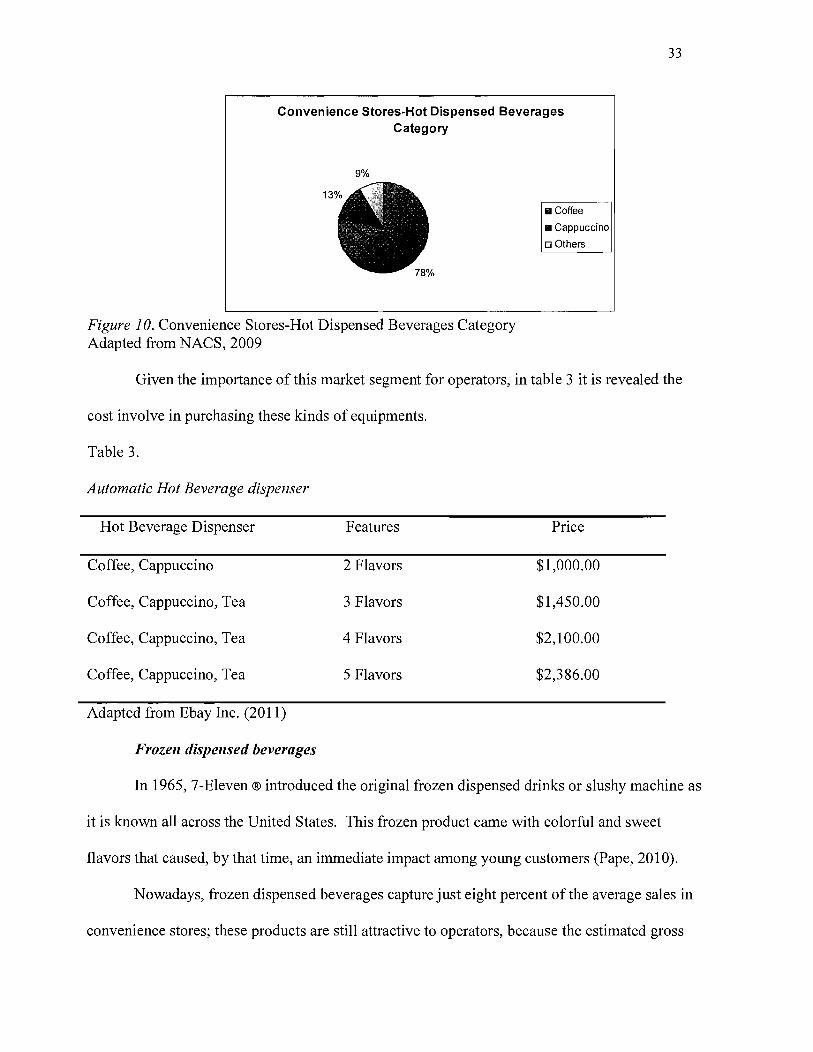
The NACS in its study called "State of the Industry data from 2008, " explains that more
than 95 percent of convenience stores offer hot dispensed beverages, where coffee is the number
one hot beverage choice among convenience store visitors, gathering 78 percent of sales within
the hot beverages category (Hamaker, 2009). In regards to this matter; the National Coffee
Association assures that more than 150 million adult U.S. citizens drink coffee on a daily basis
(Hamaker, 2009).
In addition, the same study mentions cappuccino as the second product in sales,
representing 13 percent of the hot beverage category. Meanwhile, other hot beverages, such as
Teas represent the remaining nine percent in customer preferences. As presented in the figure
below (Hamaker, 2009).
Page 33
Convenience Stores-Hot Dispensed Beverages Category
9%
Figure 10. Convenience Stores-Hot Dispensed Beverages Category Adapted from NACS, 2009
• Coffee
• Cappuccino
[J Others
33
Given the importance of this market segment for operators, in table 3 it is revealed the
cost involve in purchasing these kinds of equipments.
Table 3.
Automatic Hot Beverage dispenser
Hot Beverage Dispenser Features Price
Coffee, Cappuccino 2 Flavors $1,000.00
Coffee, Cappuccino, Tea 3 Flavors $1,450.00
Coffee, Cappuccino, Tea 4 Flavors $2,100.00
Coffee, Cappuccino, Tea 5 Flavors $2,386.00
Adapted from Ebay Inc. (2011)
Frozen dispensed beverages
In 1965, 7-Eleven ® introduced the original frozen dispensed drinks or slushy machine as
it is known all across the United States. This frozen product came with colorful and sweet
flavors that caused, by that time, an immediate impact among young customers (Pape, 2010).
Nowadays, frozen dispensed beverages capture just eight percent of the average sales in
convenience stores; these products are still attractive to operators, because the estimated gross
Page 34
34
margin of these beverages is up to 50 percent. This gross margin is the reason why, in today's
market, 75 percent of all convenience stores have slushy machines in place (Pape, 2010).
Furthermore, Pape (2010) highlights the importance of aligning the customer trend
toward healthy products with new product introduction at convenience stores, in order to be able
to provide to customers the nutritional and emotional attributes they are looking for in every
location. For that reason, some manufacturers are developing 100 percent natural juices for slush
machines and in some cases operators have experimented with real fruit smoothies at stores
(Pape, 2010).
In table 4 it is exposed the cost involved in purchasing these type equipments.
Table 4.
Frozen Beverage Dispenser
Frozen Beverage dispenser
Slush Machine
Slush Machine
Slush Machine
Adapted from Ebay Inc. (2011)
Product concept development
Features Price
1 Flavor $1,600.00
2 Flavors $2,250.00
3 Flavors $3,000.00
A product concept development process consists in a creative process based upon
customers and the market needs, which is evaluated and provides a concise description of the
working principles of a given product and technology (Ulrich and Eppinger, 2008).
One important component of a well performed concept development process is that it
assures the developer a good product design in further phases of product development. At the
same time, reduces the chances, at least in the short term, of finding better product concepts in
Page 35
the market, since a well performed process should explore a wide range of alternatives and
technologies (Ulrich and Eppinger, 2008).
35
The following five steps process has been developed by Ulrich and Eppinger, (2008).
This process begins addressing the customer needs and the market which the product should be
designed for, as well as setting a preliminary target specification of the product that will satisfy
those customers. Once that basic information is clearly understood, under a structured approach,
the process will follow a five steps method that will eventually lead to a better understanding and
design of a product that will better serve the purpose.
Step 1: Clarify the problem
This step is based upon the implementation of a structured approach that helps frame the
real dimensions of the overall problem. However before any step further, it is necessary to take
into consideration three aspects: the mission statement of the project, the customer needs and the
preliminary product specifications. Those inputs will provide to the concept developer with an
initial idea of the product to be built, as well as the possible challenges throughout the creation
path.
Nevertheless, often times the problem found is too complex to be solved as a single
problem; in that case it is recommended to decompose the problem into more manageable sub
problems.
This product decomposition is used as a basic graphical representation of the product,
where main functionalities needed in the design are established. In this part of the process the
deeper the developer goes the larger the alternative functions are; that is why those basic
functionalities are usually divided into sub functions, in order to assure that each sub function is
simple enough to work with.
Page 36
36
Once the problem decomposition phase is complete, developers should focus all their
efforts in the most critical sub problems, because that could provide the developer a better
chance to create a concept that fulfill better the customer expectations.
Step 2: Search Externally
The external search is essentially an information gathering process that explores existing
alternatives from sources that would contribute to solve either the overall problem as well as
each of the sub problems in the project. Also, in this stage of the process it is not questioned
how feasible technologies and functionalities are, because it is a fact that the more information
the developer can gather the better the final concept will be.
There are five main ways to gather information from external sources: lead user
interview, expert consultation, patent searches, literature searches, and competitive
benchmarking. However, it is researcher's decision to consider which of the source will serve
better the purpose.
Step 3: Search Internally
The internal search consists basically in an internal creative process where the developer
uses all the information gathered from prior steps, being evaluate possible alternative for the
concept, in order to generate as many ideas as possible that will satisfy the requirements.
The internal search can be done individually and in teams, but whichever the course of
action chosen, the developer should welcome every idea no matter how infeasible the idea seems
to be, because as was mentioned in the step before, the broader the options the better chances the
product will have to be successful.
Page 37
37
Step 4: Explore systematically
This step consists in organizing and synthesizing every piece of information gathered in
prior processes, which will be considered the best possible combinations to solve each of the sub
problems. In order to explore the different alternatives, two tools are used to manage the
complexity involved in the evaluation process, these tools are: the concept classification tree and
the concept combination table.
Concept Classification Tree. Concept classification trees are used to help the
evaluation of possible concept alternatives into categories, which makes it easier to view the
comparison between technologies. This graphical representation allows developers to focus their
attention on the most promising technologies, to avoid wasting time in branches where the
limitation can be risky.
Each of the most promising branches can be isolated as a particular problem, in which
each branch can contribute with different approaches by offering solutions to the overall concept.
Further evaluation of these technologies will, for first time, provide specific details of the
concept. Details such as: dimensions, weight, cost among others, can determine whether or not
those technologies can be applicable to the final concept.
Concept Combination Tables. A combination table is a graphical representation used
to support, in some specific cases, branches in the classification trees where different
combinations of promising technologies can be explored further. These combinations assure that
the best arrangements of technologies can be implemented in the final concept.
Step 5: Product concept selection
This stage involves the final synthesis of the best concepts into a single concept capable
of effectively satisfying the project requirements. The final decision can be made by using
Page 38
38
different approaches; however the project owners are the main responsible to decide which
approach should be performed in the final decision making. The following methods include:
• External Decision
• Intuition
• Product champion
• Pros and cons
• Prototype and test
Summary
In this chapter was discussed an overview of the food industry, followed by the organic
market growth and the smoothie industry. Later, it was discussed the importance of convenience
stores in the U.S and worldwide, and finally, it was explained the each of the five step of concept
development process.
Page 39
39
Chapter III: Methodology
The purpose of this study was to design an automatic smoothie machine, through the
simplification and optimization of processes in smoothie production for convenience stores all
over the United States, as well as other countries where healthy products are in high demand.
The study involves a comprehensive overview of concept development process, terms and
definitions, as well as the technologies in which the machine should be built. Finally, the study
provides recommendations to assess, manage, and create further studies that would lead to
improvements in the design.
This project was based on a five step process of product development that helps to
explore and create a more efficient arrangement of parts. These phases are: clarify the problem,
external search, internal search, explore systematically and results.
Nevertheless, prior the concept development process, it was necessary to address the
preliminary information of the project in order to visualize the initial idea of the product to be
designed.
Those preliminary inputs were the following ones:
• Mission Statement.
• Customer Needs.
• Preliminary Specification.
Table 5 consists of the development of the mission statement of the project. Here, the
initial idea of the product and the market in which the machine should be focused on were
exposed.
Page 40
Table 5
Mission Statement
Product Description
Benefit Proposition
Key Business Goal
Primary market
Secondary market
Assumtions and constrains
Stakeholders
Mission Statement
Product should blend, auto-clean, be quiet, user friendly, medium dimension, and quickly make the product.
Multiple flavor combinations with low labor cost and maintenance.
Provide the market of convenience stores with 100 percent real smoothies, under the gold category.
Convenience store bars.
Fast food franchises and food service business in general
• Natural fruit requirements can be supplied.
• High-tech machine. • Frozen product handling. • The machine will provide product
rapidly, taking care of the hygiene standards.
Purchaser and users, the developer.
40
Later, based on the assumptions developed in the mission statement, the next step was to
identify the next input, the customer needs. However, the customer needs were divided in two
categories, since convenience store operators and end users are considered customers.
The preliminary target specifications, were based on the information gained from the
customer needs and the mission statement, the basic requirements were established. Also, some
of the values exposed in this stage were gathered from the industry information.
Page 41
Concept Development Process
Clarify the problem
41
Once the inputs were completely addressed, it was possible to begin the concept
development process. Due to the complexity involved in the design of a new smoothie machine,
it was necessary to perform problem decomposition. Nevertheless, it is important to highlight
that because of the complexity expressed before, it was necessary to divide the process in two
levels: the smoothie production process and the cleaning process.
External Search
Subsequently, once the functional decompositions were completed, the external search
was performed to gather information from external sources about technologies available in the
market. Among the sources used were:
• Internet.
• Literature.
• Benchmarking.
The first action taken was the exploration of related products in use at convenience
stores. Later, the blender market was studied, as well as the cost involved in refrigeration
equipment to manage smoothie ingredients. Finally, a benchmarking activity was performed to
compare the closest technologies.
Internal search
Once the external search was completed the internal search was started. In this step the
developer performed a creative exploration of possible solutions to each of the sub problems, by
using all the information gathered in prior stages.
Page 42
42
Explore systematically
In this stage, all the information was synthesized by using classifications trees and
combinations tables. The combinations tables were used any given time the classification tree
became too complex to be developed.
Result
Once all the decisions were taken and hardware components of the machine were well
specified, it was necessary to illustrate through drawing the solutions to each of the sub
functions, as well as the step-by-step of the process. In those drawings, 3D views of the
machine's final arrangement were shown.
Summary
In this chapter the procedure implemented was discussed in the concept creation of a
smoothie machine, in which the information was decomposed, analyzed and synthesized until the
decisions of each of the machine parts were made.
Page 43
43
Chapter IV: Results
The market has experienced significant changes in customer's preference toward healthy
products, especially toward smoothies. Thus, the purpose of this study was to design an
automatic smoothie machine, through the simplification and optimization of processes in
smoothie production for convenience stores all over the United States, as well as other countries
where healthy products are demanded. The study involves a comprehensive overview of concept
development process, terms and definitions, as well as the technologies in which the machine
should be built. Finally, the study provides recommendations to assess, manage, and create
further studies that would lead to improvements in the design.
The study was focused on addressing the necessary inputs to begin the concept
development process. The concept was developed by performing a five step process. The first
step was to assure a well understanding of the challenges involved in the design of a smoothie
machine. Later, an exploration and evaluation of technologies available in the market was
performed. Additionally, graphical representations were used in the research to clearly illustrate
each of the product parts, and the concepts were synthesized until the final decision was made.
Later on, the smoothie machine was drawn in detail and a material cost was calculated.
Based on the information exposed on table 5 it was possible to determine the mission
statement of the project:
Mission Statement. Design an automatic smoothie machine for convenience stores; that
has the capability to rapidly deliver 100 percent real fruit smoothies, under the gold category, at
the right price. The smoothie machine will help support the future growth of our primary
customers, and increase the well being of our end users.
Page 44
44
The customer's needs were divided in two categories, convenience store operators and
end users. The result of the process is expressed below.
The following needs were addressed from the store operator's standpoint:
• Low labor cost.
• Easy maintenance.
• Low energy consumption.
• Affordability.
The following requirements were considered in the case of end users:
• Customers can see the product being blended.
• Clean process.
• Friendly user machine.
• The machine should be able to provide the product within a reasonable period of time.
Once the mission statements and the customer needs were addressed, it was possible to
determine the preliminary specification of the product to be developed. Among these
specifications were found:
• The process should take less than 70 seconds per customer, to provide the product within
the average time that it takes a regular customer to select a product at convenience stores.
• The machine should be able to manage solids, liquids and powder.
• The machine should use packaged frozen fruit to assure product freshness.
• The noise level should be between 40-65 DN, which means should be no noisier than a
dishwasher.
• The product dispensed per cup should be between 12 OZ (355 ml) and 16 OZ (500 ml).
• Blender should have at least a two horse power electric motor.
Page 45
45
• No waiting time between customers.
• The smoothies made by the machine should be under the Gold category.
• The auto cleaning process should use hot water as solvent.
Clarify the Problem
During the problem clarification was necessary to divide the process in two levels: the
smoothie production process and the cleaning process.
The figure 11 is the result of the first problem decomposition into basic functions needed
in the smoothie production process.
Input
Energy Materials
~ --(Ingredients) .. Signal
Figure 11. Level I, Problem Decomposition
Smoothie Machine
Output
Product --..
Subsequently, Figure 12 consists in the first problem decomposition of the cleaning
process.
Input
Energy Materials (Hot Water)
•
.--.------1> Signal
Figure 12. Level II, Problem Decomposition
Smoothie Machine
Output
Flushing --+
Once both levels were decomposed, it was necessary to perform a more detailed
decomposition. The result of this process can be seen in the next two figures.
Page 46
46
Energy
Matenals
(Ingredients) Apply Apply
_~_. Energy to Energy to ~ -", Blender Lid .-"; Blender Smoothie
,
Signal ,
, : I
,. .. ------_ .. -'- .. ------ -- -- -- -_ .. ---- --_. Microprocessor ___________ 1.._ .. w_ .. __ ......... "' ........... ,. ........ __ .. _ ..... ____ .. , .,
Figure 13. Level I, Functional Decomposition
Energy
Materials
(Hot Water)
convert Storage or _ Energy to ~ External
'--___ --l TransItional
,-------,
Hot water Liquid "1"---=.... Apply _I Draining 11---+-__ Production -+ pumping : Energy to .- -:, Process I
: Blender , 1. Flushing , " , " , " ~'" .. ,... ,. .". _ ....... _ .. ",t ::
~~~~~~ --- ------ ----1.----M-ic-ro-p-r-o-c-es-s-o-r--,I~ .. on .. - on _____ n _ ....... __ 0 _. _ .. 1 ________ .i
Figure 14. Level II, Functional Decomposition
The above figures indicate the use of a microprocessor, as the one responsible to control
each of the sub-functions during the smoothie production and the cleaning process.
External search
Based upon the information gathered from table 3, automatic hot beverage dispensers can
vary from prices of$I,OOO.OO (two flavors) to $2,386.00 (five flavors), being this segment is
responsible for 27 percent of the total food service sales in convenience stores.
Moreover, Slushy machines were the next equipment to be studied. Based upon the
information gathered in table 4 the price of these equipments can vary from $1,600.00 (one
flavor) to $3,000.00 (three flavors). Frozen products are responsible of eight percent of total
food service sales in convenience stores.
Page 47
47
Afterward, as can be seen in table 6, it was studied the blender market, in order to provide
a more accurate general idea of the current technologies used in the smoothie preparation.
Table 6
Blender types and prices
Blender Type Unit Price
Basic Unit 1/3 HP $100-$200
Smoothie Blender 1 to 2 HP, heavy-duty $300-$500
Smoothie Machine 2 to 3 HP, programmable, $600-$900 Sensitive electric motor
Automatic Smoothie BDI Blendtec® $3,000
Machine F'real ® $8,000
Additionally, based on the information gathered in table 2, the refrigeration equipment
involved in the smoothie preparation can be valued in $6,000.
Later on, based in the information gained from above table, it was possible to perform a
benchmarking activity in order to analyze the closer technologies to be outperformed.
As a result, in table 7, the BDI Blendtec ® analysis; and later in table 8 the f'real ®
milkshake and smoothie machine analysis can be seen.
Page 48
48
Table 7
Benchmarking activity BD! Blendtec ®
Pros Cons
• Use fruit purees. • High-tech features can be overwhelmed.
• Easy product handling, just plumbing systems. • Require certain level of expertise,
since the machine can manage 8
• Machine cost $3,000. different flavors and 64 combinations.
• Easy manufacturing process. • The target market of this machine
• Some machines are capable to is bars, rather than convenience handle automatically ice cube stores. portions.
• Requires extra space for product
• Low chances of product leaking. racks (Bag in the box technology).
• Within the silver category of smoothie (Fruit puree).
• Manual cleaning process.
• It can not be seen where products come from while are dispensed. No natural perception.
Page 49
49
Table 8
Benchmarking activity f'real ®
Pros Cons
• Designed to convenience stores. • Long shaft, increase vibration and as a result parts fatigue.
• Moderate acceptance among operators, with 4,000 locations. • Costly equipment, $8,000.00.
• Easy to use. • Complex manufacturing process, which includes: 273 different
• Have under counter refrigerator. pieces; 74 different suppliers.
• Easy product handling. • Within the silver category of smoothie.
• During the cleaning process the machine leaks.
• It can not be seen the product being blended.
Internal search
Once the external search was completed the internal search was stmied. Table 9 consists
of all the possible solutions to each of the main sub-functions evaluated in the problem
clarification process.
Page 50
Table 9
Level I: Solution to sub-problem product dispensing
Solid Liquid
• Auger wire. • Electric water pump.
• Manually.
• C02 driven
• Auger wire and pump. manually unpackaged.
• Pressure from
• Linear motion X, Y, Z. store.
• Robot hand. • Manually.
Table 10
Level I: Solution to sub-problem of product handling
Solid
• Internal freezer.
• External freezer.
Liquid
• Water tank.
• External Tap water.
• External water bottle.
50
Powder
• Hooper-Auger wire.
• Air pressure.
• Manually.
Powder
• Hooper.
• Paper bags.
Page 51
51
Table 11
Levelll: Solution to Sub-problem Hot water
Hot water production Liquid pumping
• Electric water heater tank. • Electric water pump.
• Tankless electric water heater. • C02 driven pump.
• Boiler. • Pressure from store.
• Solar water heater.
Table 12
Solutions to Sub-problem Apply Energy
Lid system Blending process Dispensing process
• Linear motion-Z • Automatically • Automatically by aXIS. activate. draining pipes
attached to
• Angular motion- • Push button. container. gear.
• Manually. • Manually
• Angular motion to pour product.
Explore systematically
Once all the options were addressed, all the information was synthesized by using
classifications trees and combinations tables. The result of this process can be seen in the figures
and tables following:
Page 52
52
The first process considered was the machine's energy source, because according to the
inputs established in the beginning of the process the machine will have high-tech features. For
that reason, it was decided to choose the wall outlet as primary source of energy to prevent
energy outage during peak hours (Figure 15).
Figure 15. Clasification tree, subfunction energy
The combination table below was performed to explore the best combination of product
handling and solid dispensing. This decision was considered critical, since the fruit is the main
ingredient used in smoothie's preparation.
The combination chosen it can be seen in the figure and the table below:
Frozen Fruit packaged
Product handling
Internal freezer
Dispense solid product
Auger wire.
External freezer· . '> Manually
Figure 16. Combination table, Frozen fruit
Auger wire and manually unpack.
Linear motion X, Y, Z
Blender
Page 53
53
Table 13
Pros and cons, Frozen Fruit
Pros Cons
• Proven technology available. • Increase the product time selection.
• Easy task for costumer. • Increase overall process time.
• It helps to reduce machine cost. • Increase variability.
• Increase customers' interaction in the preparation.
• Increase hygiene.
• Simpler arrangement of parts.
• Reduce technology complexity.
• Reduce machine weight.
• Long lasting product, since it is packaged.
The linear motion can be used in possible automatic unpacking processes; however it was
not taken into consideration because it would have increased dramatically the machine cost.
The following figure and table consist of the result of the sub-function water handling
and water temperature. In regards, the water temperature was a pretty straight forward decision,
since the product used by the machine is frozen fruit, the water temperature will not make a
remarkable difference to the final product.
The water source chosen was the store water, because the convenience stores water can
fulfill the two main prerequisite: pressure and cleanness; because most convenience stores are
Page 54
54
designed to manage several pieces of equipment that require certain levels of water pressure,
such as: hot beverage dispensers, slushy machines and car wash. On the other hand, from the
water quality standpoint, the FDA (2011) requires high levels of water purification in order to be
able to sell in store beverages.
Water
Product handling
Temperature Dispensing
process
Internal tank of Mineral water.
Filtered water from store
External mineral water source
Figure 17. Combination table, cool water
Table 14
Pros and Cons, Cool water
Pros
• Cheaper.
• Simple arrangement of part.
• Decrease machine weight.
• Easier process to customers.
• Proven technology.
• Some technologies already in place.
Cold
Natural Automatically
Manually
Cons
• In case of outage of water the
machine cannot operate.
Page 55
55
Figure 18 and Table 15 illustrates the best combination found it in the particular case of
powder handling and dispensing. The technology used in powder dispensing has been around
for centuries and its implementation is relatively cheap and simple.
Powder
B Product Dispensing handling process
Hooper Auger wire
Paper bags Air pressure Blender
Manually
Figure 18. Combination table, automatically powder dispensing
Table 15
Pros and Cons, Automatically Powder Dispensing
Pros Cons
• Better portion control. • Increase cost.
• Proven technology. • Increase the use of parts and
• Reliable and simple technology. technology.
• Cleaner process. • Increase complexity.
• Easy to manufacture. • The powder portion has to be fixed.
Figure 19 shows the combination chosen in the particular case of hot water production
and pumping processes. In addition, table 16 provides several advantages of using a tankless
water heater to the overall design.
Page 56
56
Filtered Water from
B store Produce Liquid hot water pumping
Electric water Electric water pump heater tank
Tankless water C02 pressurized Blender heater water pump
Boiler Pressure from store pipes
Solar heater
Figure 19. Combination table, Tankless water heater and store pressure
Table 16
Pros and cons, Tankless Water Heater and Store Pressure
Pros Cons
• Proven technology. • Limited hot temperature.
• Hygienic. • Limited hygiene.
• 60 percent less power consumption.
• Dramatically less weight.
• Simple arrangement of parts.
• Less water consumption.
• Increase available space within the machine.
Finally the last decisions were made by using classification trees. Figure 20, 21 and 22
show the result of this process.
Page 57
57
Figure 20. Clasification tree, subfunction Apply energy to Blender Lid
Figure 21. Clasification tree, subfunction Apply Energy to Blender
Figure 22. Clasification tree, subfunction Dispensing Process
Figure 22 consists of the result of the final product dispensing processes. This decision
was critical, because this design represents one of the differentiation points with the rest of the
technologies in the market, aside from the mobile lid in figure 20.
Page 58
58
Result
Figure 23 illustrates the solution to the final product dispensing commented in figure 22.
This final arrangement includes two blenders in order to avoid waiting time between customers
while cleaning. In addition, the container capacity established was 20 OZ or 600 ml; and the
serving size was established with 12 OZ or 355 ml per cup. Beside, about the C02 driven pump
was established a minimum discharge capacity of 100 mllsec or 3.4 OZ/sec
i ------ .------ - --I .
Product Dispensing
Level f
Container
:-\T--- Electric Motor
Flushing Process
Level II
Drain Pipes
C02 Pump
Figure 23. Solution to subfunction Dispensing Process
Upward Linear Motion
3D Front view Front view
ElectrlCMo/
Ud
Blender Jar -\ - 7 Figure 24. Solution to subfunction Apply Energy to Blender Lid, upward motion
Page 59
Downward Linear Motion
3D Front view Fron/view
,J I: " il r-!! .1 " :'
Figure 25. Solution to subfunction Apply Energy to Blender Lid, downward motion
59
Figure 24 and 25 illustrate the solution expressed in figure 20. It was decided to control
the linear motion of each of the lid container by using stepper motors, because it is required that
the Lid seals well every time the process is carried out.
Additionally, as can be seen in both figures, the design takes advantage of the linear
motion to help control the powder dispenser. Also, when the lid is placed at its maximum height,
a pin installed at the top of the lid pushes the mobile dispenser upward, transforming the linear
motion into angular motion, placing the powder dispenser in the exact position at internal edge of
the blender container.
The Blender Lid manages cool water and hot water
4 Hot Water I.' i.1.1 I Nozzle •
· ... ',::'E':·;::iF"
'_.!>\ . ,
\_------~;
Cool water is dispensed from the center hose
Figure 26. Solution to subfunction Apply Energy to Blender Lid, Lid description
Page 60
60
The figure 26 represents the solution of figure 21. Here, four nozzles pointing out to each
of the container's walls were used in order to assure the effectiveness of the cleaning process
while the hot water is running. Also, it was decided that the cool water is going to be pumped
through the container lid.
Each of the drawings below expresses the result of the water handling sub-function.
From both figures, it can be interpreted that simplicity is the most important characteristic, since
the water supply represents one of the most critical choices to reduce the machine complexity
and cost.
Hot water process
Electro-valve
Filtered wate;;~;~ ® --store
Takless Water Heater
Figure 27. Solution to subfunction Hot water
Cool water process
Filtered water from store
Electro-valve
Figure 28. Solution to subfunction cool water
Figure 29 illustrates in more detail the powder dispensing operation, which consists of
one hoper with two auger wires at each of the sides of the machine. Every time the blender lid
Page 61
61
reaches its highest position, the auger wire will spin one revolution, providing with the necessary
amount of product for the smoothie.
Powder
Hooper
Figure 29. Solution to subfunction Powder Dispensing
Figure 30. Machine Noise control arrengement
One of the preliminary specification established from the beginning of the process was
related to the necessity to control the noise. In this regard to accomplish this requirement each of
the blender motors are going to be cover by using noise isolation material (figure 30).
Page 62
62
Once, one by one, all problems were solved, it was necessary to illustrate graphically,
how the whole system works. The subsequent figures show the step-by-step progression of each
of the processes.
Figure 31. Solution to Process Level I
5_C02 activates the Pump
Figure 31 illustrates the entire level I process in detail. Once the customer has chosen the
fruit from the under counter fridge, the frozen fruit is unpackaged and dispensed manually
through the machine door, falling into the container. Subsequently, depending on the customer's
preference toward sugar, the powder can be dispensed. Afterward, the cool water is dispensed
through the container lid, following the blending process. Once the product dispensing process
has started and the cup is taken by the customer, the door is closed prepare the machine for the
cleaning process.
Figure 32 shows the level II or cleaning process, which is a process made basically by
spraying hot water through the blender lid and the whirlpool formed by the blender when
activated.
Page 63
Figure 32. Solution to Process Level II
Levell ends
+-
8. Door is closed
Level II Starts
2. Hot water is blended
4. Drain ~ Process with
hOt water activated
3. C02 actIVates! 5. Flushing the Pump
16. Water Sewer
, _______ . ____ .. __________ . ______________________ !::f!_v..f!!_~:J_~_~':£'?!!~~E!!?=_e.~~ ____________________________________________ ,
! ! ! ! I ! c ____________ .. ______ . _______________________________________________________________________________________________________ J
Leve/II: 70 Seconds process -----------------------------------------------,
i 1
! !
i ,----._----------_.----_._--------_._---_._-----------------------------------------------------------------------------------------, Figure 33. Flow chart of the entire process
63
The flow chart above shows in detail the process algorithm. From the figure, it can be
interpreted that each blender works independently of the other, because the cleaning process
must begin immediately after the smoothie is dispensed and the small front door is closed, in
order to ensure the effectiveness of the cleaning process.
Page 64
Frozen FruIT Inlet
Door
freezer
Figure 34. Machine external apperance
64
C02 Supply
The figure 34 shows the machine's final external apperance. As seen in the figure, in
order to make the machine user friendly, it uses lights to indicate to customers which blender is
available to produce smoothies. For instance, once the little front door is closed the light is
turned off, automatically turning on the light of the other blender, guiding the customer to place
the fruit in the right container.
Finally, table 17 illustrates the estimated material cost of the machine. In addition, based
on table 6 the machine price was set to $6,000.00, in order to place it in between the two similar
technologies and $2,000.00 cheaper than the closest one.
Page 65
65
Table 17
Material Cost
Item Quantity Unit Price Total
Under counter fridge 1 $1,500.00 $1,500.00
Stepper Motor 2 $20.00 $40.00
Microprocessor 1 $200.00 $200.00
Wiring 1 $5.00 $5.00
Threaded Rod 1 $13.00 $13.00
Linear guide 1 $5.00 $5.00
Bearings 4 $2.50 $10.00
Customized Lid 2 $40.00 $80.00
Blender Jar 2 $25.00 $50.00
Blender motor 2 $100.00 $200.00
C02 driven Pump 2 $230.00 $460.00
Plumbing 1 $15.00 $15.00
Hooper 1 $20.00 $20.00
Auger wire 2 $1.00 $2.00
Gears and Motors 2 $7.00 $14.00
Internal/Ext panels $200.00 $200.00
Motor isolation $10.00 $10.00
Tankless w/heater 1 $200.00 $200.00
Manifold 1 $50.00 $50.00
Total $3,074.00
Adapted from Ebay Inc. (2011)
Summary
In this chapter was discussed the result of each of the five step of concept development
process. Also, it was explained the step-by-step of the machine functionalities, as well as the
estimated material cost and the machine price.
Page 66
66
Chapter V: Discussion
The market has experienced significant changes in the consumer's preference toward
healthy products, especially toward smoothies. Due to these changes, customers are demanding
fresher quality ready-to-go products at convenience stores.
This market outlook represents a substantial business opportunity through the
development of technologies and products that can help to align efforts capable to satisfy the
market demand for the coming years. Therefore, the purpose of this study was to develop a
product concept for an automatic smoothie machine, through the simplification and optimization
of processes for smoothie production for convenience stores all over the country.
Limitations
• The study is limited only to the concept development process, which is the main creative
process of product development. In addition, across this research the process performed
was made individually, even though some references highlighted the use of teams to
develop certain methods.
• Cost estimates are accurate.
• The smoothie market continues growth.
Conclusions
In this project it can be concluded that this machine has large potential, since
there are almost no technologies available that serve this growing market at convenience stores.
The machine designed has the capability to provide the product every 70 seconds or 55
smoothies per hour. In addition, the convenience stores market is expected to reach $800 billion
in sales, in two years time, driven primarily by changes in customer preferences for ready-to-go
Page 67
food and drinks. Also the price proposed represents a $2000 saving when compared to the
closest technology.
Recommendations
67
Recommendations suggest that further studies be done once the prototyping phase has
started. It is necessary to designs an experiment to reduce possible sources of variability during
the smoothie production. Besides, it is recommended to measure containers' hygienic level after
is used, because if the machine can not meet the required levels, it is suggested to take into
consideration the use of a boiler as the source of hot water. In addition, performing a water test is
necessary to measure the water quality, because water is a critical ingredient in the smoothie
preparation.
It is recommended to test different sizes of containers as well as the amount of water used
in the cleaning process to measure the whirlpool formed in order to assure the effectiveness of
the cleaning process.
It is suggested to review the pressure capabilities of the store before any equipment is
sold, in order to assure the enough pressure is available for proper machine operation.
Summary
In this chapter was discussed an overview of project purpose, followed by the limitation
surround the concept development process. Later, it was presented the conclusion of project, and
finally, recommendations to further studies were provided.
Page 68
68
References
American Diabetes Association (ADA). (2011, January 16). Diabetes Statistic, Retrieved from
http://www . diabetes. orgl diabetes-basi csl diabetes-statisti csl
Bendall, D. (2005). Blend your Way to Profits. Restaurant Hospitality, 89(6), 102.
Retrieved from MasterFILE Premier database.
Berry, D .. (2010, June). Holistic HALO. Dairy Foods, 111(6),34,36,38,40,42. Retrieved
October 21, 2010, from ABI/INFORM Global. (Document ID: 2069500161).
Big retailers think small. (2004, September). Country Monitor, 12(35), 1. Retrieved October 21,
2010, from ABI/INFORM Global. (Document ID: 813373261).
Business Monitor International (BMI). (2010, October). Australia Food and Drink Report,l-
89 Retrieved October 20,2010, from ABIIINFORM Trade & Industry. (Document ID:
2123565611).
Business Monitor International (BMI). (2010, October). Brazil Food & Drink Report, 1-77.
Retrieved October 20, 2010, from ABIIINFORM Trade & Industry. (Document ID:
2123571511).
Business Monitor International (BMI). (2010, October). China Food & Drink Report,1-96.
Retrieved October 20, 2010, from ABIIINFORM Trade & Industry. (Document ID:
2123582721).
Business Monitor International (BMI). (2010, October). France Food & Drink Report,1-72.
Retrieved October 20, 2010, from ABIIINFORM Trade & Industry. (Document ID:
2141583331).
Business Monitor International (BMI). (2010, October). Germany Food & Drink Report, 1-
Page 69
69
74. Retrieved October 20,2010, from ABI/INFORM Trade & Industry. (Document ID:
2123593931).
Business Monitor International (BMI). (2010, October). India Food & Drink Report,1-89.
Retrieved October 20,2010, from ABI/INFORM Trade & Industry. (Document ID:
2147517011).
Business Monitor International (BMI). (2010, October). Mexico Food & Drink Report,1-95.
Retrieved October 20, 2010, from ABIIINFORM Trade & Industry. (Document ID:
2141588291).
Business Monitor International (BMI). (2010, October). Japan Food & Drink Report, 1-78.
Retrieved October 20,2010, from ABIIINFORM Trade & Industry. (Document ID:
2147517121)
Business Monitor International (BMI). (2010, October). United Kingdom Food & Drink Report,
1-77. Retrieved October 20, 2010, from ABI/INFORM Trade & Industry. (Document
ID: 2147520621).
Blendtec. (2011). Retrieved from http://www.blendtec.com/
Convenience Store Count, (2010). U.S. NACSonline, Retrieved from
http://www.nacsonline.comINACSlNews/FactSheets/Scopeoflndustry/Pages/IndustryStor
eCount.aspx
Convenience Store Sell Time, (2009). U.S. NACSonline, Retrieved from
http://www.nacsonline.comINACSlNews/FactSheets/ScopeoflndustryIPages/Convenienc
e.aspx
Changes in the big beverage market. (2008). Dairy Foods, 109(11), 80-88. Retrieved from
Business Source Premier database.
Page 70
Doucette, L. (1998, March) Foodservice Equipment & Supplies. Vol. 51, Iss. 3, p.
29-31 (2 pp.).
Ebay Inc. (2011). Retrived from http://www.ebay.coml
Food and drugs administratios (FDA). (2011). State Retail and Food Service Codes and
Regulations by State, Retrieved from
70
http://www. fda. gov IF ood/F oodSafety IRetailF oodProtectioniF ederalStateCooperati veProg
rams/ucm 122814.htm
Food and Drugs Administration (FDA). (N.D). What is the meaning of'natural' on the label of
food?, Retrieved from
http://www.fda.gov/AboutFDAITransparency/Basics/ucm214868.htm
Ford Motor Company. (2010). Innovator, Industrialist, Outdoorsman: Henry Ford Started It All,
Retrieved from http://corporate.ford.comlabout-ford/heritage/people/henryford/650-
henry-ford
Frigidaire. (2008). History, Retrieved from http://www.frigidaire-intl.com/history.asp
Global Smoothies Market to Reach $9.0 Billion by 2015, According to New Report by Global
Industry Analysts, Inc .. (2010). PRWEB, Retrieved from
http://www.prweb.comlreleases/smoothies_market/frozen_mix_smoothie/prweb3808804.
htm
Hamaker, Sarah. (2009, April). Strong brew. NACS Magazine, Retrieved from
http://www.nacsonline.comINACS/Magazine/PastIssues/2009/April2009/Pages/CCUHot
Disp.aspx.
International Franchise Association (IF A). (2010). Beverage directory, Retrieved from
http://www.franchise.org/Franchisebycategory.aspx?category=g-bev
Page 71
Juice and smoothie association (JASA). (2000). Smoothie History, Retrieved from
http://www.smoothiecentral.com/Flashsite/index.html
Juice and smoothie association (JASA). (2000). Smoothie Definitions, Retrieved from
http://www.smoothiecentral.com/Flashsite/index.html
71
LaFave, C. (2008, July). Smoothie Moves. Restaurants & Institutions, 118(11),43. Retrieved
February 3, 2011, from ABIIINFORM Global. (Document ID: 1512314211).
Mack. (2011). Blending Milkshakes: How Tough Can it Be?, Retrieved from
http://www.mack.com/page.php?name=Newsletter-Summer-2009-
1 &rt=47 &sub=Newsletter-Archives.
McDonald's Corp. (2010). Franchising Notable Facts, Retrieved from
http://www.aboutmcdonalds.comlmcd/franchising/us _ franchising/why _ mcdonalds.html
Organic Trade Association (OTA). (2010). U.S. Organic Industry Overview, Retrieved from
http://www.ota.comlorganic/mt/consumer.html
Oza-Frank, R., & Narayan, K. (2010). Overweight and Diabetes Prevalence Among US
Immigrants. American Journal of Public Health, 1 00(4), 661-668. Retrieved from
Academic Search Complete database.
Pape, P. (2009). Ice Cold Profits. NACS Magazine.
http://www.nacsonline.comINACS/Magazine/PastIssues/2009IFebruary2009/Pages/FebC
CUFrozDisp.aspx.
Pape, P. (2010, March). Category close-up: frozen dispensed beverages - frozen assets. NACS
Magazine, Retrieved from
http://www.nacsonline.comINACS/Magazine/PastIssuesI20 1 0/March20 1 O/Pages/CCUFr
ozenF oods.aspx
Page 72
72
Toops, D. (2007). How did the food industry get (from there) to here?, in Beckley, J. H, Foley,
M. M, Toop, EJ, Huang J. C, Prinyawiwatkul , W. (Eds). Accelerating New Product
Design and Development.
Ulrich, K, & Eppinger, S. (2008). Product design and development. New York: McGraw-Hill
U.S Census Bureau, (2010). Monthly retail trade andfood services Washington, DC. Retrieved
from http://www.census.gov/retail/mrts/www/benchmark/20 1 O/html/naicsdef.html
United States Department of Agriculture (USDA). (2010). What is organic production?,
Retrieved from
http://www.nal.usda.gov/afsic/pubs/ofp/ofp.shtml
U.S. c-stores to see 5 percent CAGR growth by 2013. (2009, June 10). CSNews, Retrieved from
http://www.csnews.com/top-story-
u.s._ c _stores_to _see _5 ~ercent_ cagr_growth _by _2013-50716.html.