CONCEPT FUND SOLUTIONS PLC (An umbrella fund with variable share capital and segregated liability between funds) Annual Report and Audited Financial Statements for the financial year ended 31 December 2017
Transcript
CONCEPT FUND SOLUTIONS PLC
(An umbrella fund with variable share capital andsegregated liability between funds)
Annual Report and Audited Financial Statements for thefinancial year ended 31 December 2017
CONTENTSPage
General Information 4
Directors’ Report 15
Statement of Directors’ Responsibilities 21
Report of the Depositary to the Shareholders of Concept Fund Solutions plc 22
Independent Auditor’s Report to the Members of Concept Fund Solutions plc 23
Investment Manager's Report (Market Commentary and Outlook) 29
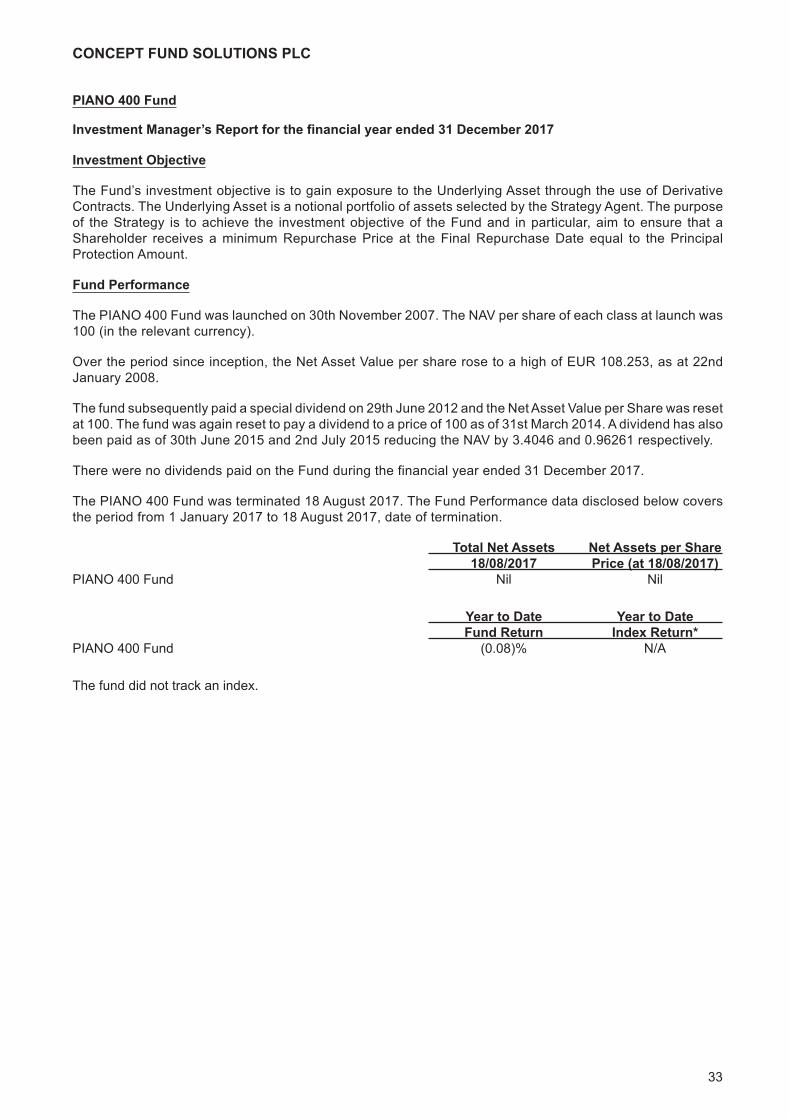
PIANO 400 FundInvestment Manager’s Report 33
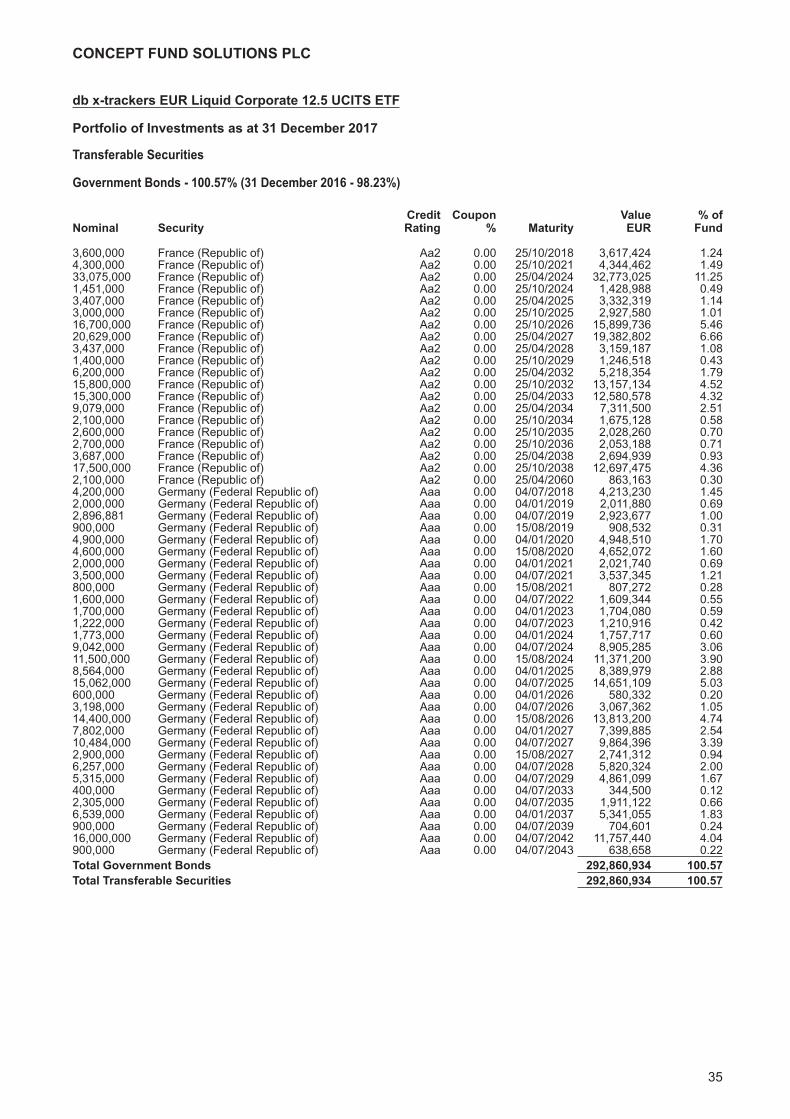
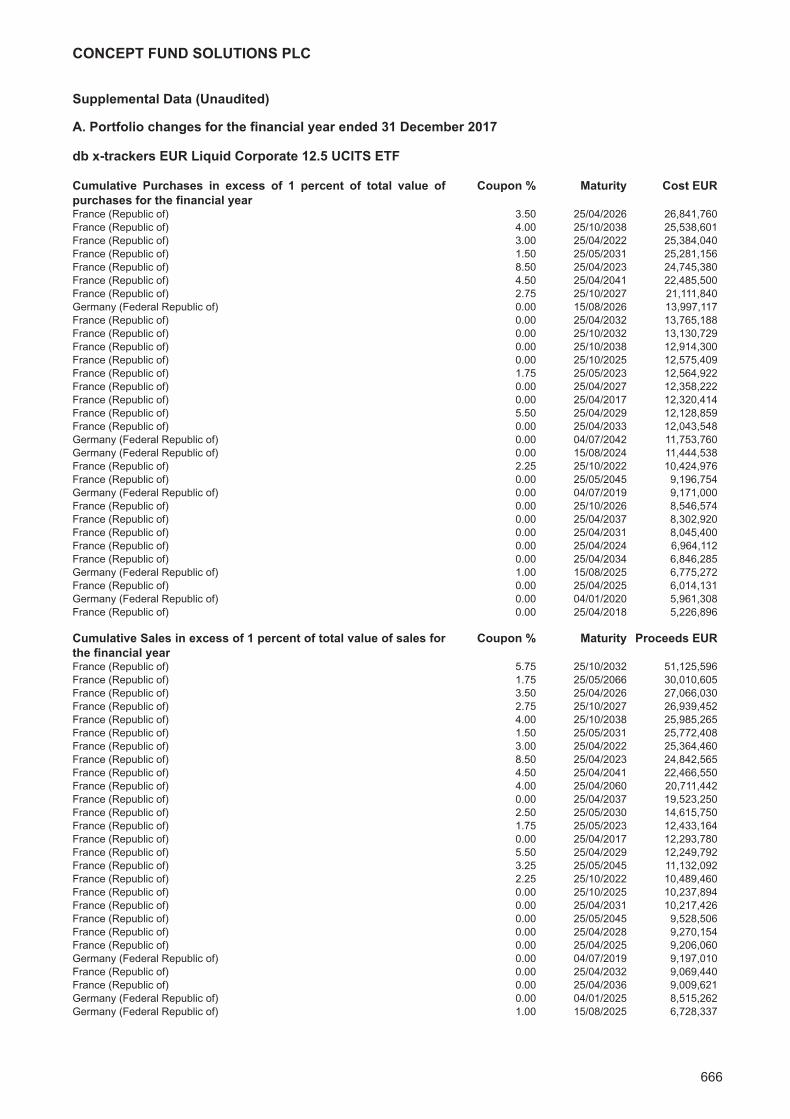
db x-trackers EUR Liquid Corporate 12.5 UCITS ETFInvestment Manager’s Report 34Portfolio of Investments 35
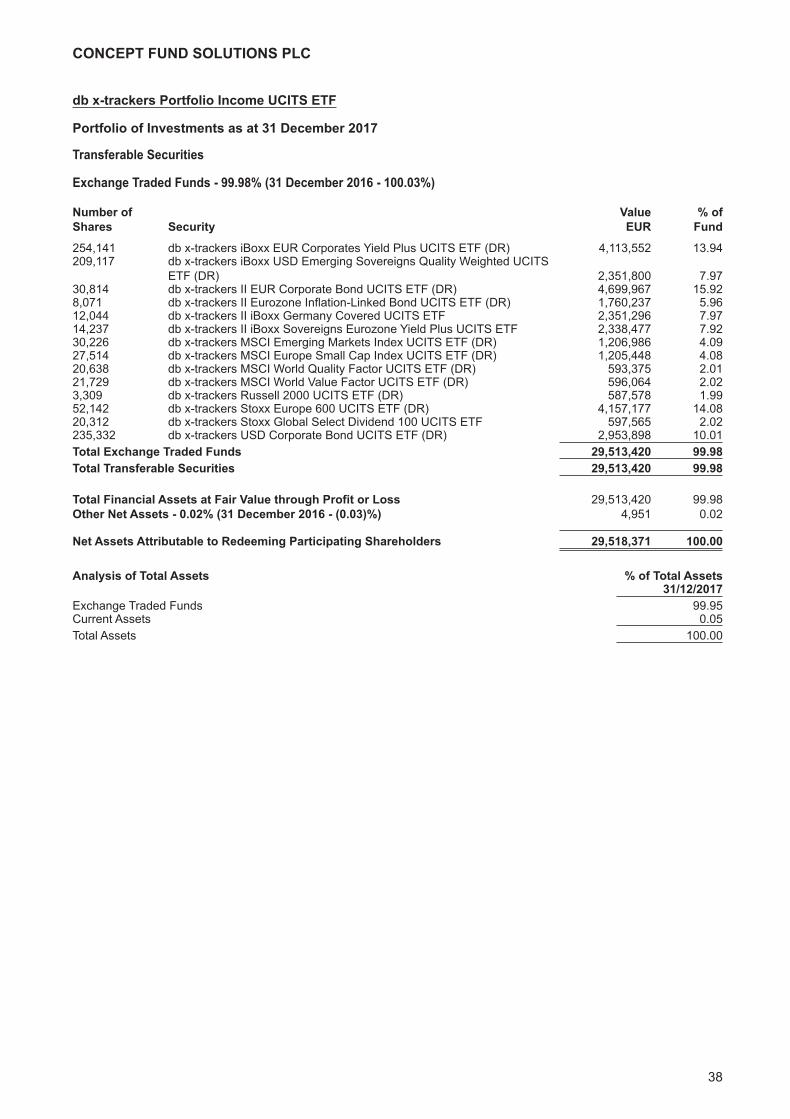
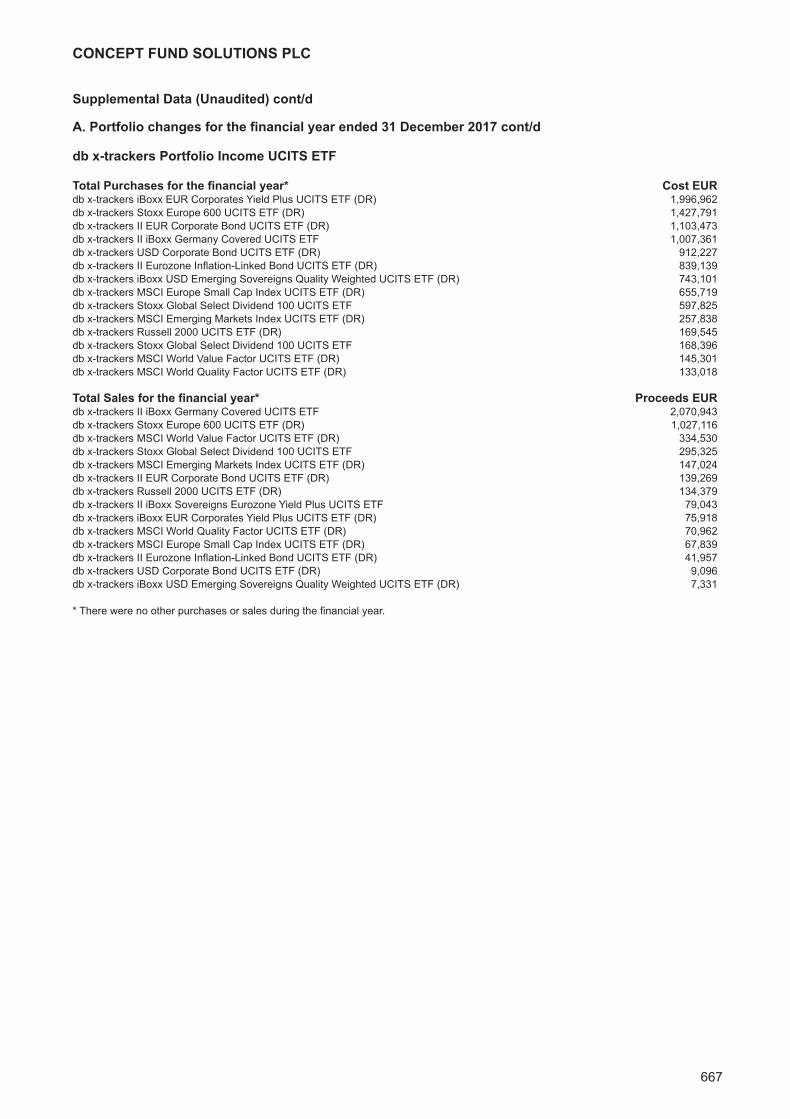
db x-trackers Portfolio Income UCITS ETFInvestment Manager’s Report 37Portfolio of Investments 38
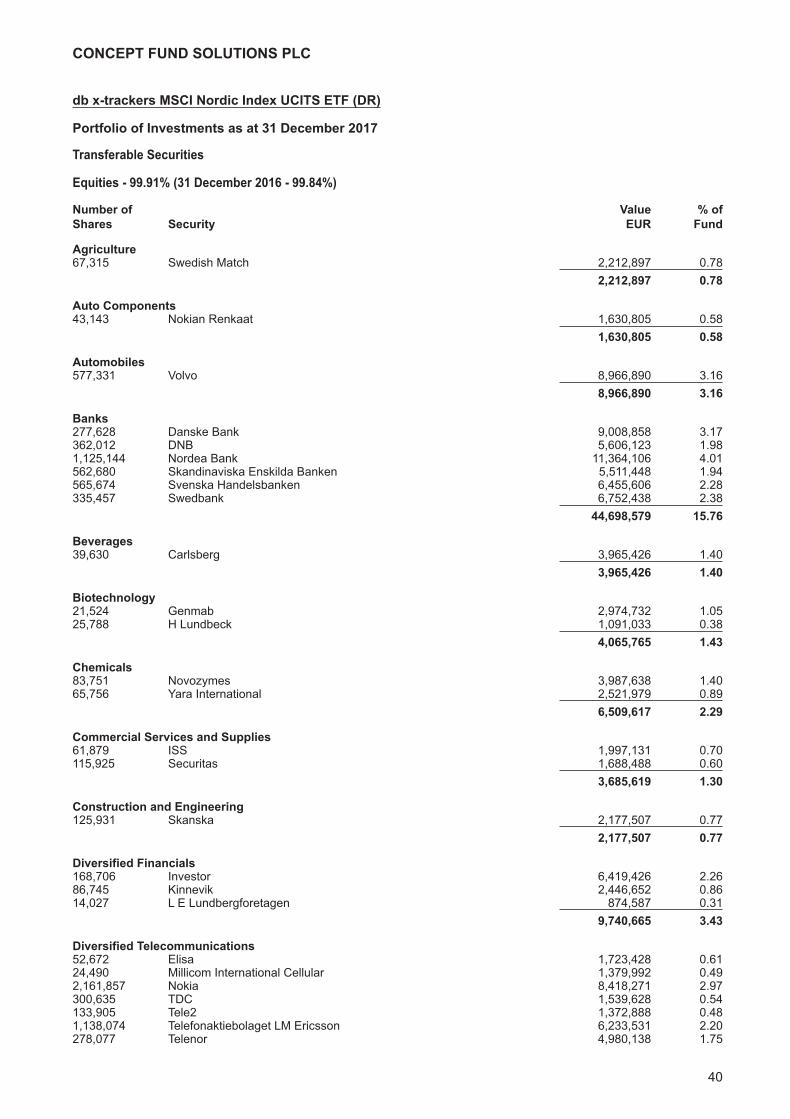
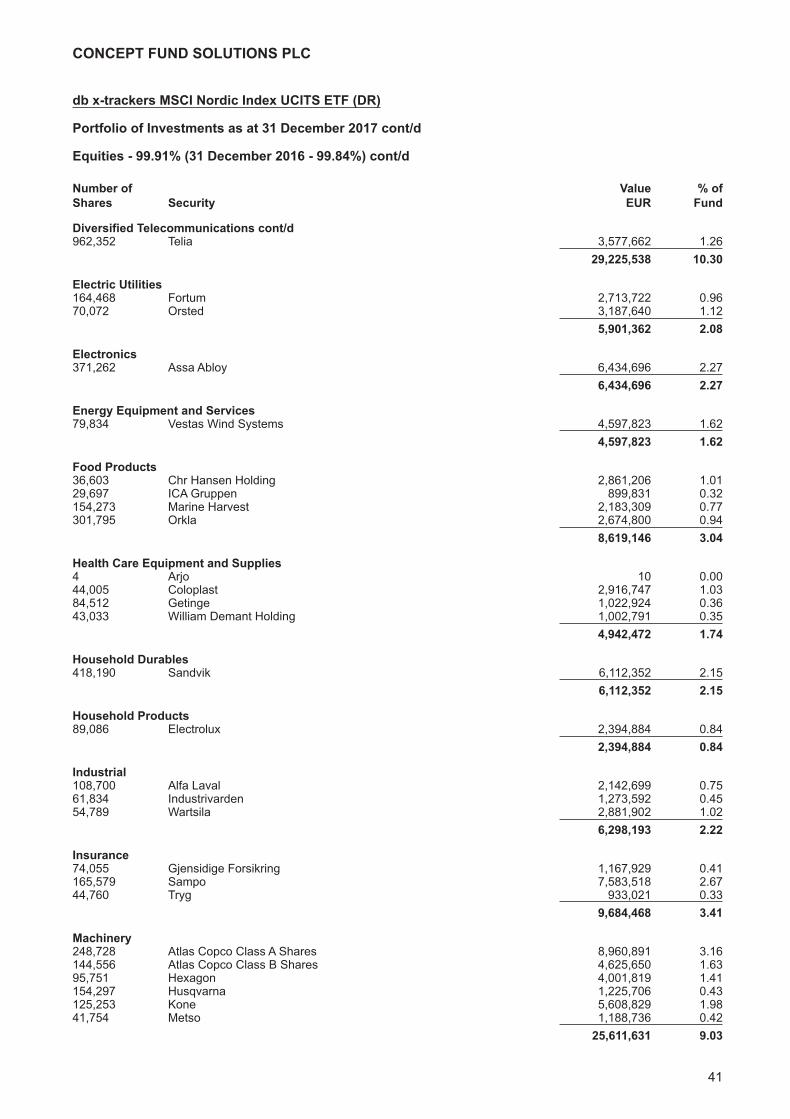
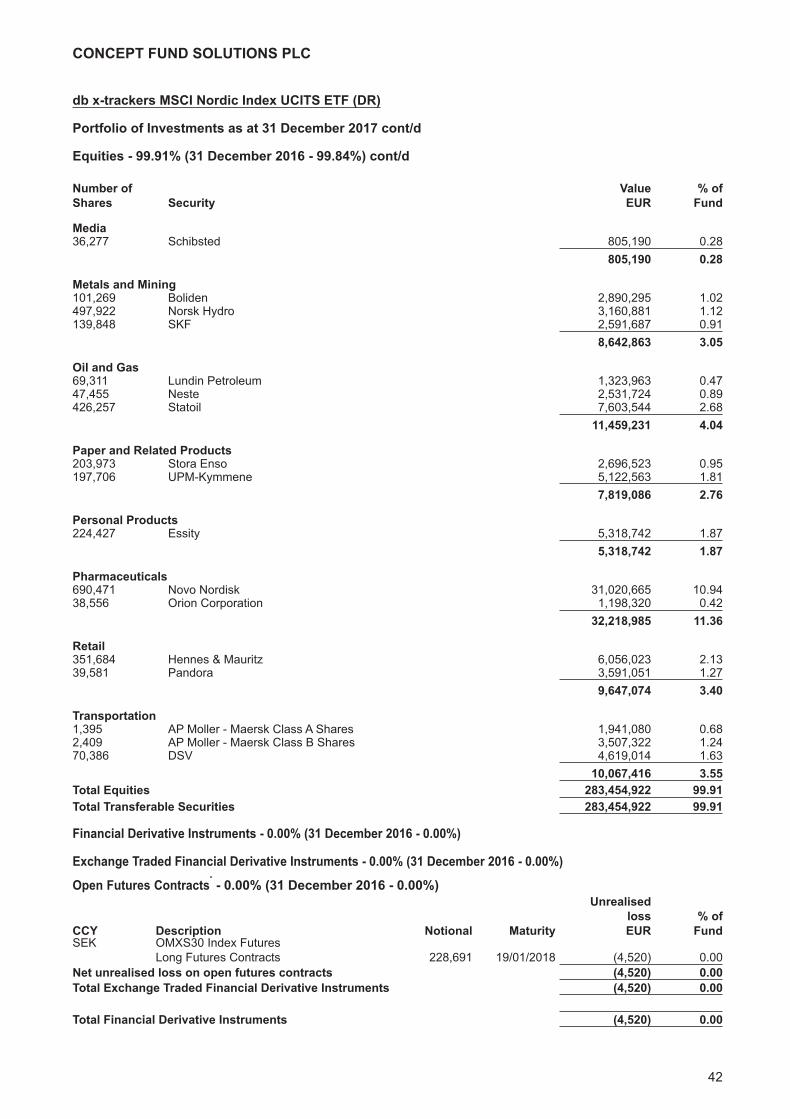
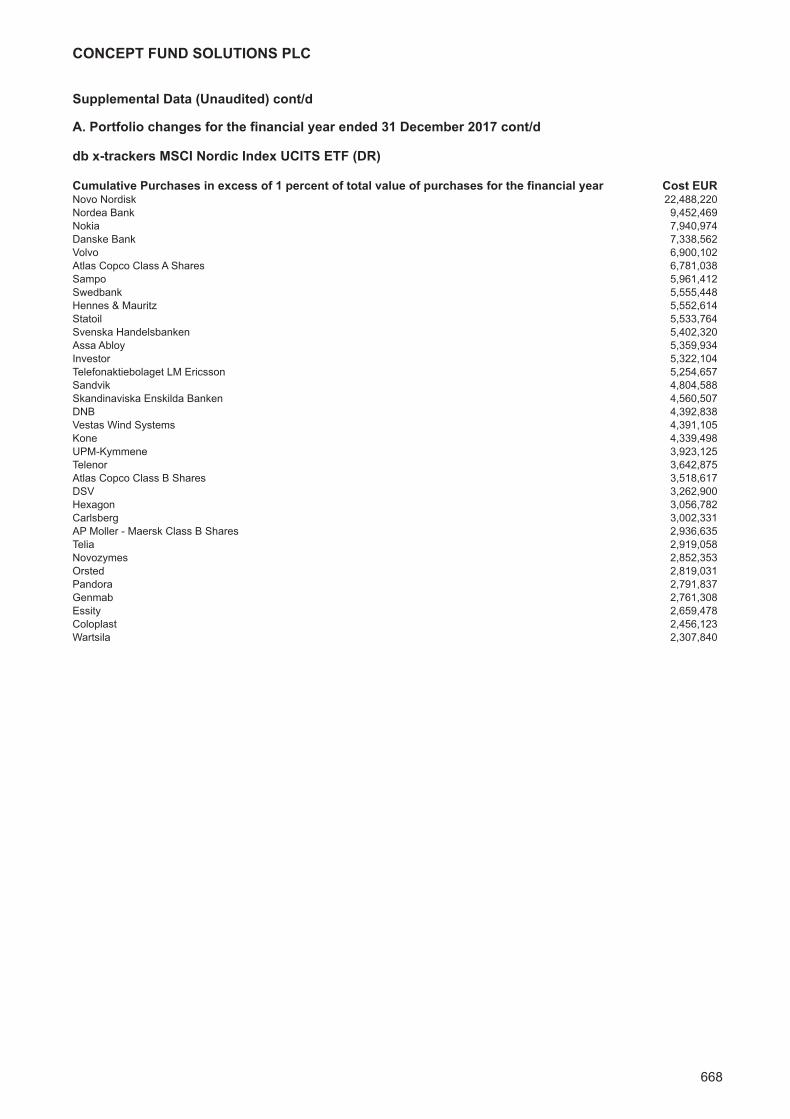
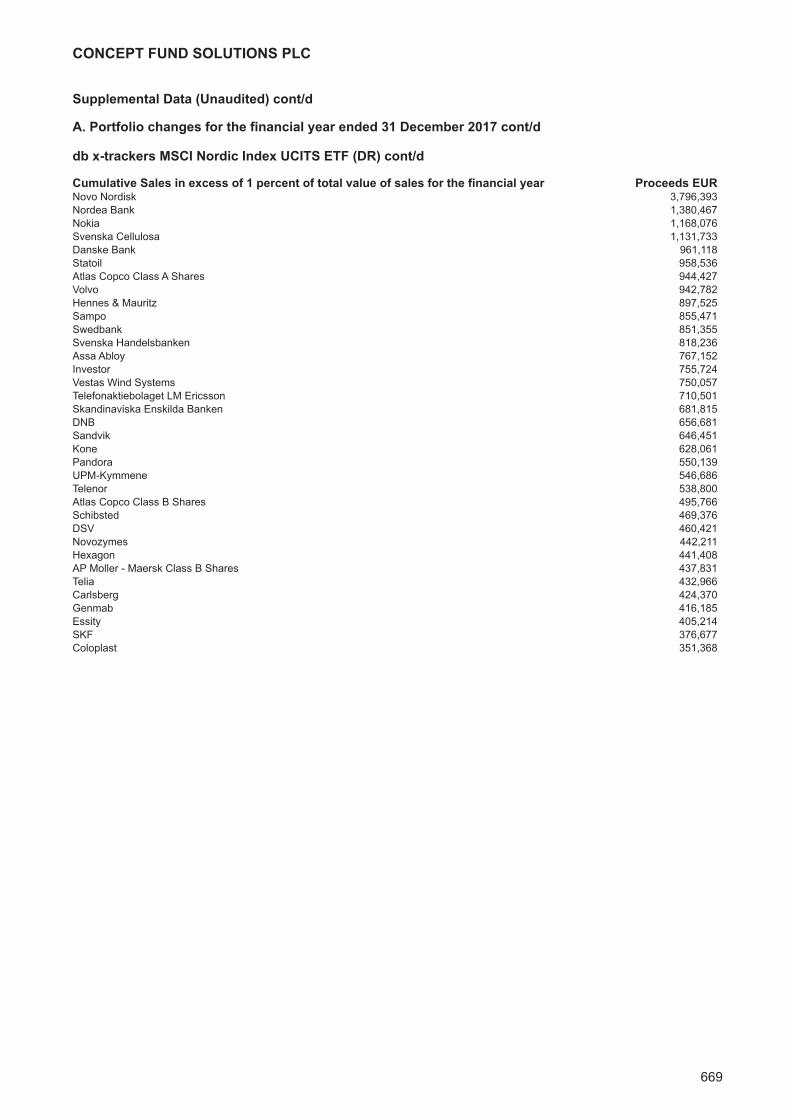
db x-trackers MSCI Nordic Index UCITS ETF (DR)Investment Manager’s Report 39Portfolio of Investments 40
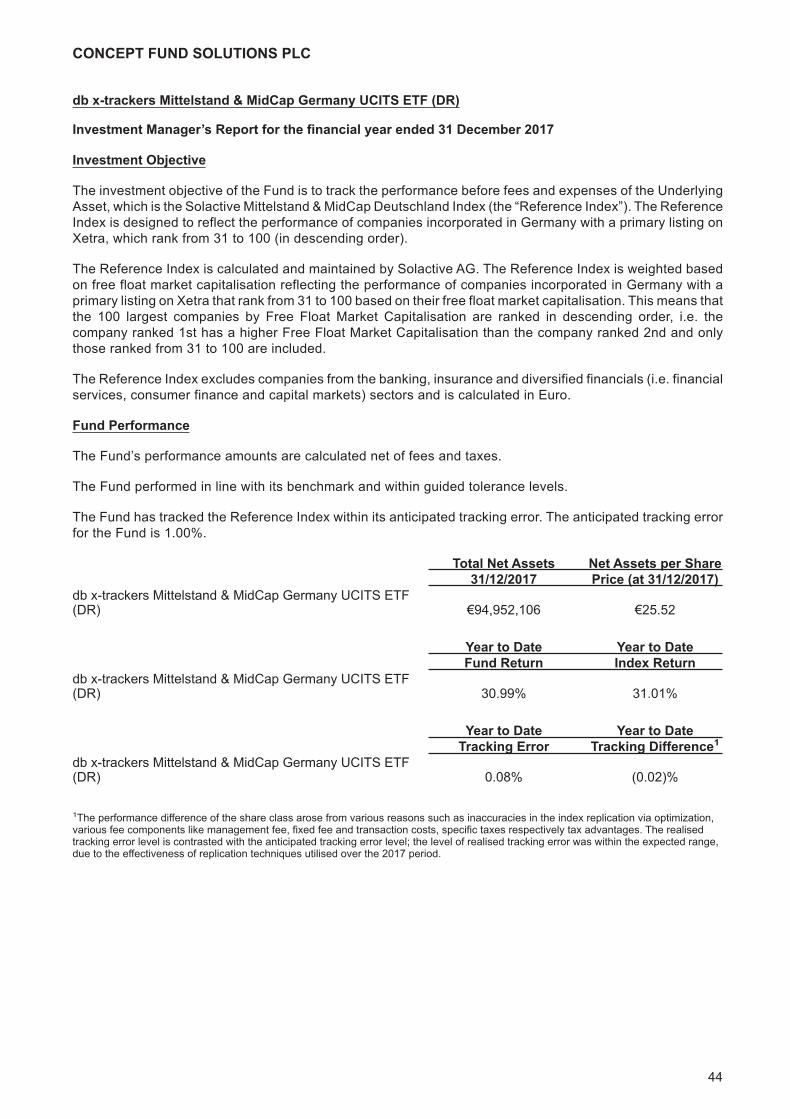
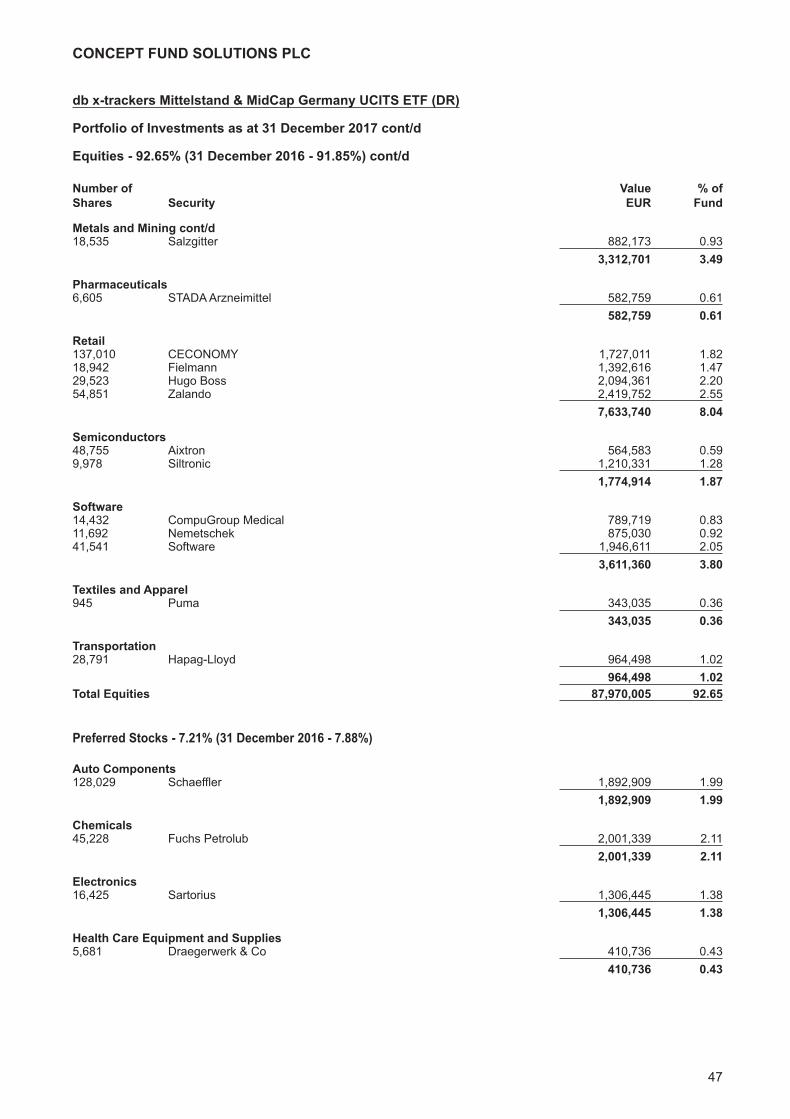
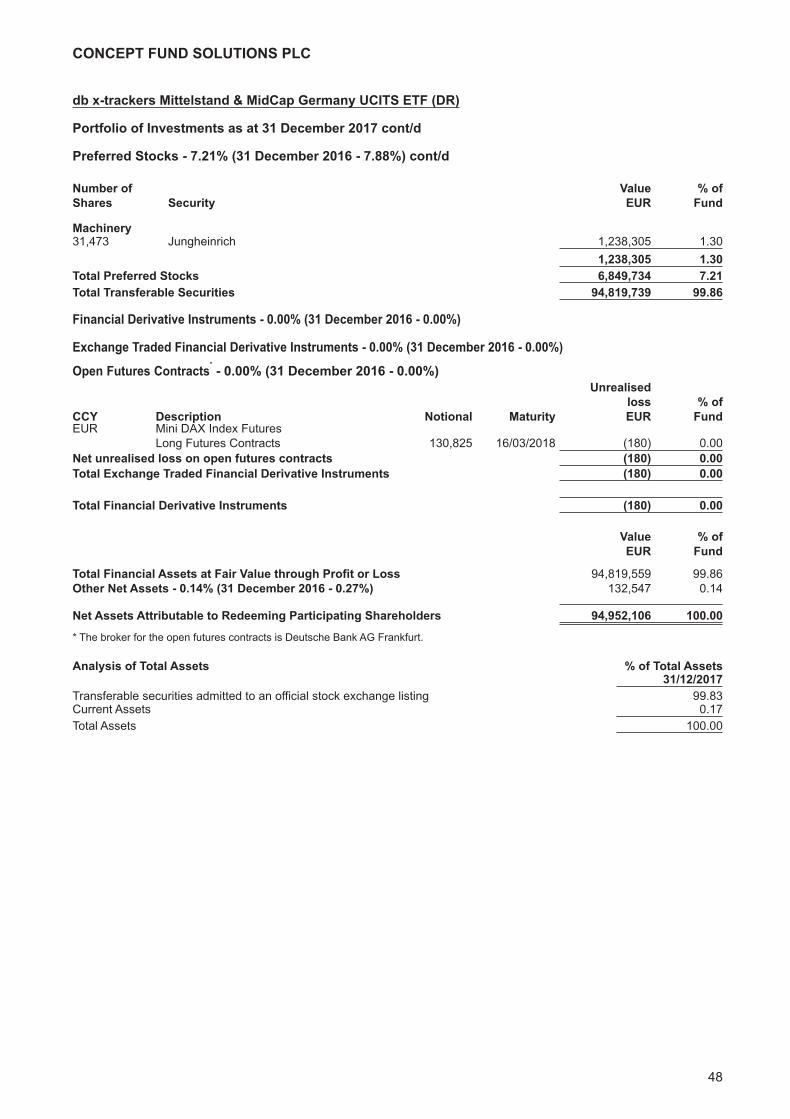
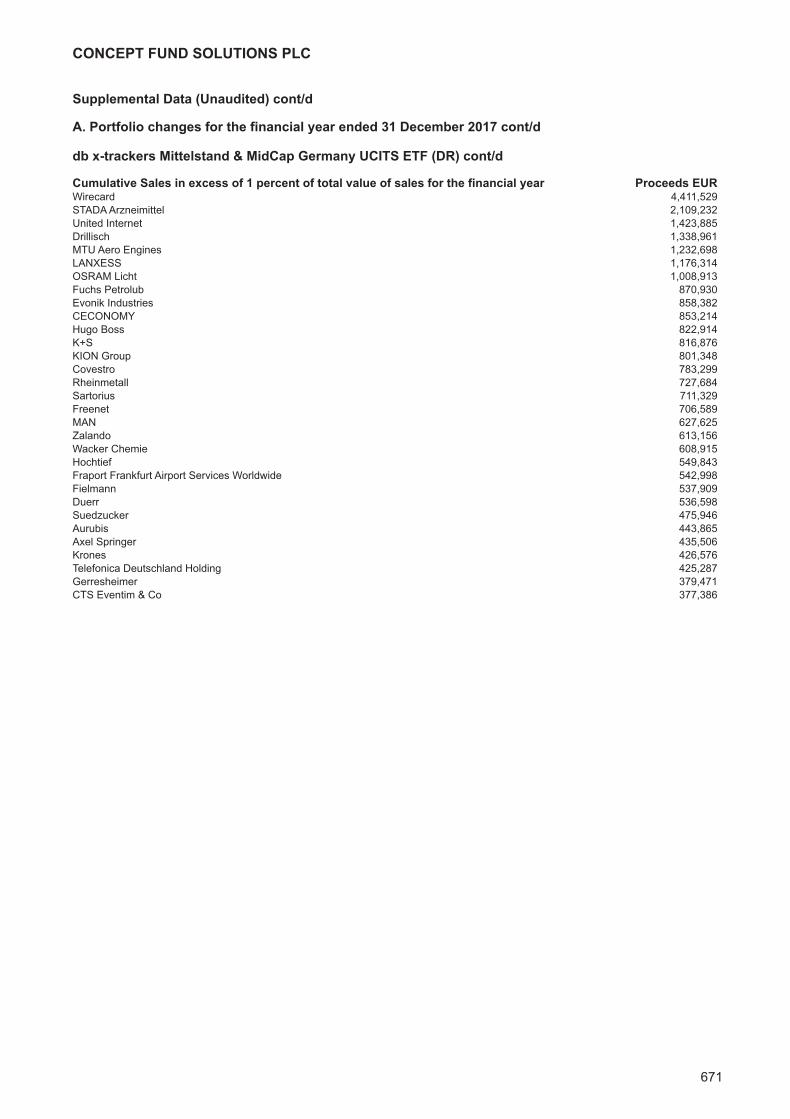
db x-trackers Mittelstand & MidCap Germany UCITS ETF (DR)Investment Manager’s Report 44Portfolio of Investments 45
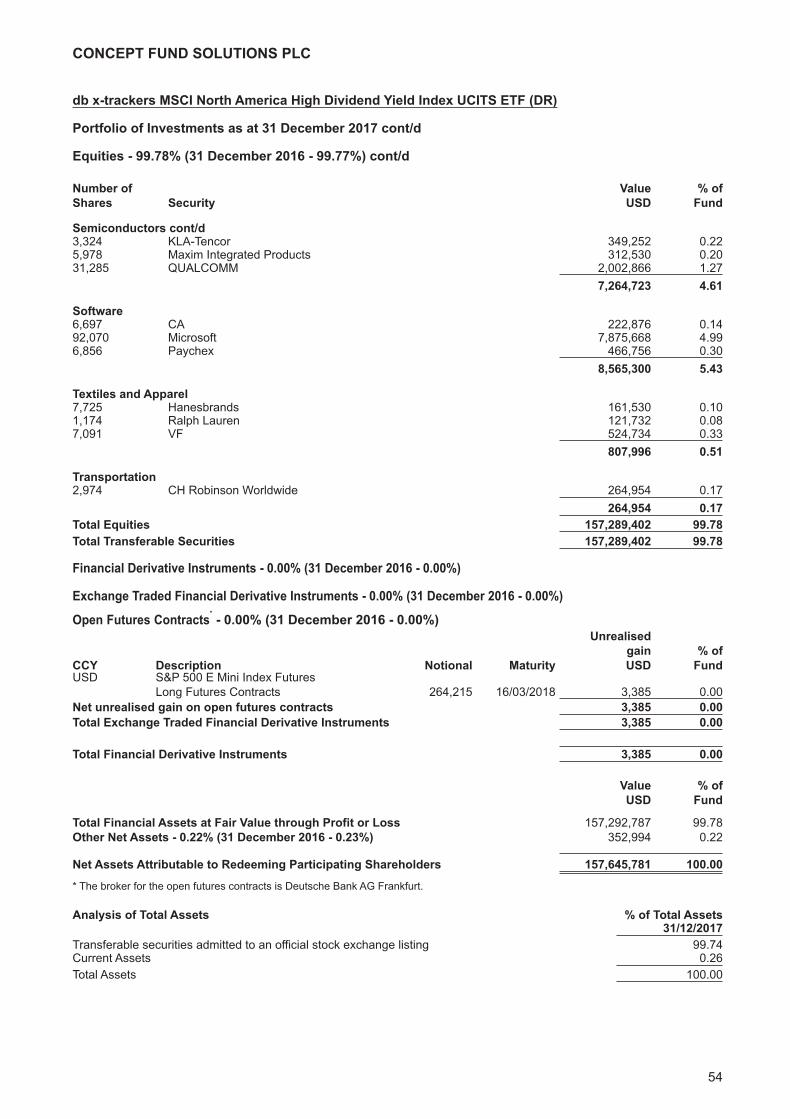
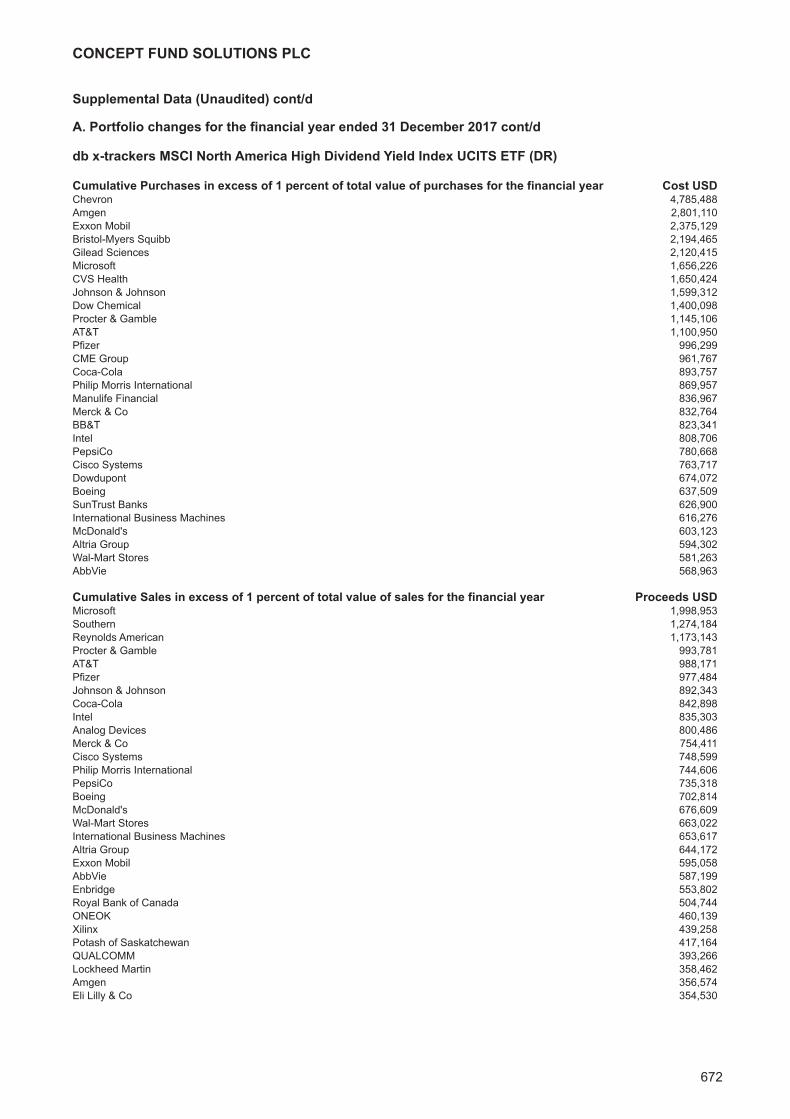
db x-trackers MSCI North America High Dividend Yield Index UCITS ETF (DR)Investment Manager’s Report 49Portfolio of Investments 50
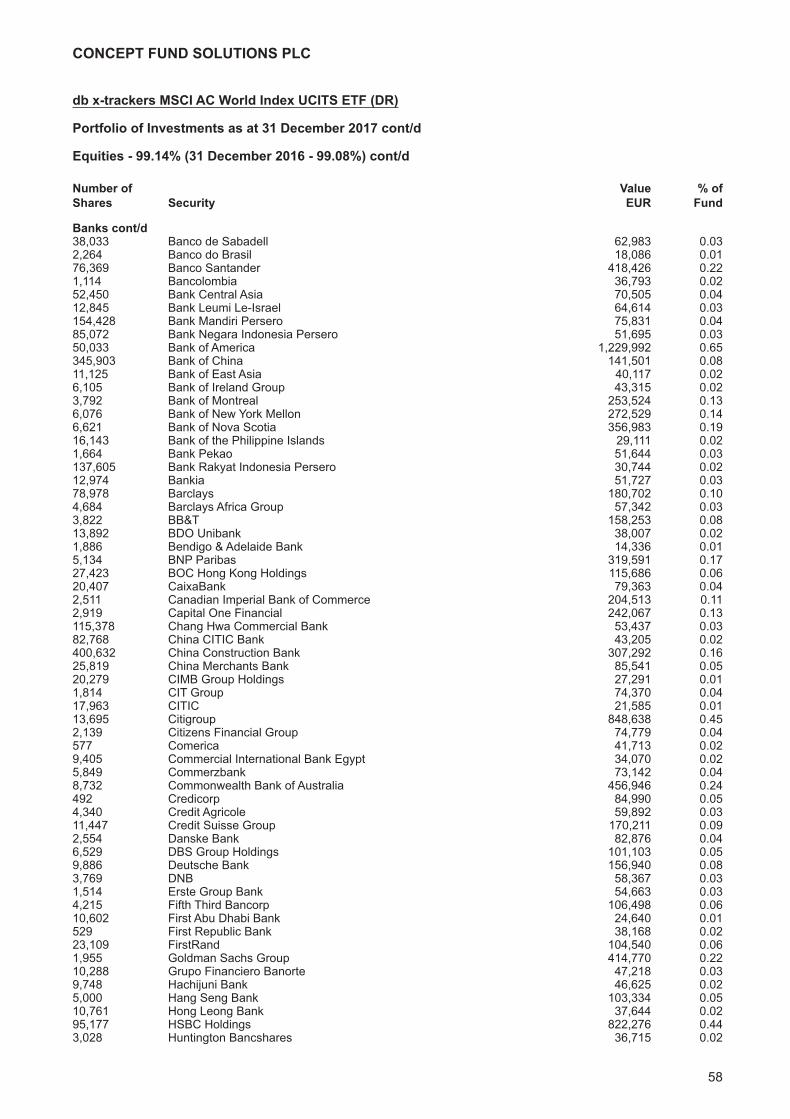
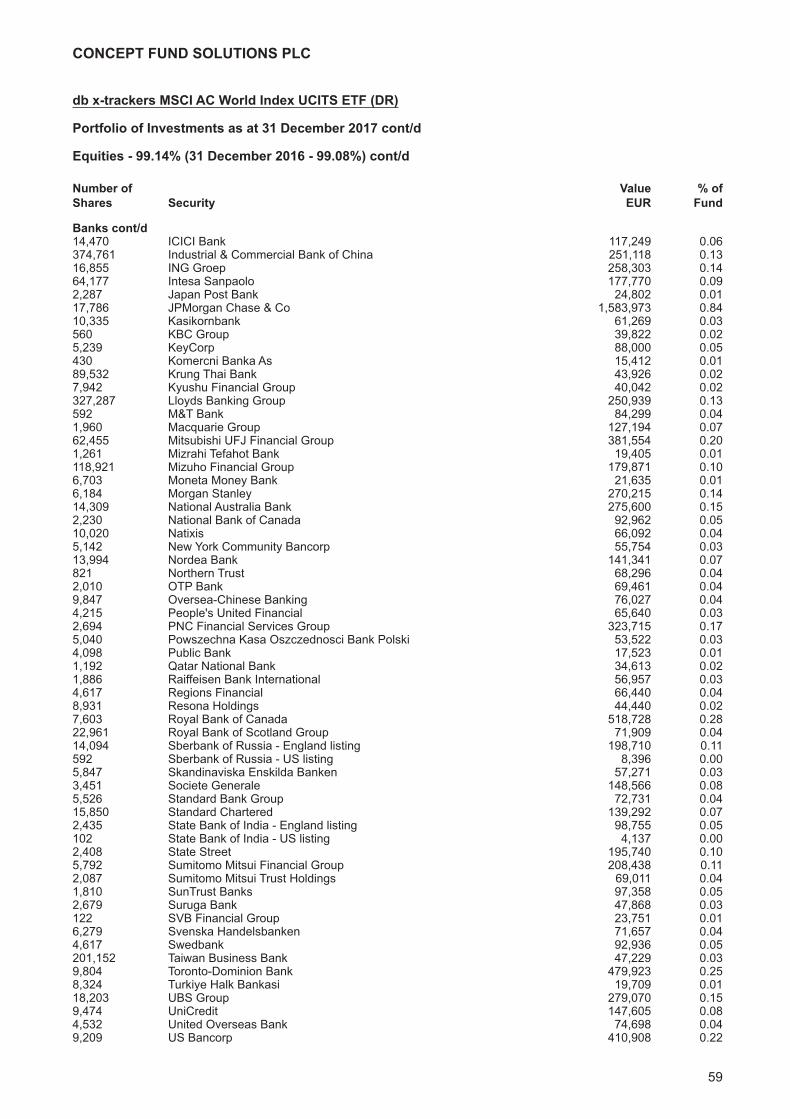
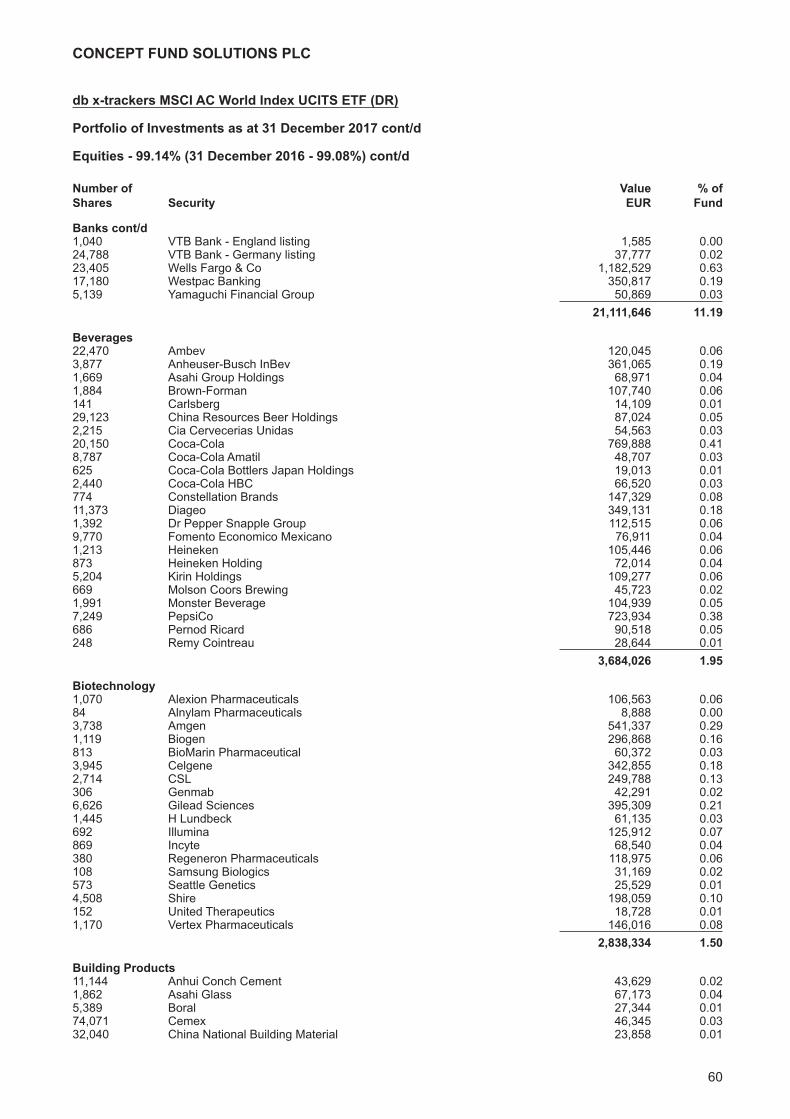
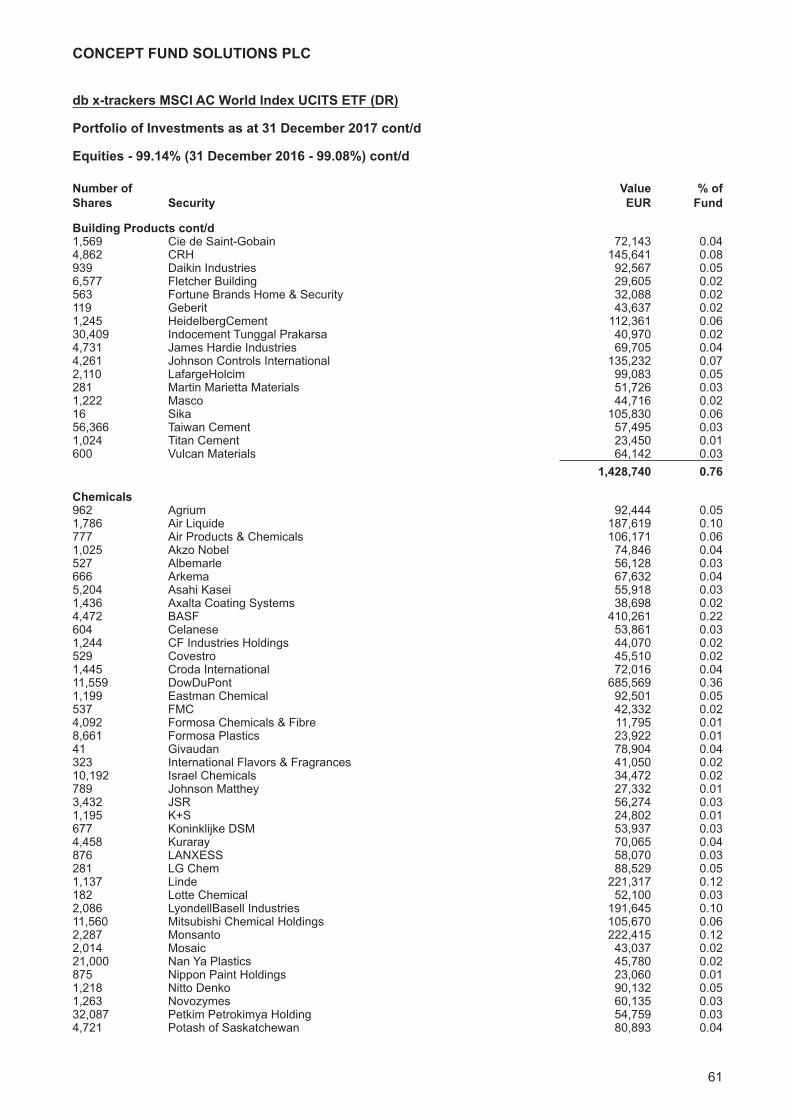
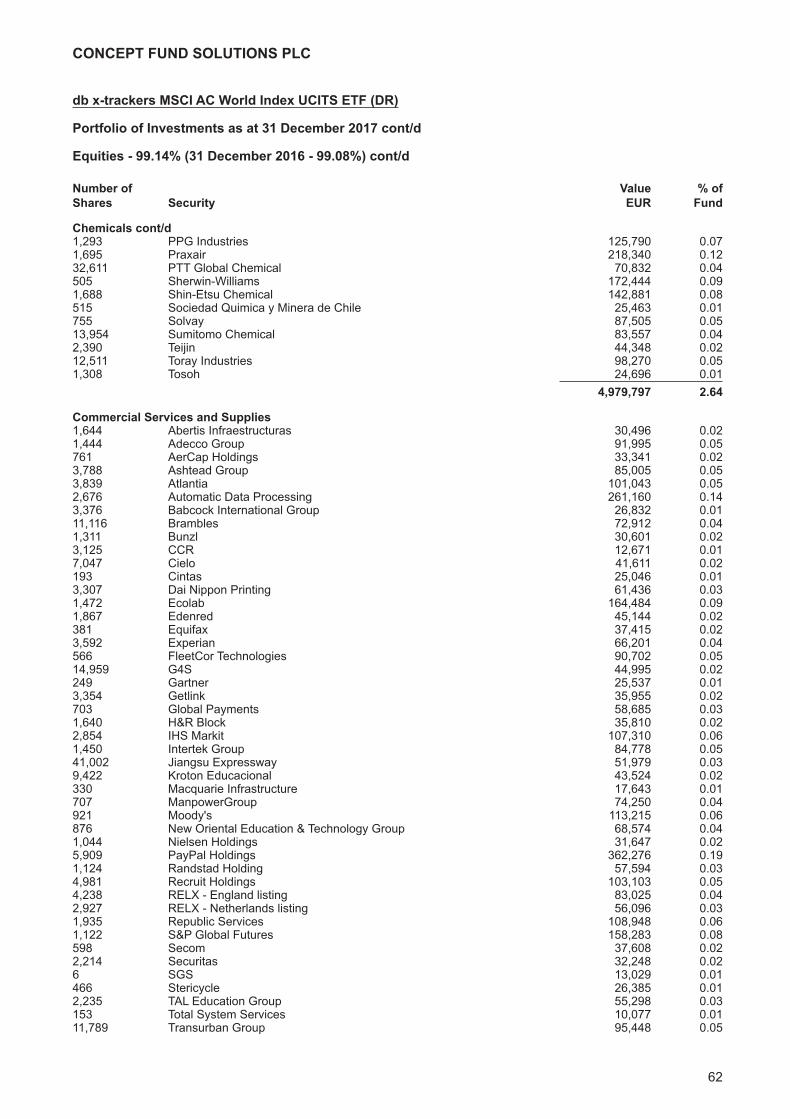
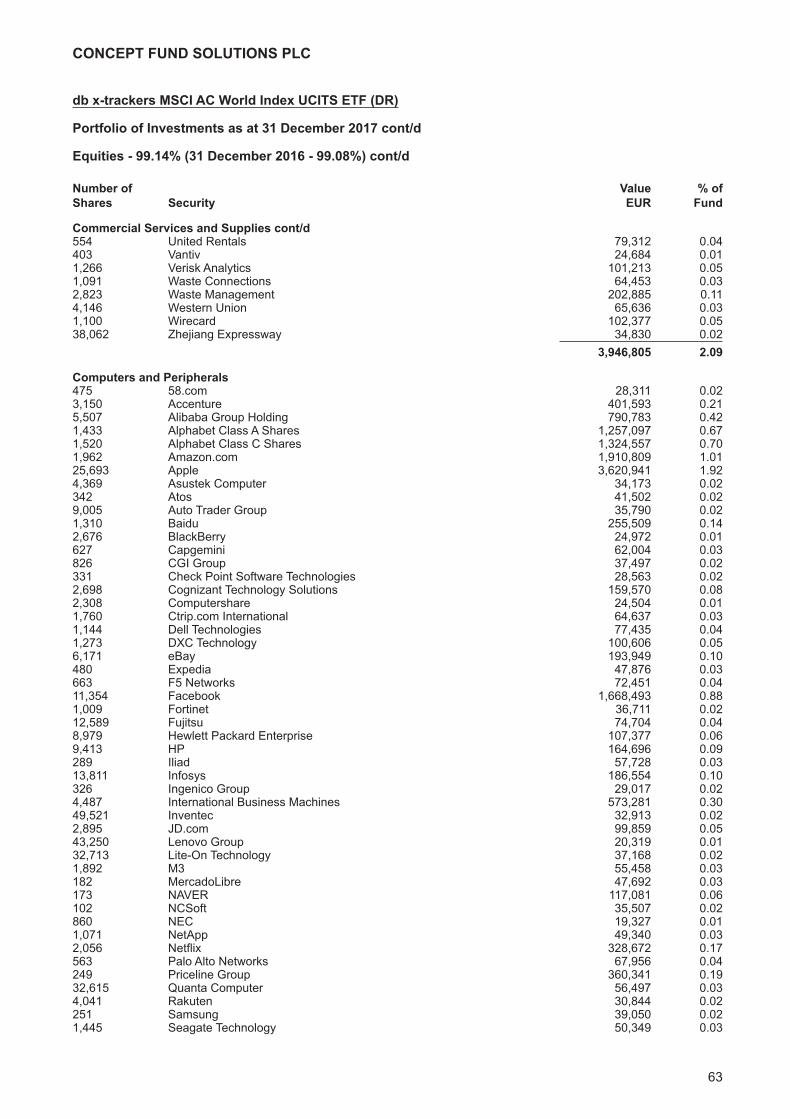
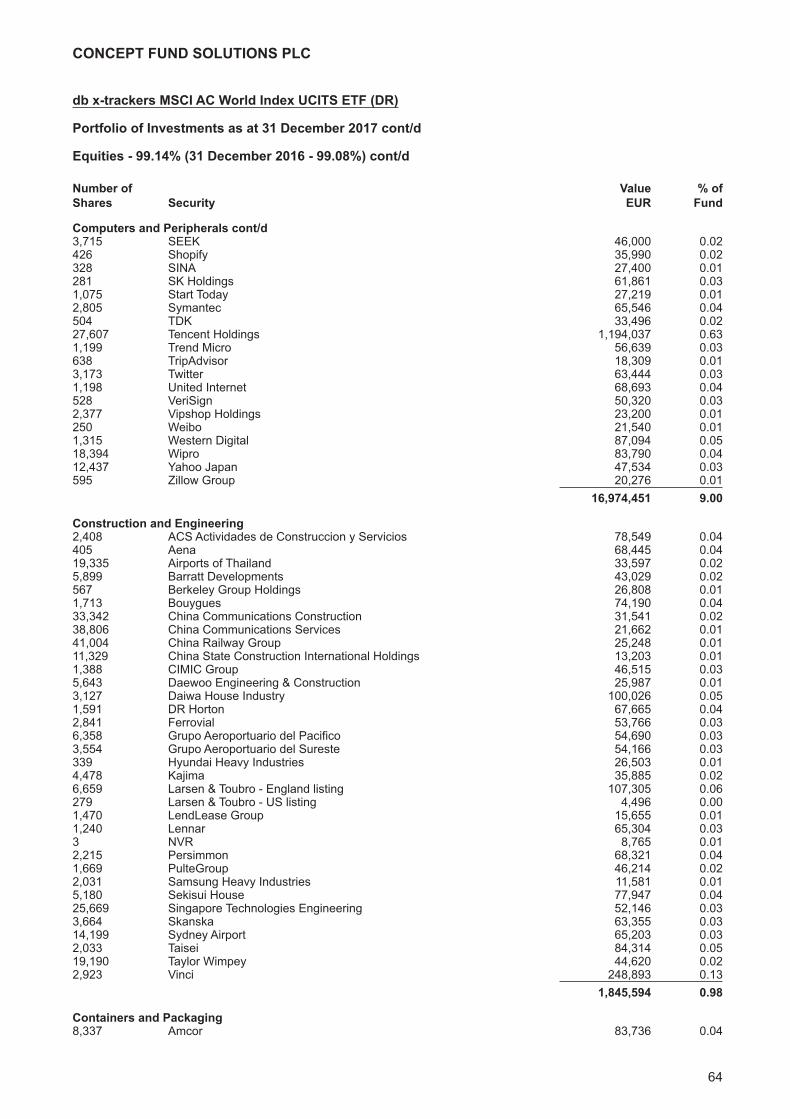
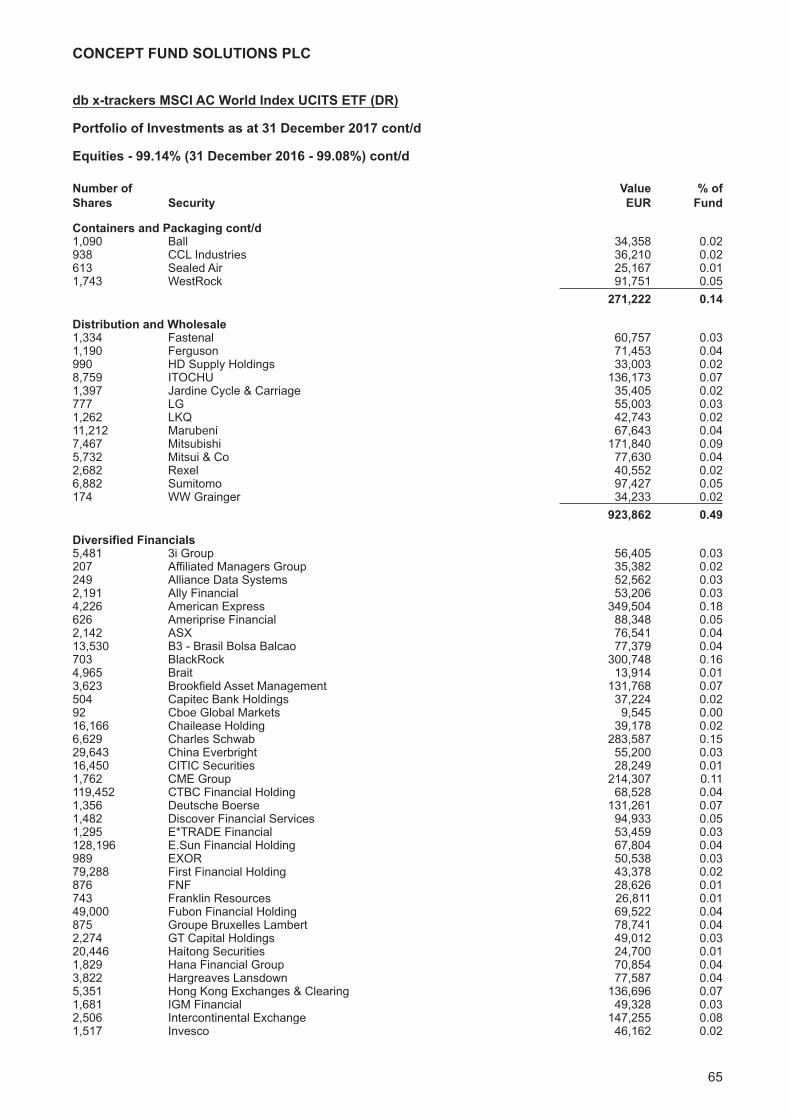
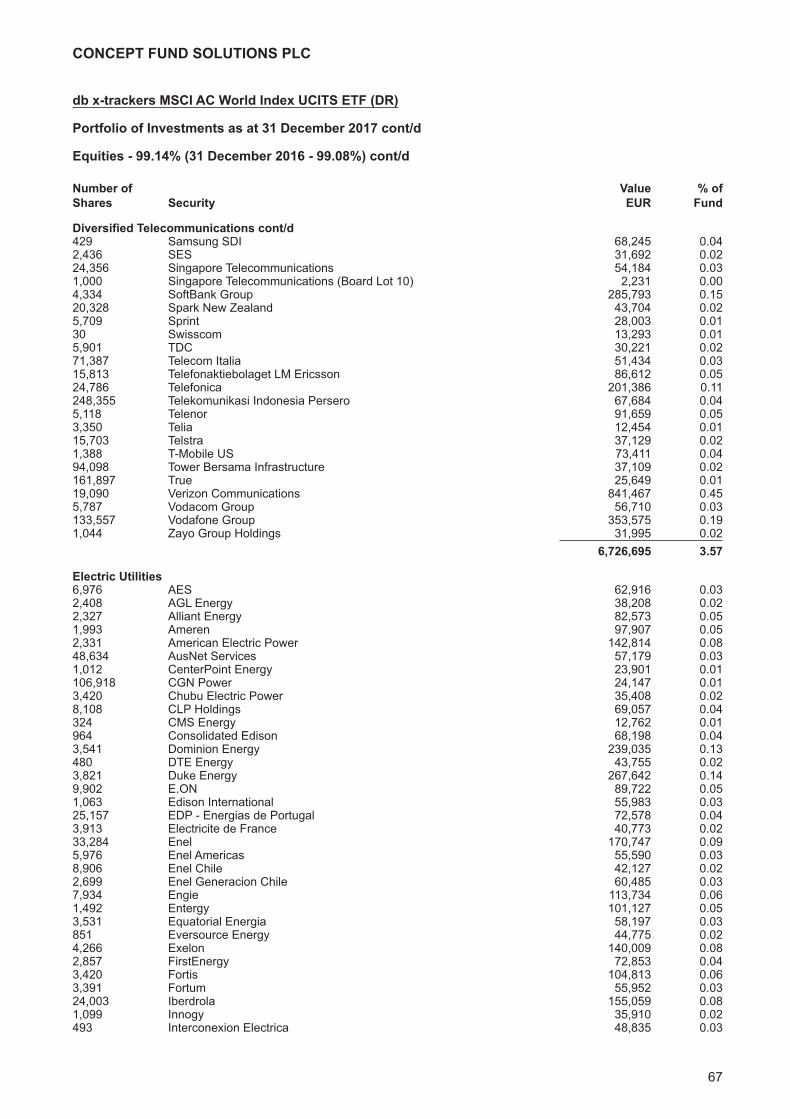
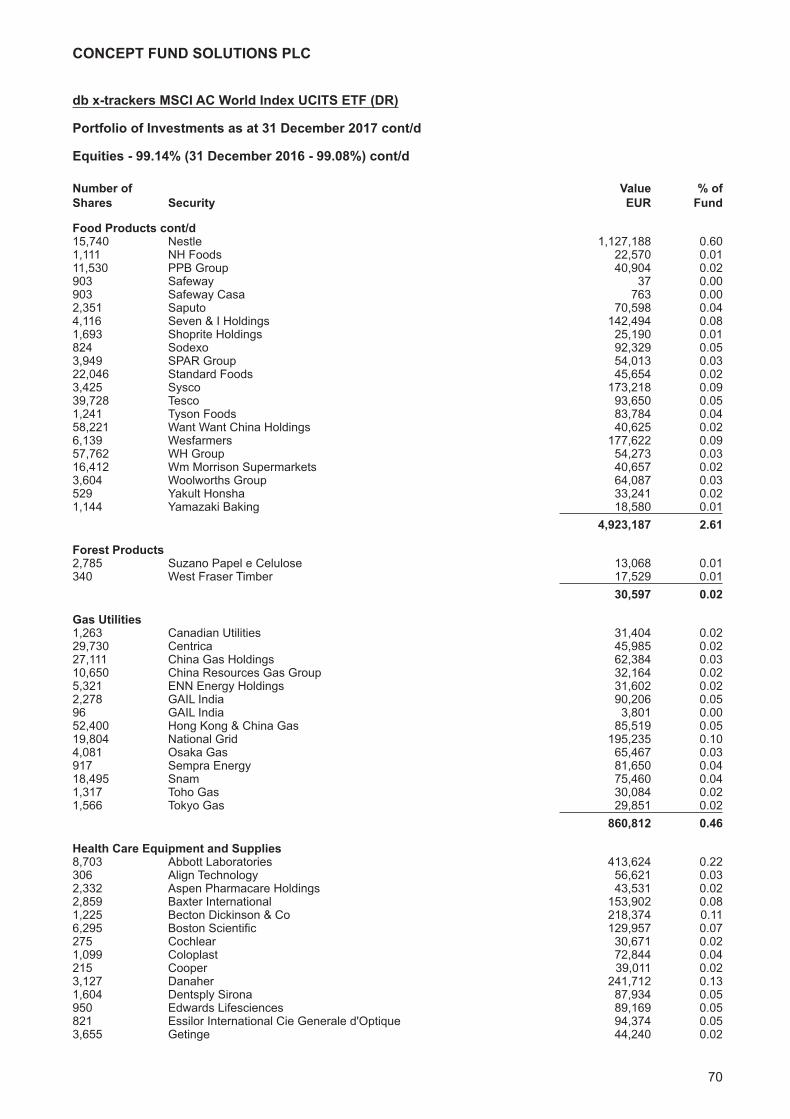
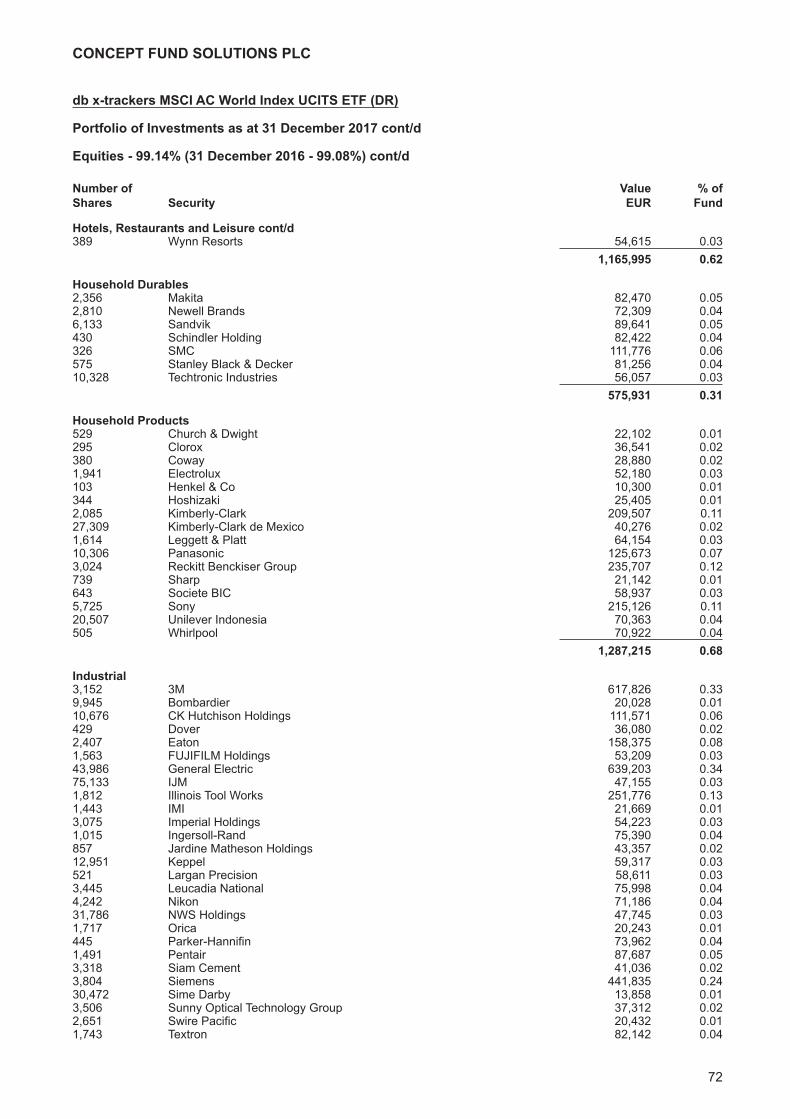
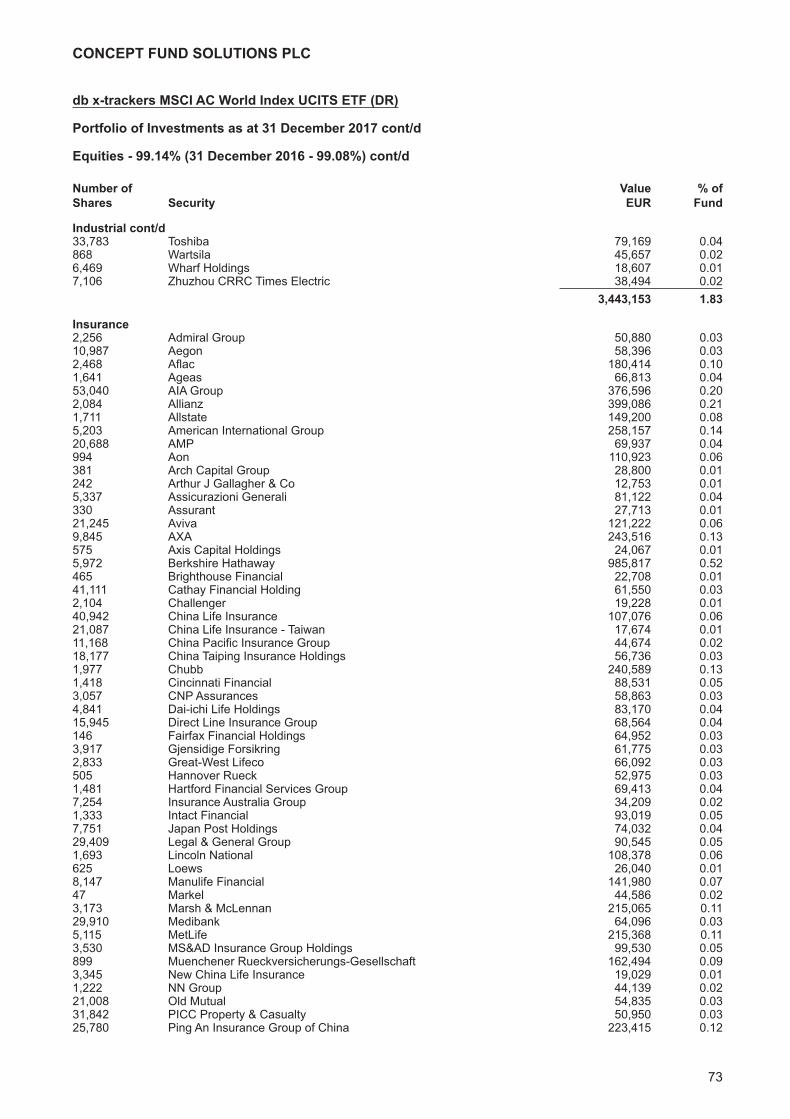
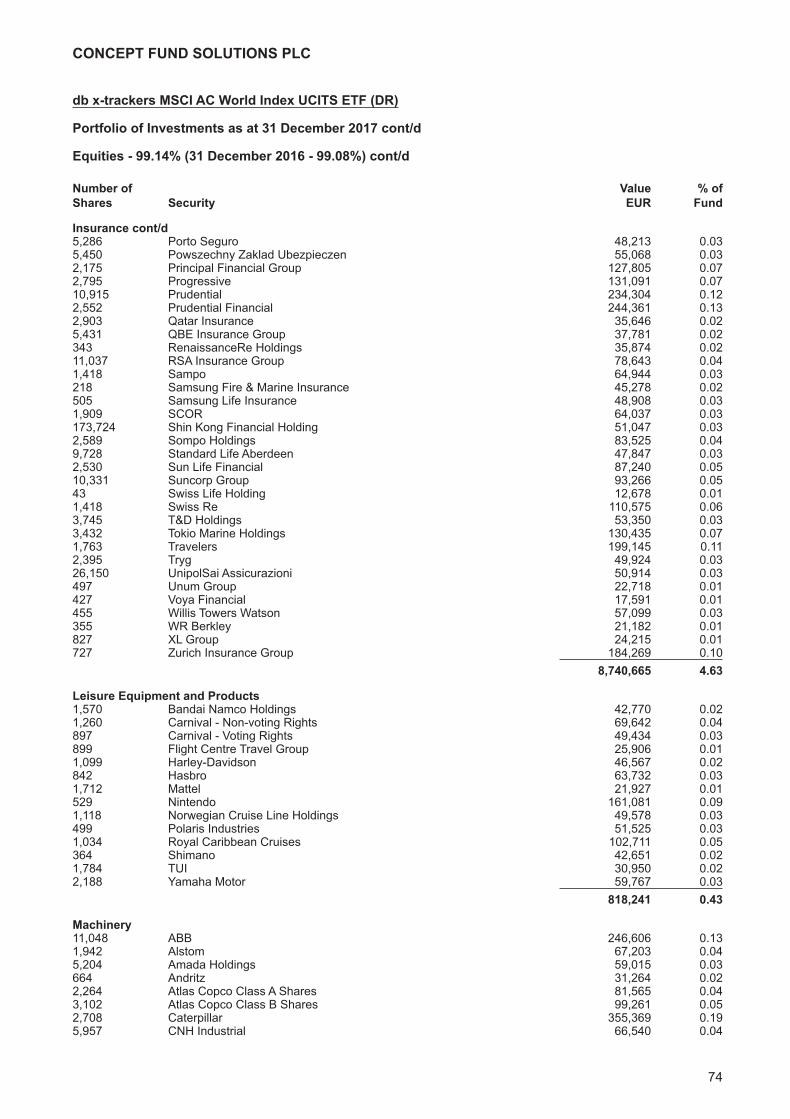
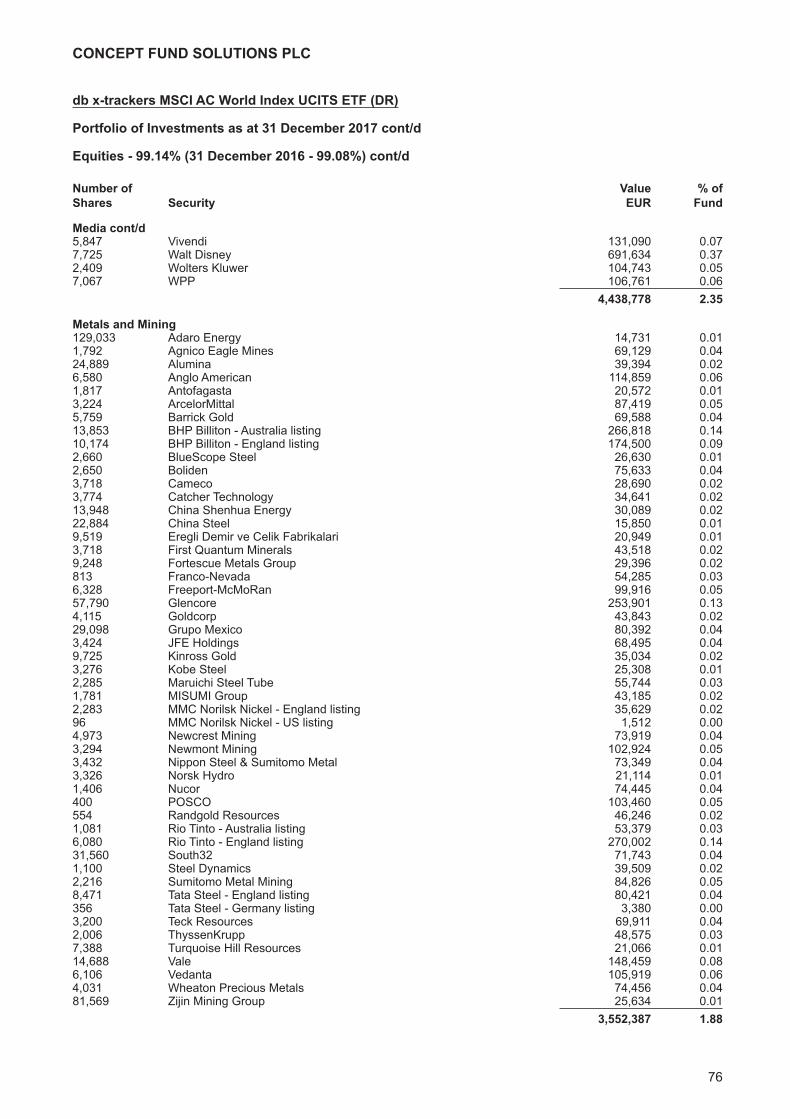
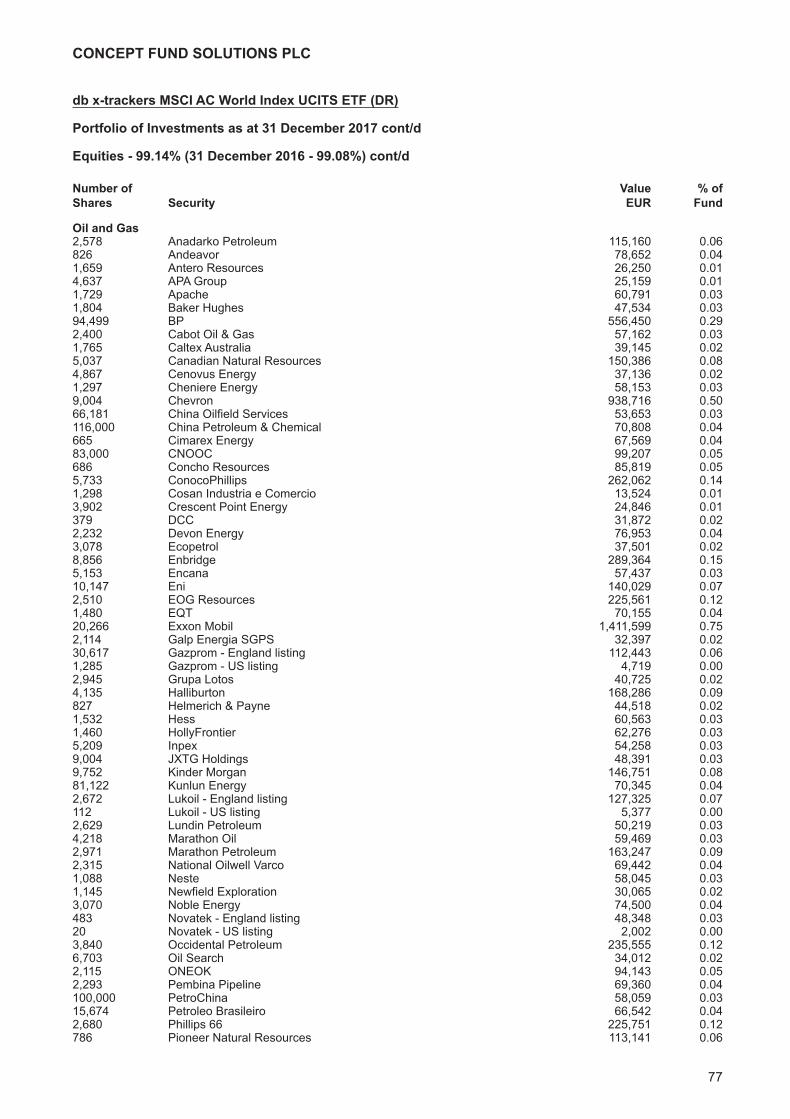
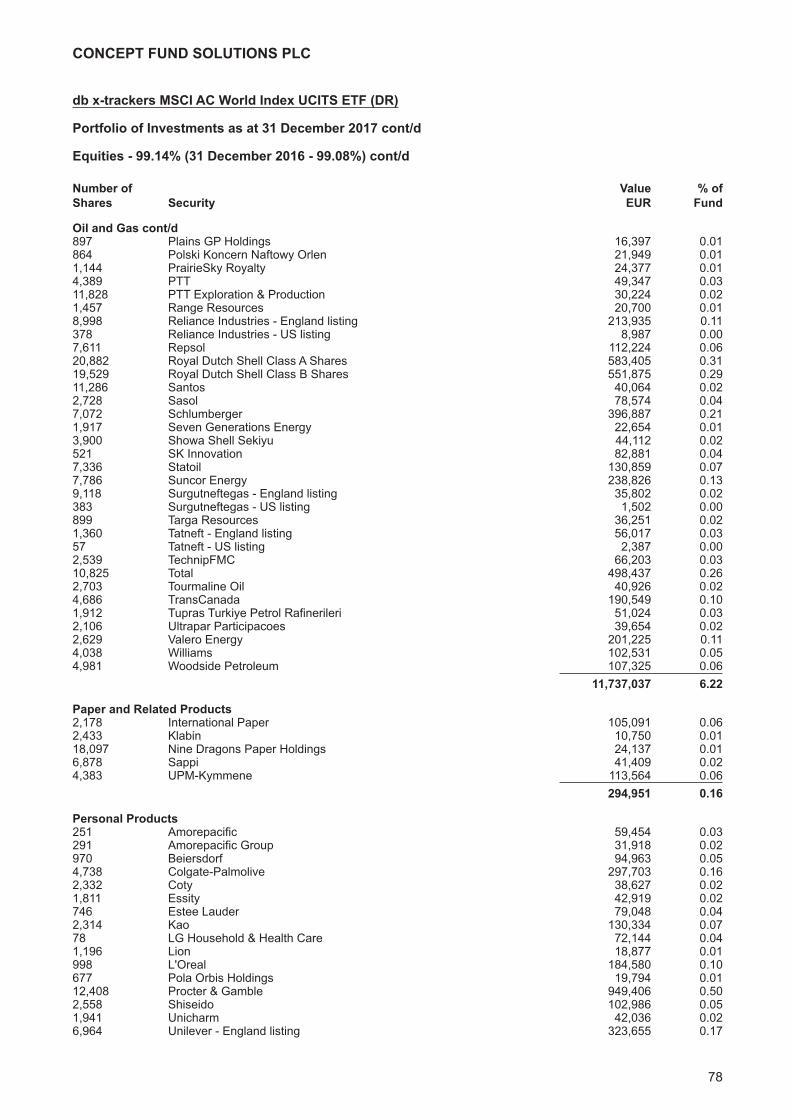
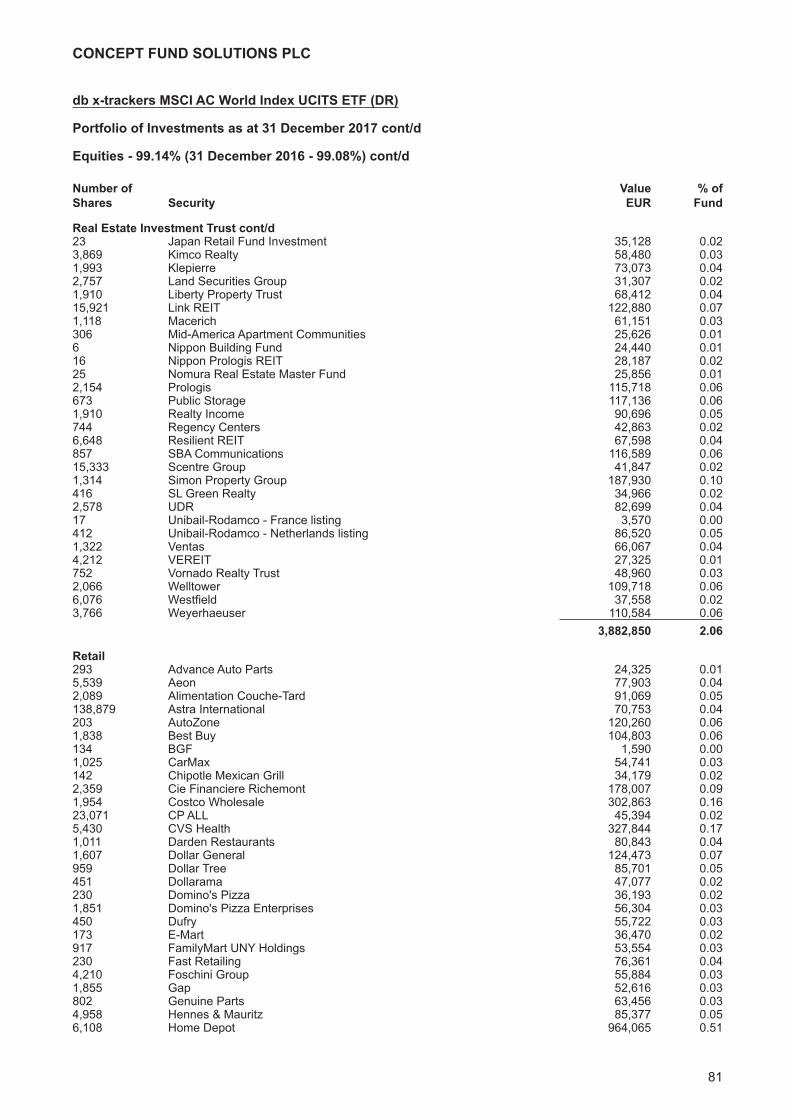
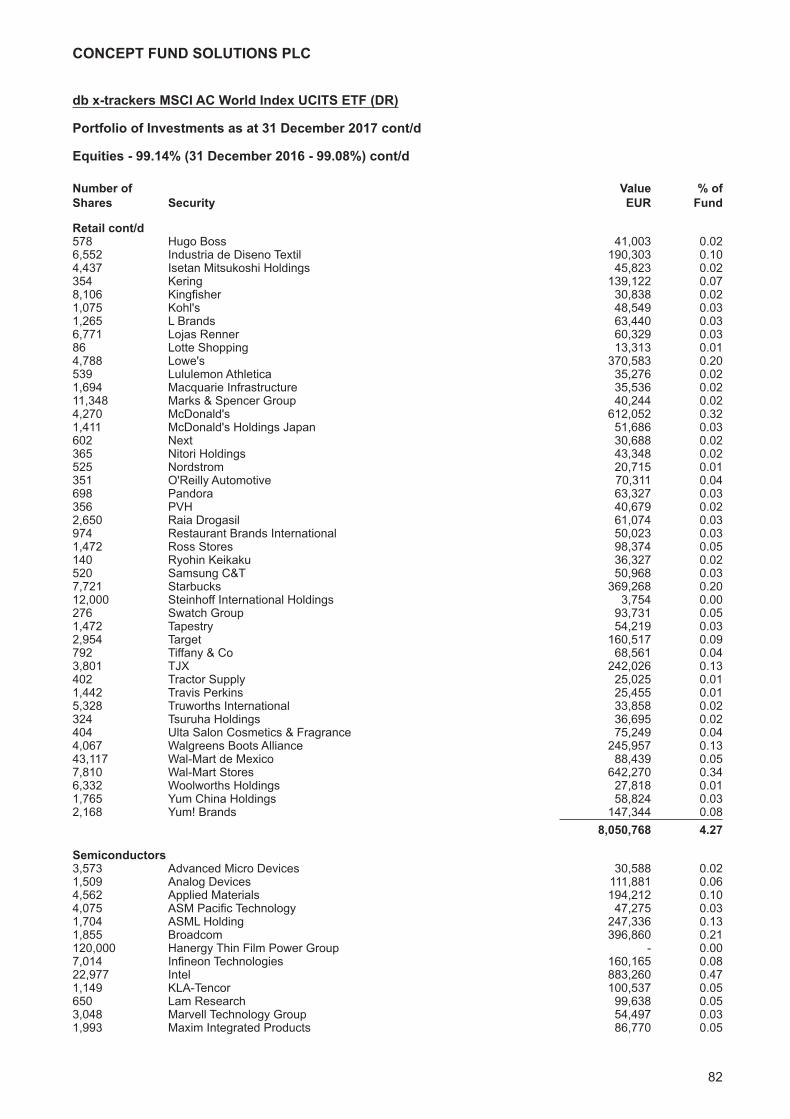
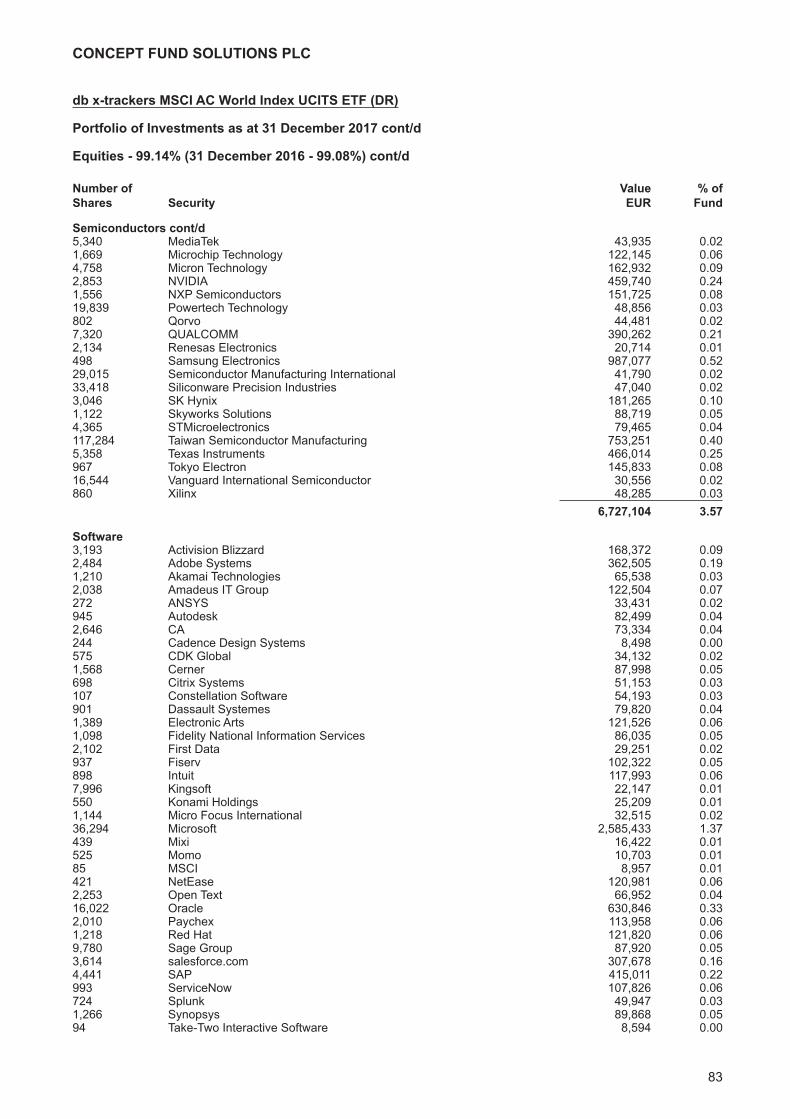
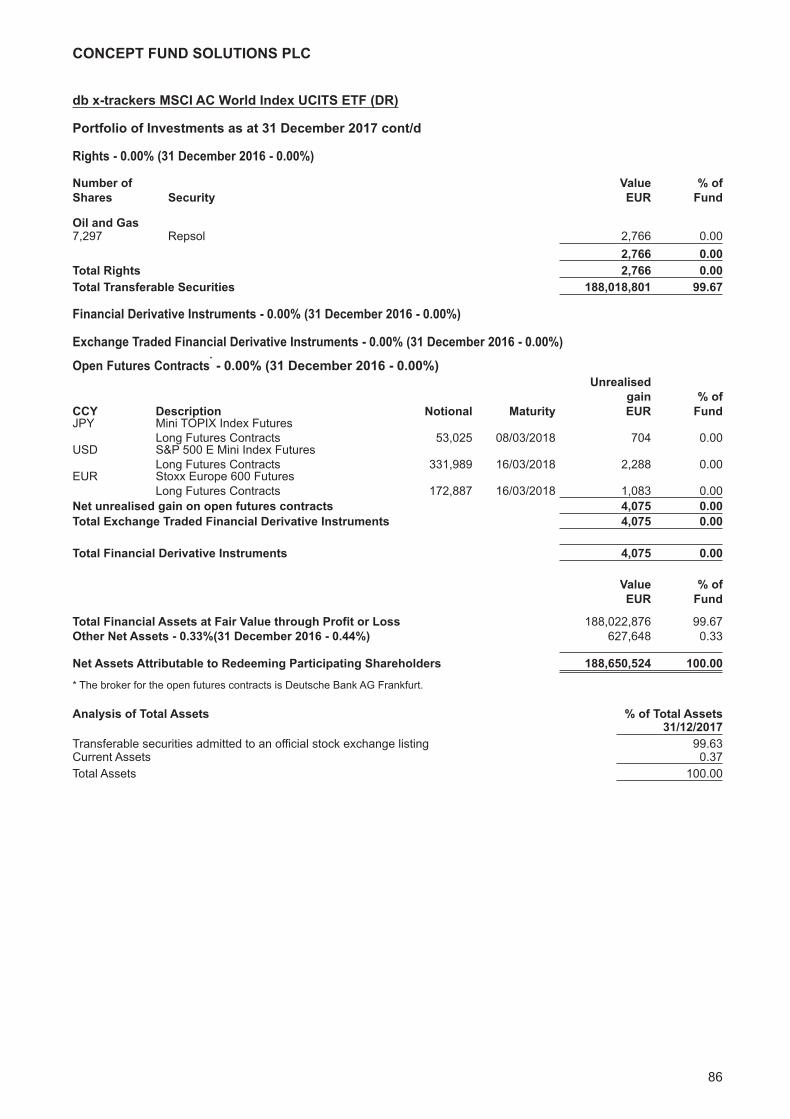
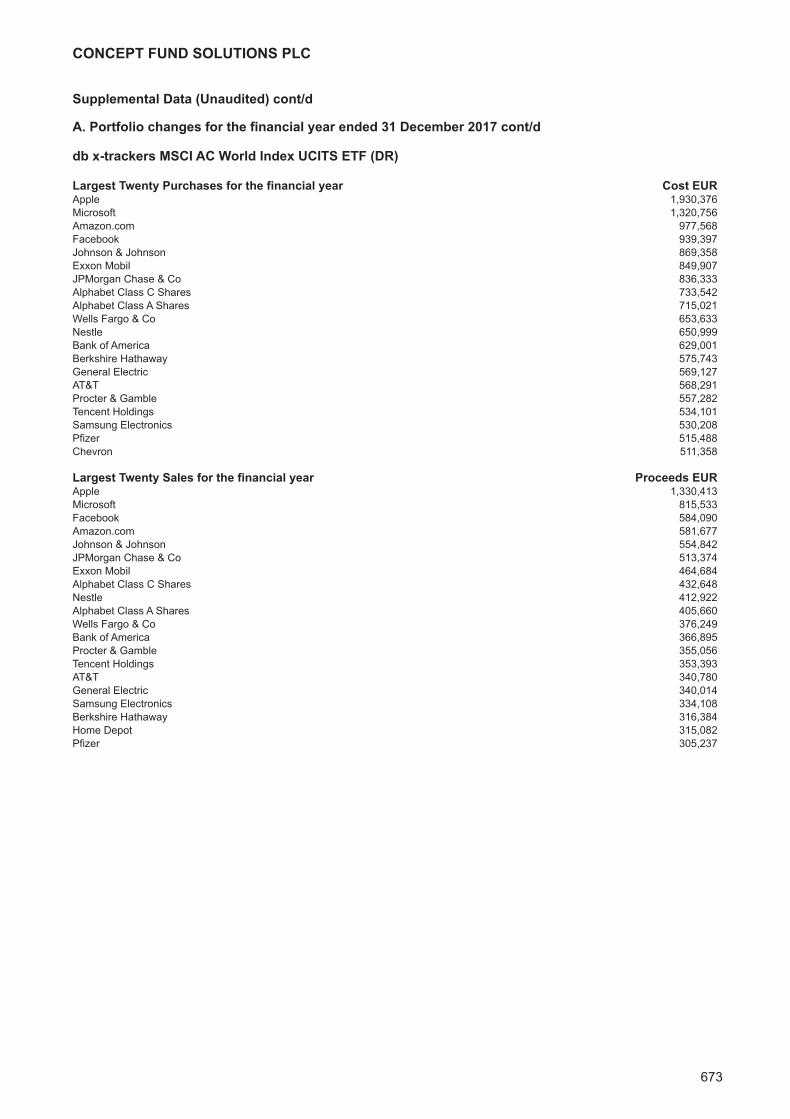
db x-trackers MSCI AC World Index UCITS ETF (DR)Investment Manager’s Report 55Portfolio of Investments 56
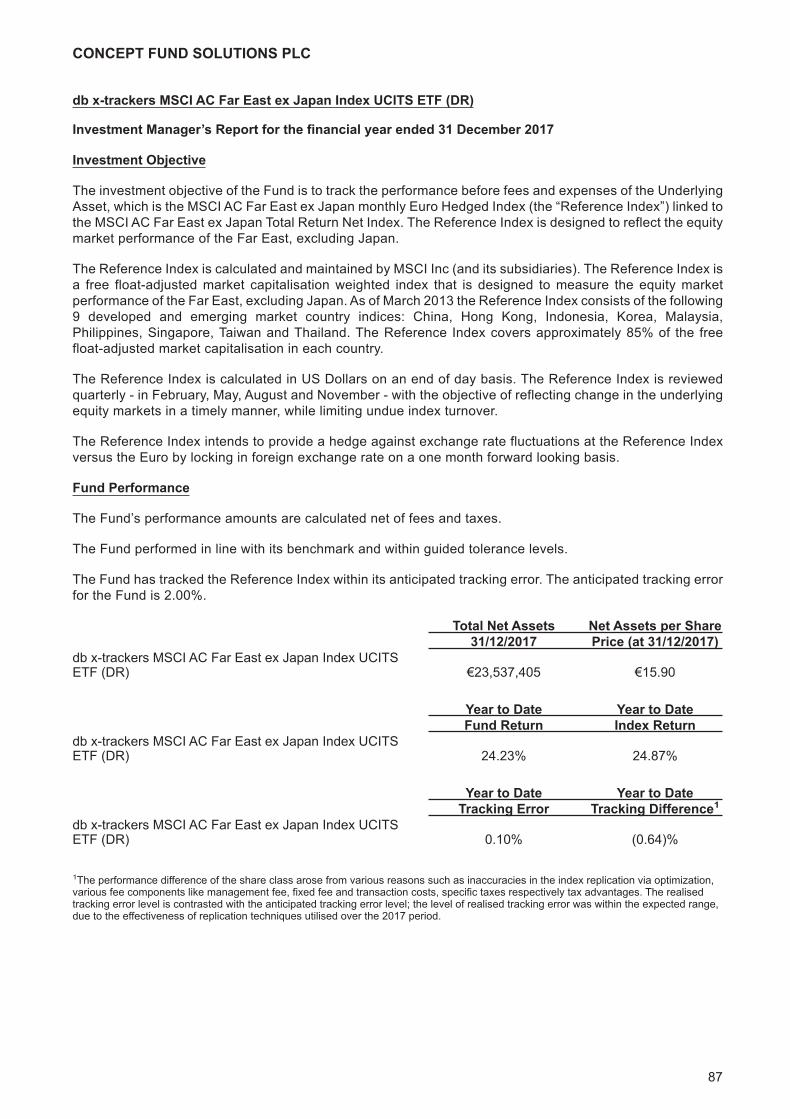
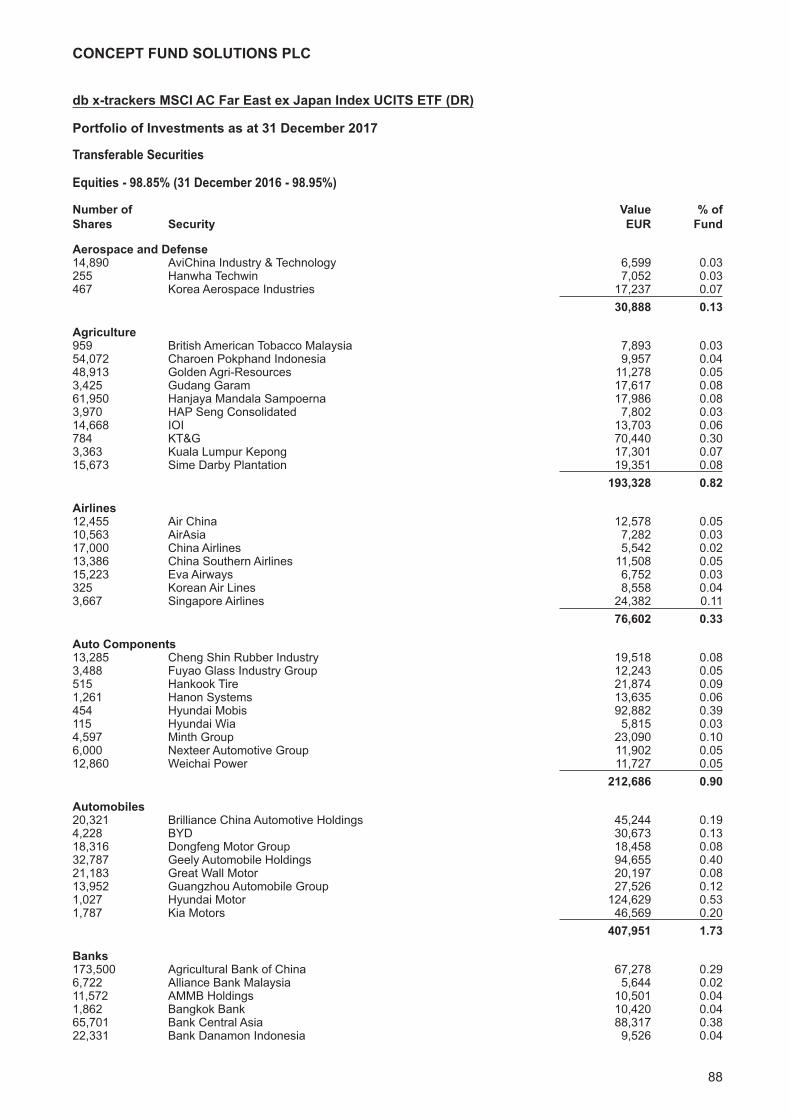
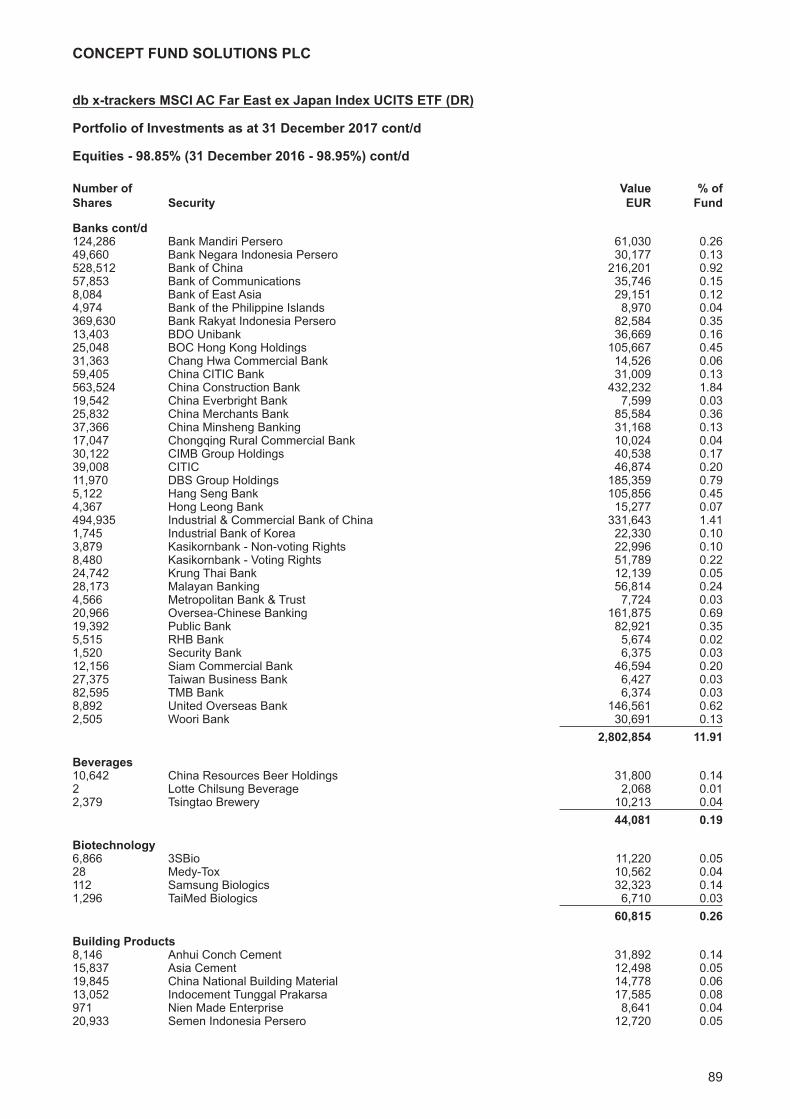
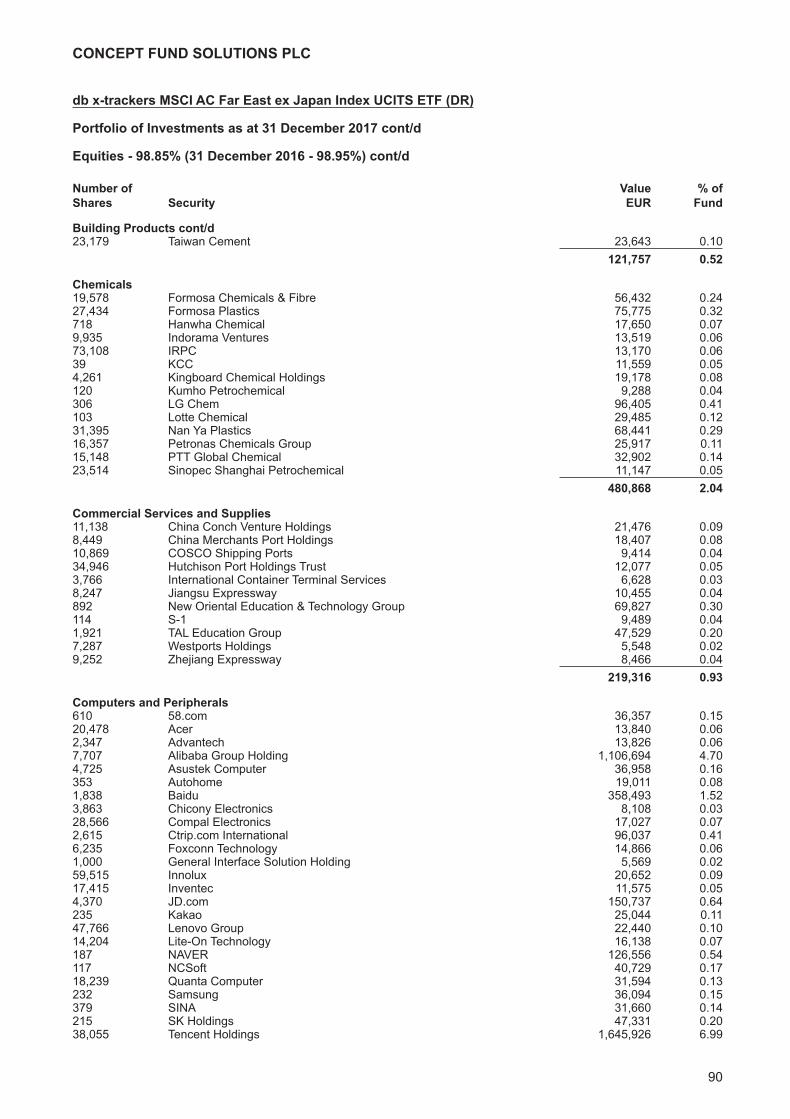
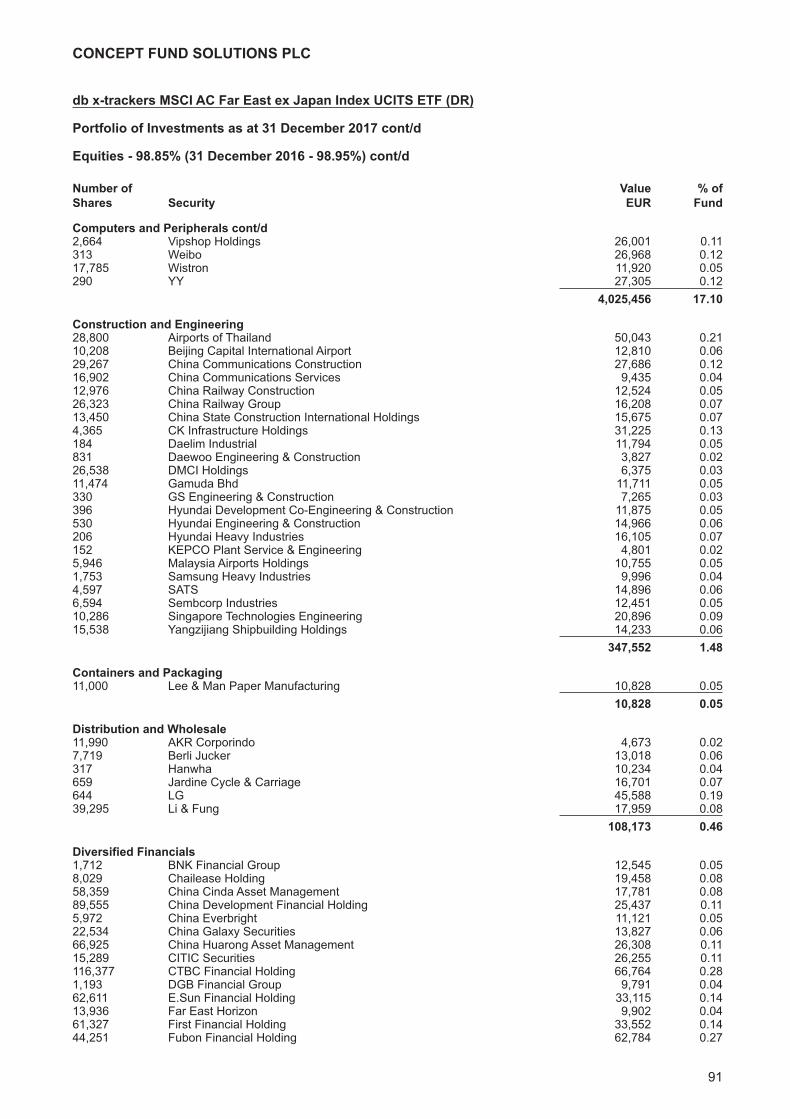
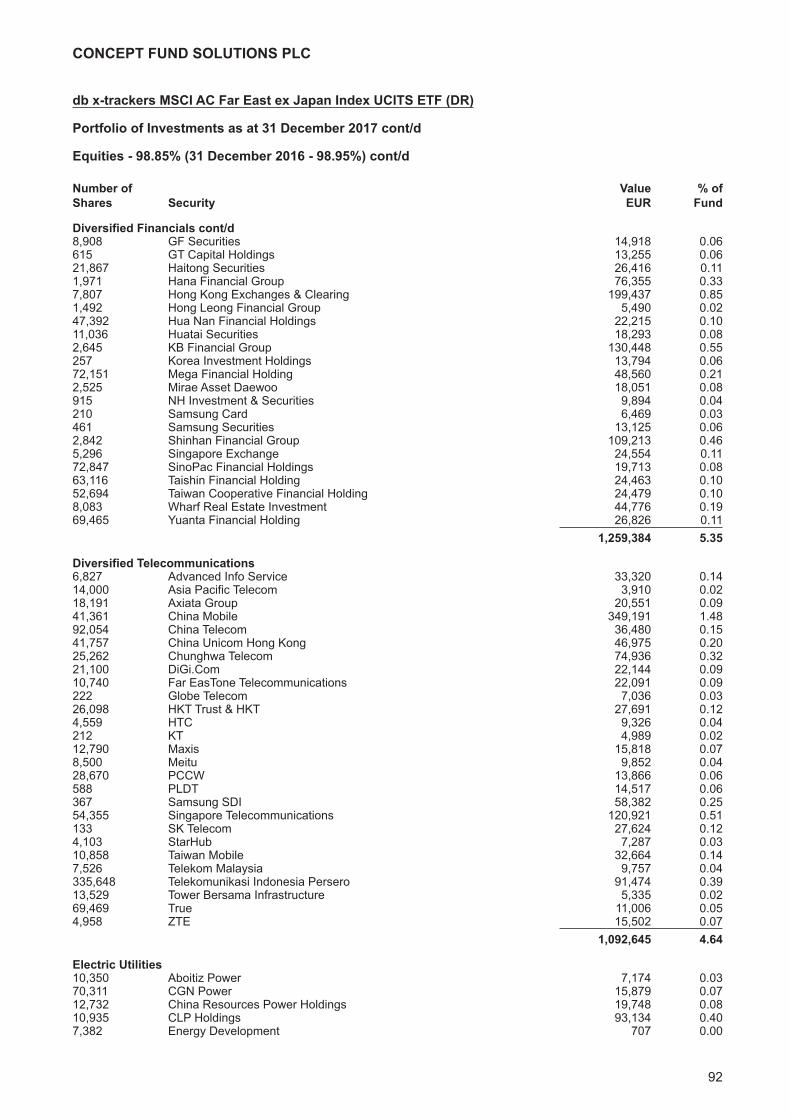
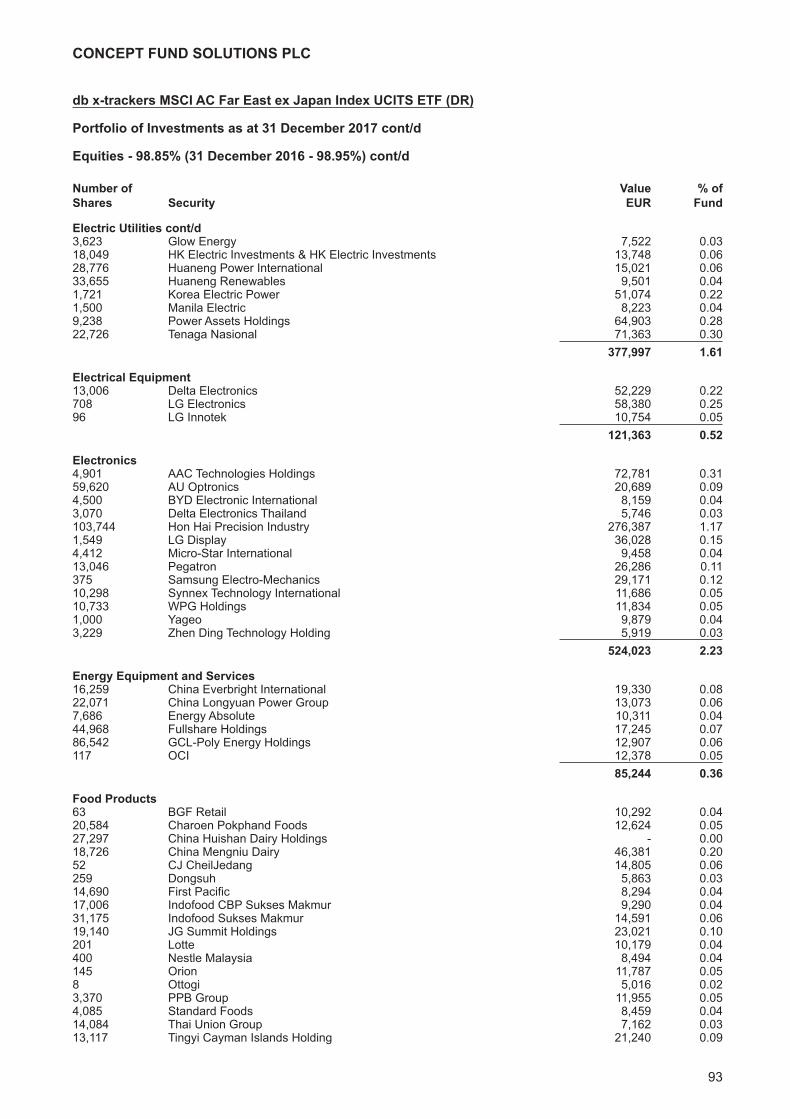
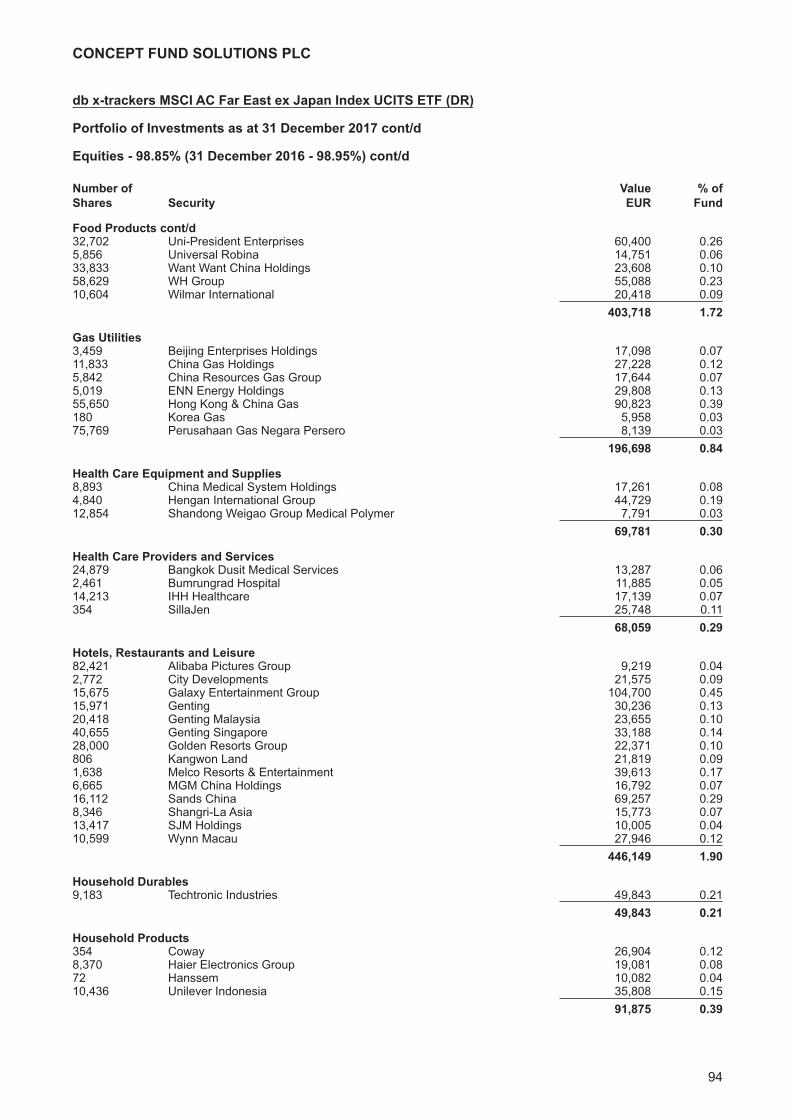
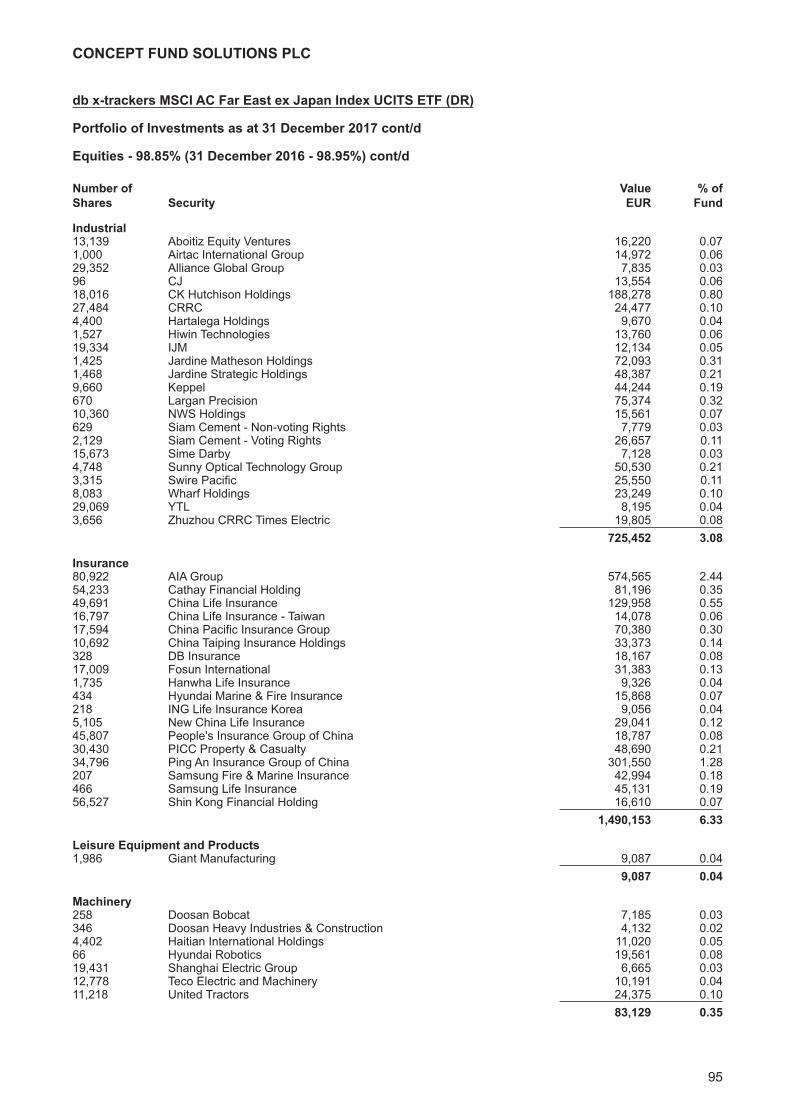
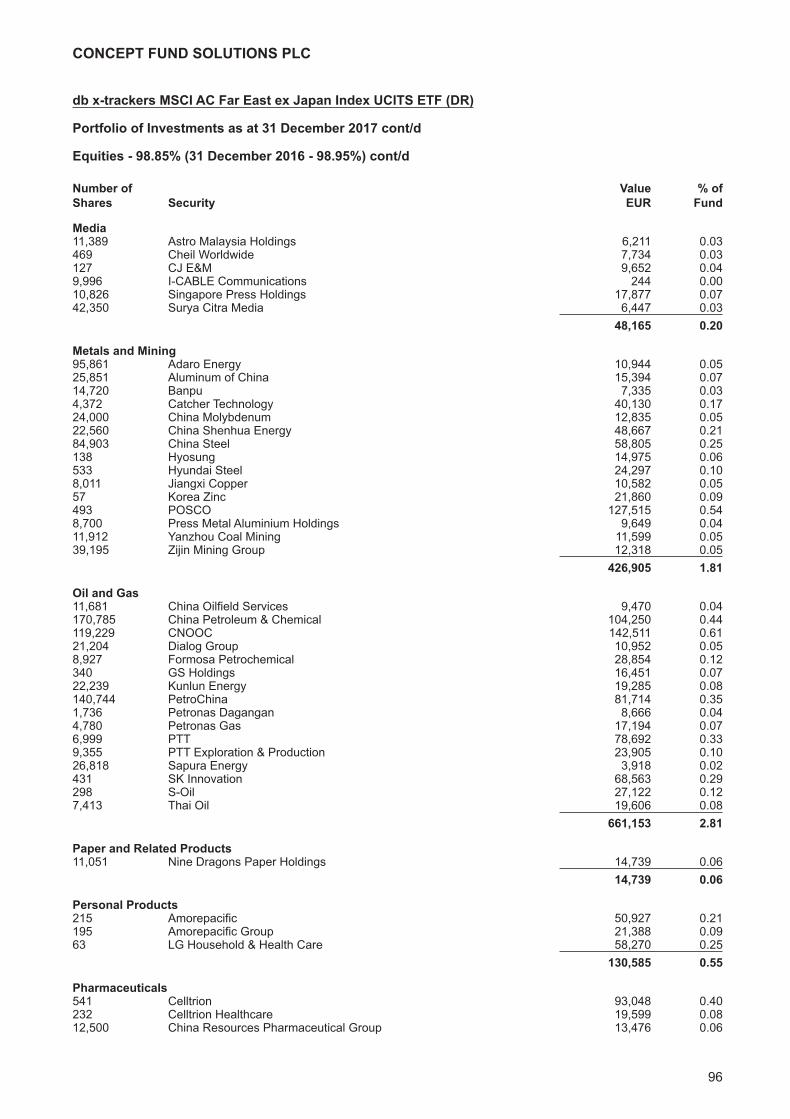
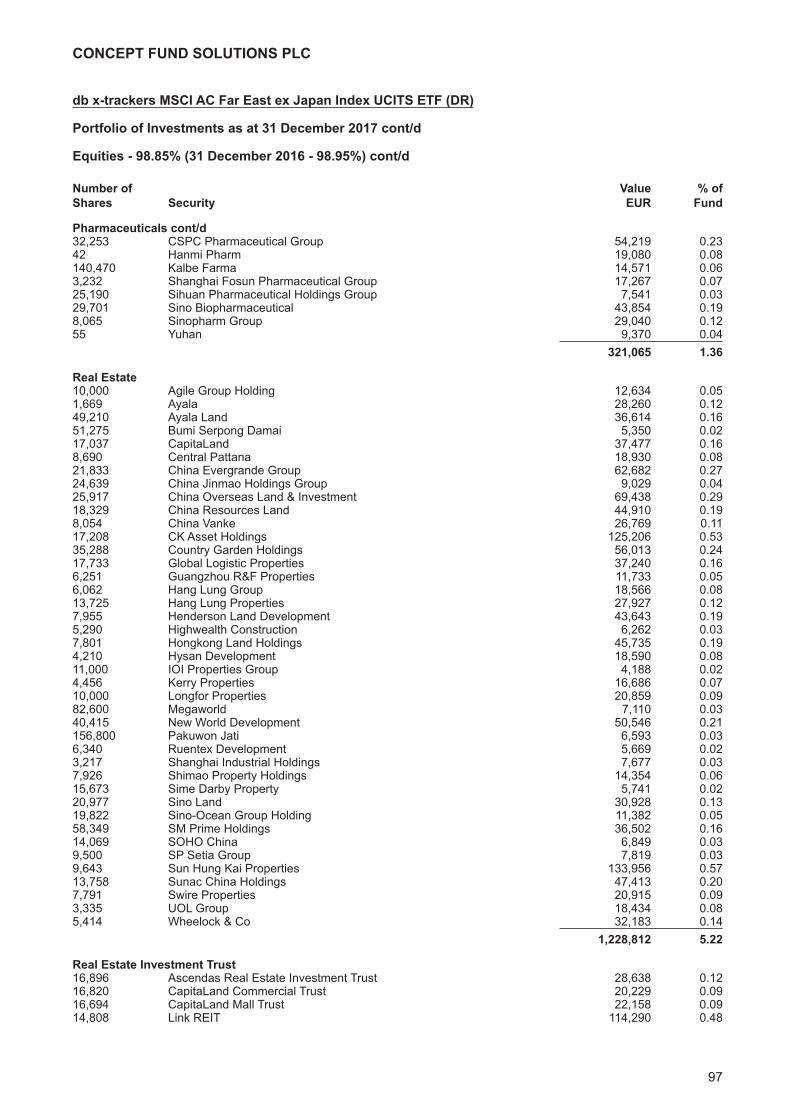
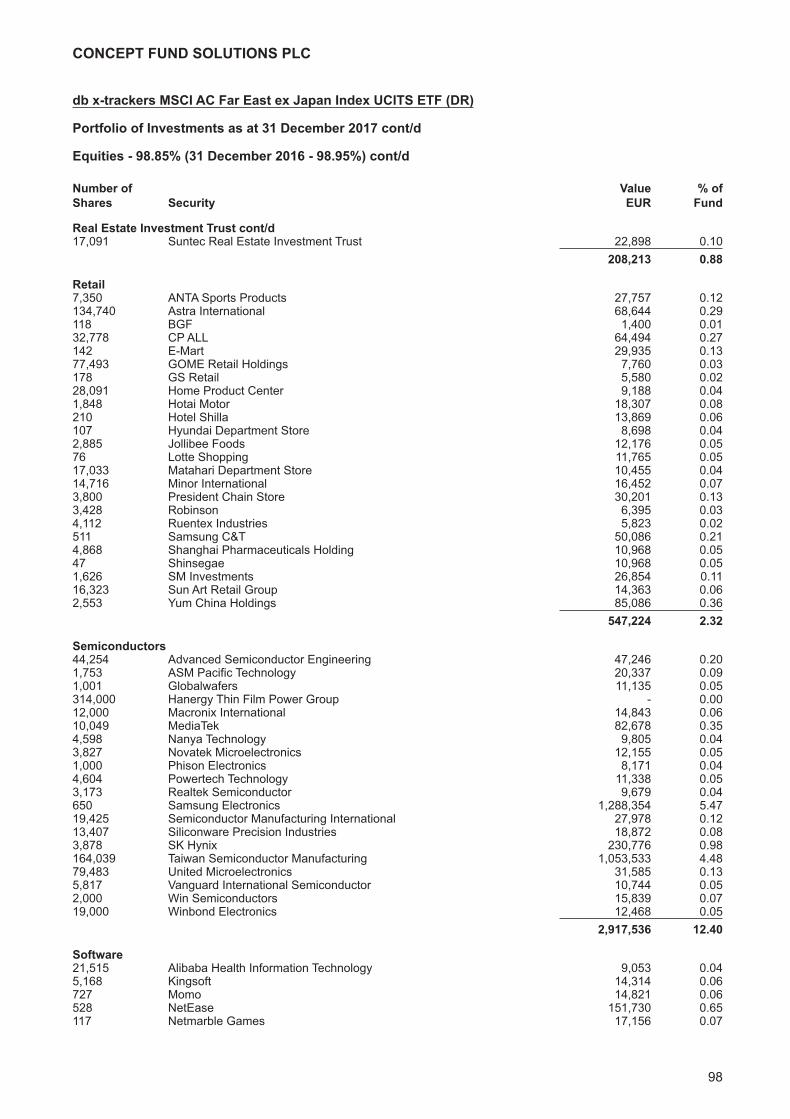
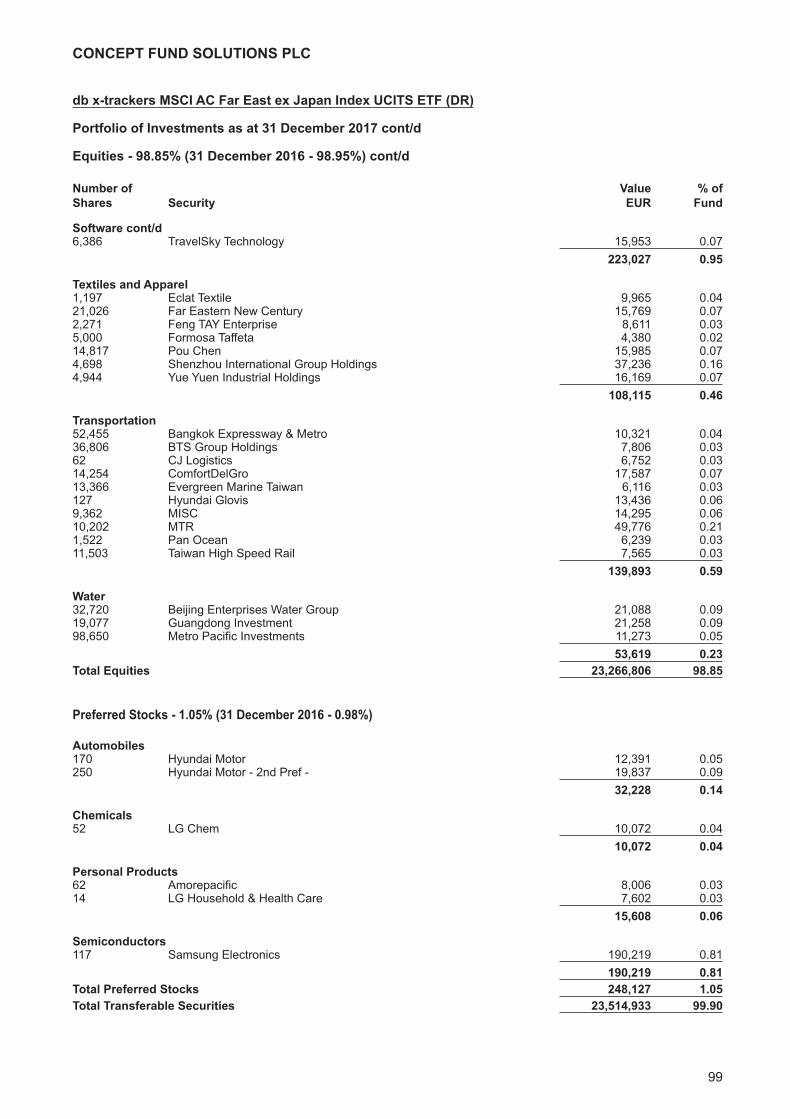
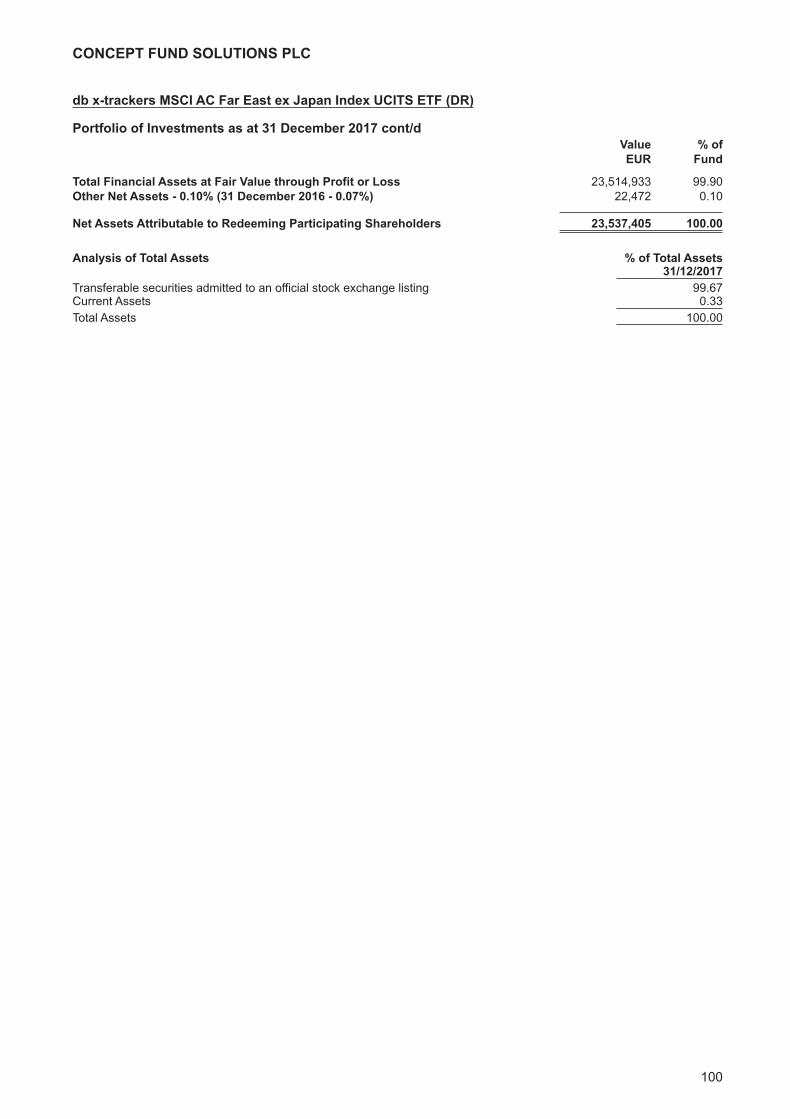
db x-trackers MSCI AC Far East ex Japan Index UCITS ETF (DR)Investment Manager’s Report 87Portfolio of Investments 88
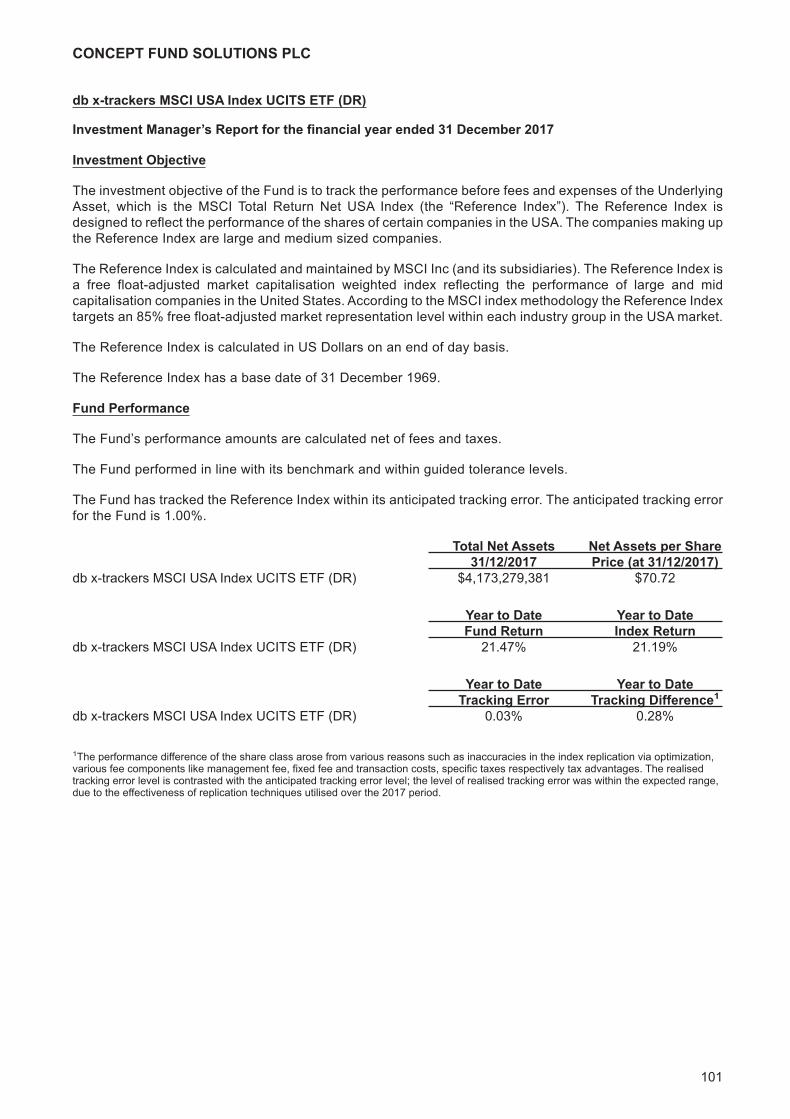
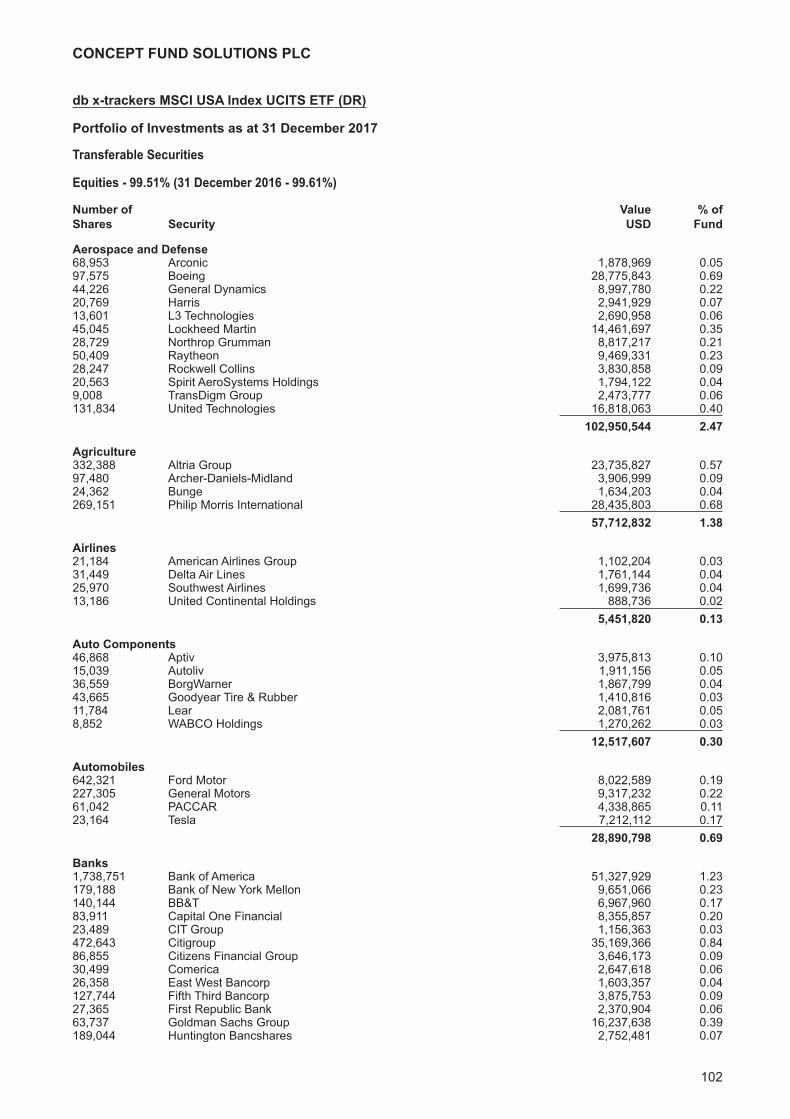
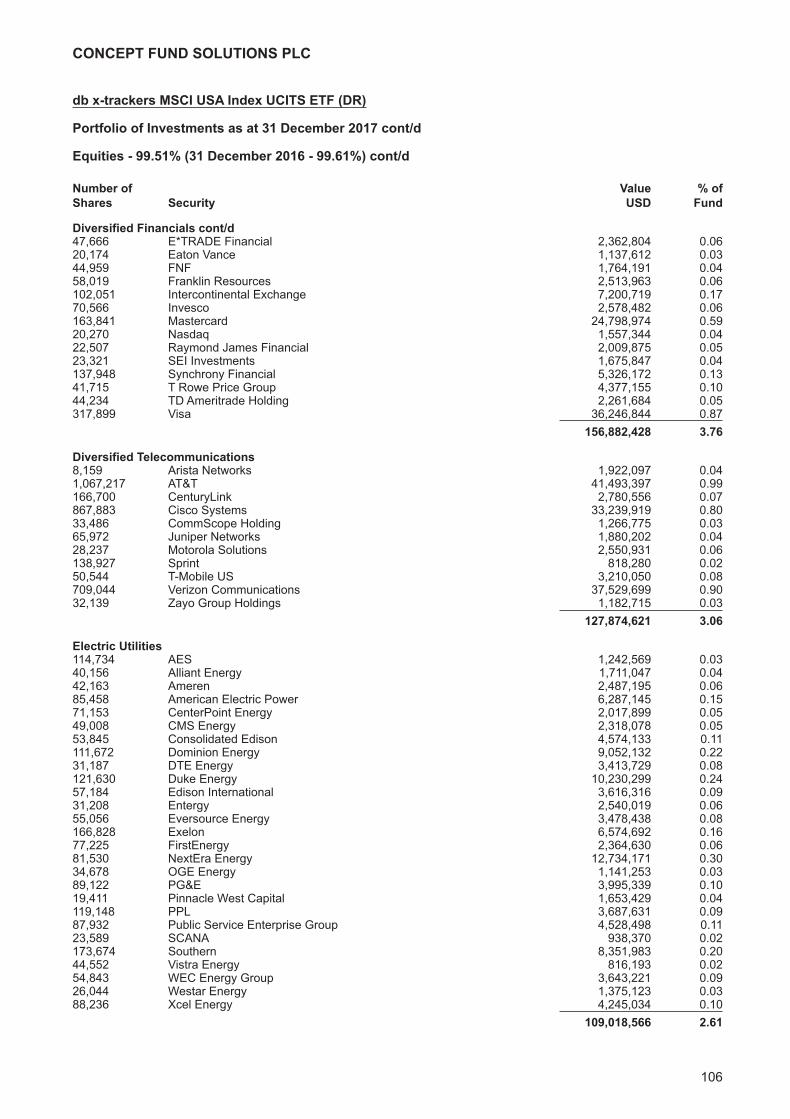
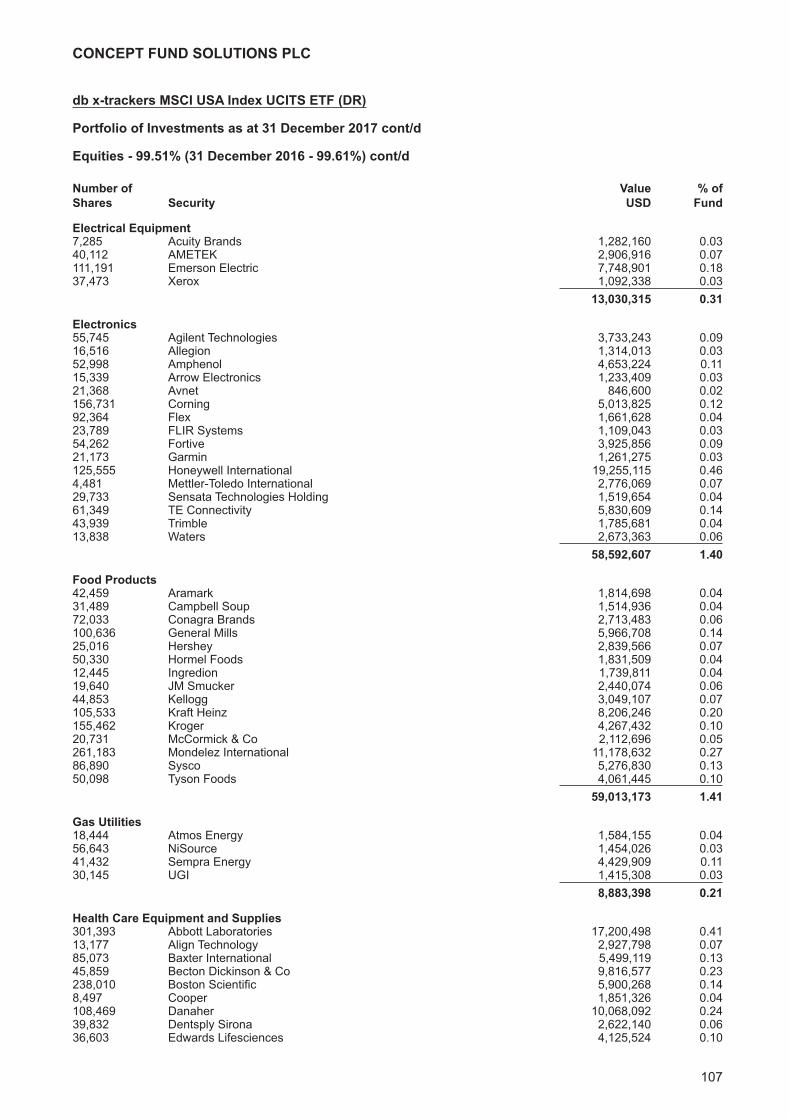
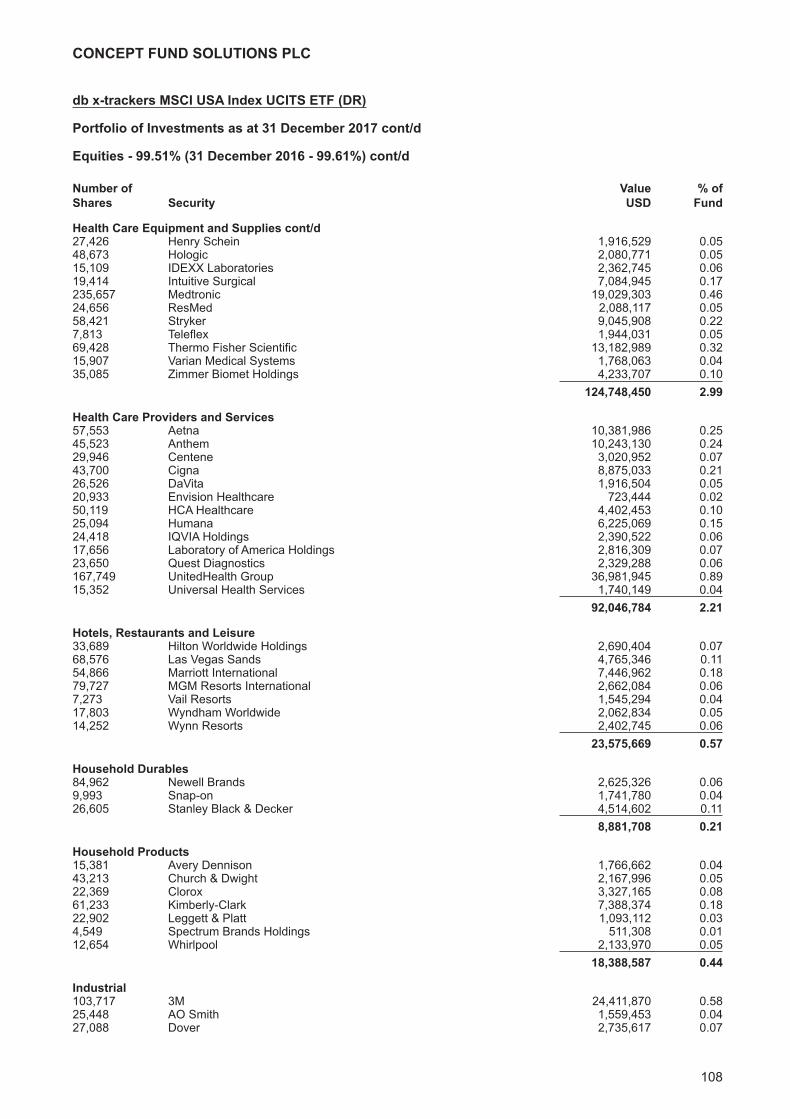
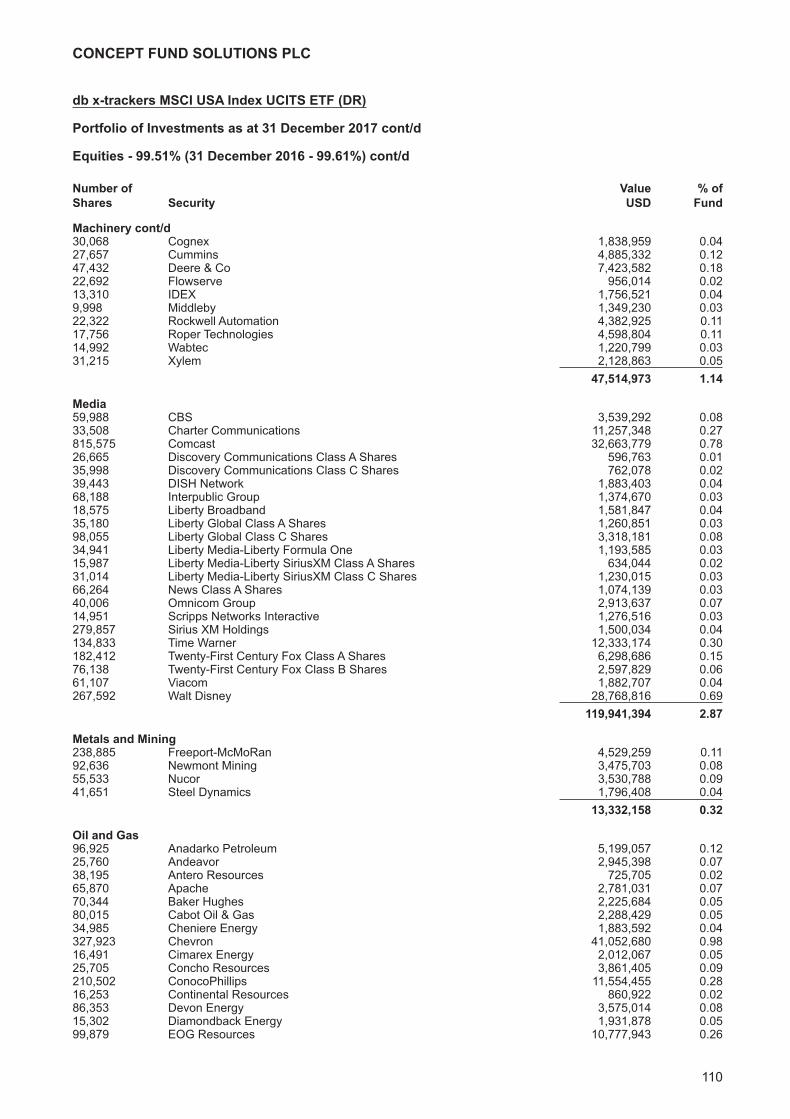
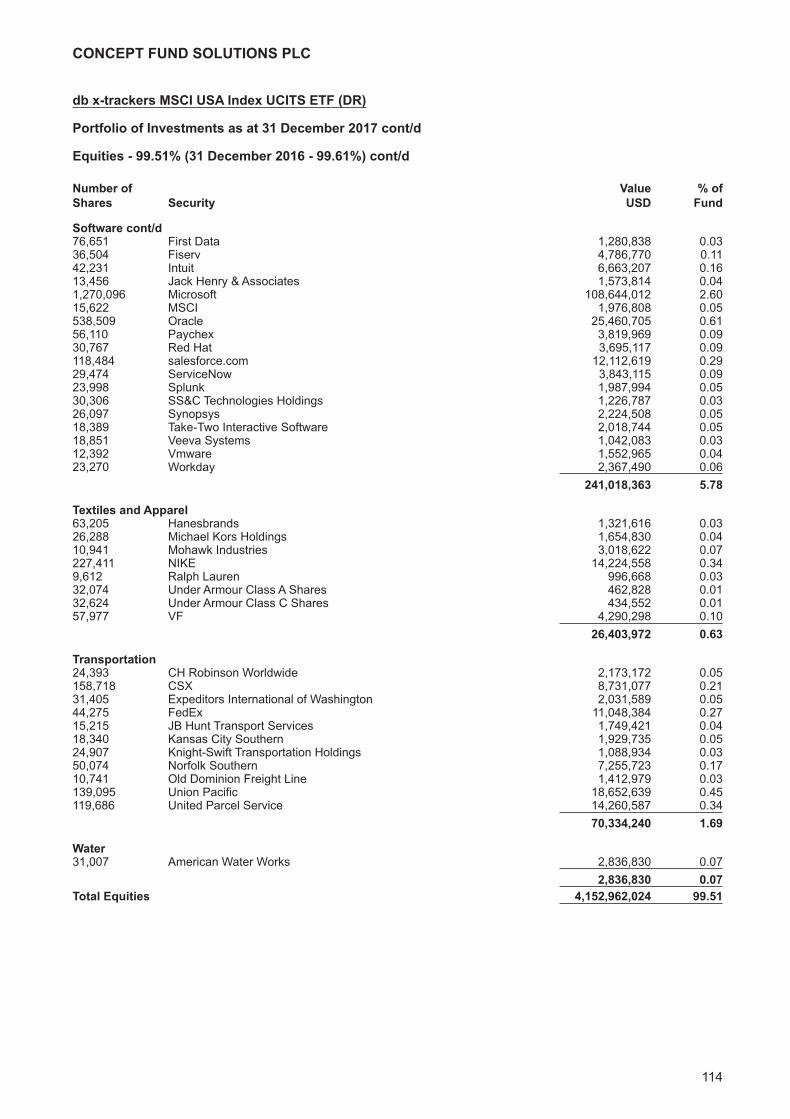
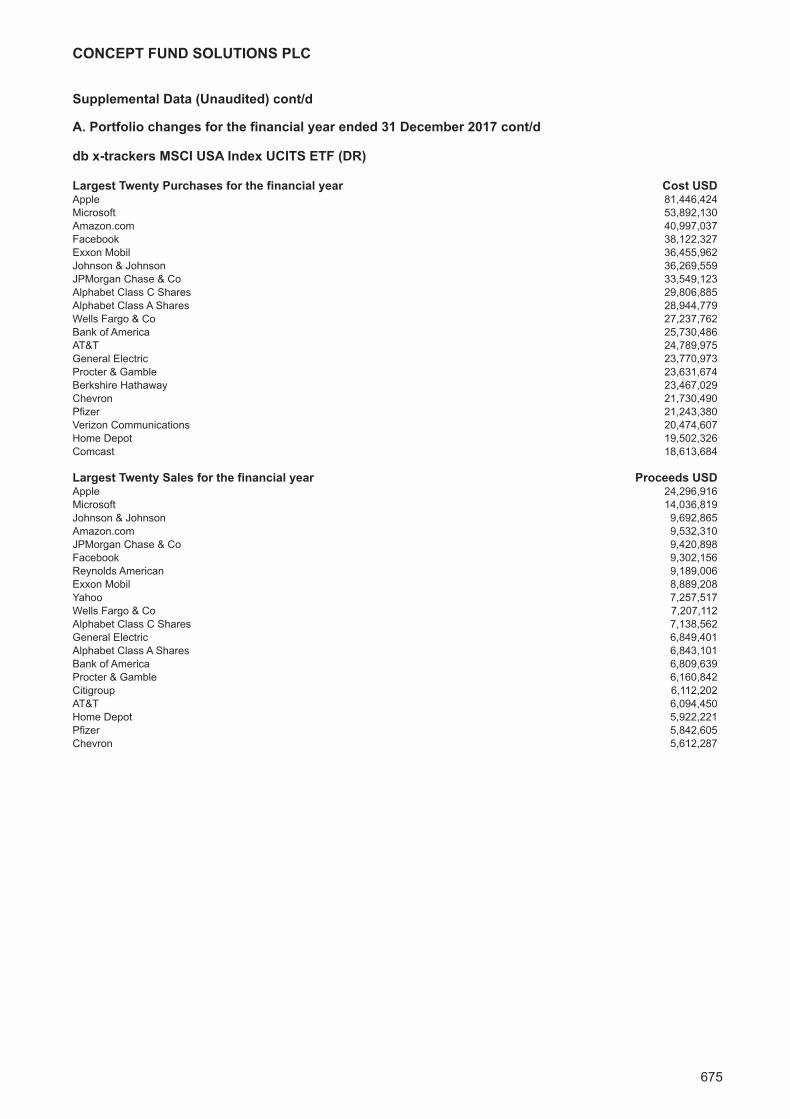
db x-trackers MSCI USA Index UCITS ETF (DR)Investment Manager’s Report 101Portfolio of Investments 102
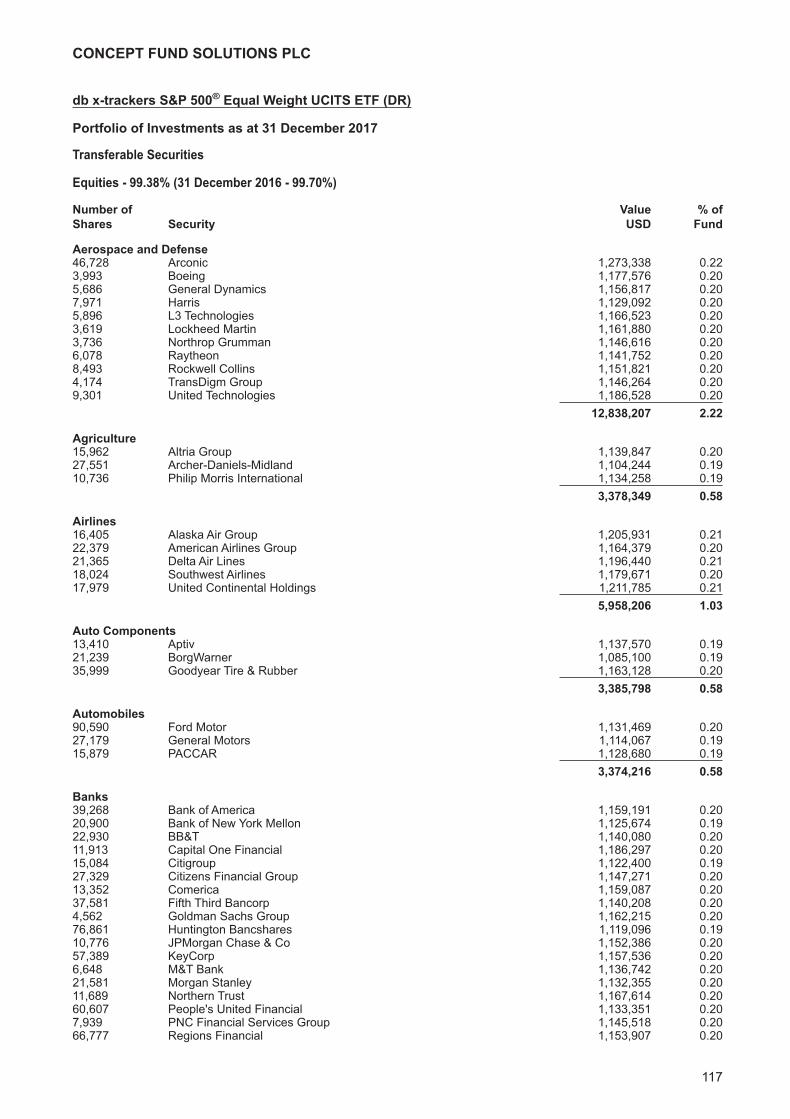
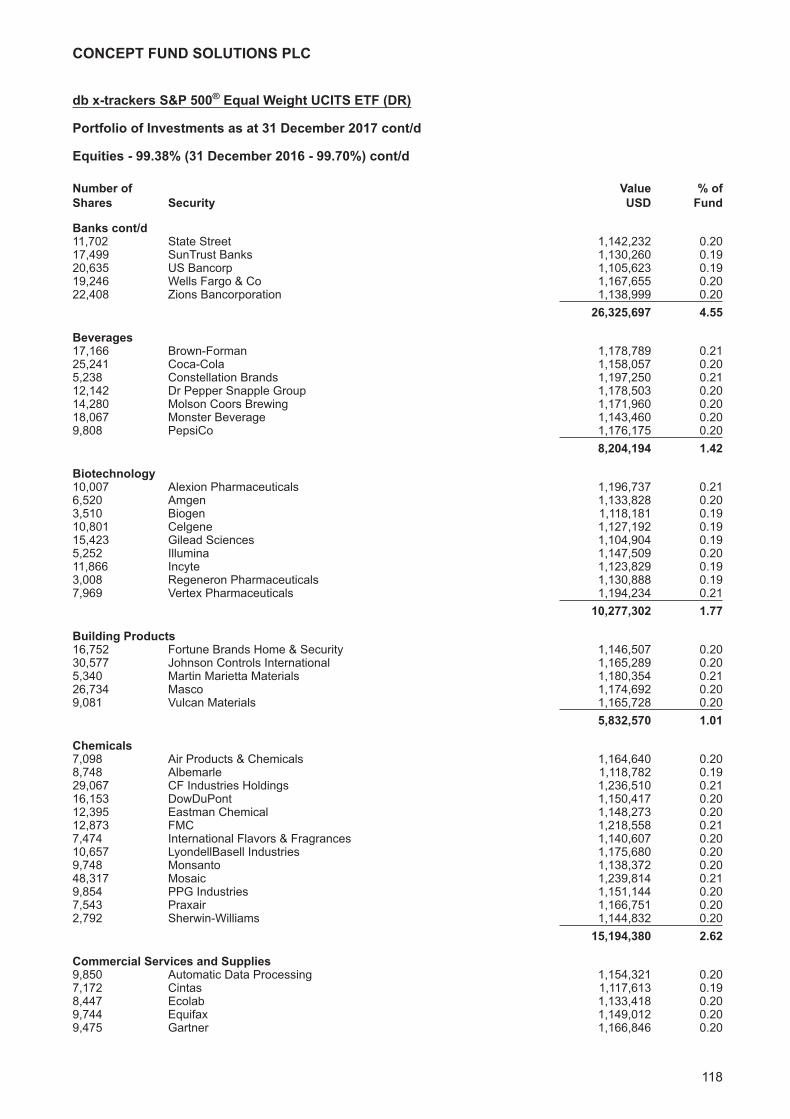
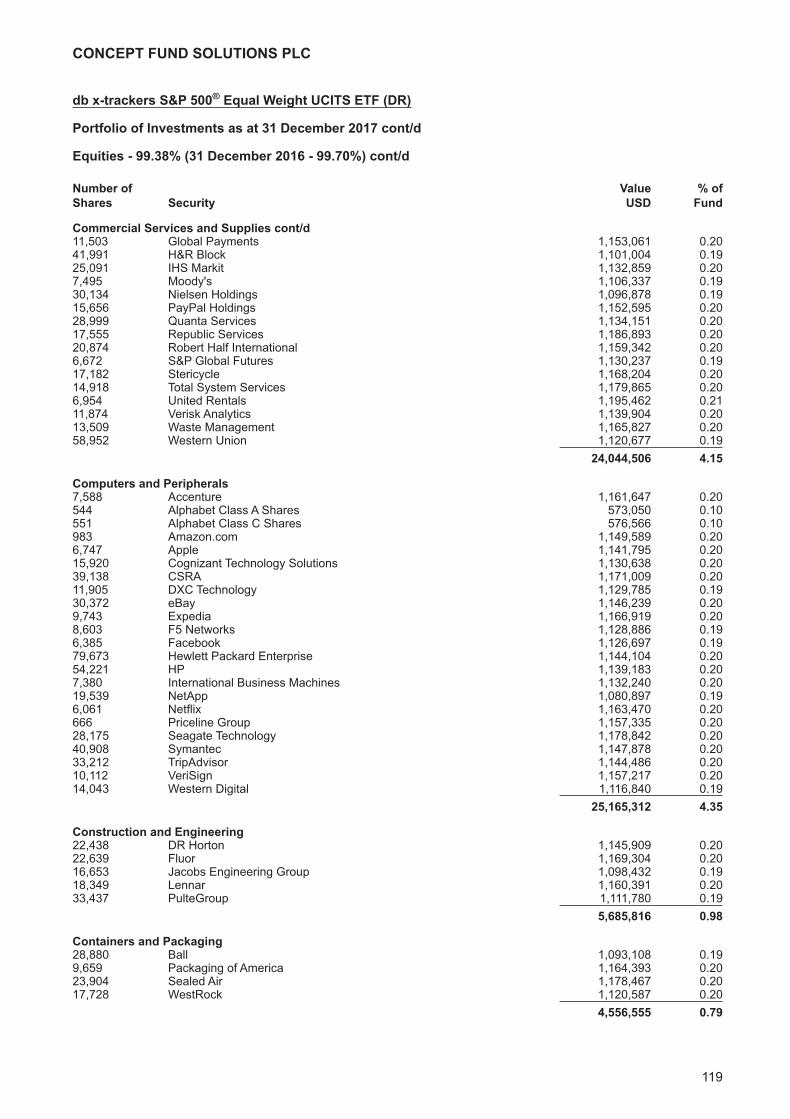
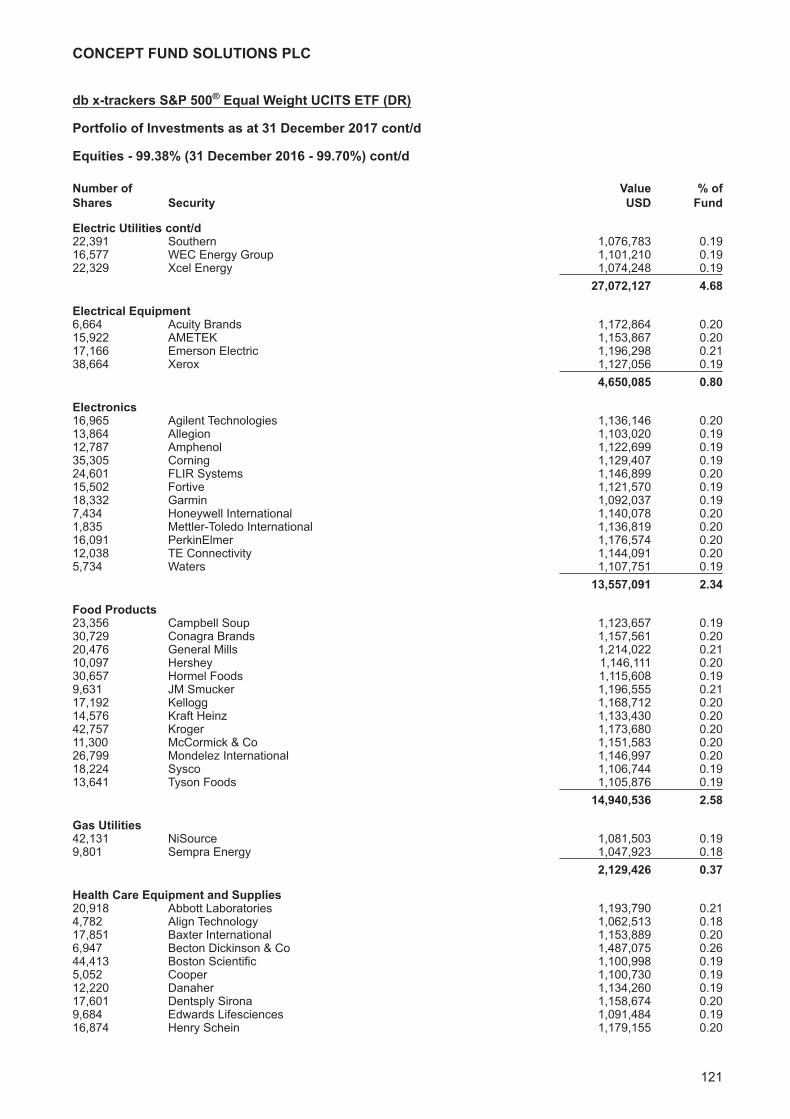
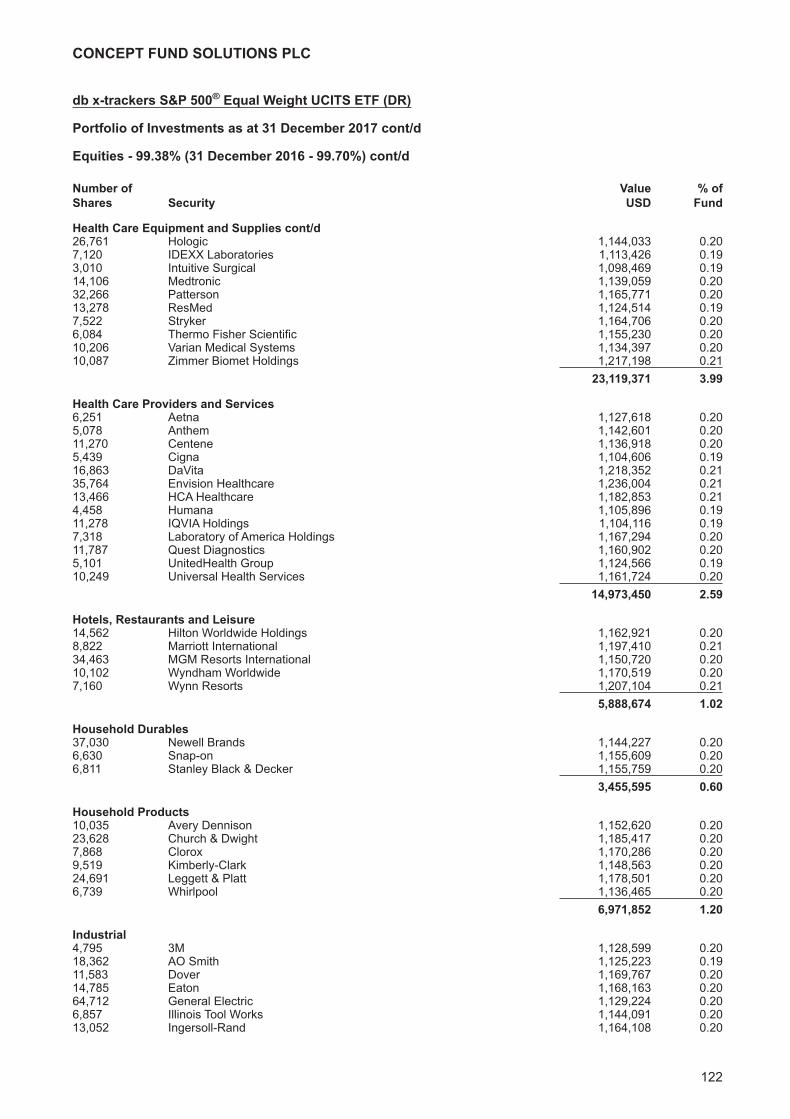
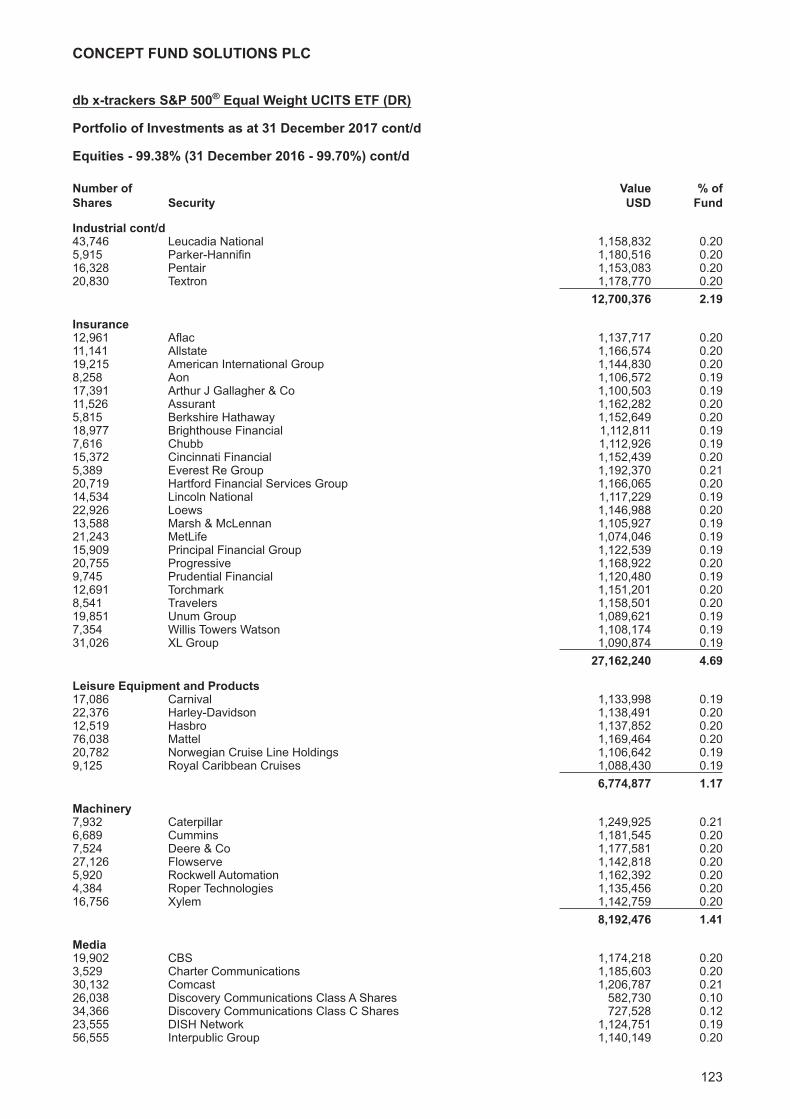
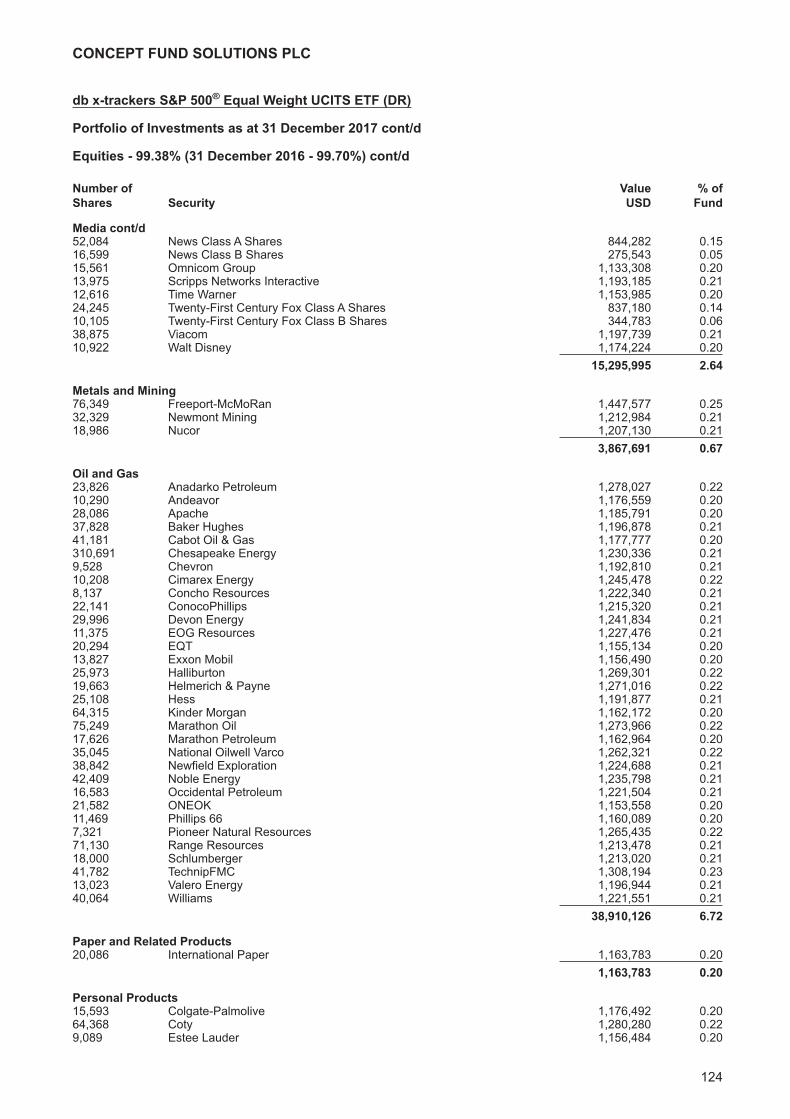
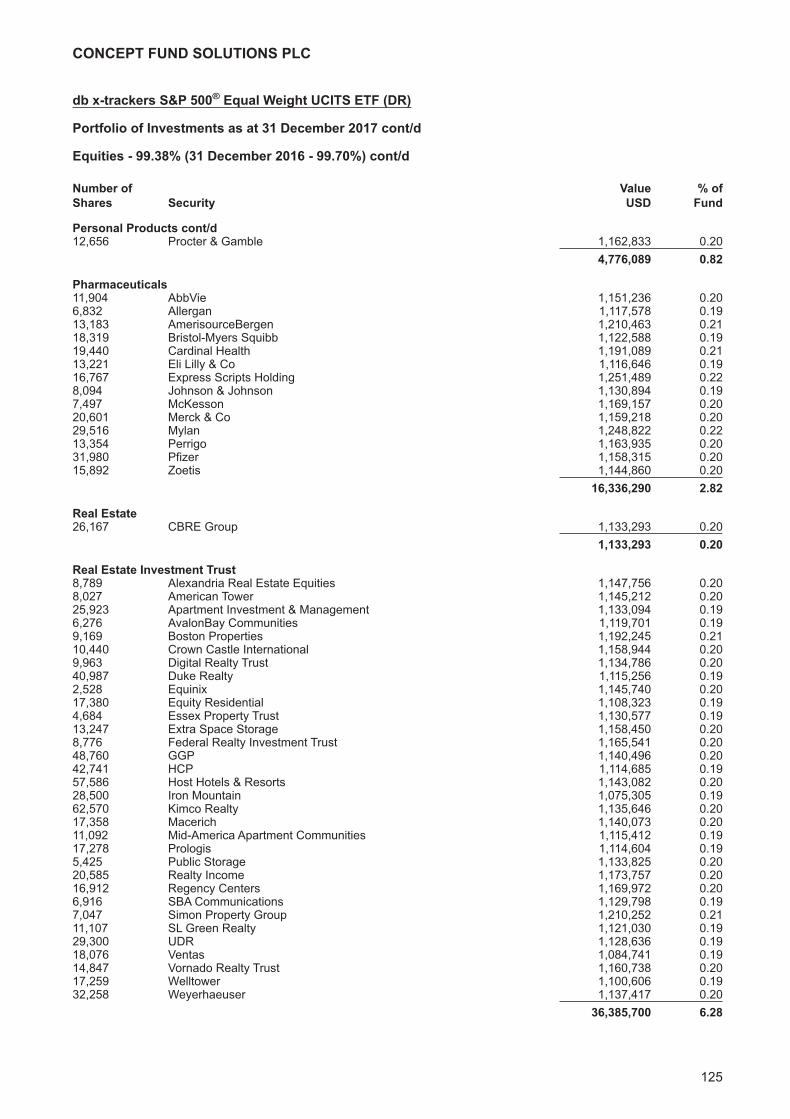
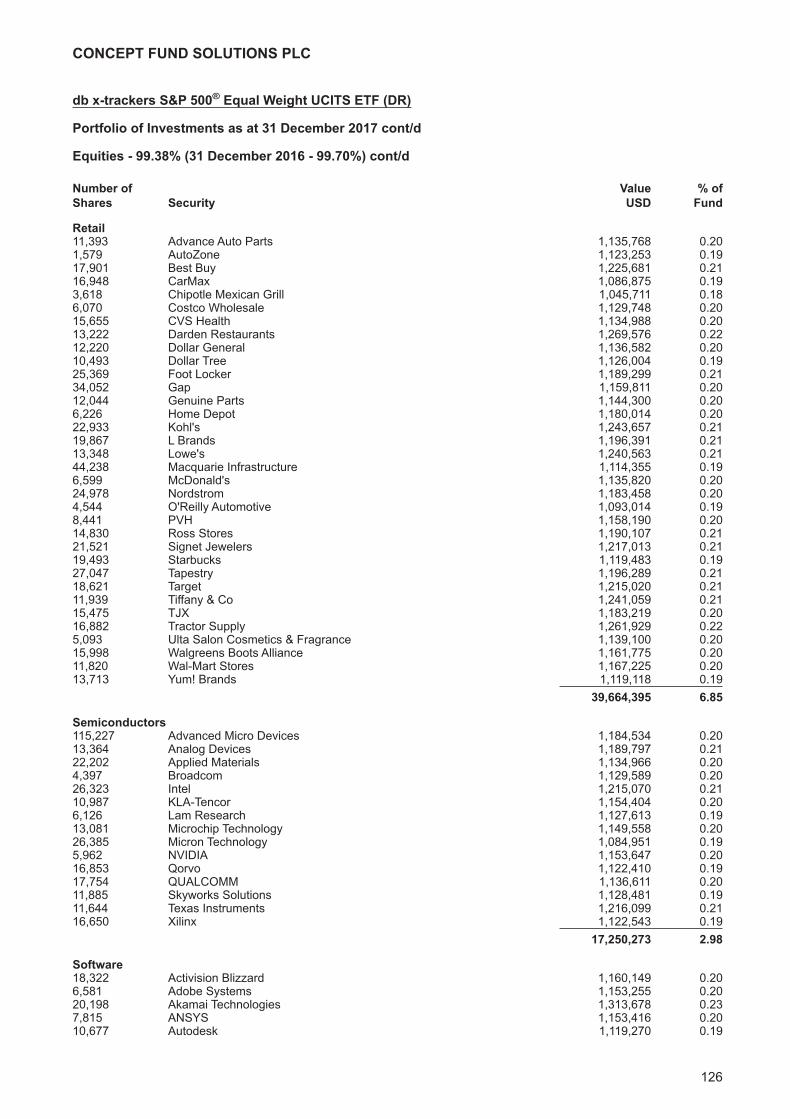
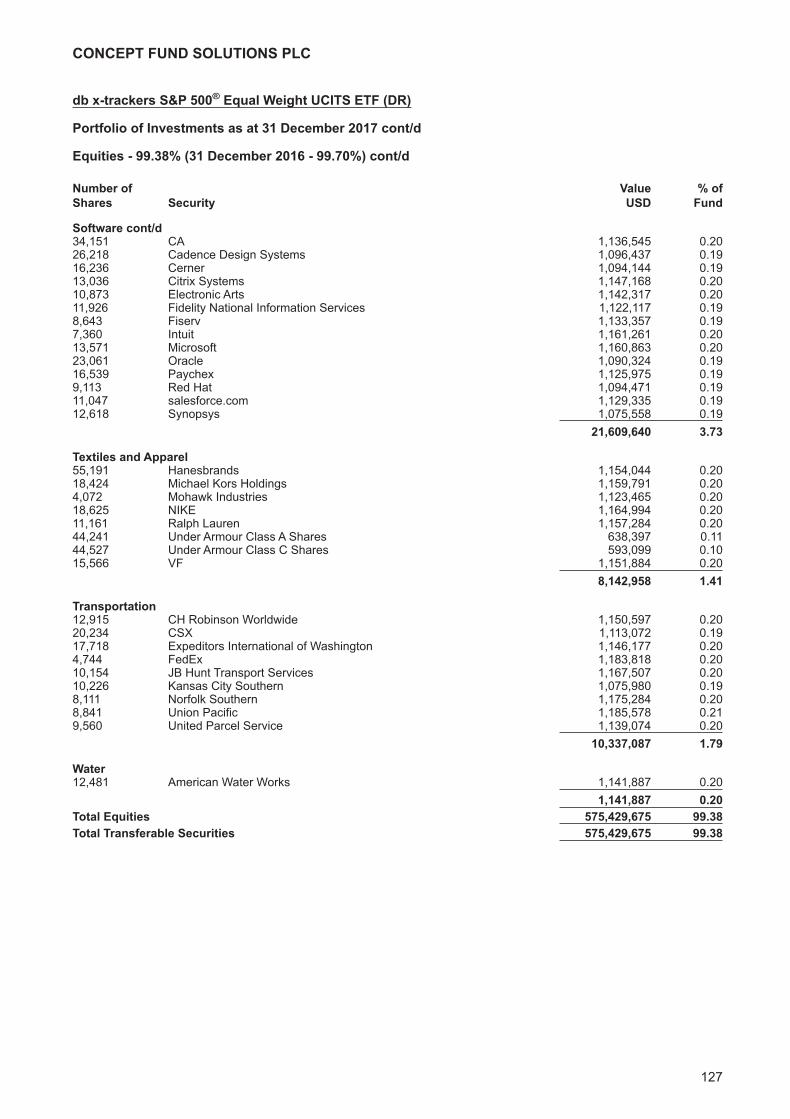
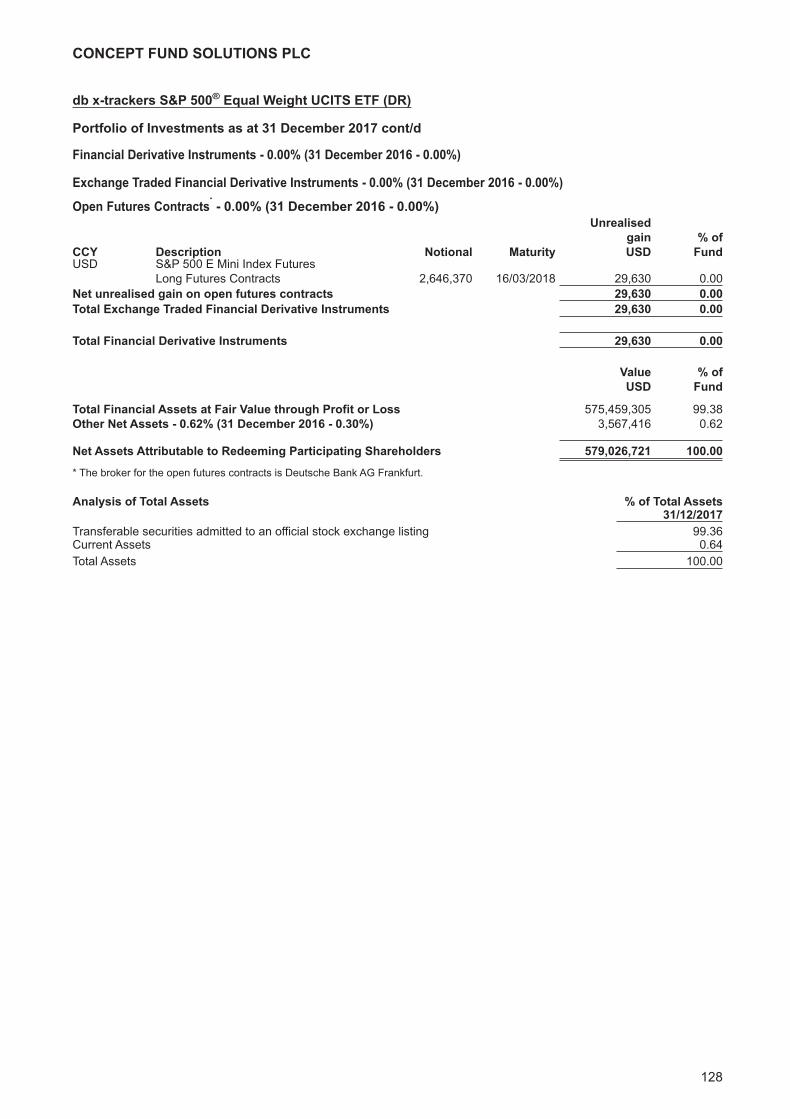
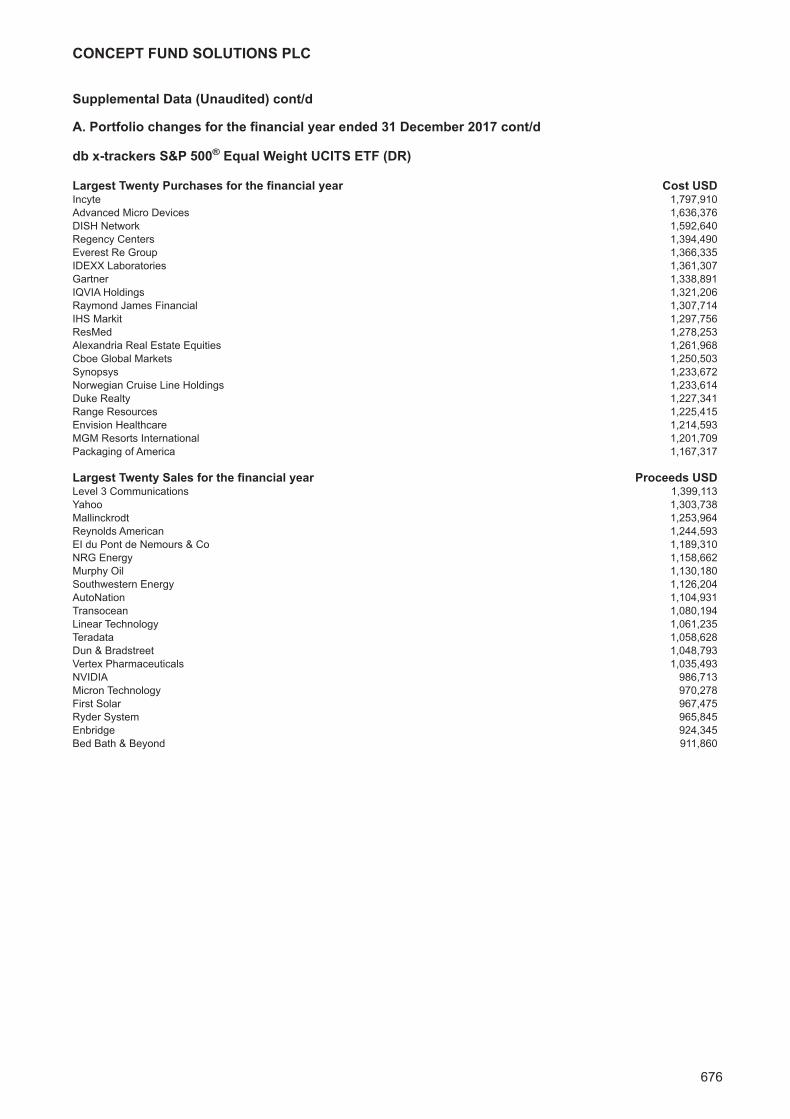
db x-trackers S&P 500® Equal Weight UCITS ETF (DR)Investment Manager’s Report 116Portfolio of Investments 117
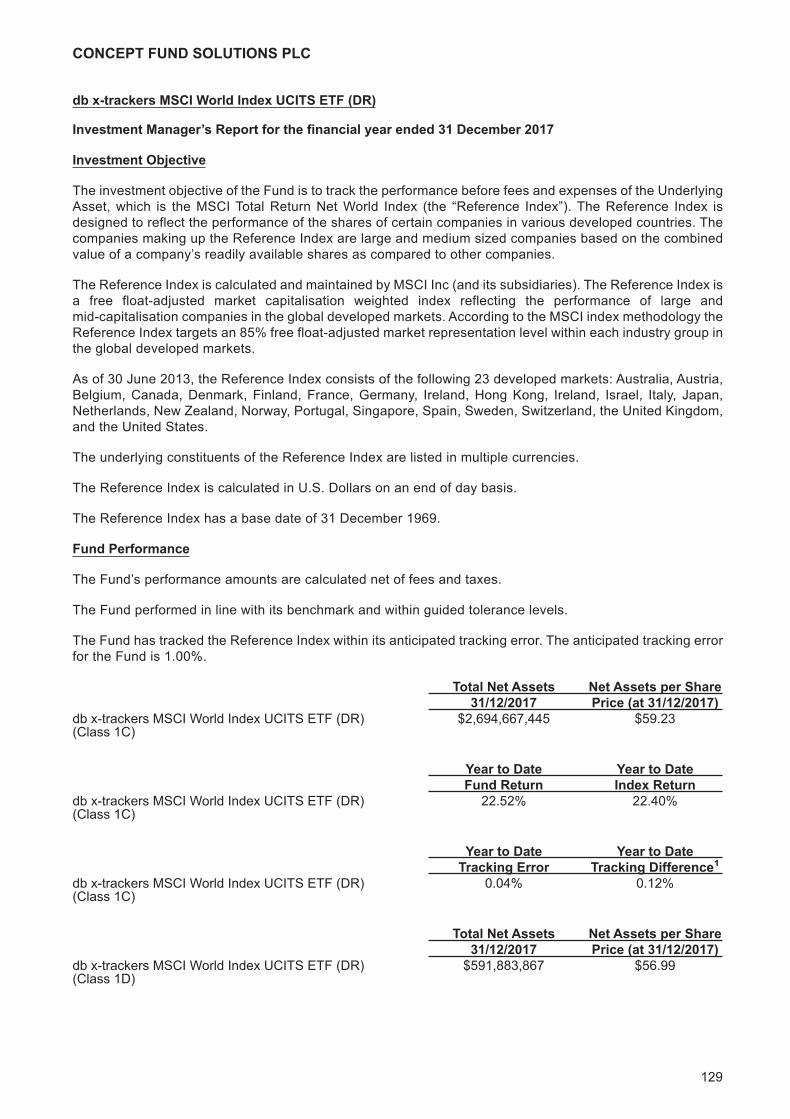
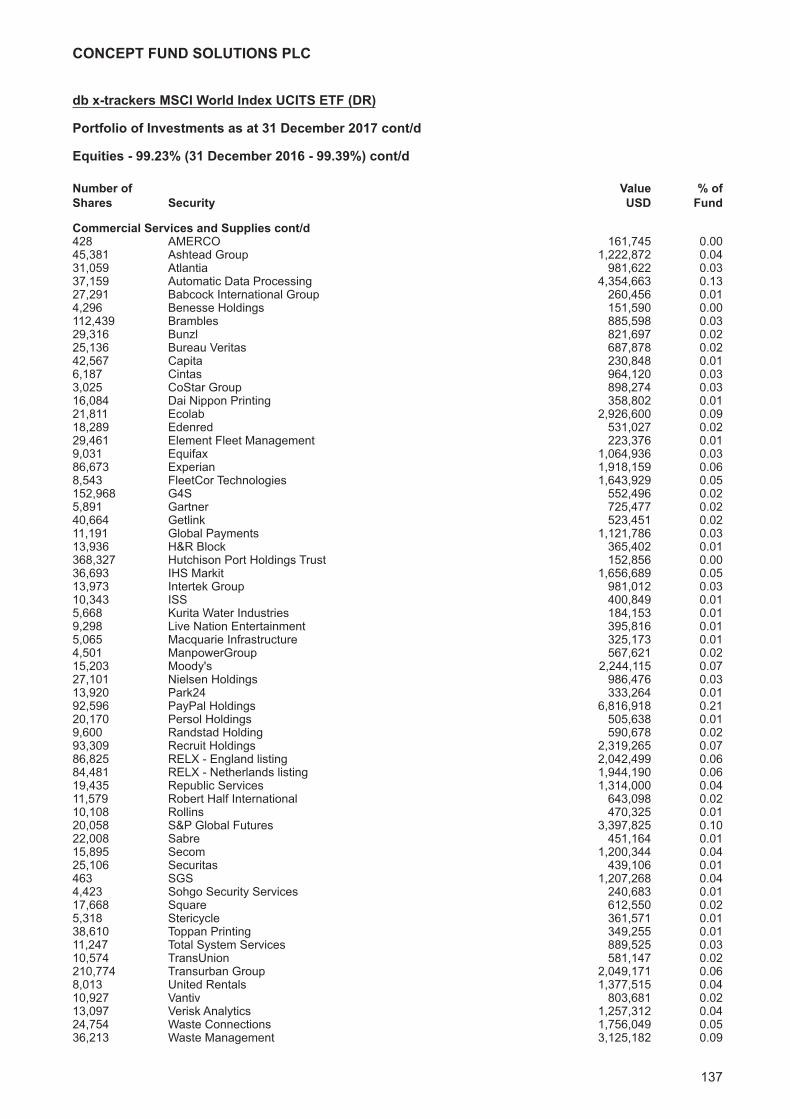
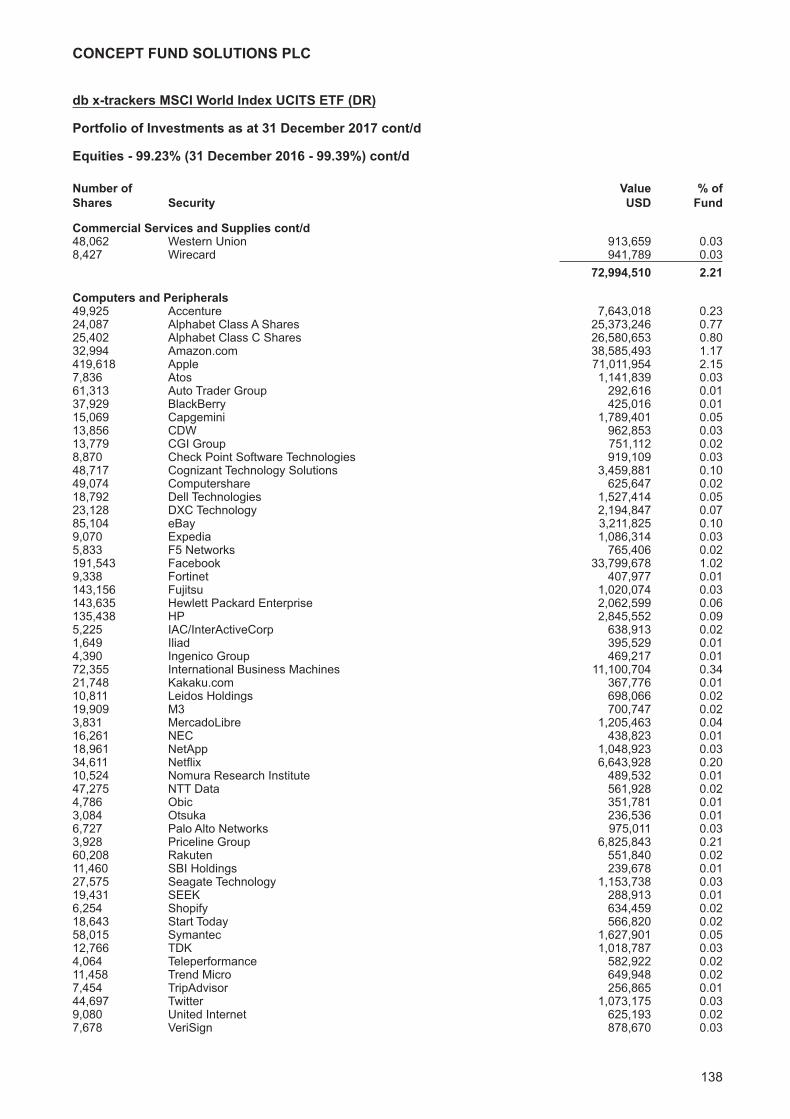
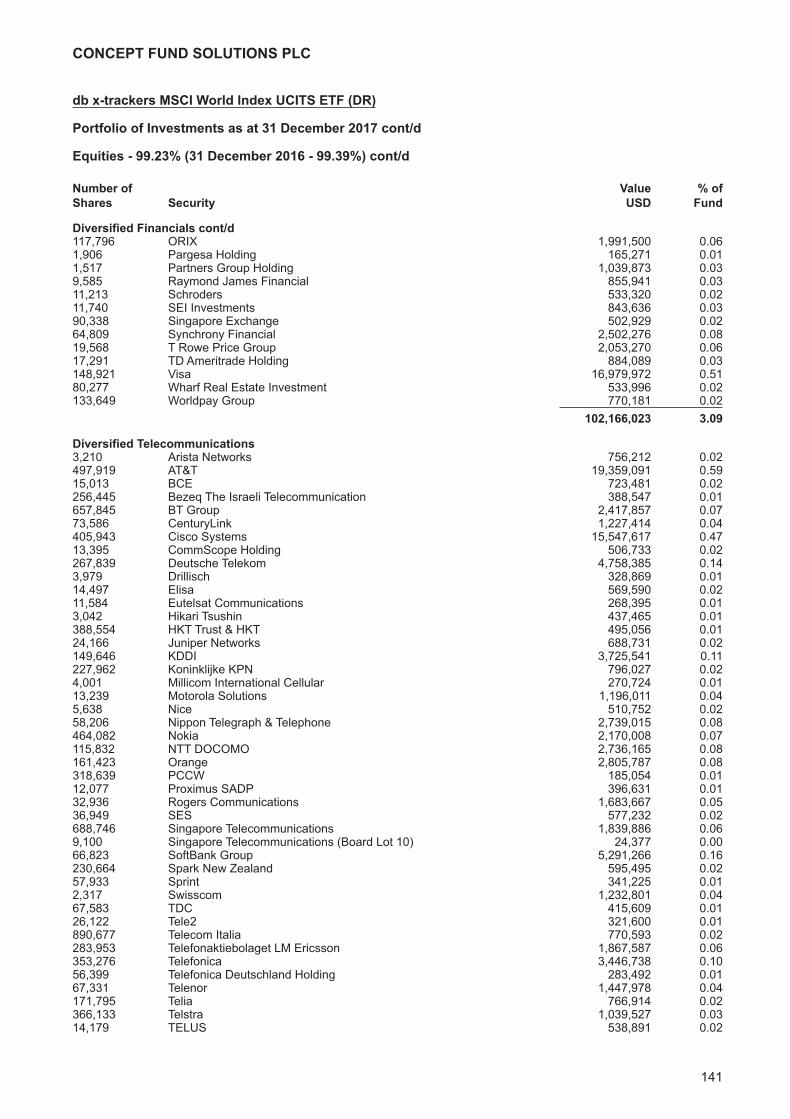
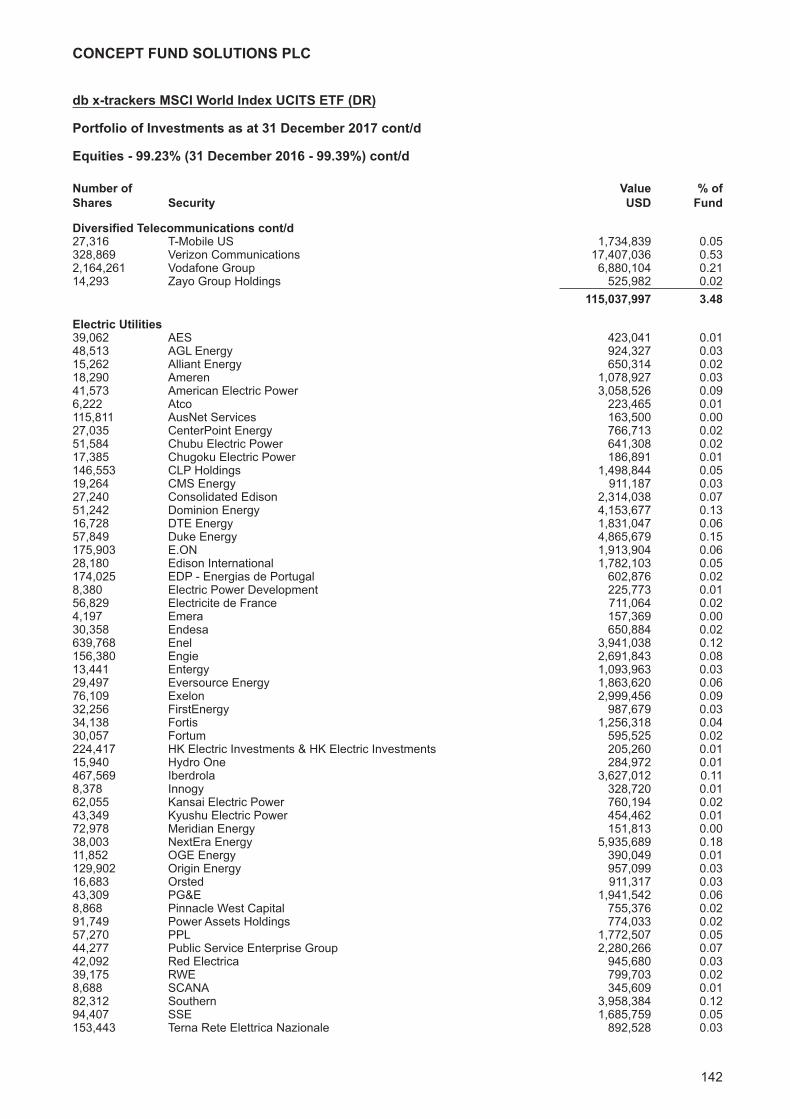
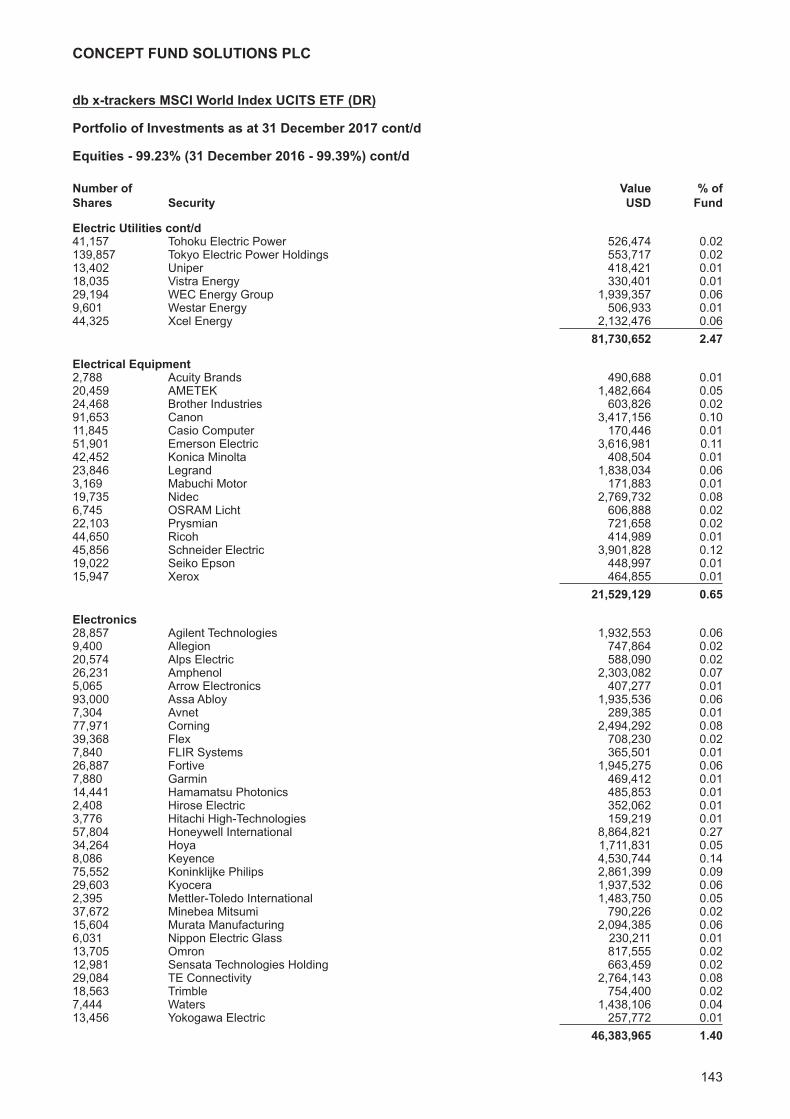
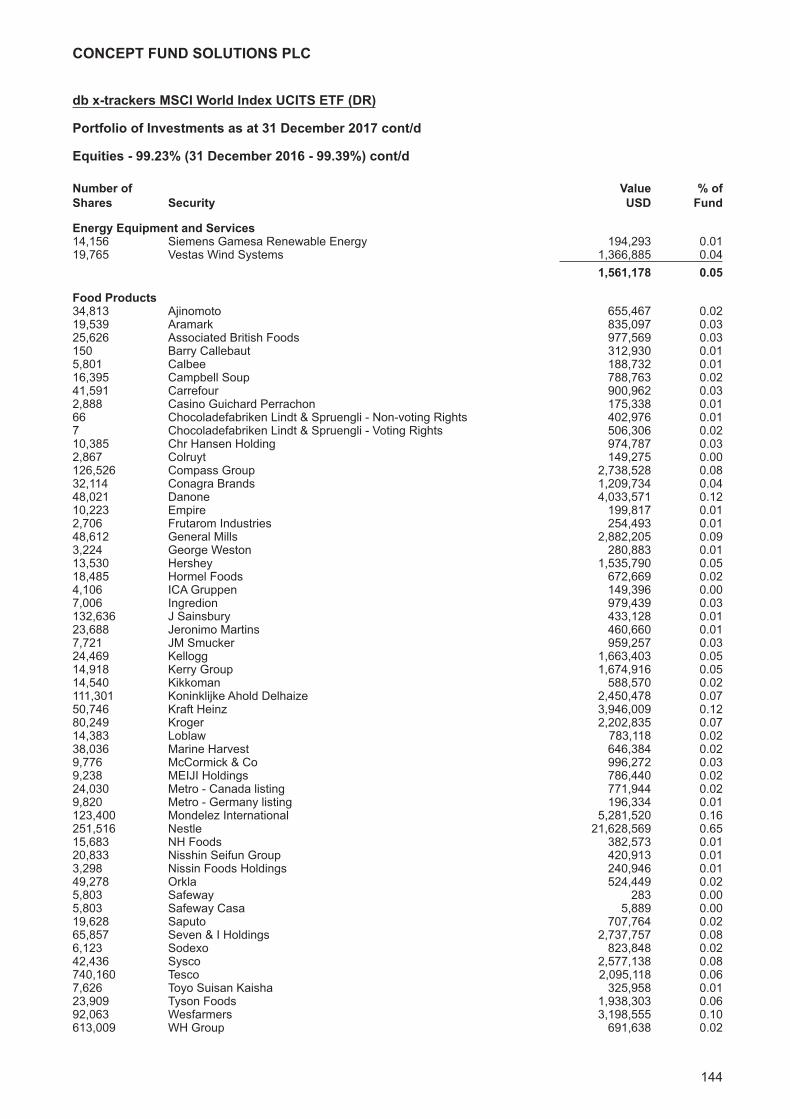
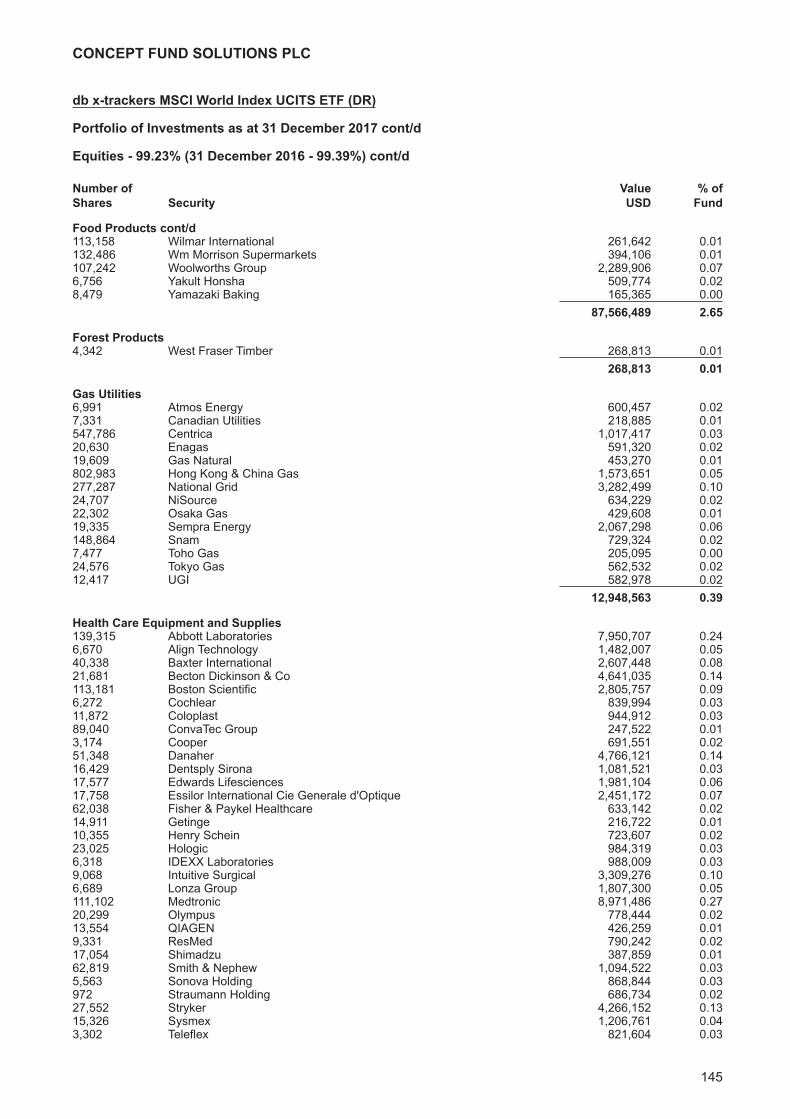
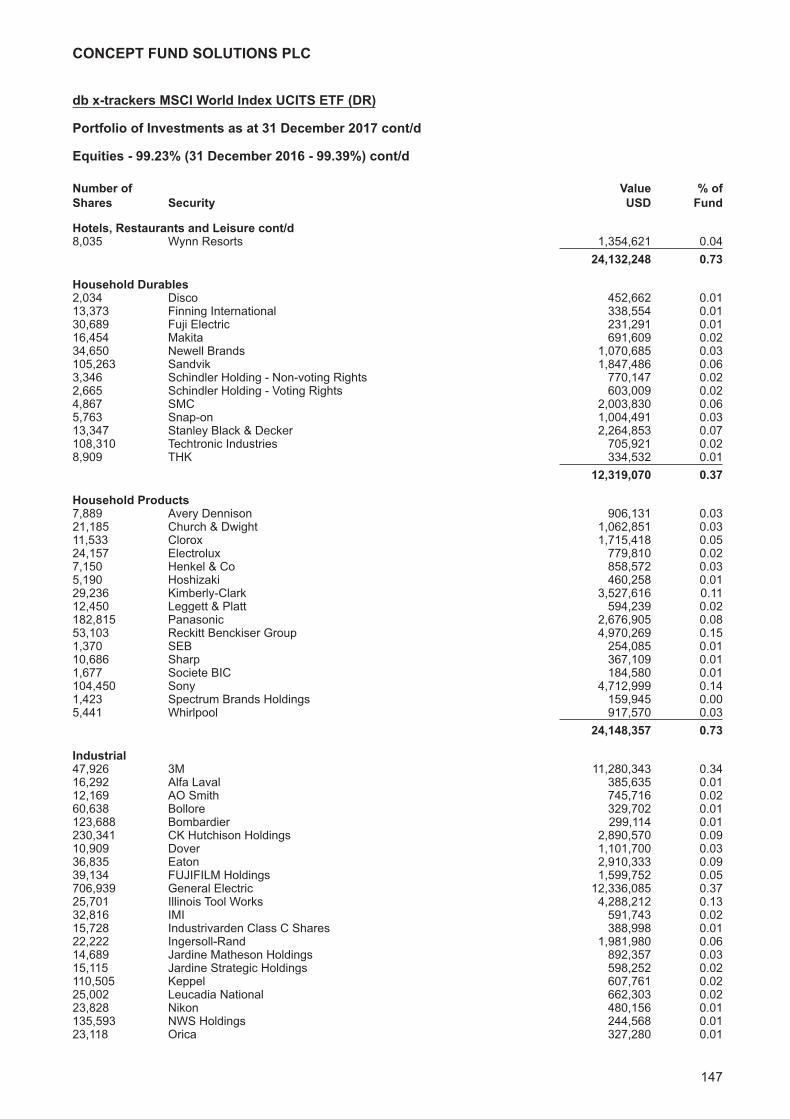
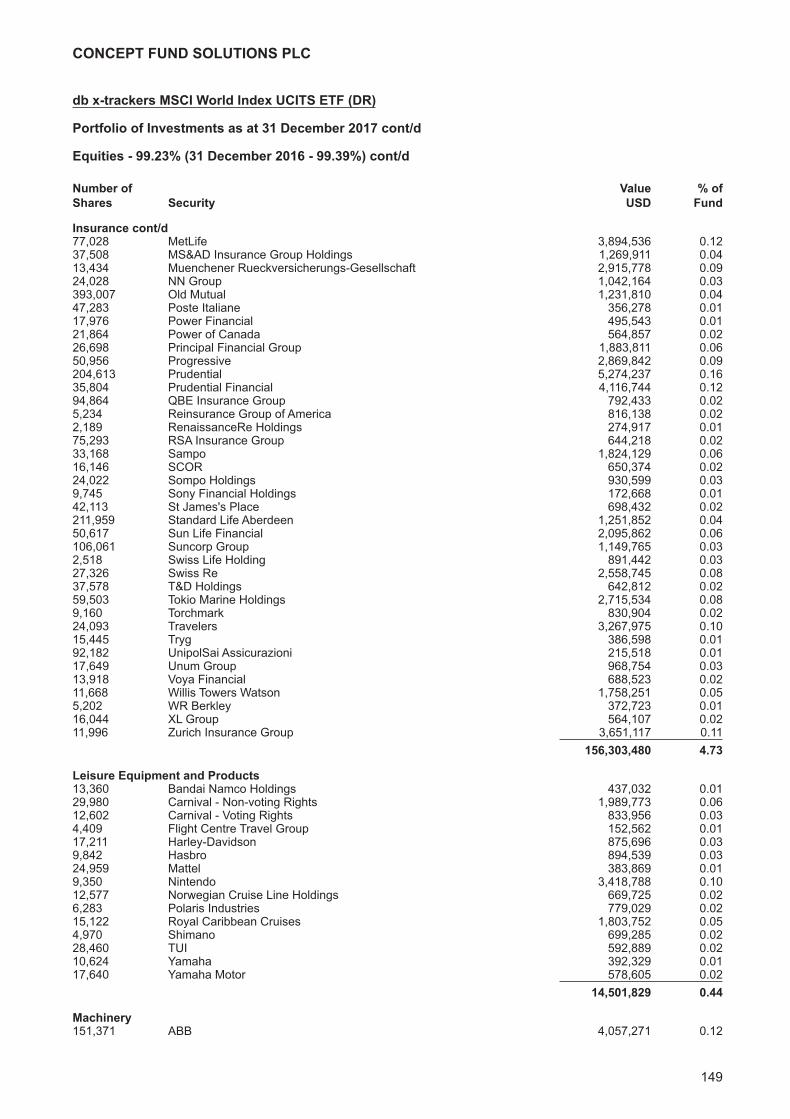
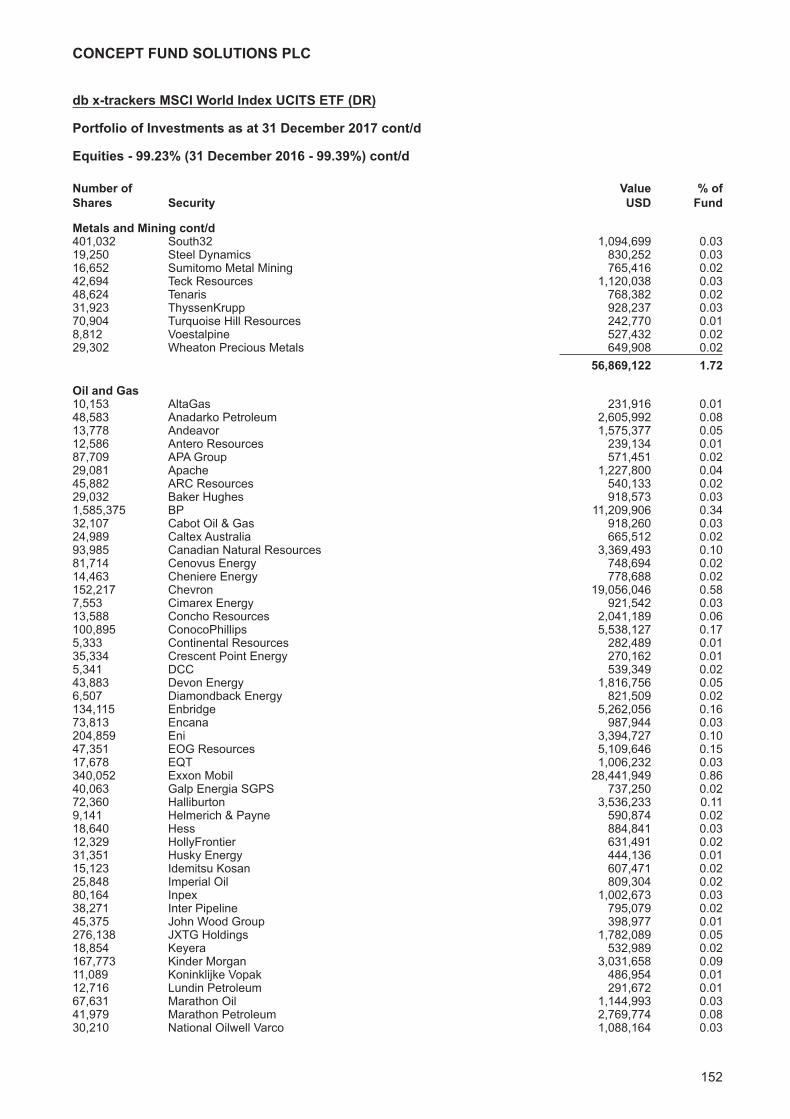
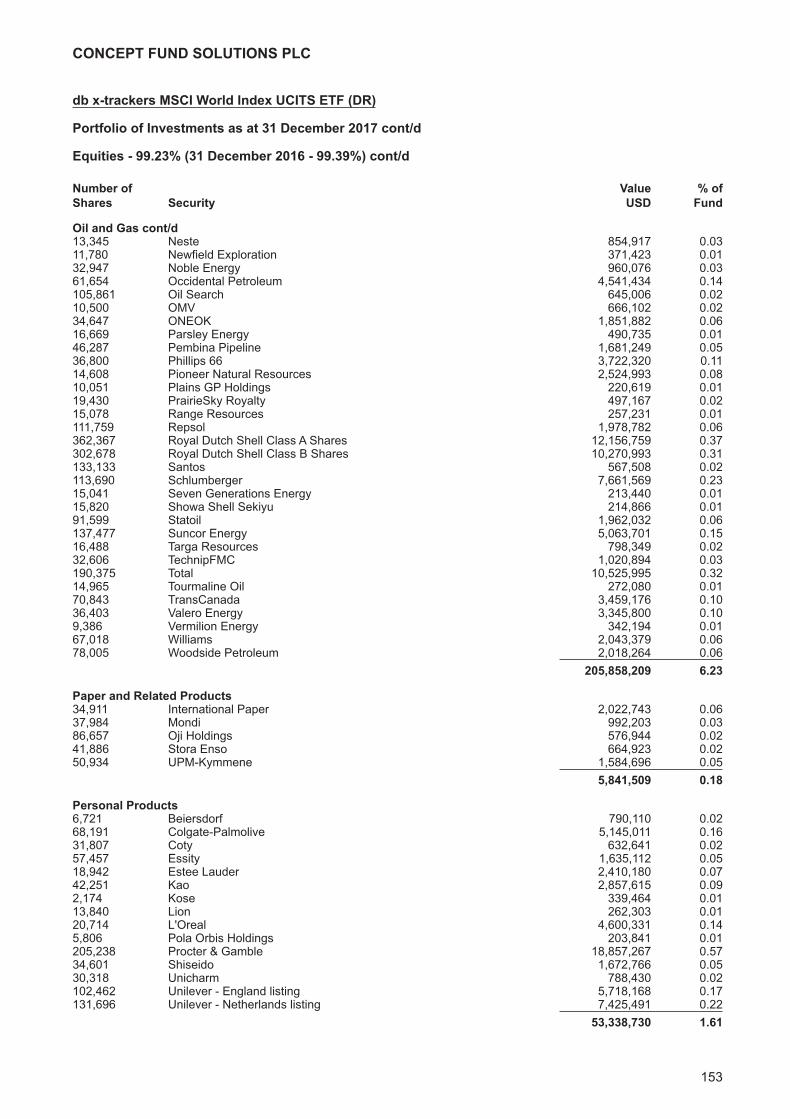
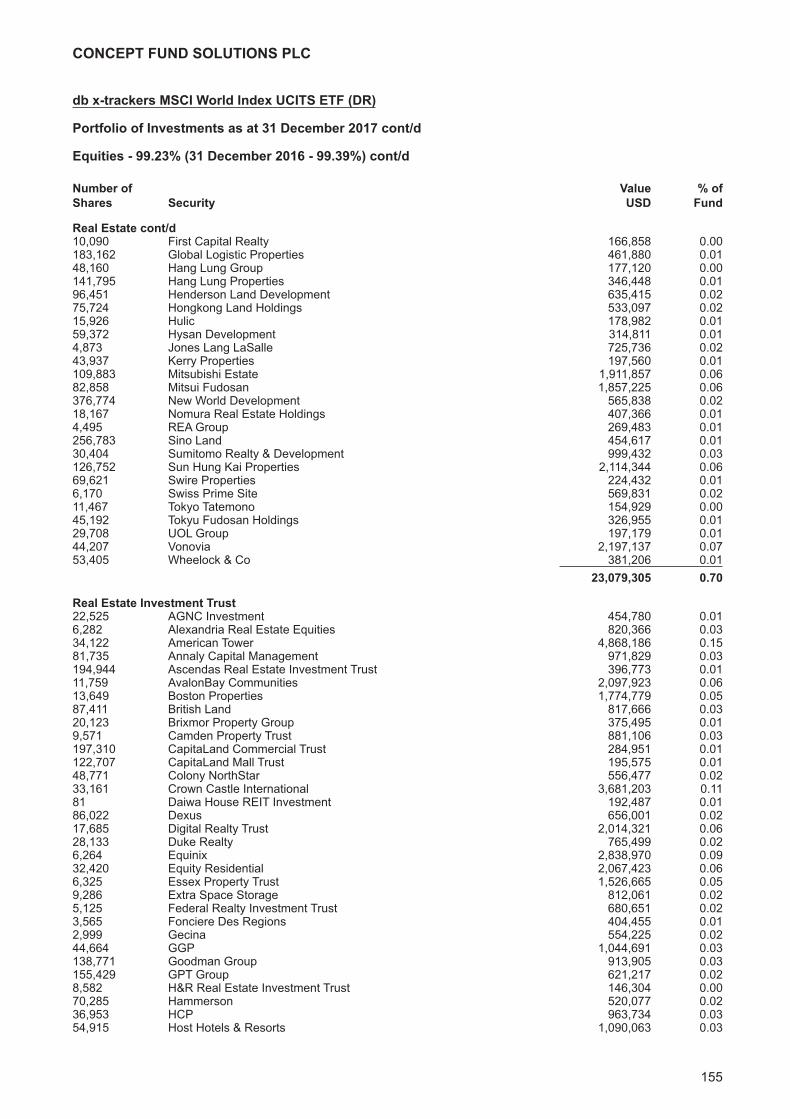
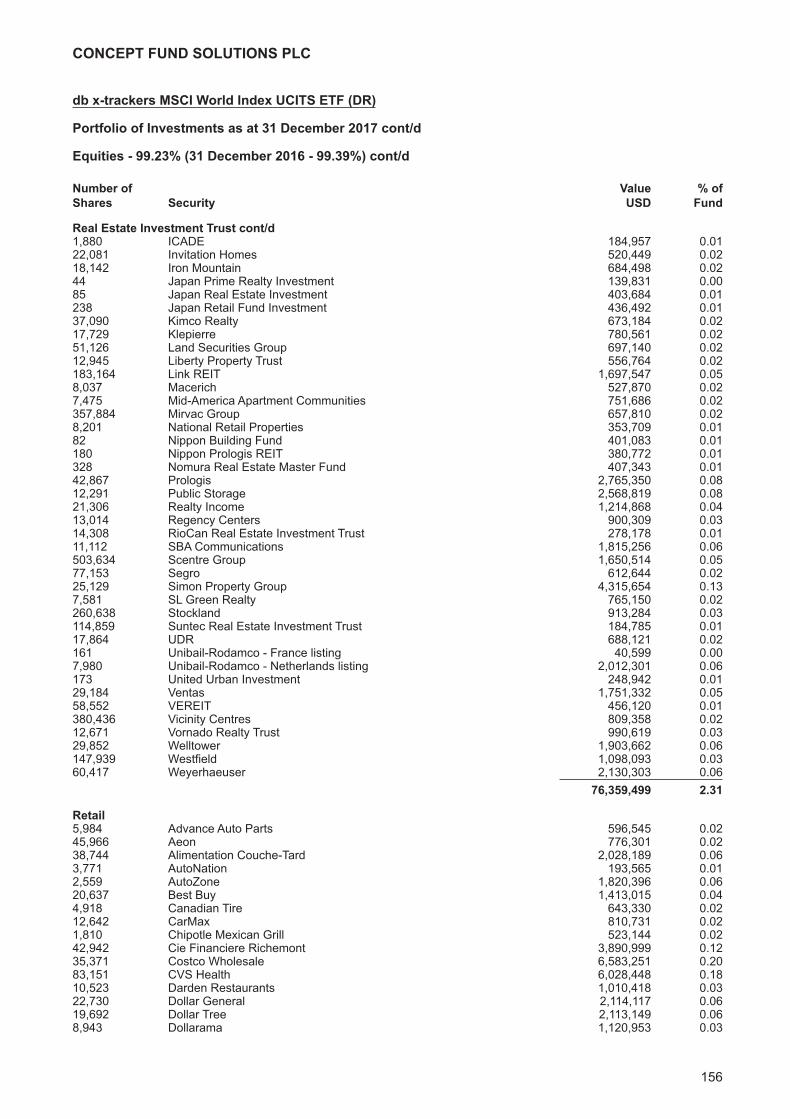
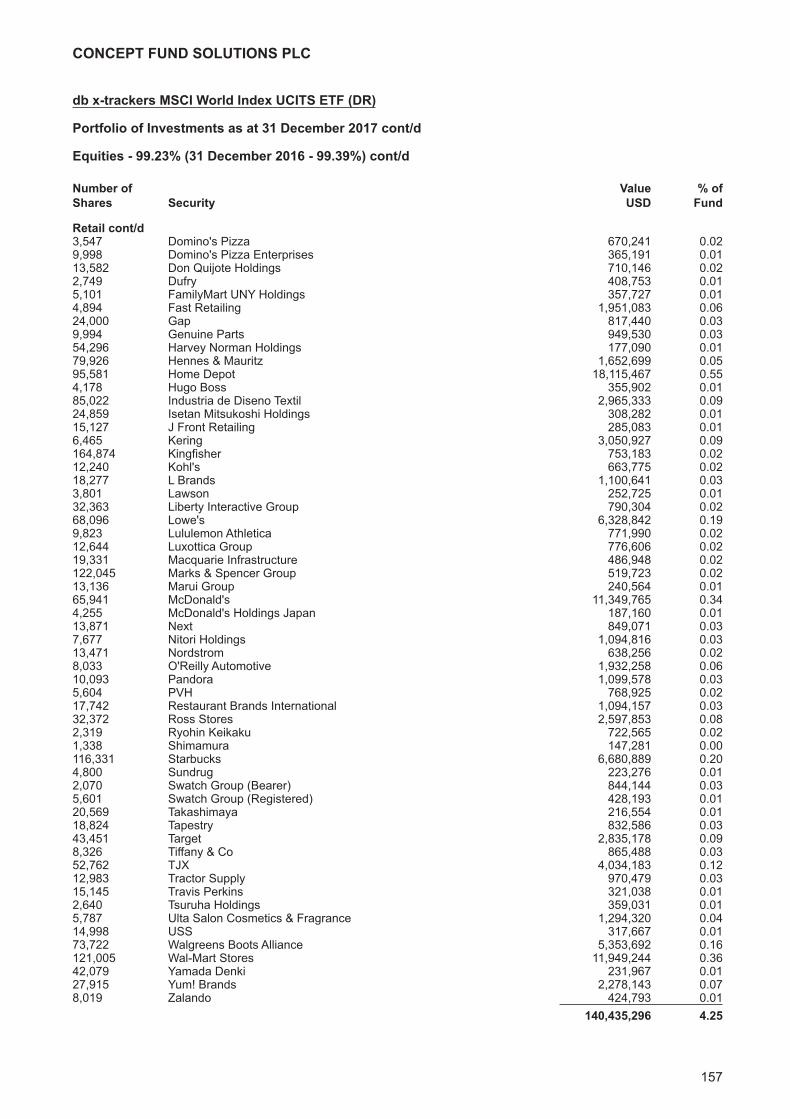
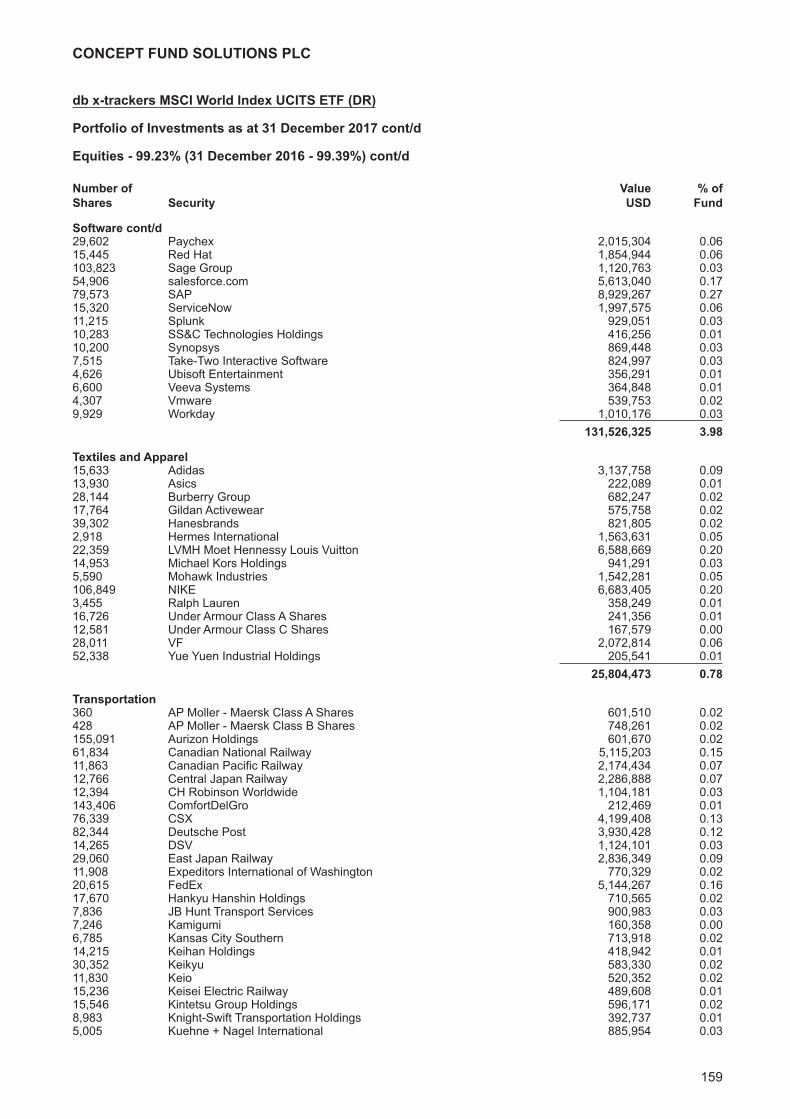
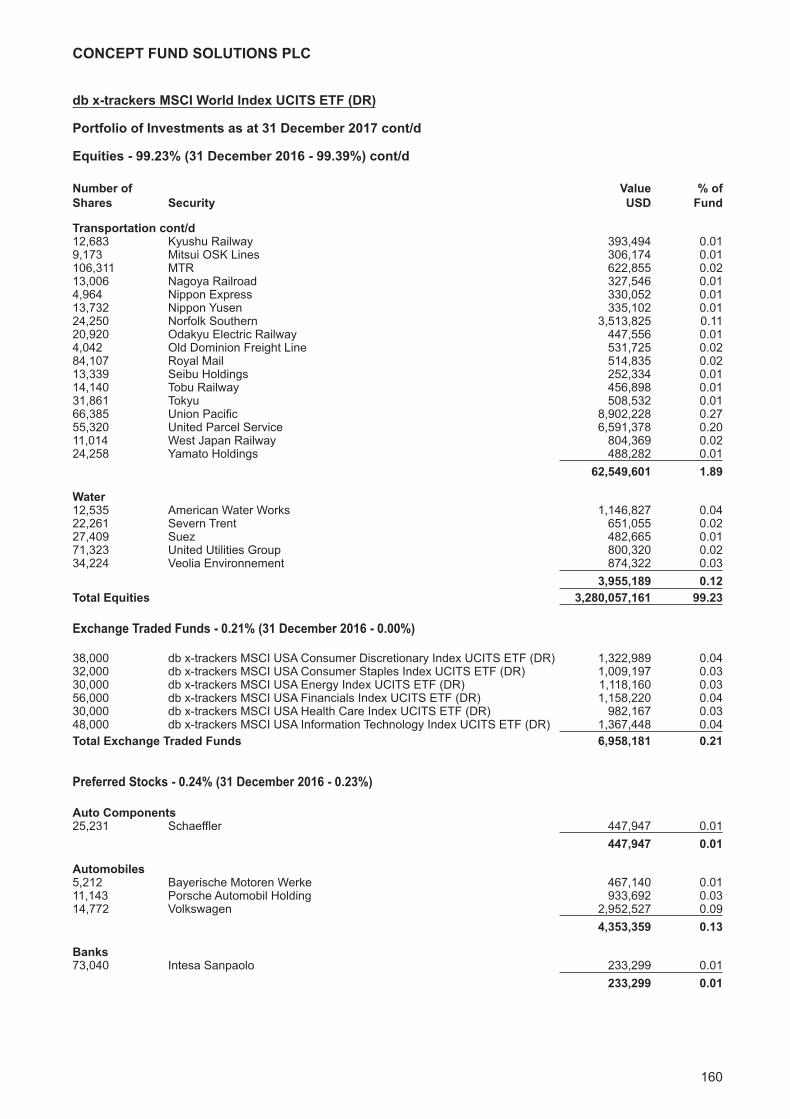
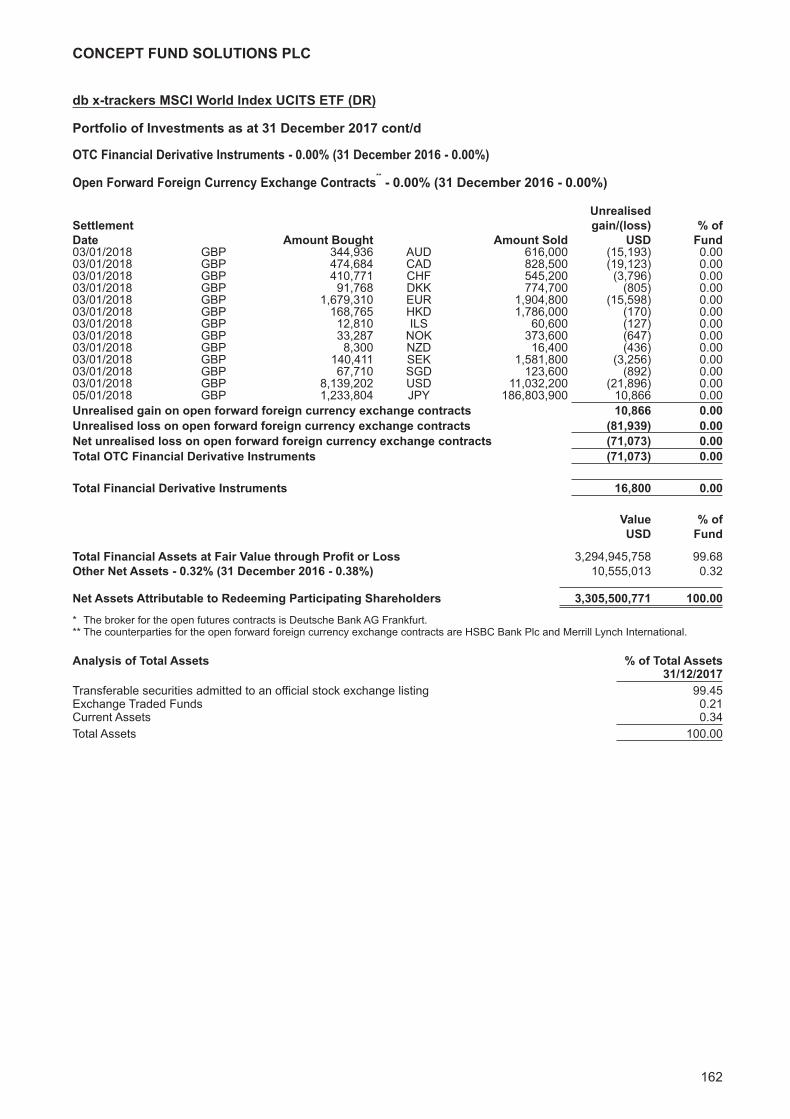
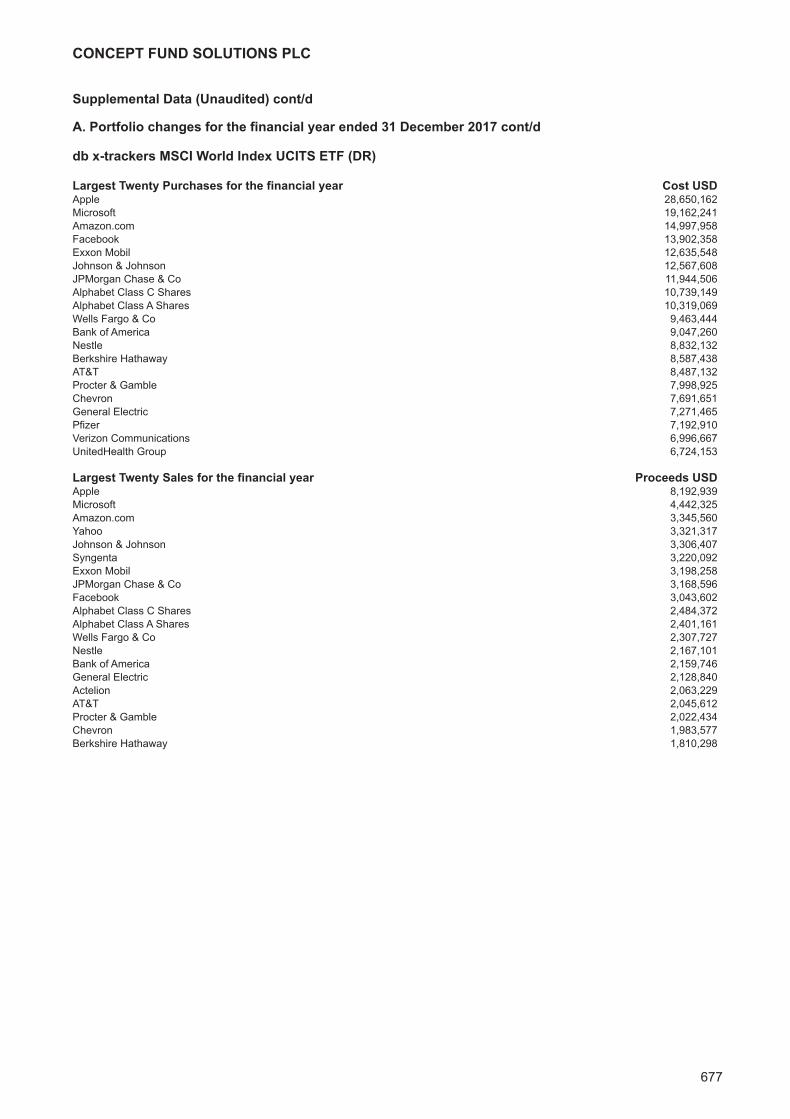
db x-trackers MSCI World Index UCITS ETF (DR)Investment Manager’s Report 129Portfolio of Investments 131
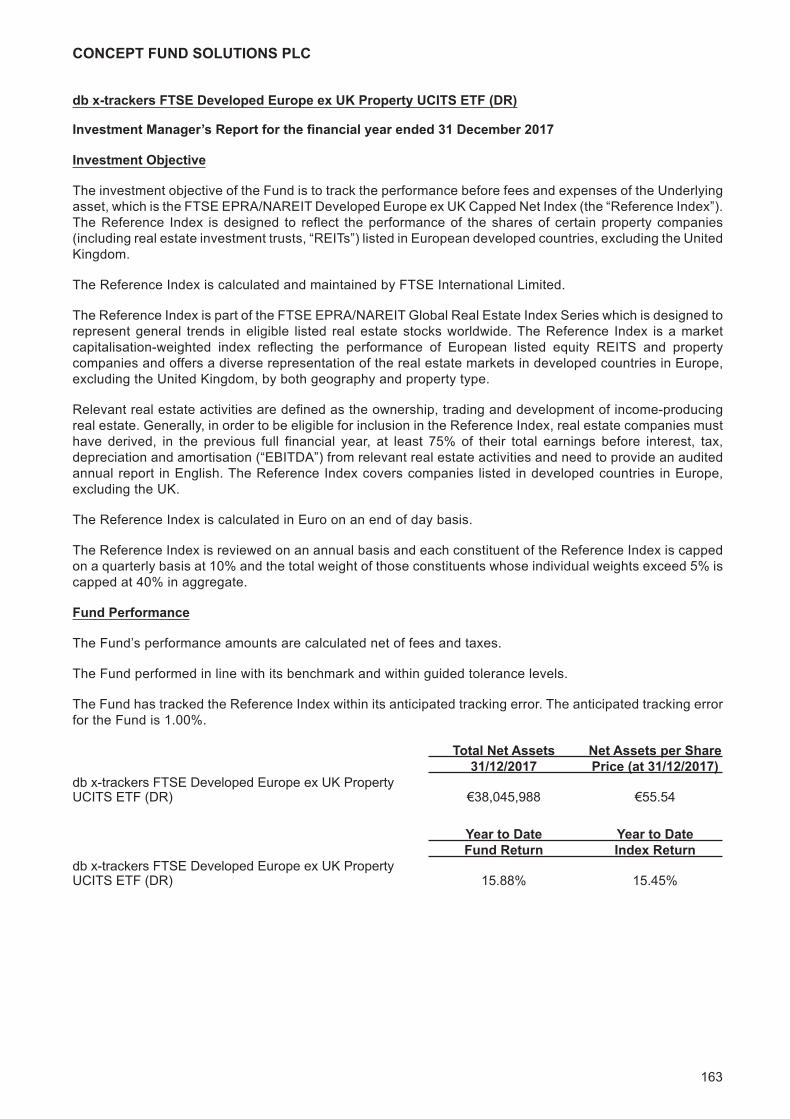
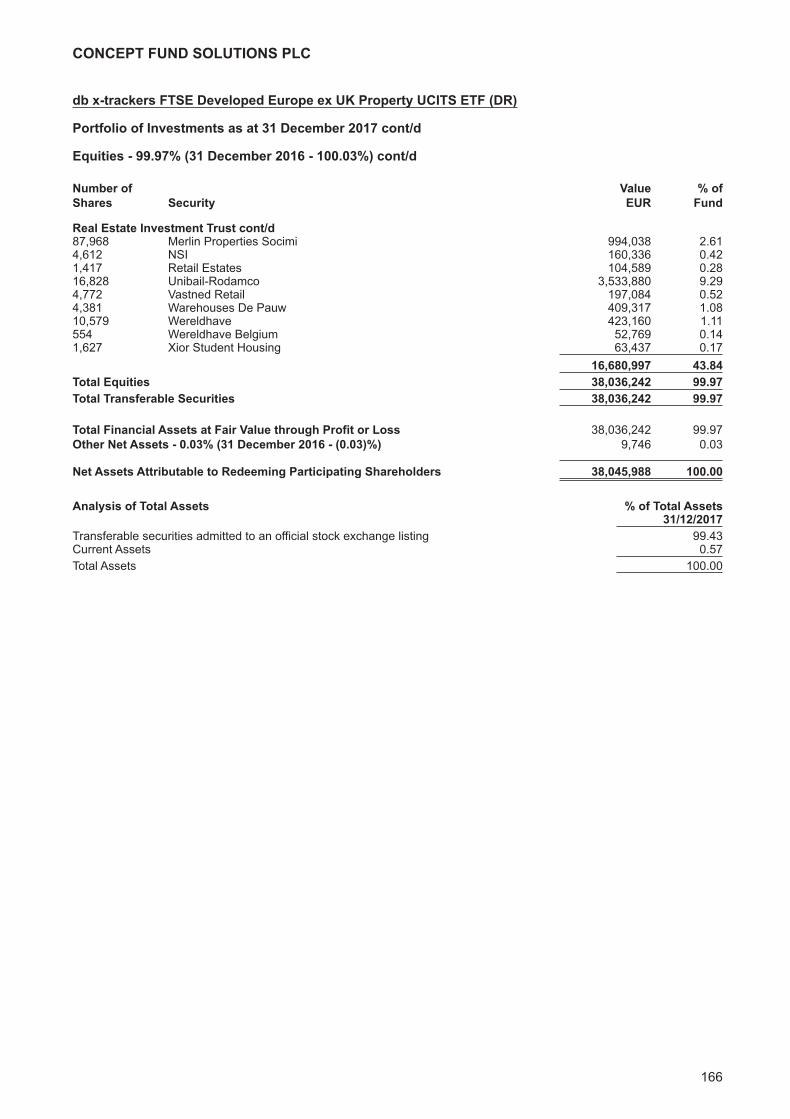
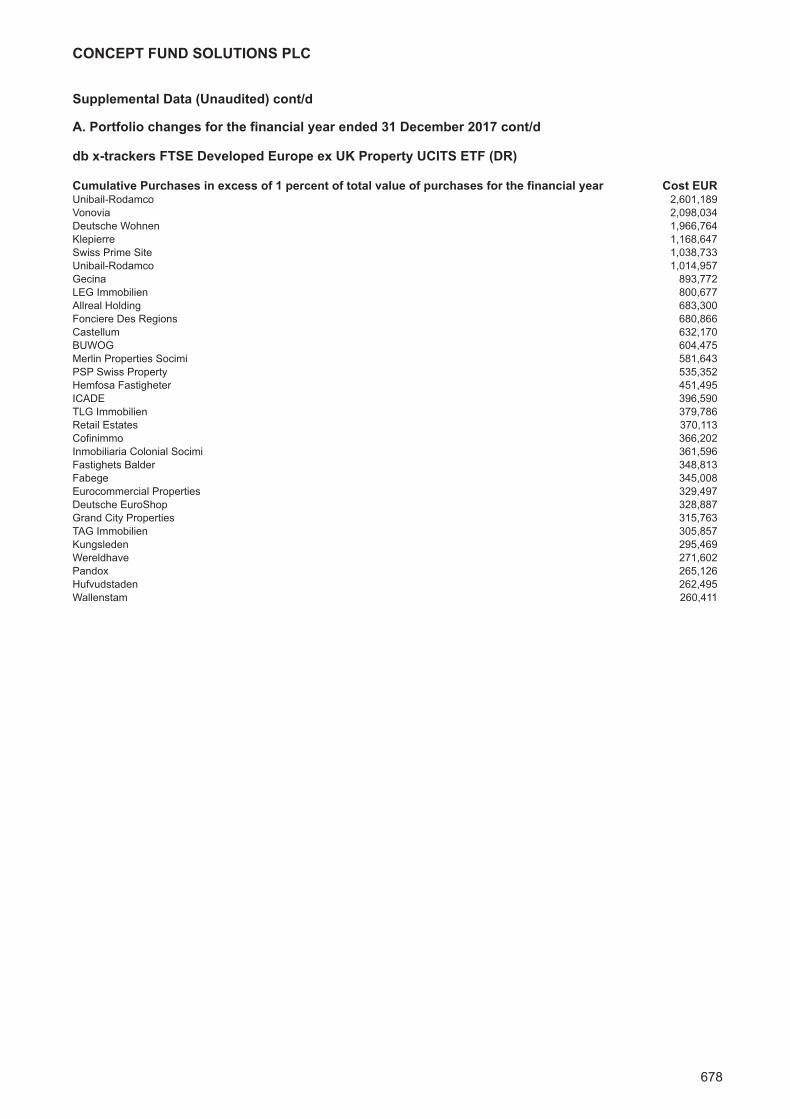
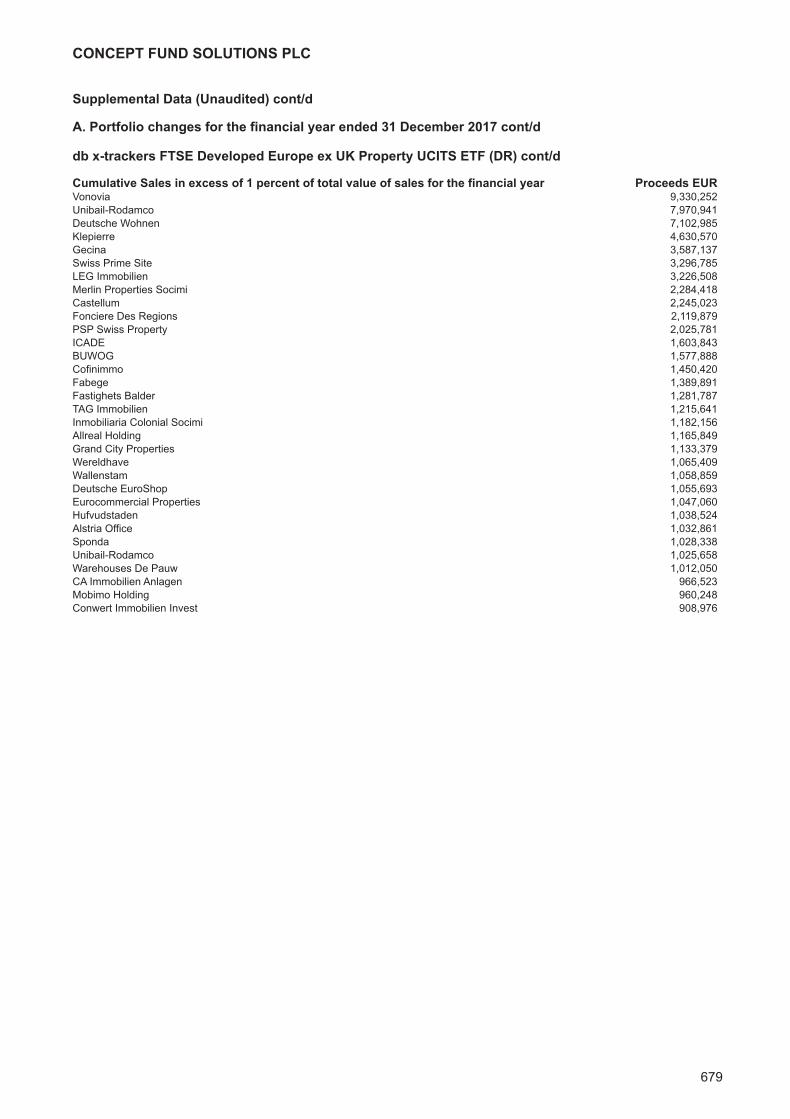
db x-trackers FTSE Developed Europe ex UK Property UCITS ETF (DR)Investment Manager’s Report 163Portfolio of Investments 165
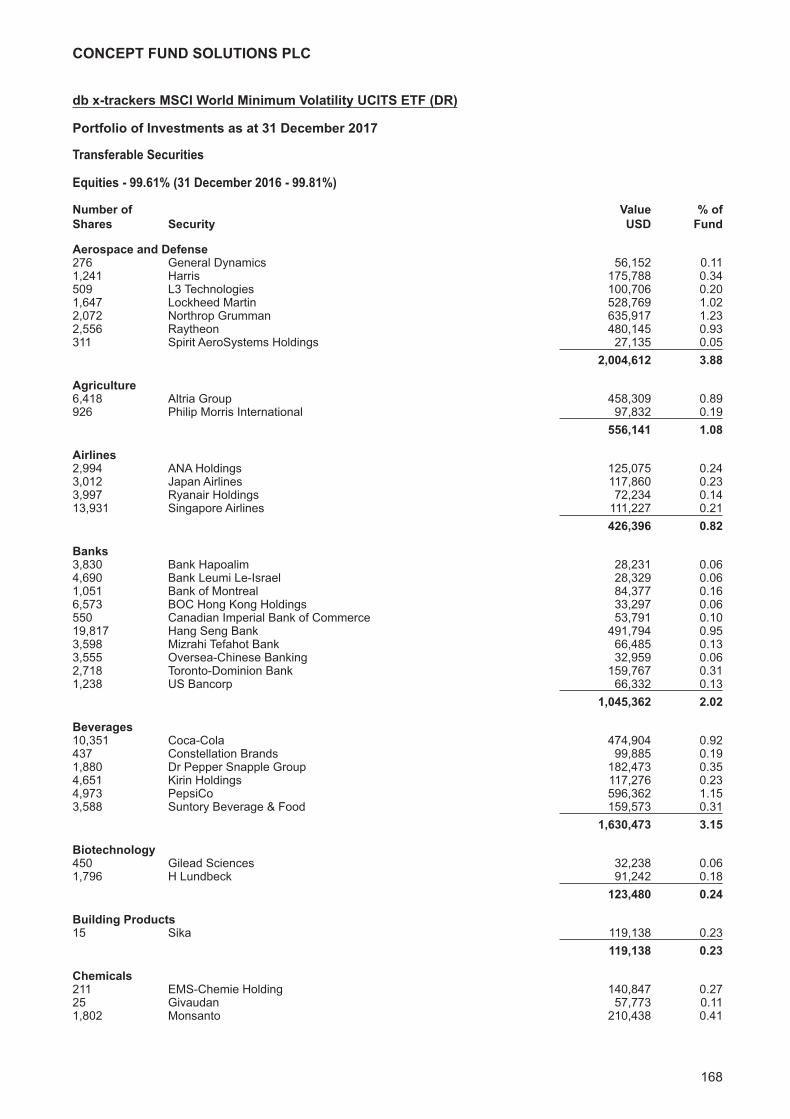
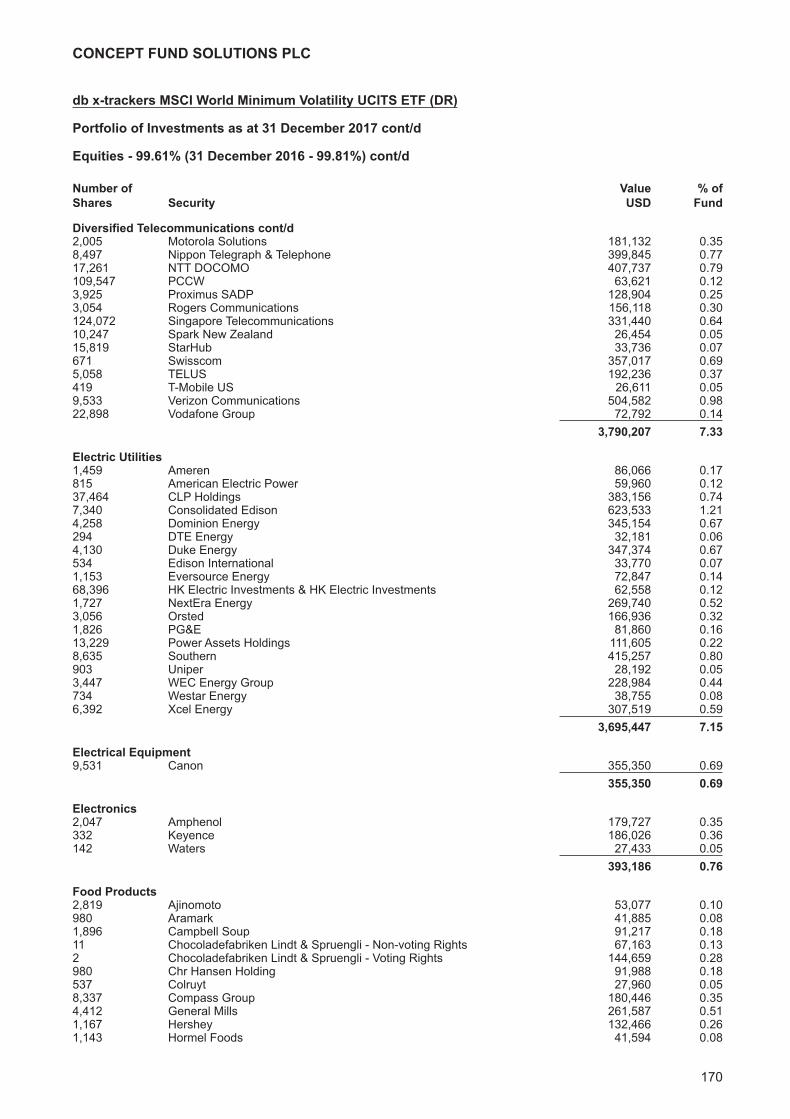
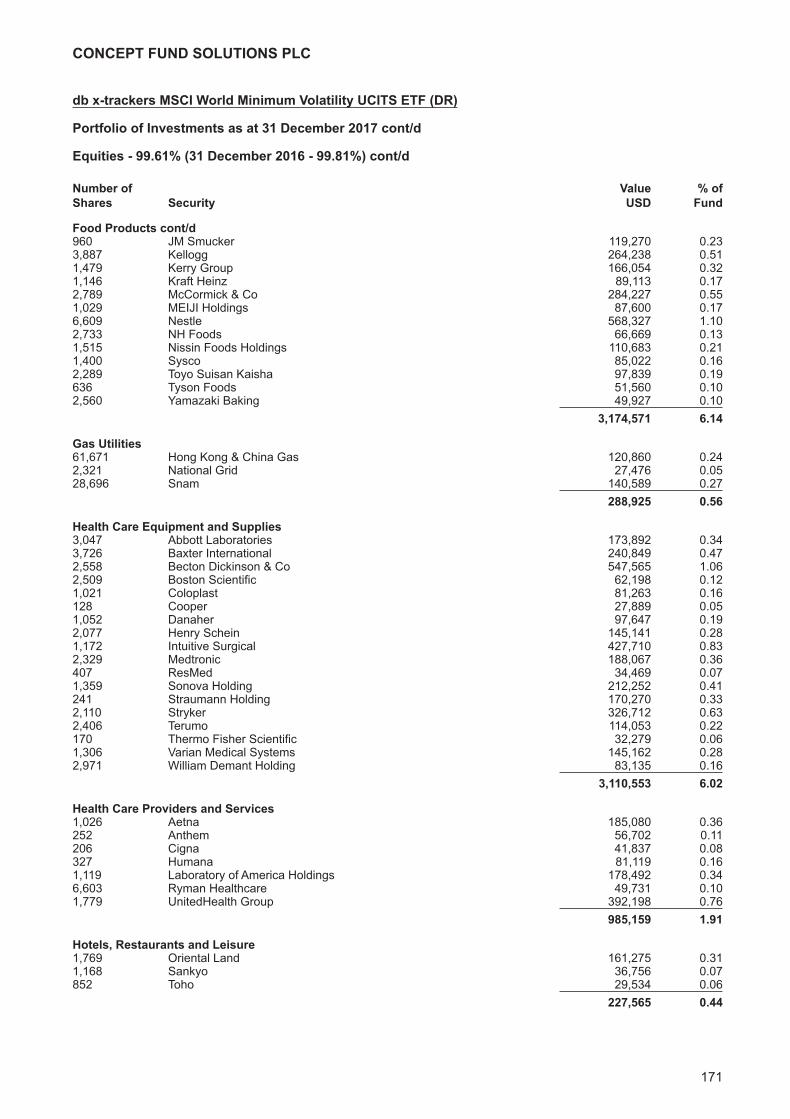
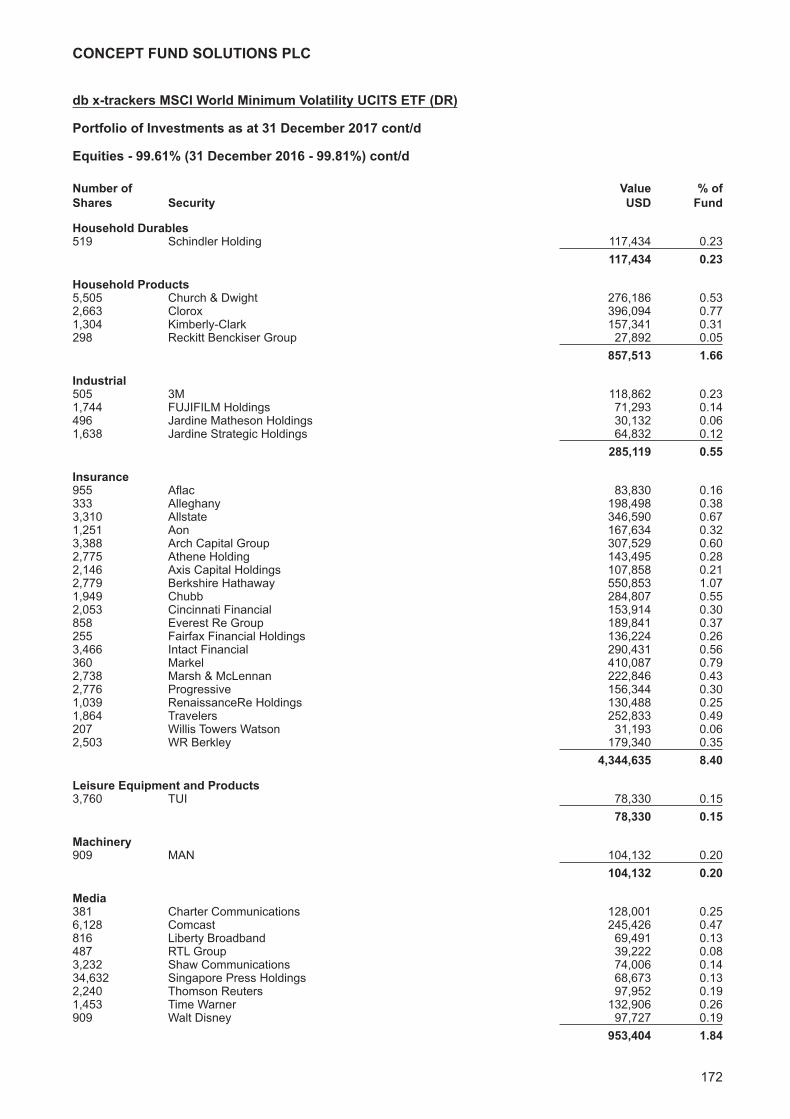
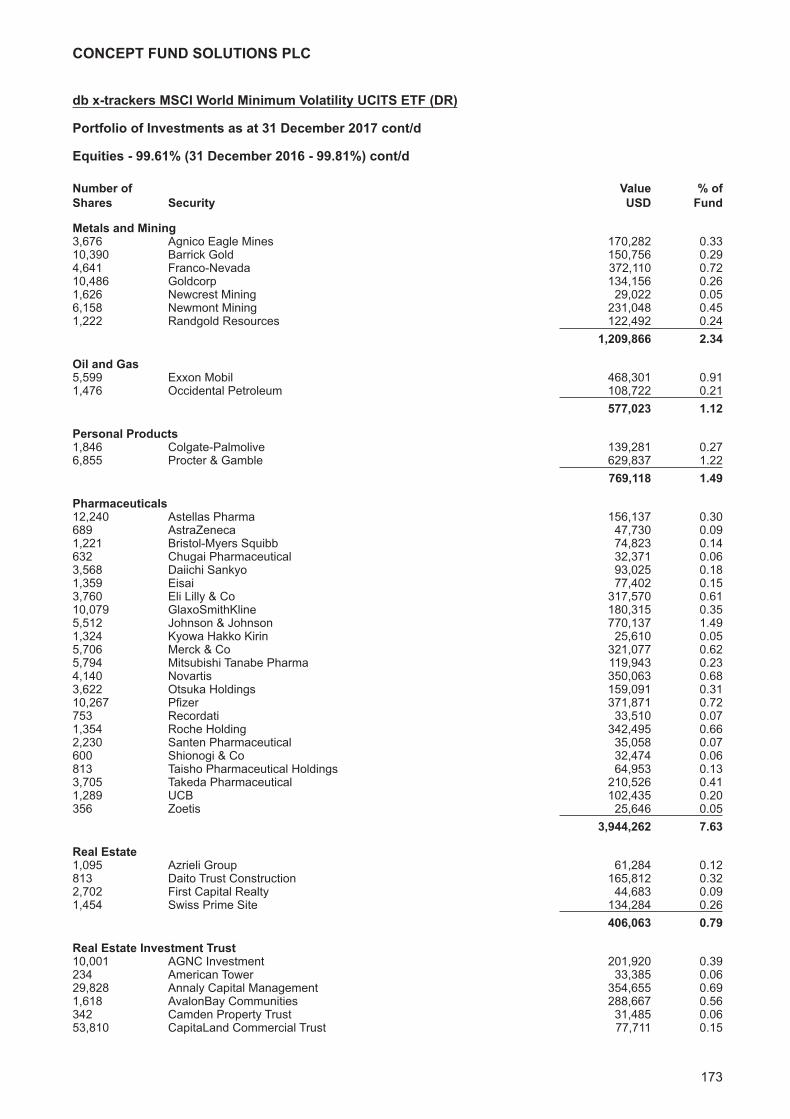
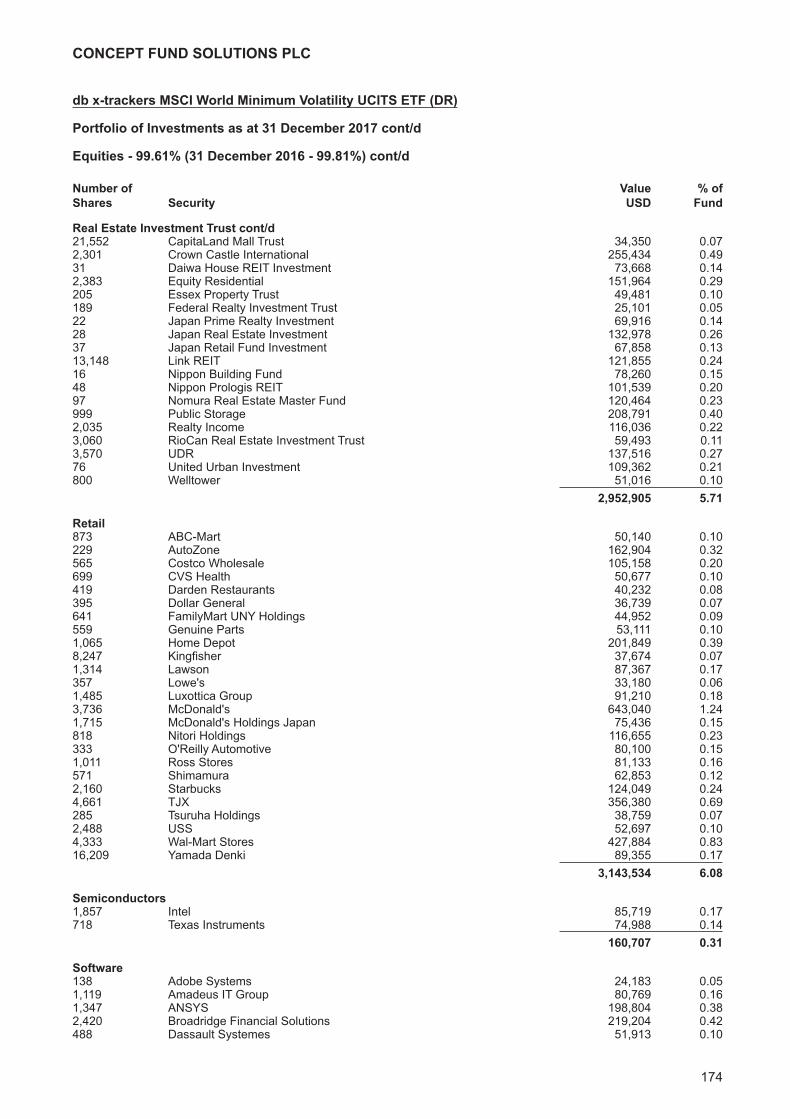
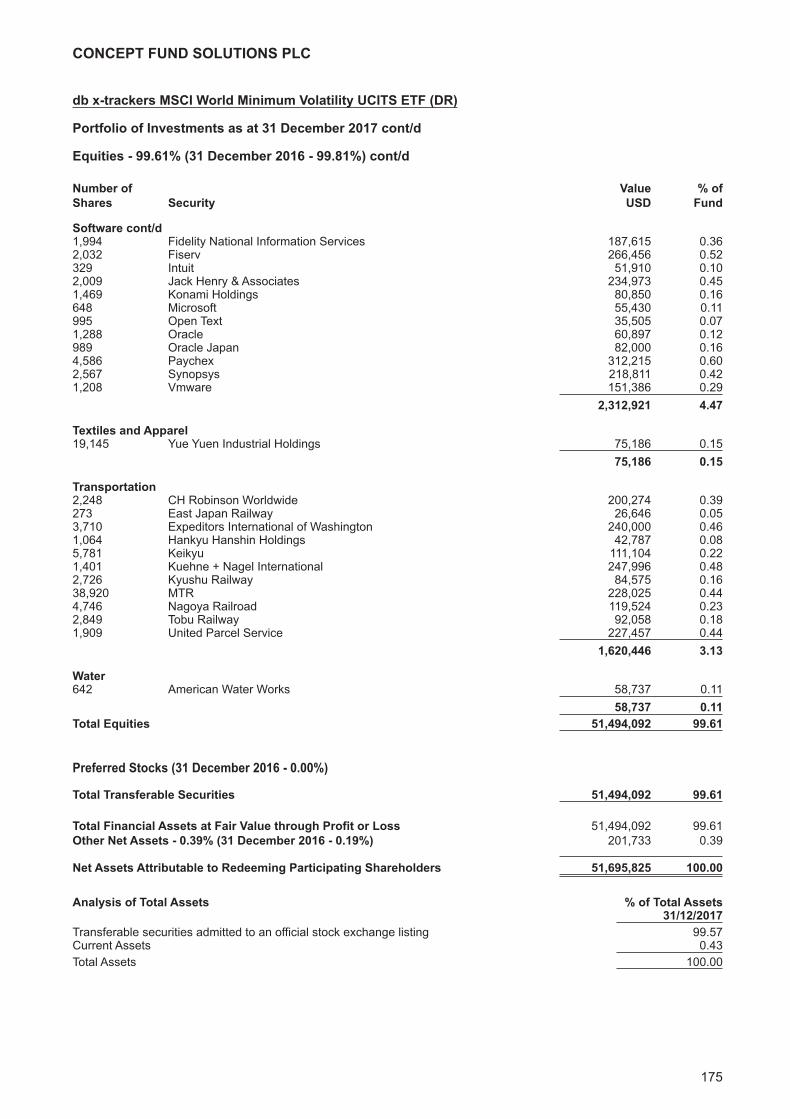
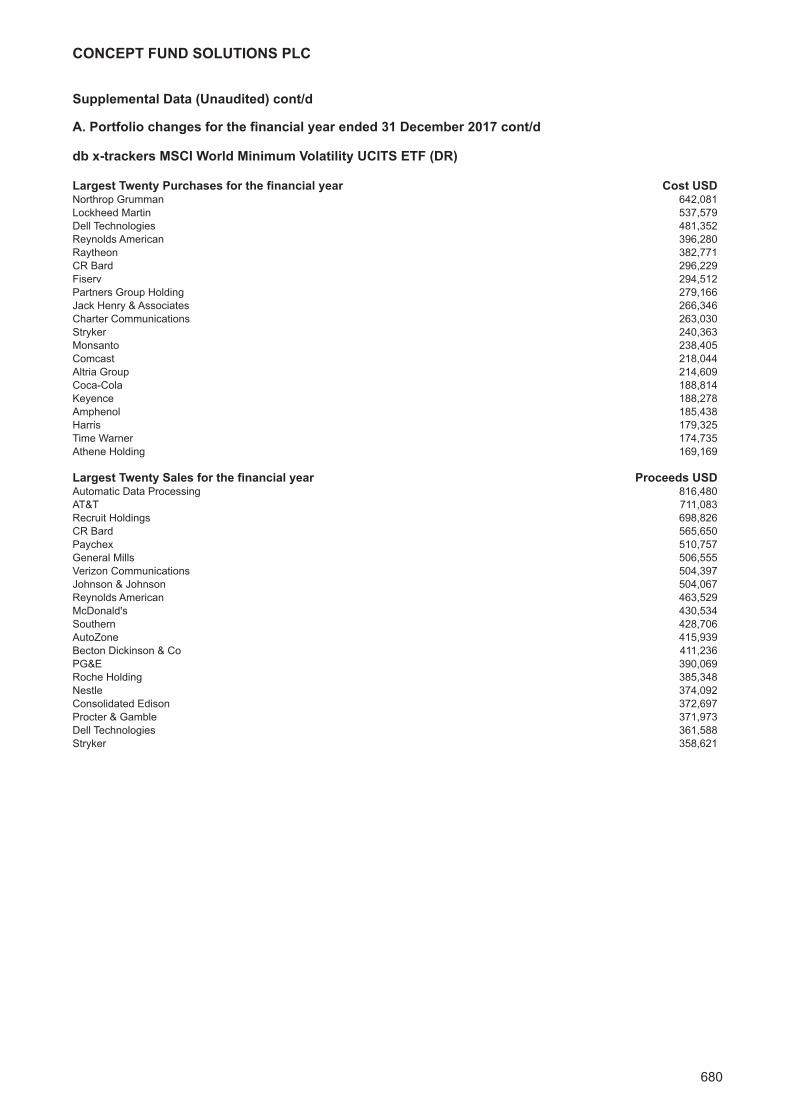
db x-trackers MSCI World Minimum Volatility UCITS ETF (DR)Investment Manager’s Report 167Portfolio of Investments 168
CONCEPT FUND SOLUTIONS PLC
CONTENTS CONT/DPage
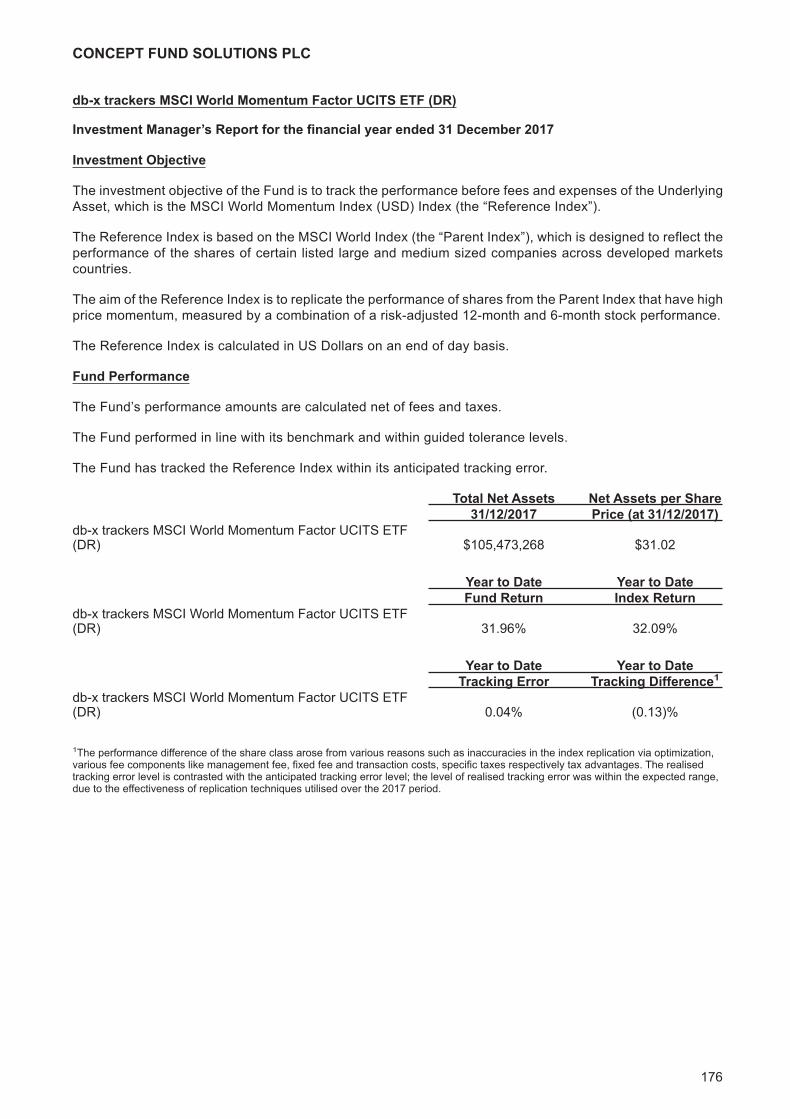
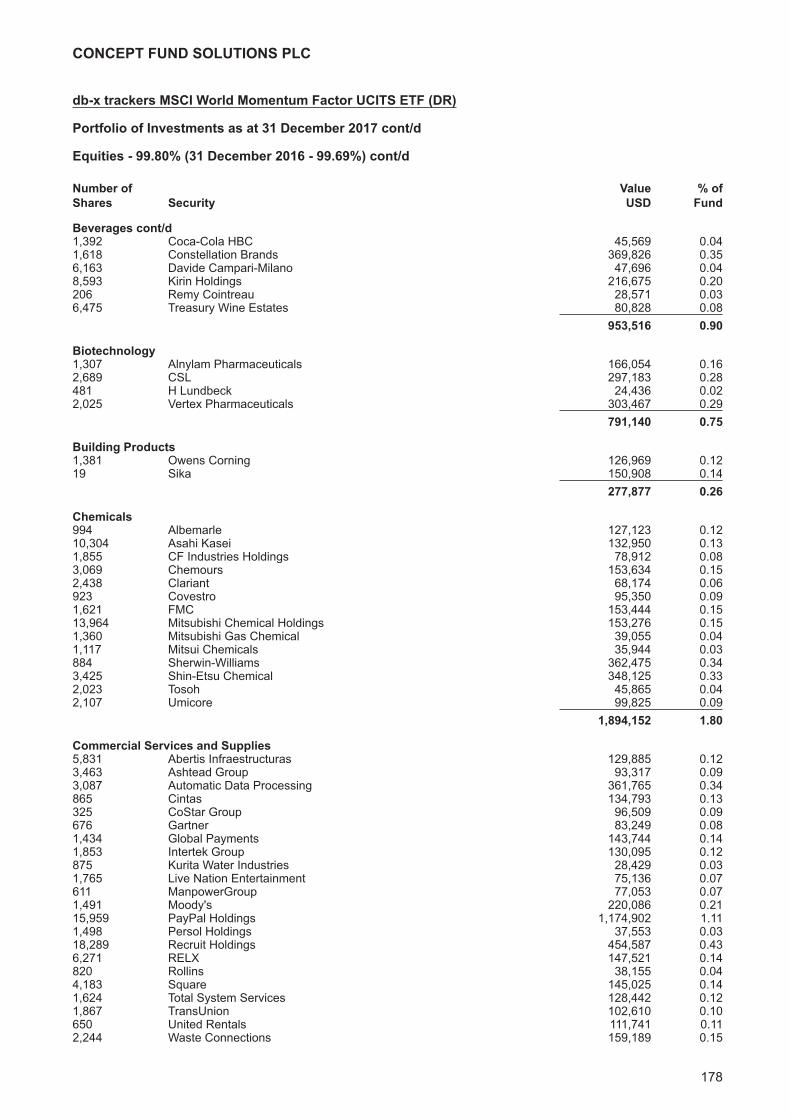
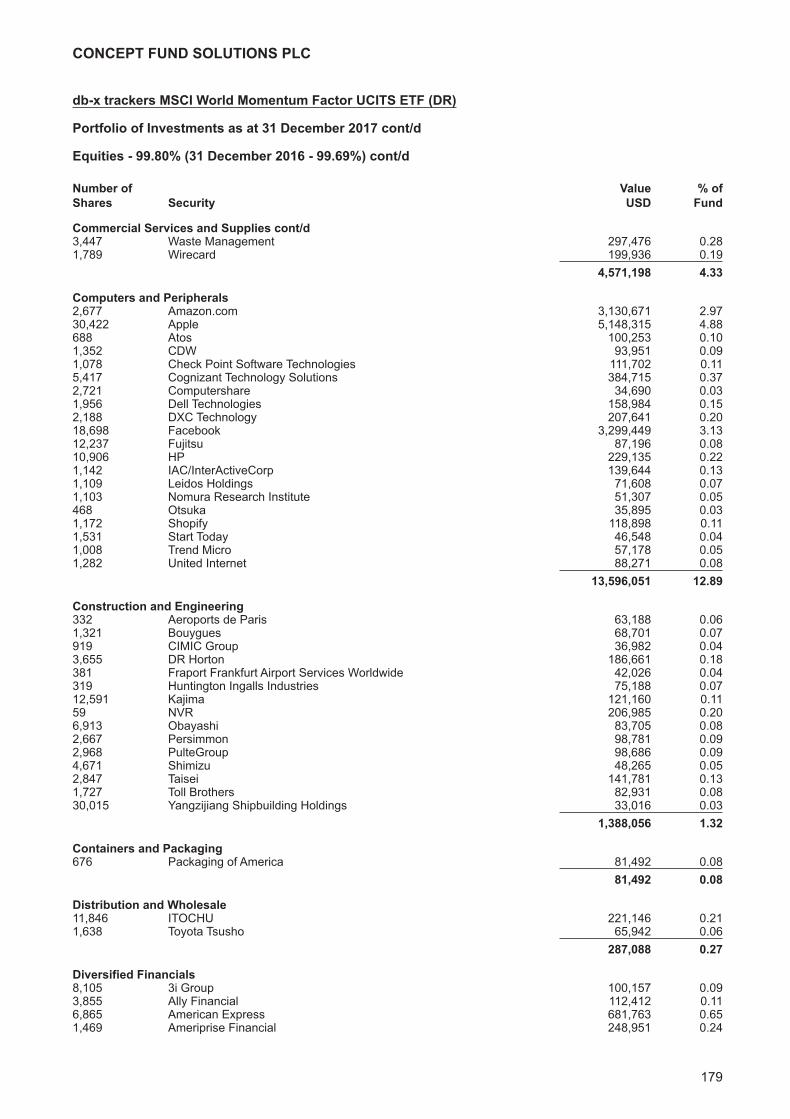
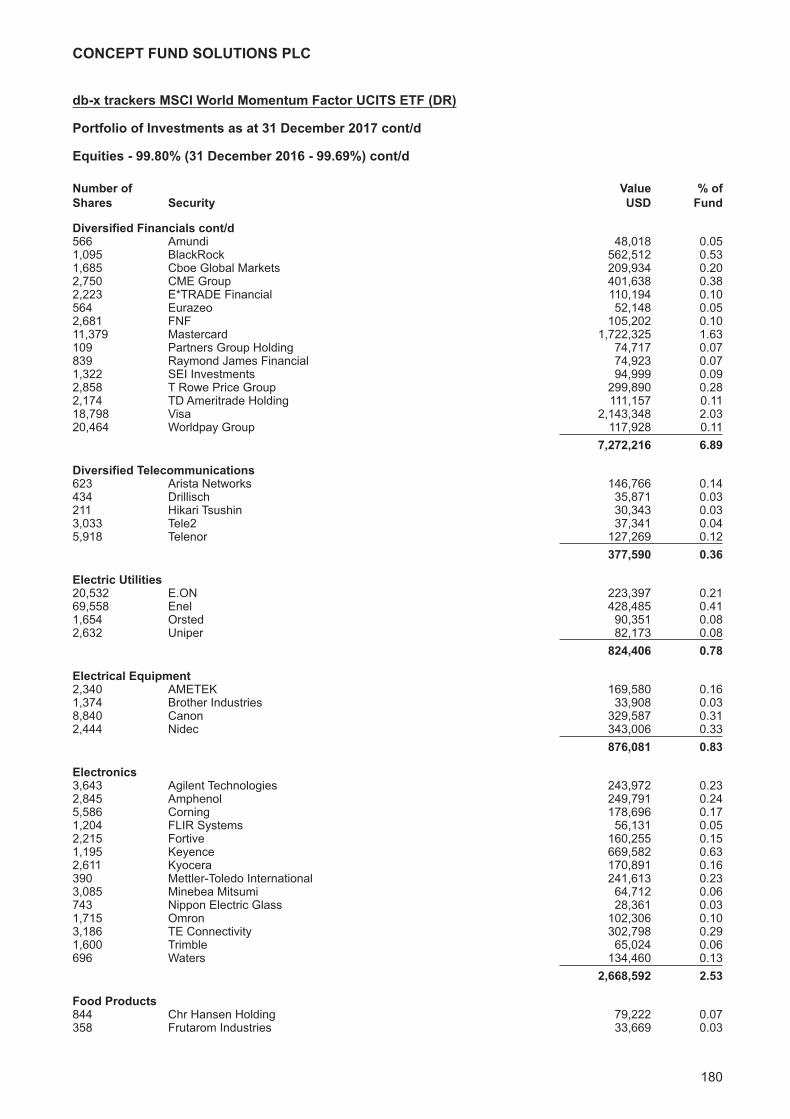
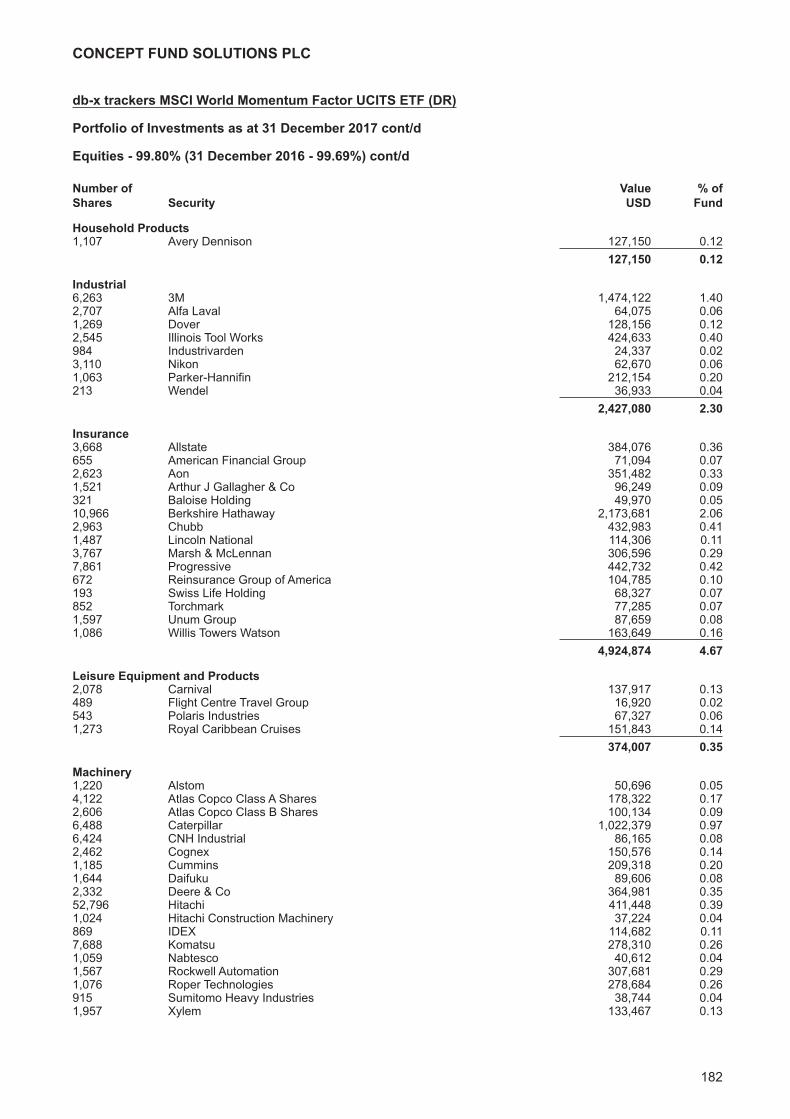
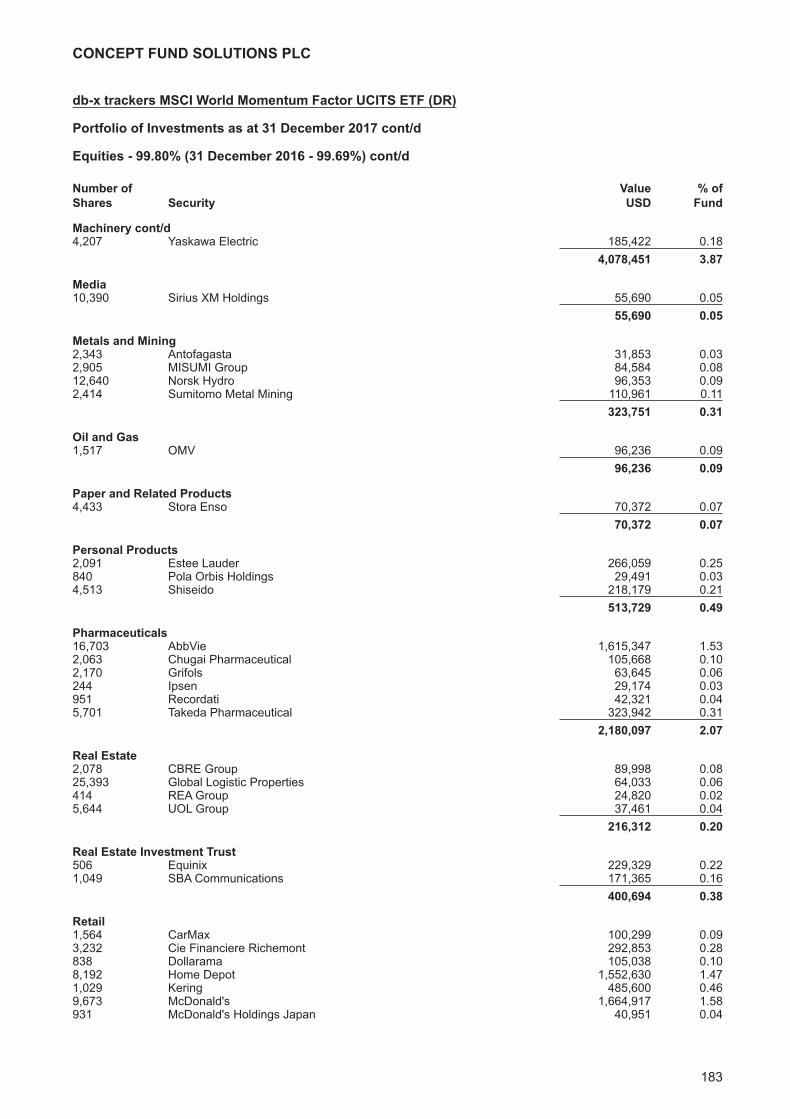
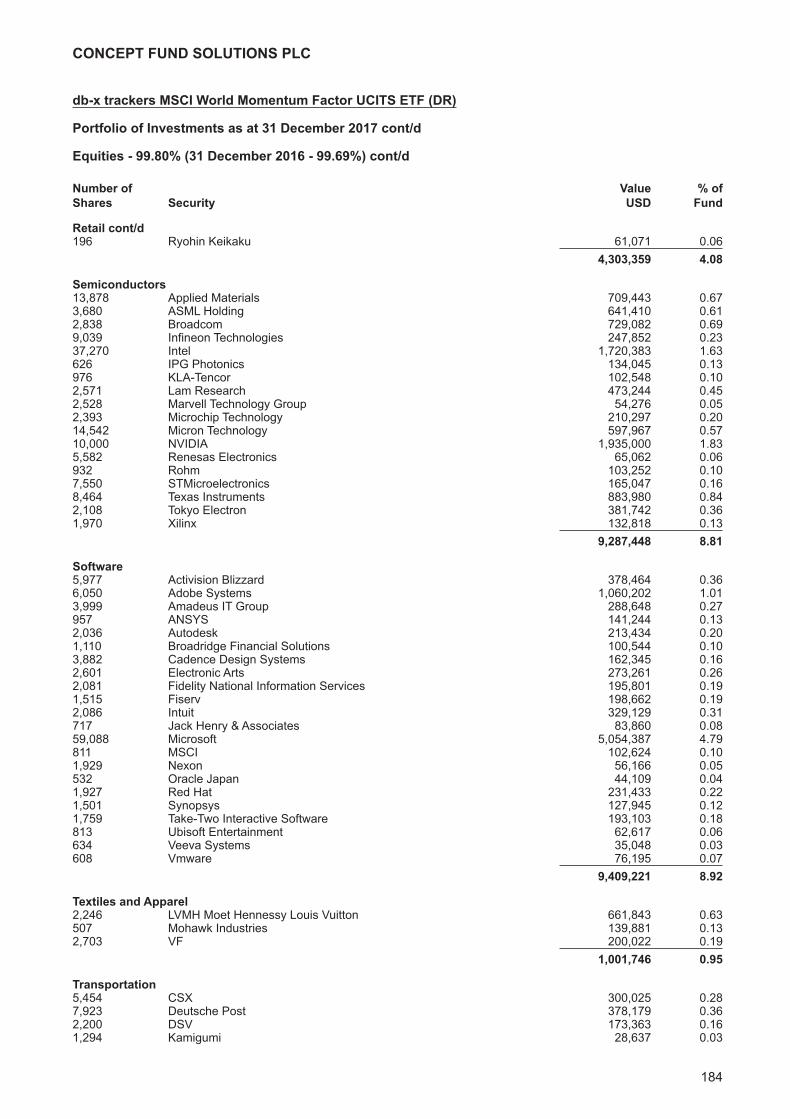
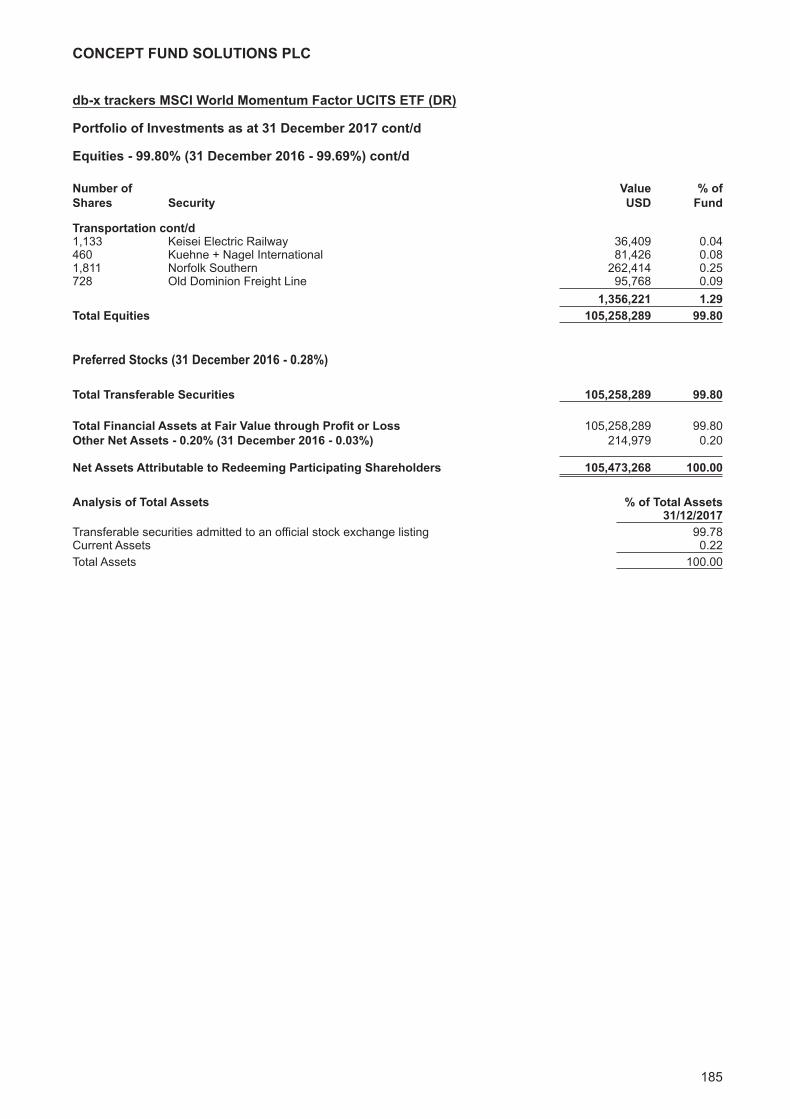
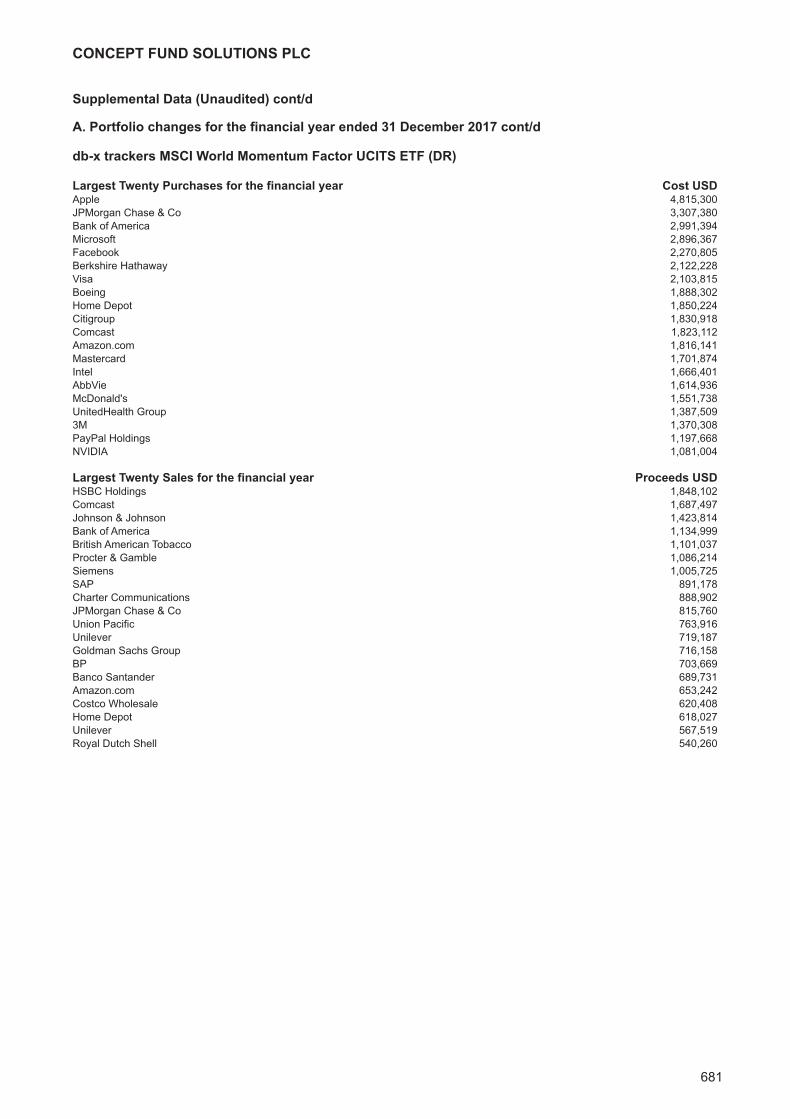
db-x trackers MSCI World Momentum Factor UCITS ETF (DR)Investment Manager’s Report 176Portfolio of Investments 177
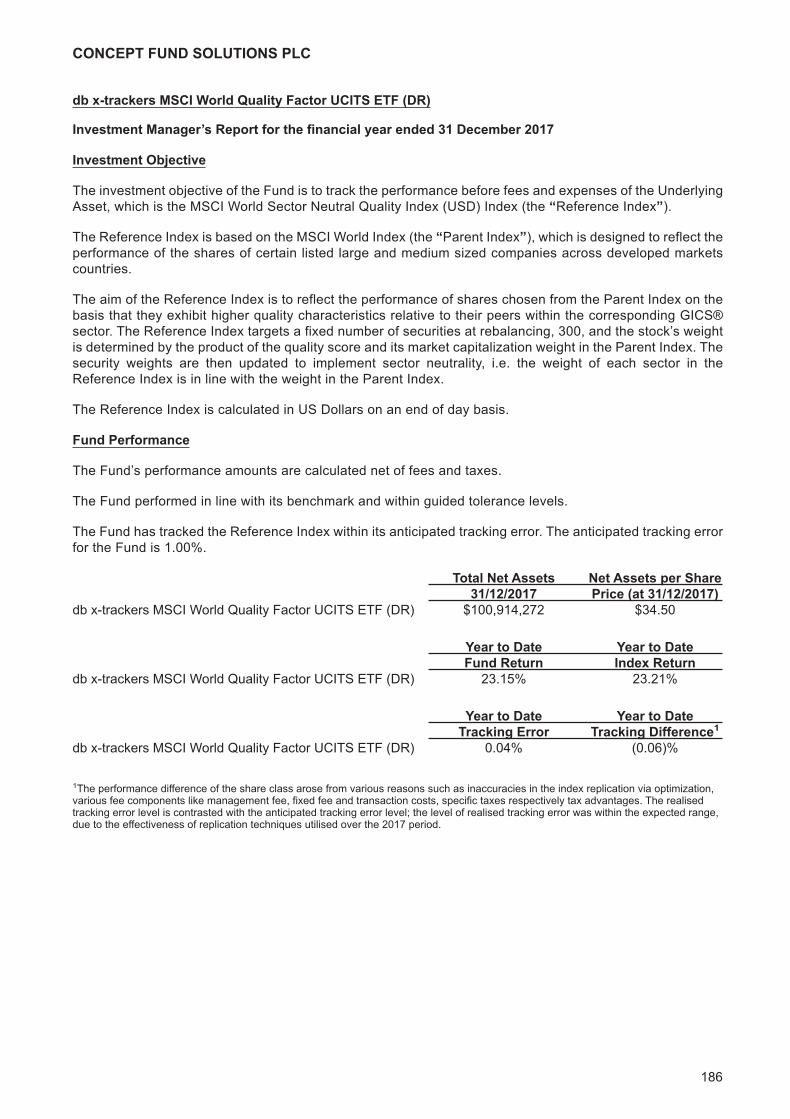
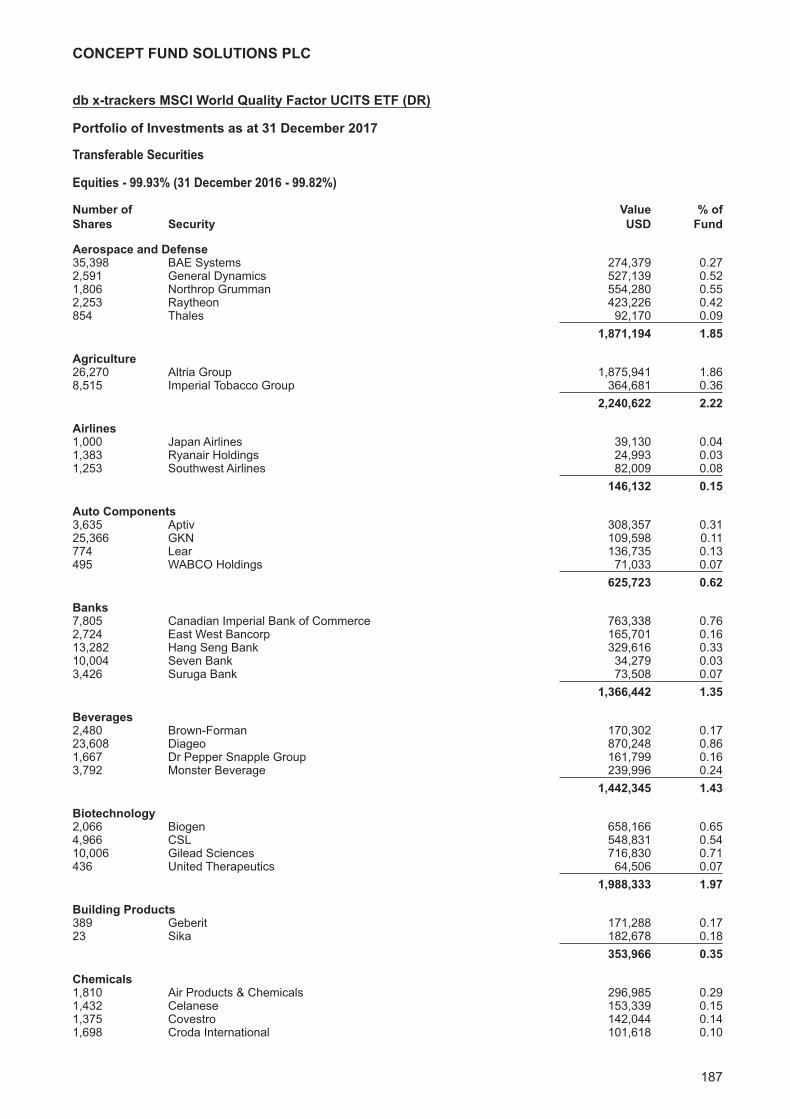
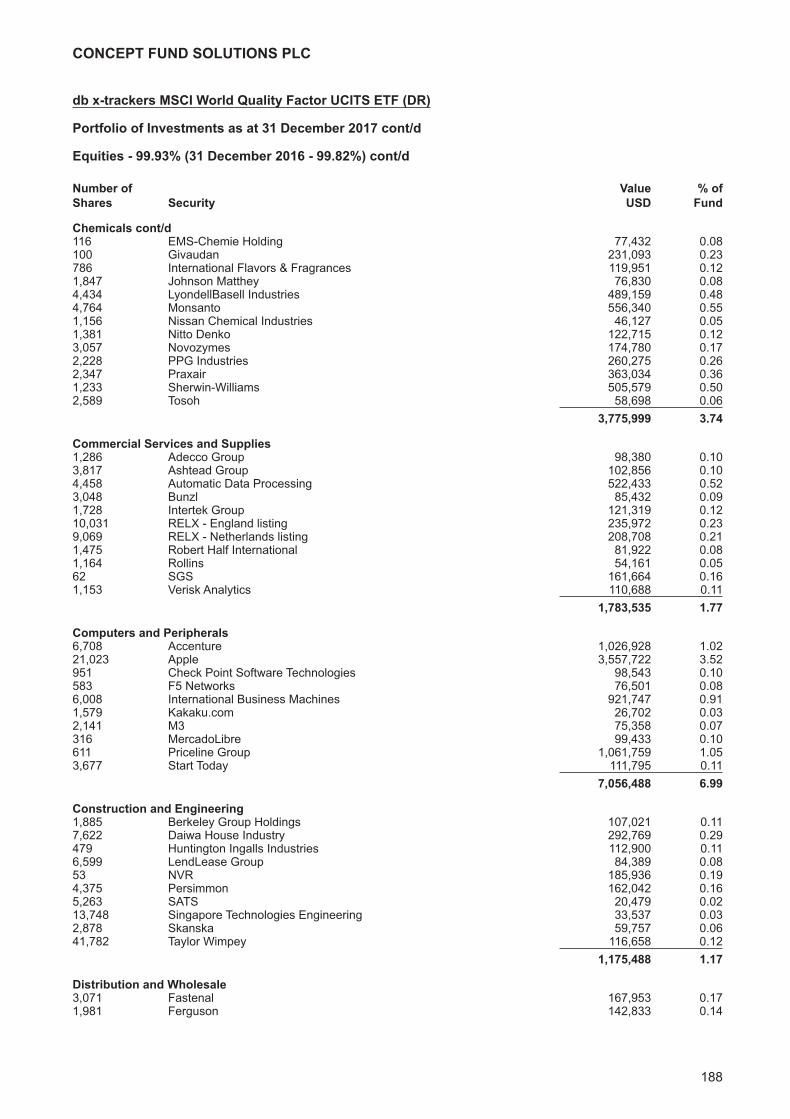
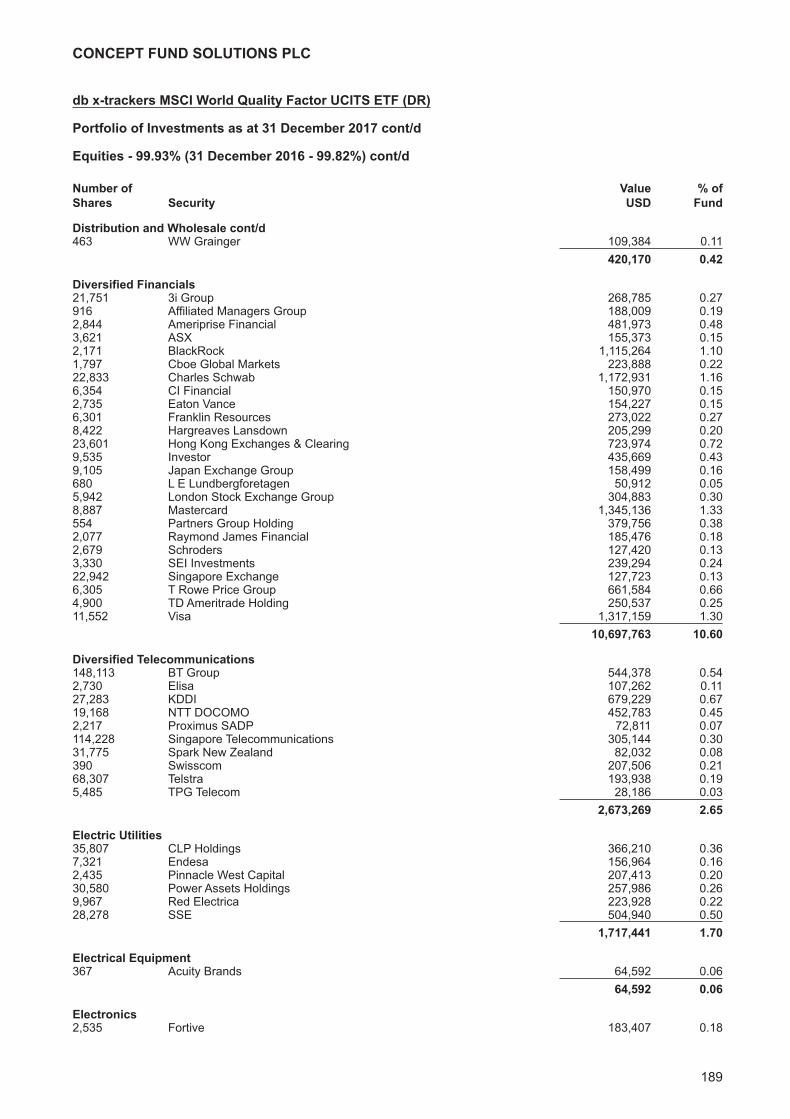
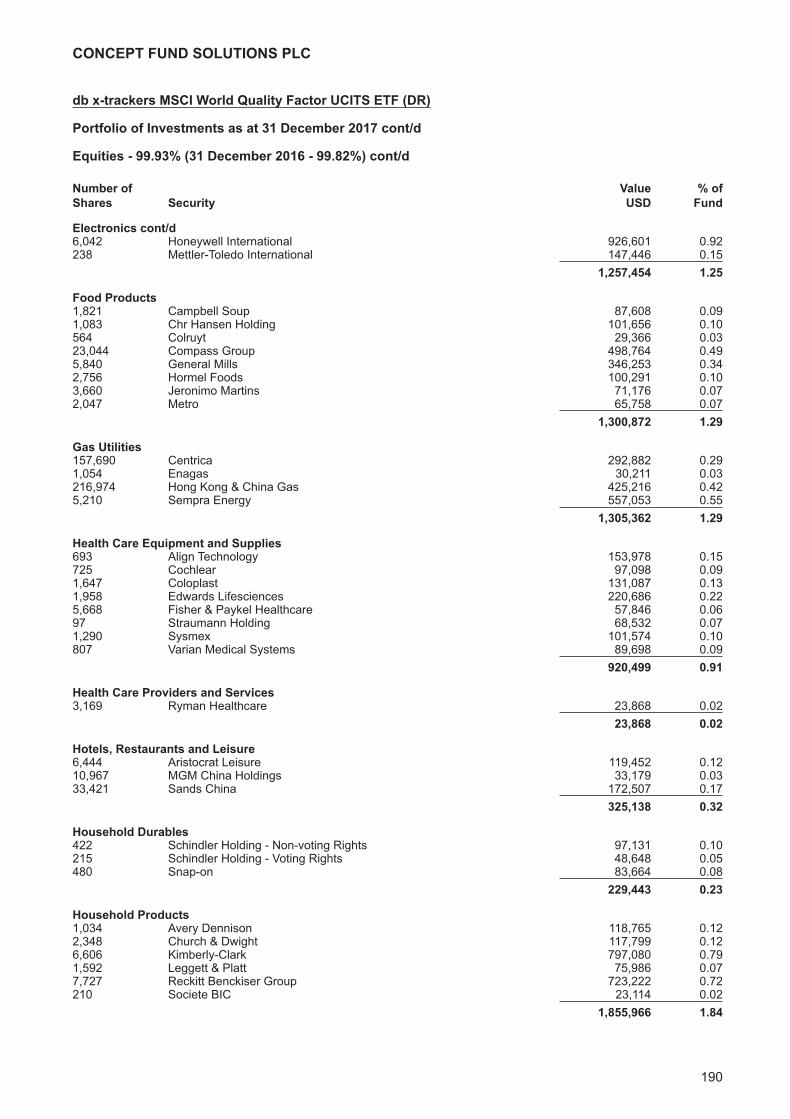
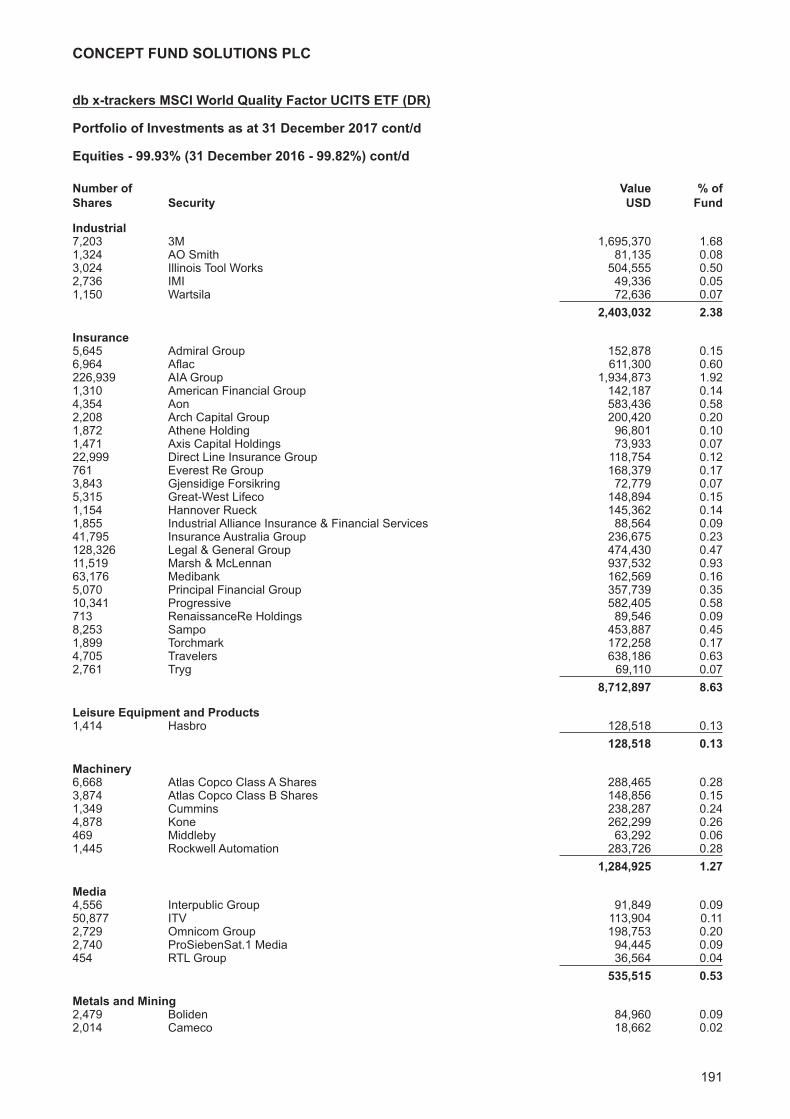
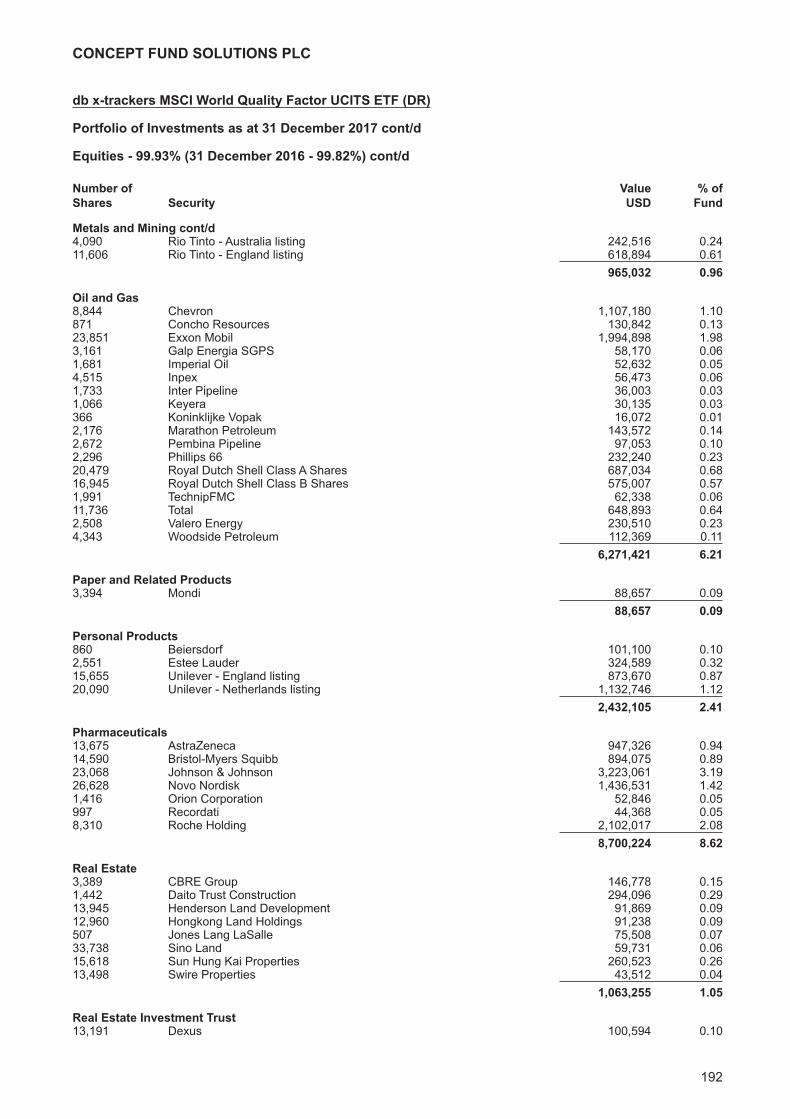
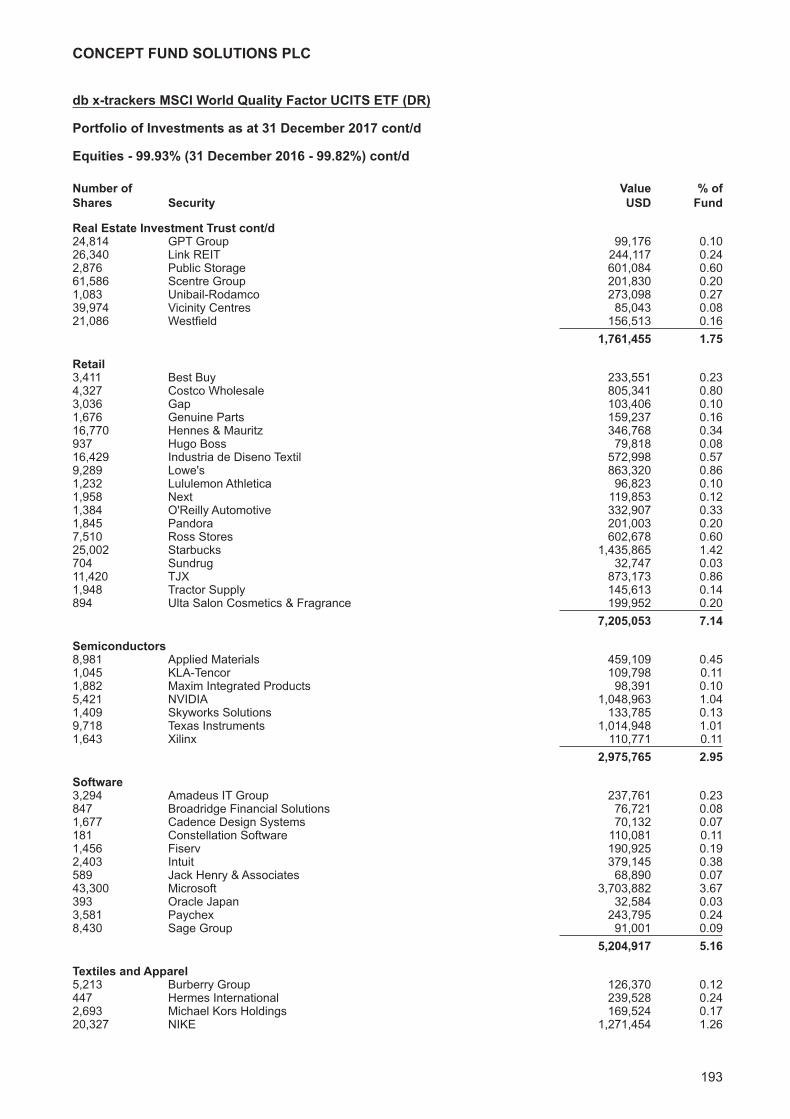
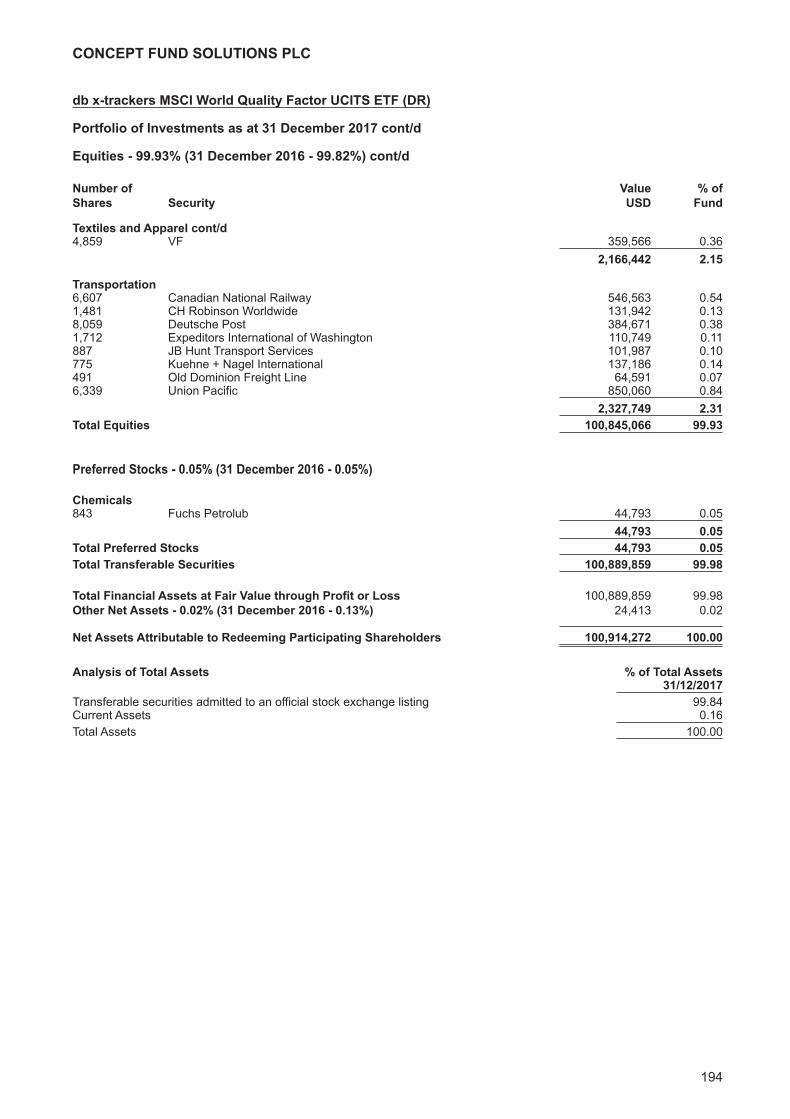
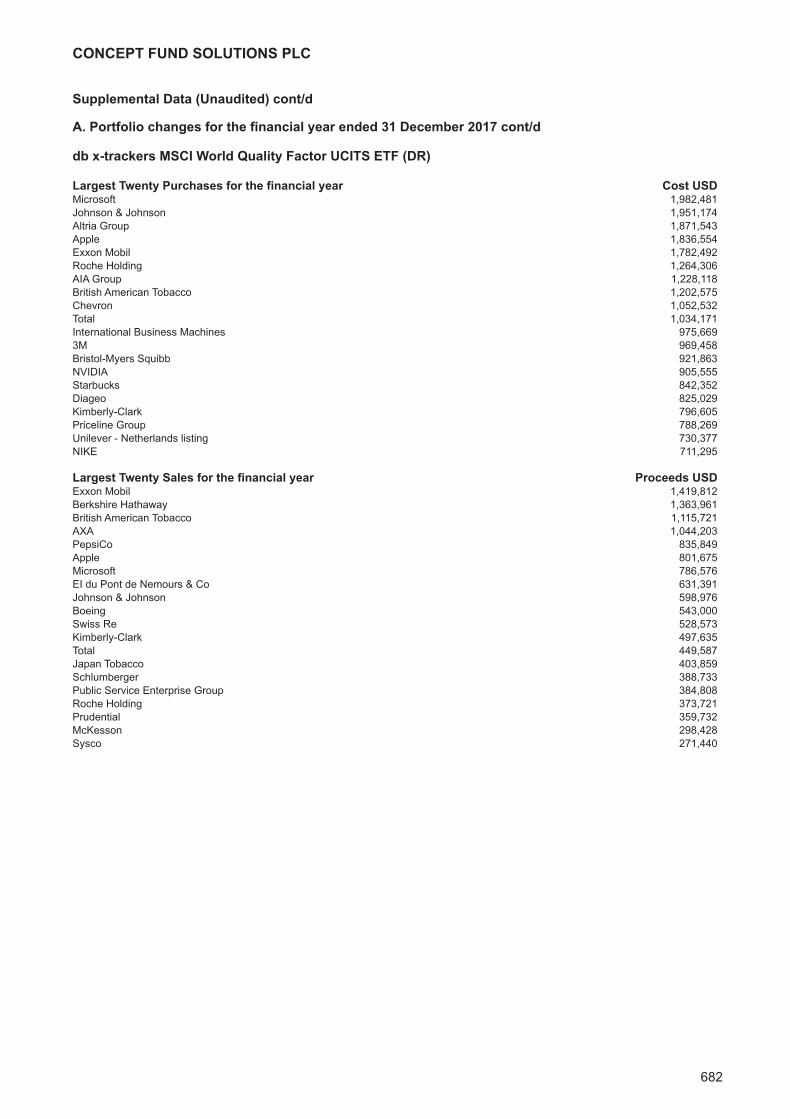
db x-trackers MSCI World Quality Factor UCITS ETF (DR)Investment Manager’s Report 186Portfolio of Investments 187
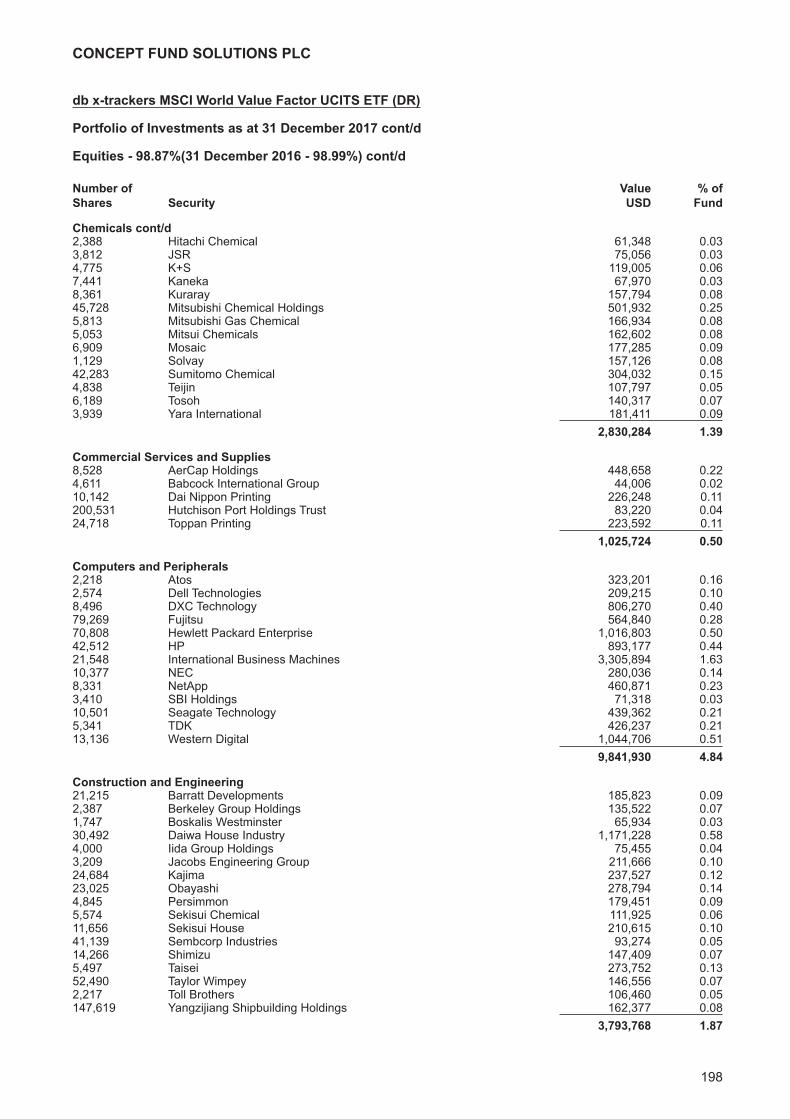
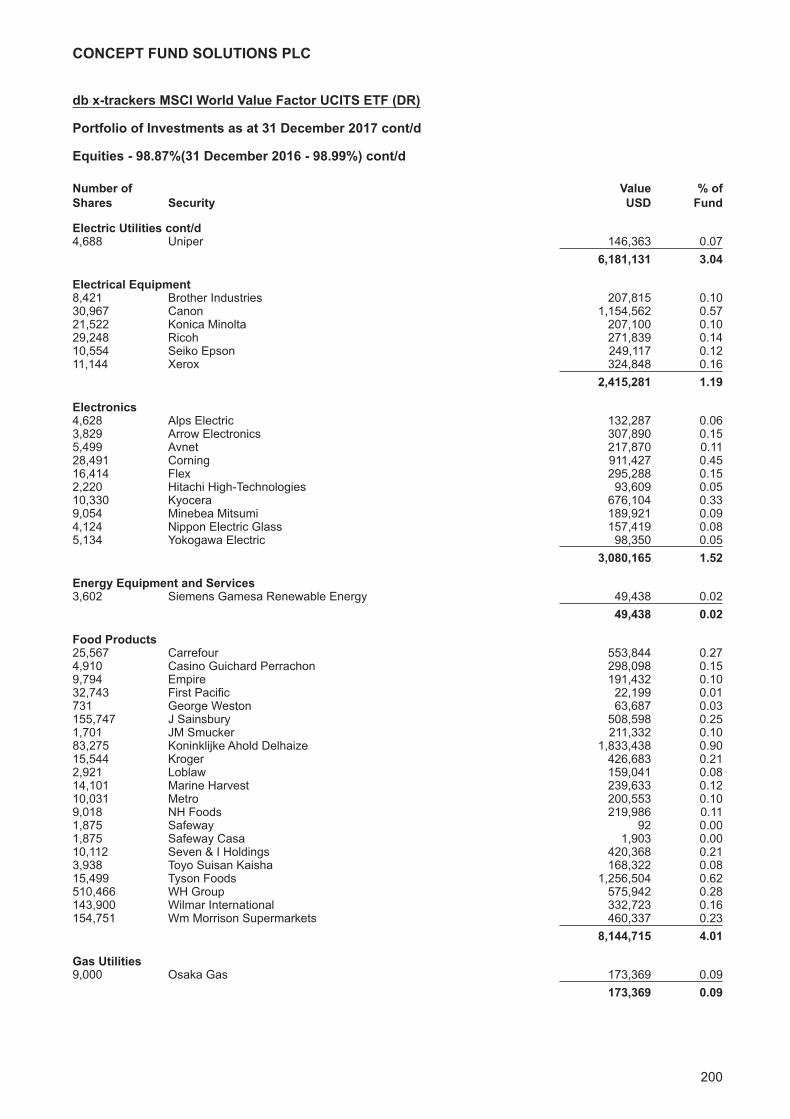
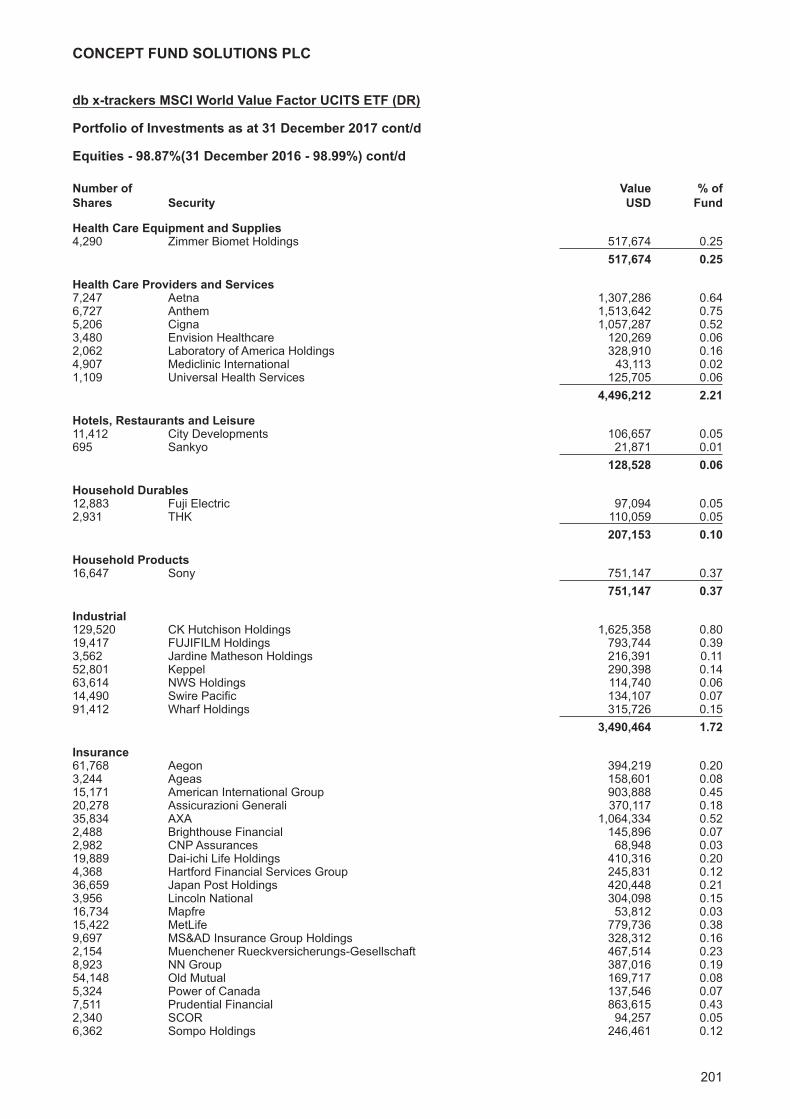
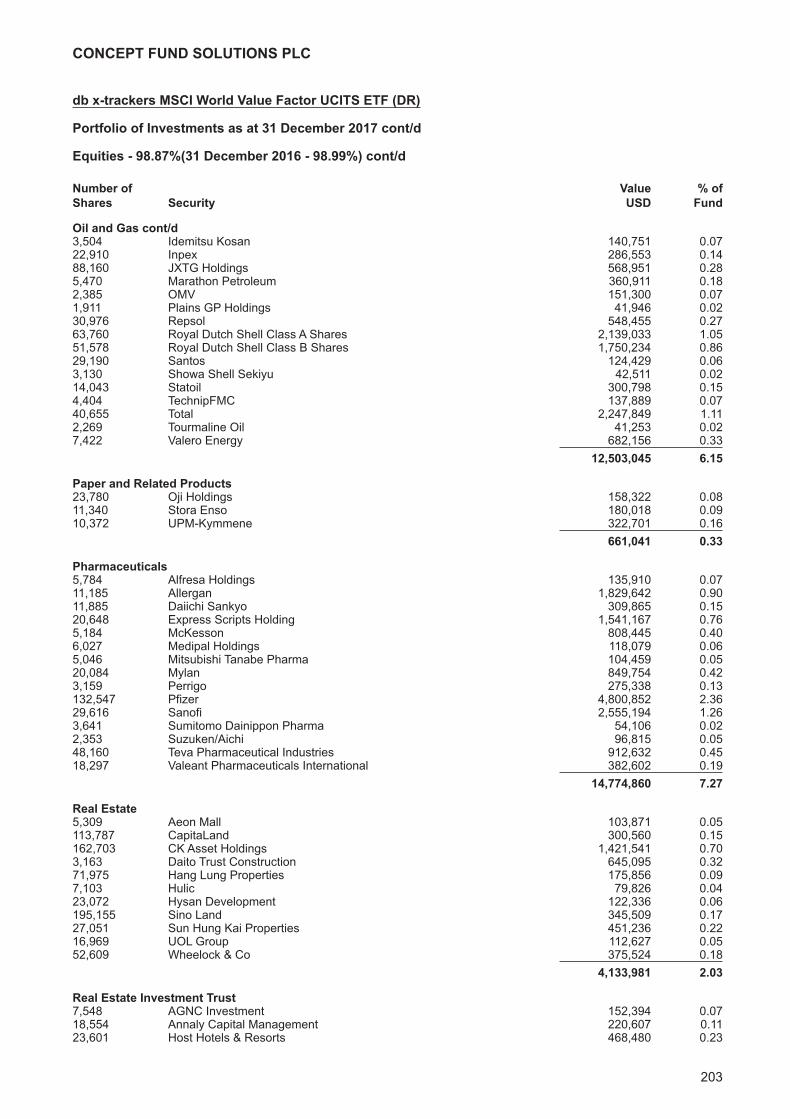
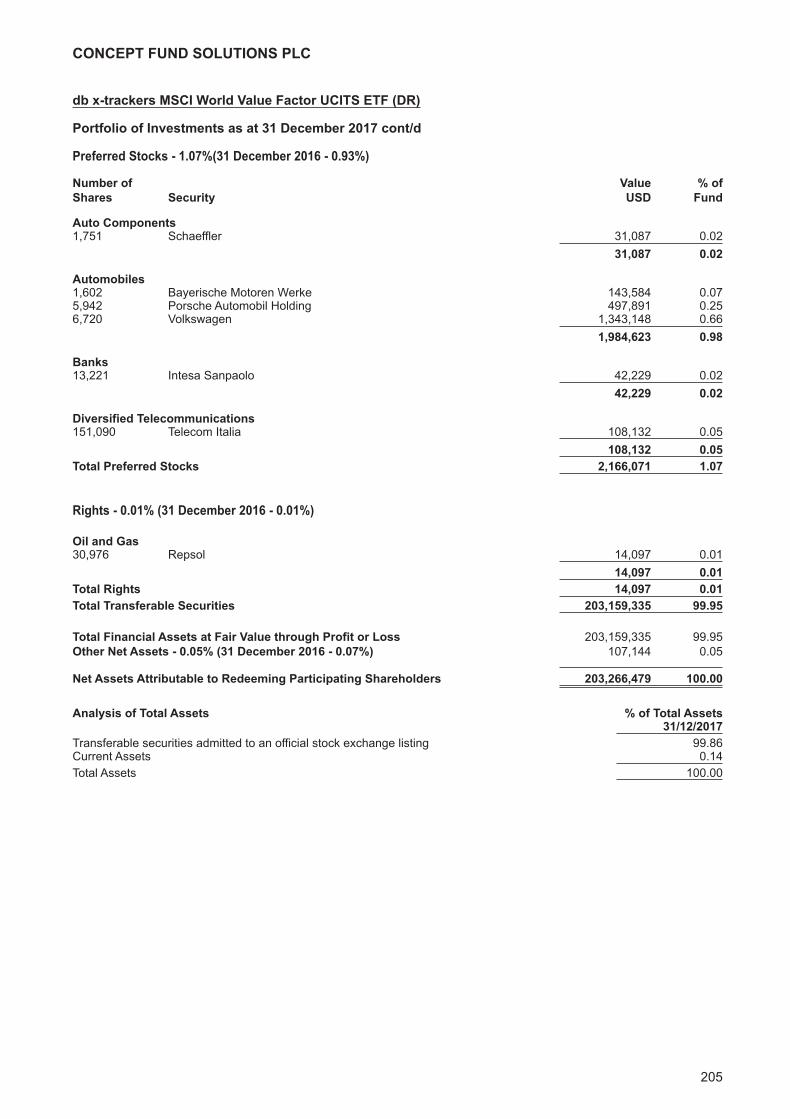
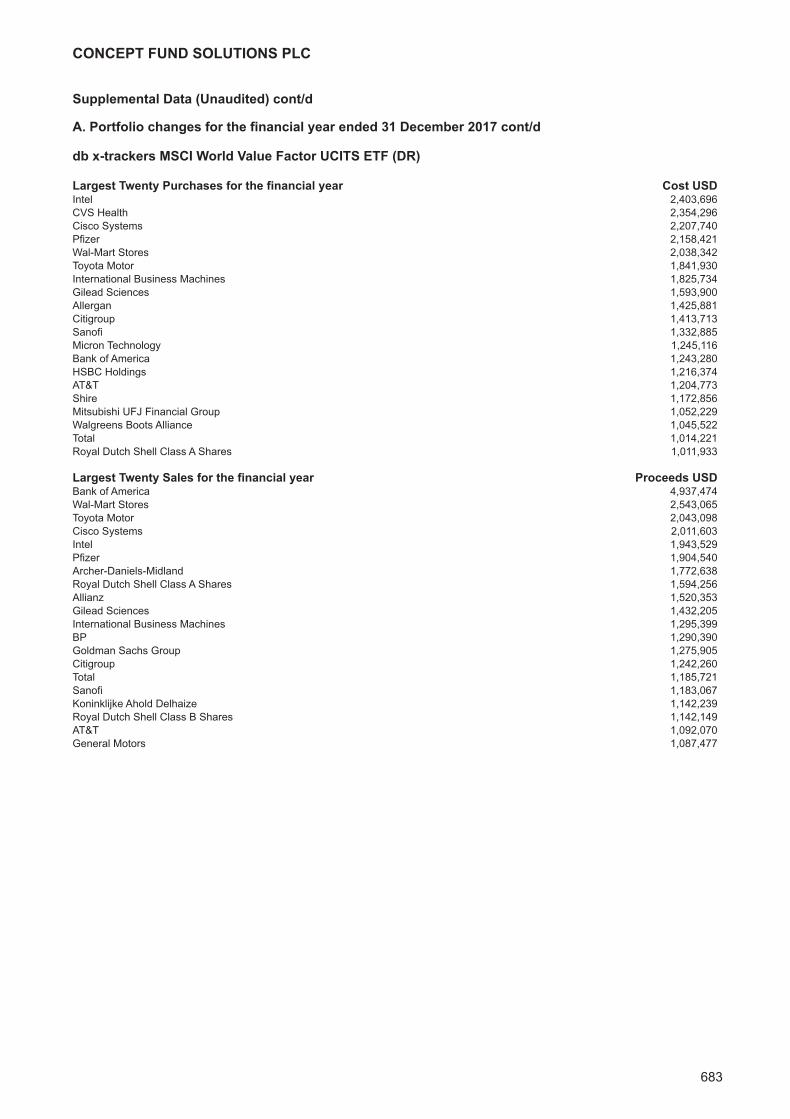
db x-trackers MSCI World Value Factor UCITS ETF (DR)Investment Manager’s Report 195Portfolio of Investments 196
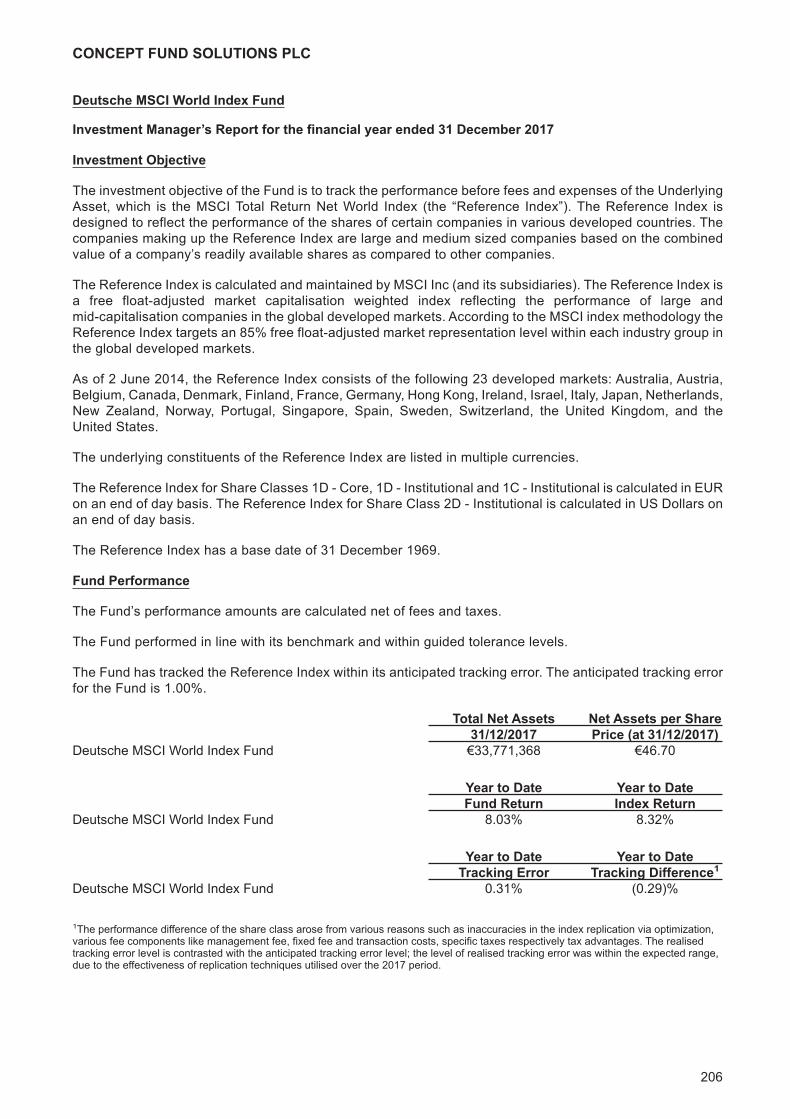
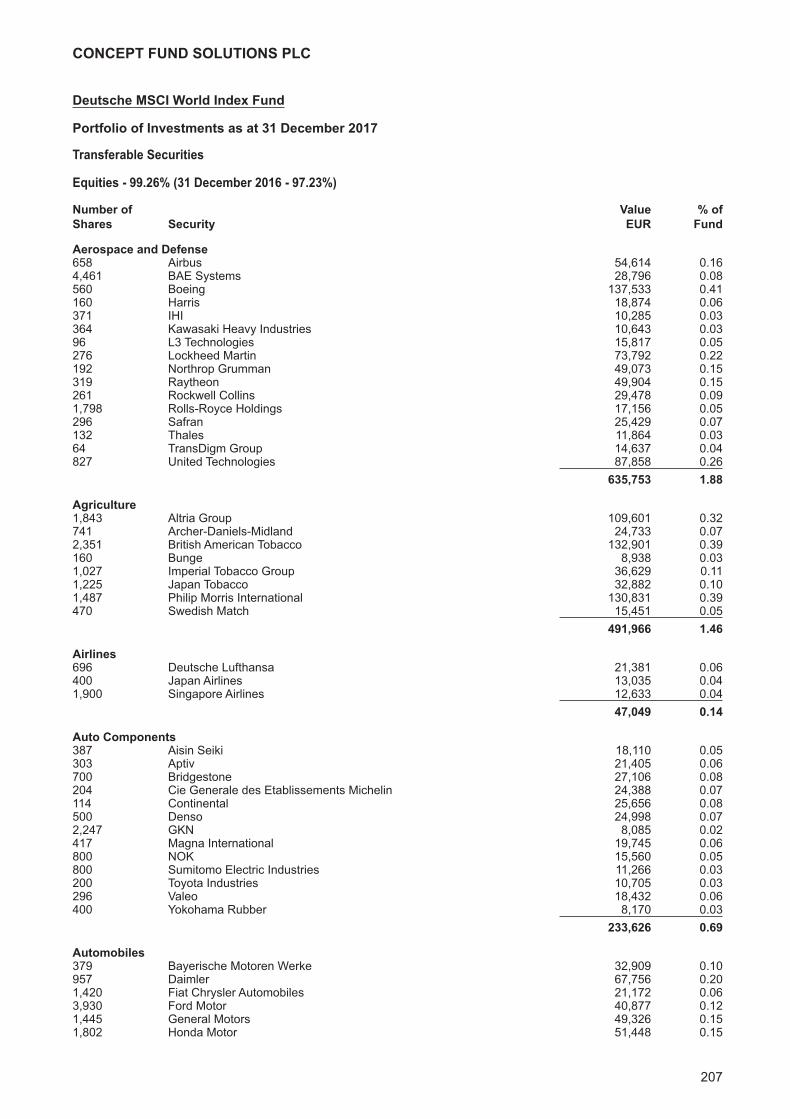
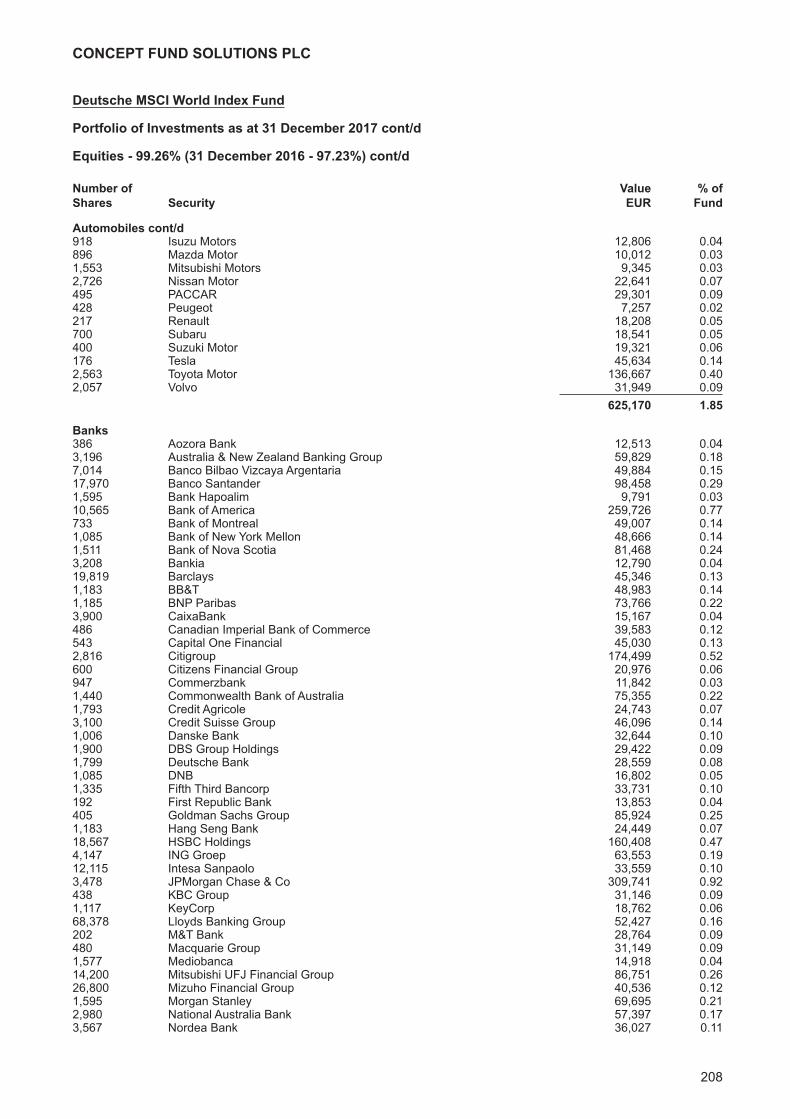
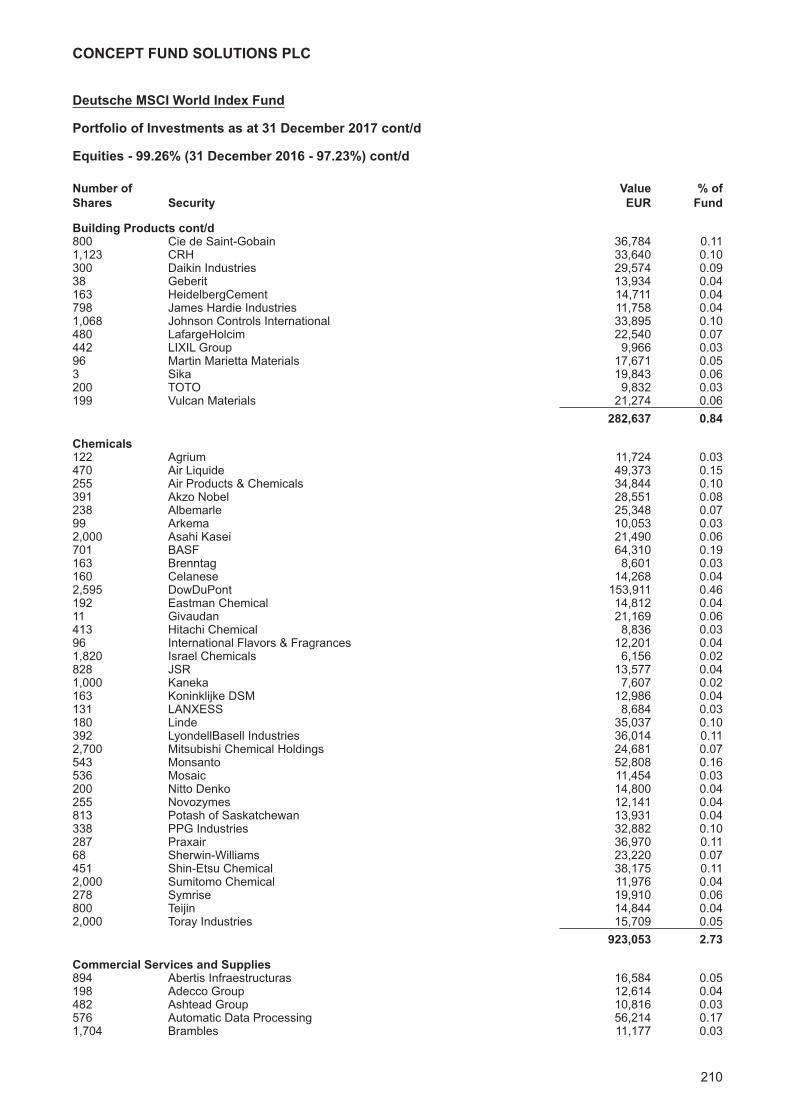
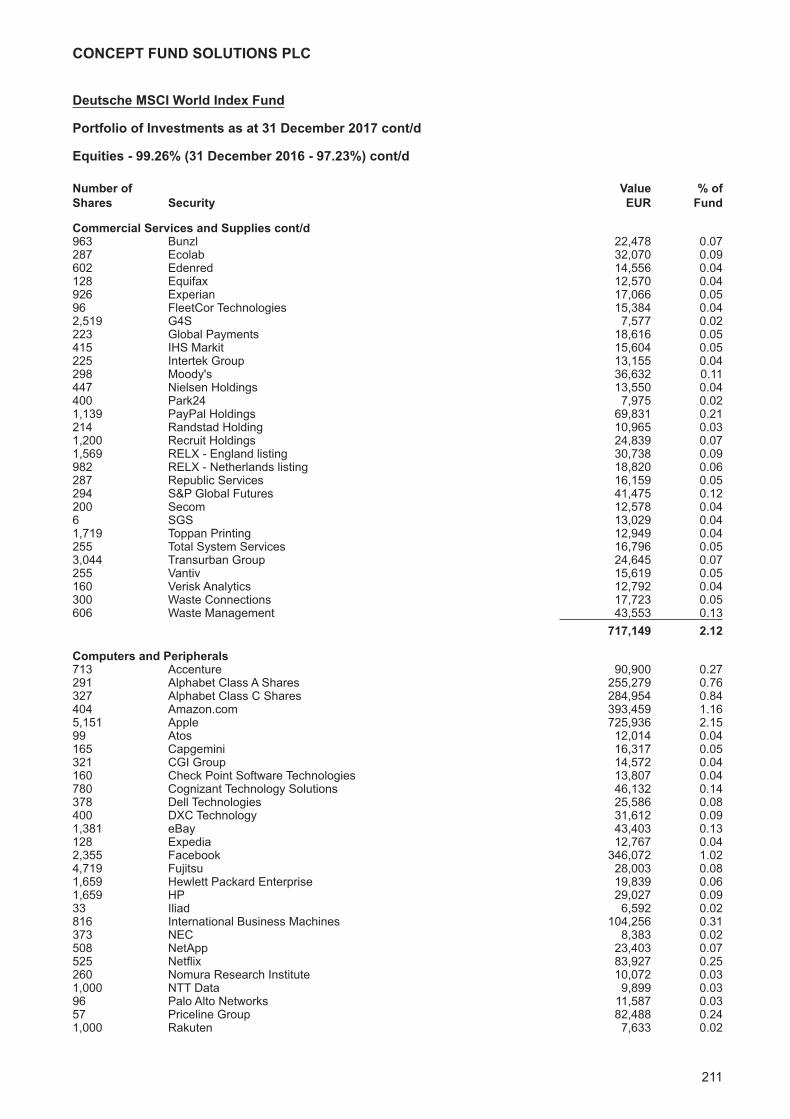
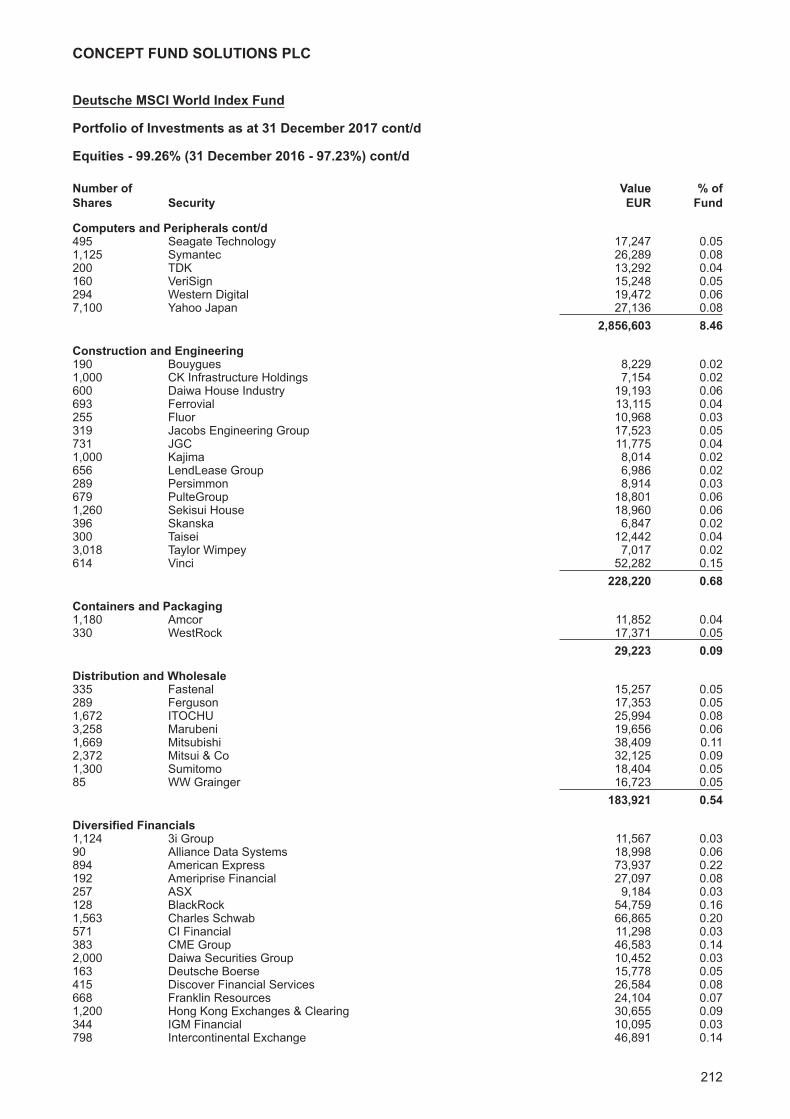
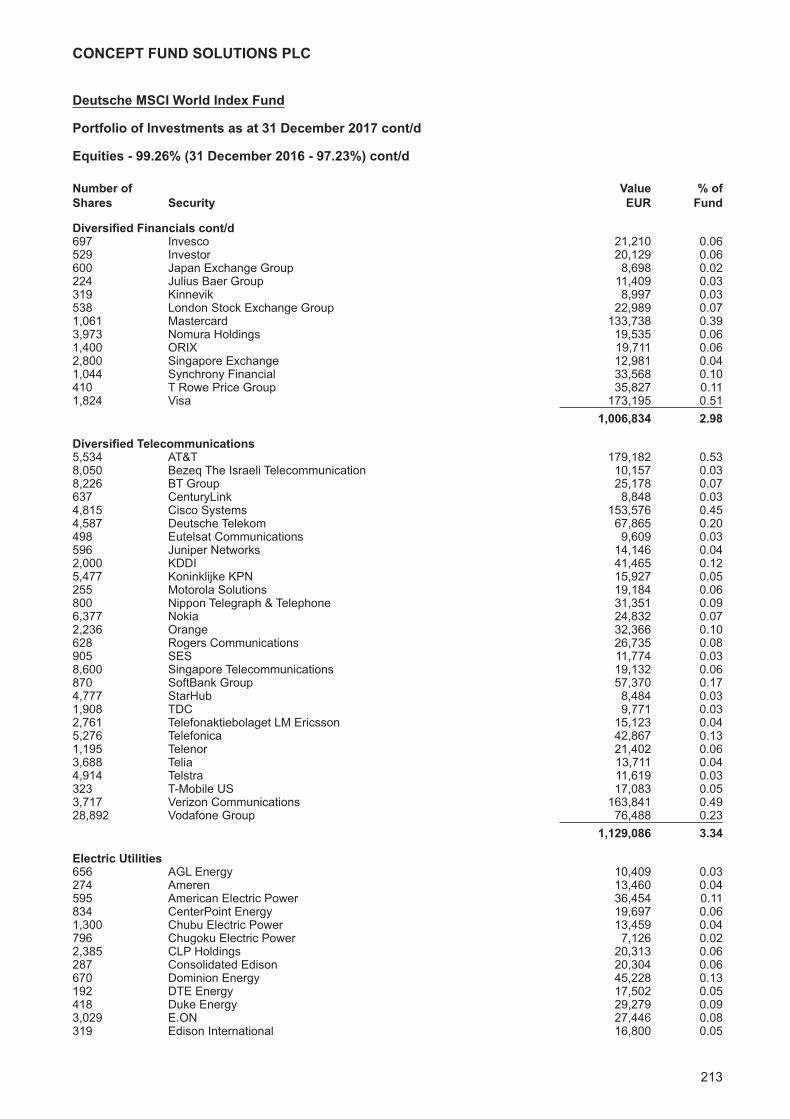
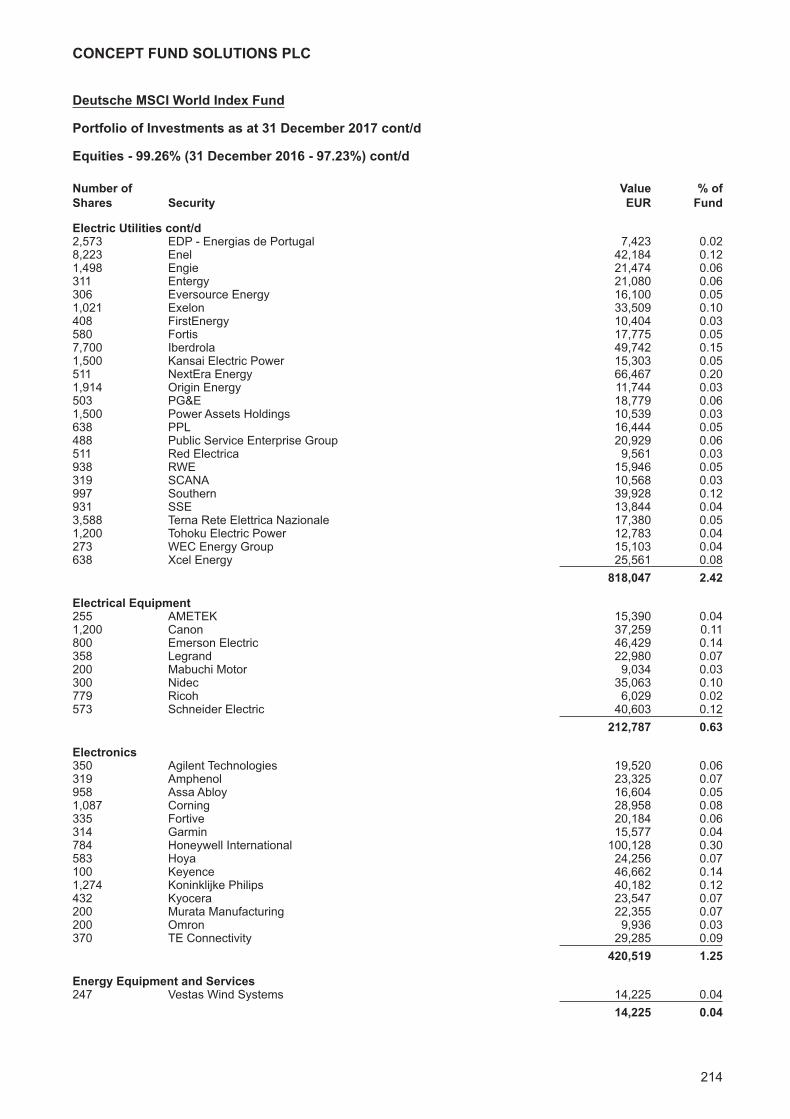
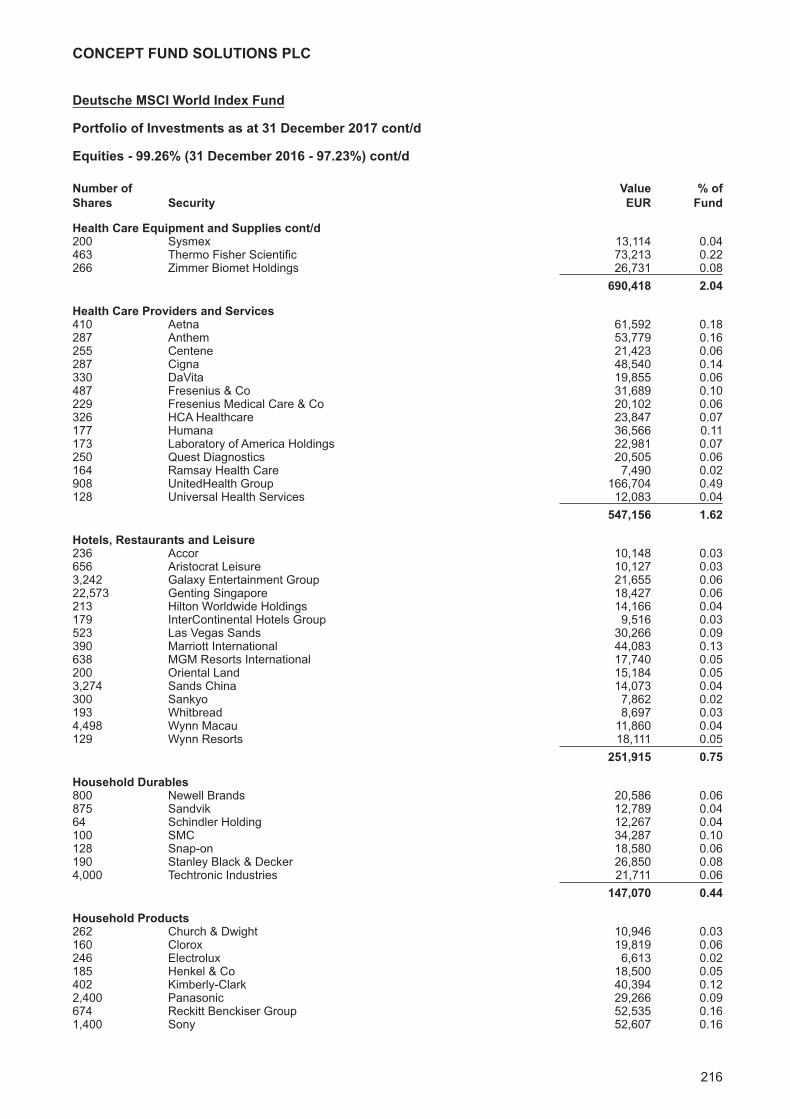
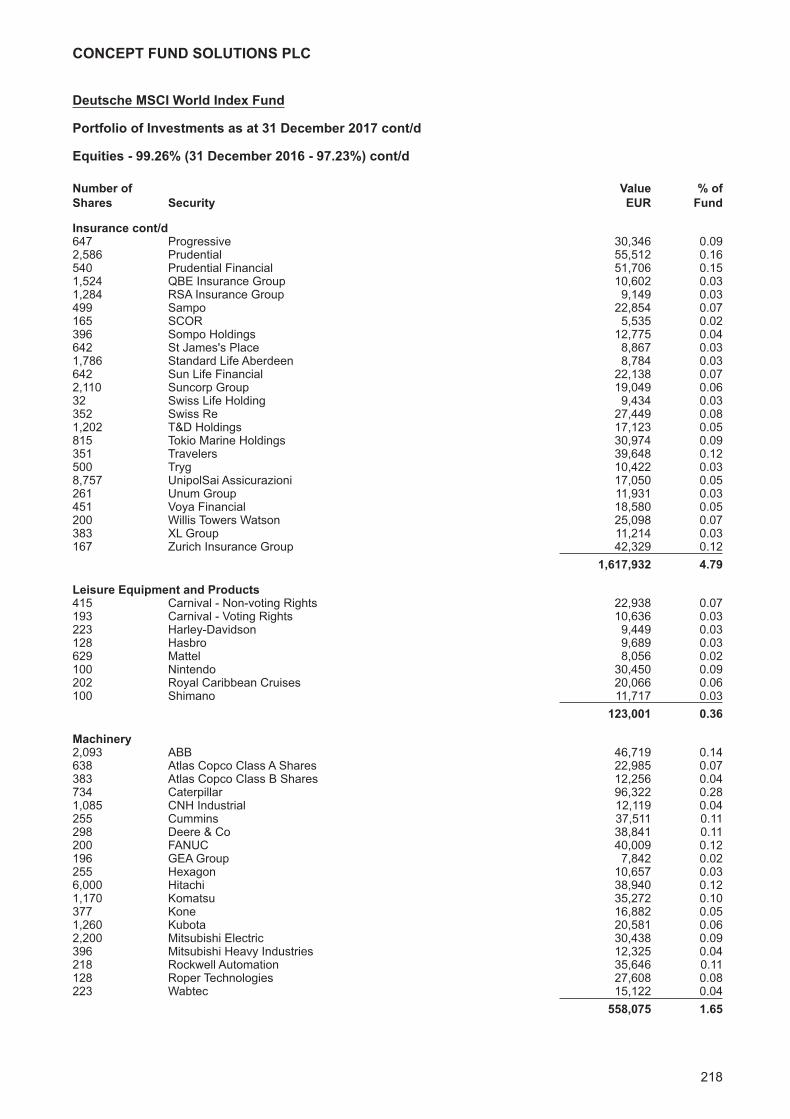
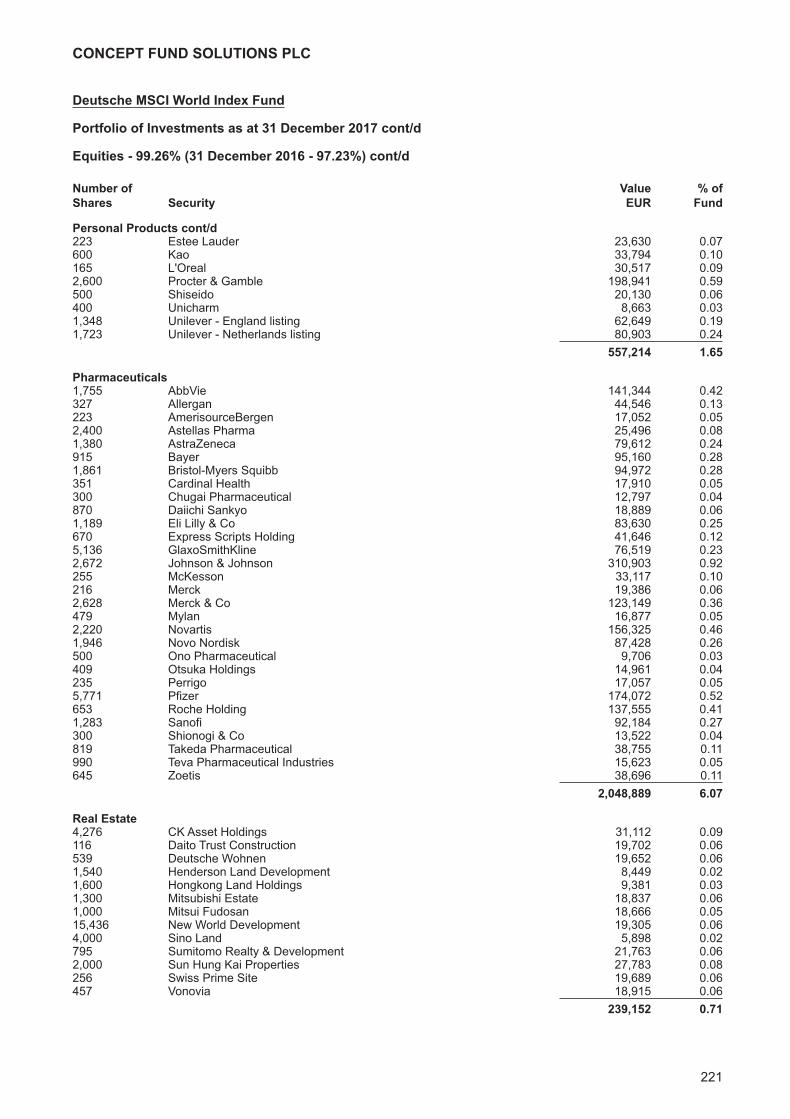
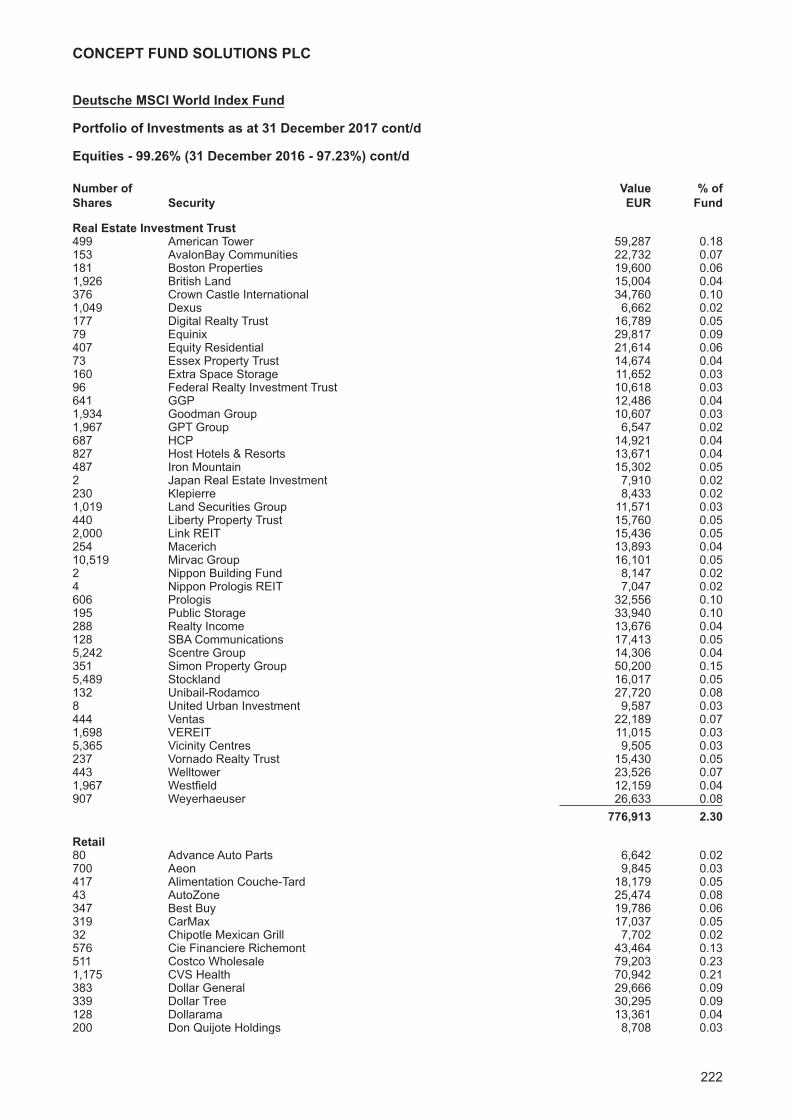
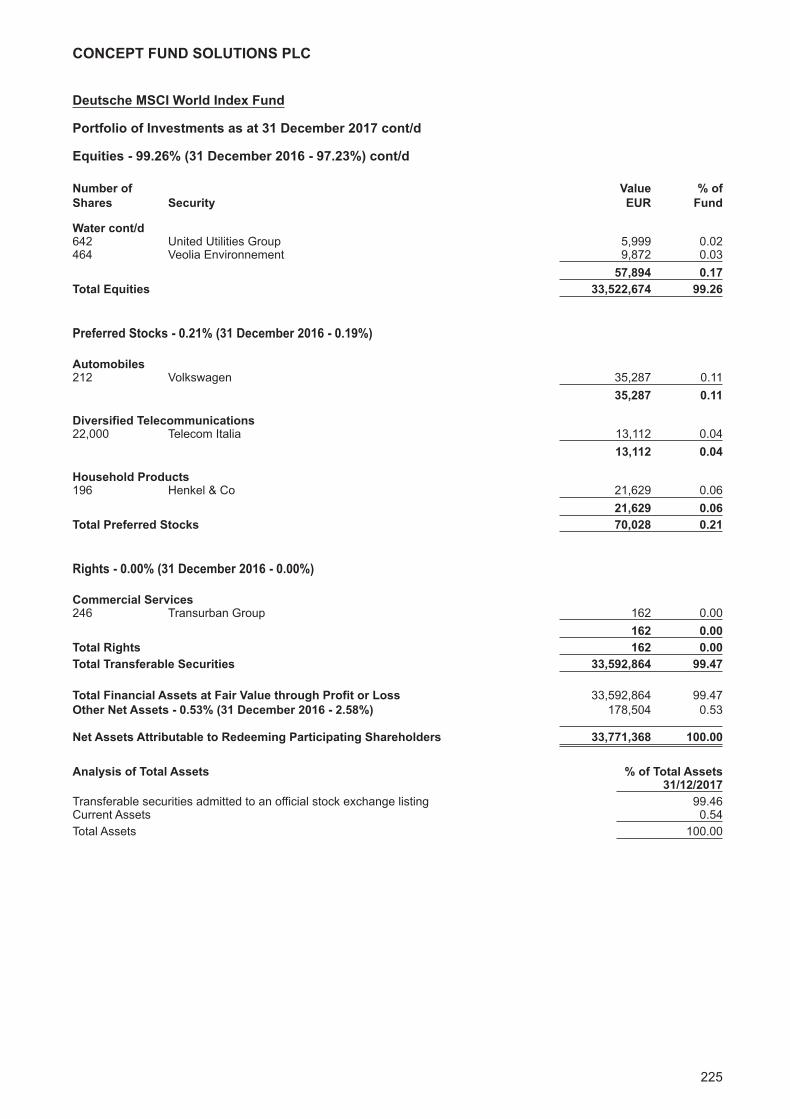
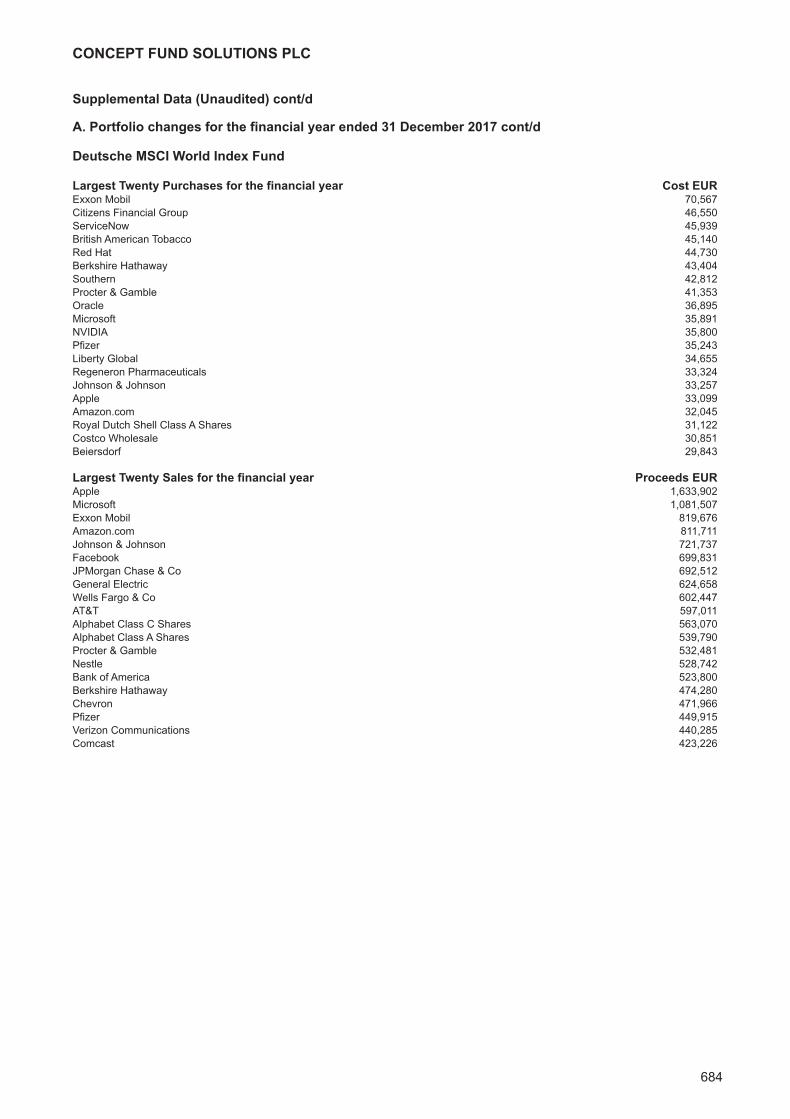
Deutsche MSCI World Index FundInvestment Manager’s Report 206Portfolio of Investments 207
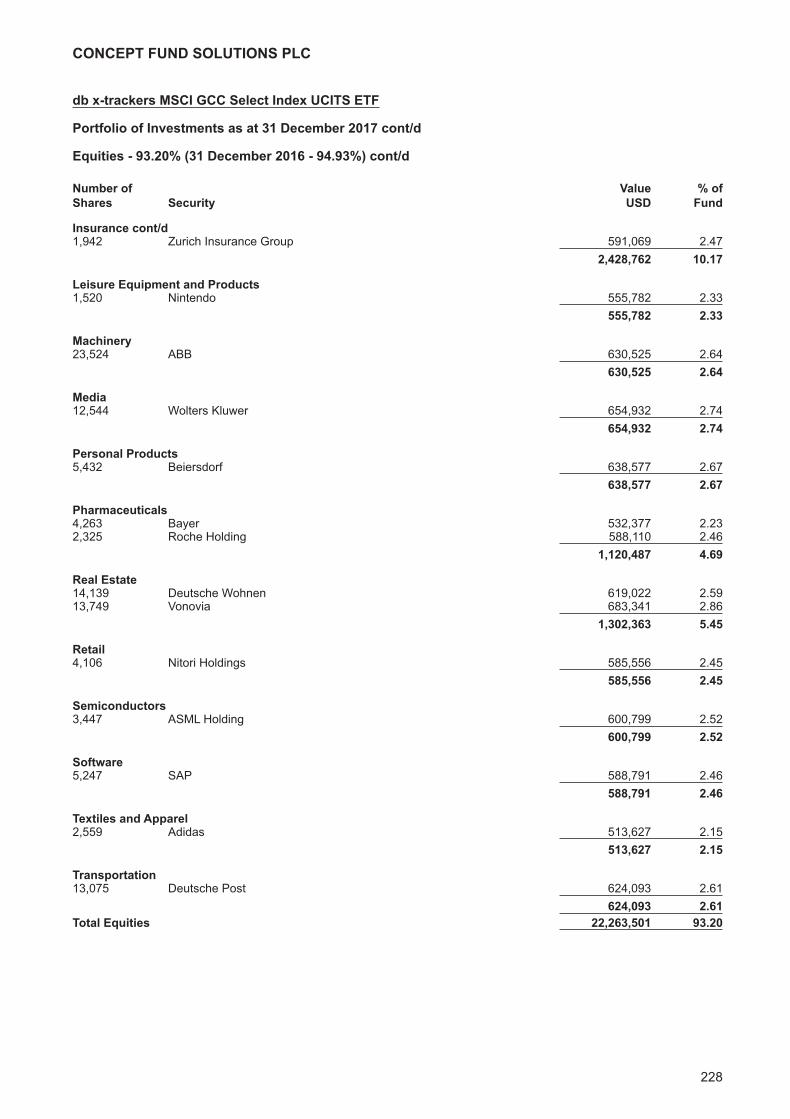
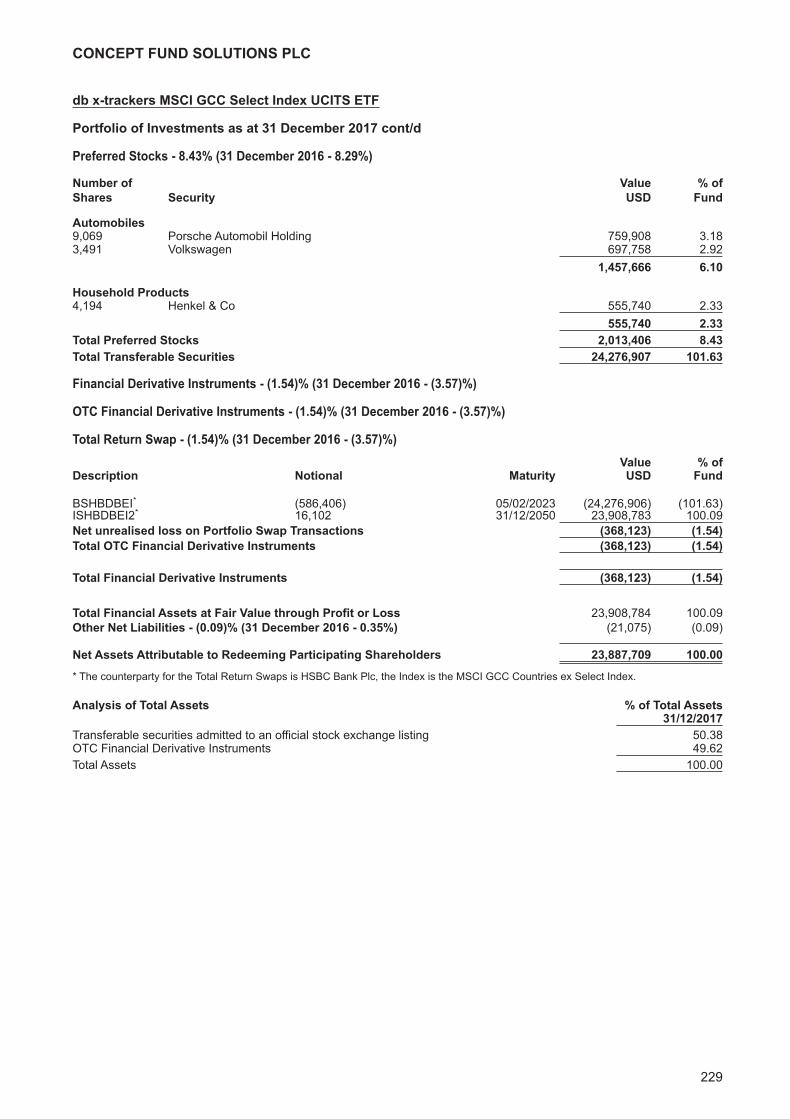
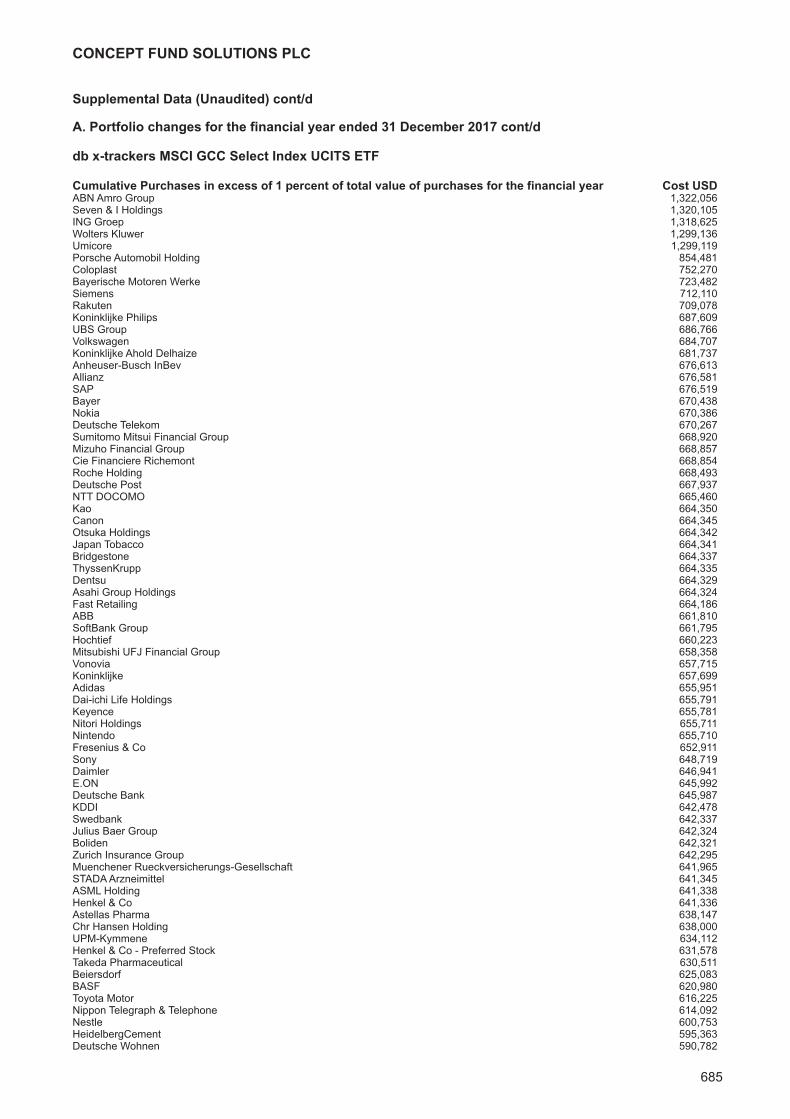
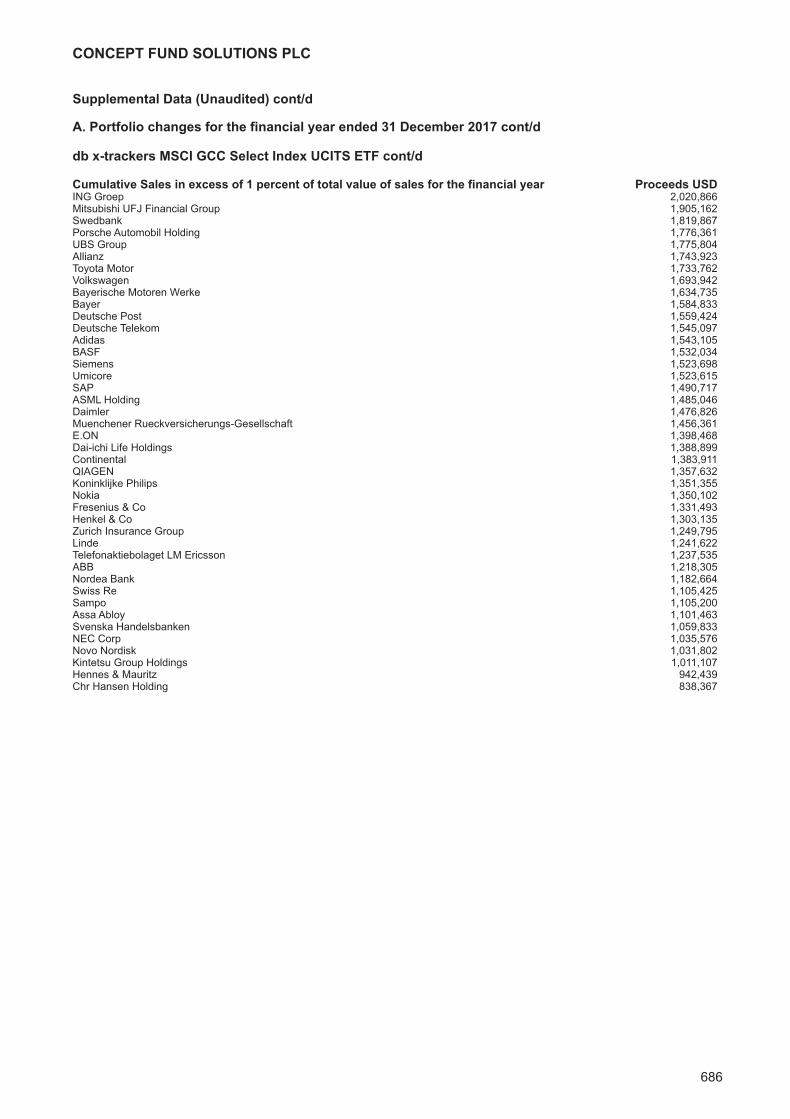
db x-trackers MSCI GCC Select Index UCITS ETFInvestment Manager’s Report 226Portfolio of Investments 227
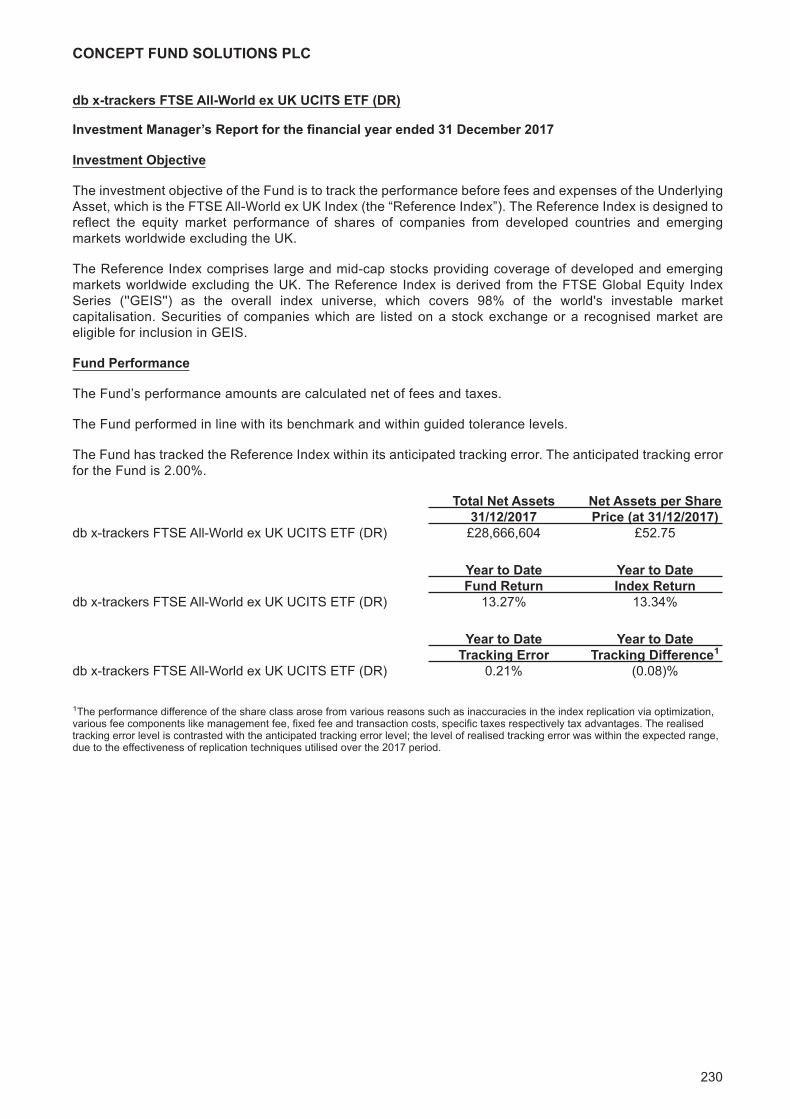
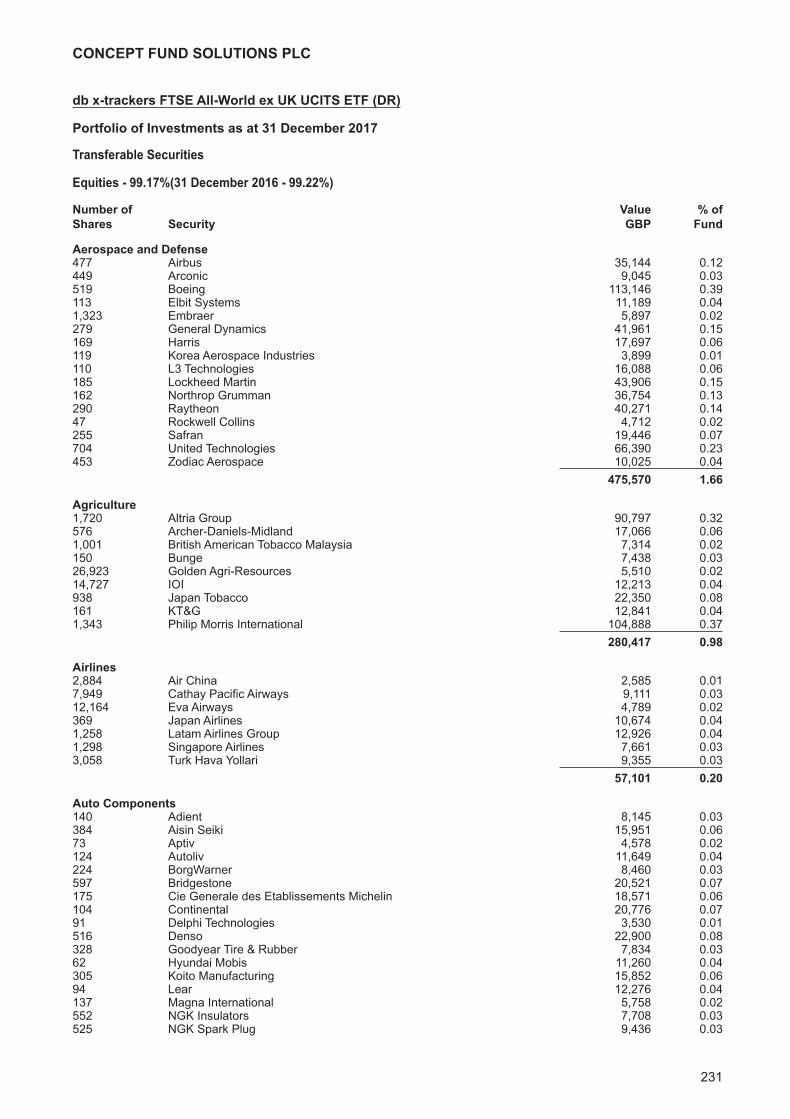
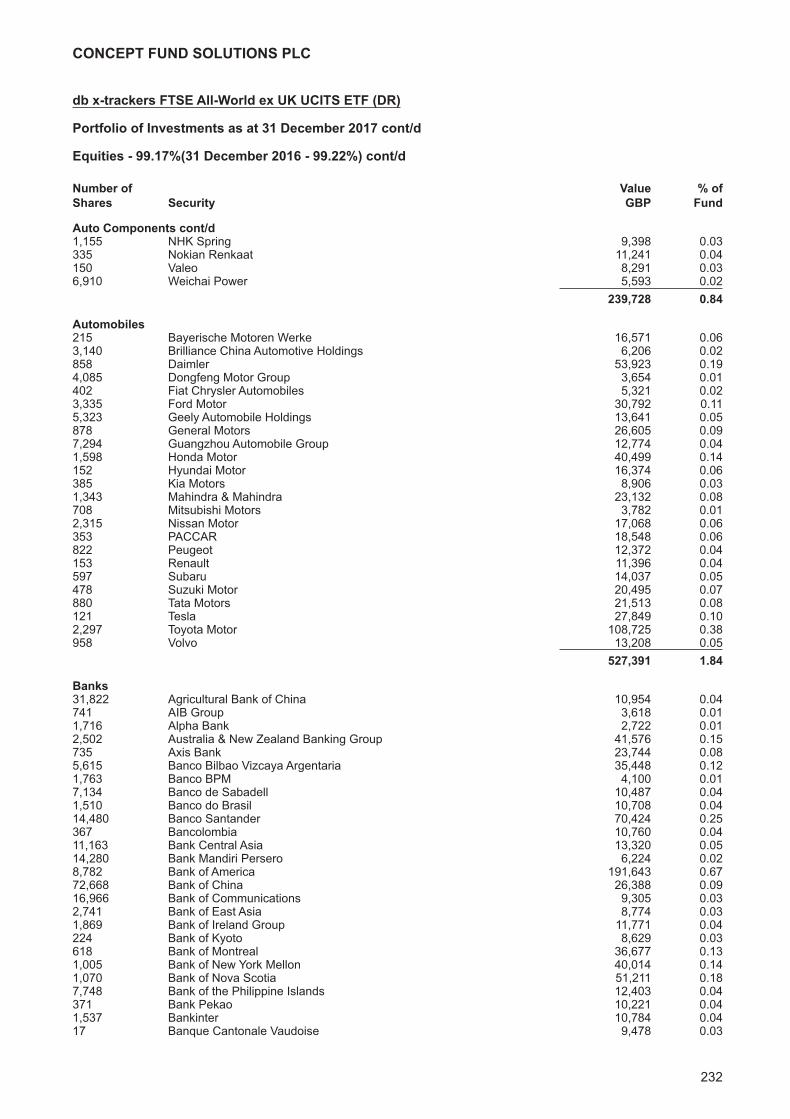
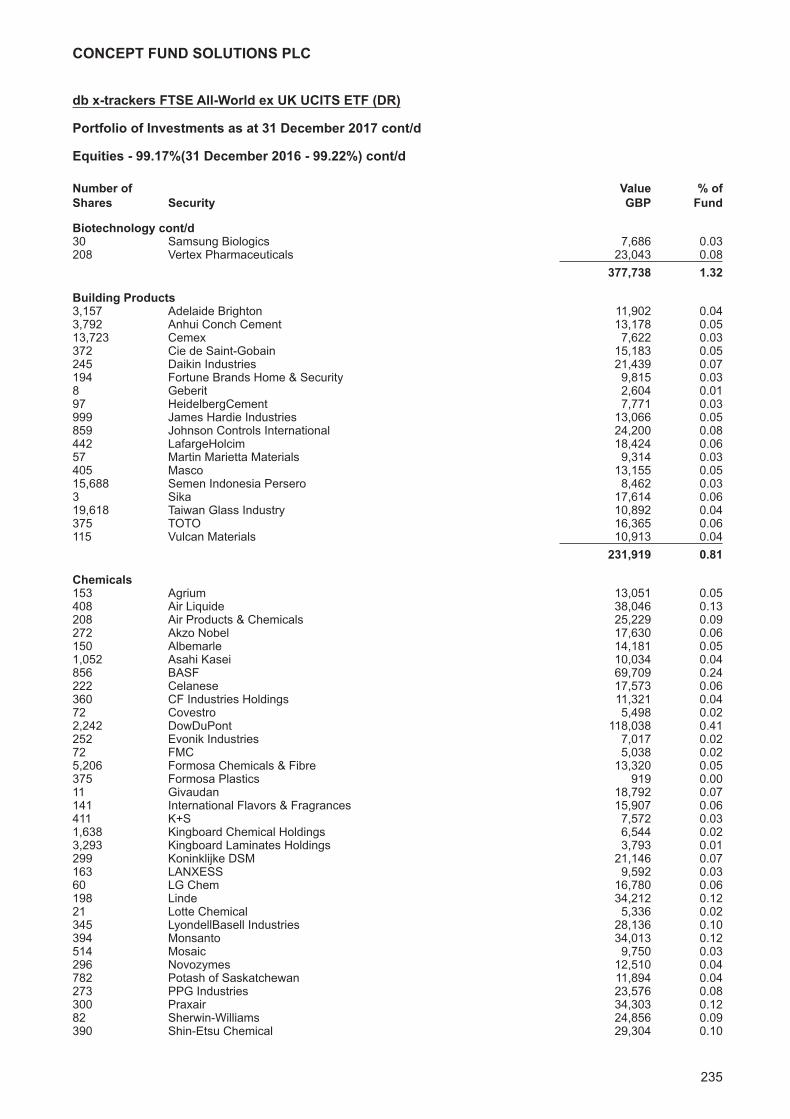
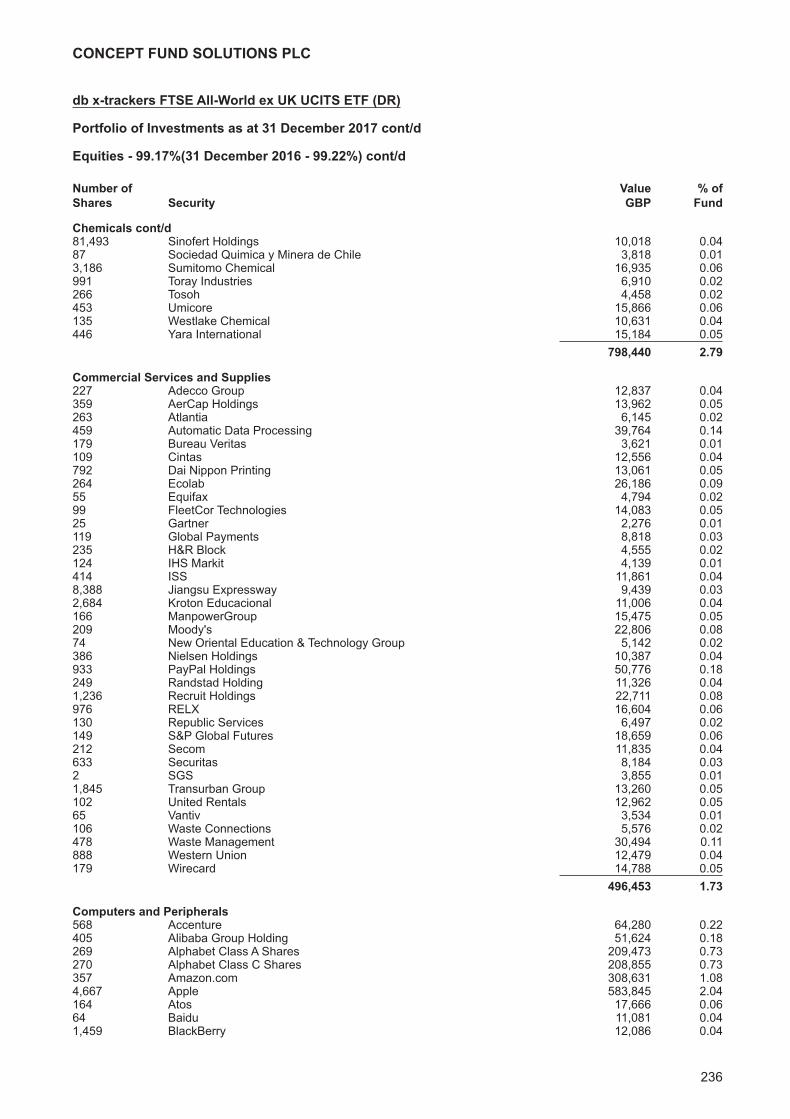
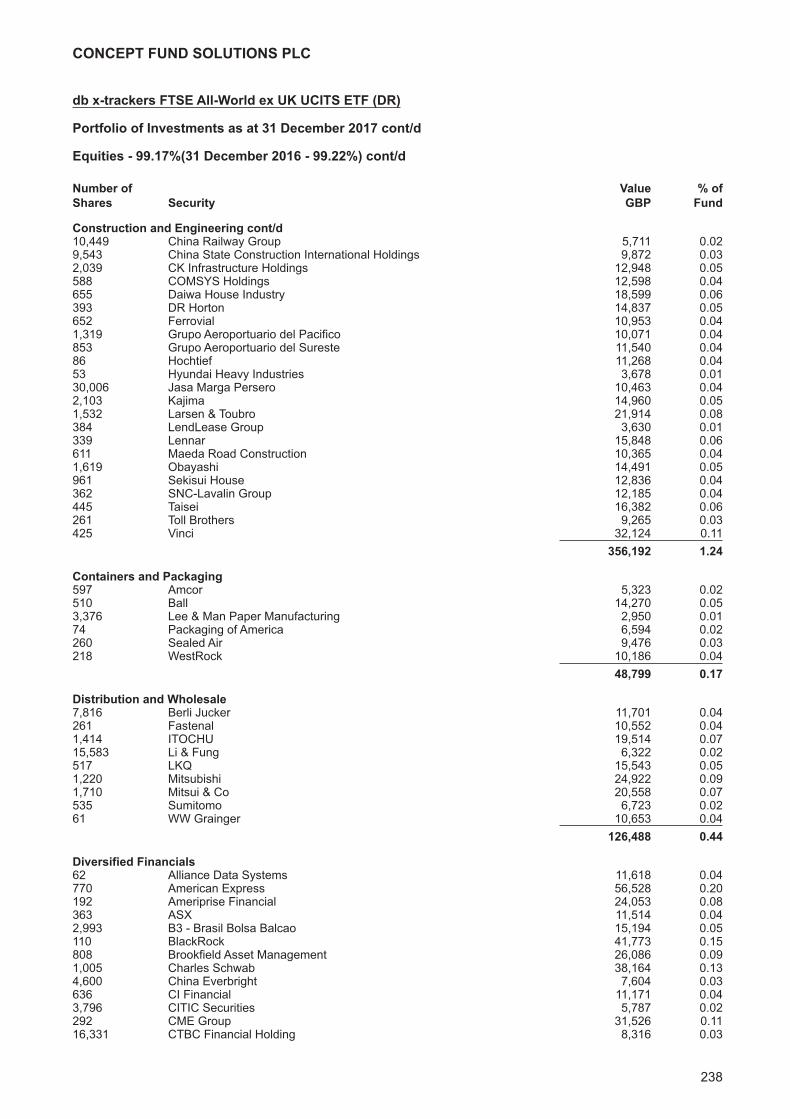
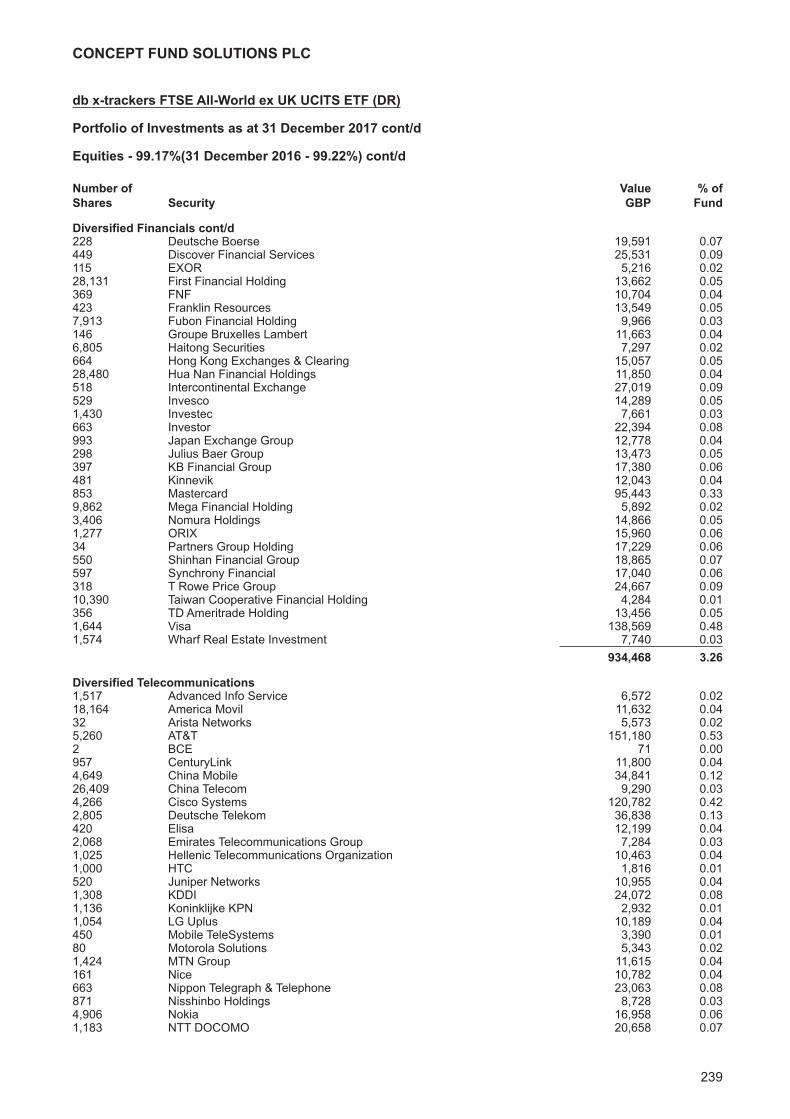
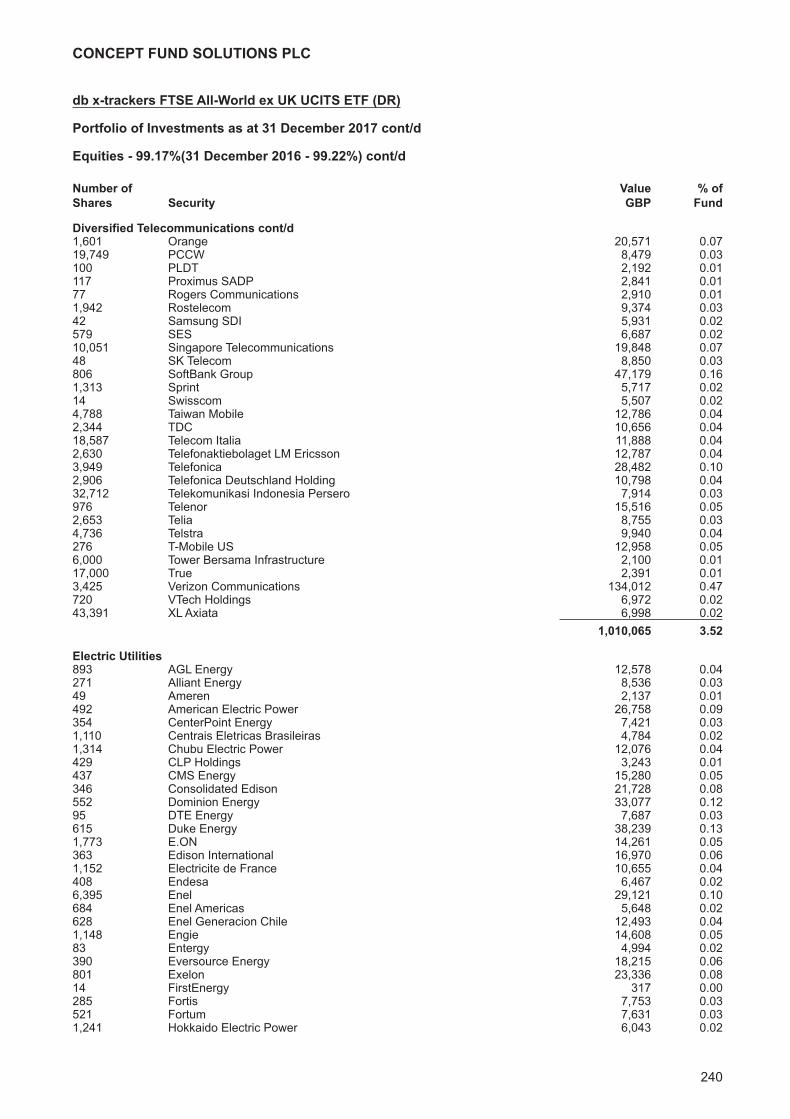
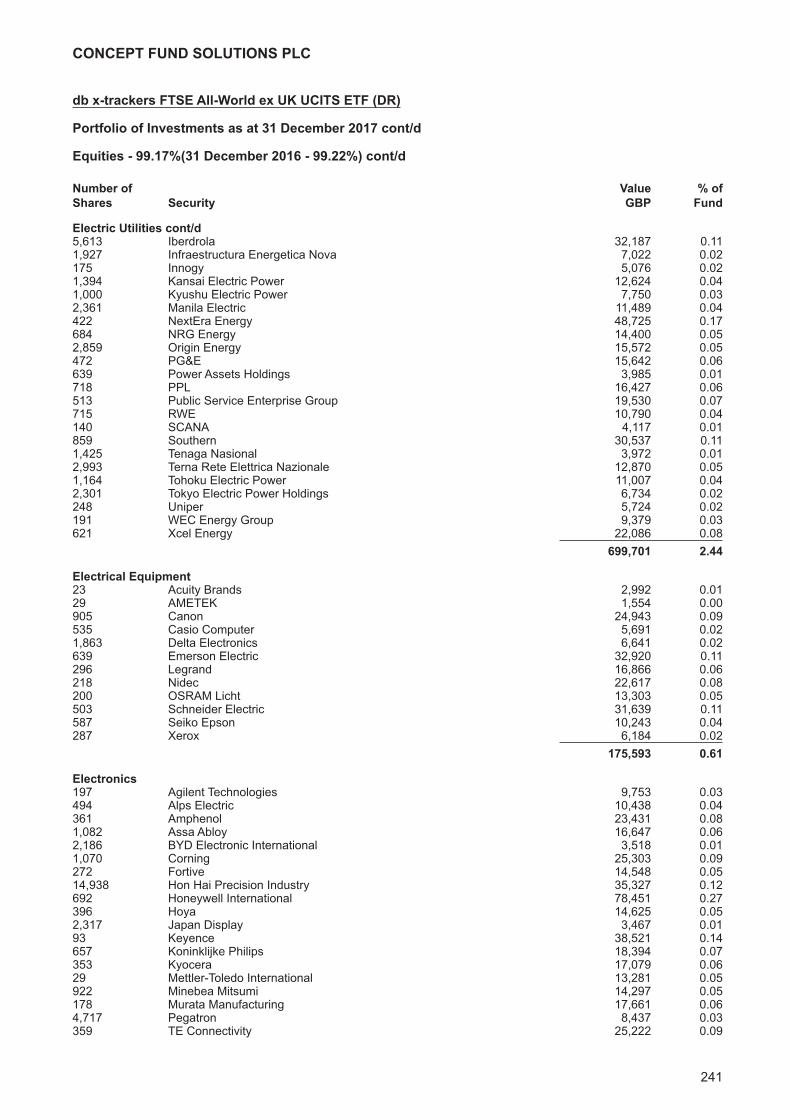
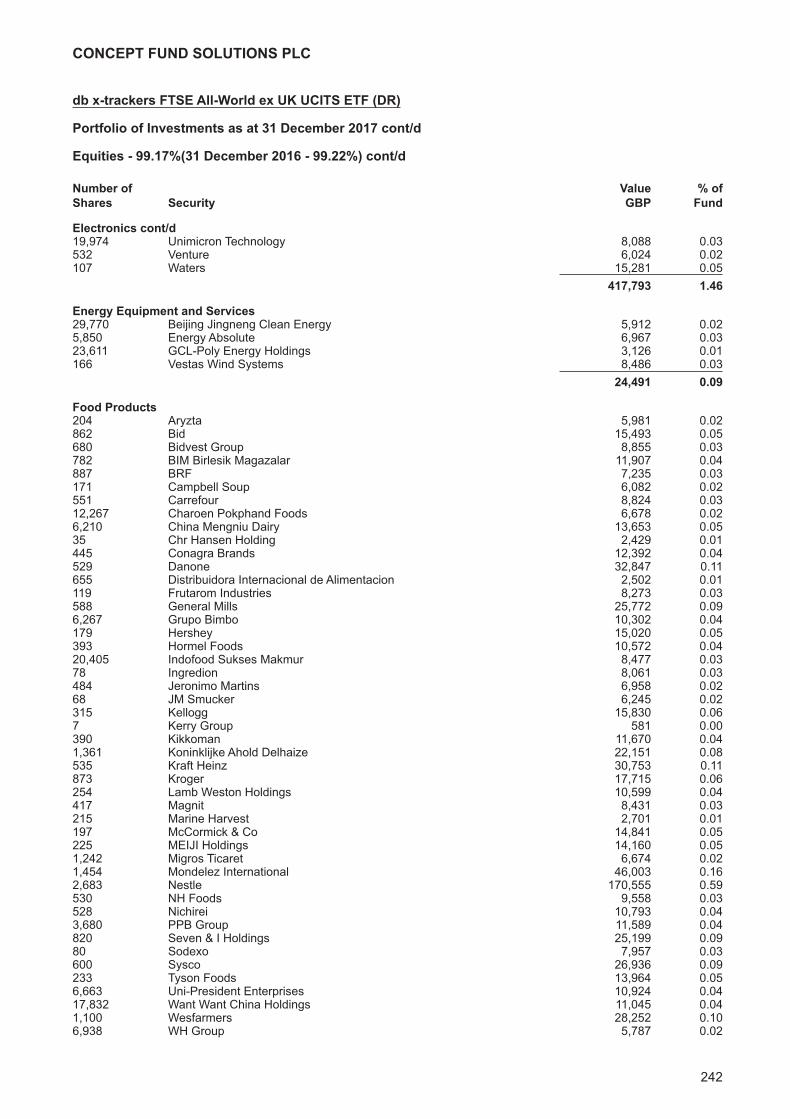
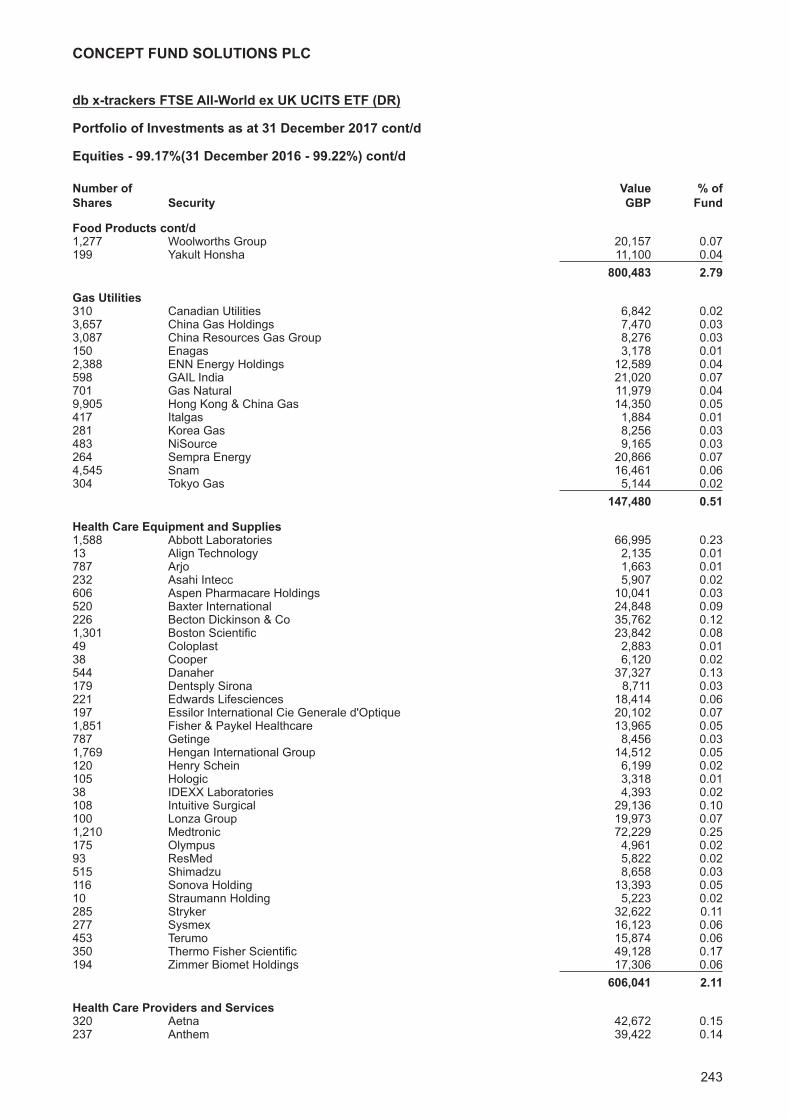
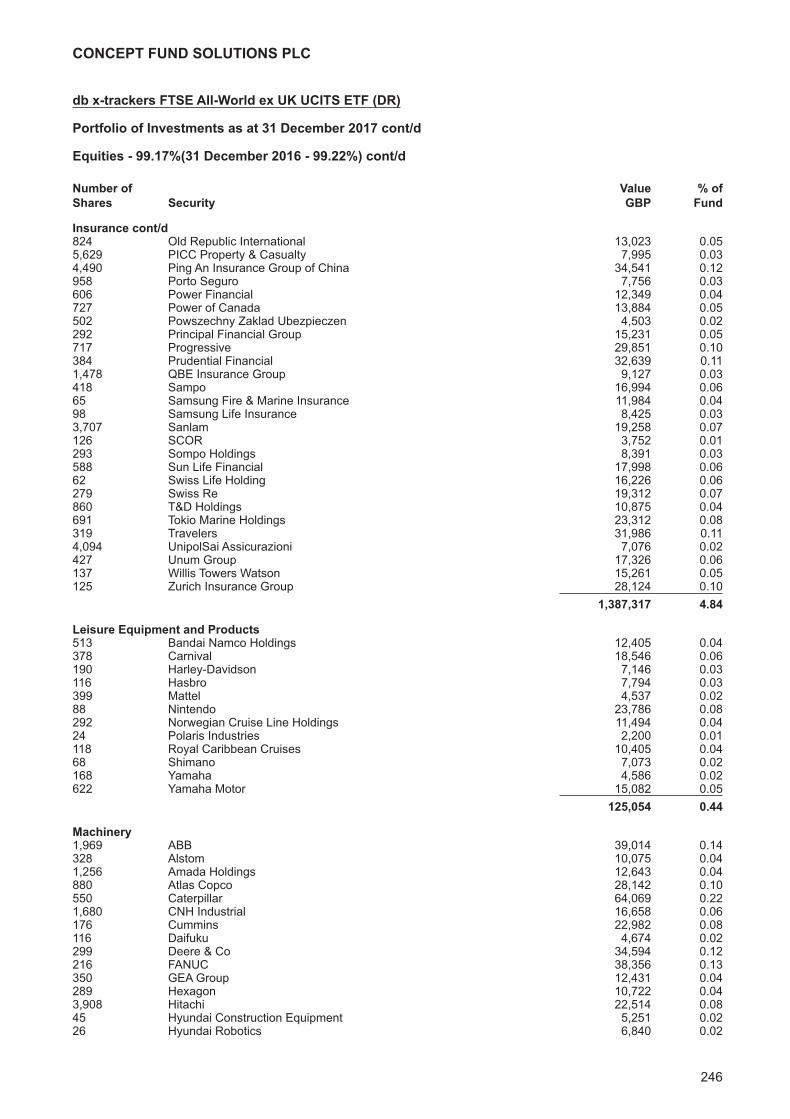
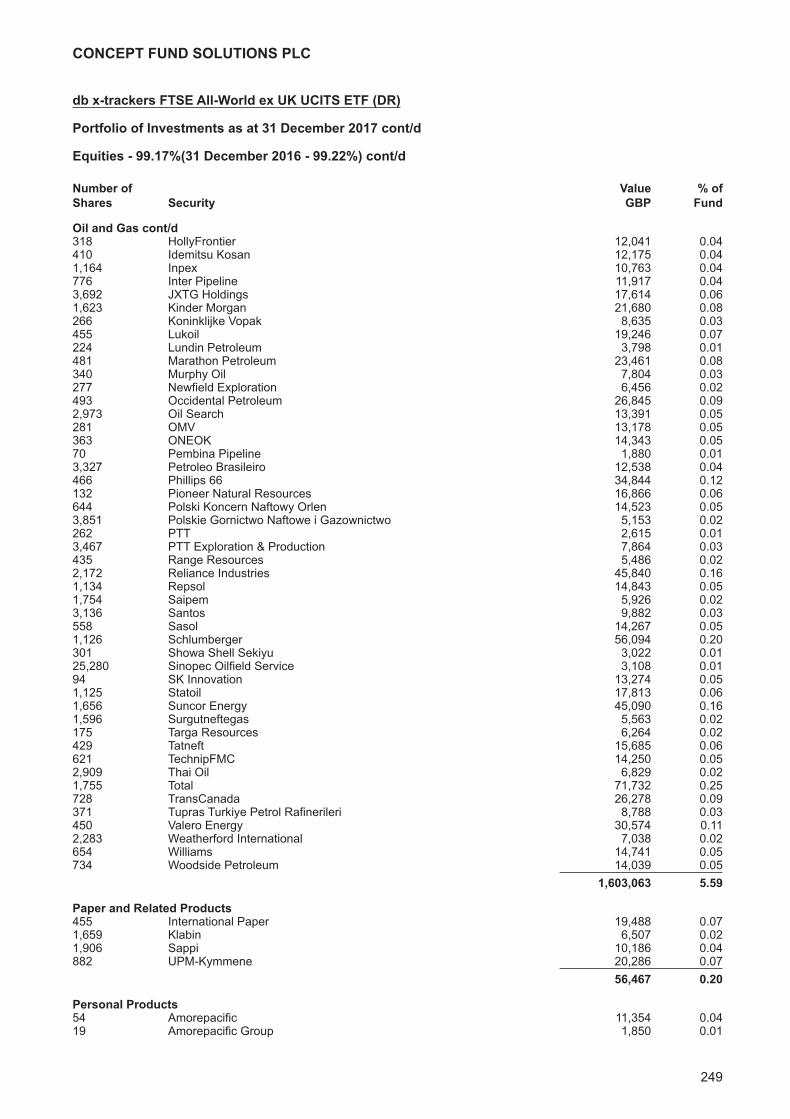
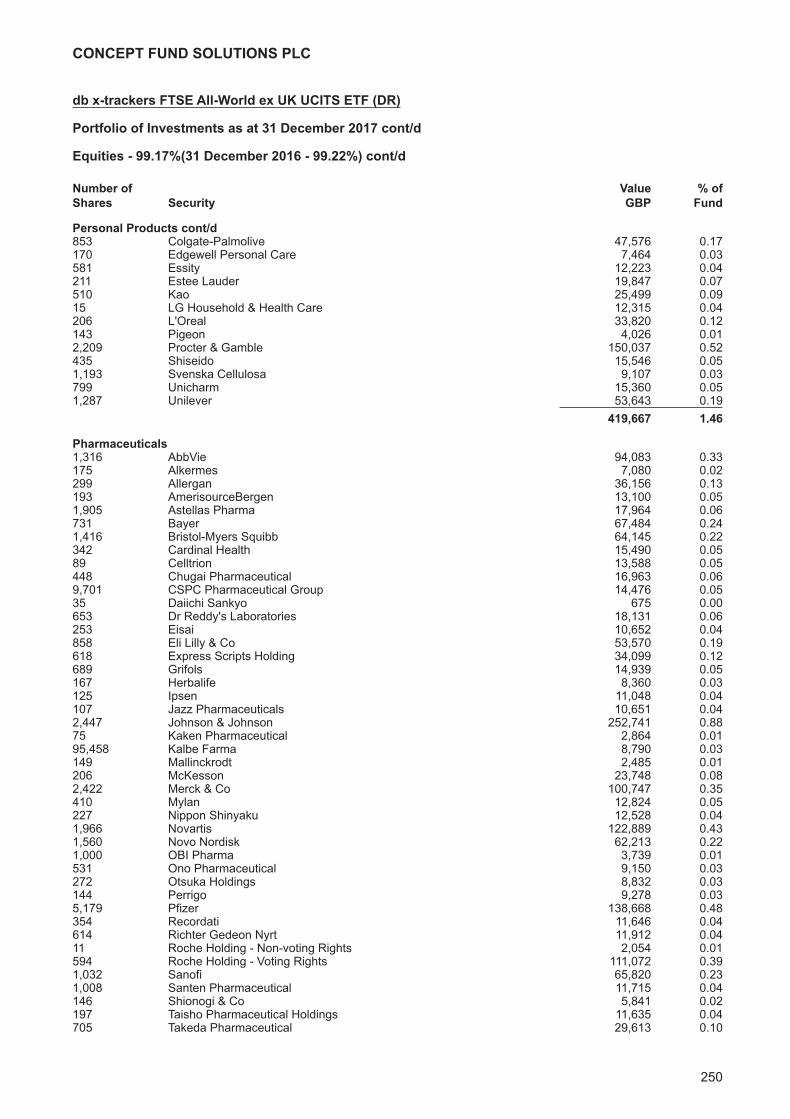
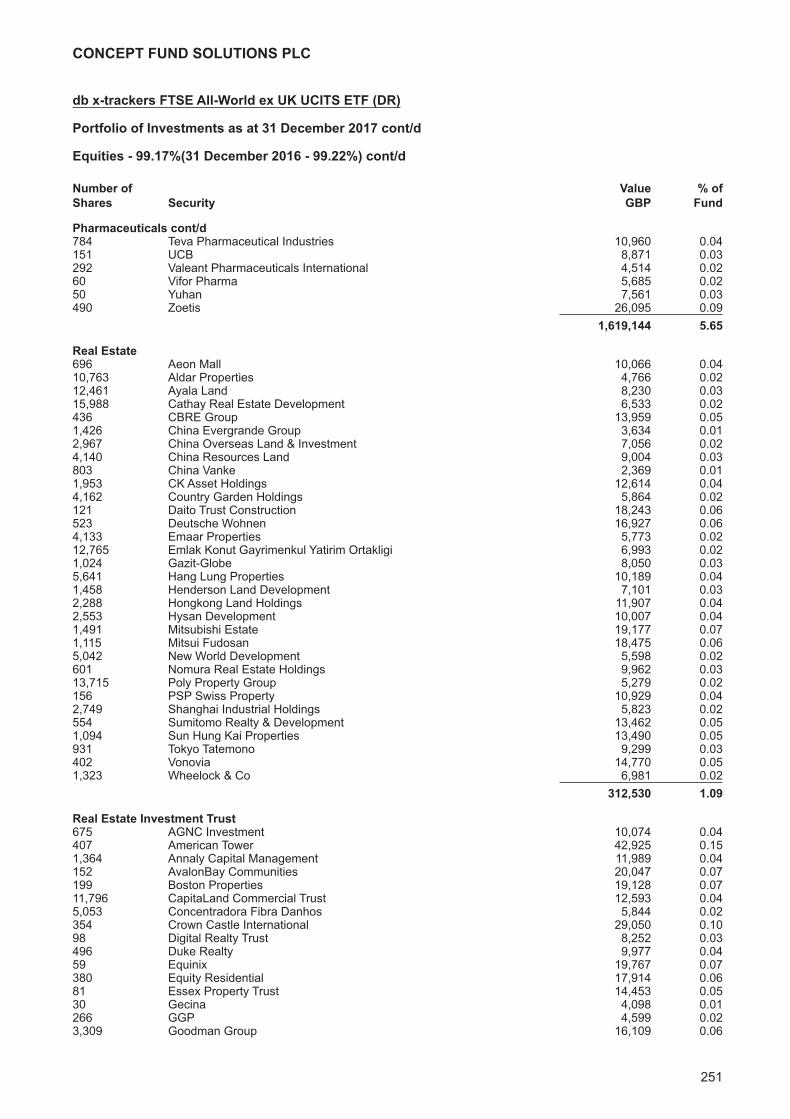
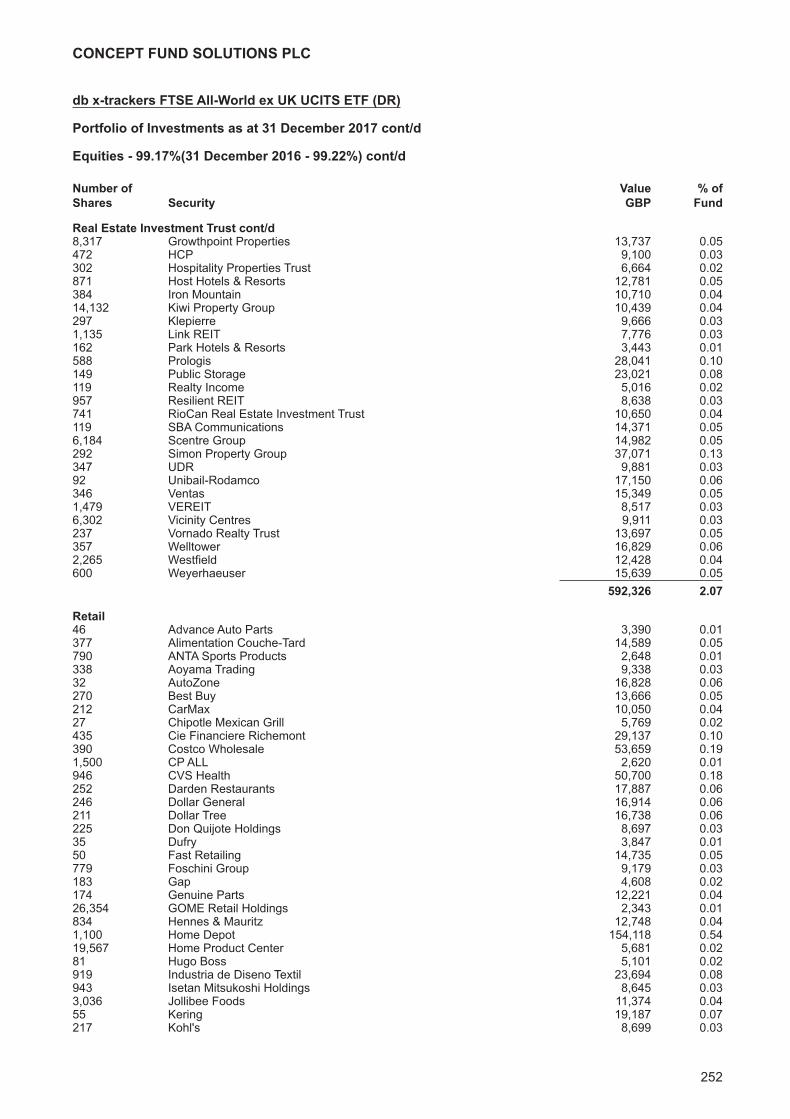
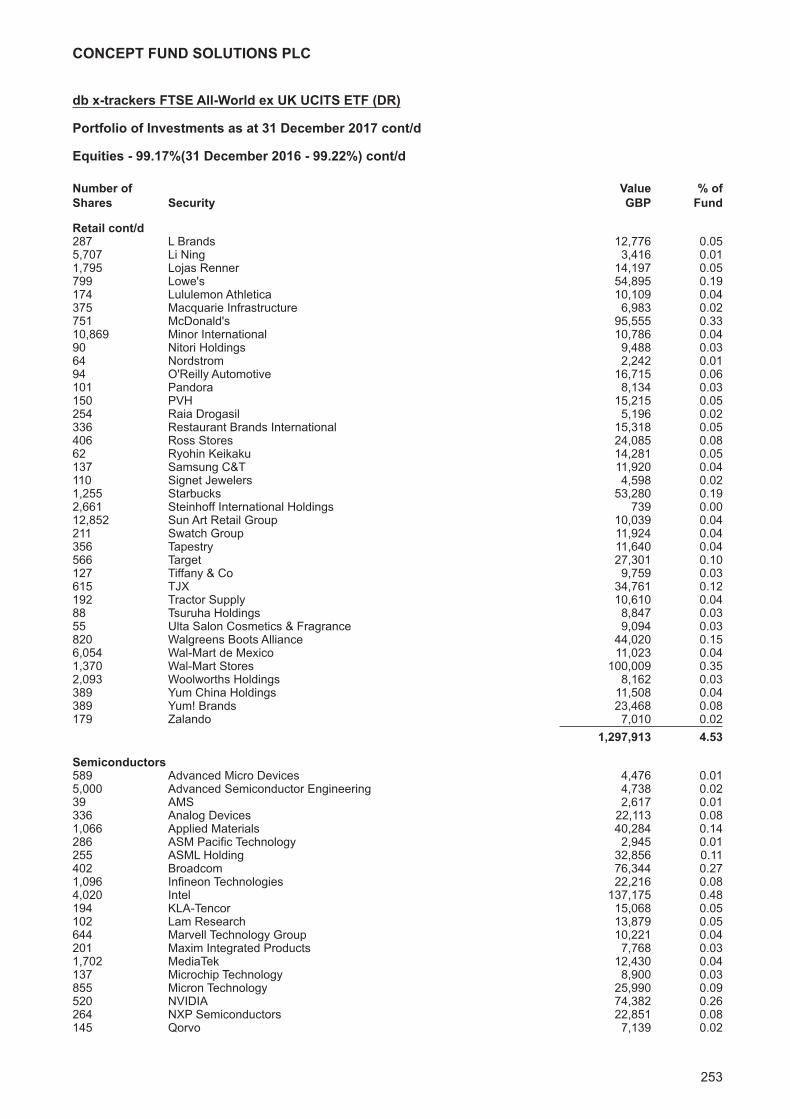
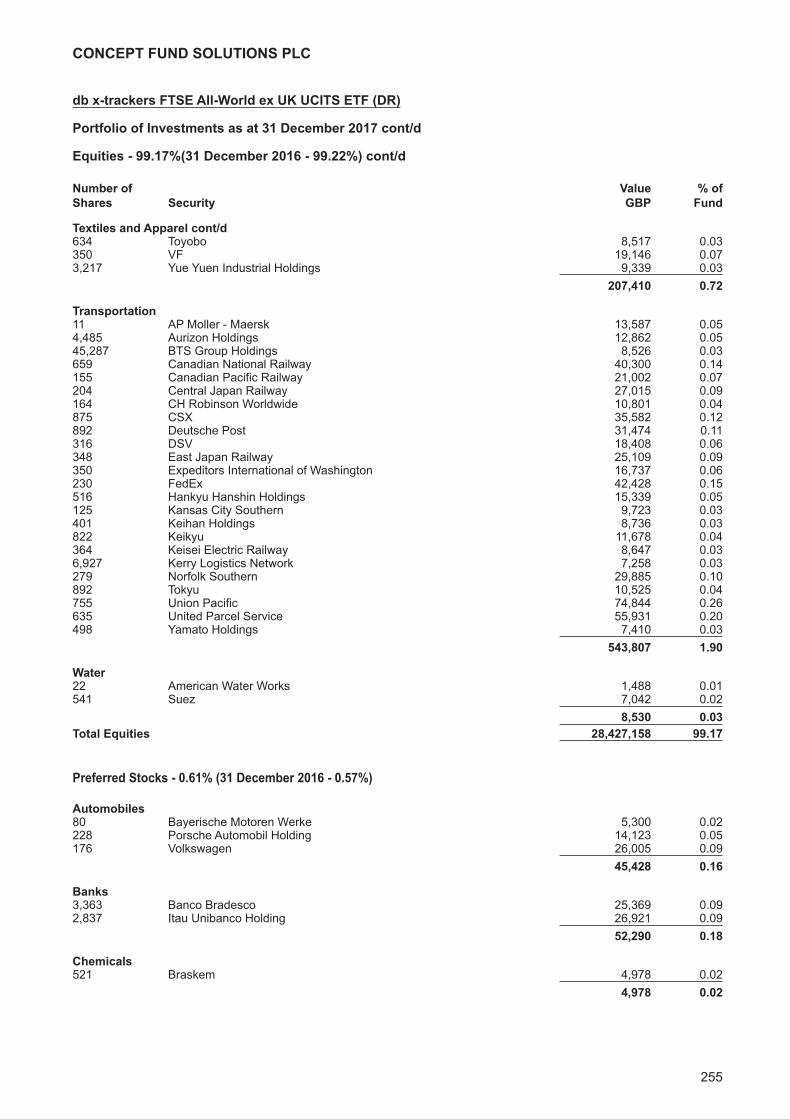
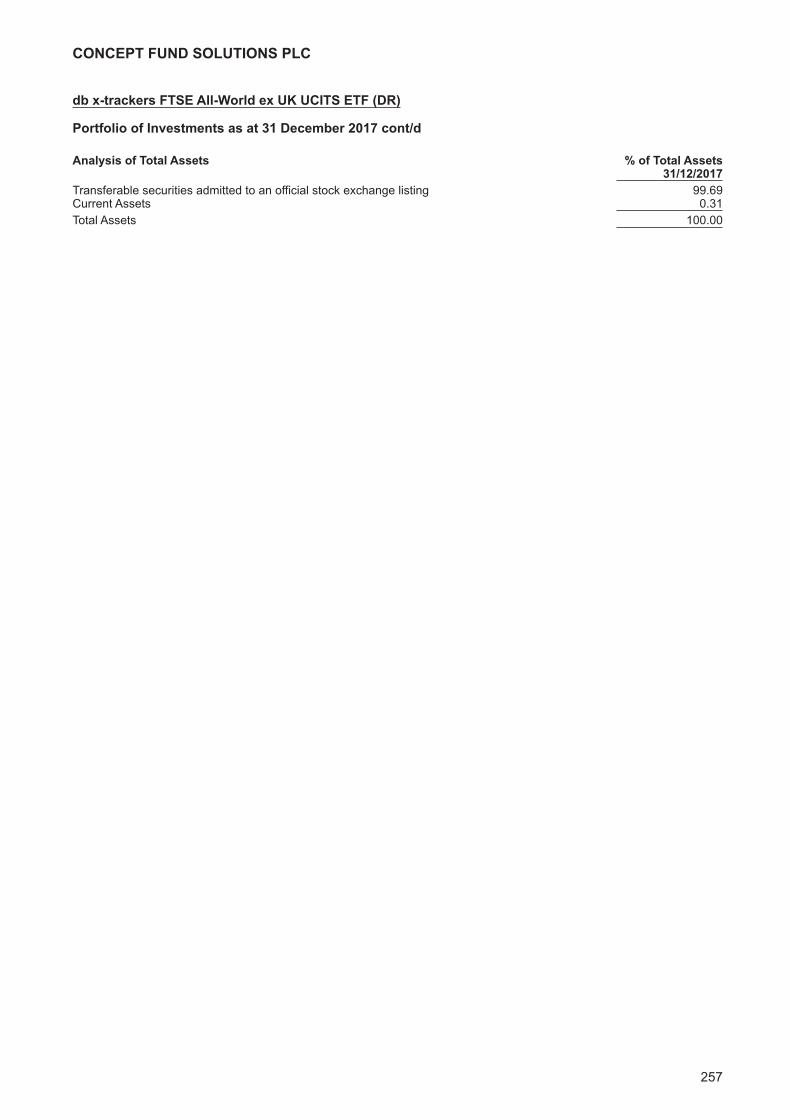
db x-trackers FTSE All-World ex UK UCITS ETF (DR)Investment Manager’s Report 230Portfolio of Investments 231
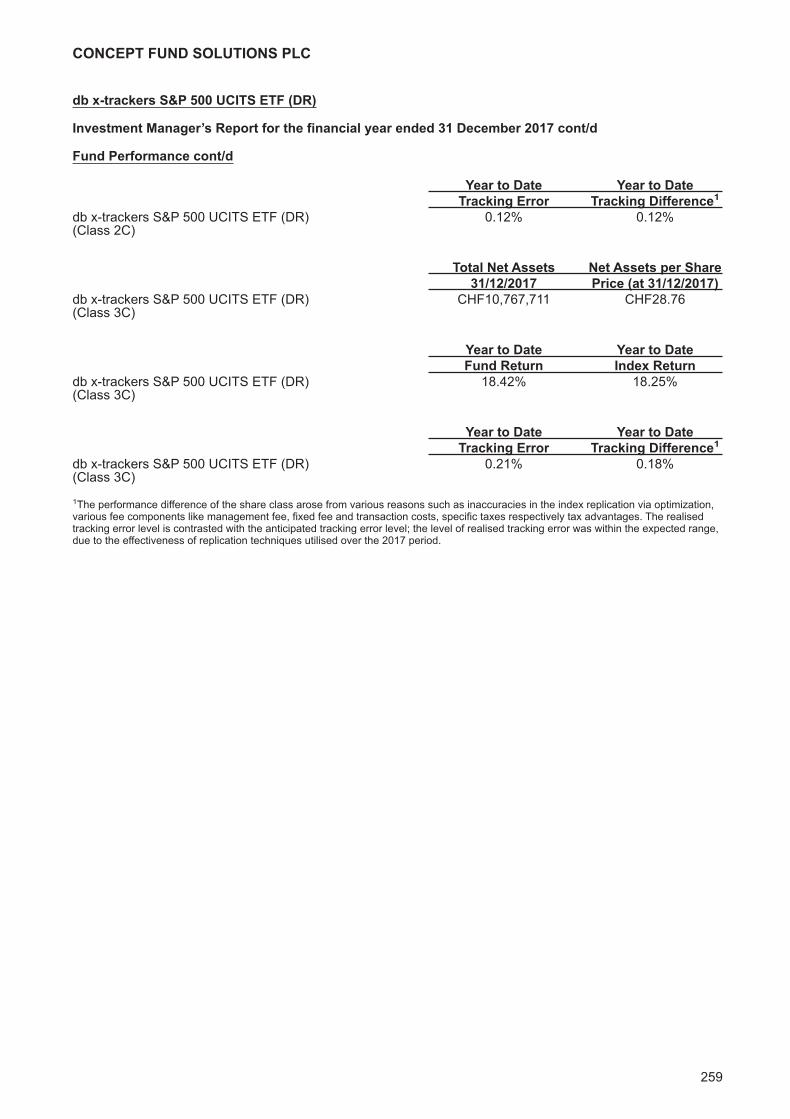
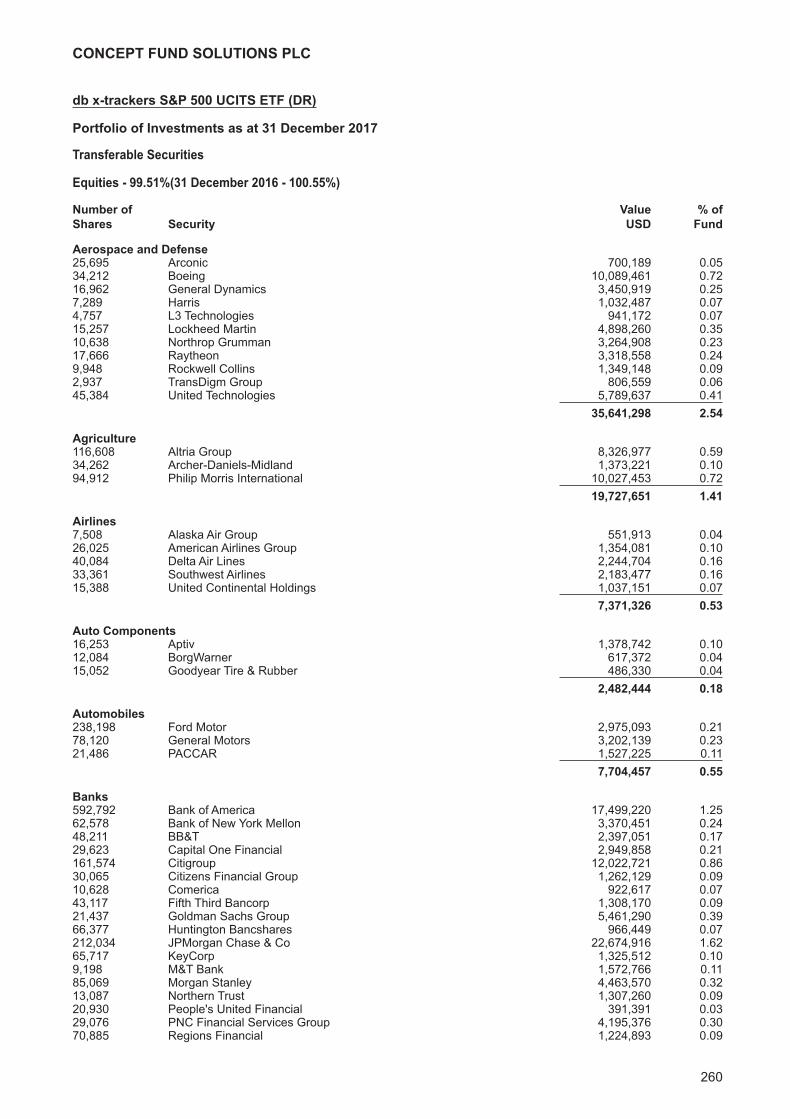
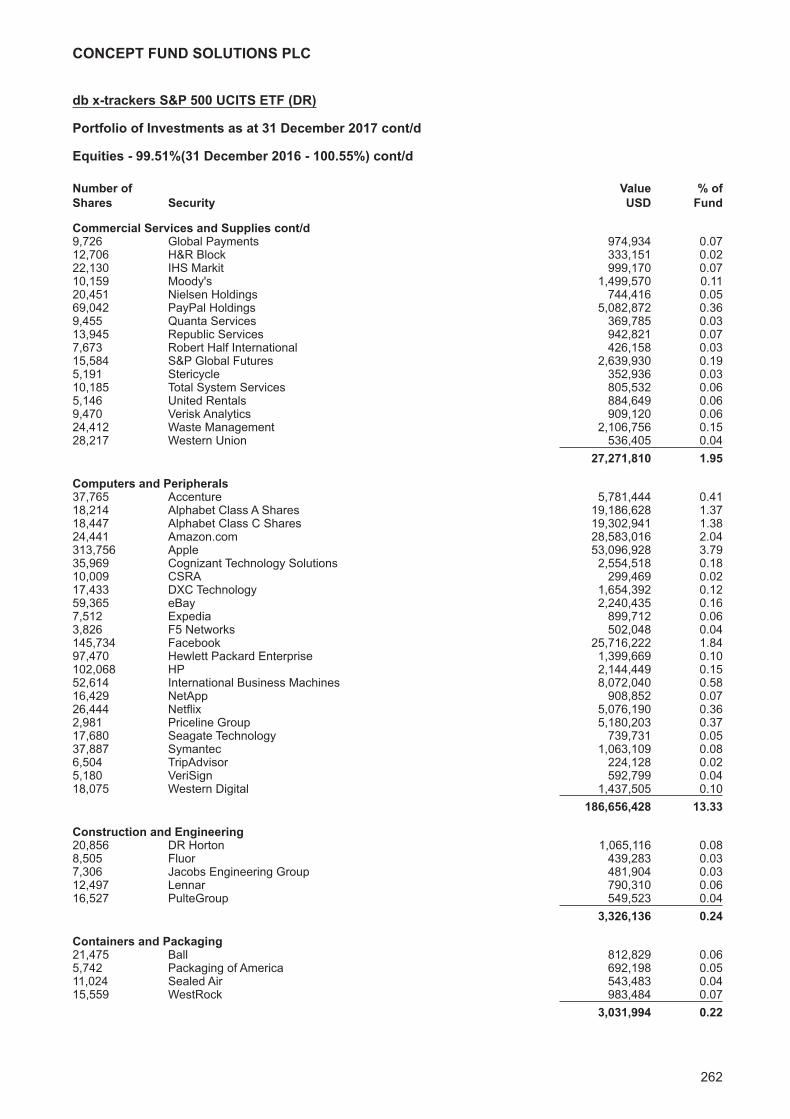
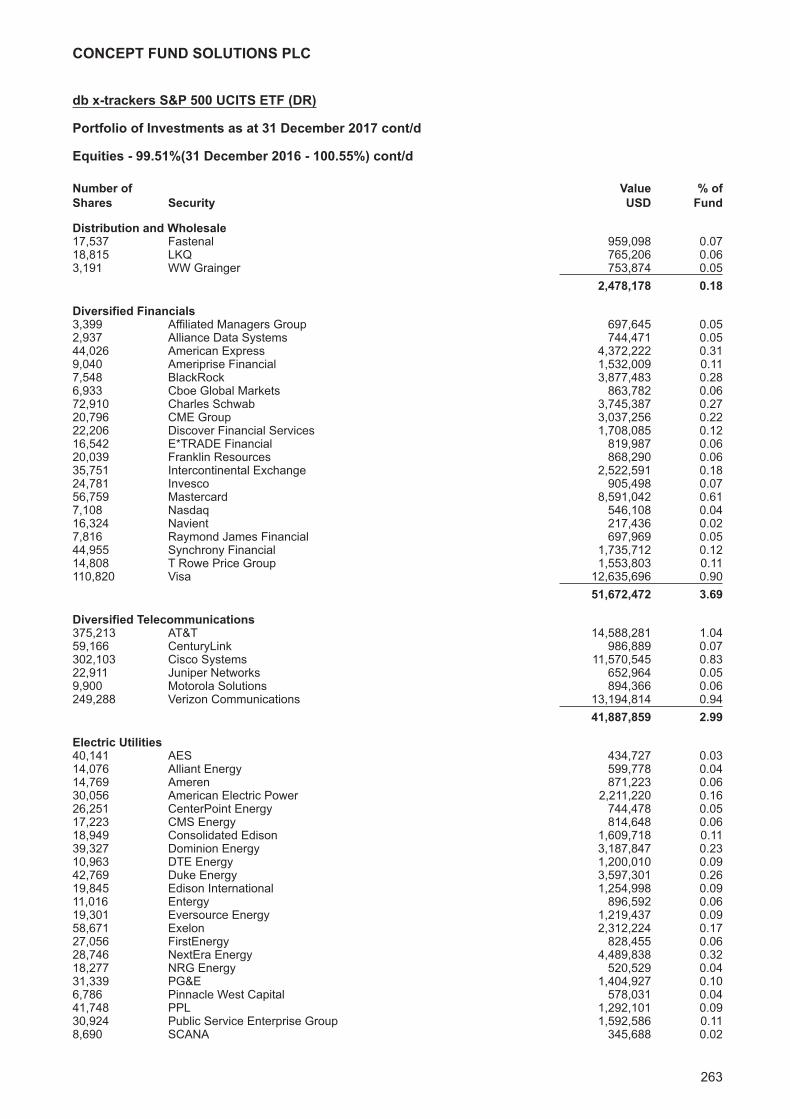
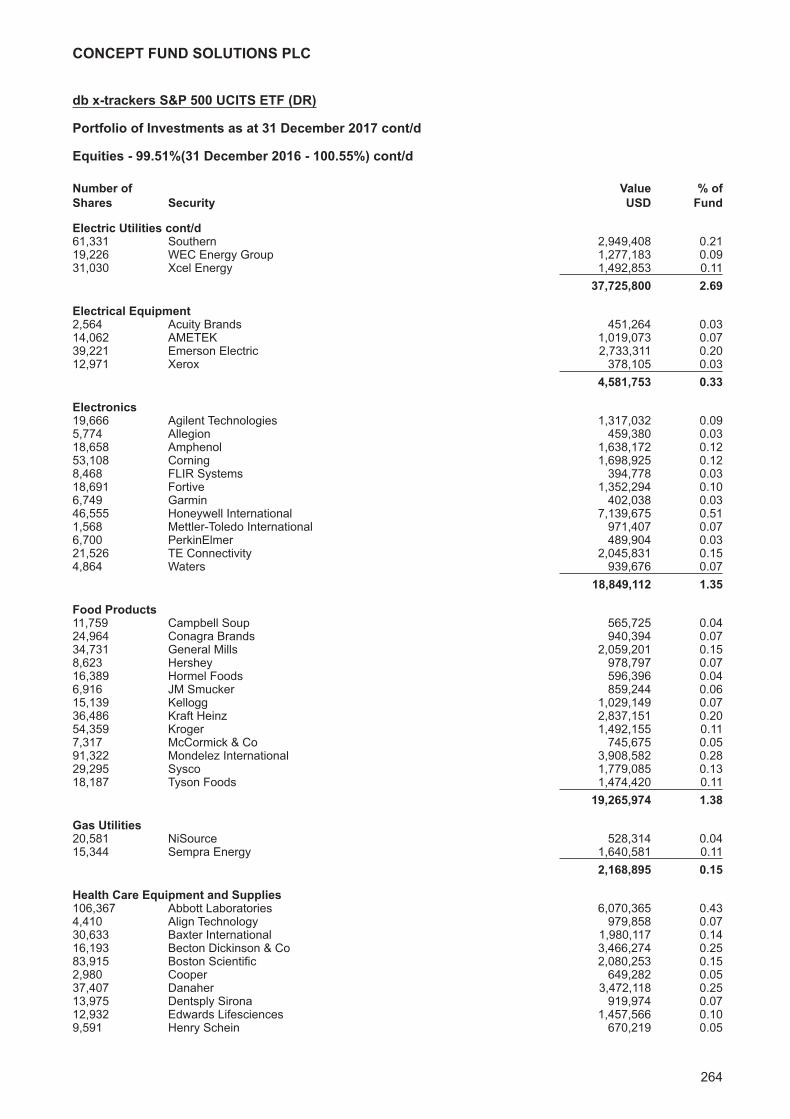
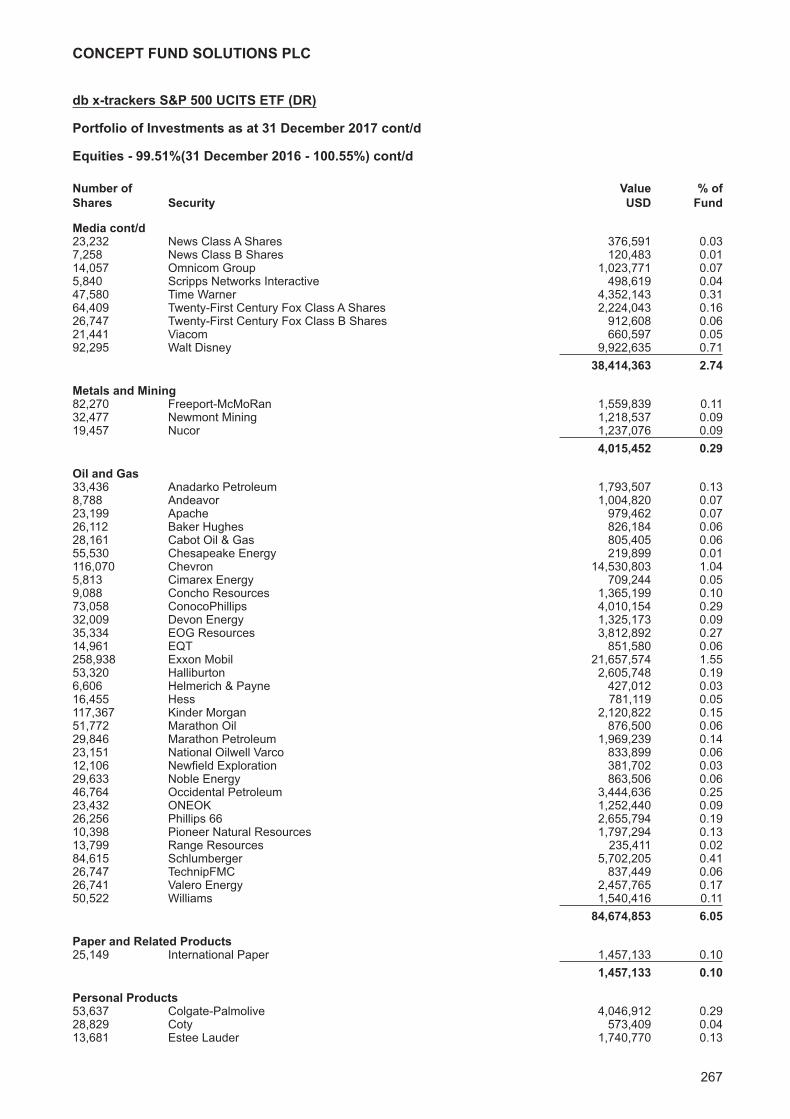
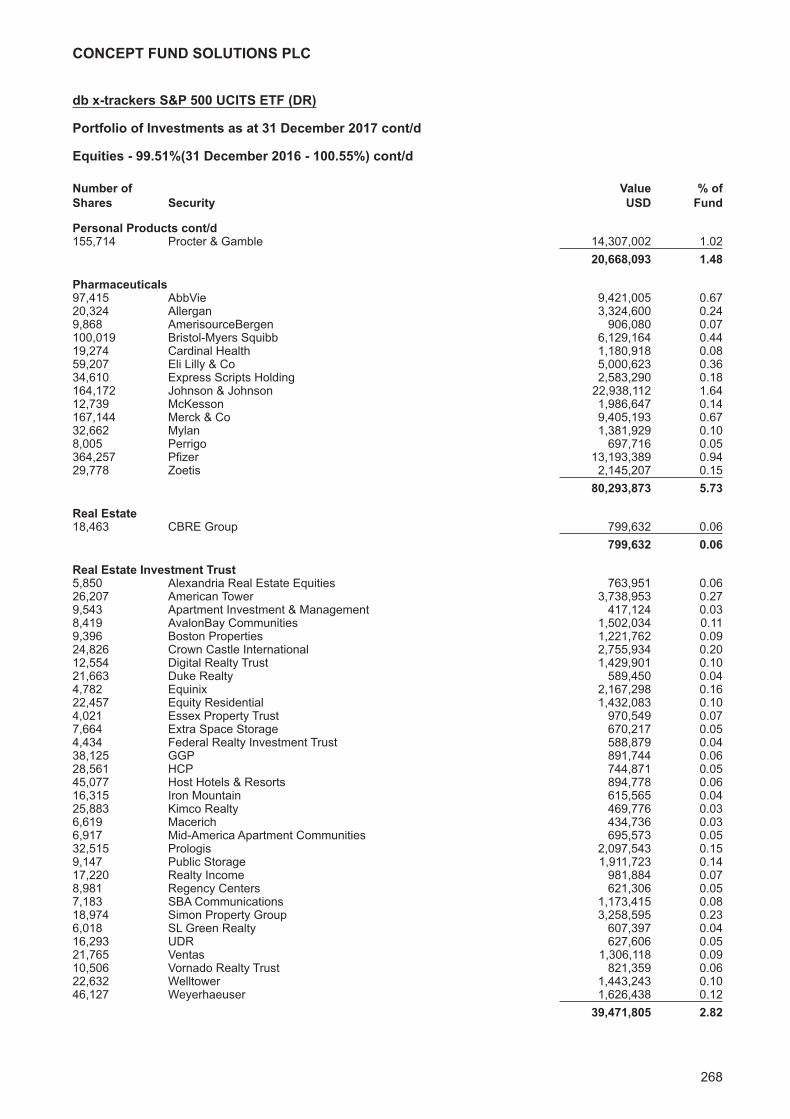
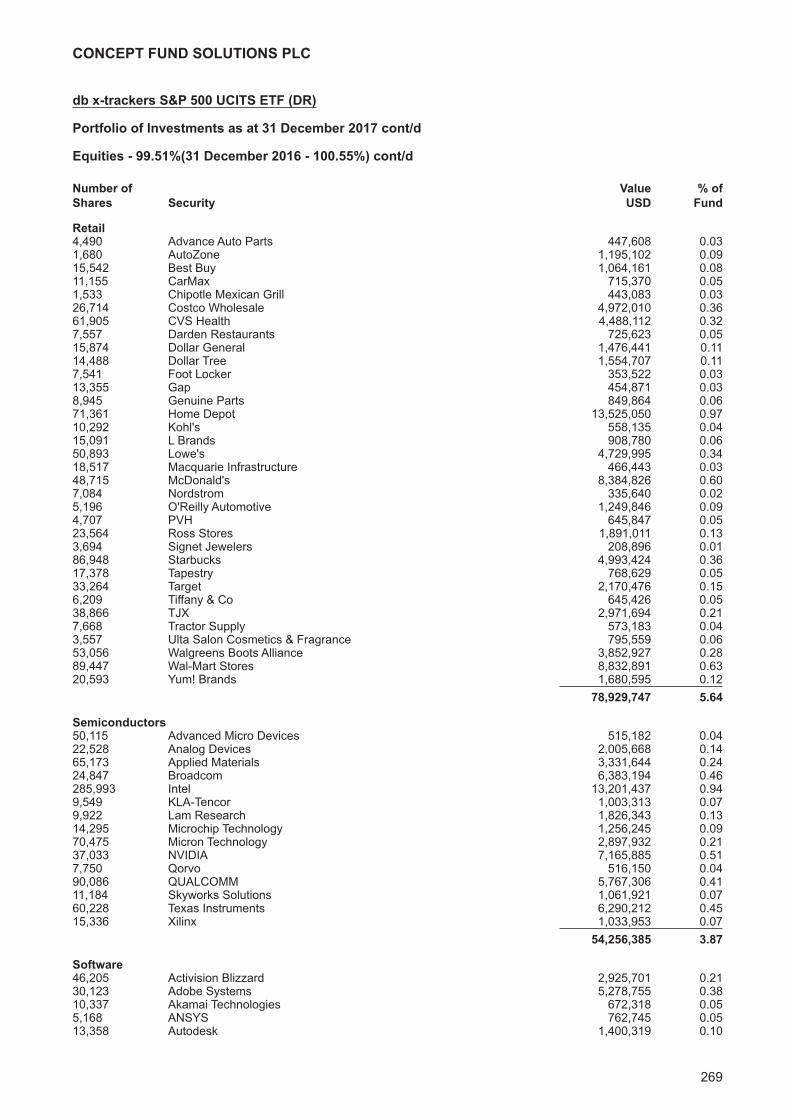
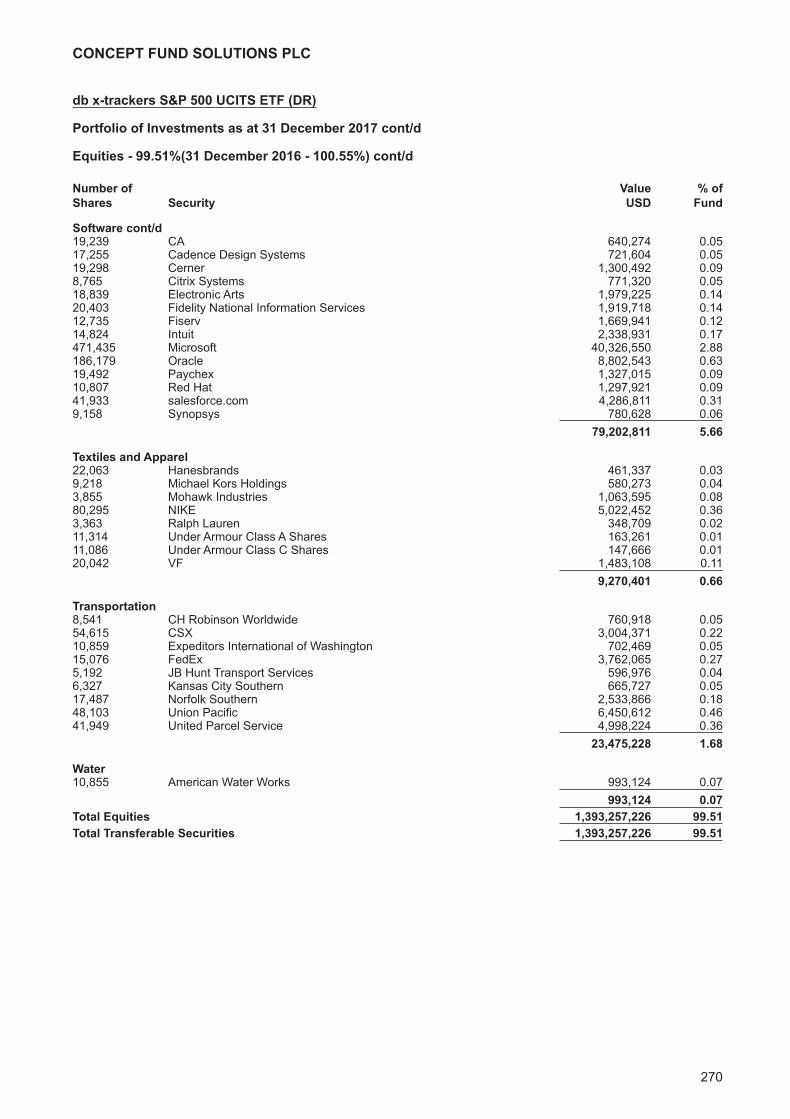
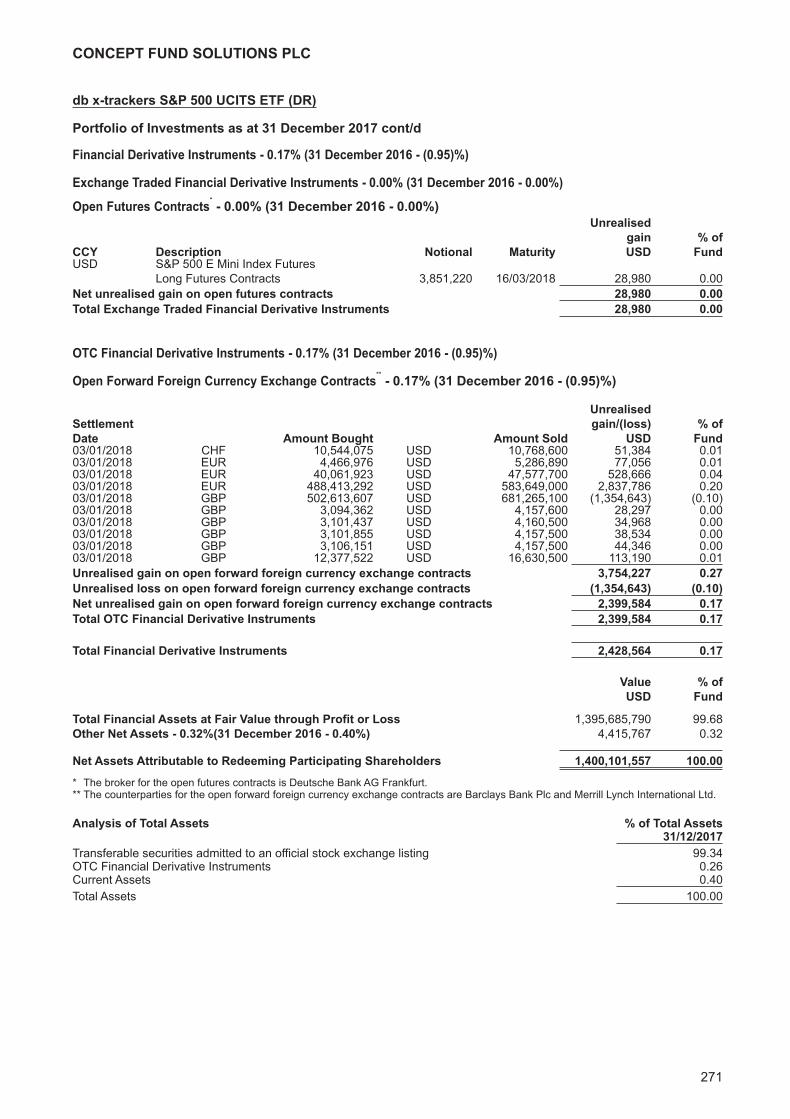
db x-trackers S&P 500 UCITS ETF (DR)Investment Manager’s Report 258Portfolio of Investments 260
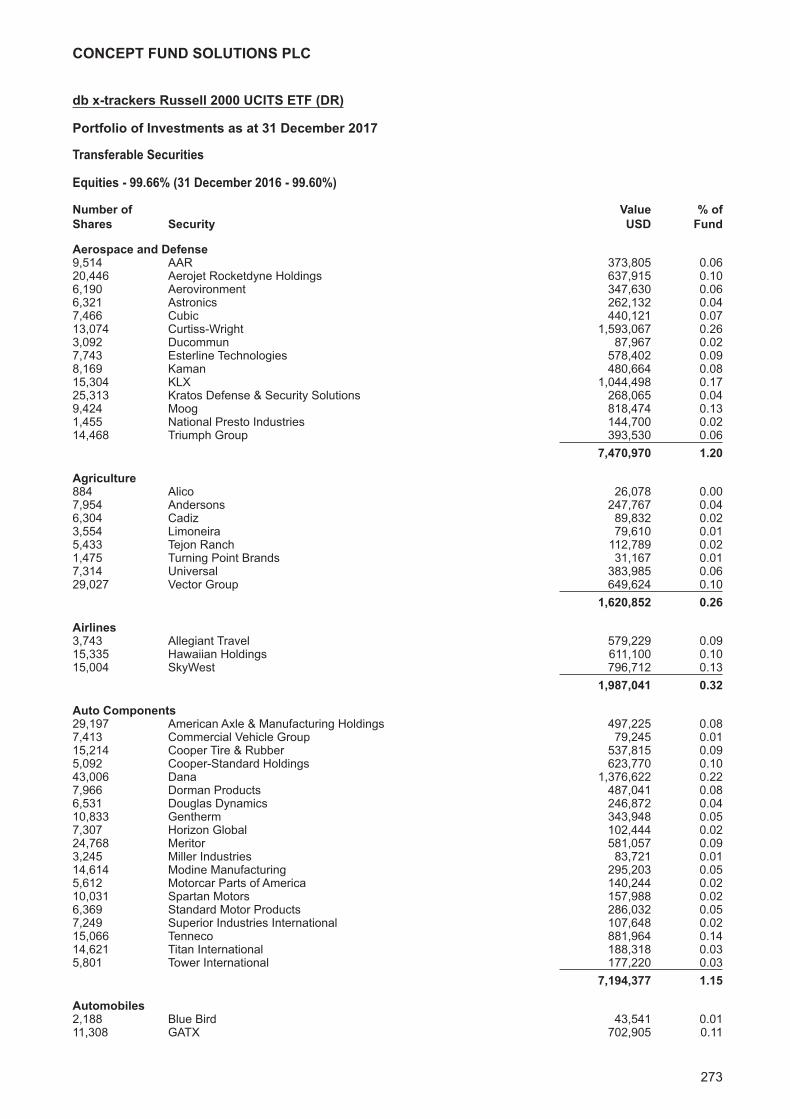
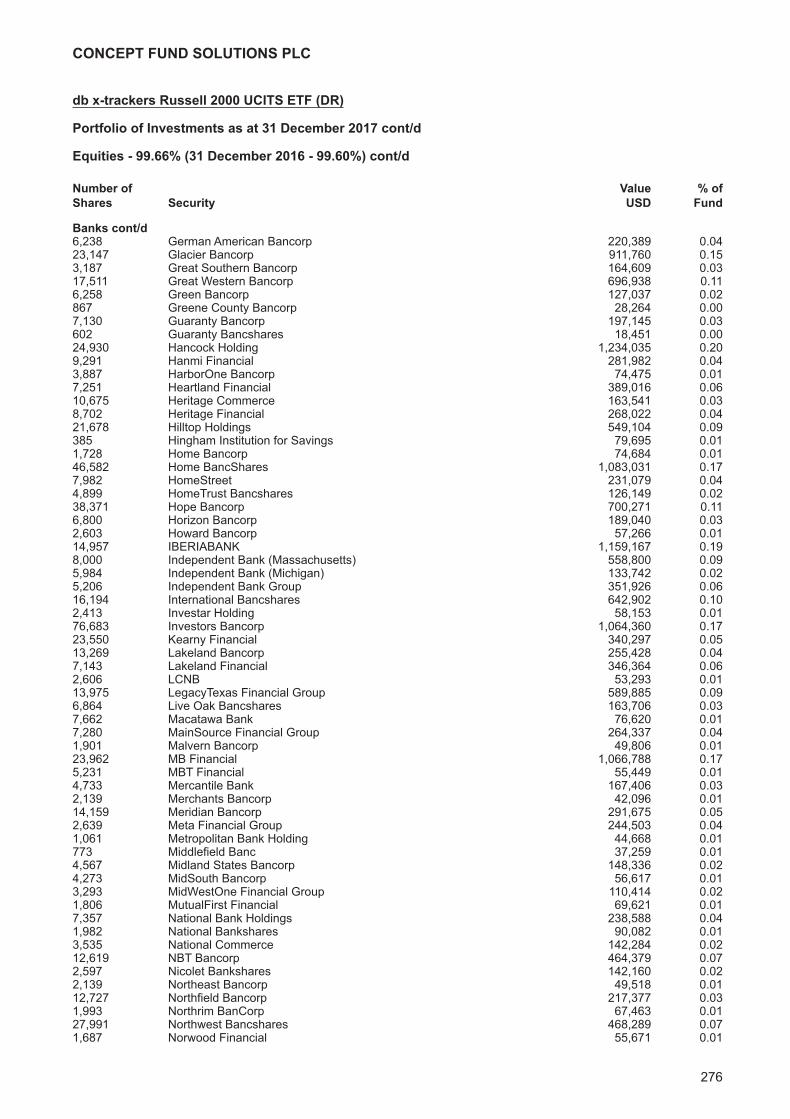
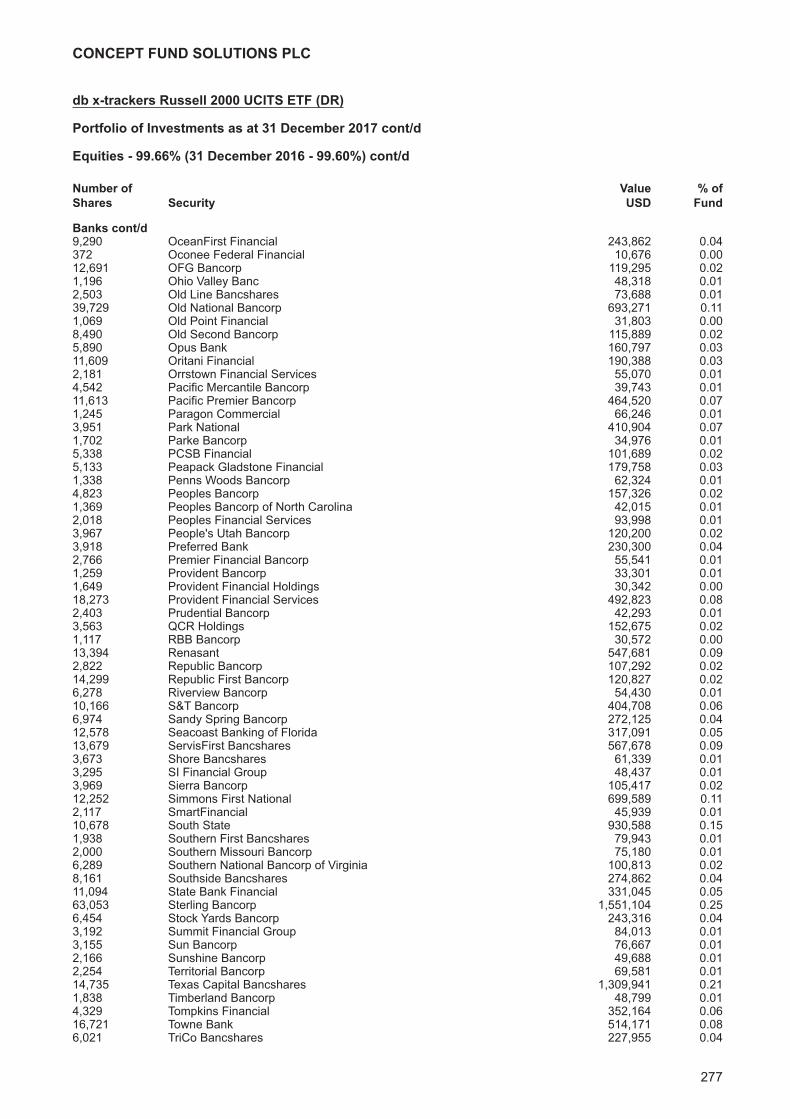
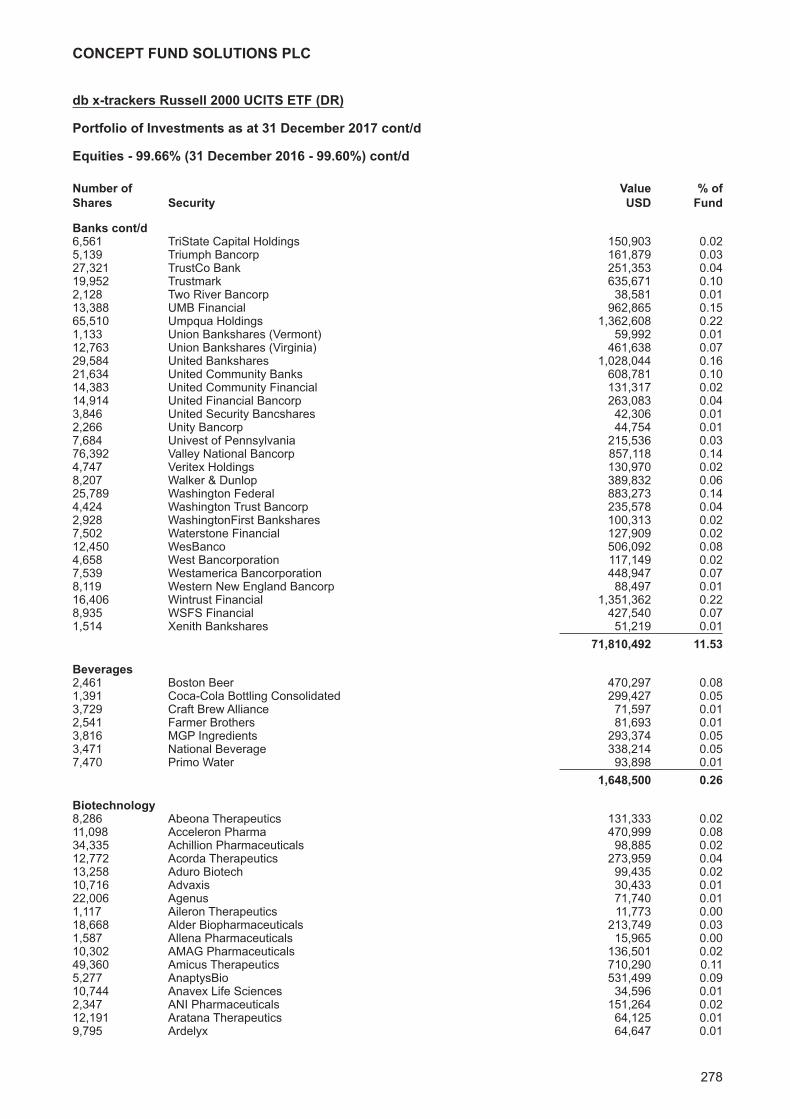
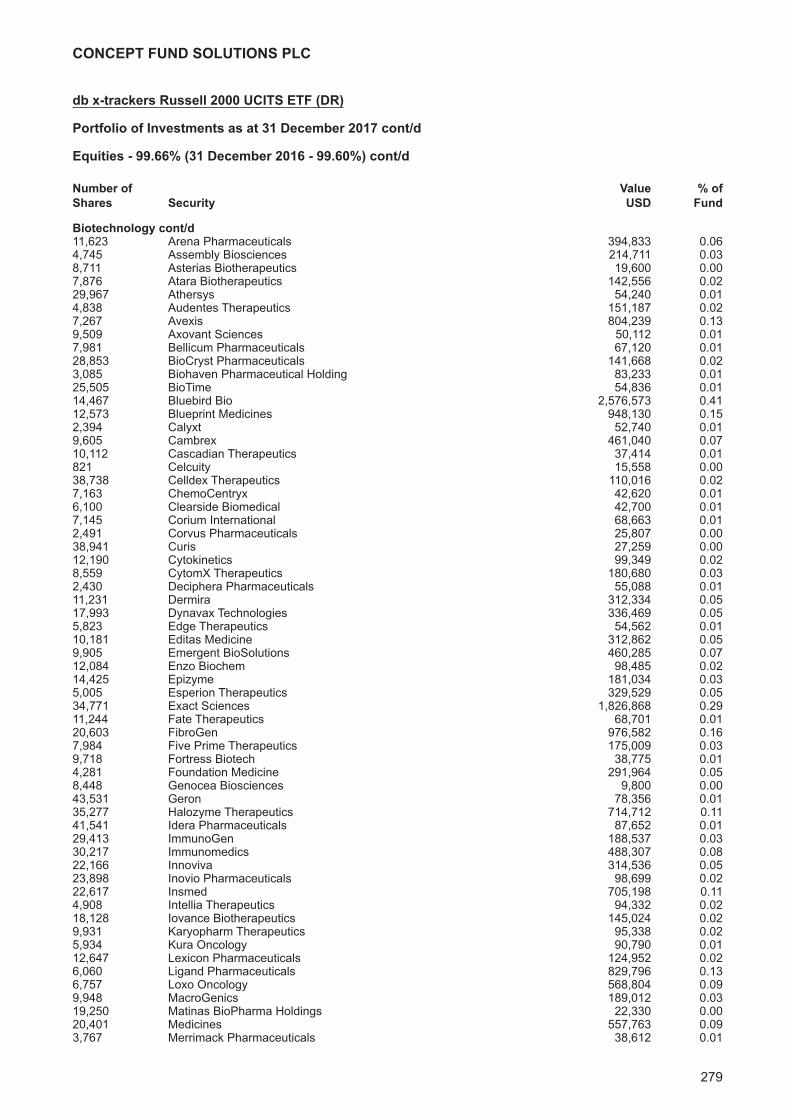
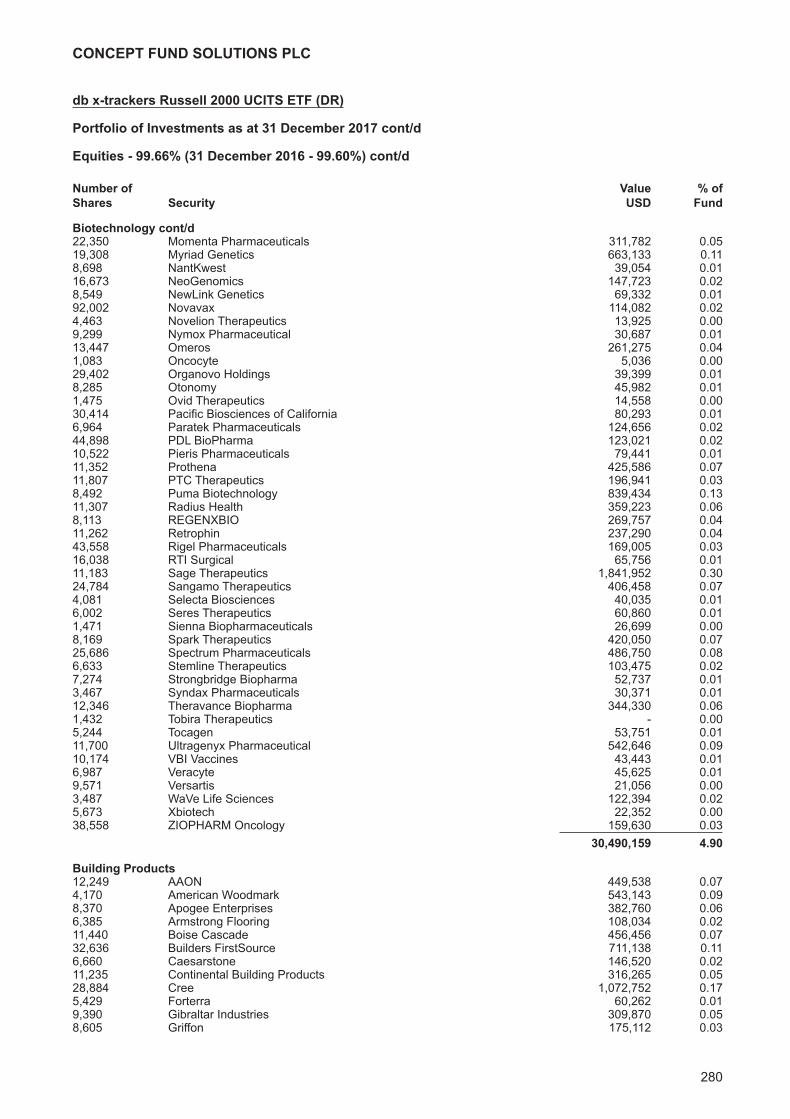
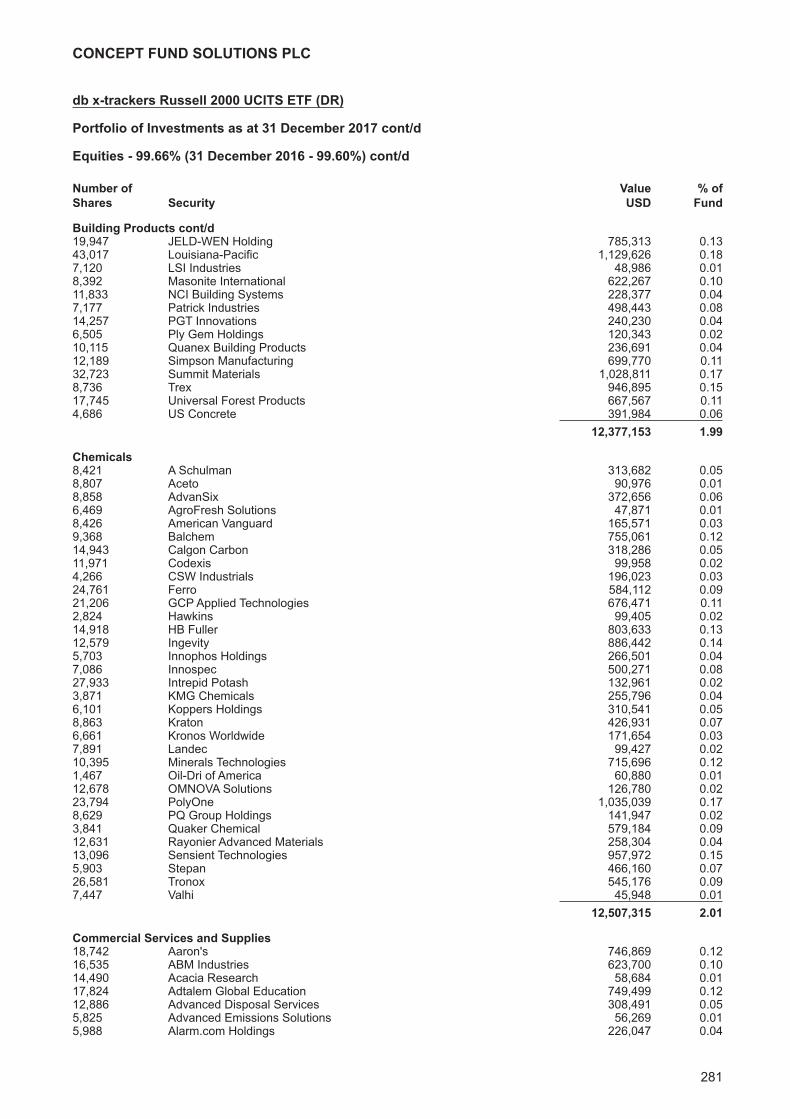
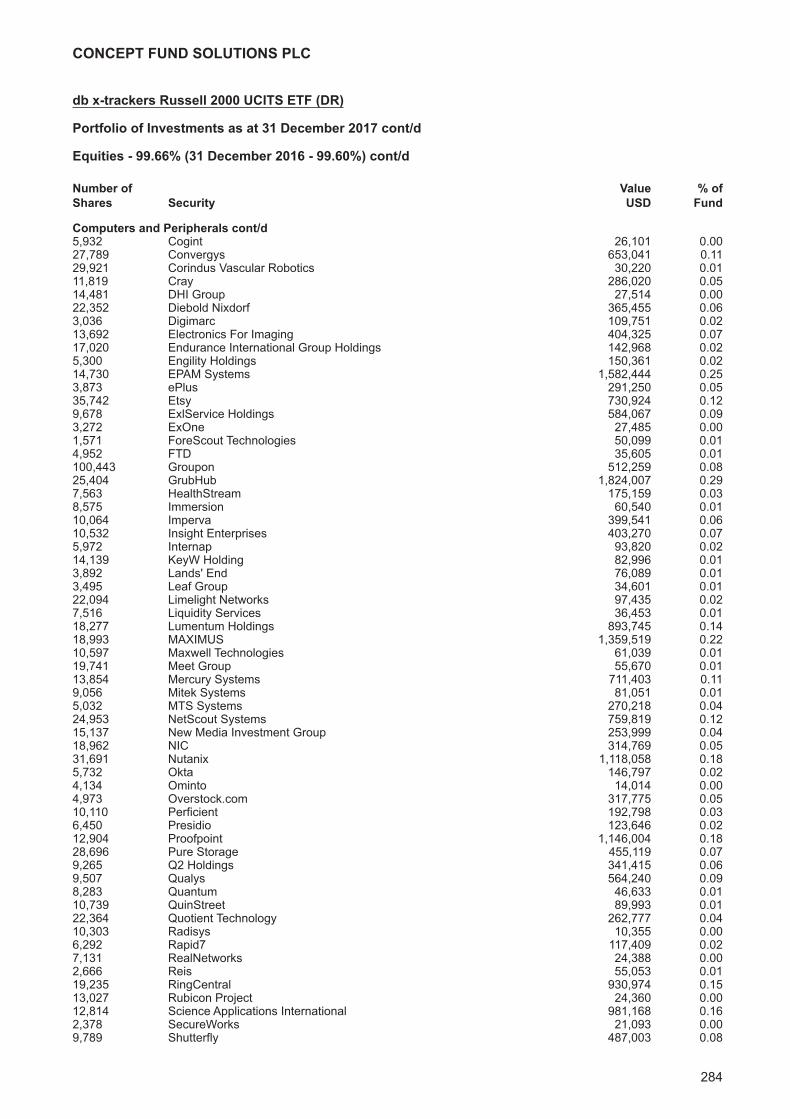
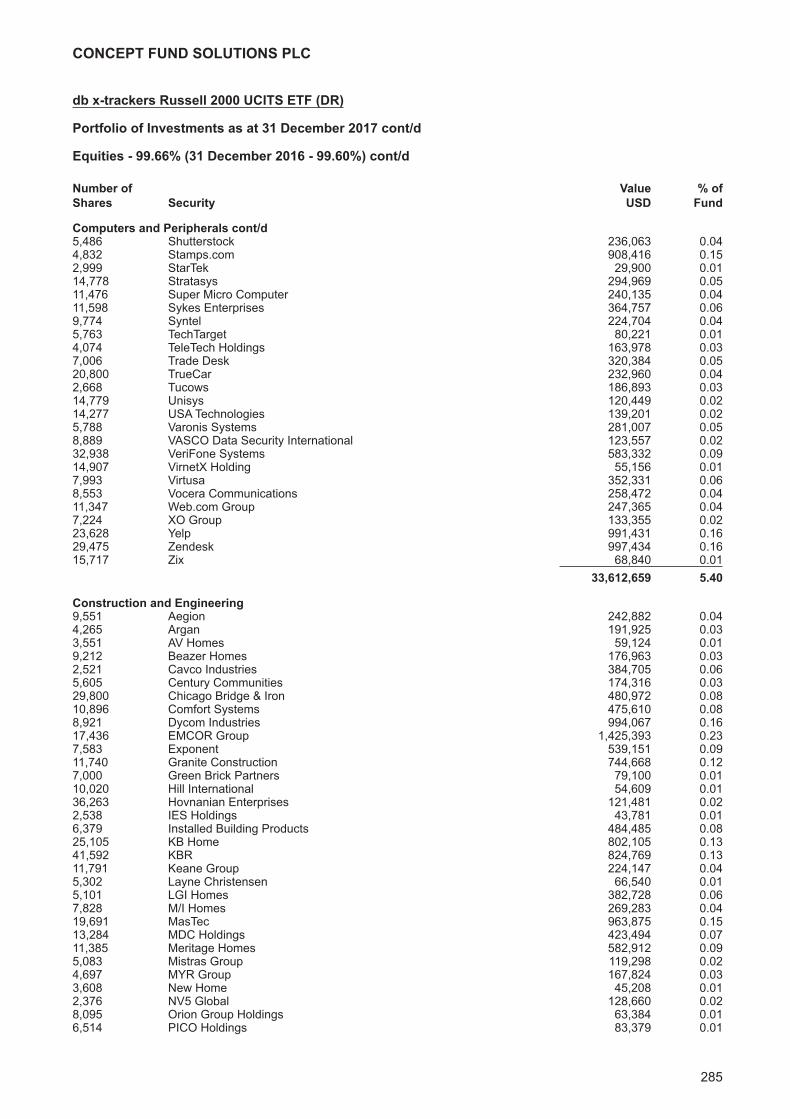
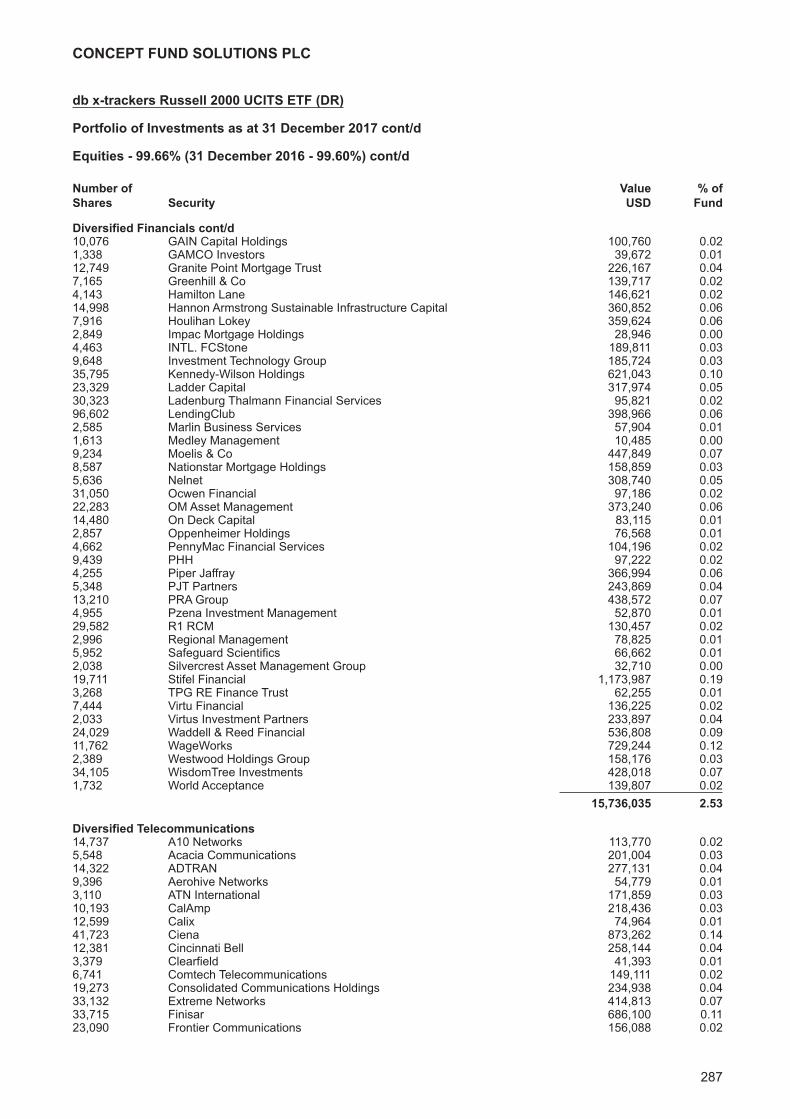
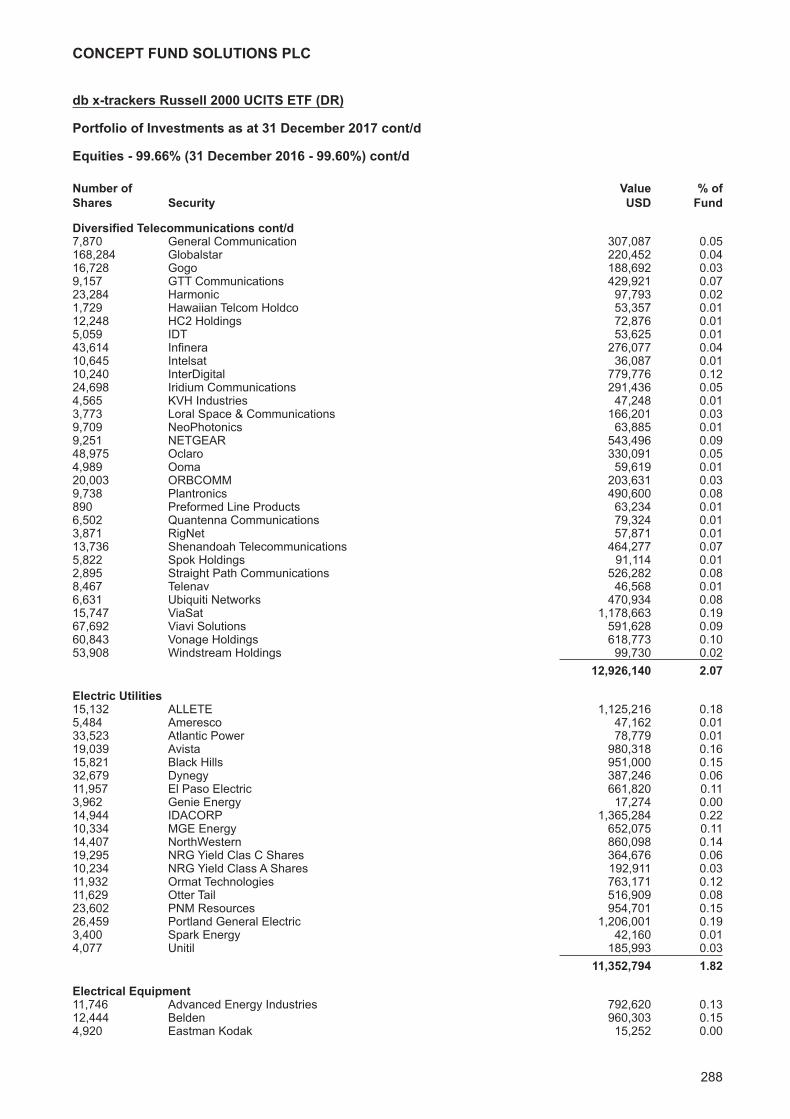
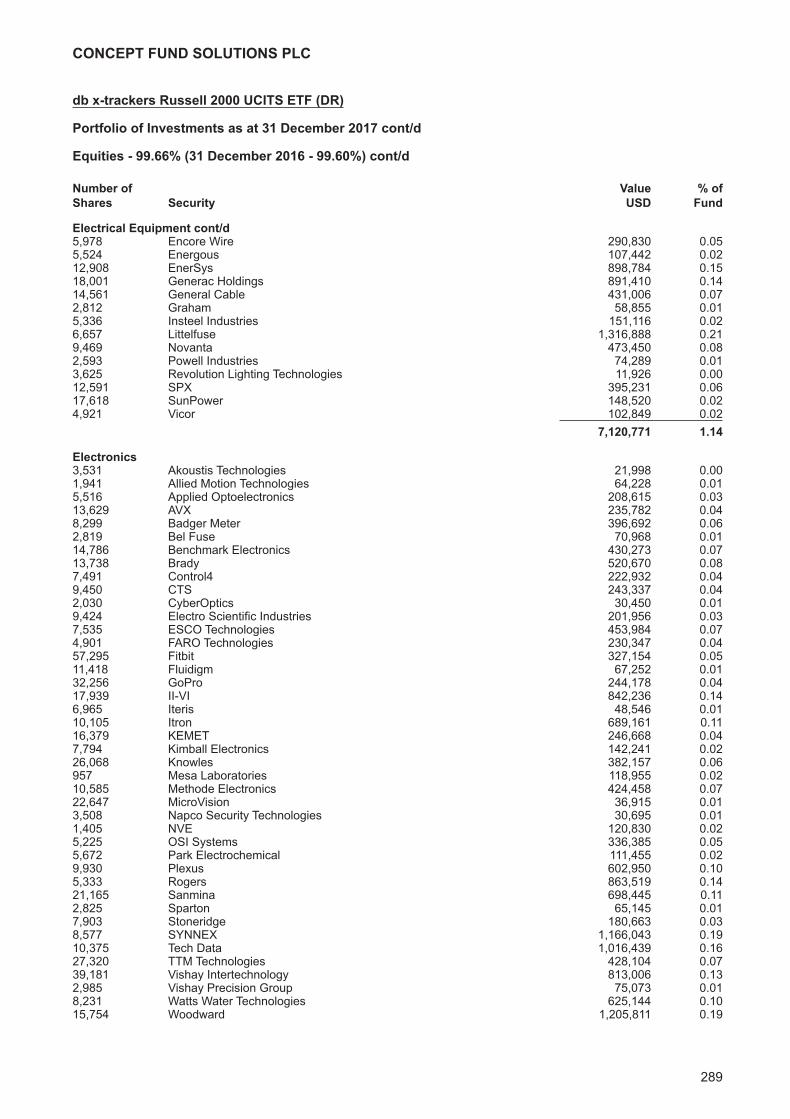
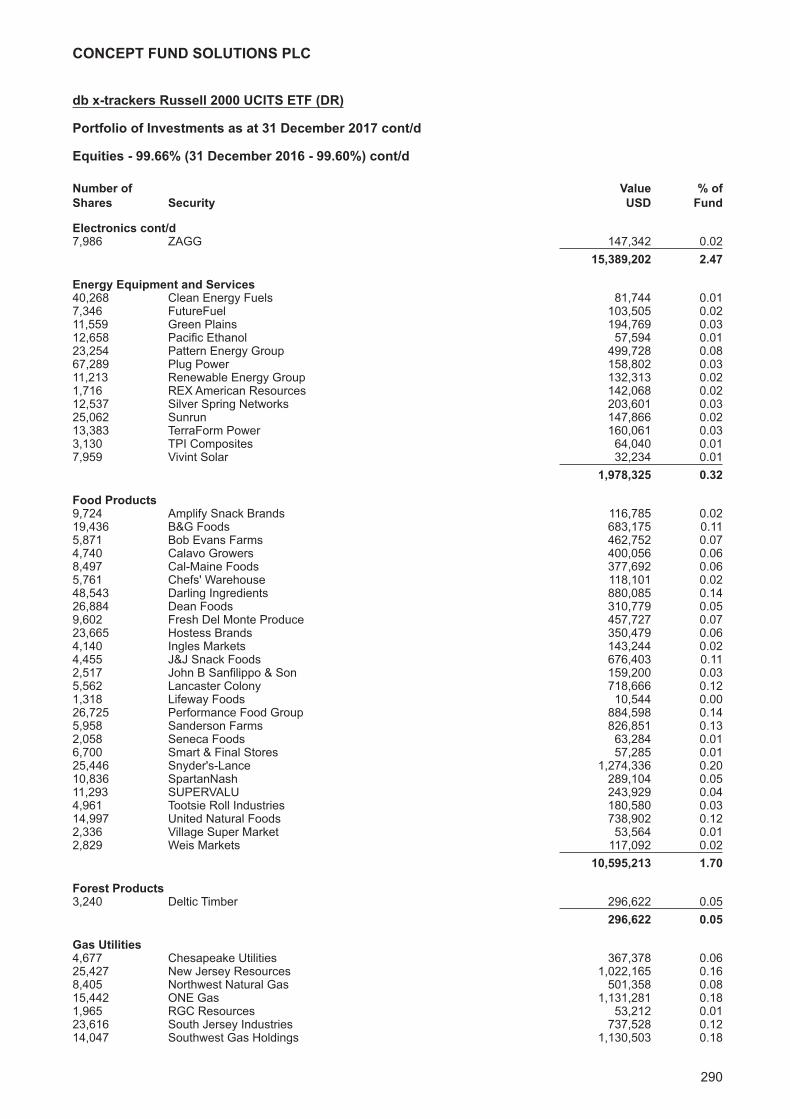
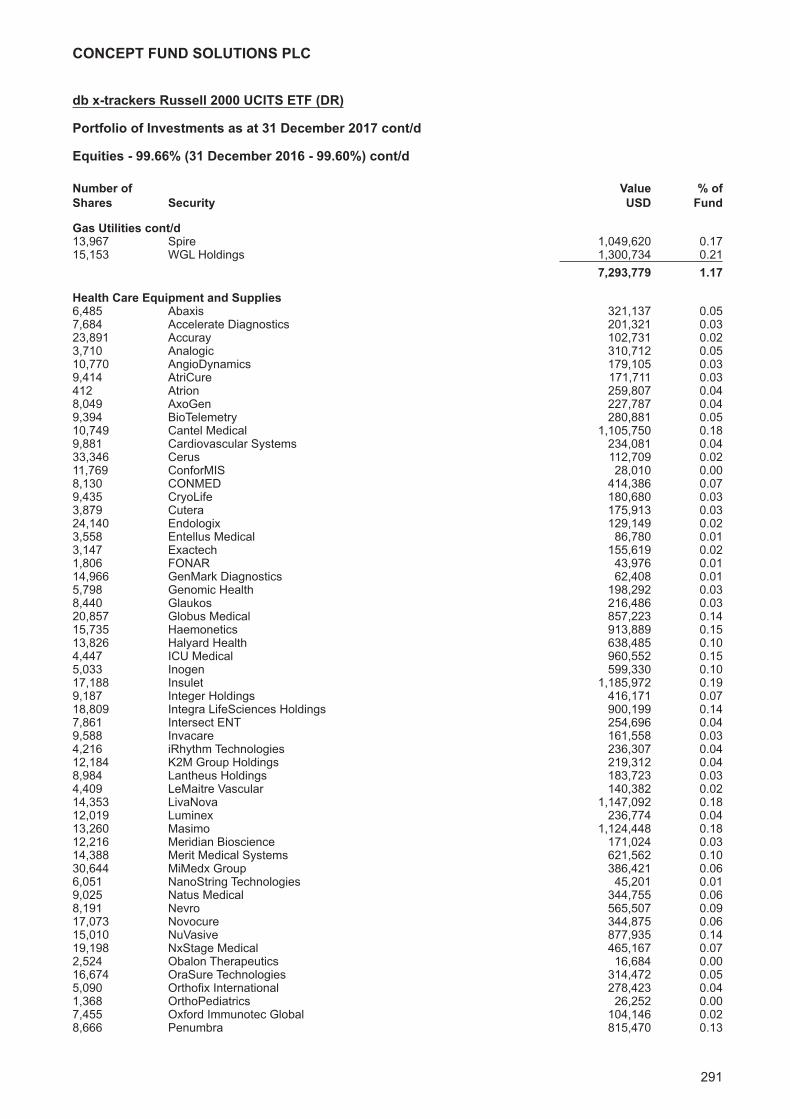
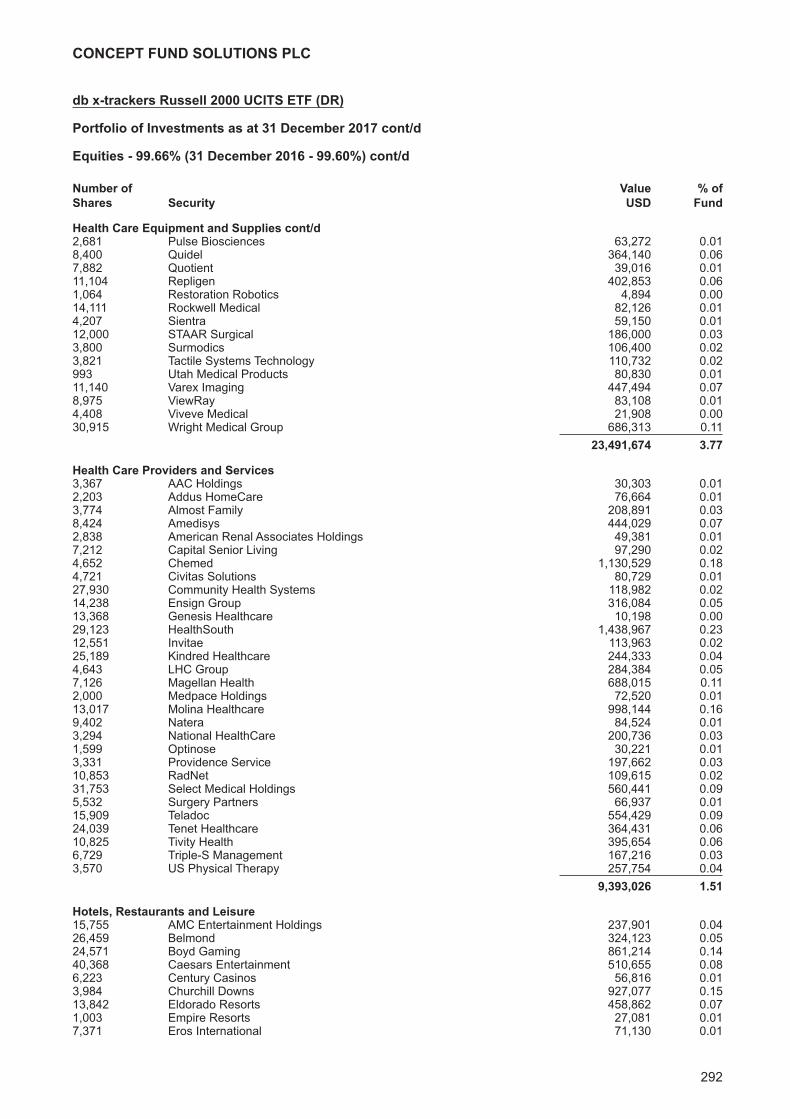
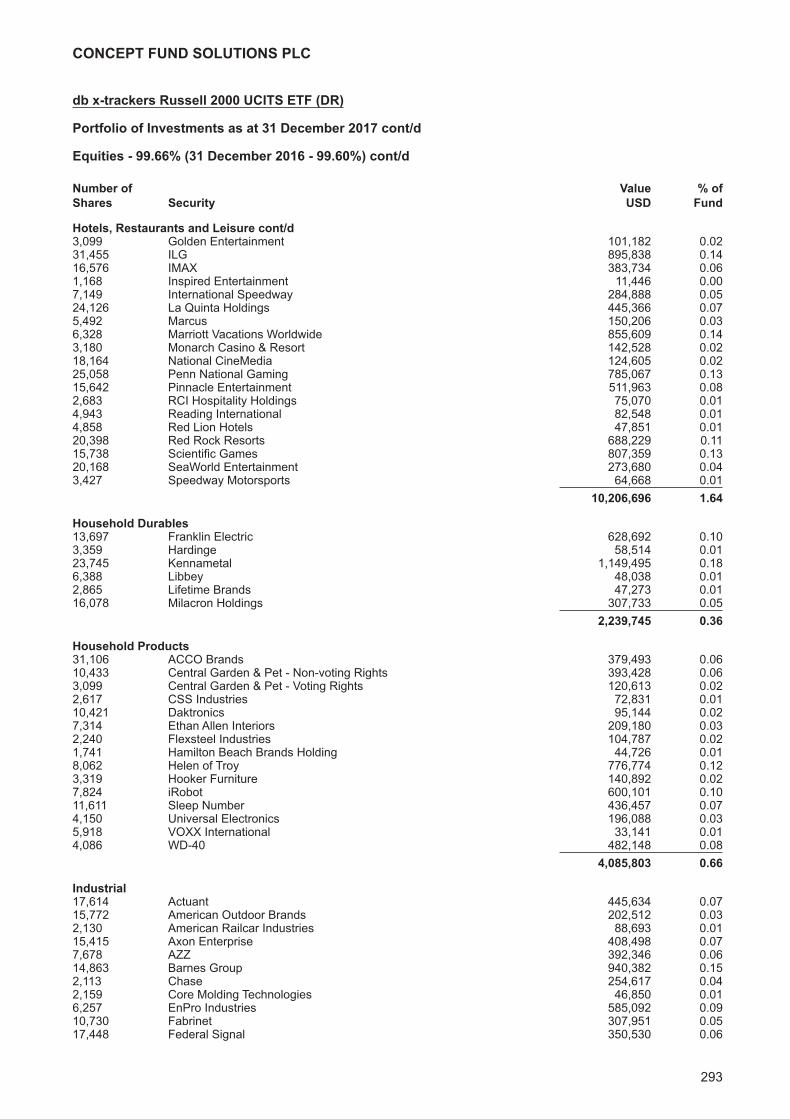
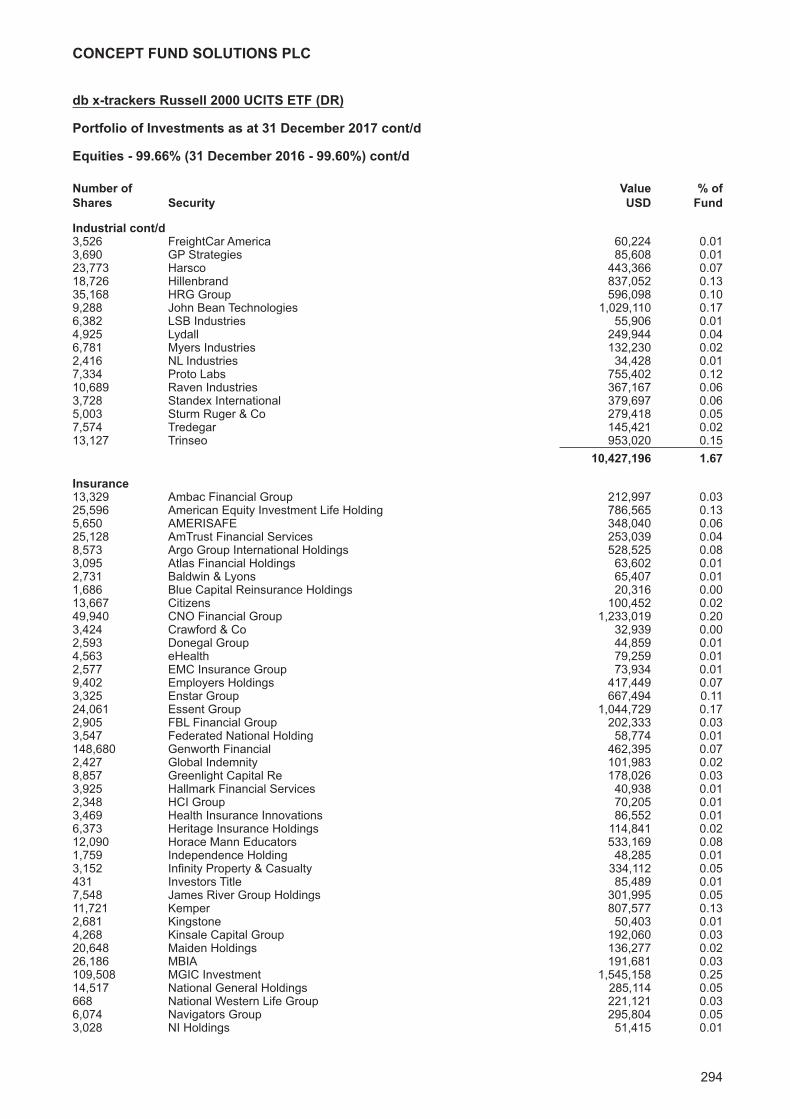
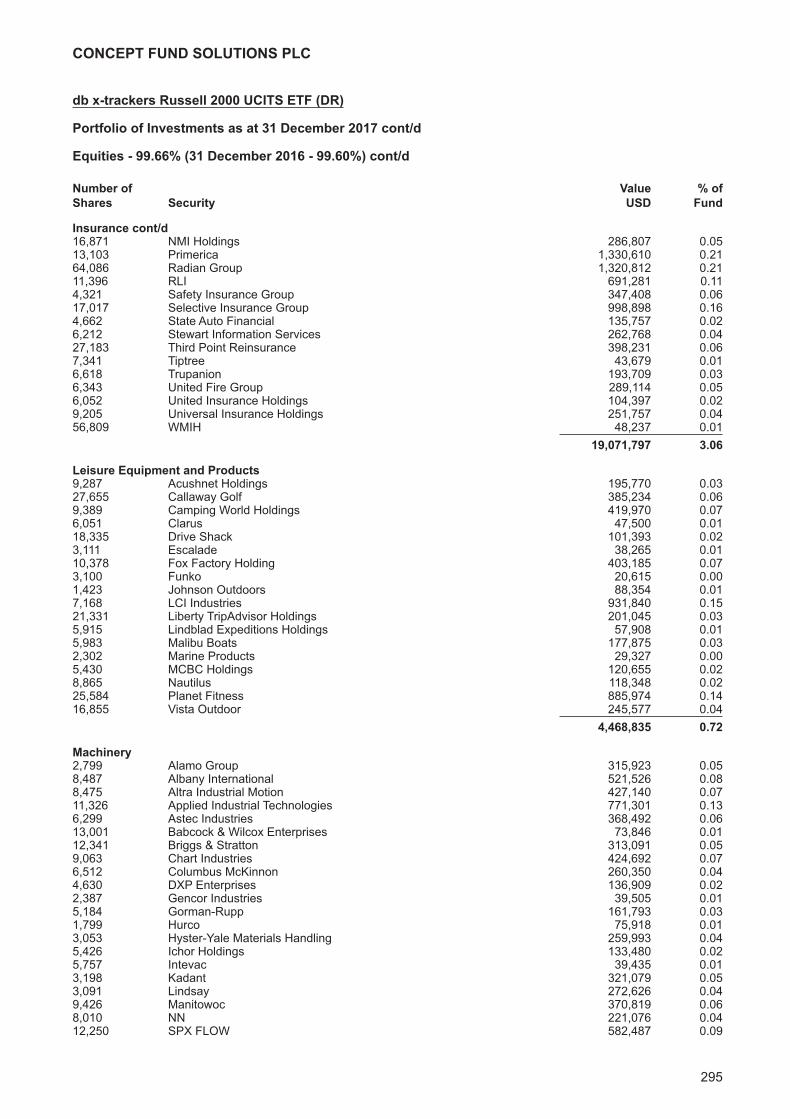
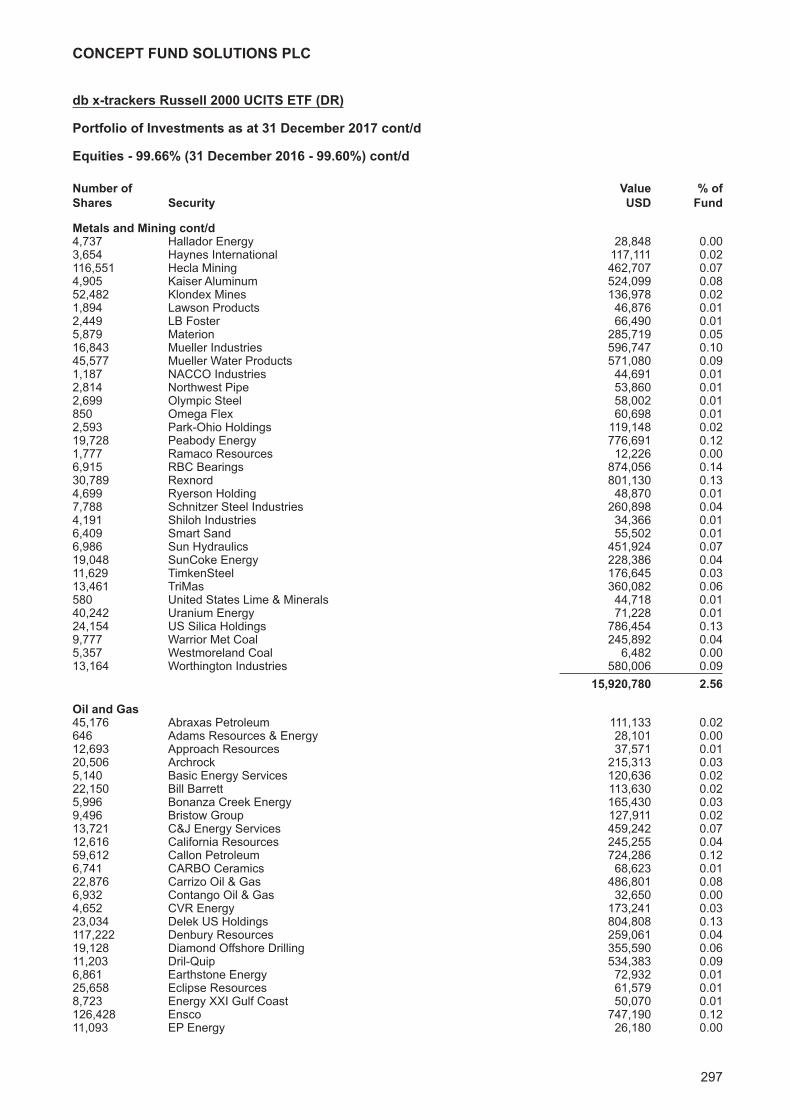
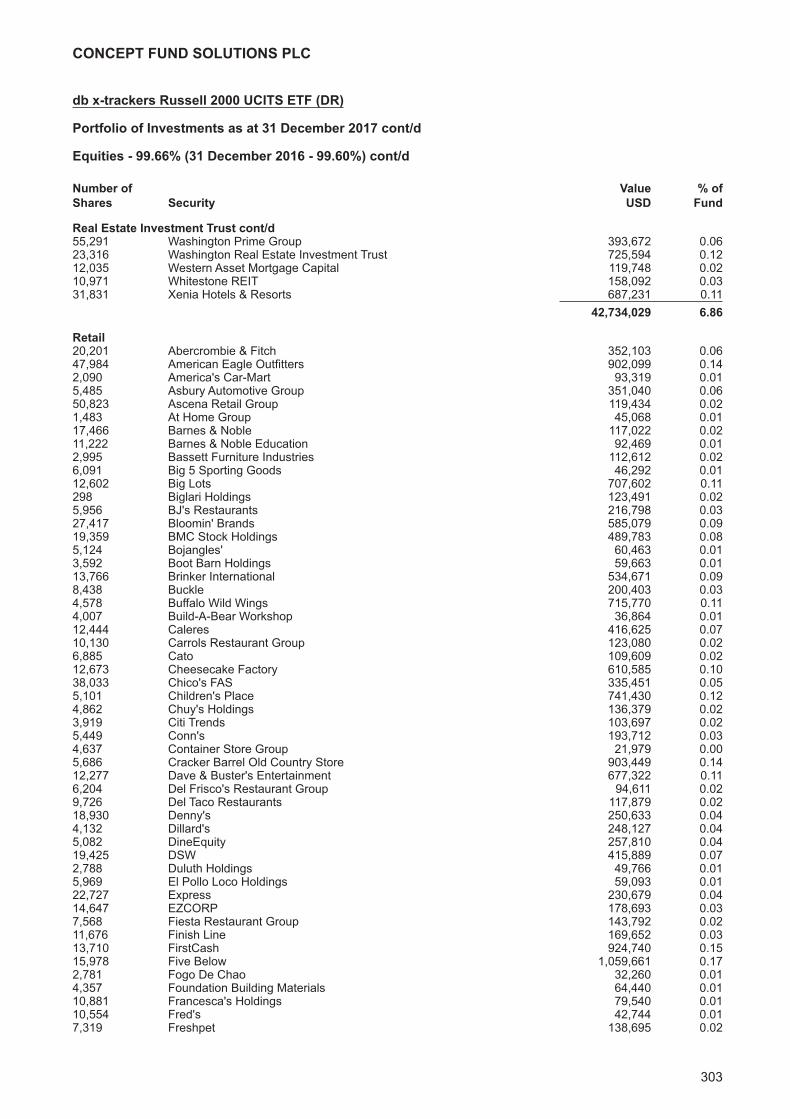
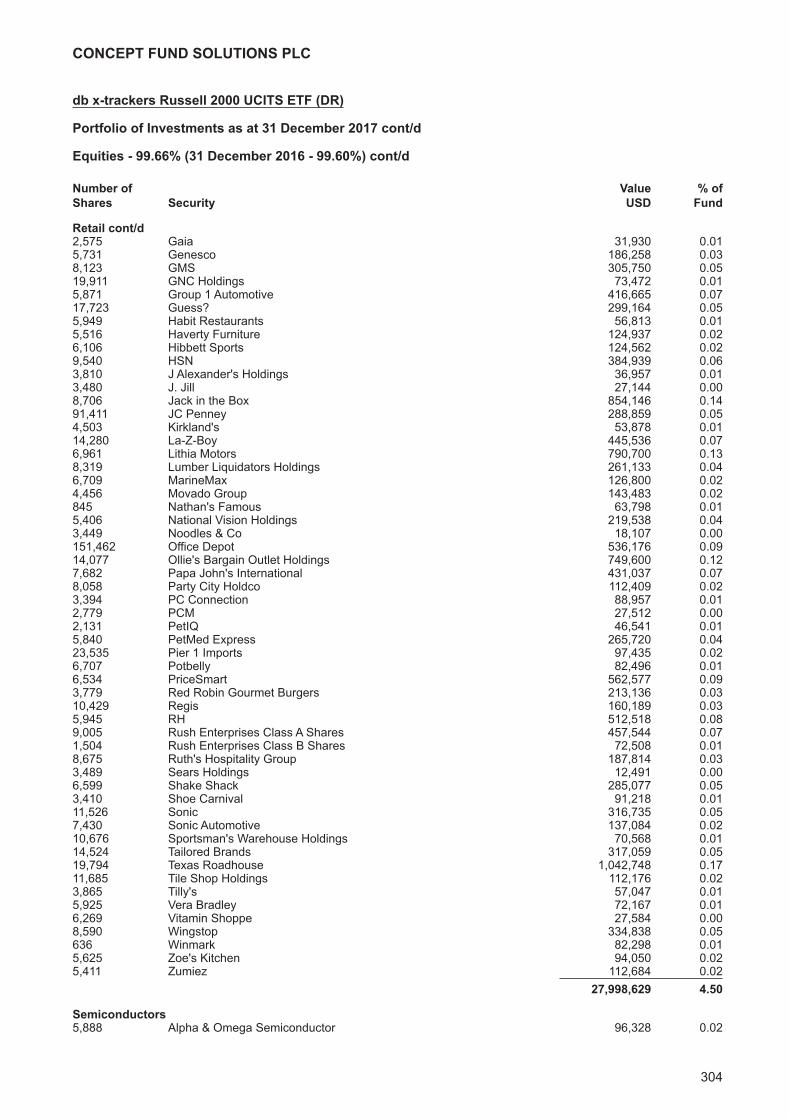
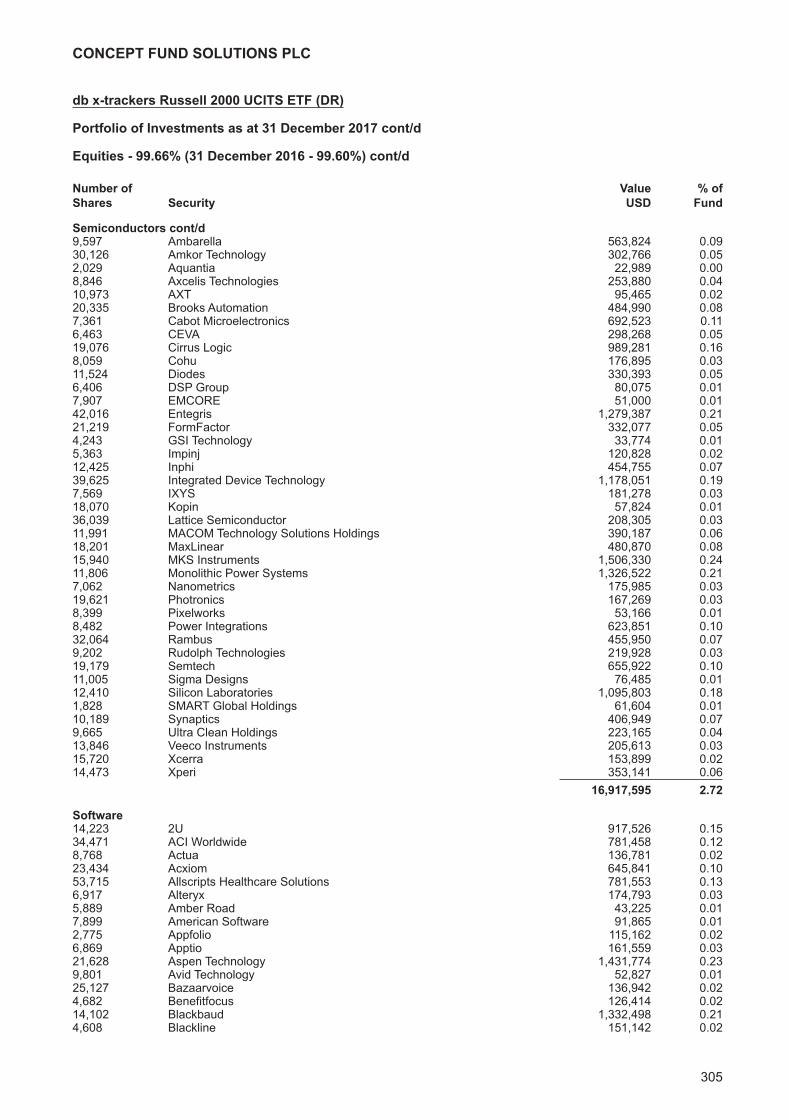
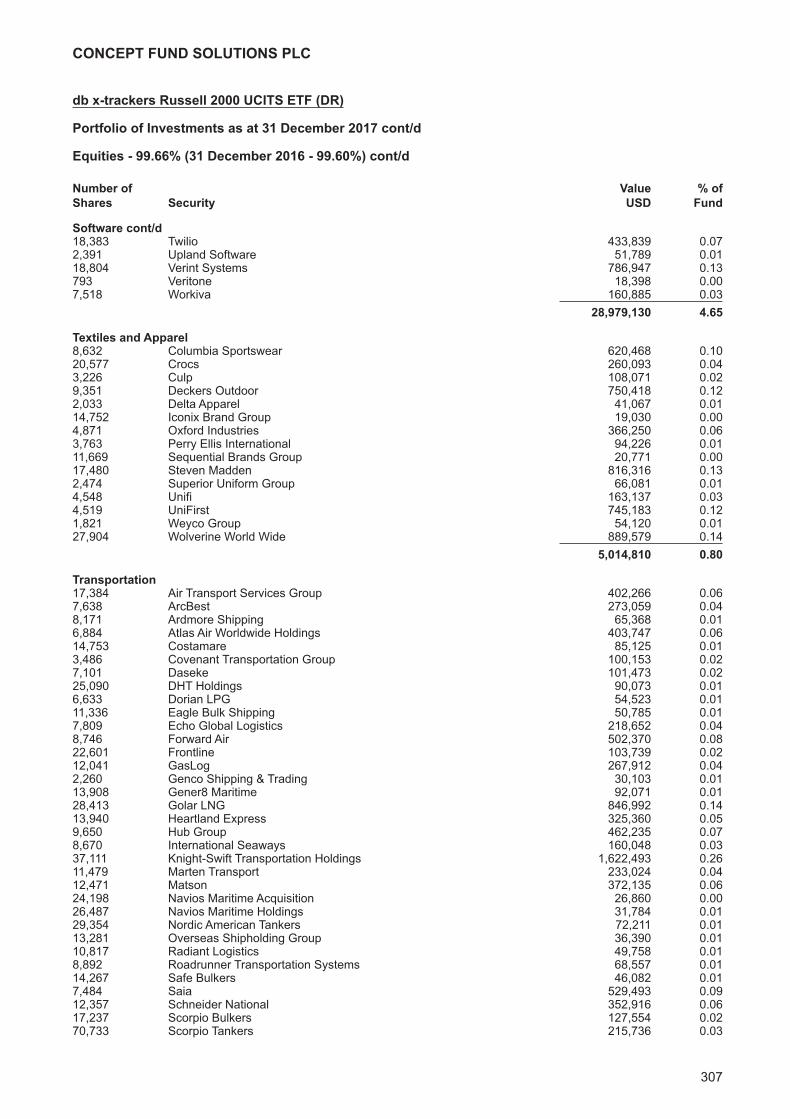
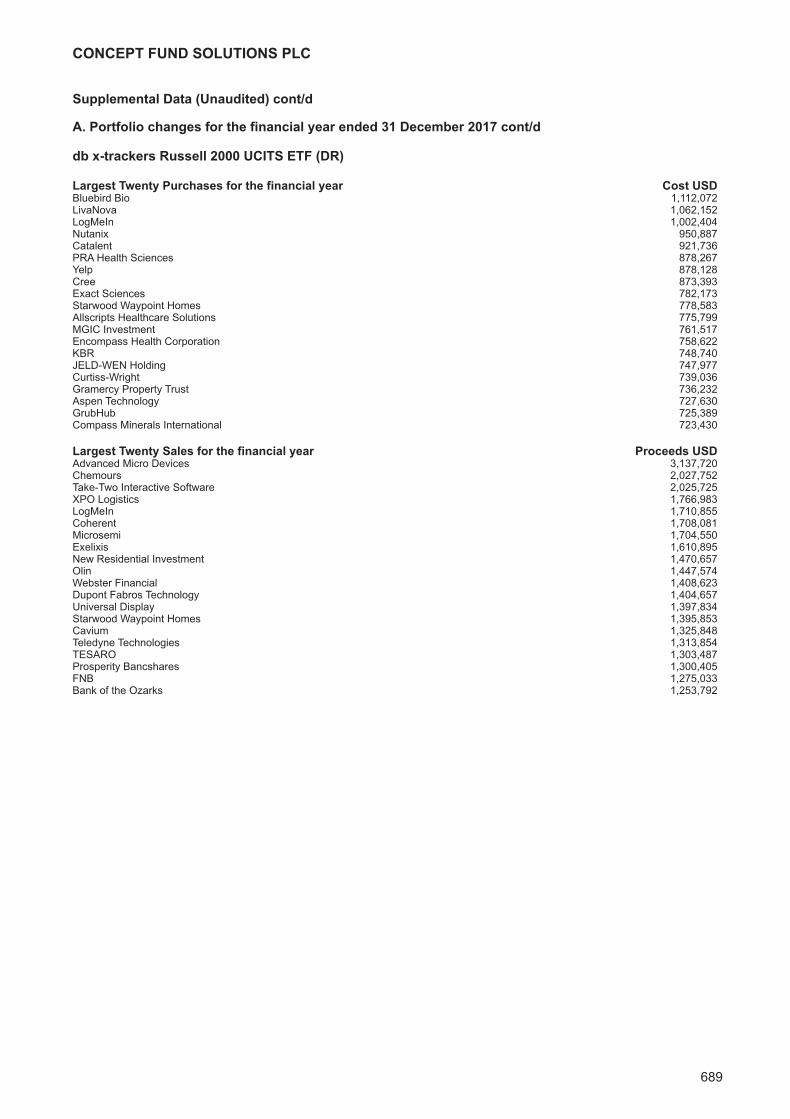
db x-trackers Russell 2000 UCITS ETF (DR)Investment Manager’s Report 272Portfolio of Investments 273
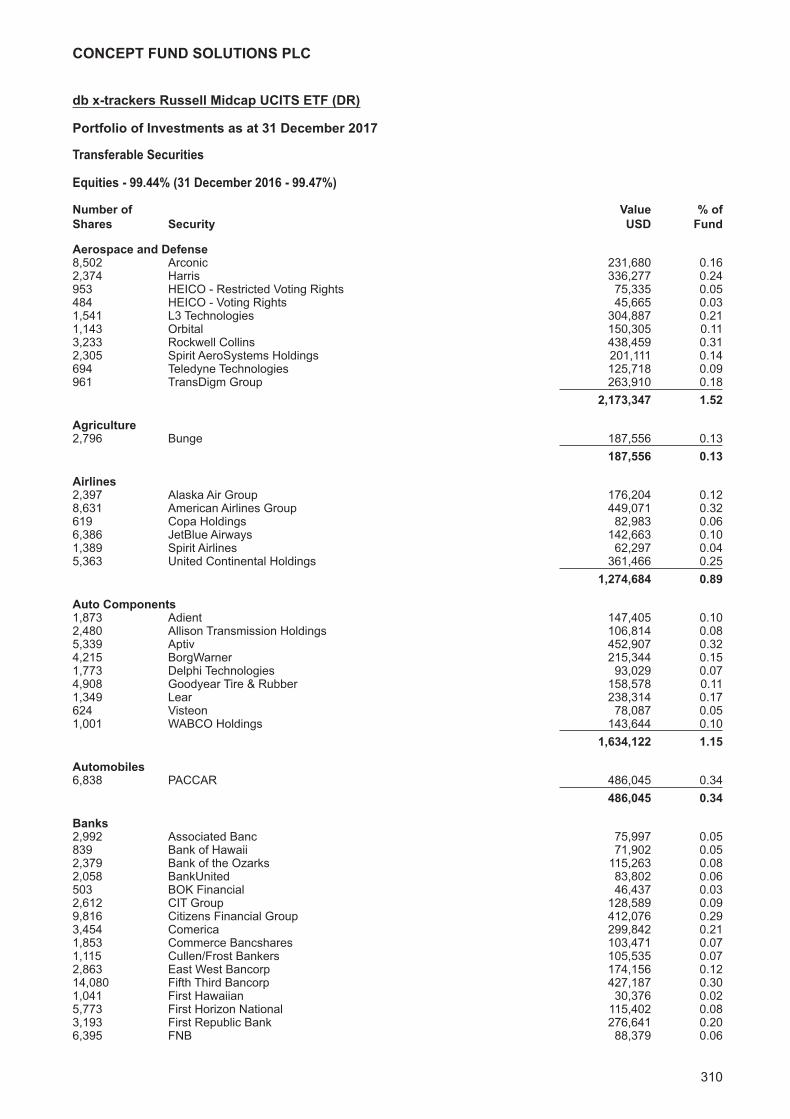
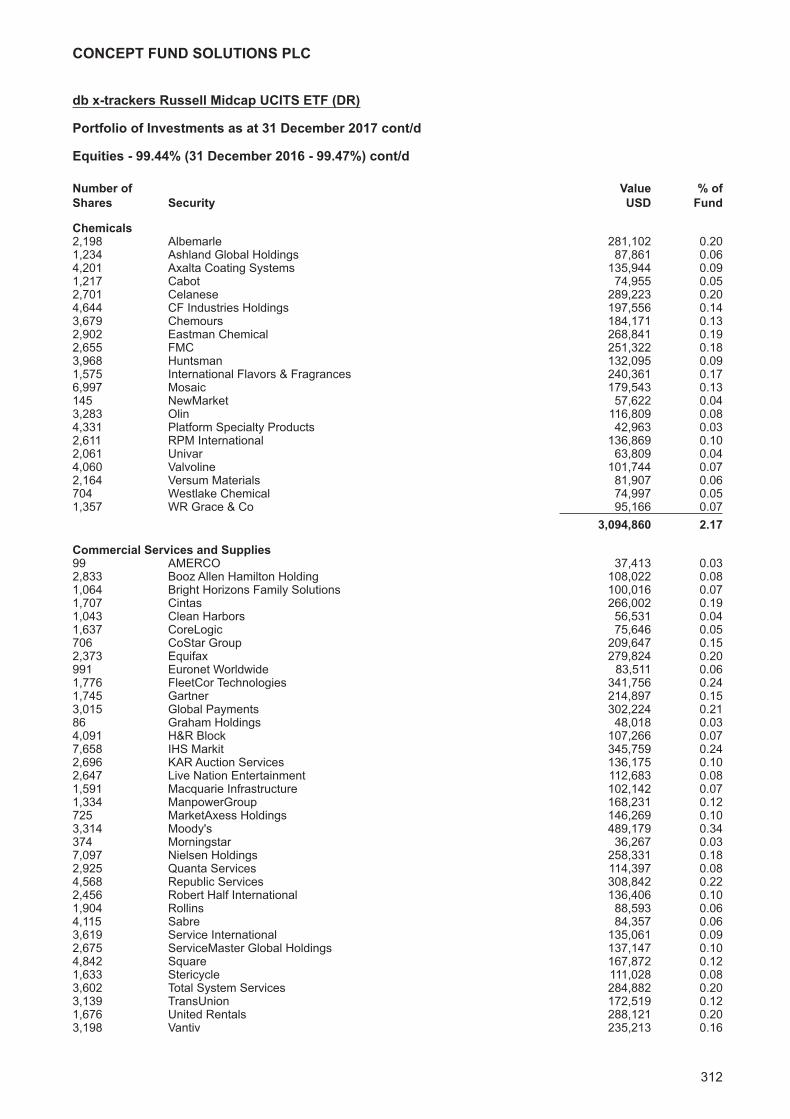
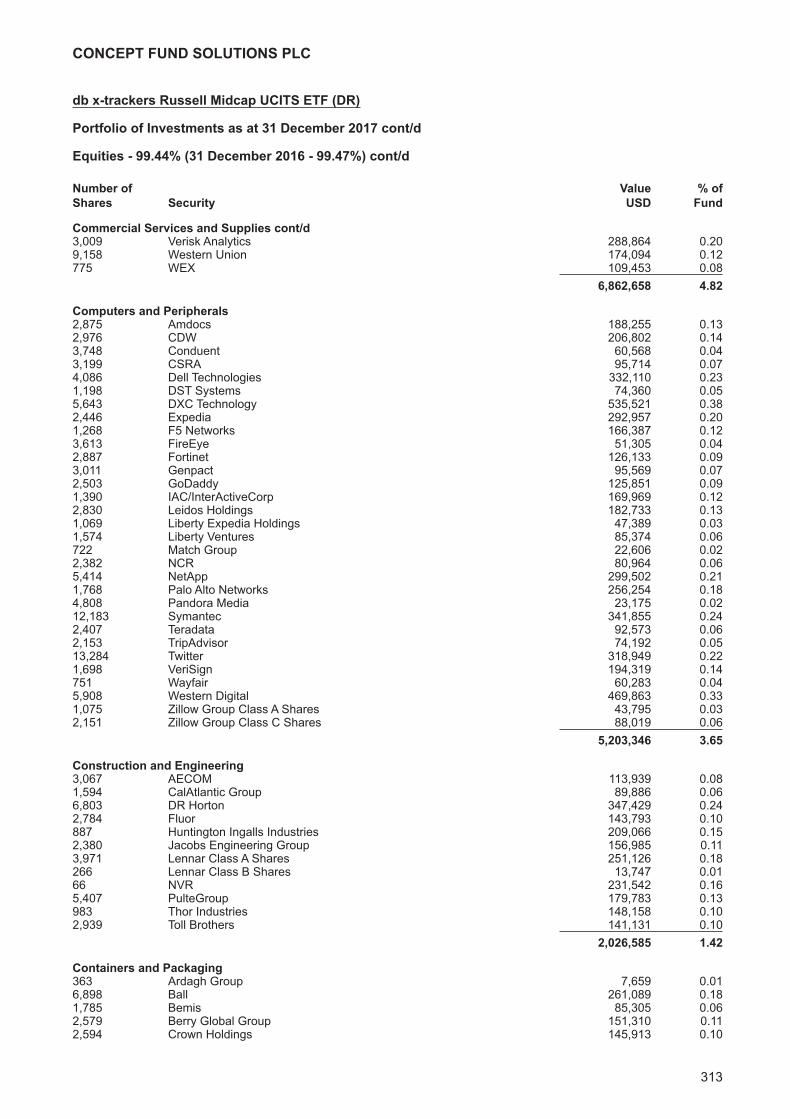
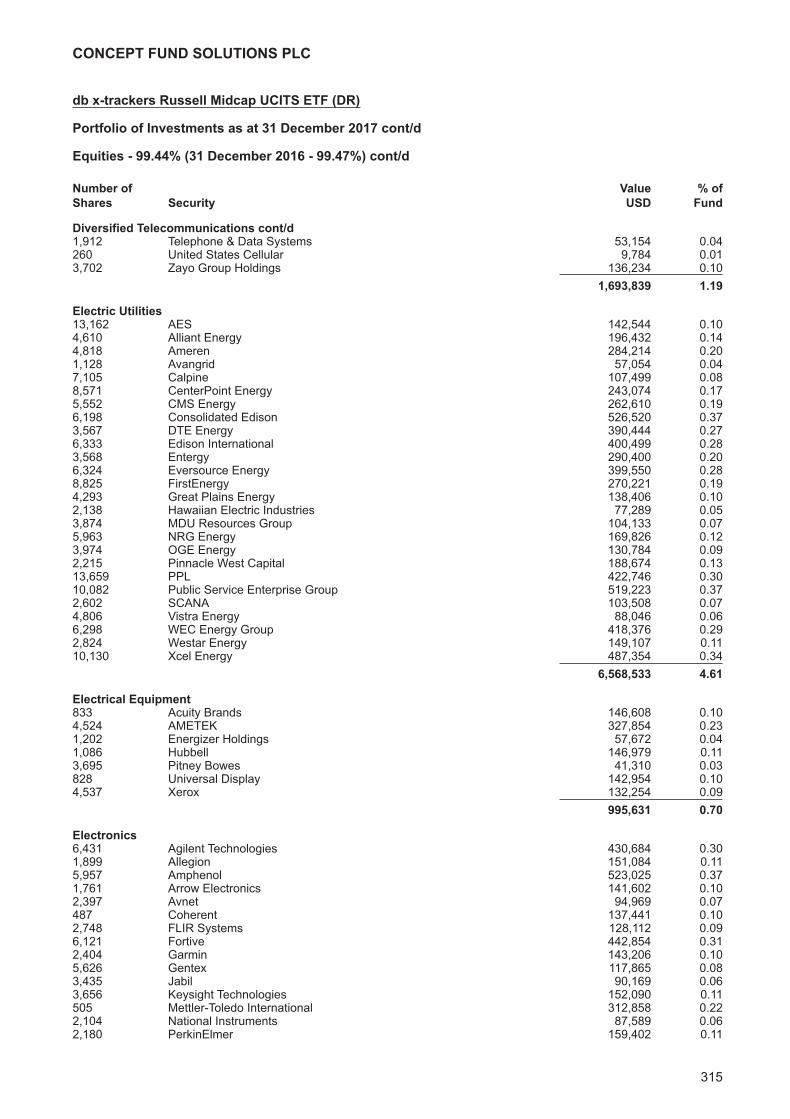
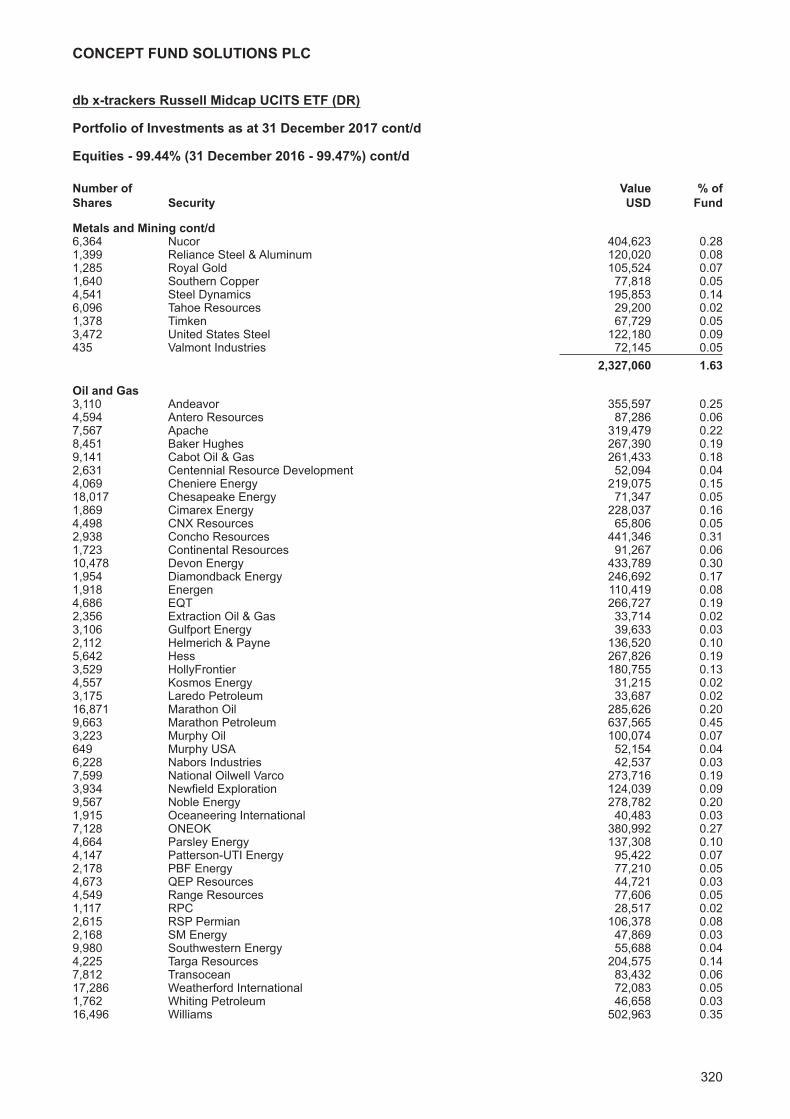
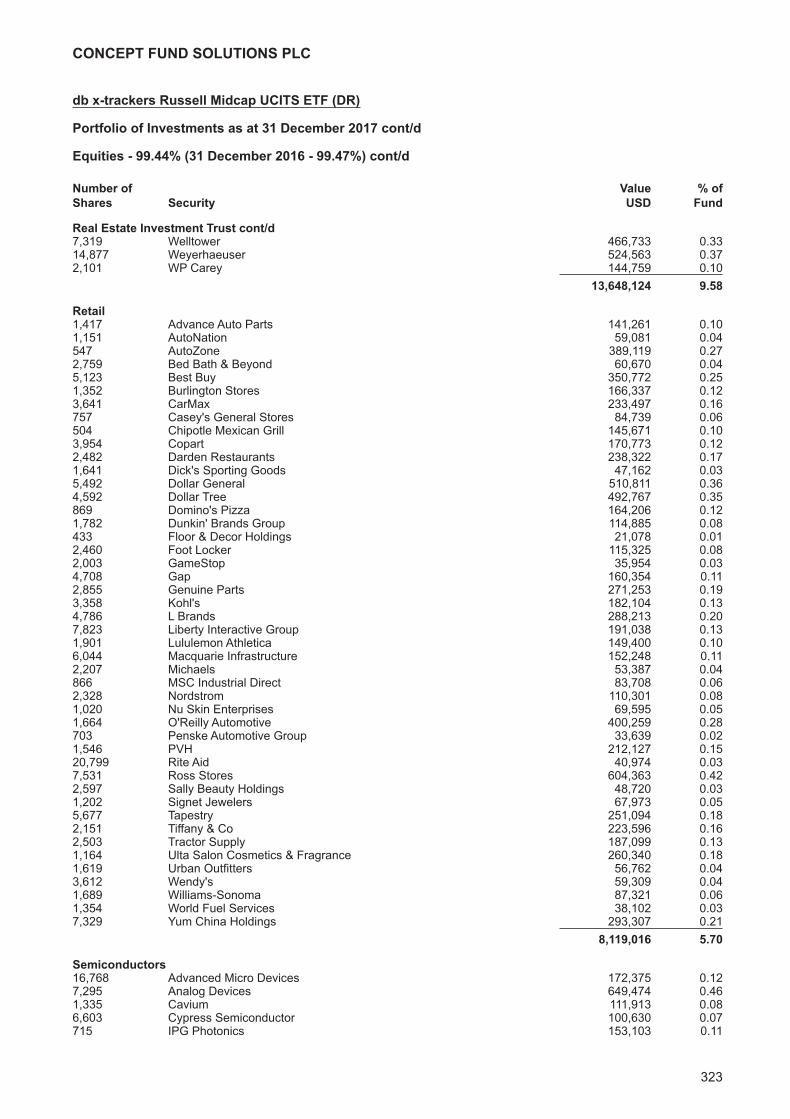
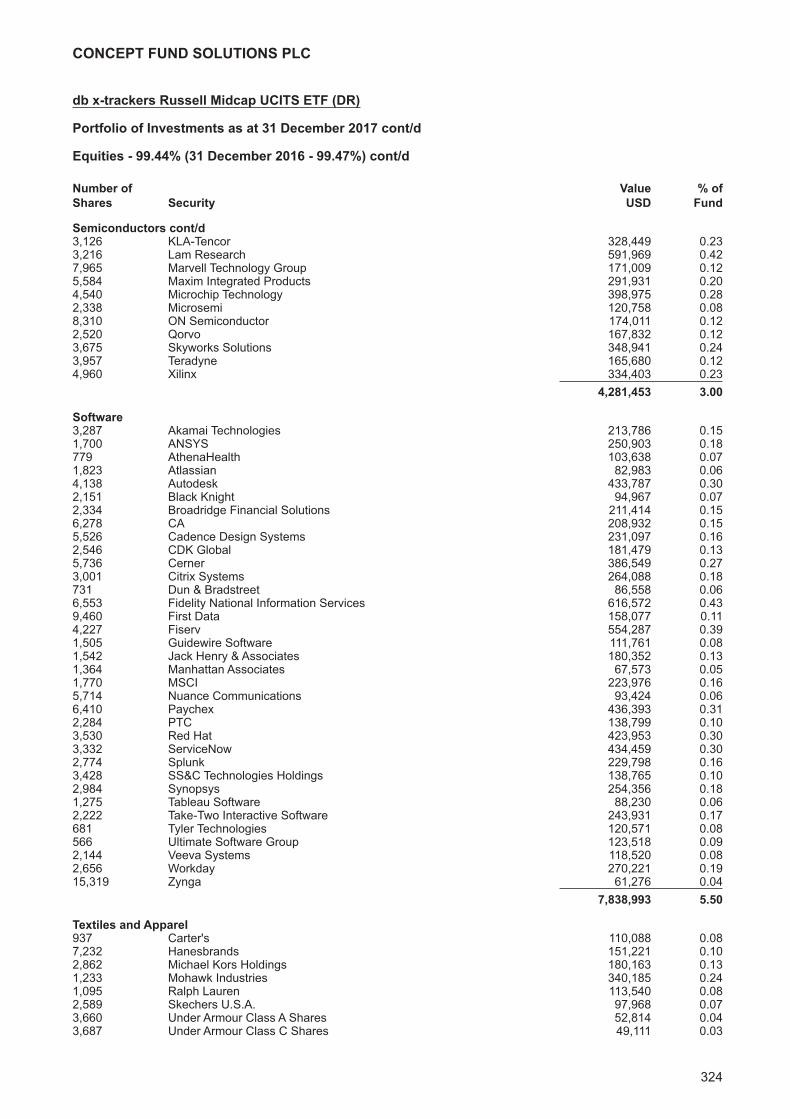
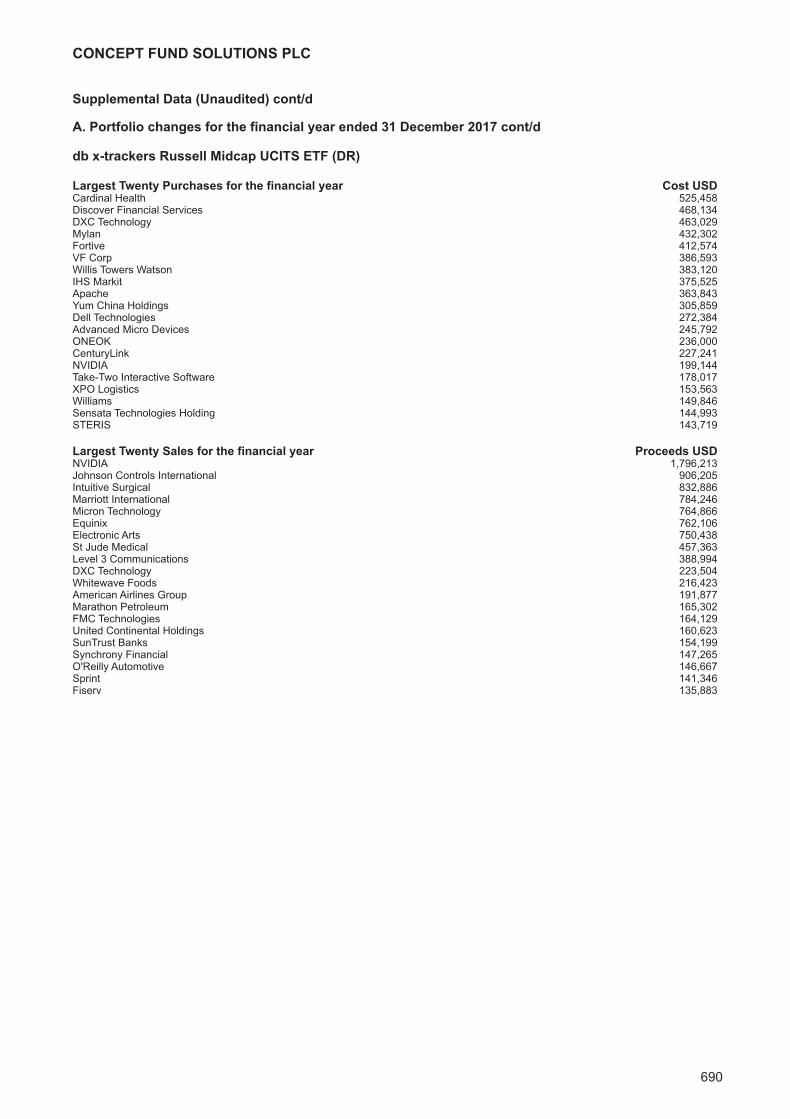
db x-trackers Russell Midcap UCITS ETF (DR)Investment Manager’s Report 309Portfolio of Investments 310
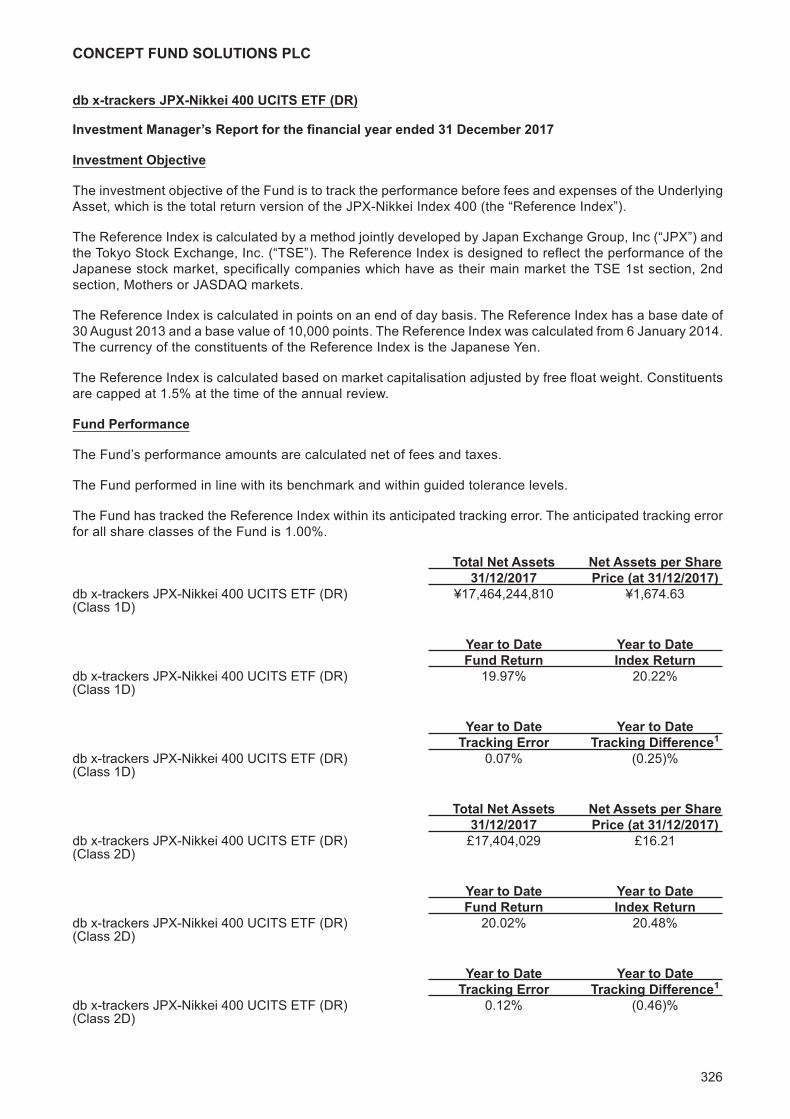
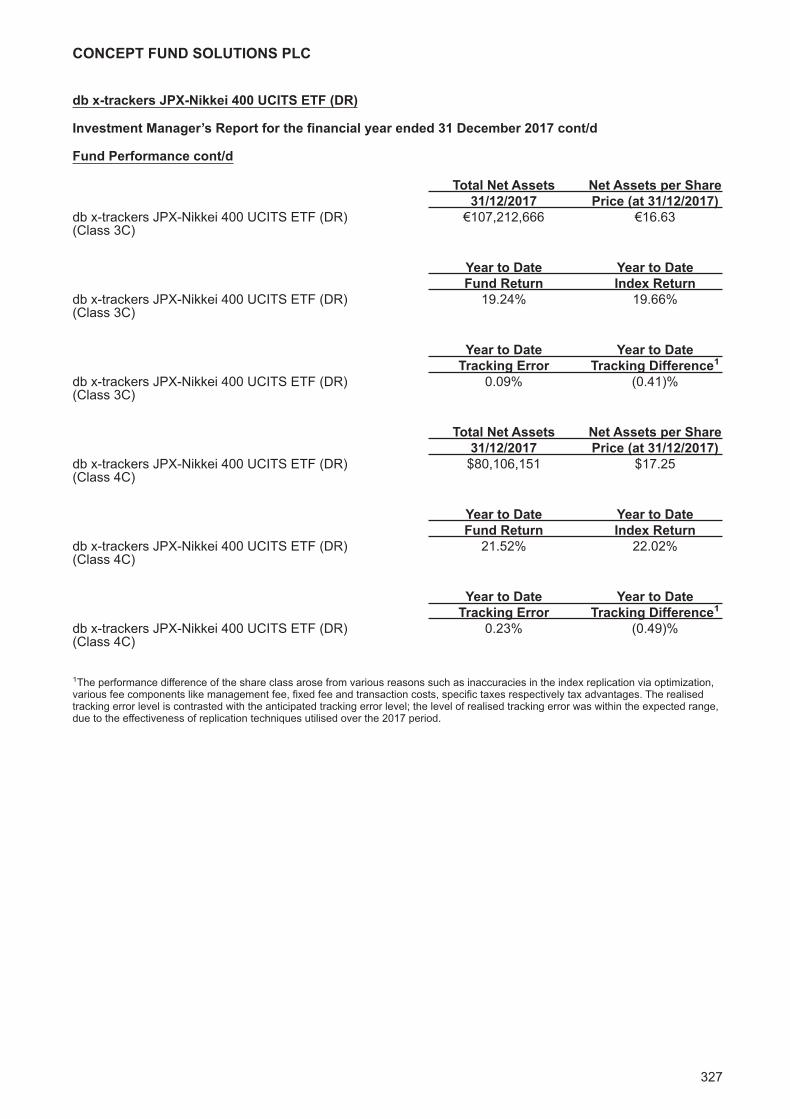
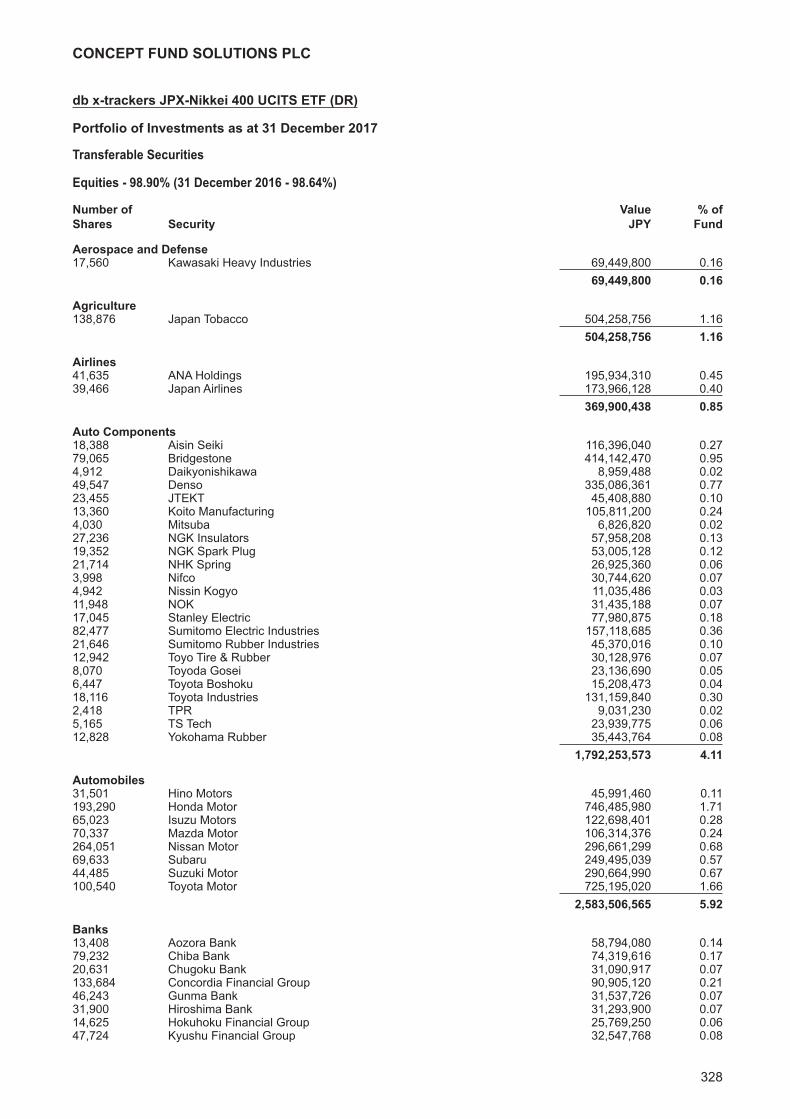
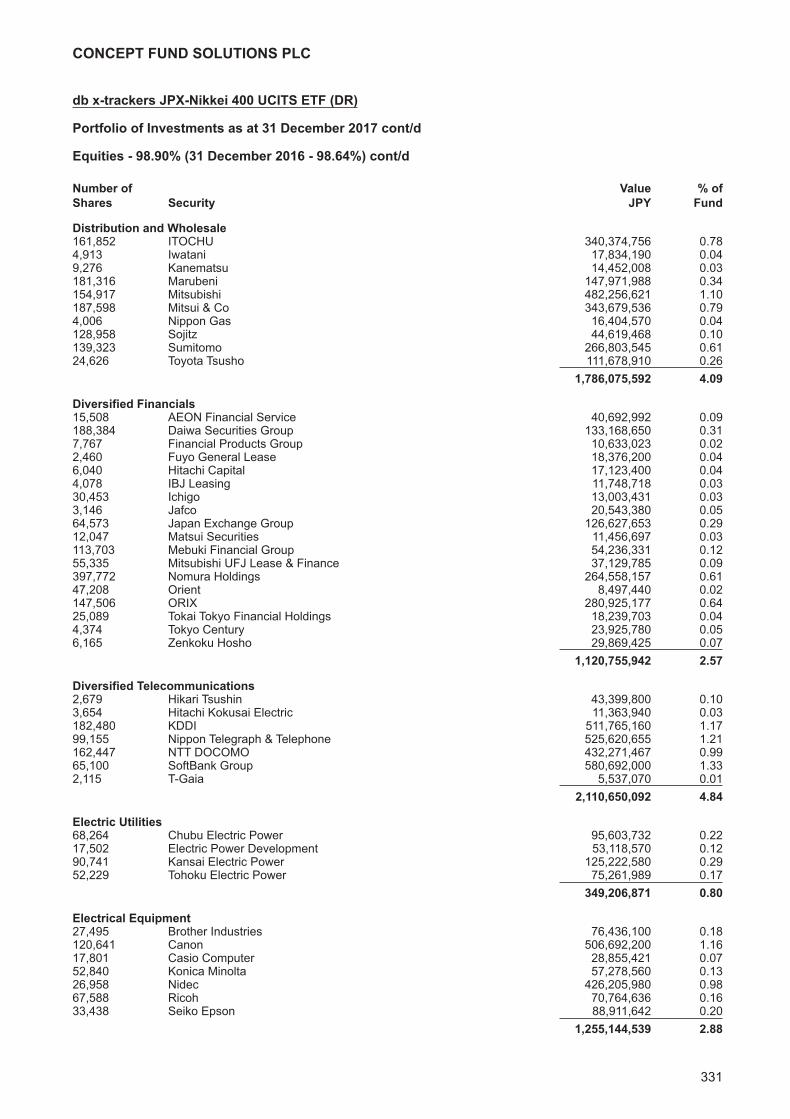
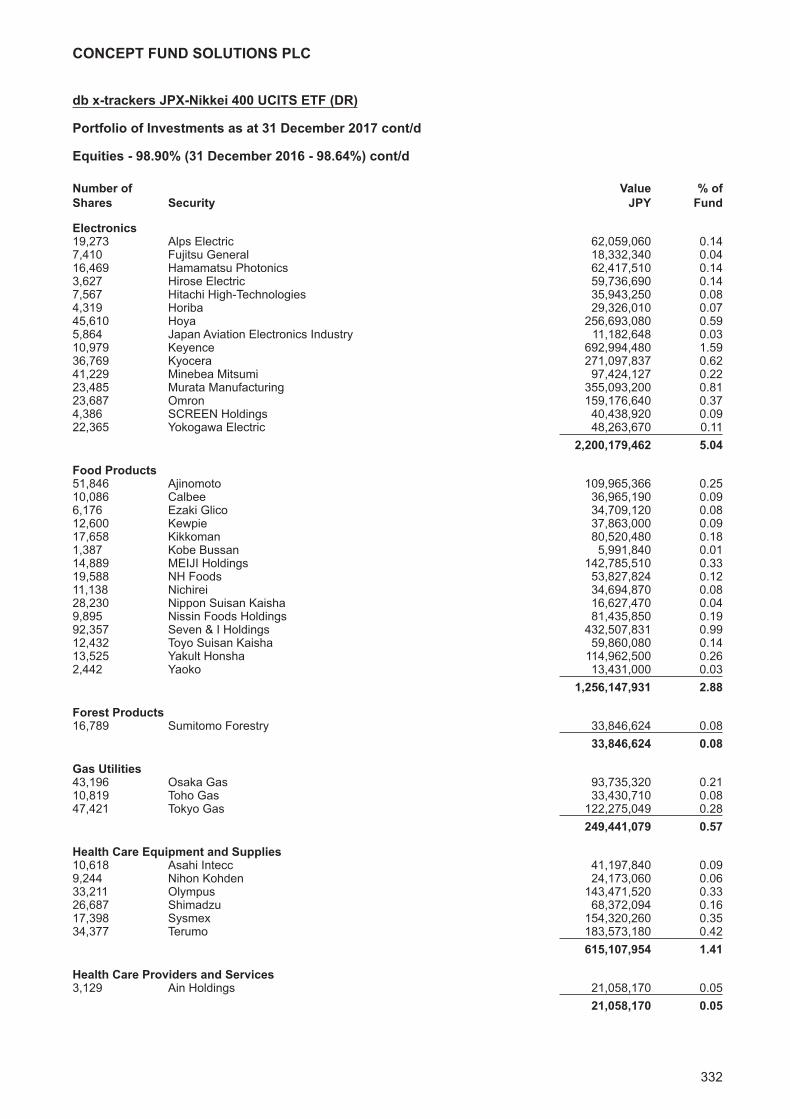
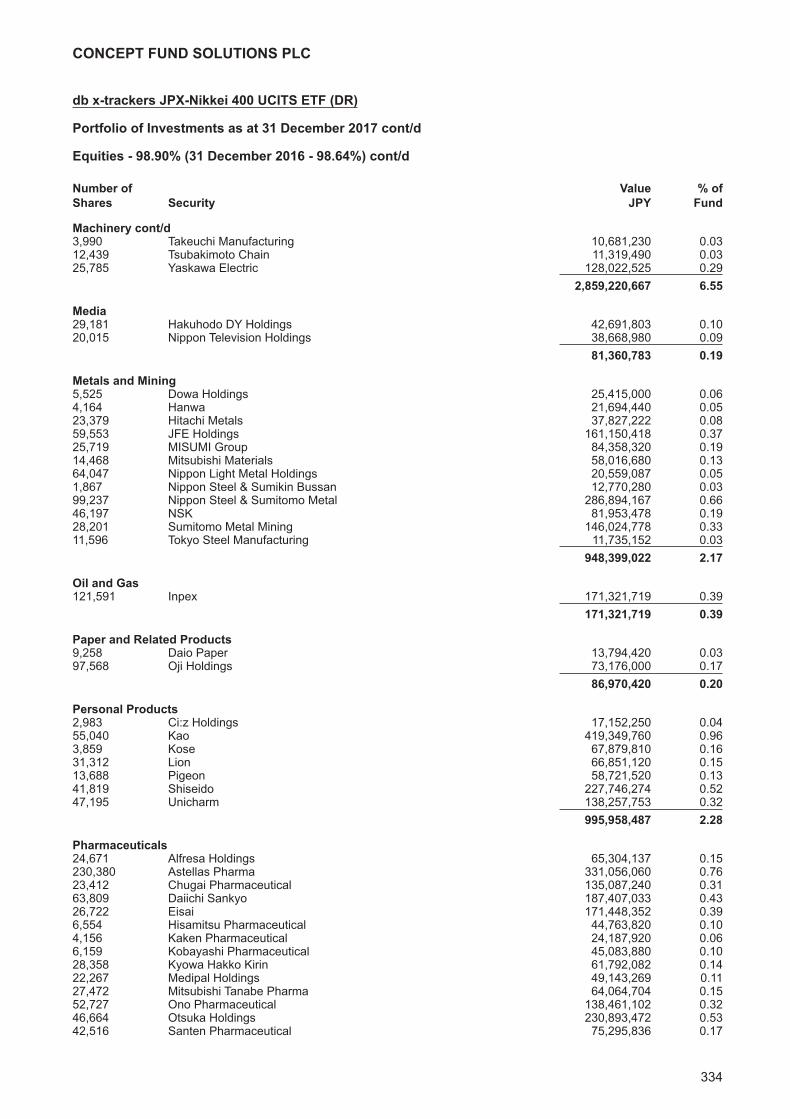
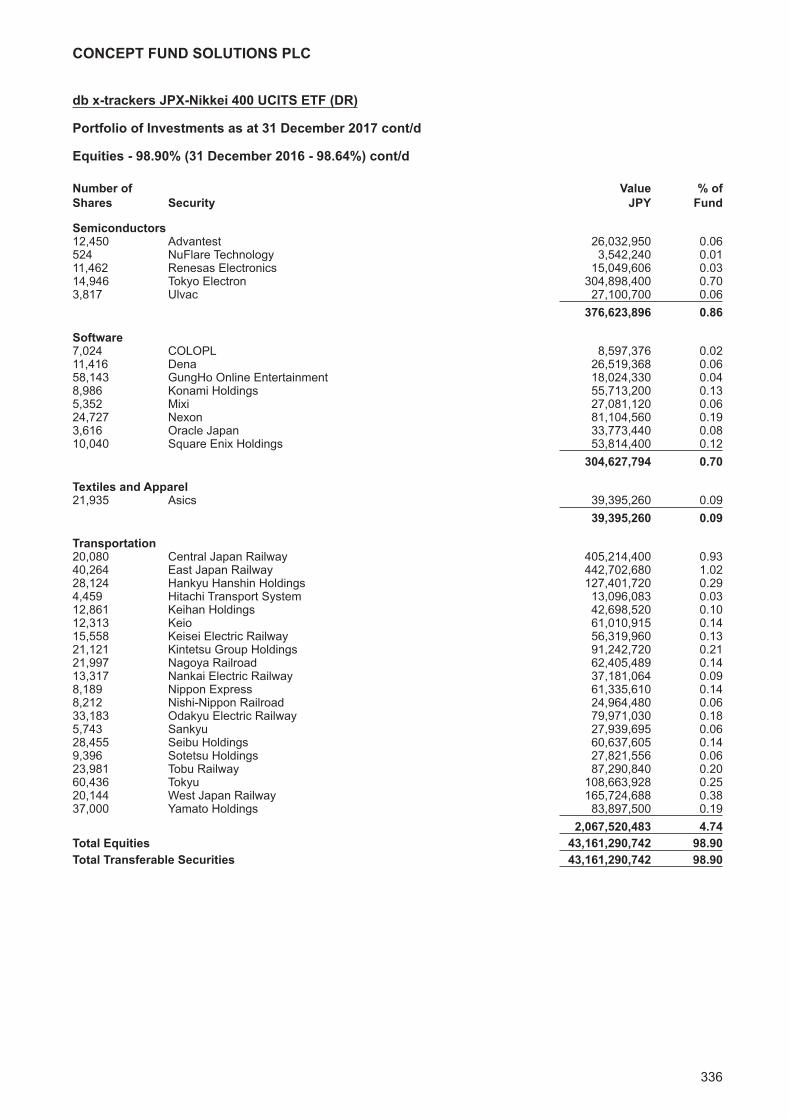
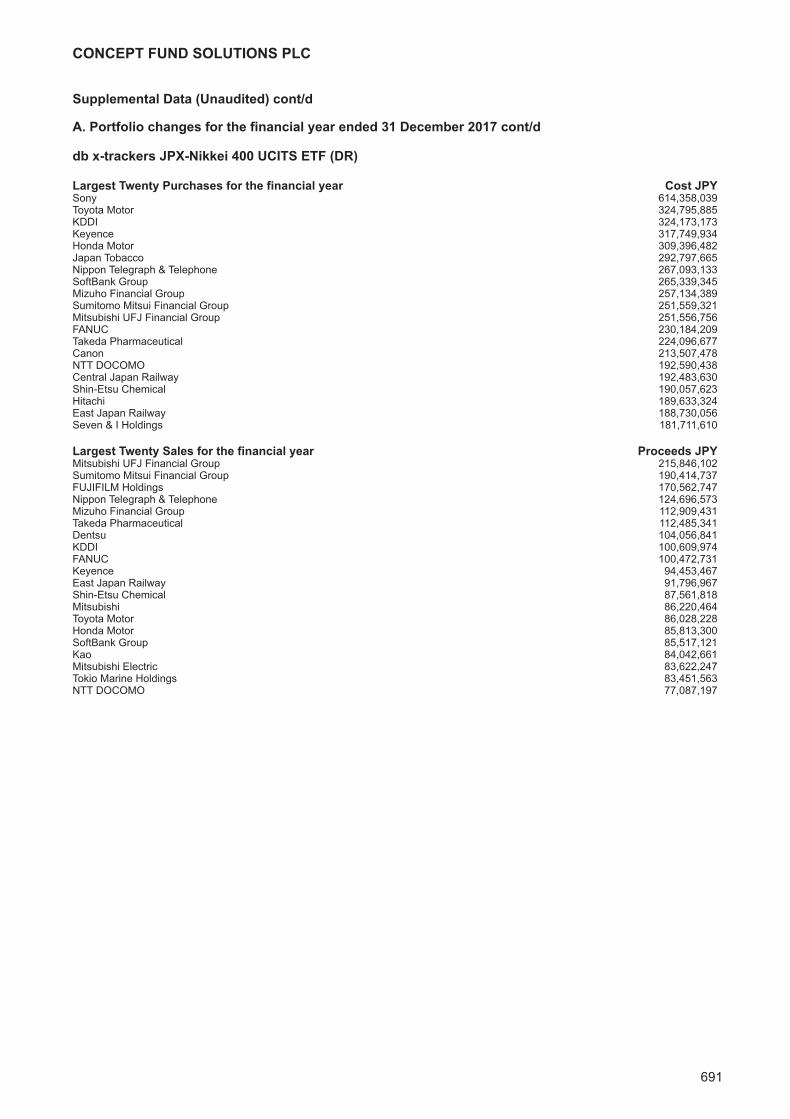
db x-trackers JPX-Nikkei 400 UCITS ETF (DR)Investment Manager’s Report 326Portfolio of Investments 328
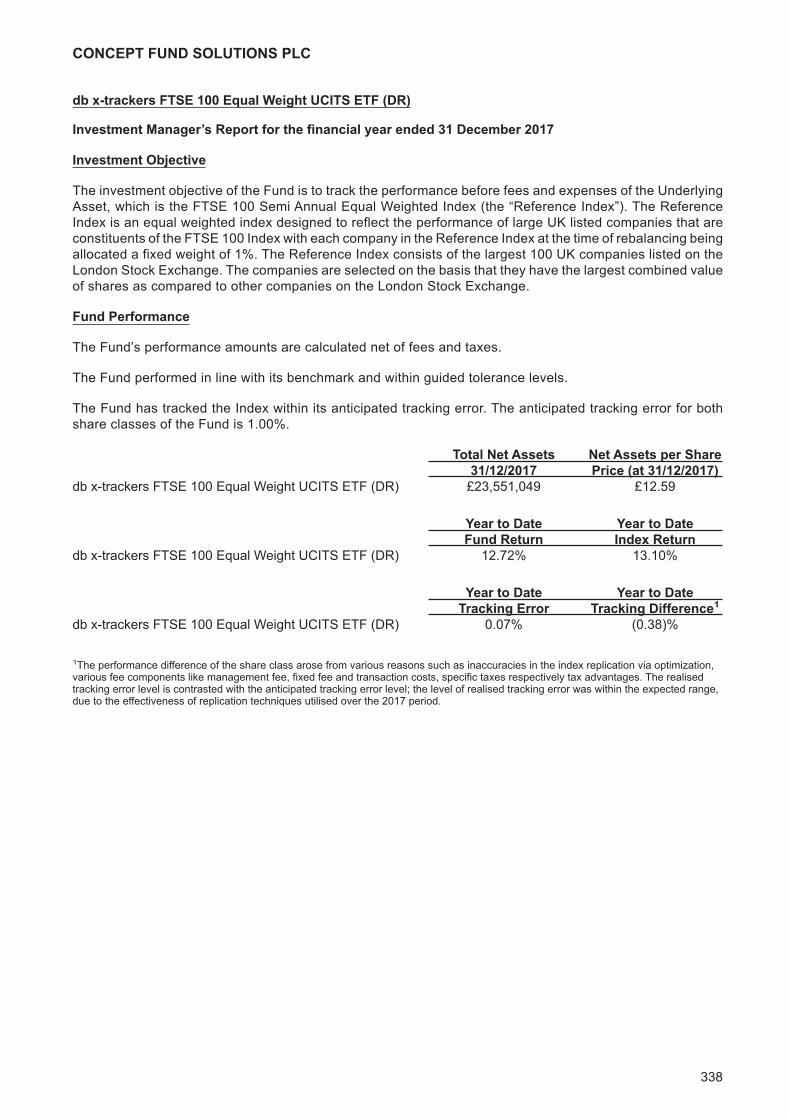
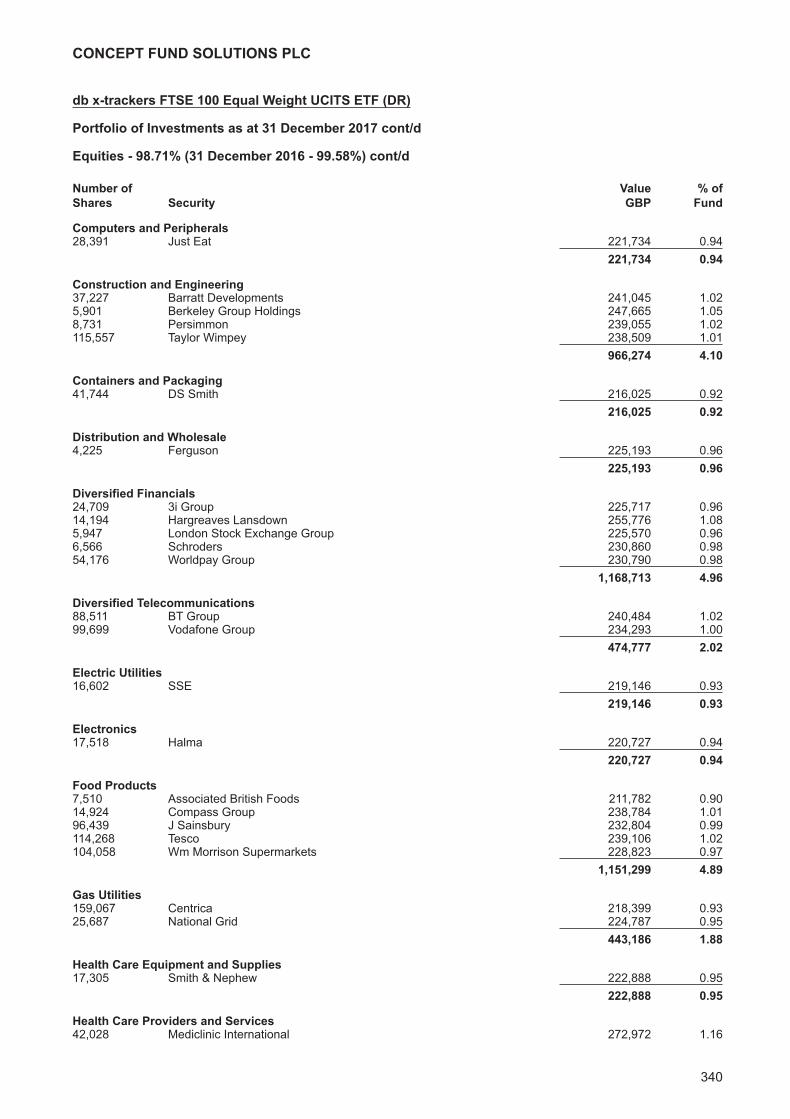
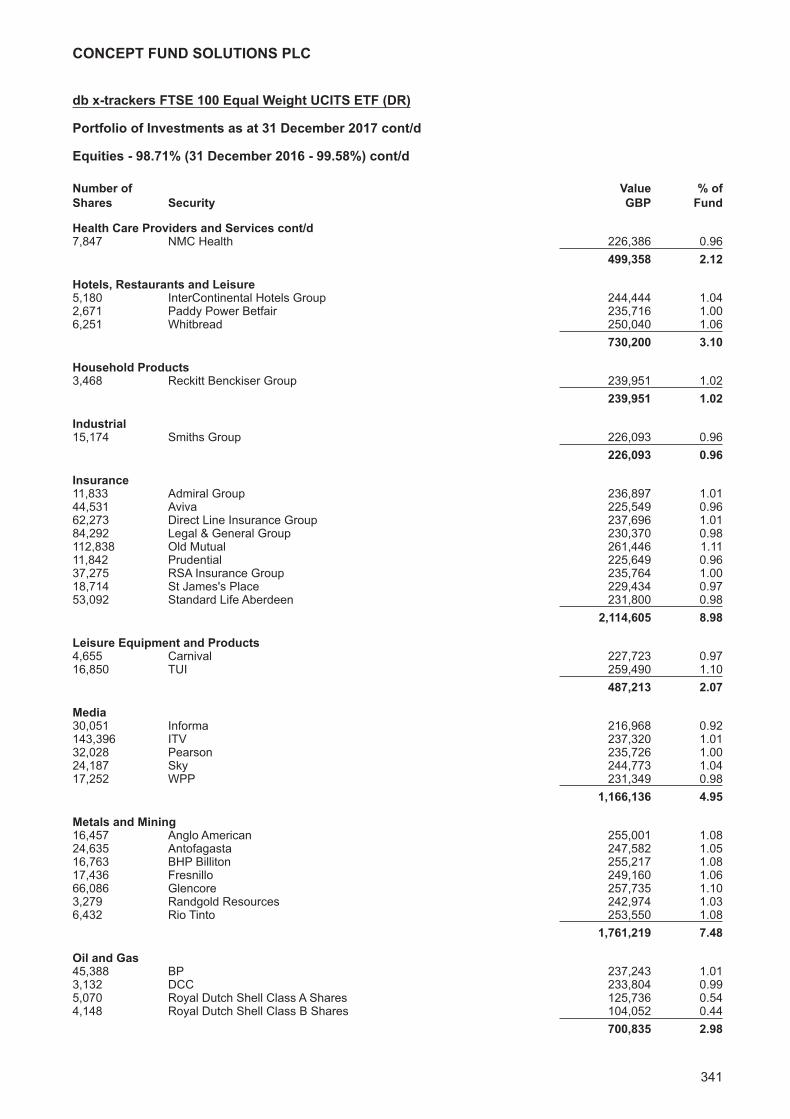
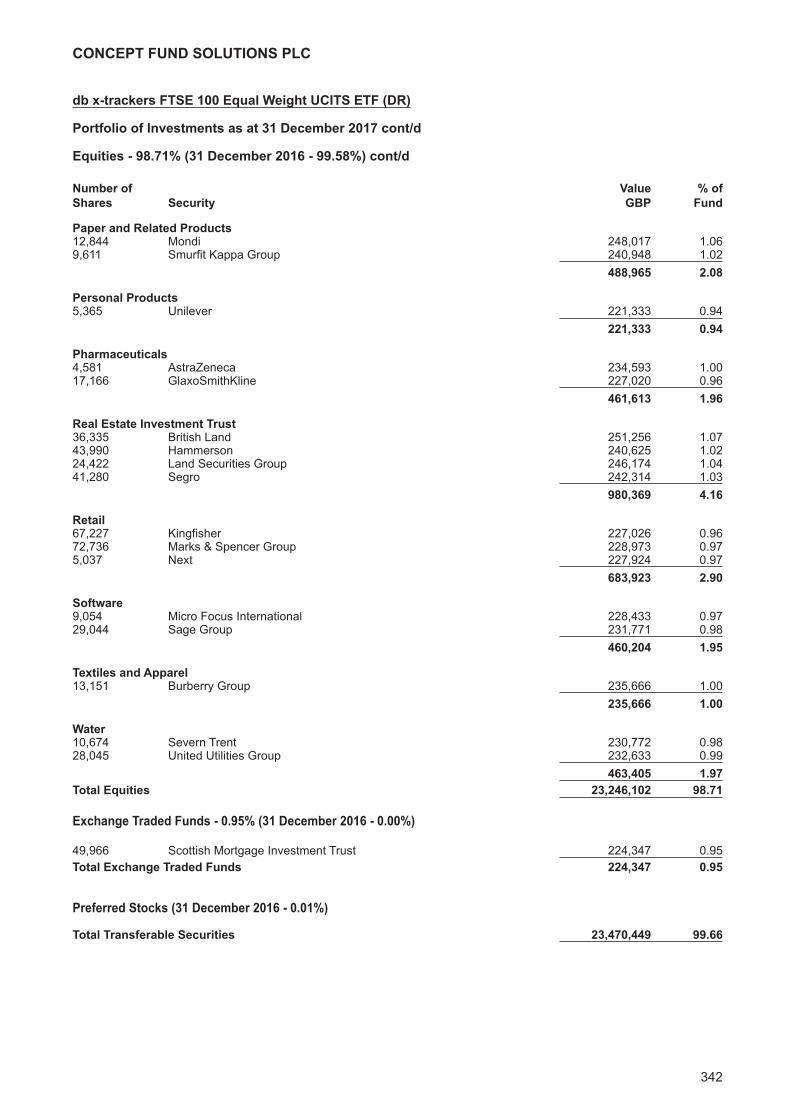
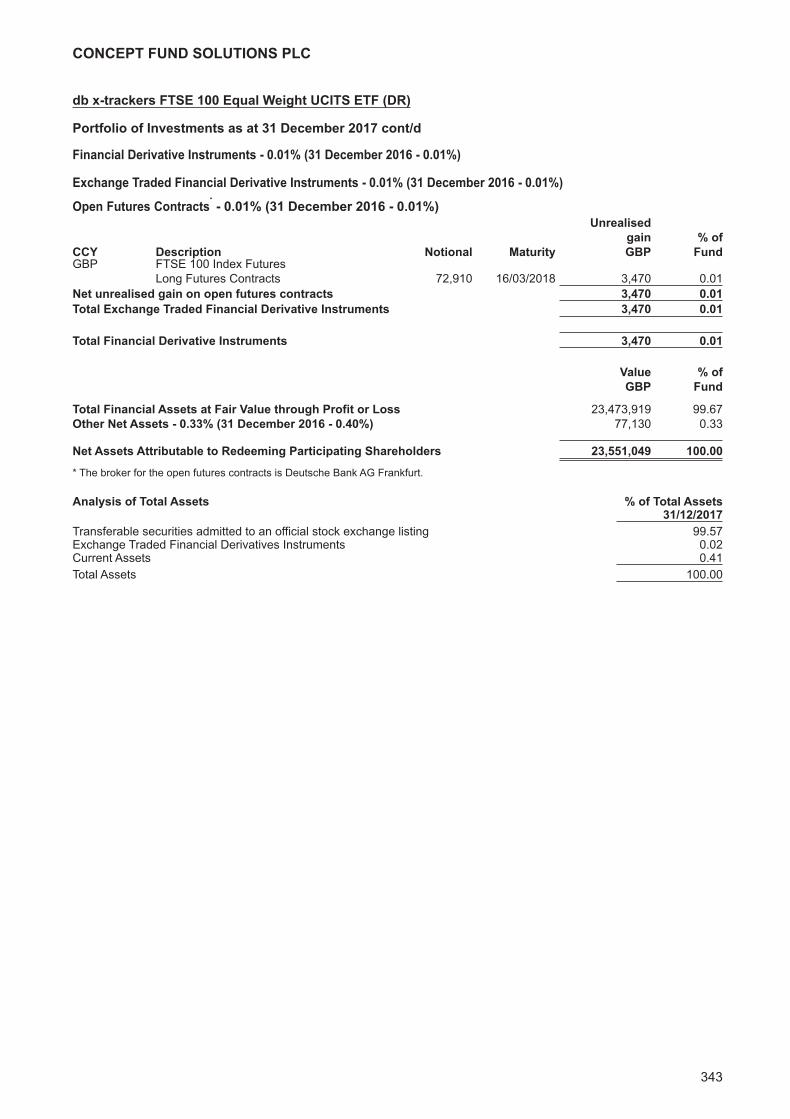
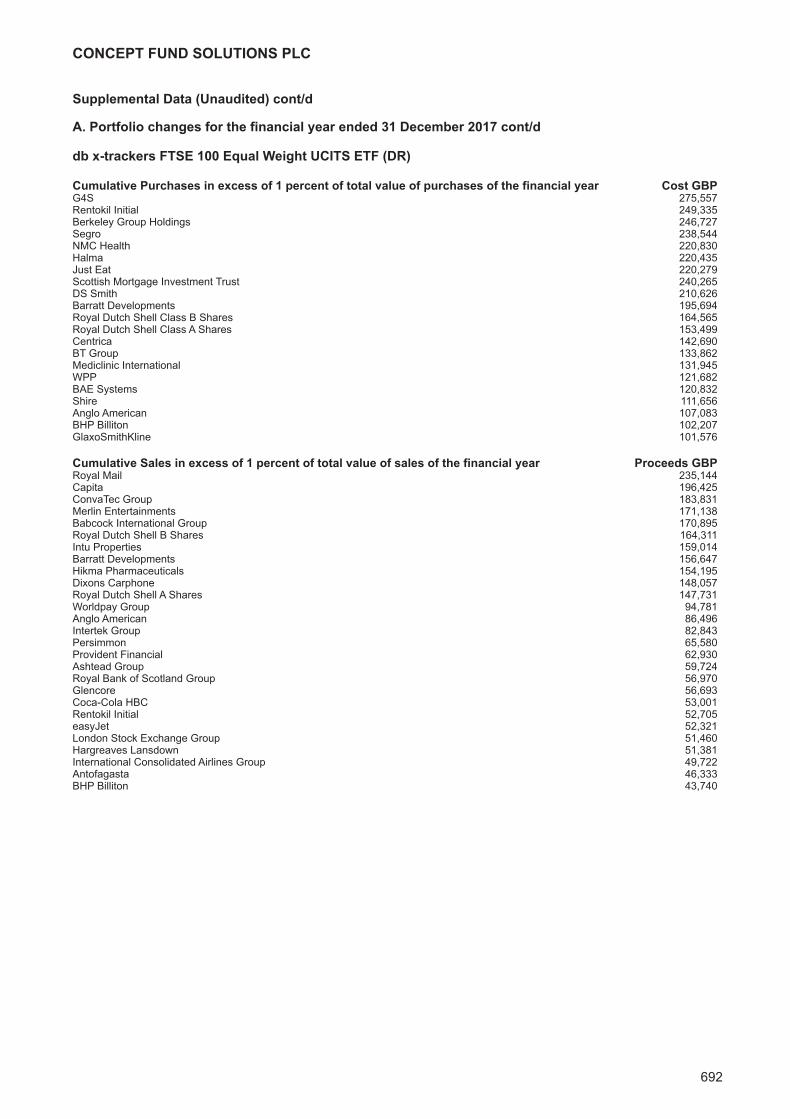
db x-trackers FTSE 100 Equal Weight UCITS ETF (DR)Investment Manager’s Report 338Portfolio of Investments 339
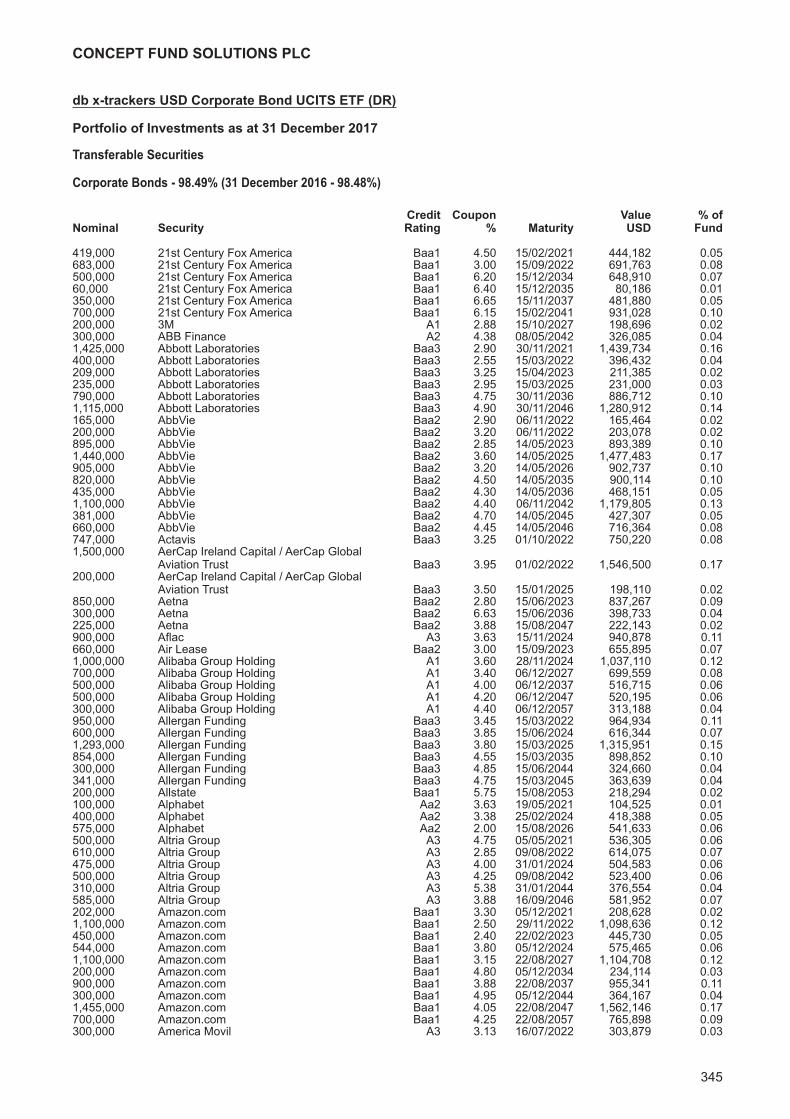
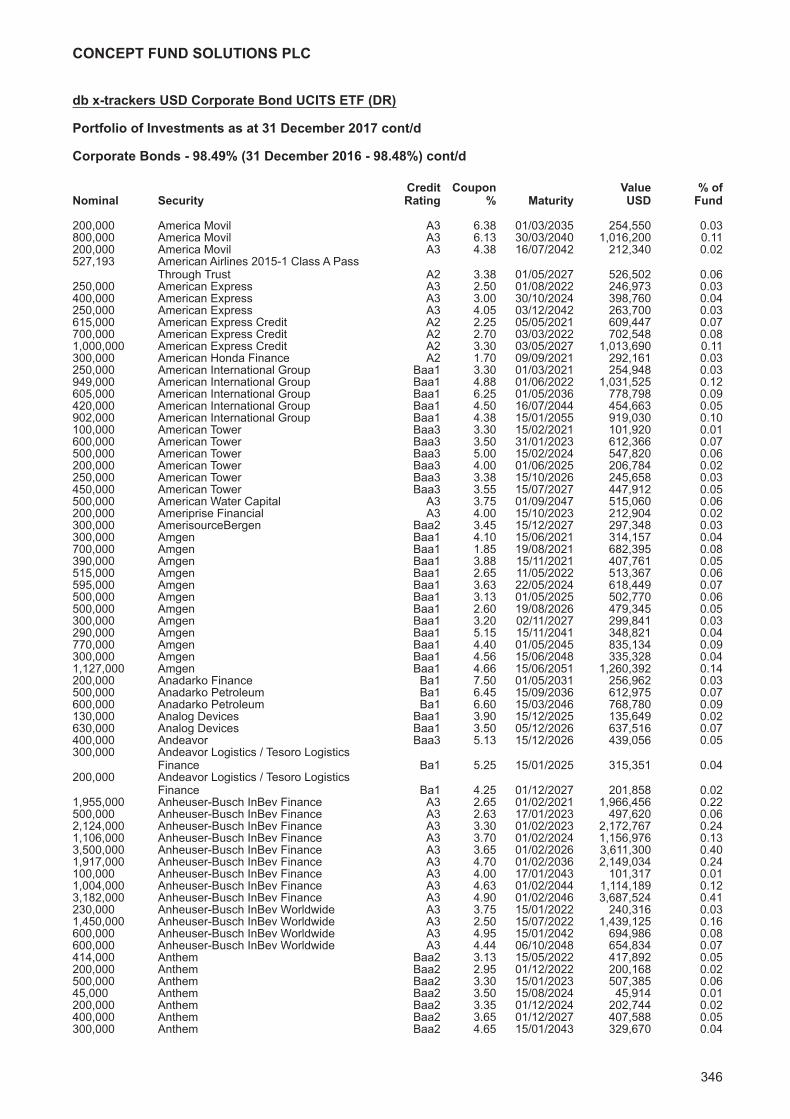
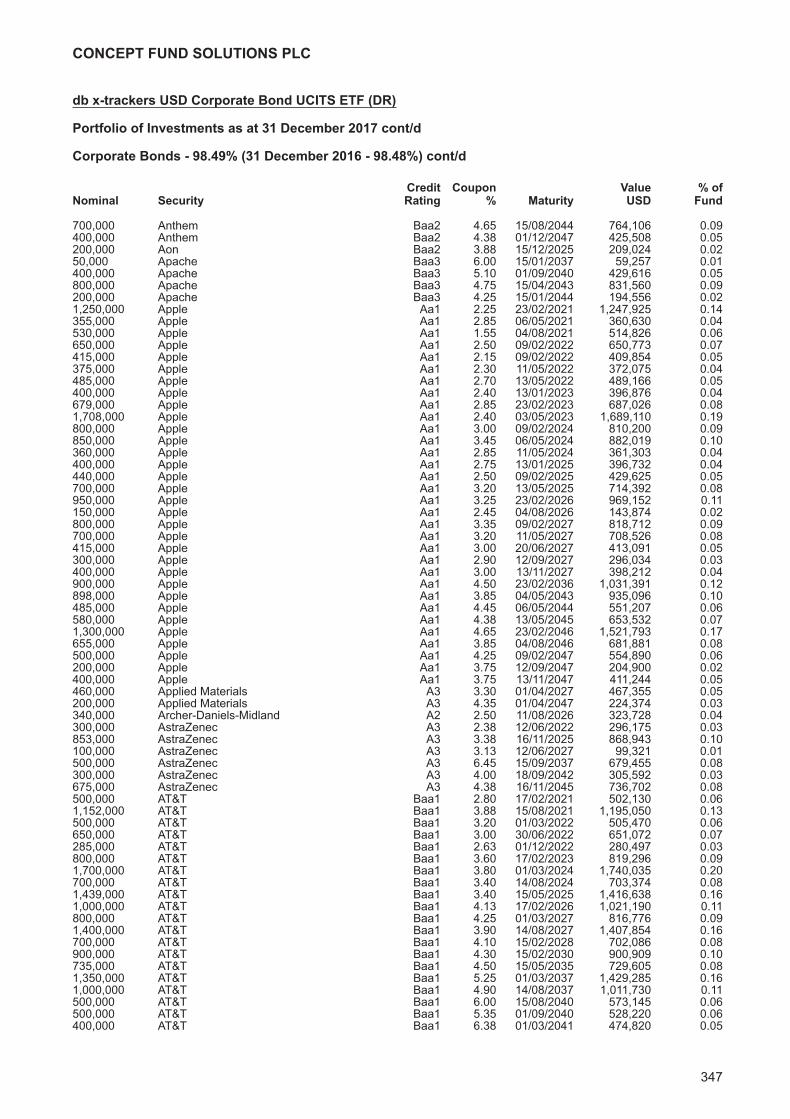
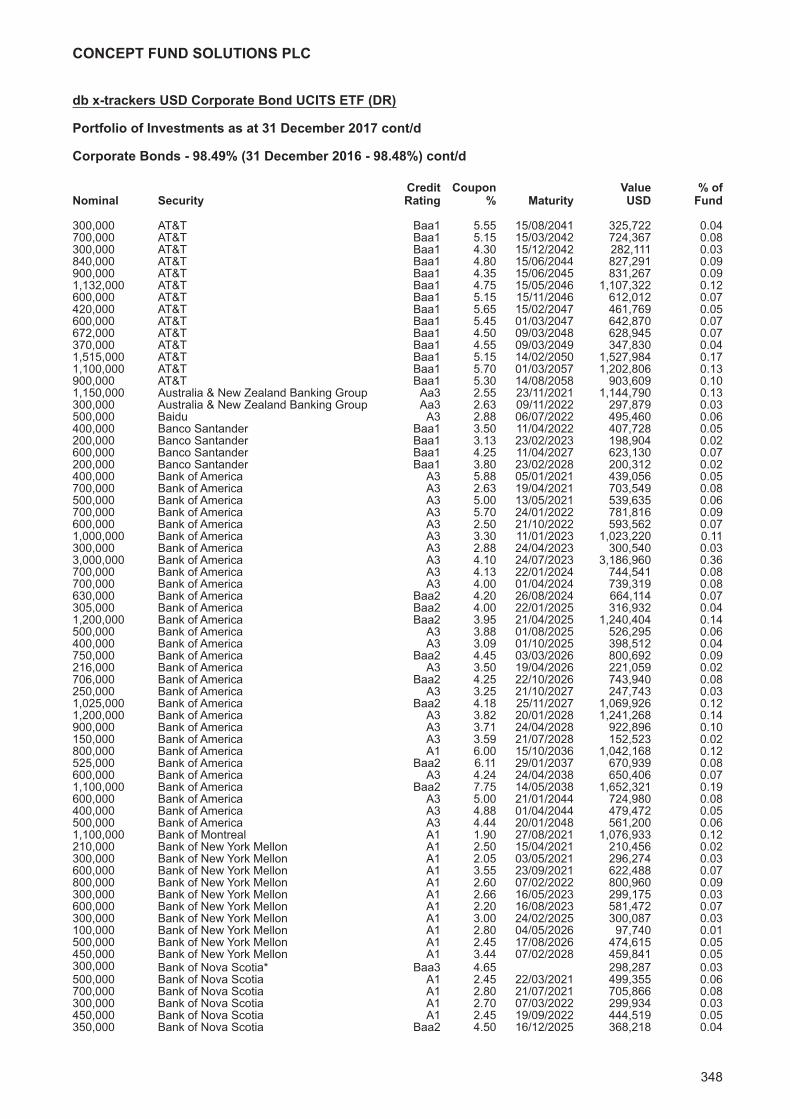
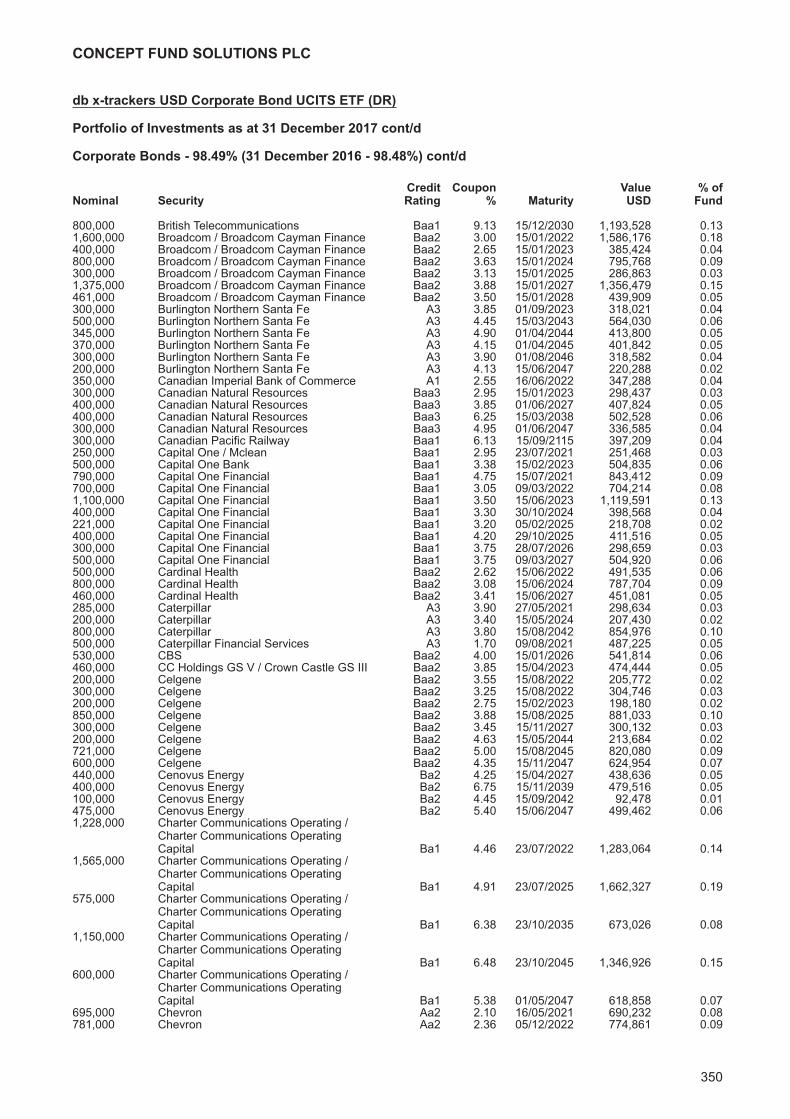
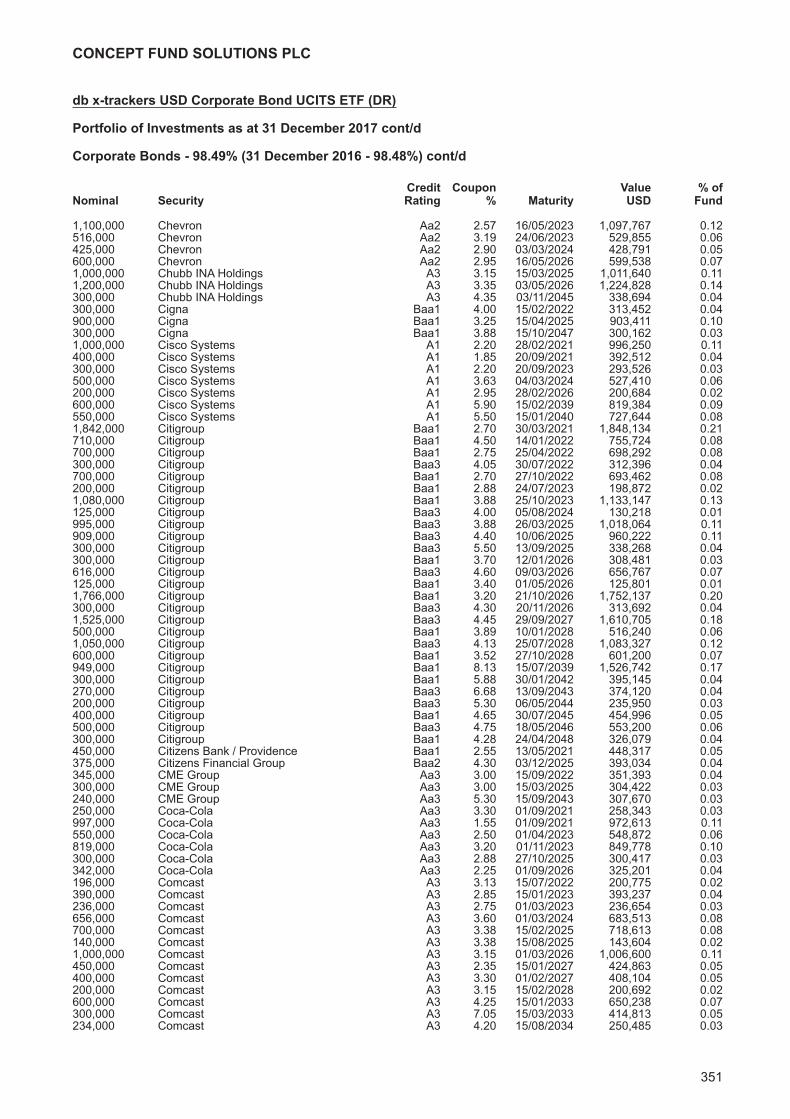
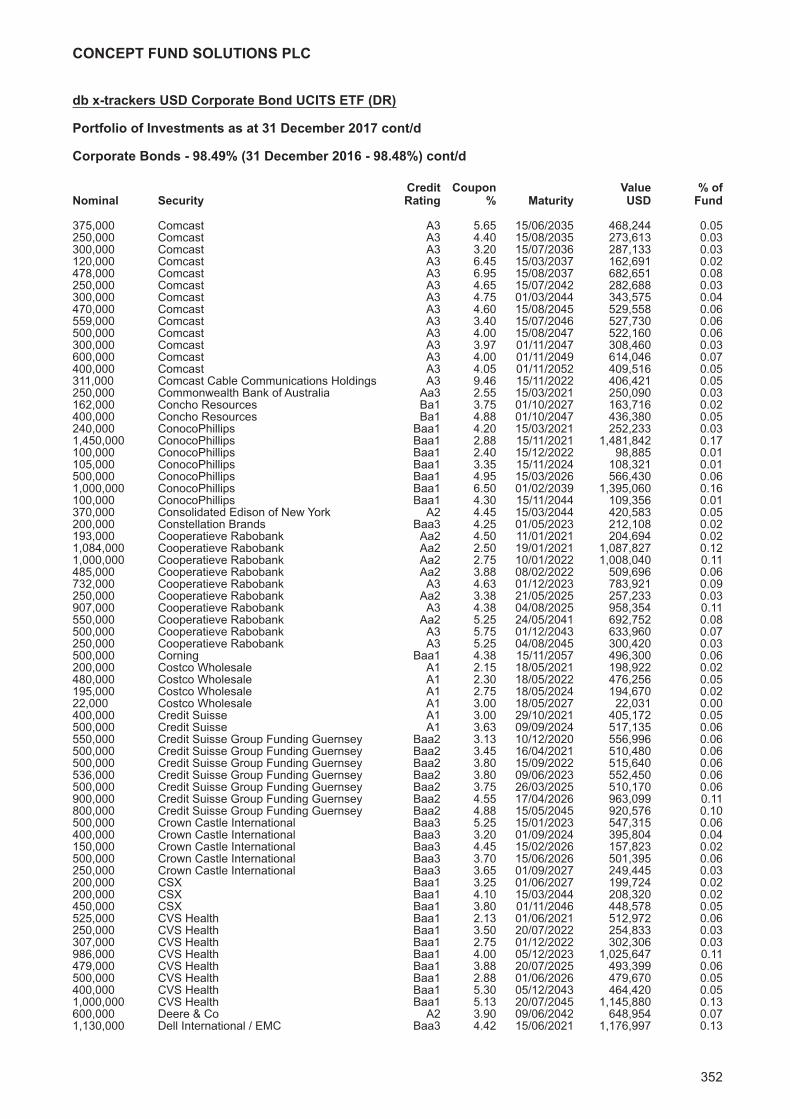
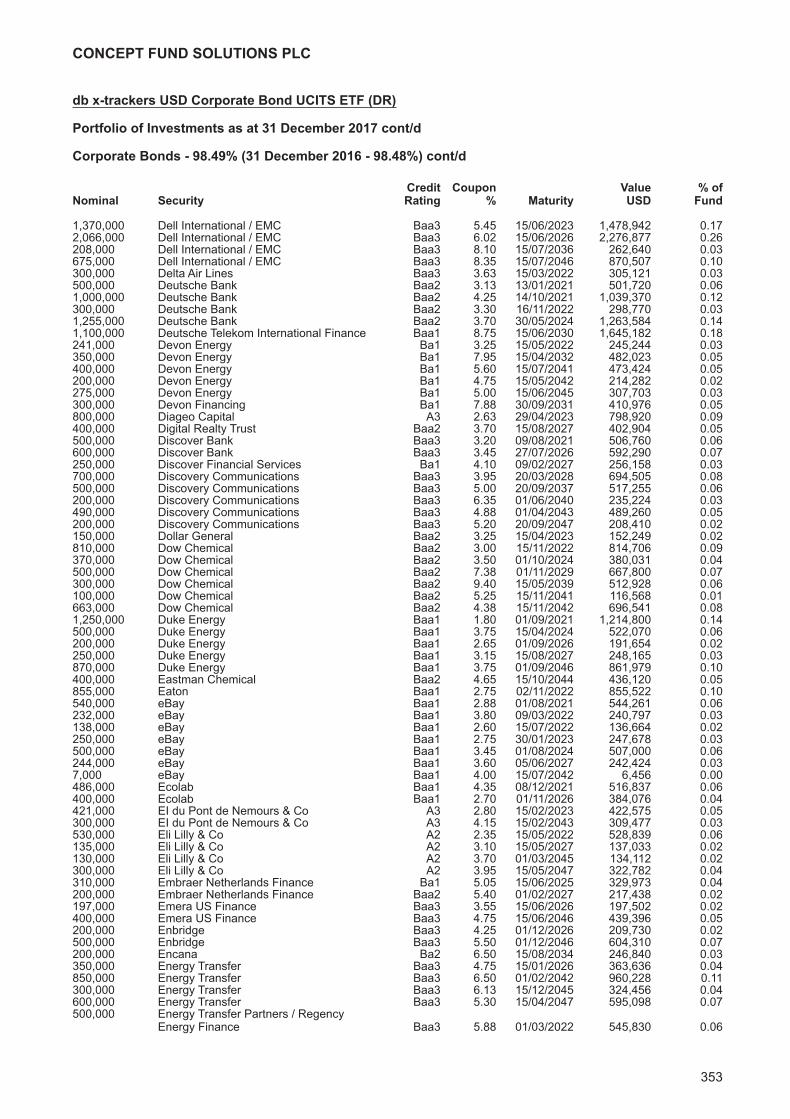
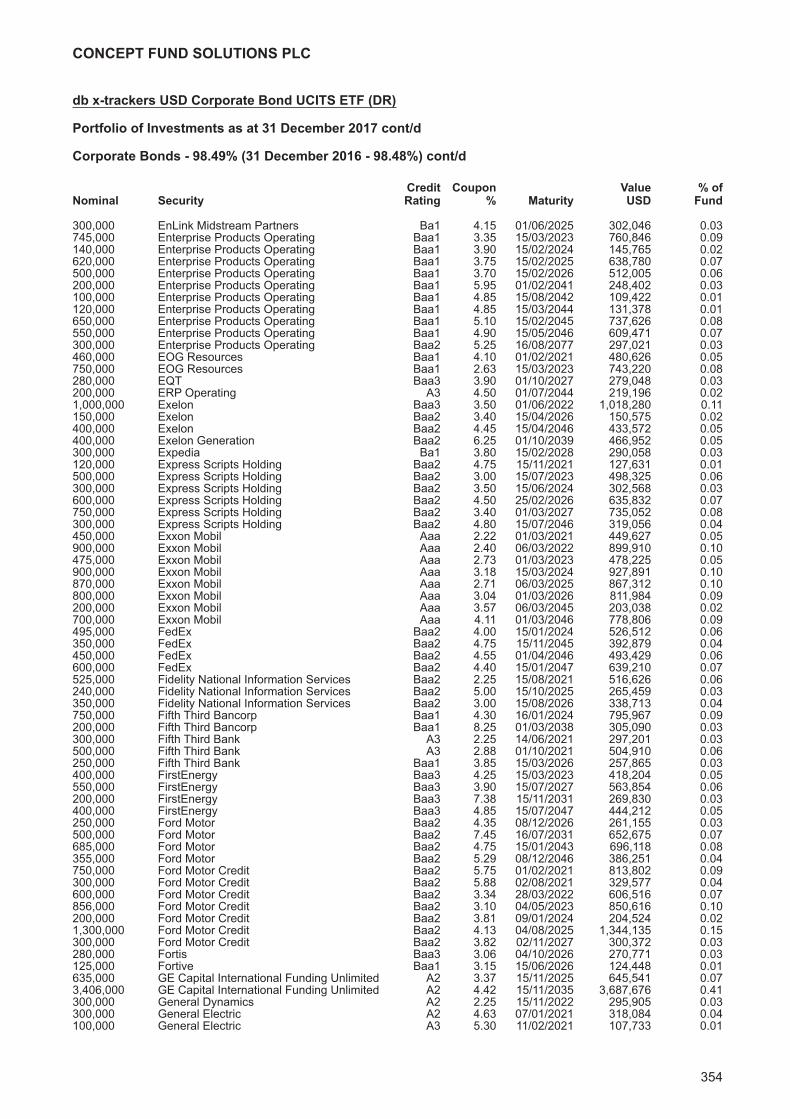
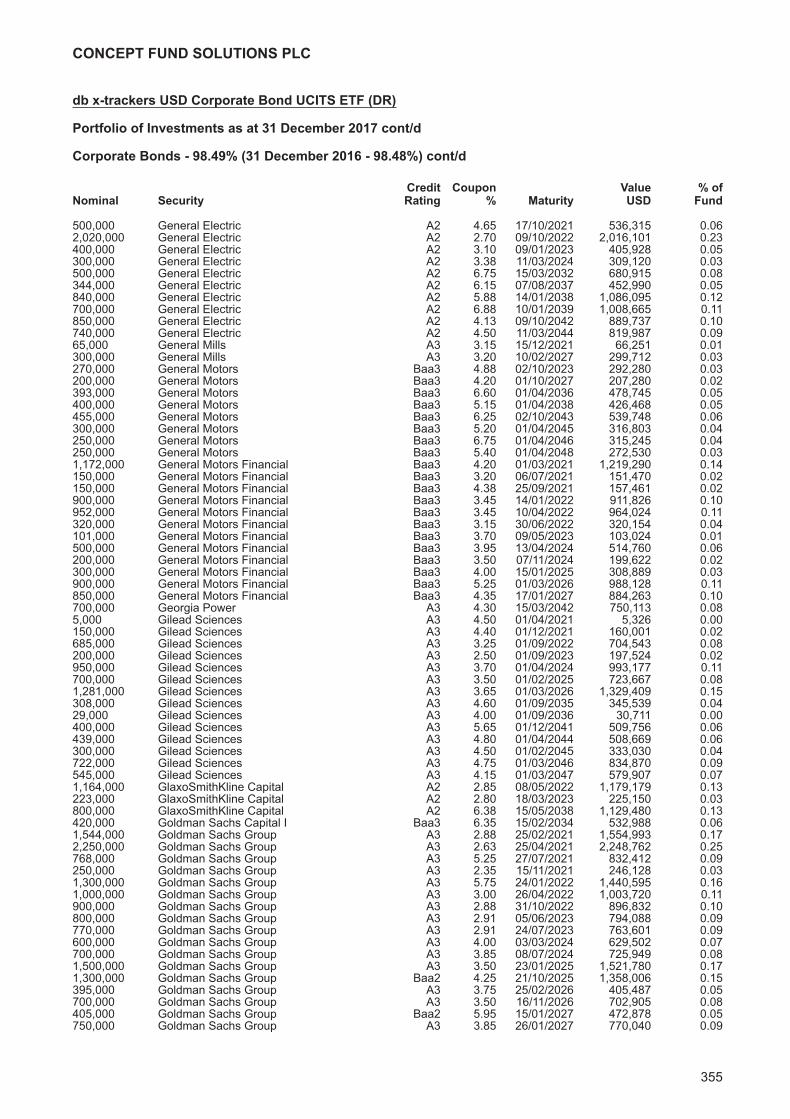
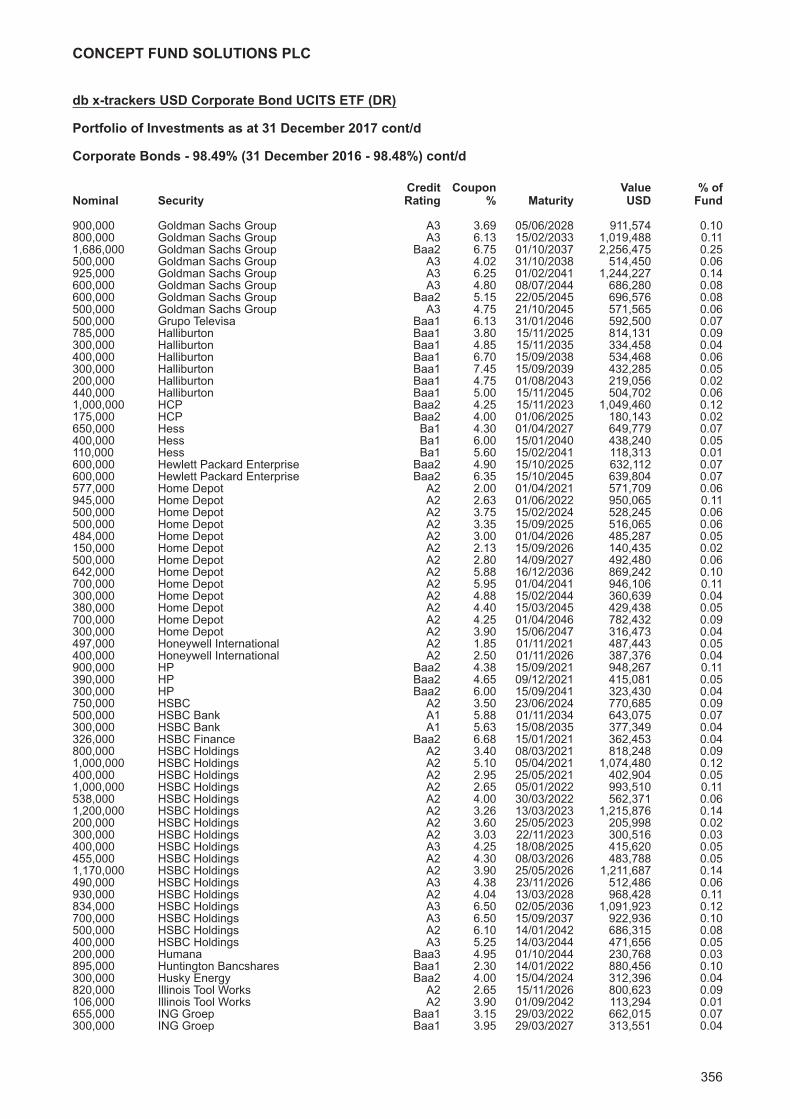
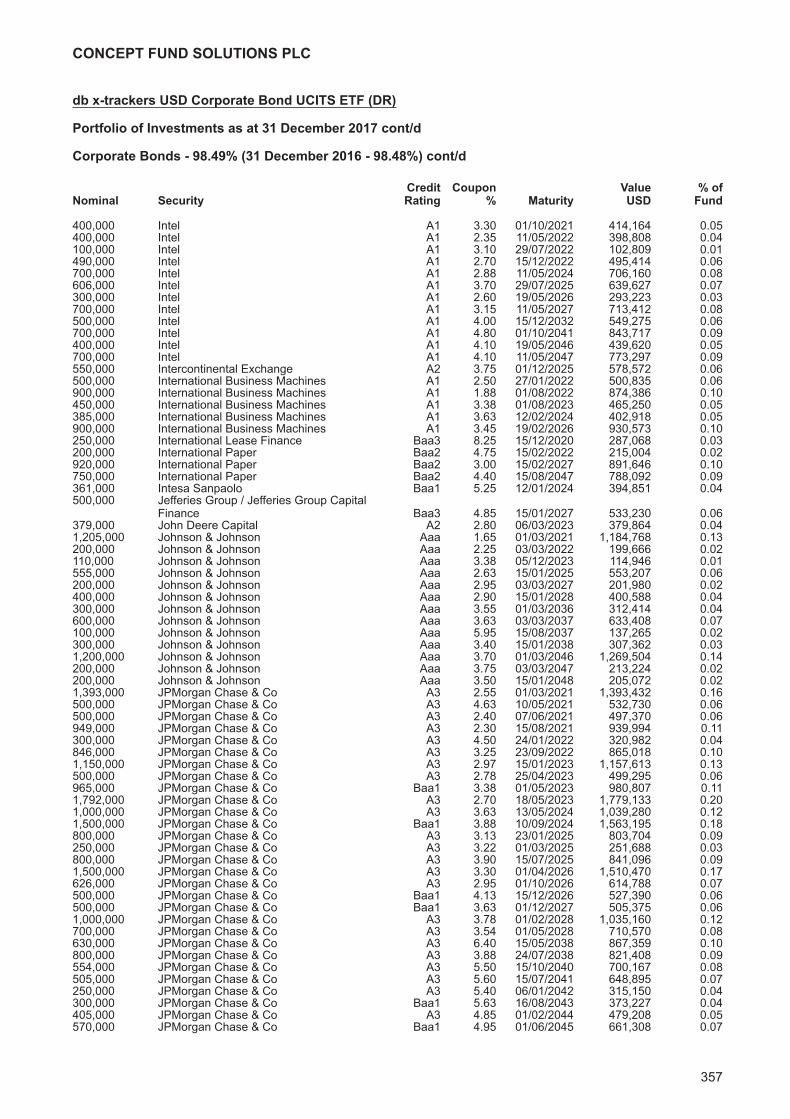
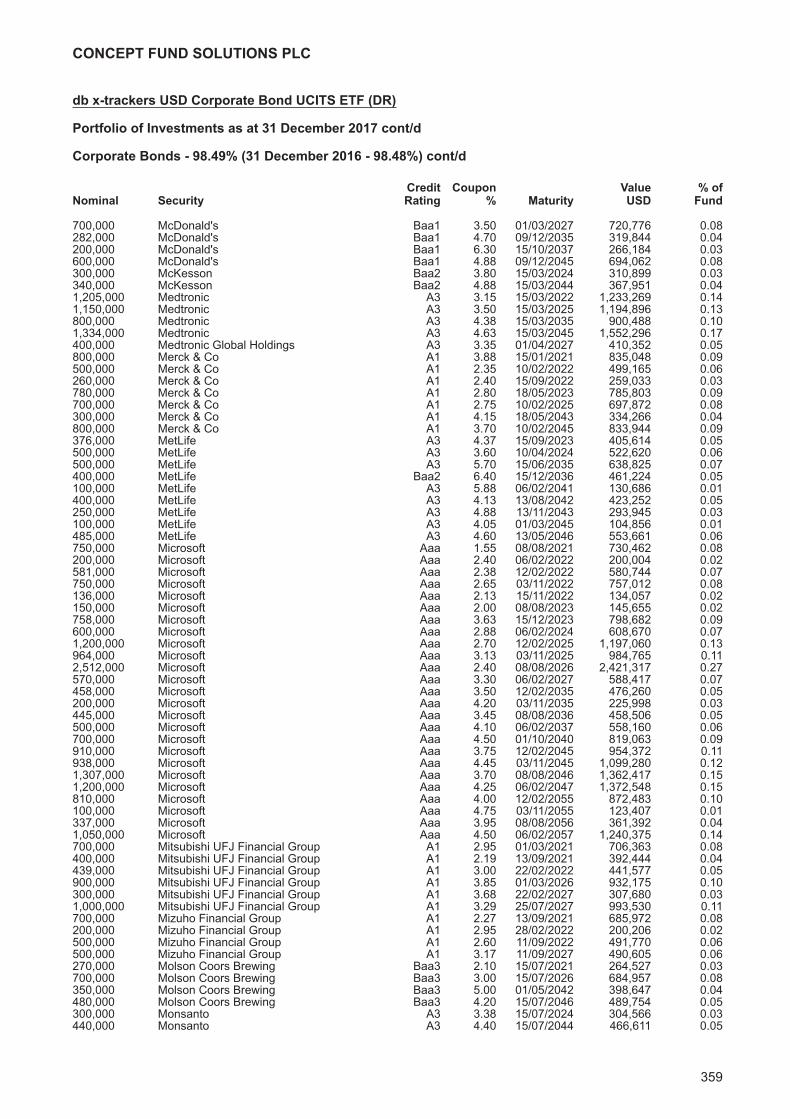
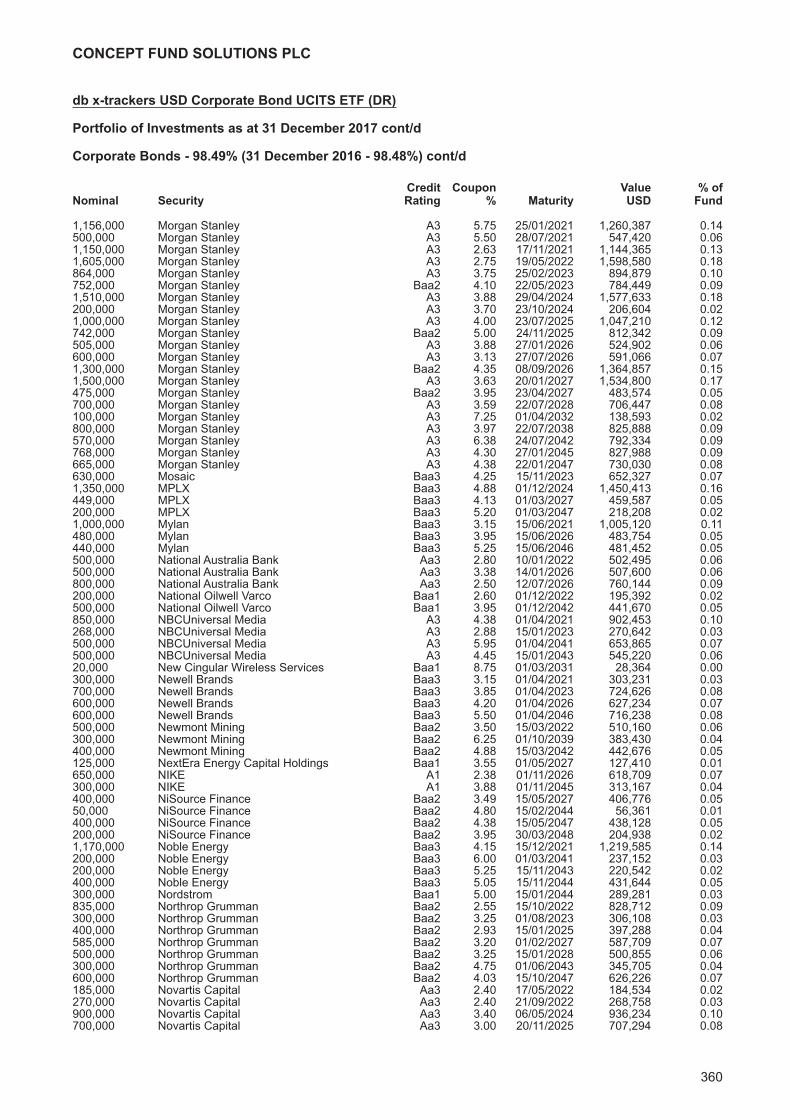
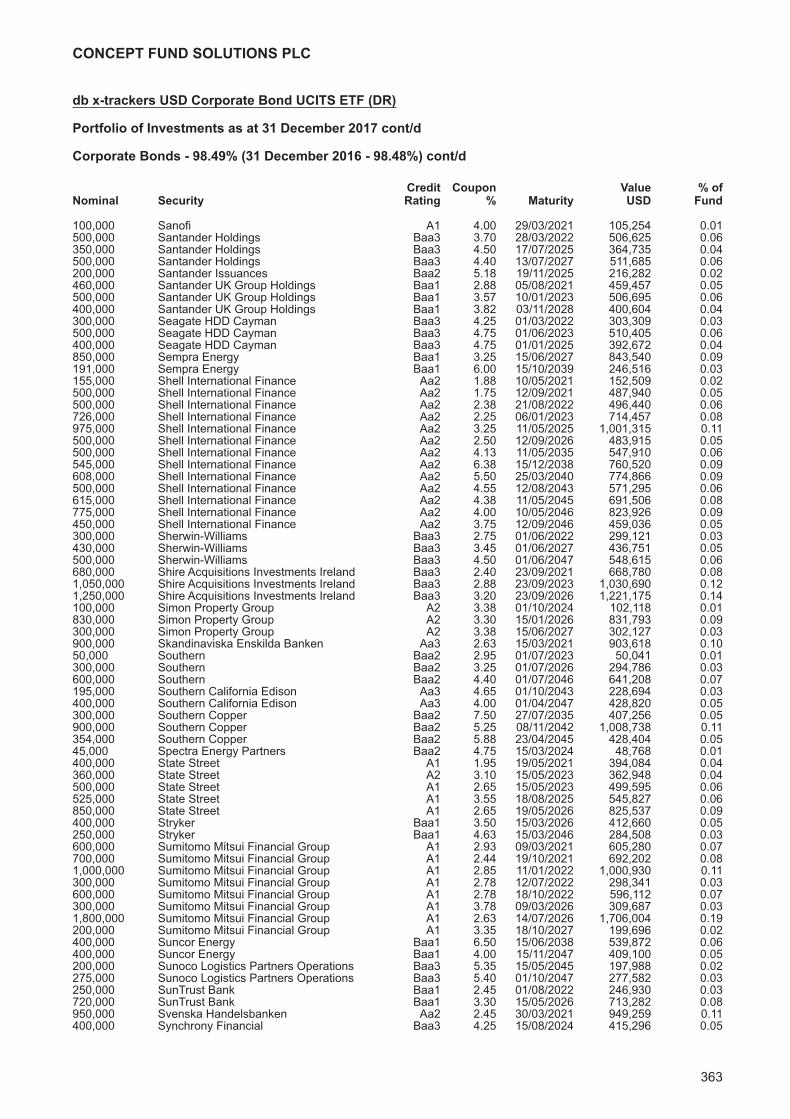
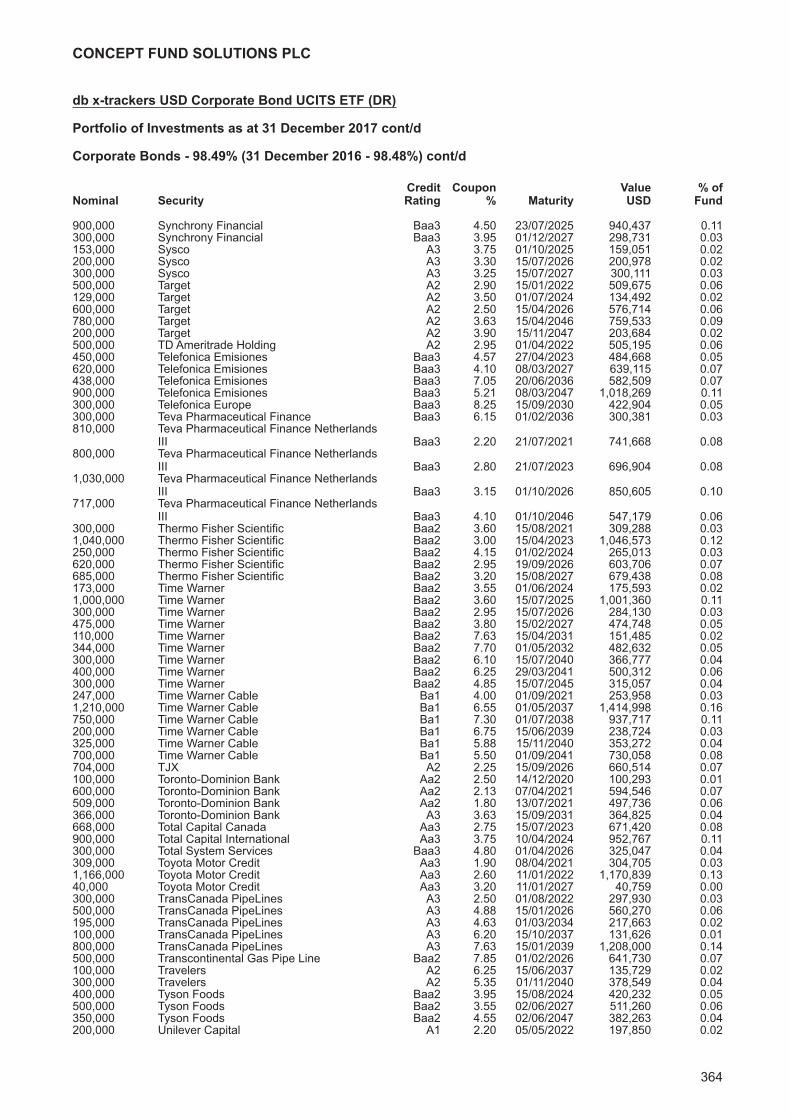
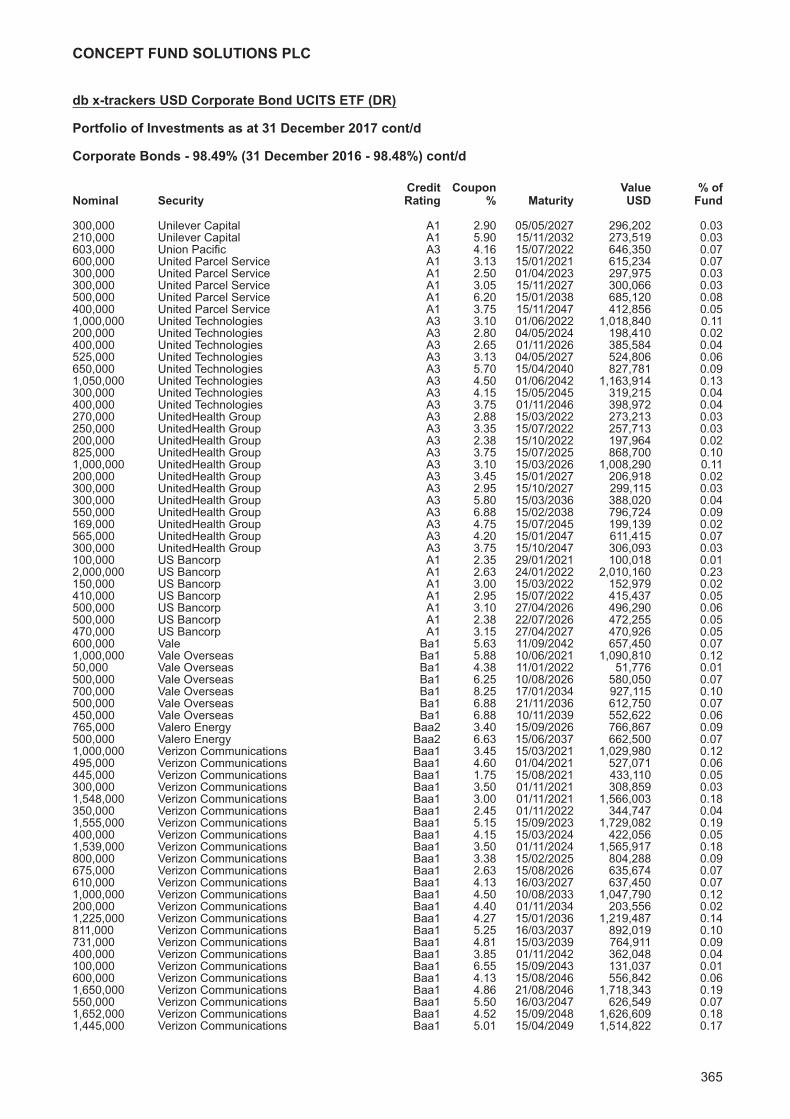
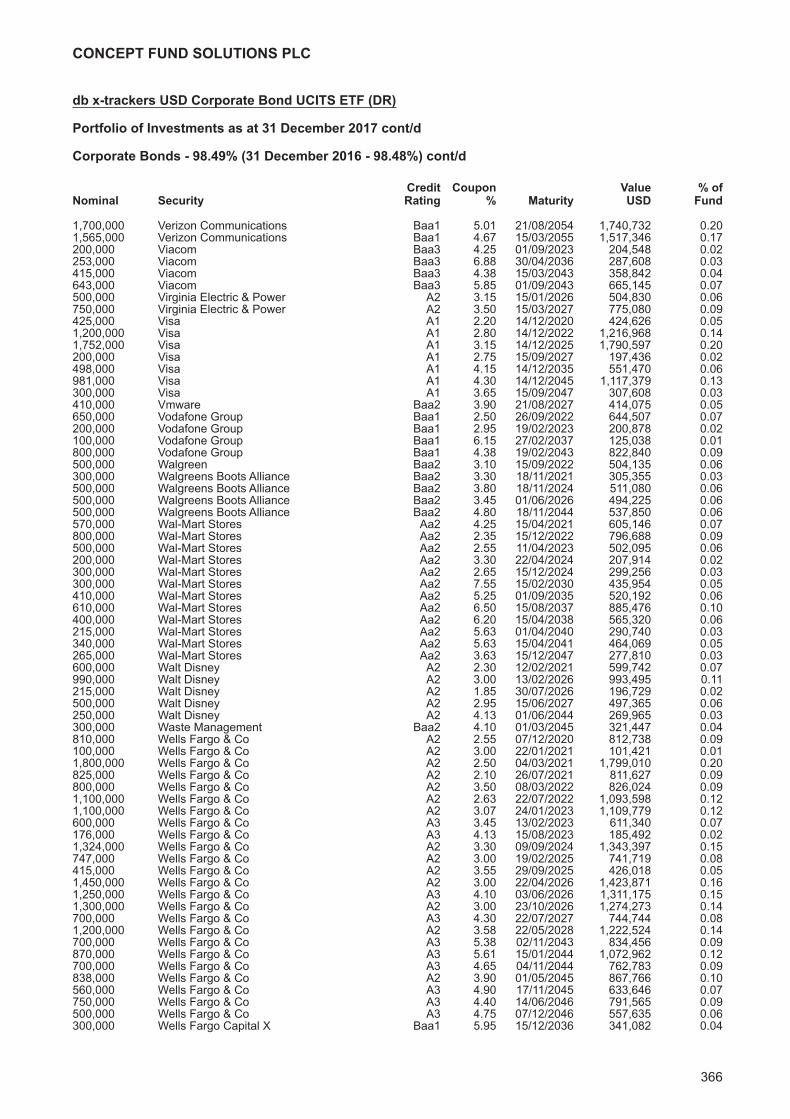
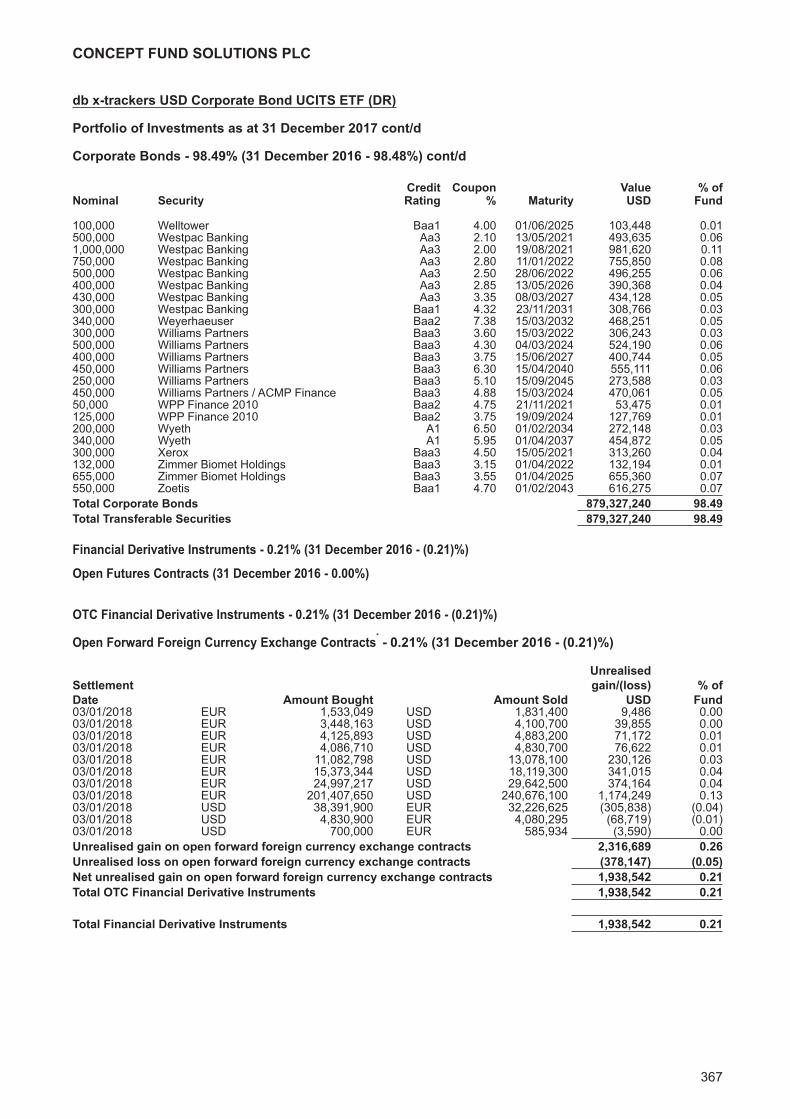
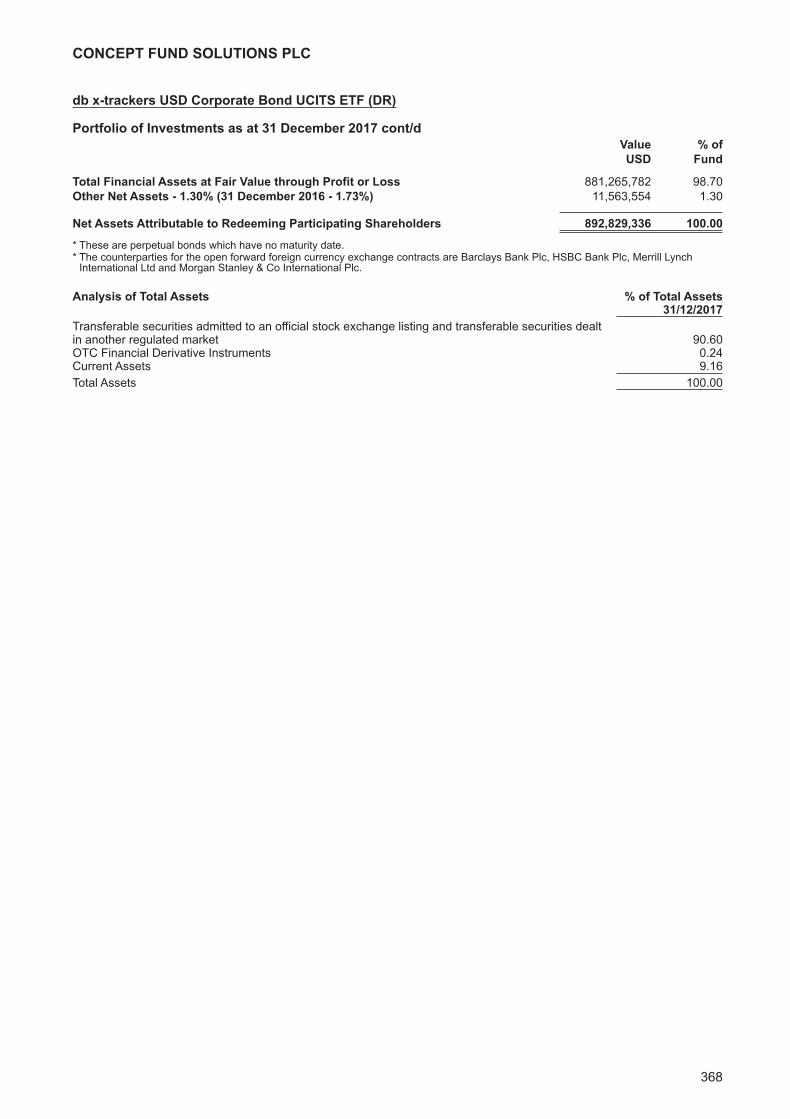
db x-trackers USD Corporate Bond UCITS ETF (DR)Investment Manager’s Report 344Portfolio of Investments 345
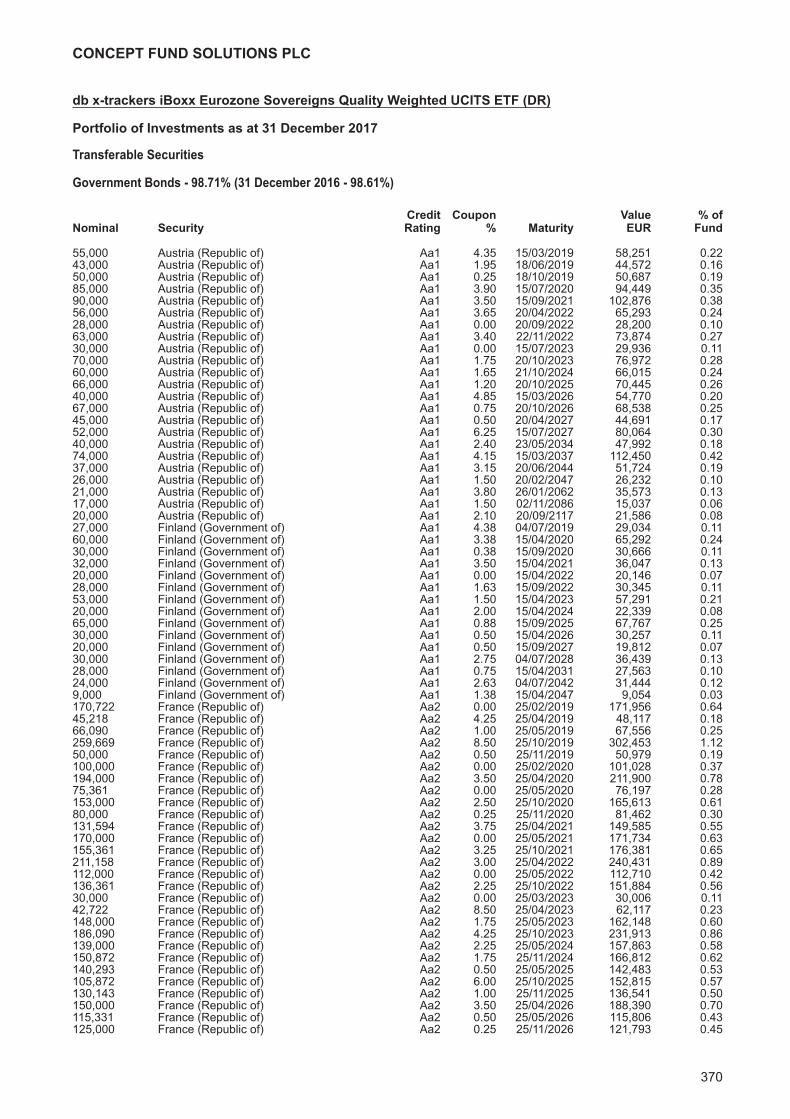
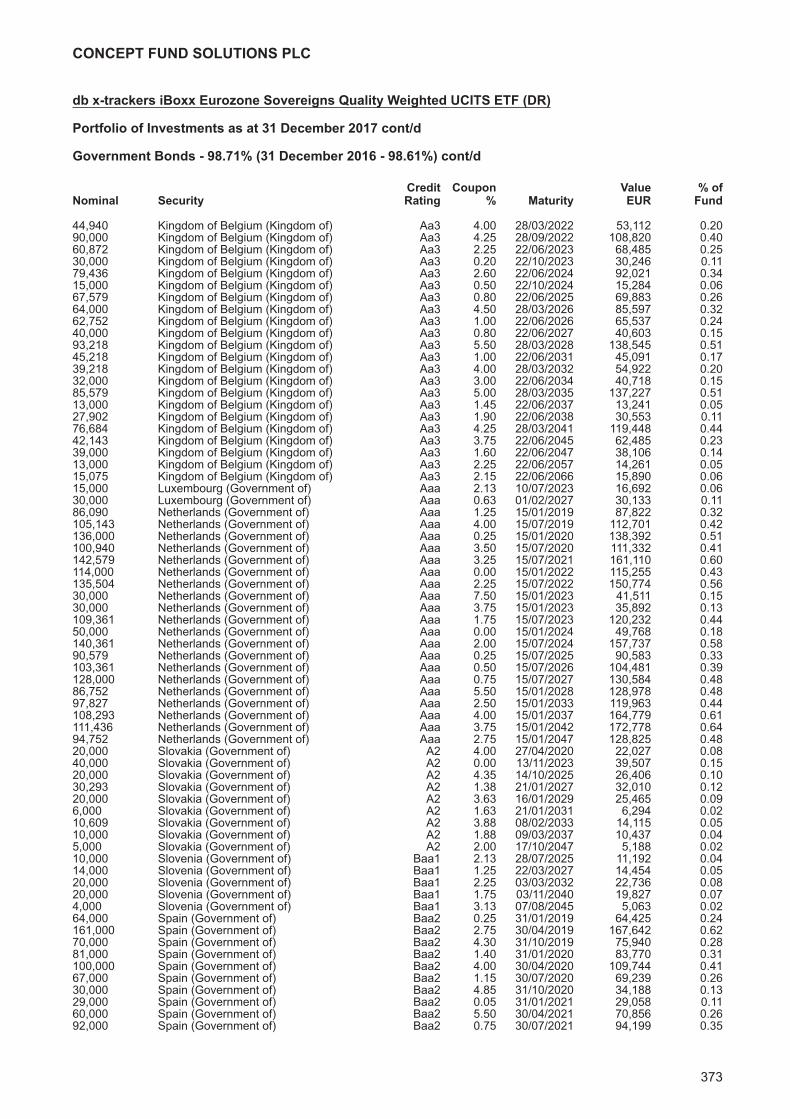
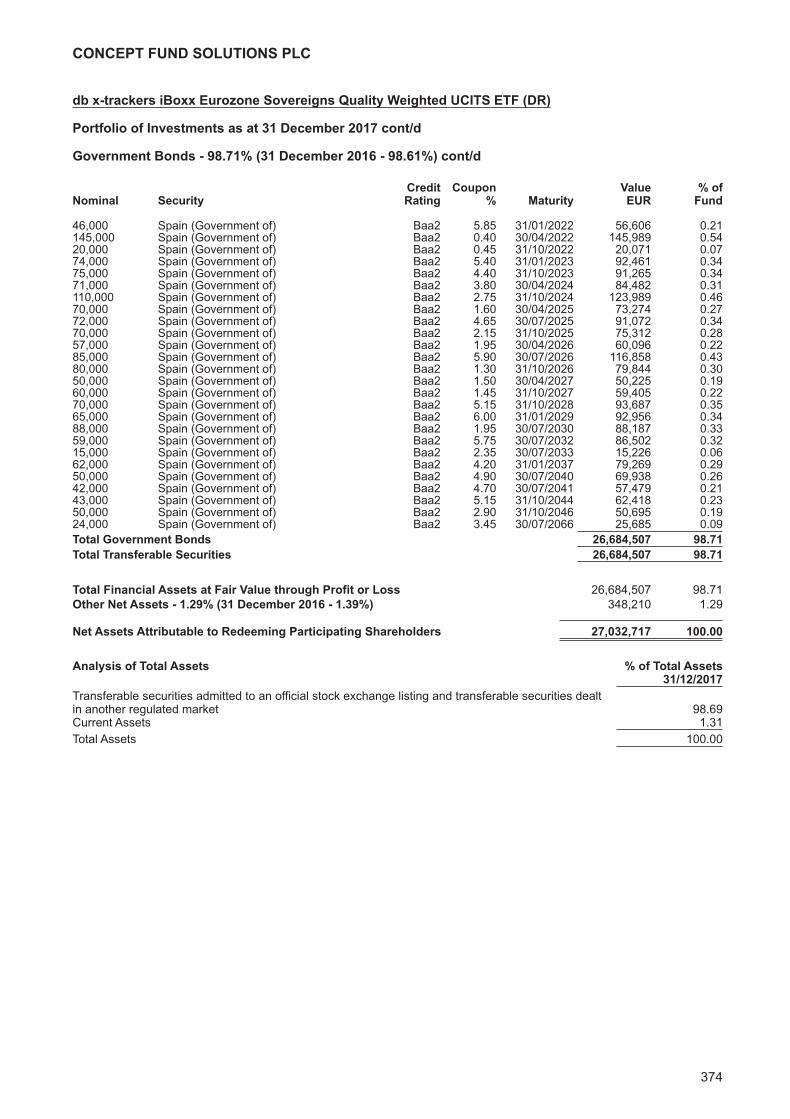
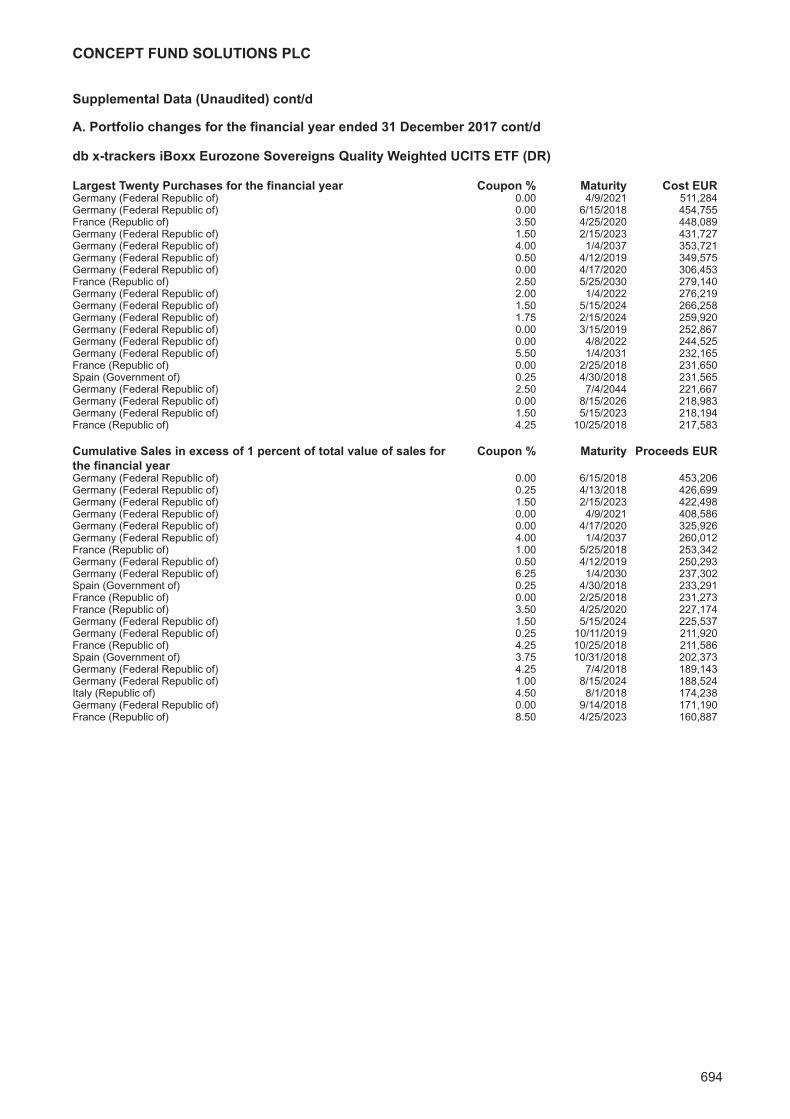
db x-trackers iBoxx Eurozone Sovereigns Quality Weighted UCITS ETF (DR)Investment Manager’s Report 369Portfolio of Investments 370
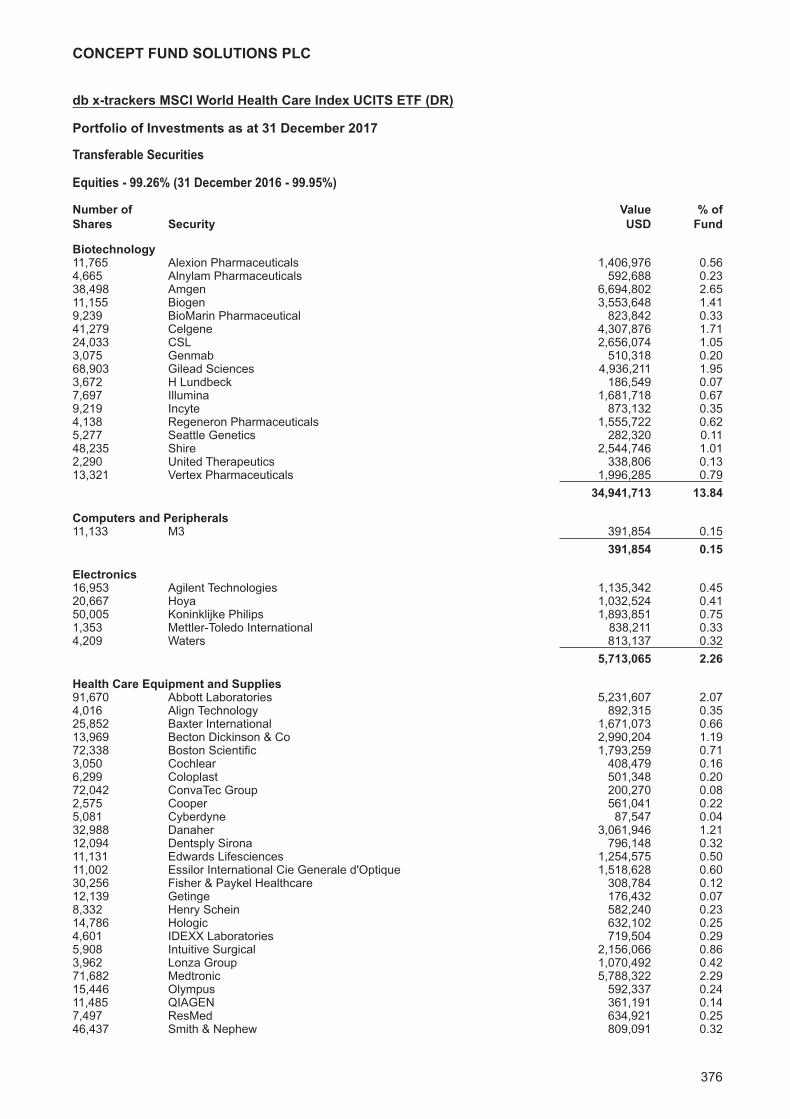
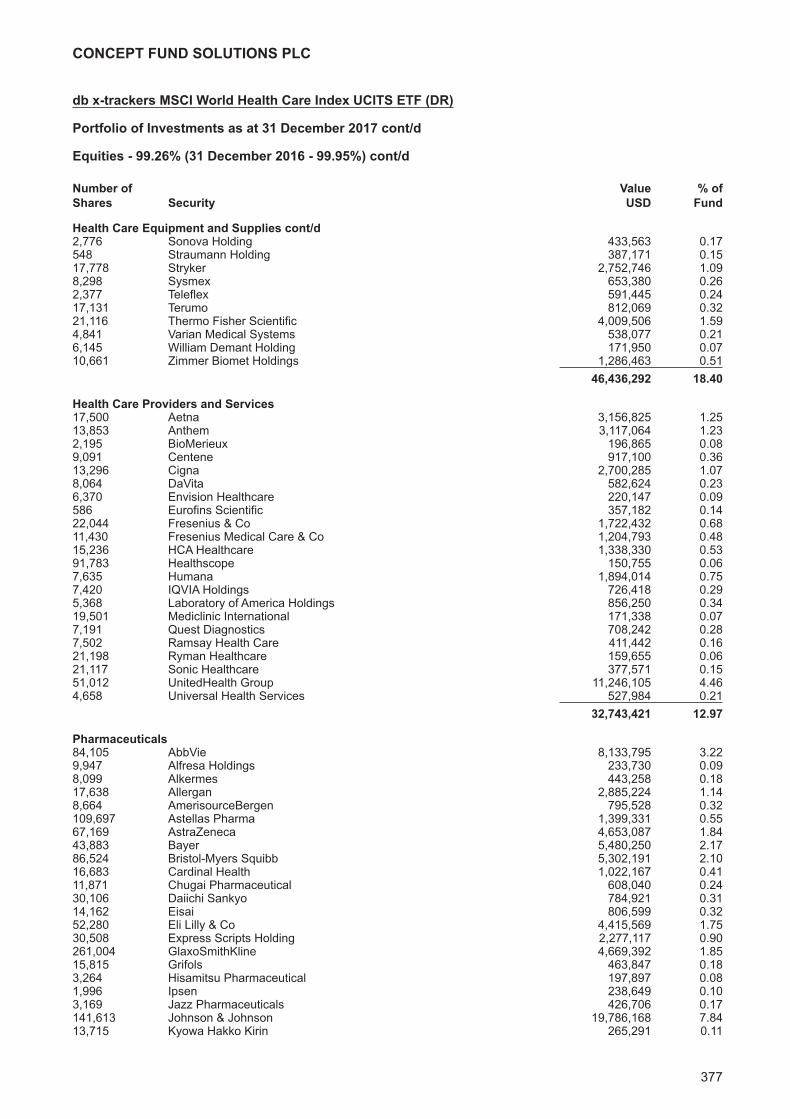
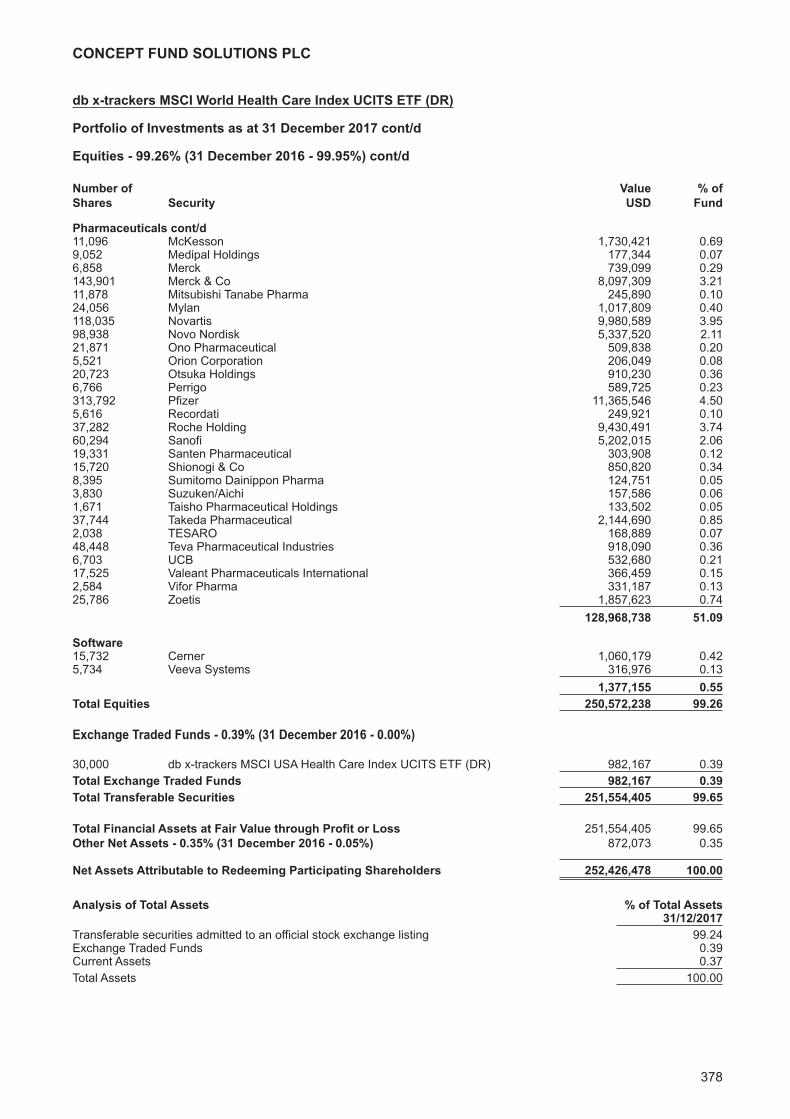
db x-trackers MSCI World Health Care Index UCITS ETF (DR)Investment Manager’s Report 375Portfolio of Investments 376
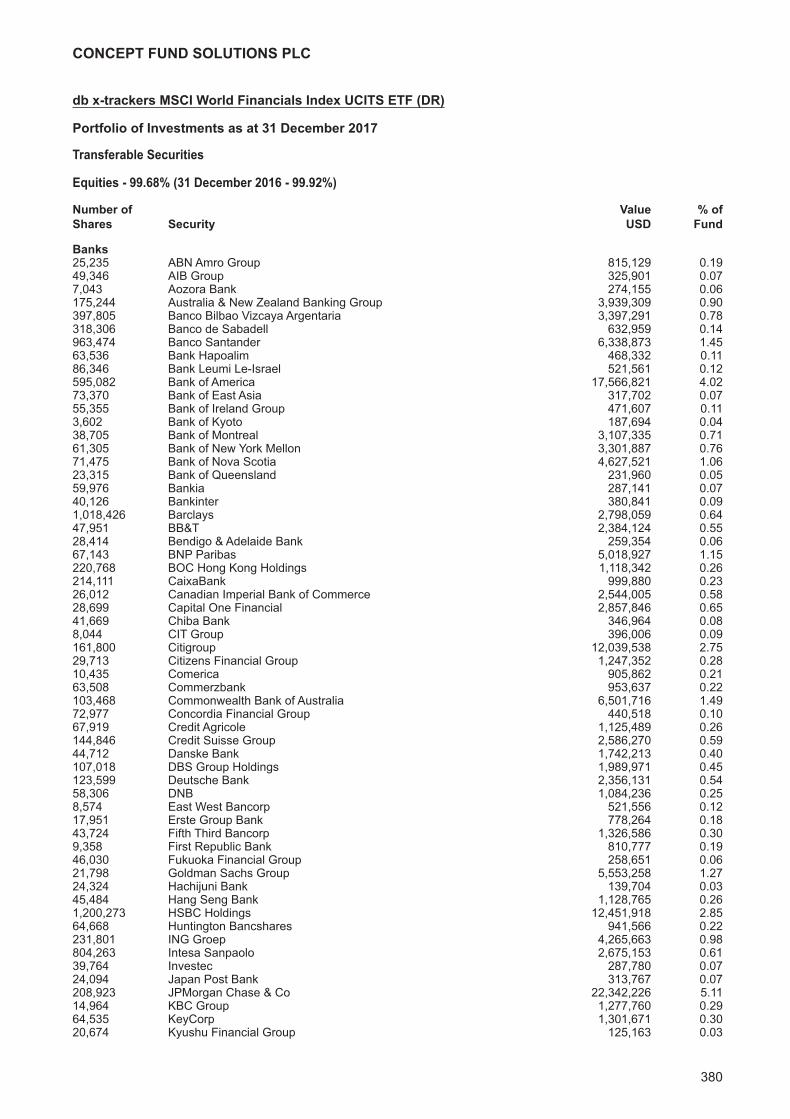
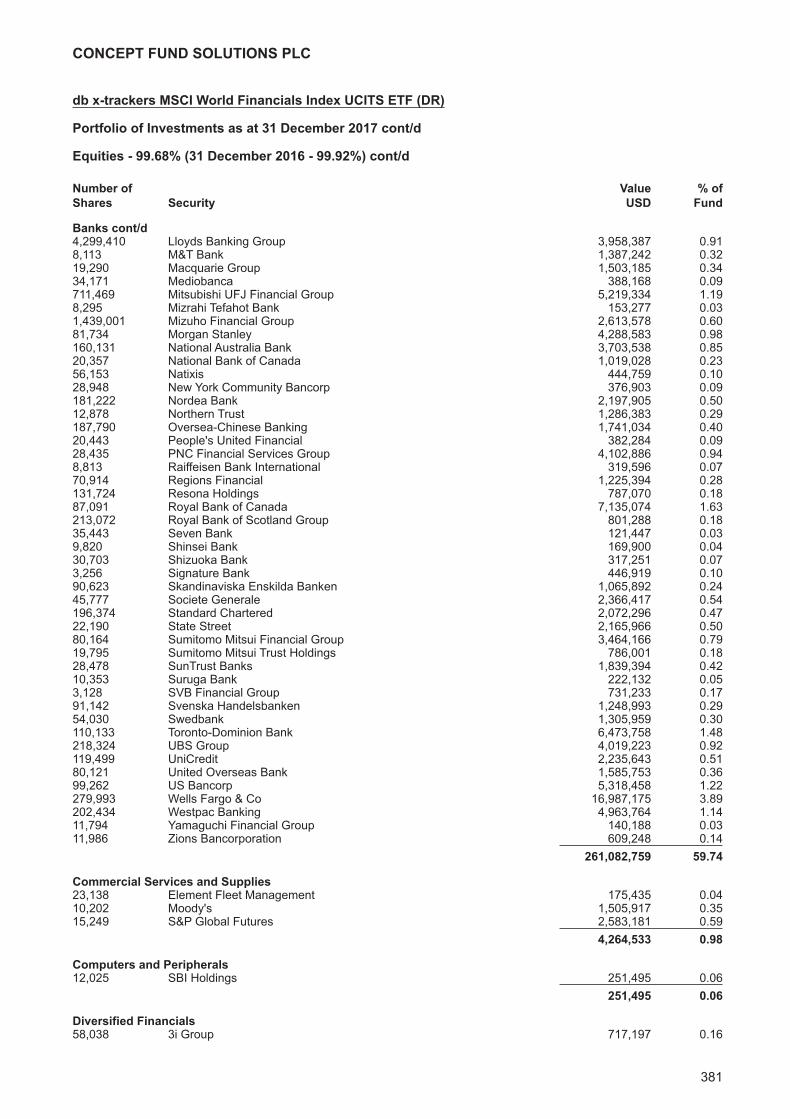
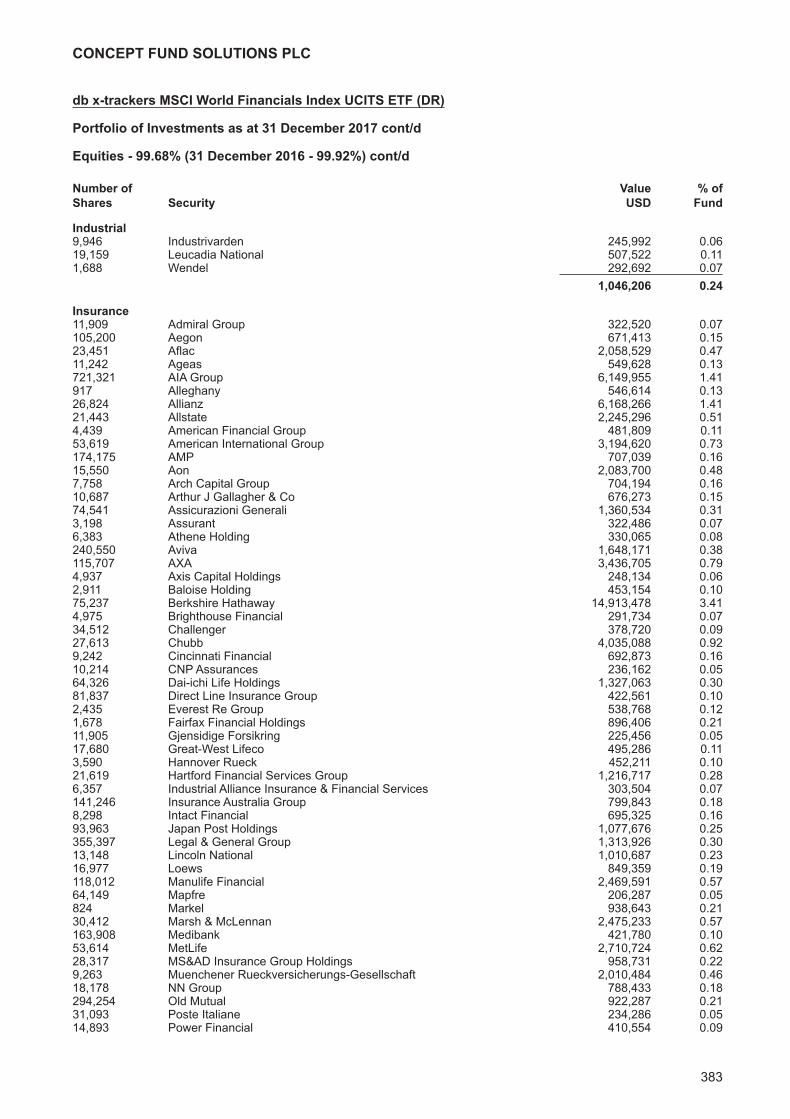
db x-trackers MSCI World Financials Index UCITS ETF (DR)Investment Manager’s Report 379Portfolio of Investments 380
CONCEPT FUND SOLUTIONS PLC
CONTENTS CONT/DPage
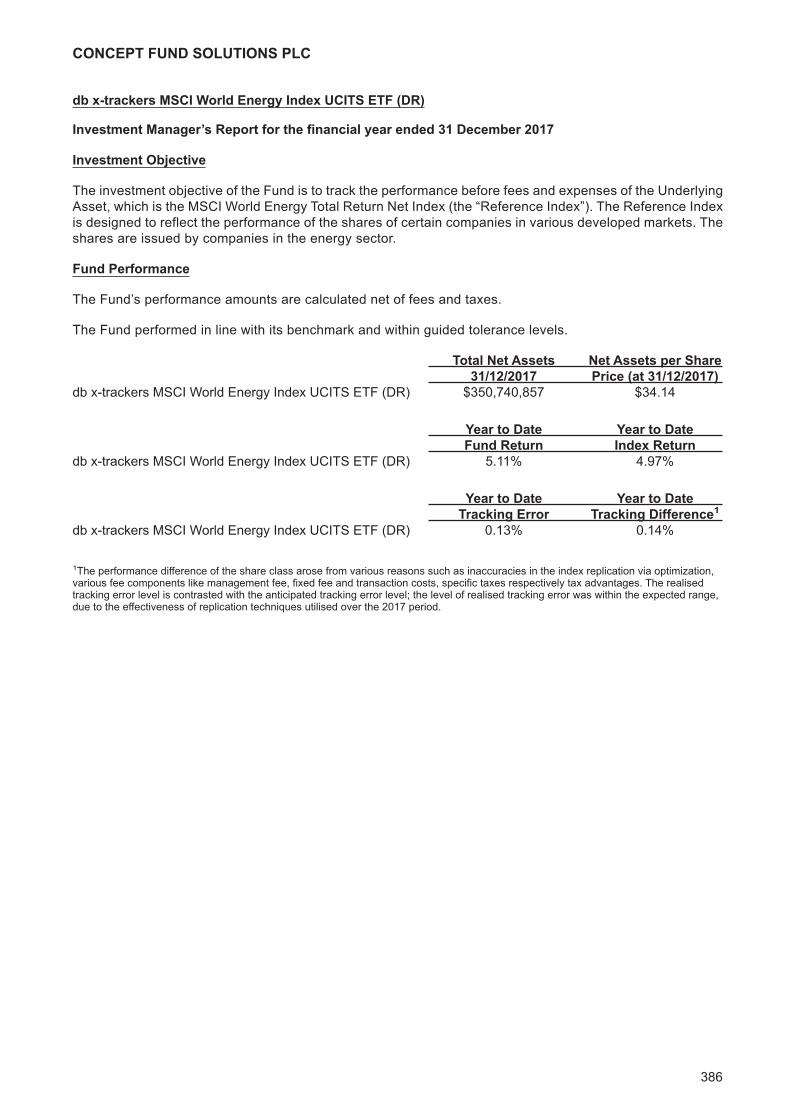
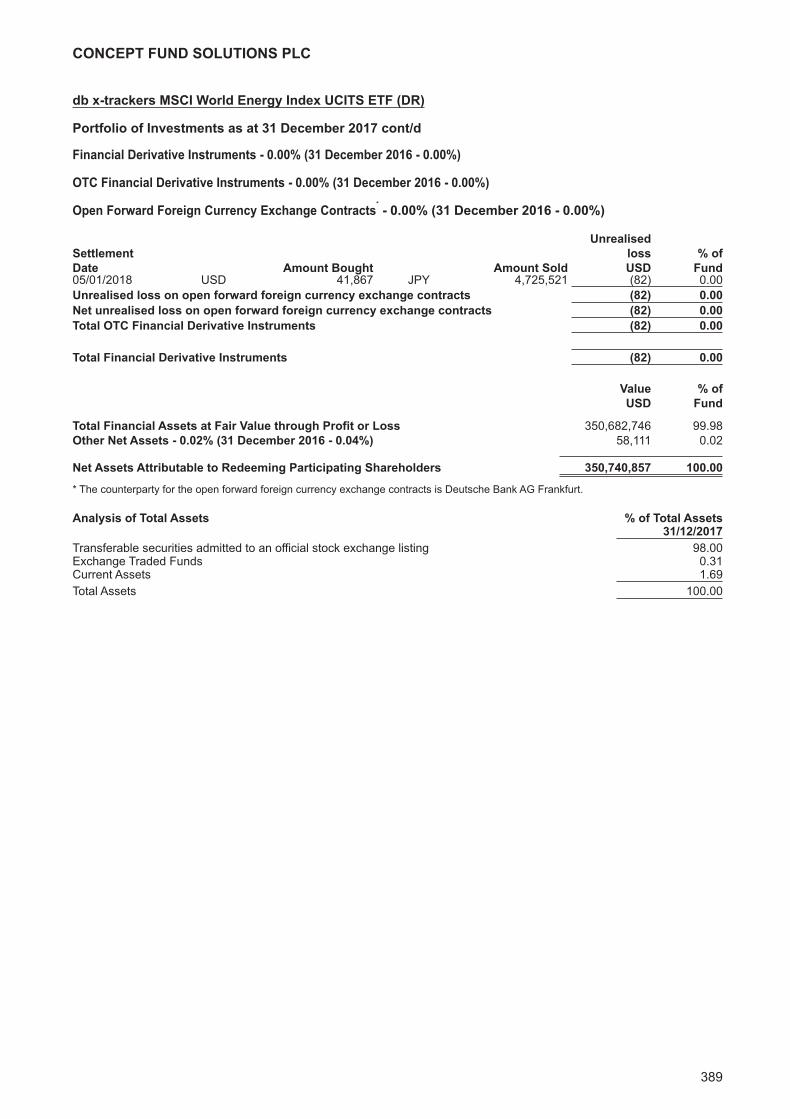
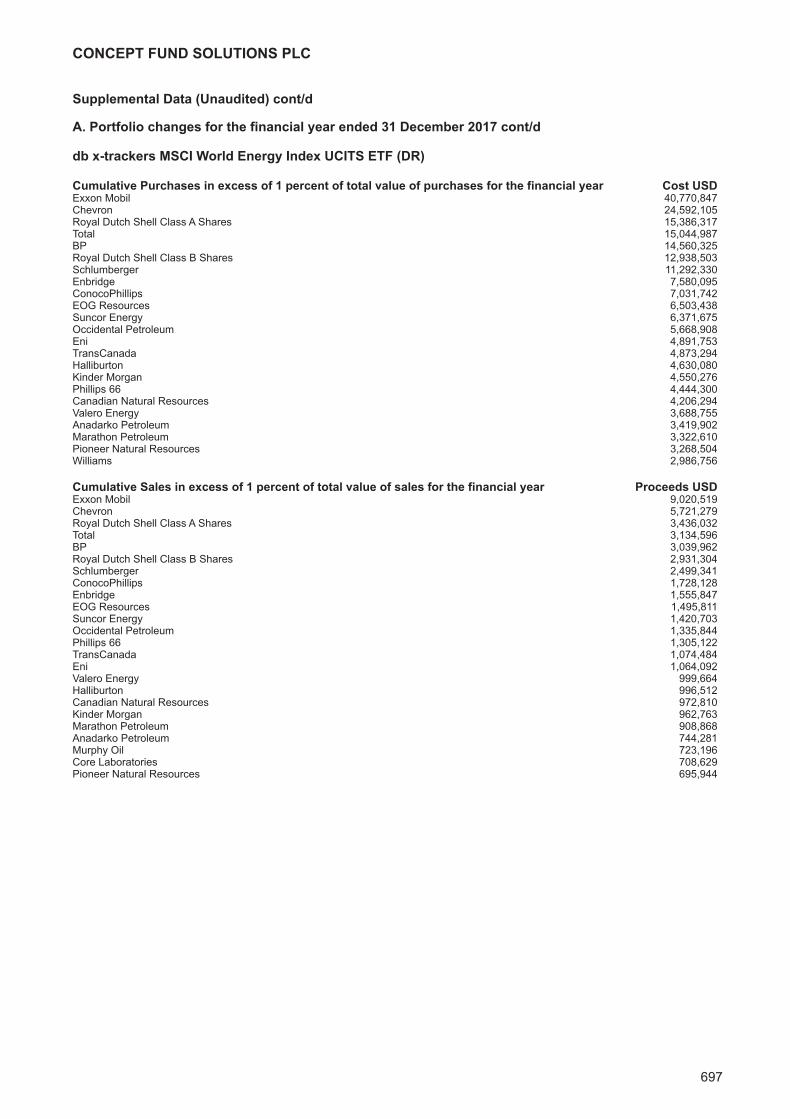
db x-trackers MSCI World Energy Index UCITS ETF (DR)Investment Manager’s Report 386Portfolio of Investments 387
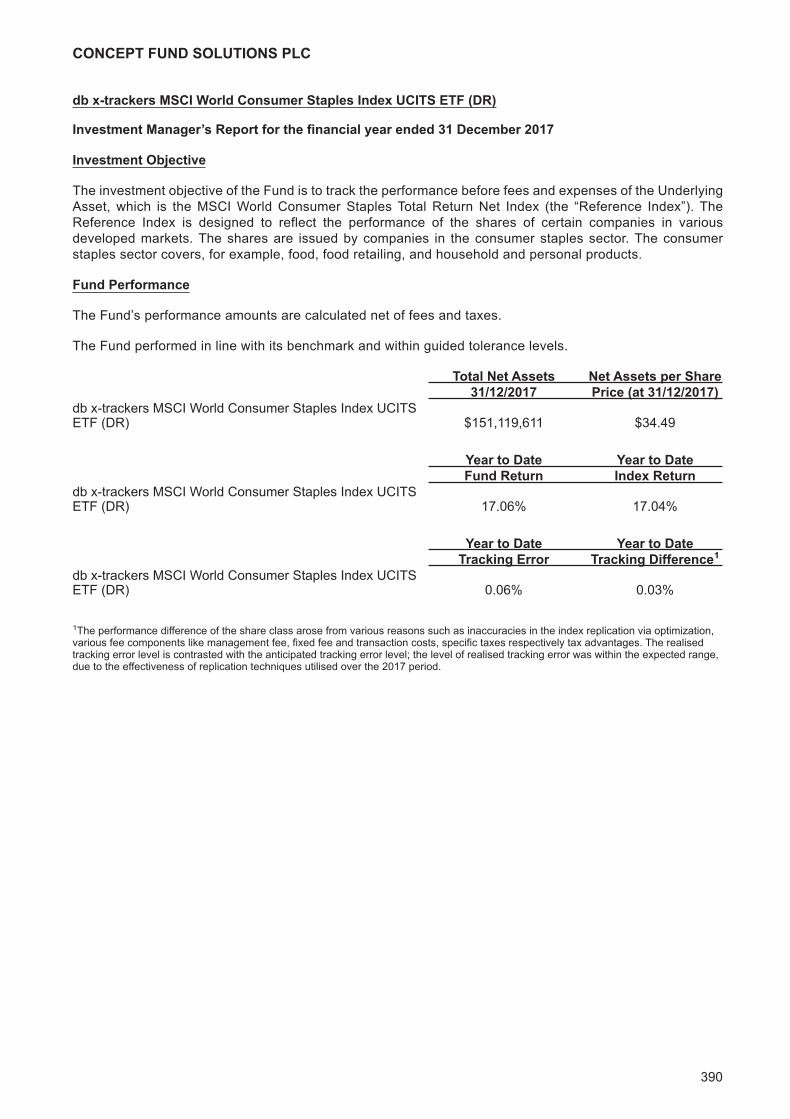
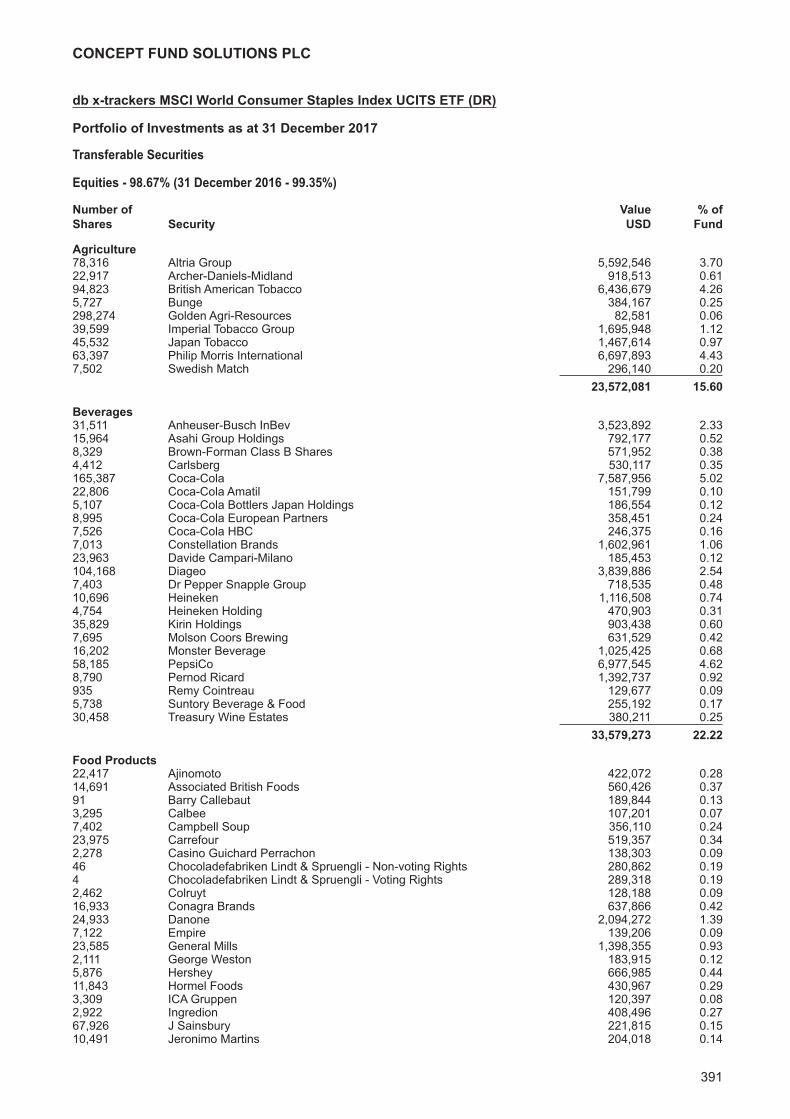
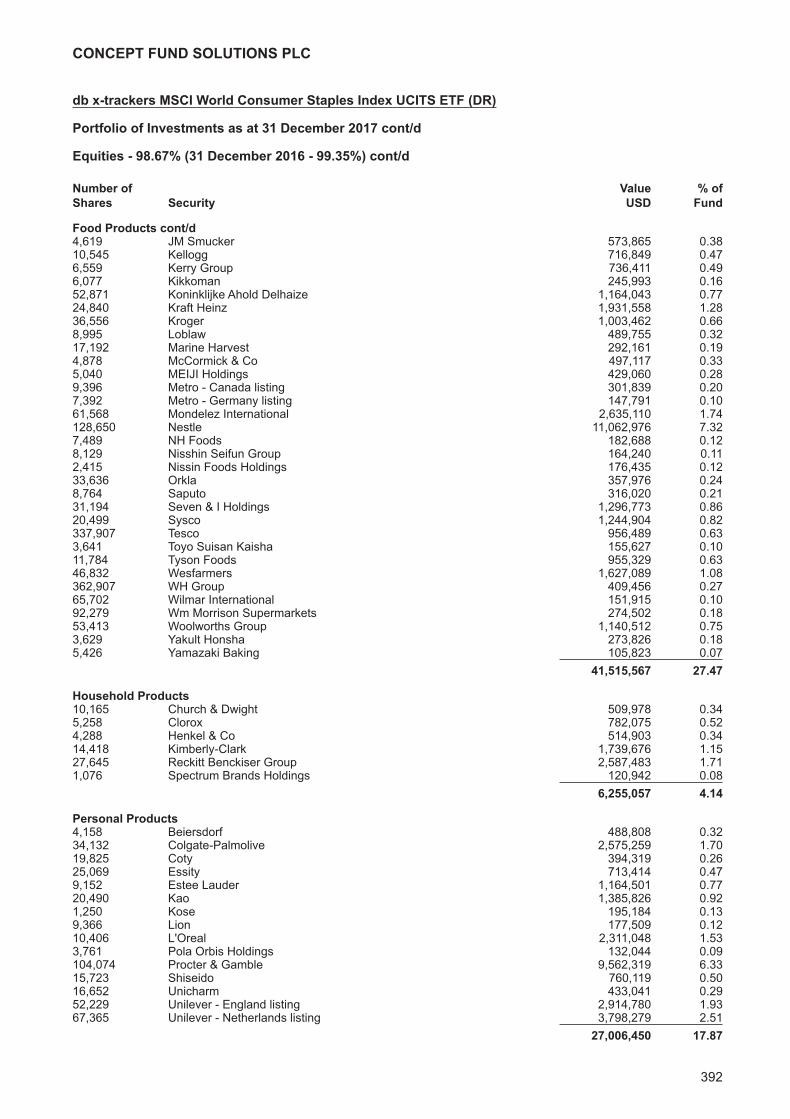
db x-trackers MSCI World Consumer Staples Index UCITS ETF (DR)Investment Manager’s Report 390Portfolio of Investments 391
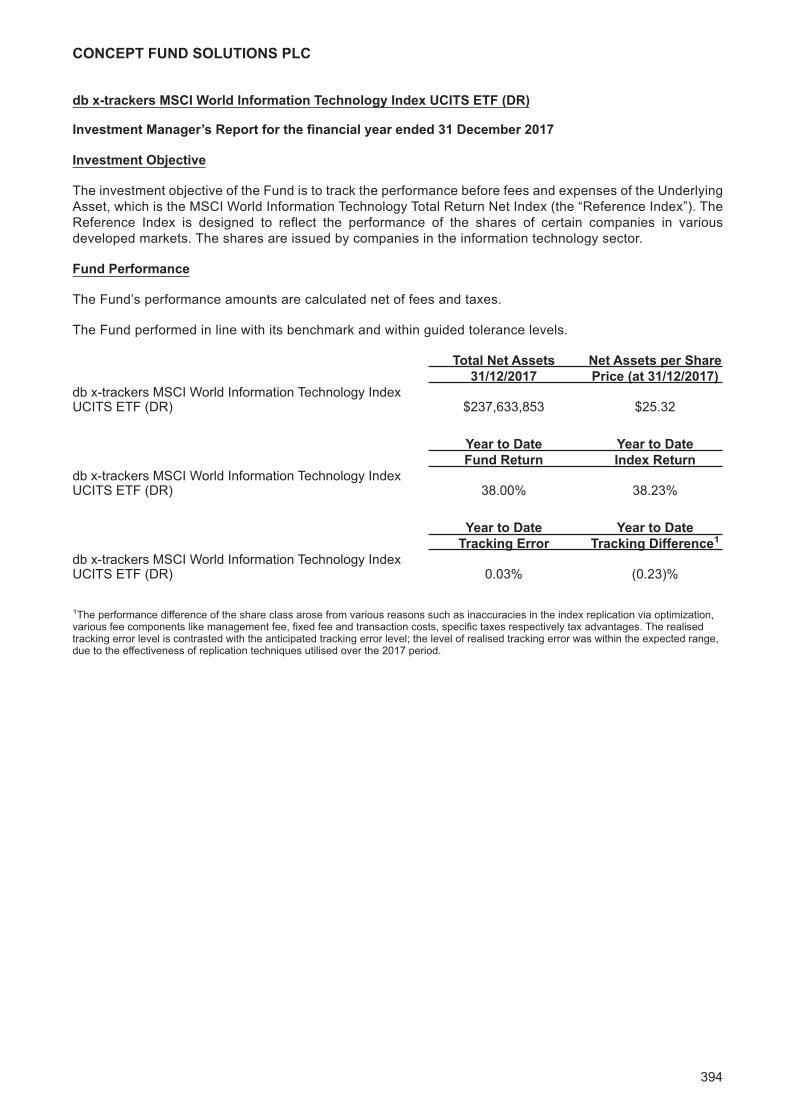
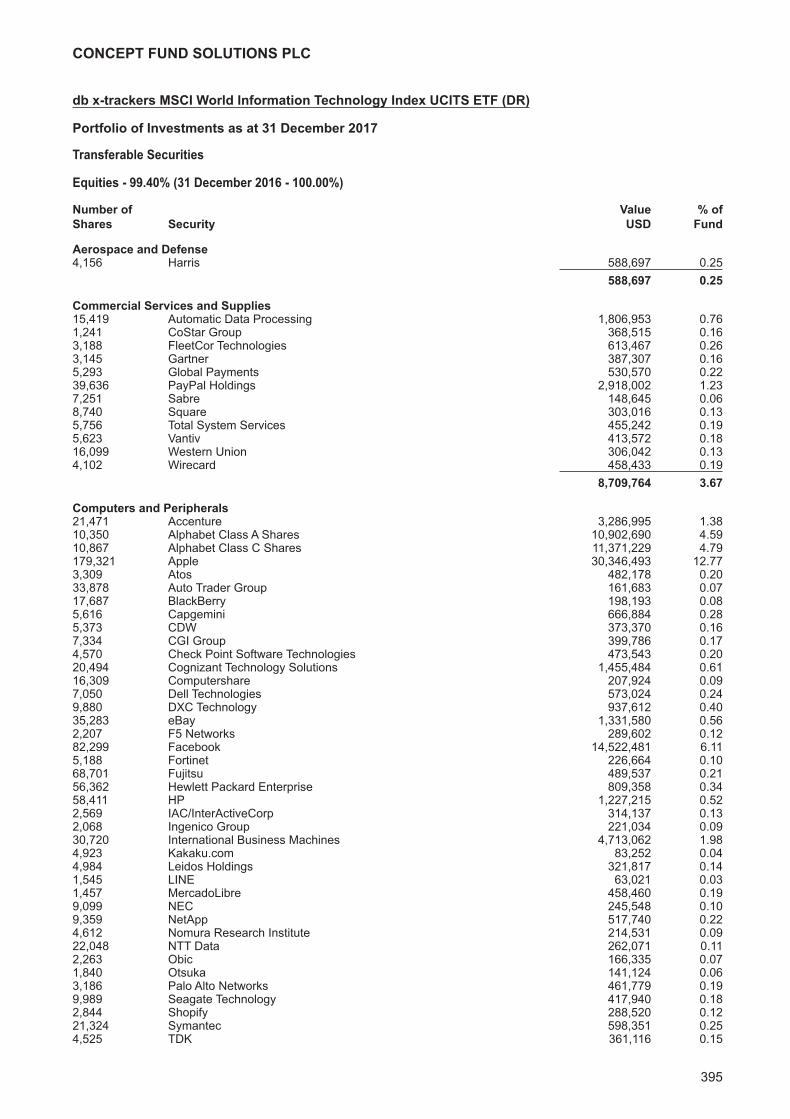
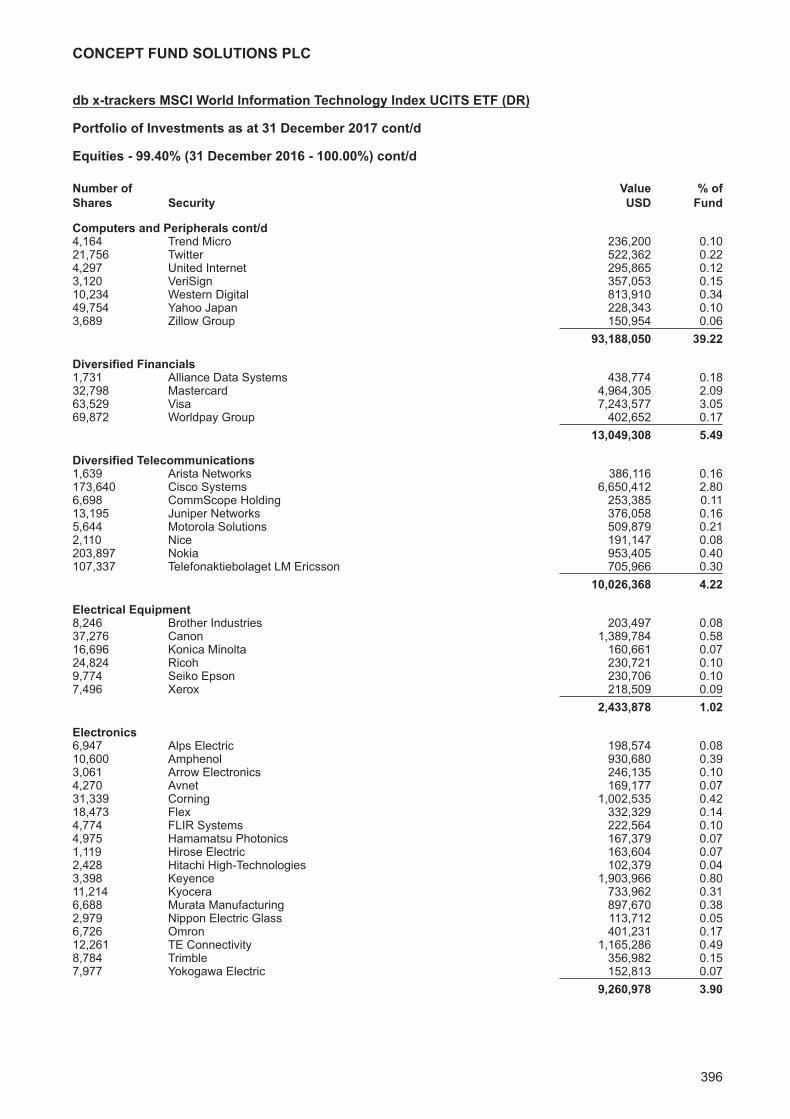
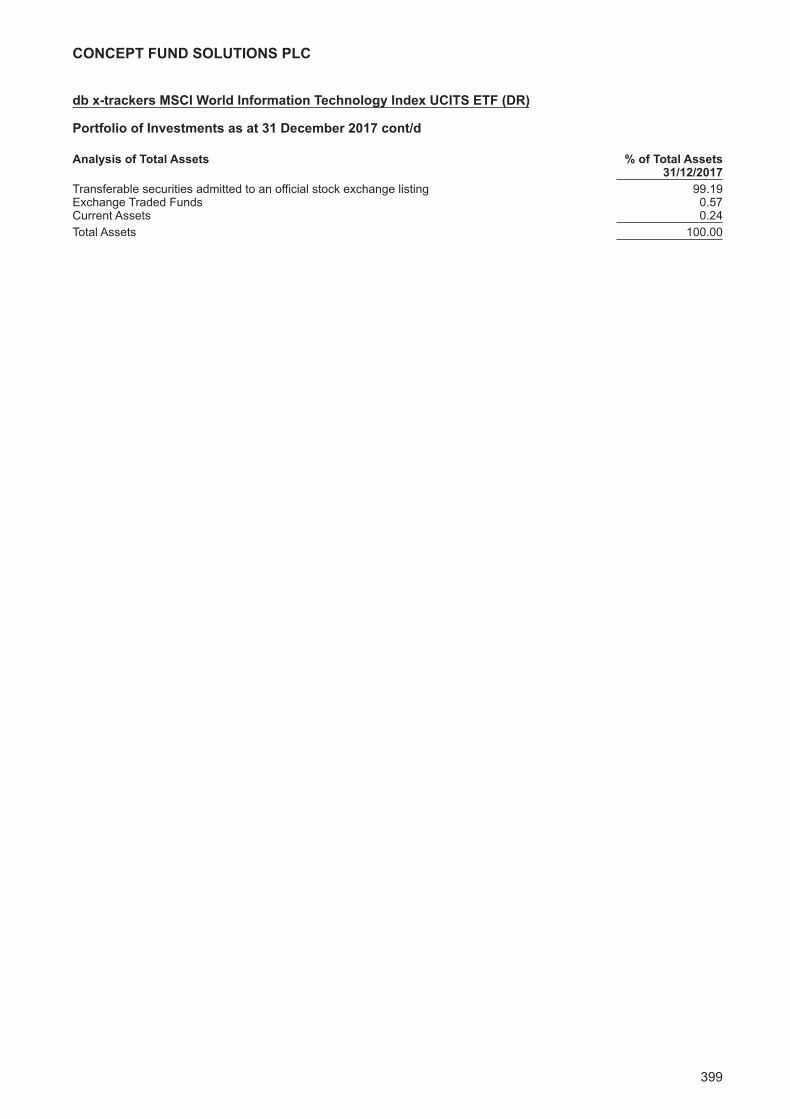
db x-trackers MSCI World Information Technology Index UCITS ETF (DR)Investment Manager’s Report 394Portfolio of Investments 395
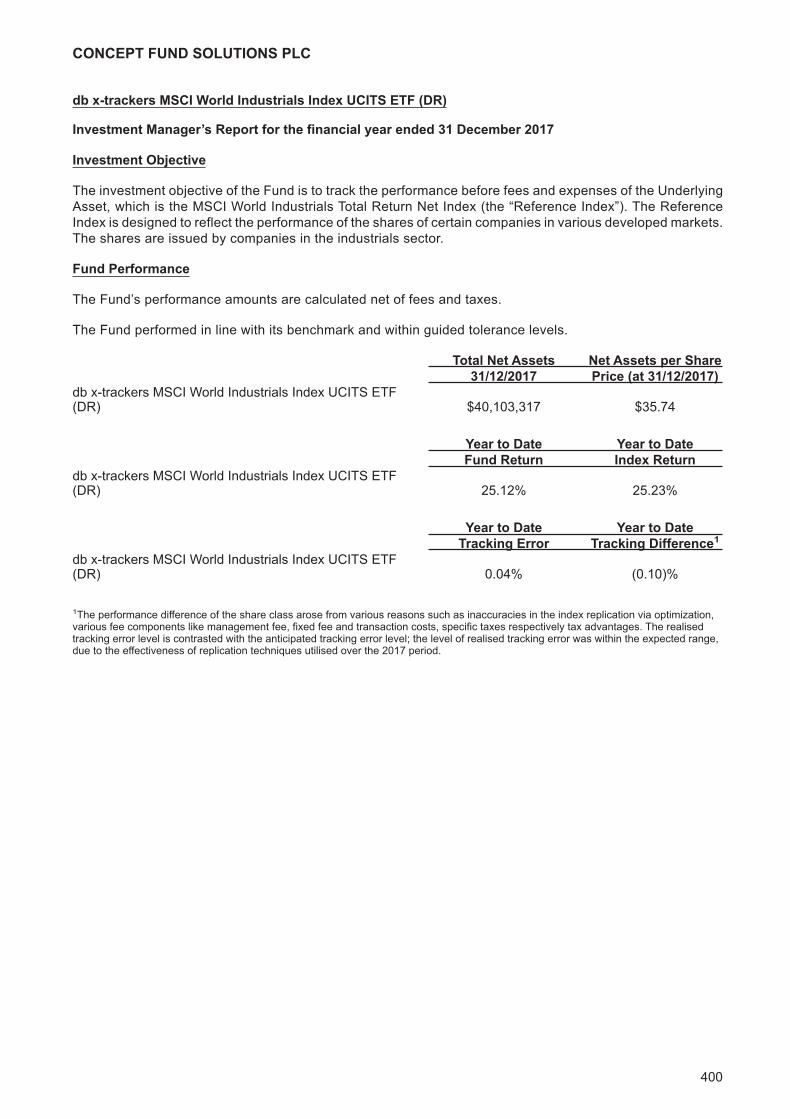
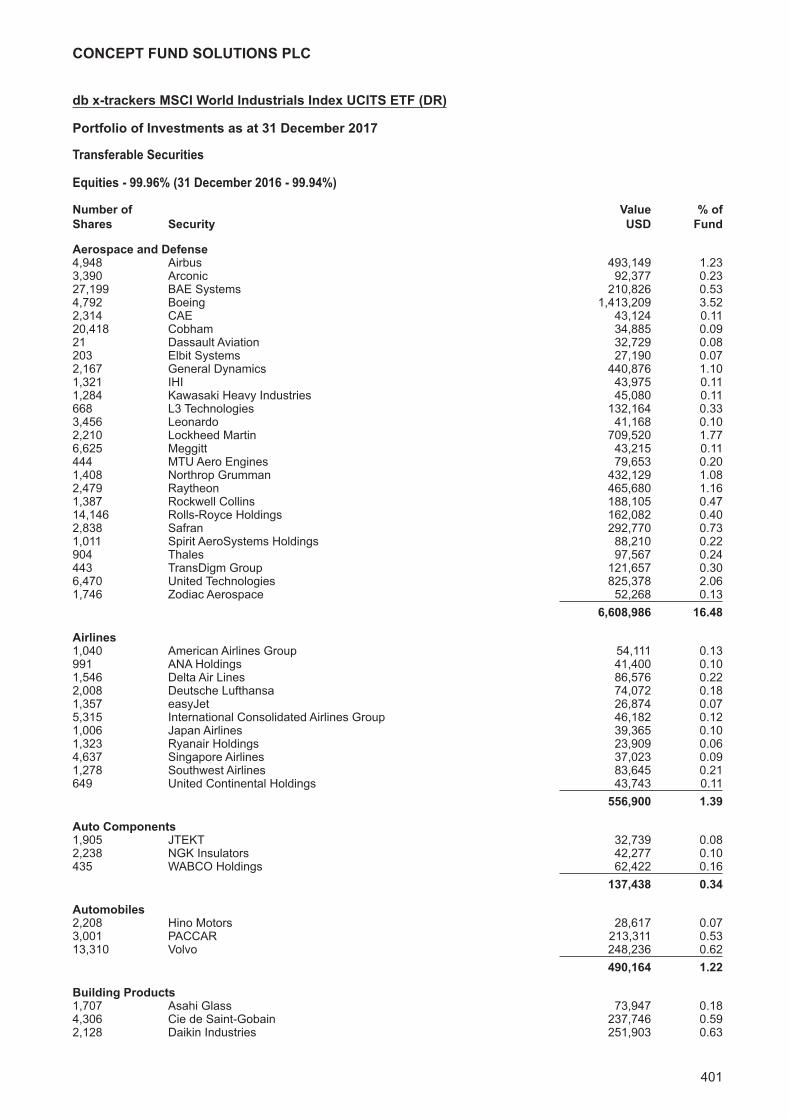
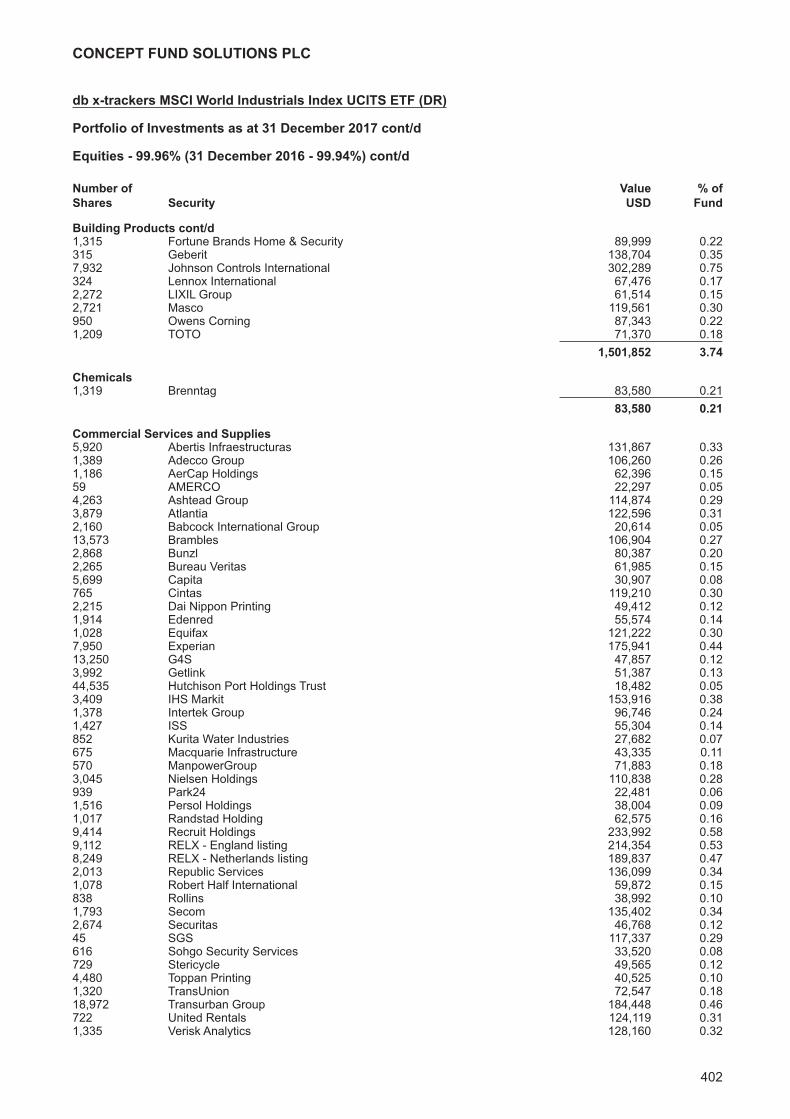
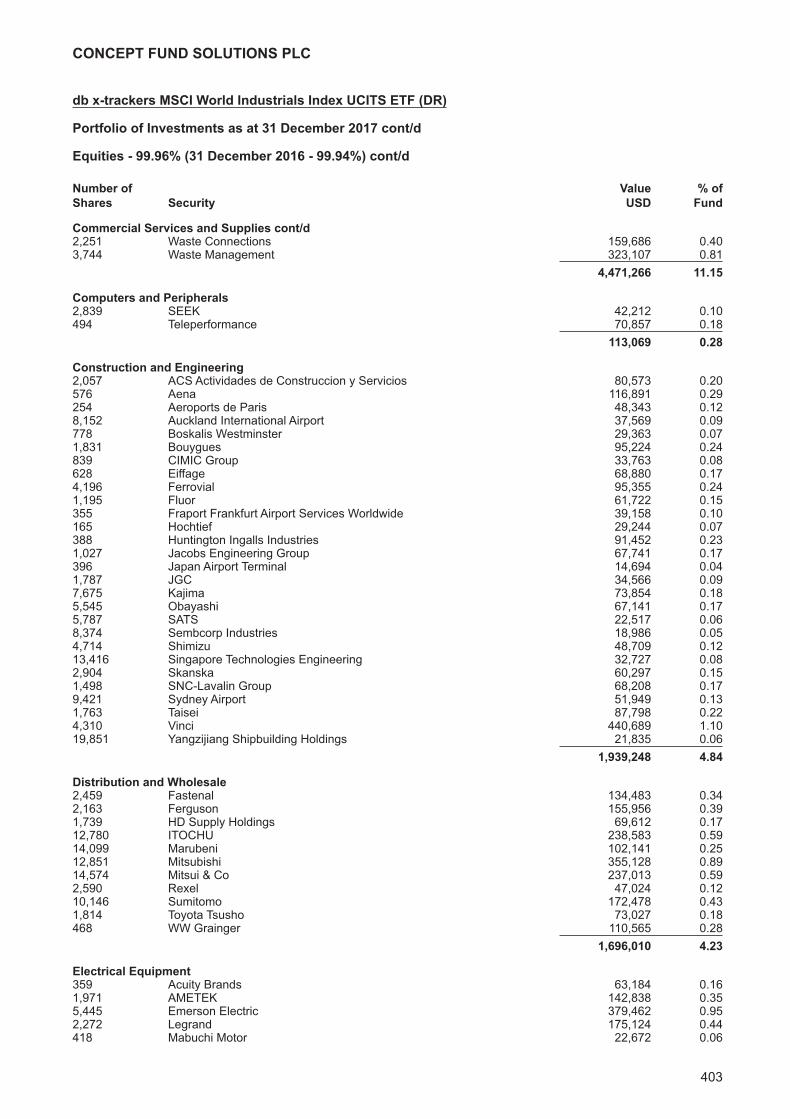
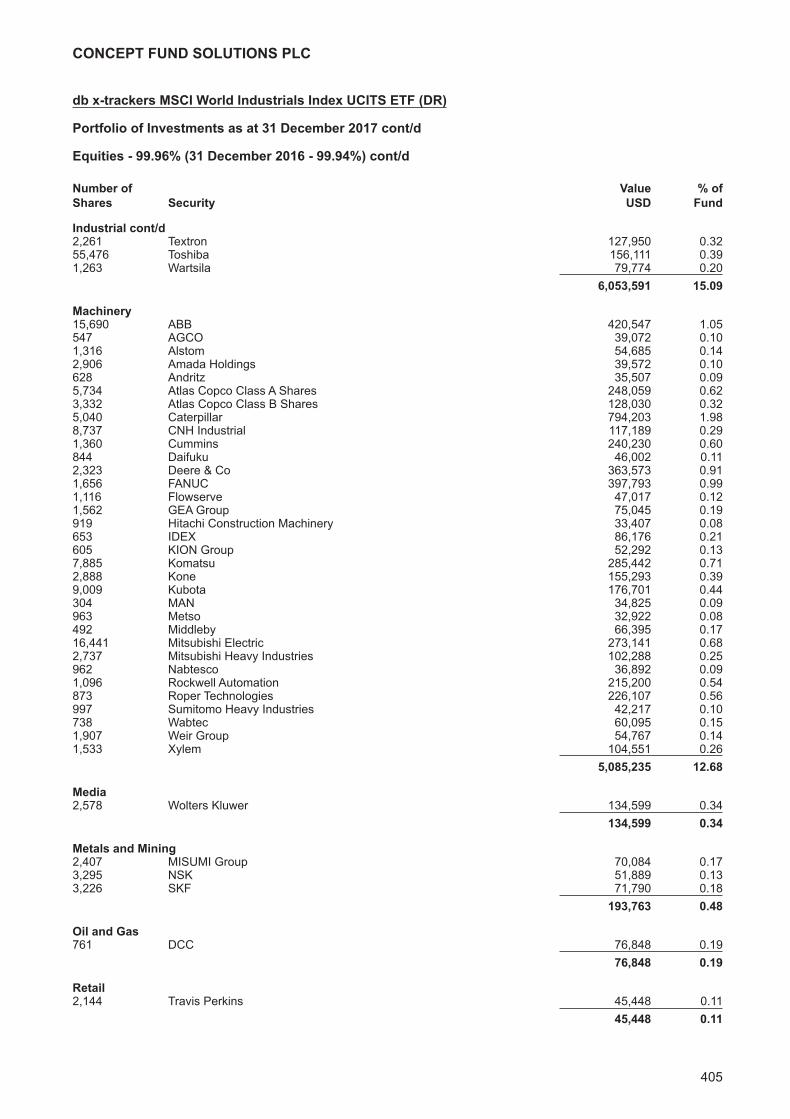
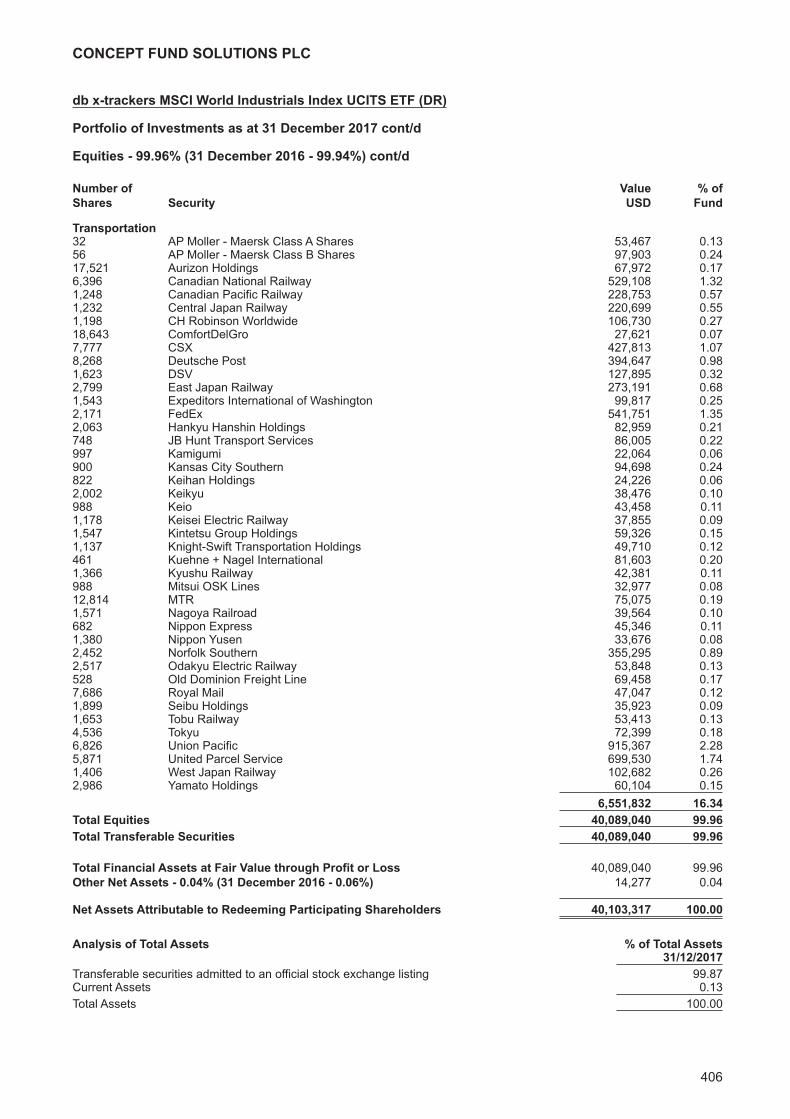
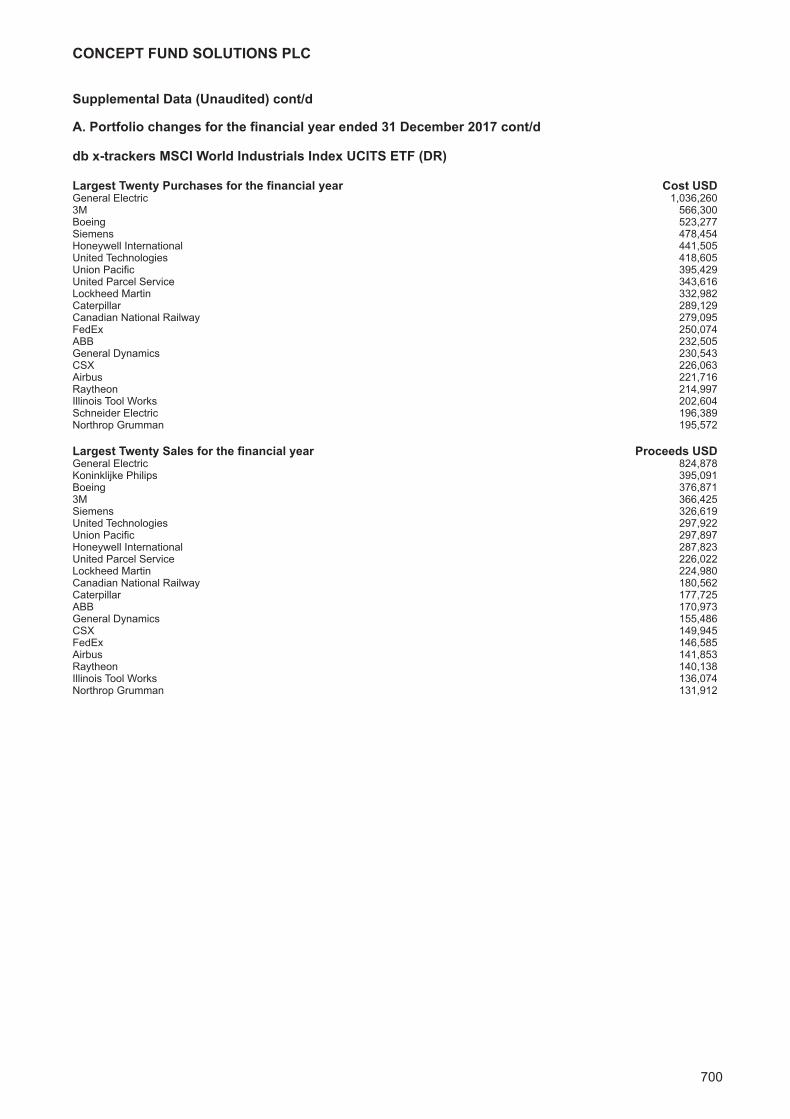
db x-trackers MSCI World Industrials Index UCITS ETF (DR)Investment Manager’s Report 400Portfolio of Investments 401
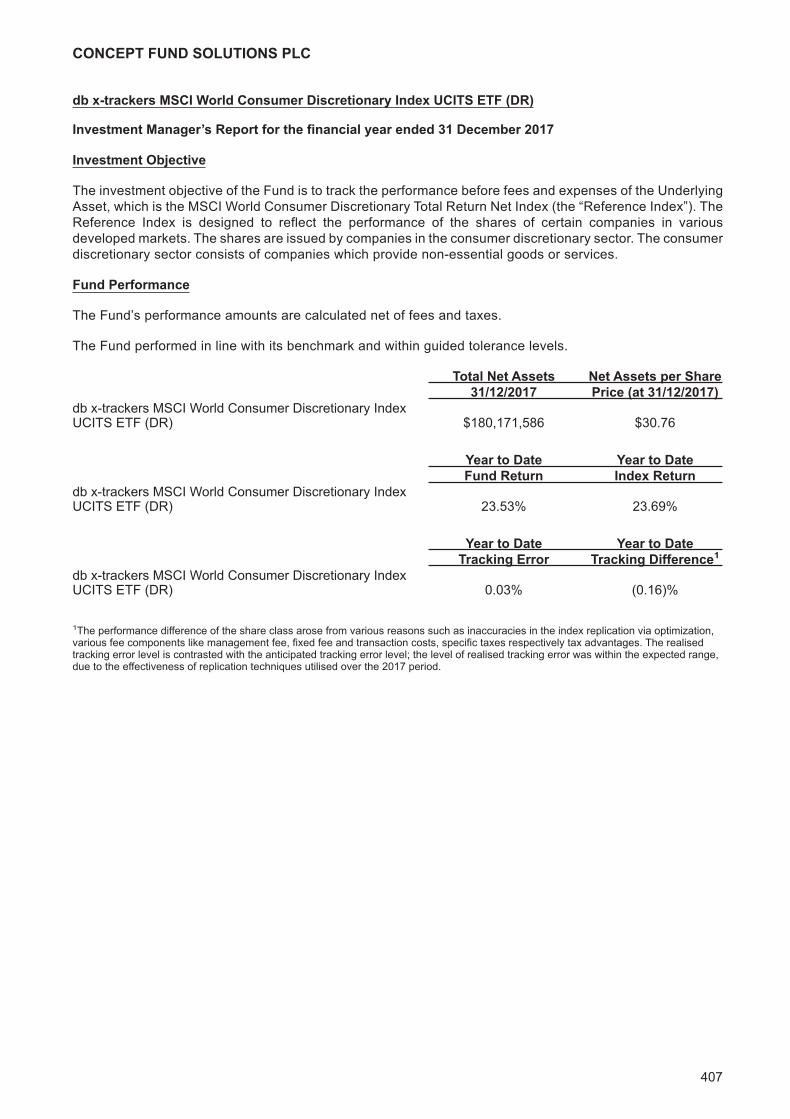
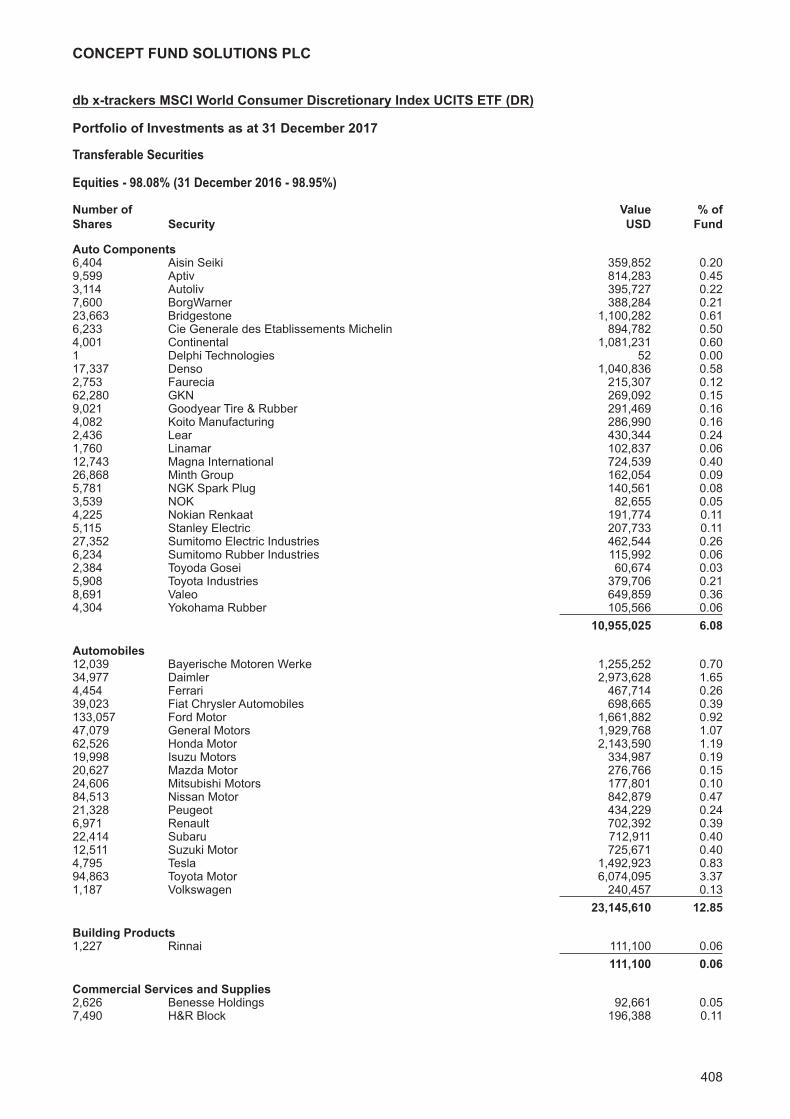
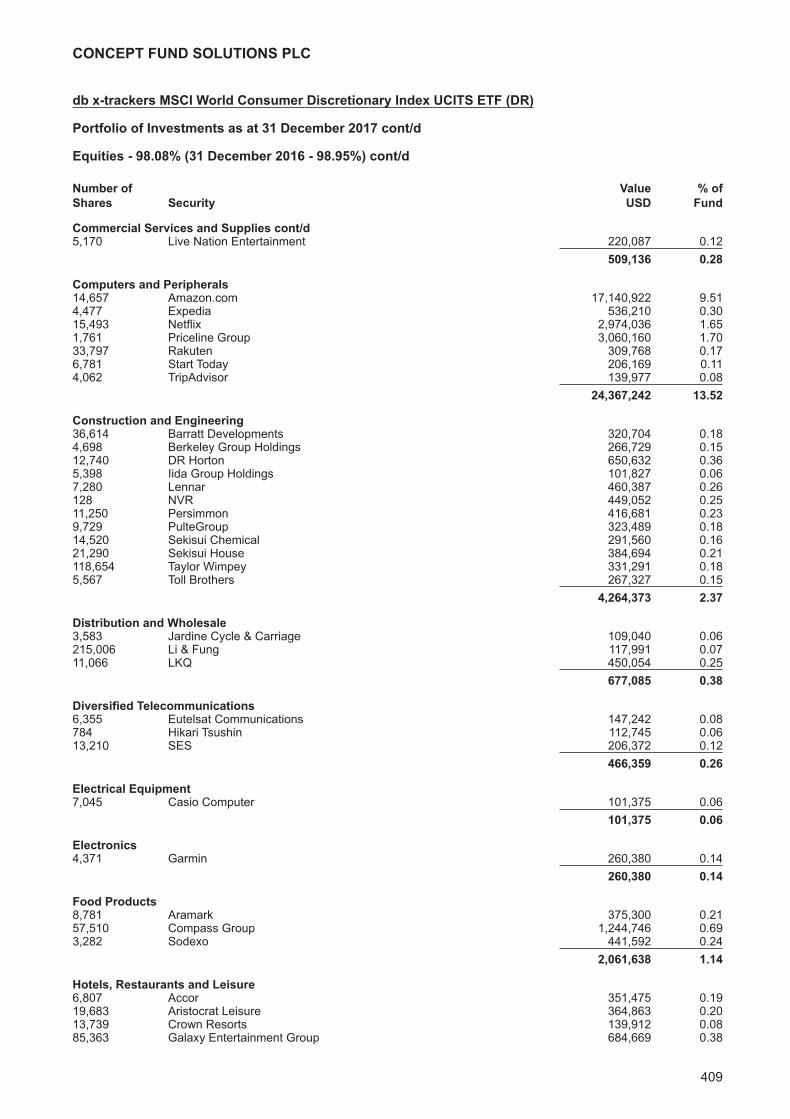
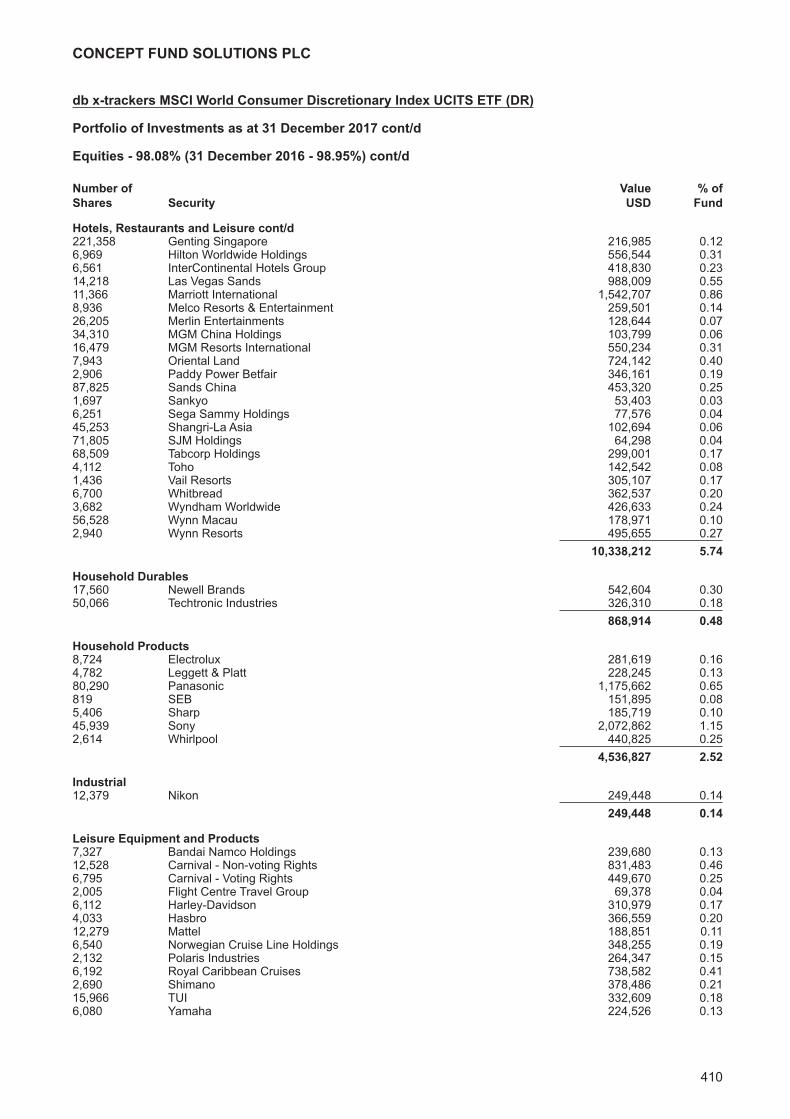
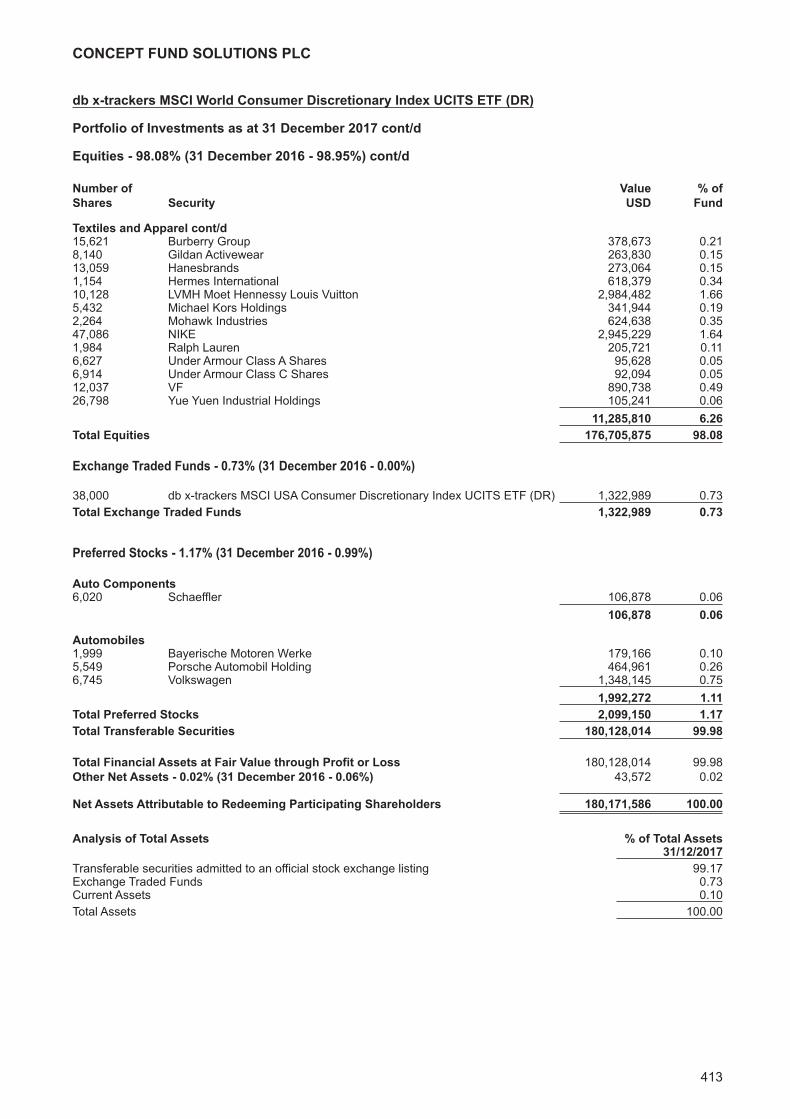
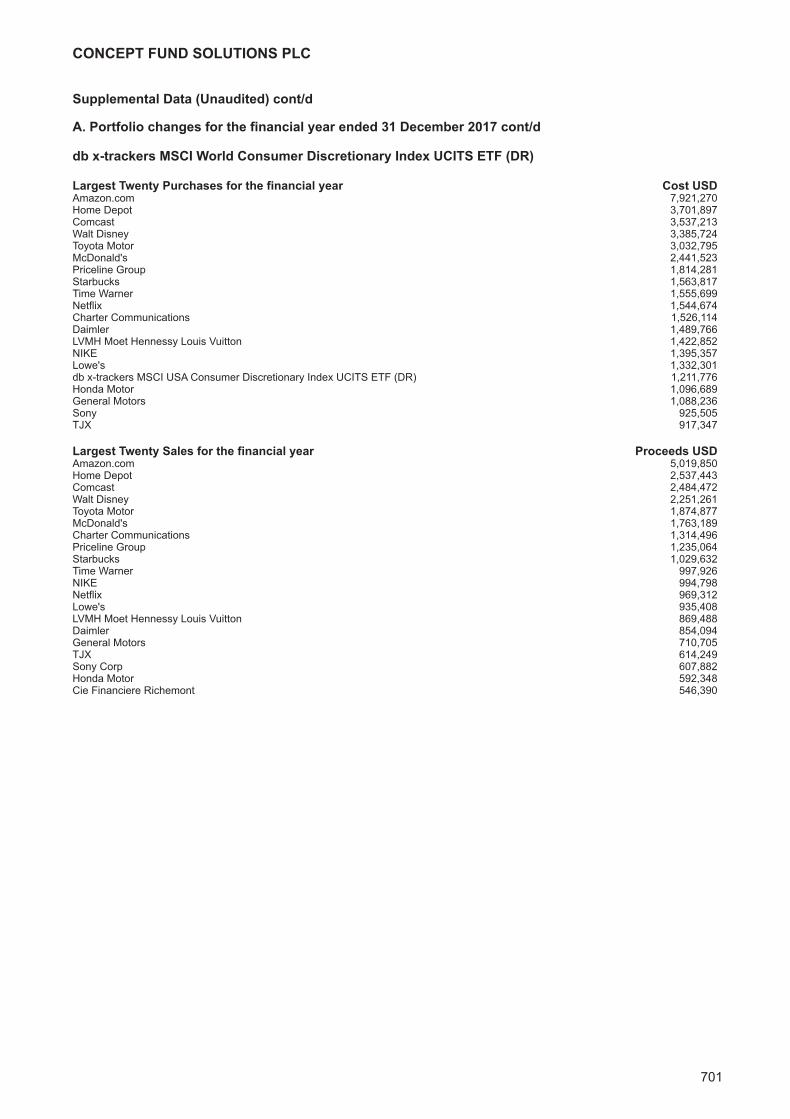
db x-trackers MSCI World Consumer Discretionary Index UCITS ETF (DR)Investment Manager’s Report 407Portfolio of Investments 408
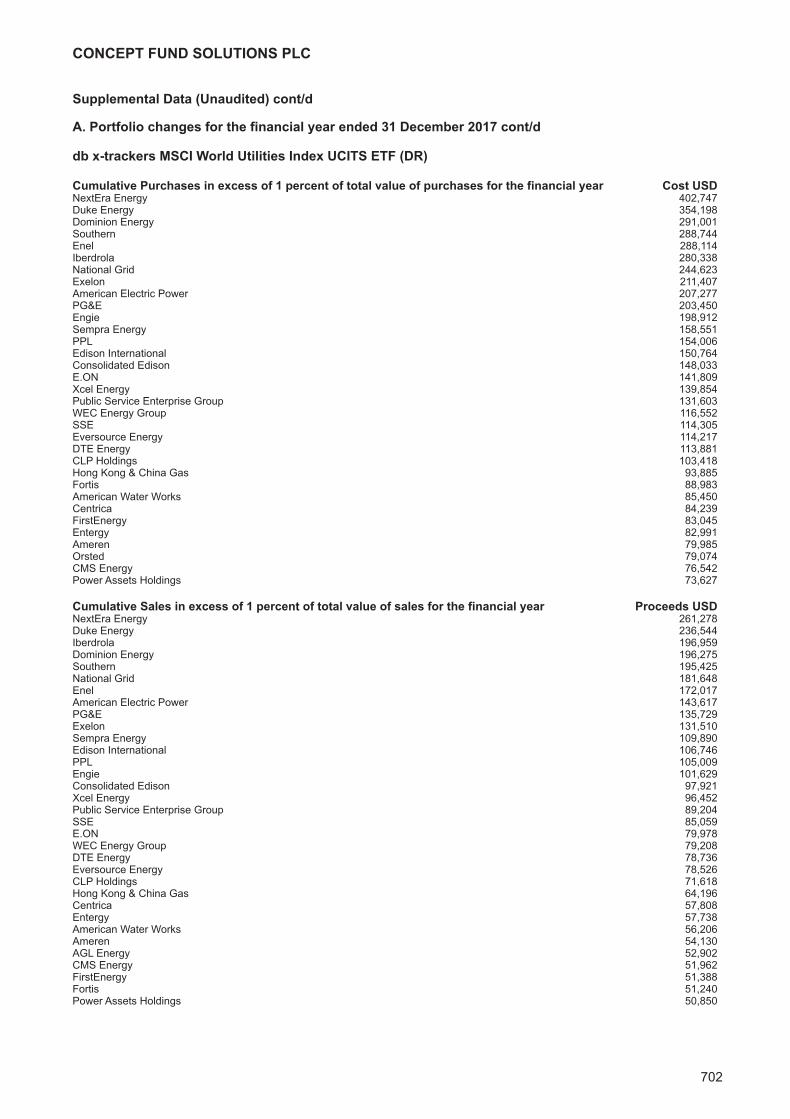
db x-trackers MSCI World Utilities Index UCITS ETF (DR)Investment Manager’s Report 414Portfolio of Investments 415
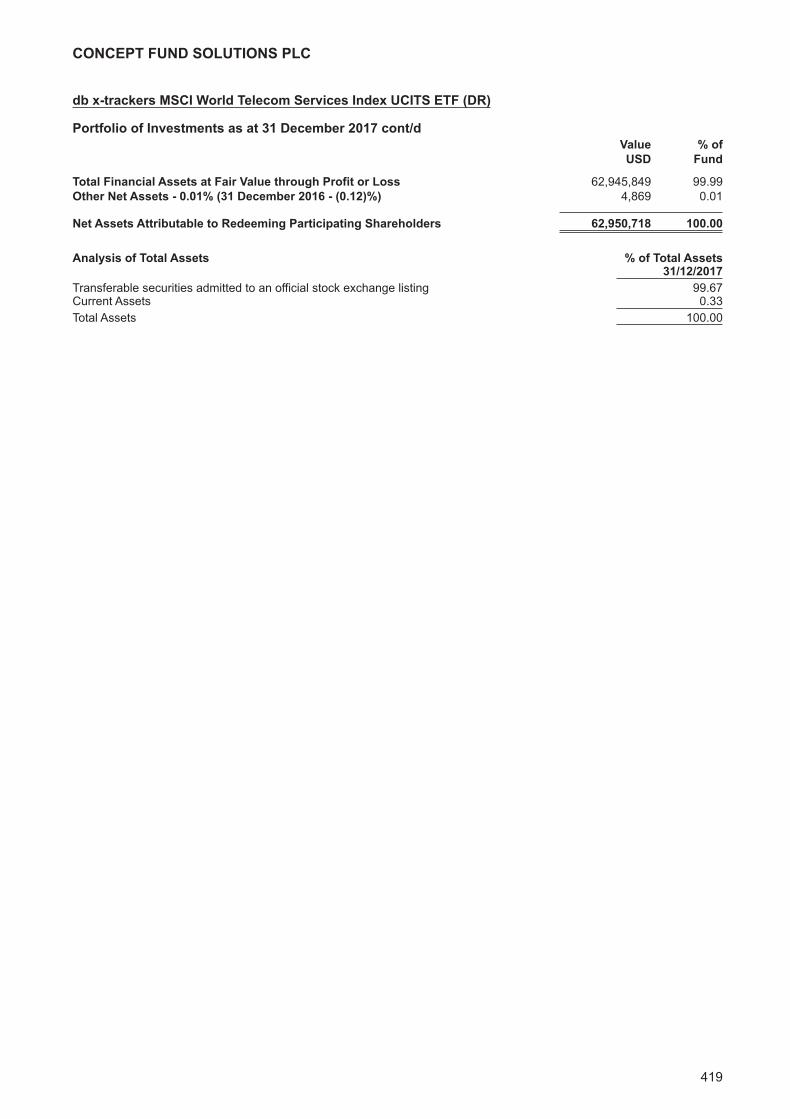
db x-trackers MSCI World Telecom Services Index UCITS ETF (DR)Investment Manager’s Report 417Portfolio of Investments 418
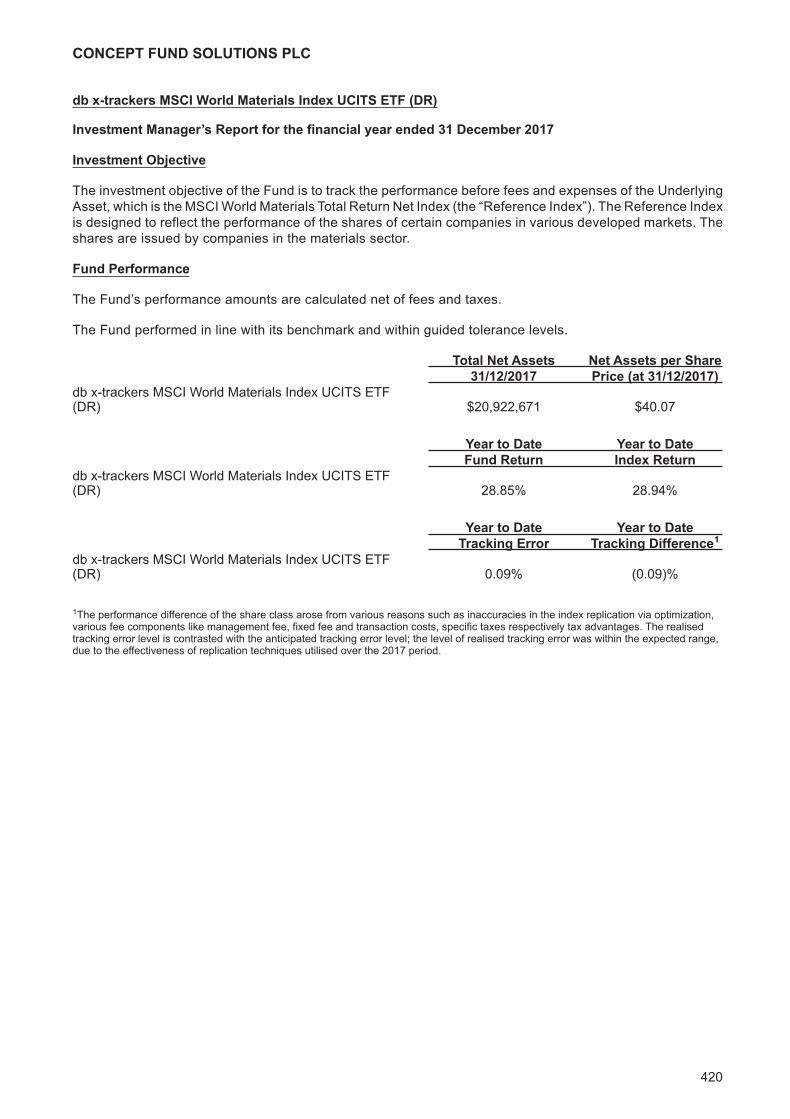
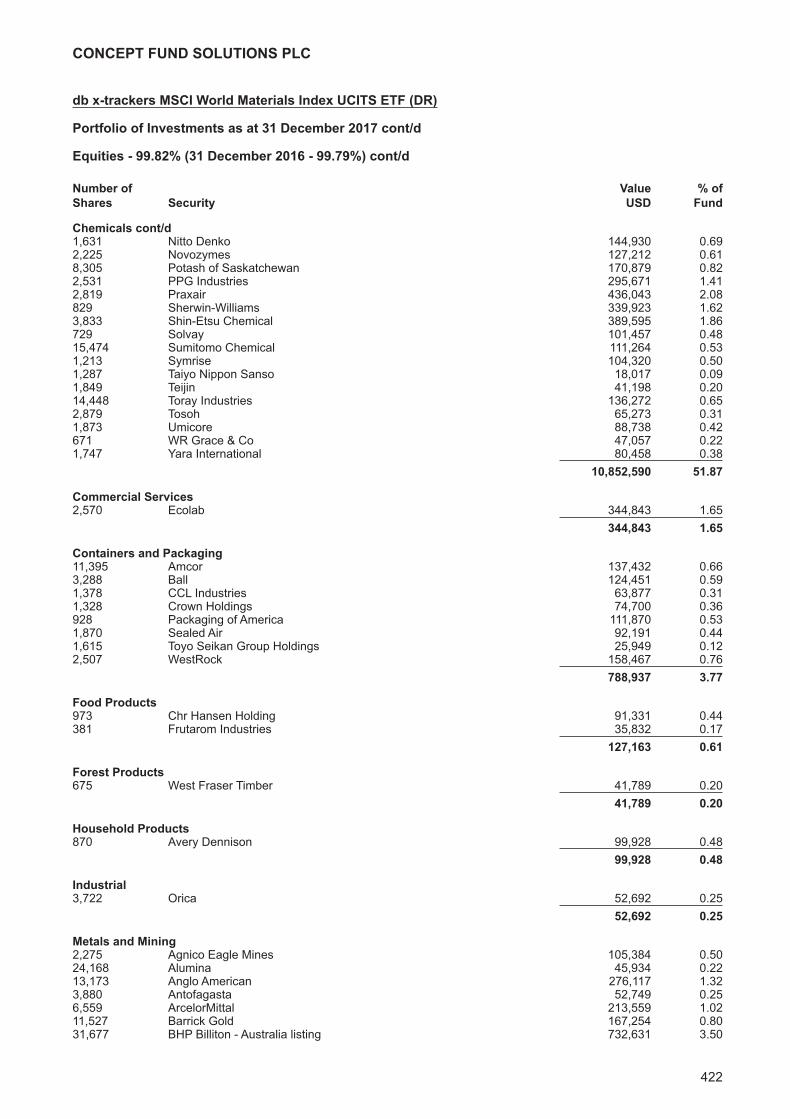
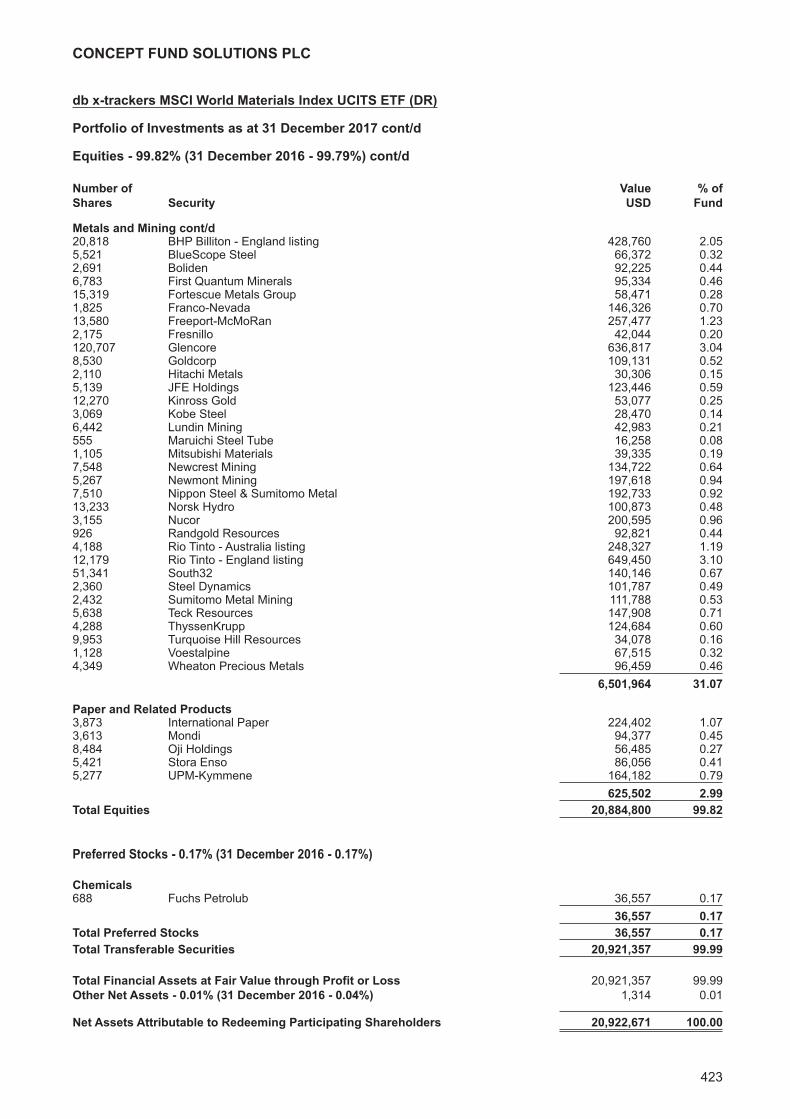
db x-trackers MSCI World Materials Index UCITS ETF (DR)Investment Manager’s Report 420Portfolio of Investments 421
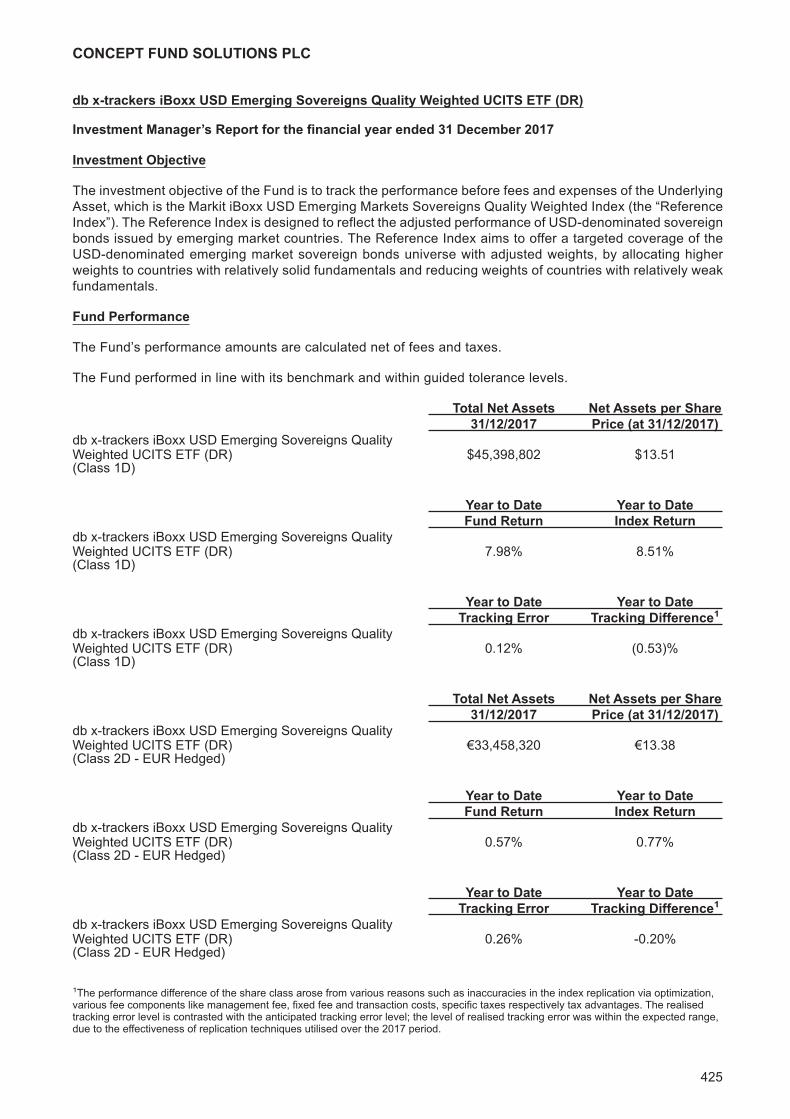
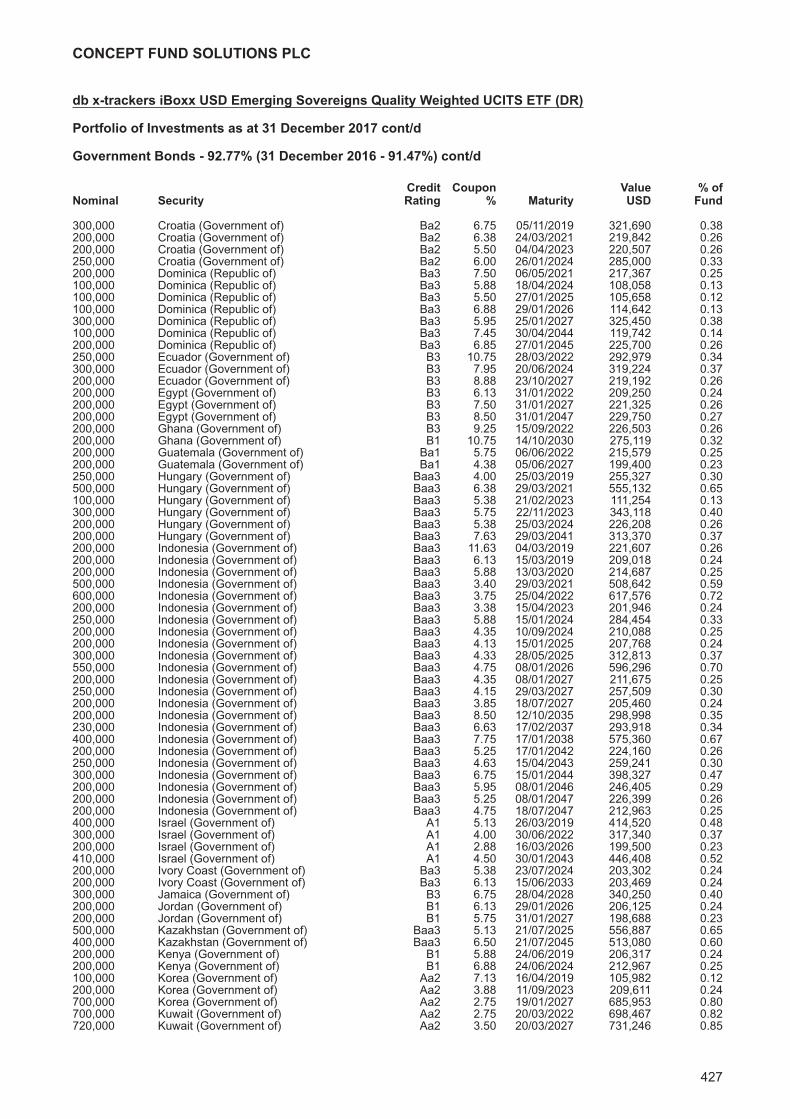
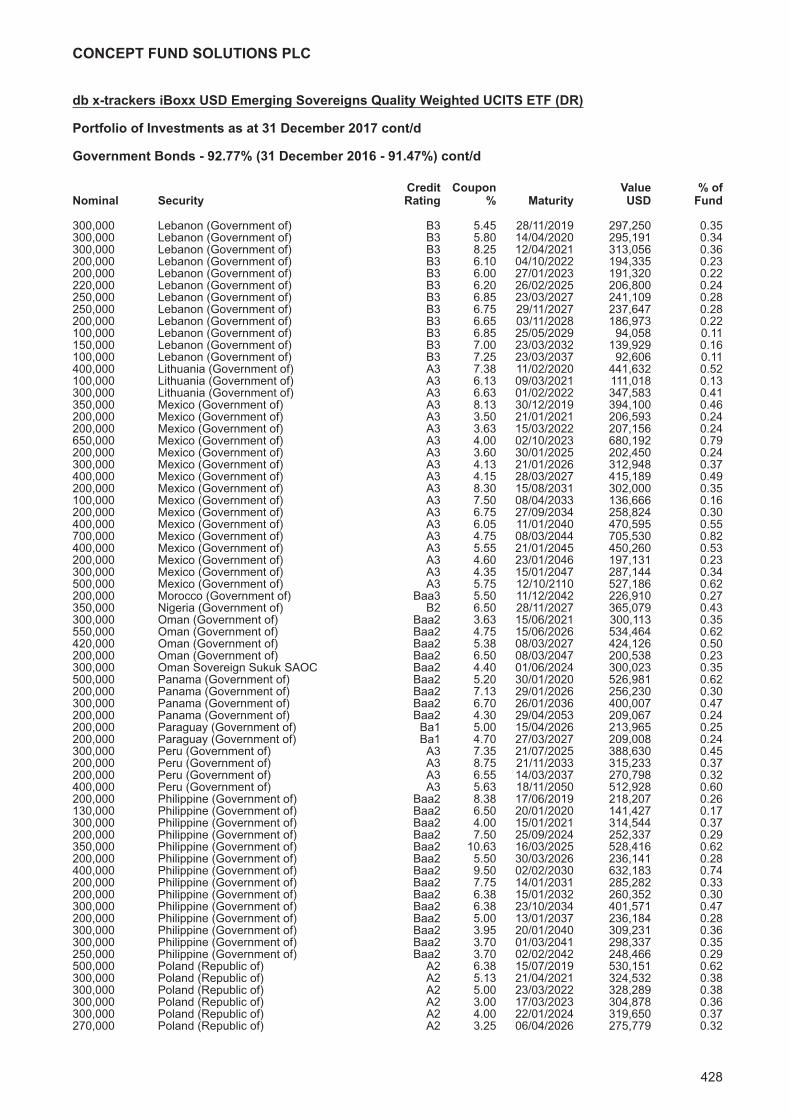
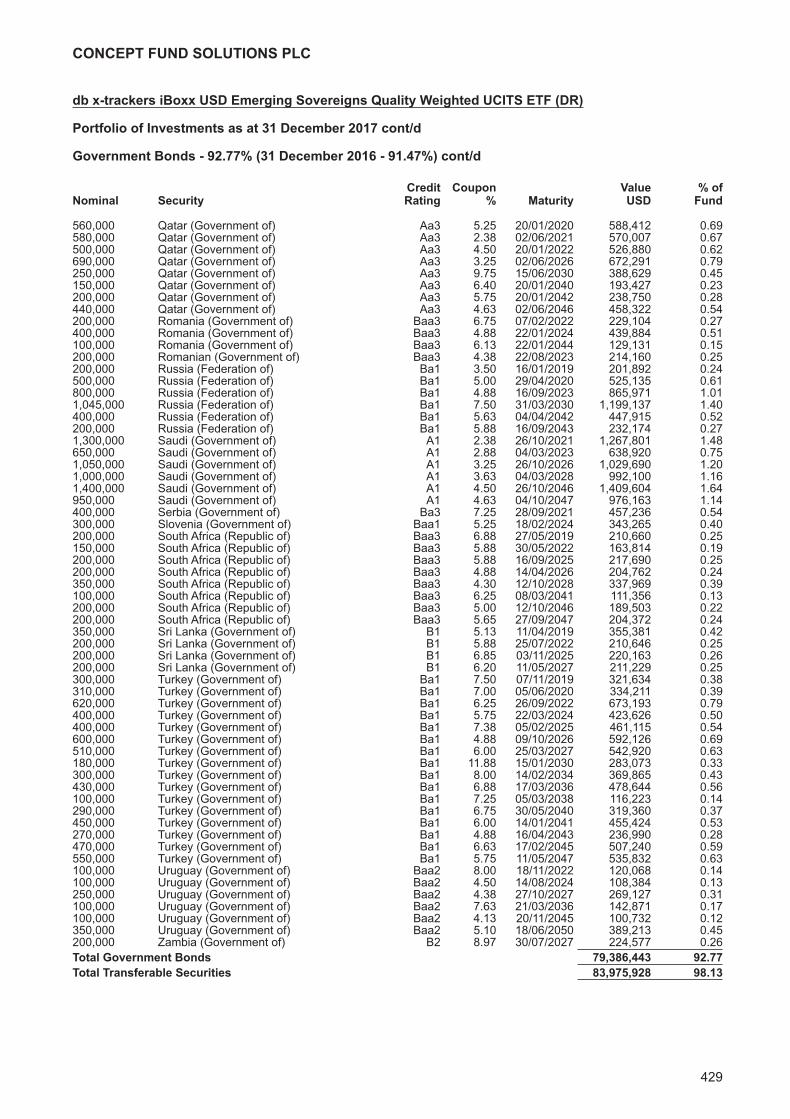
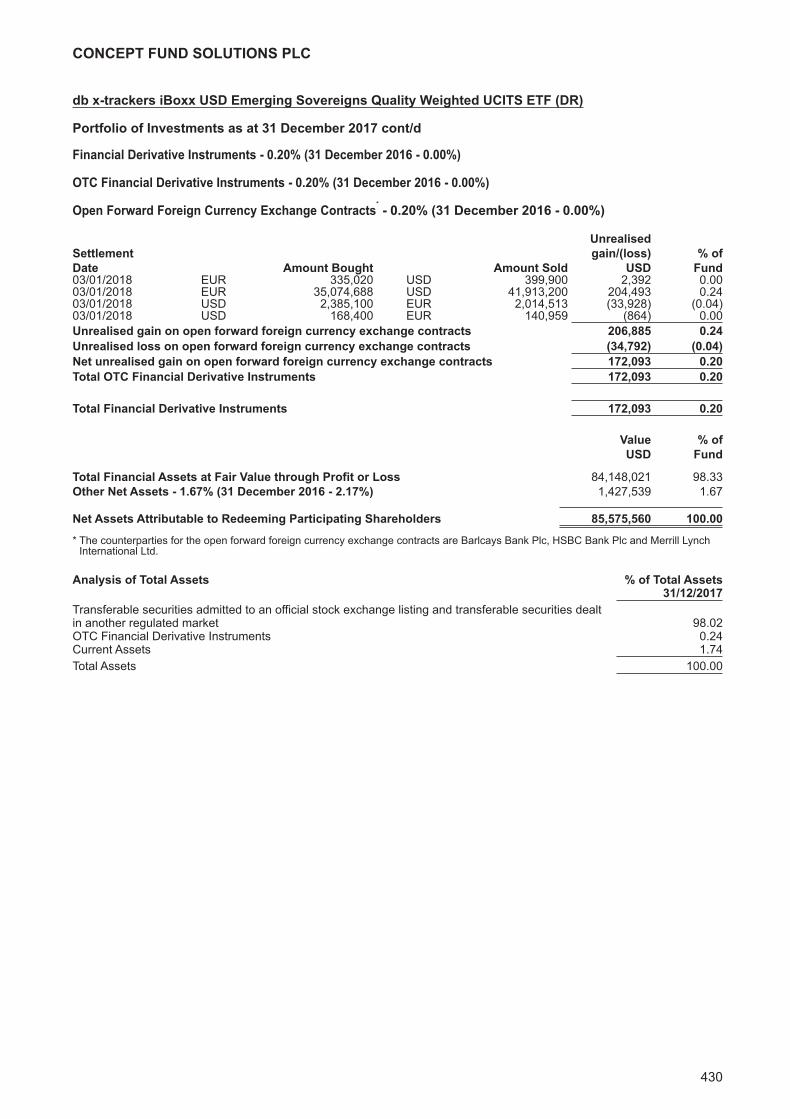
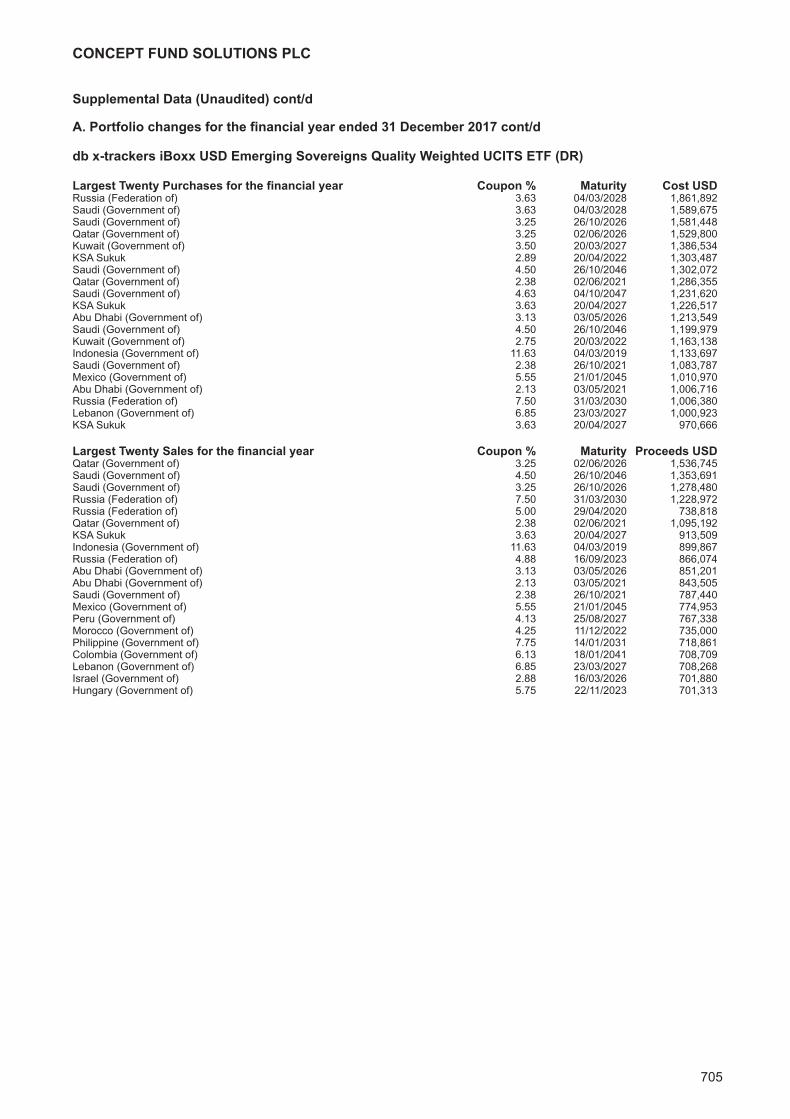
db x-trackers iBoxx USD Emerging Sovereigns Quality Weighted UCITS ETF (DR)Investment Manager’s Report 425Portfolio of Investments 426
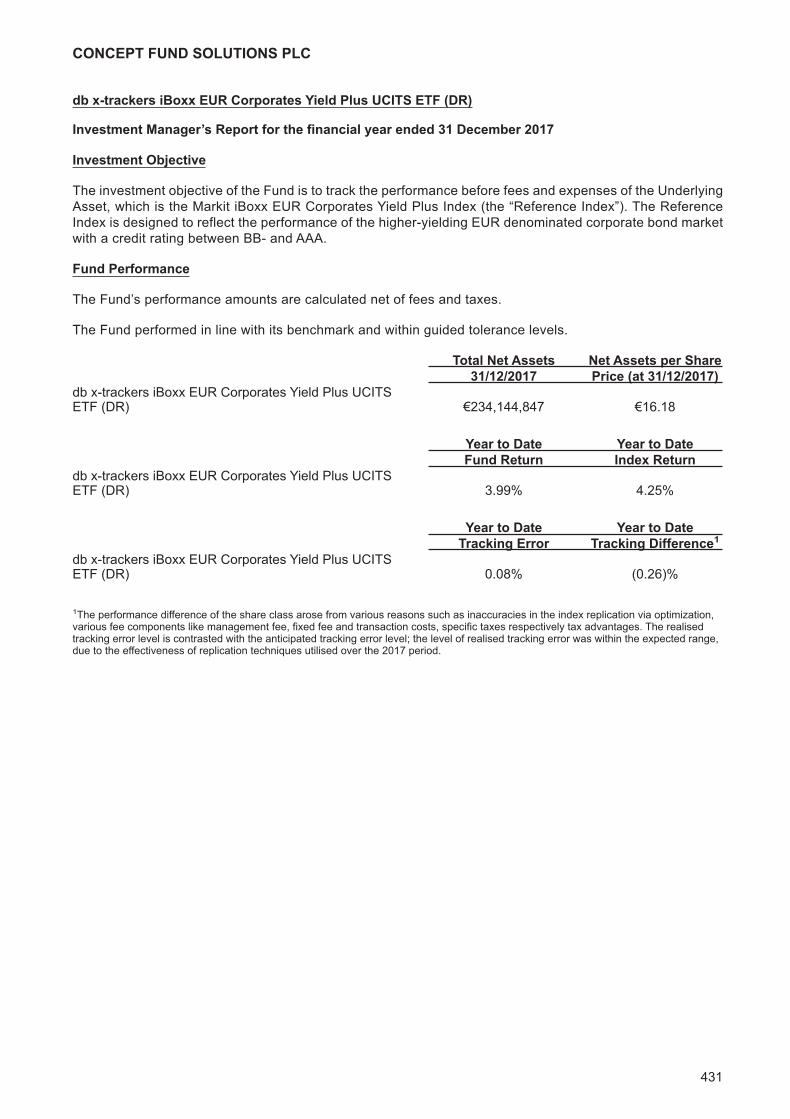
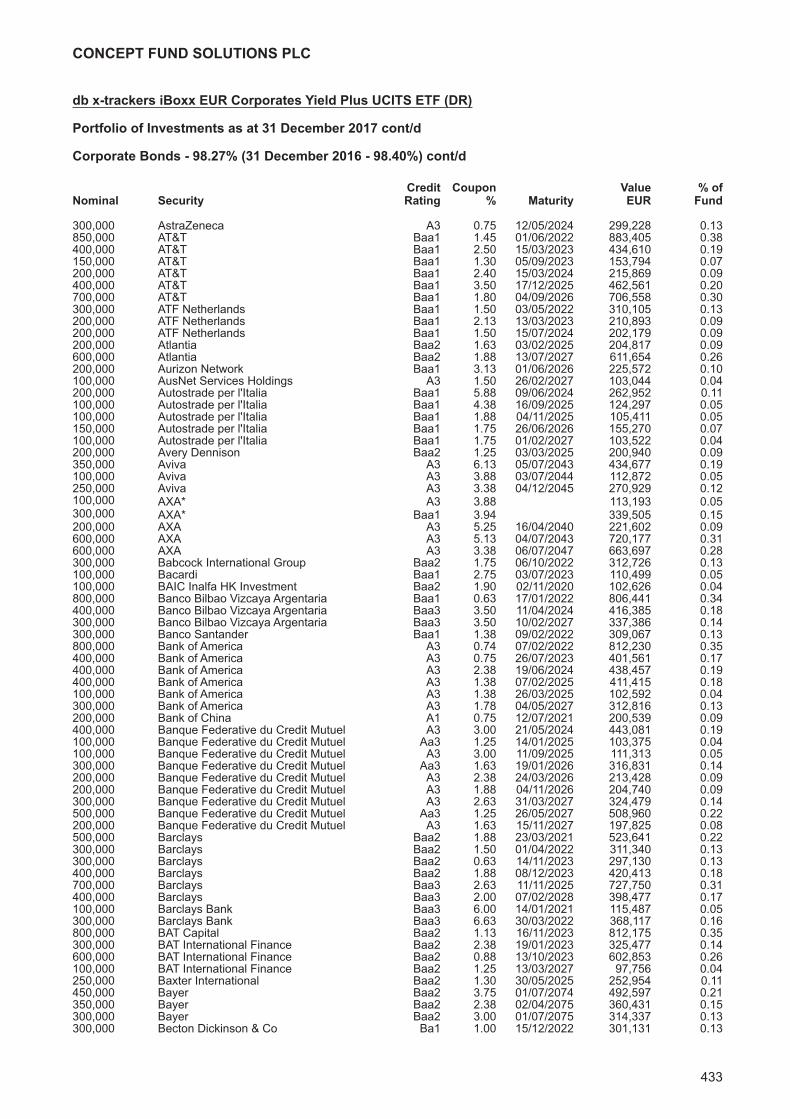
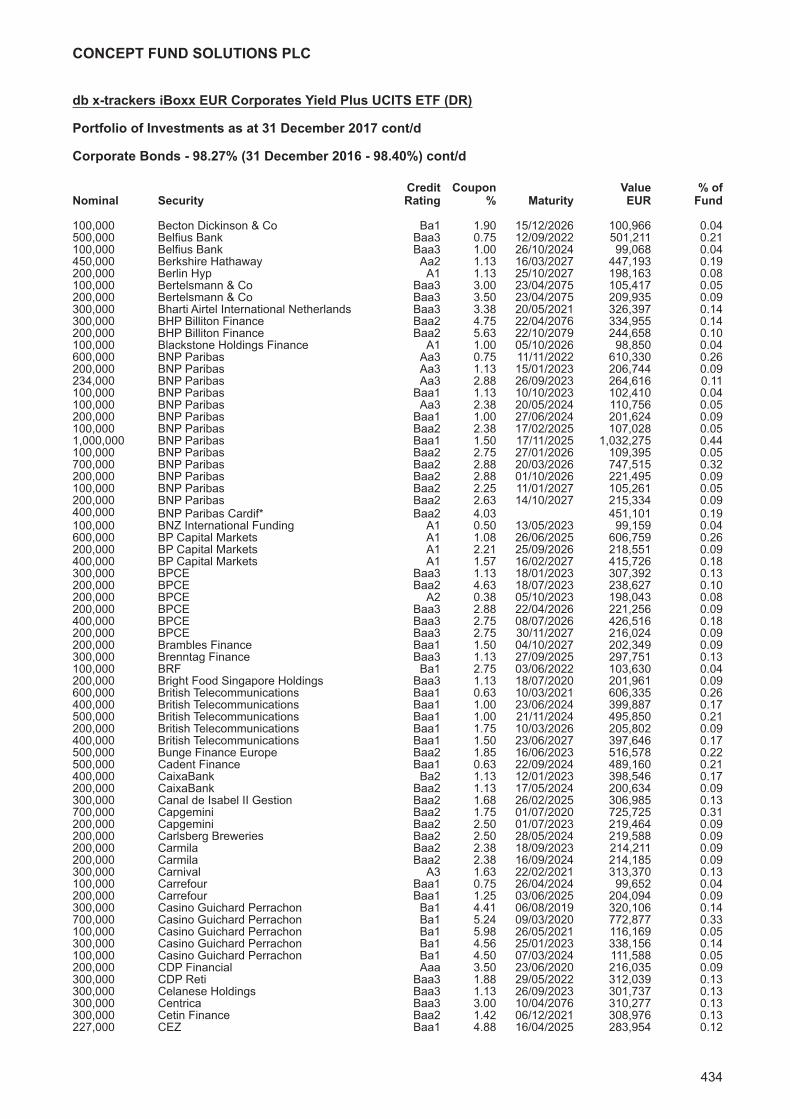
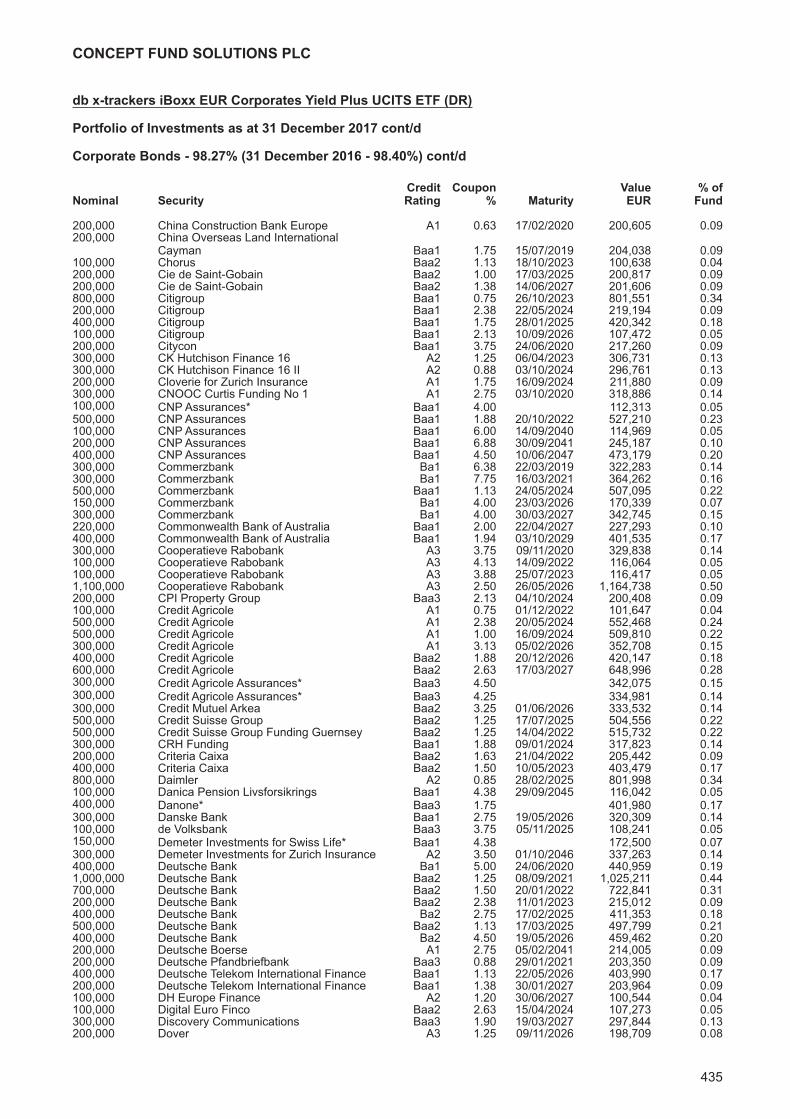
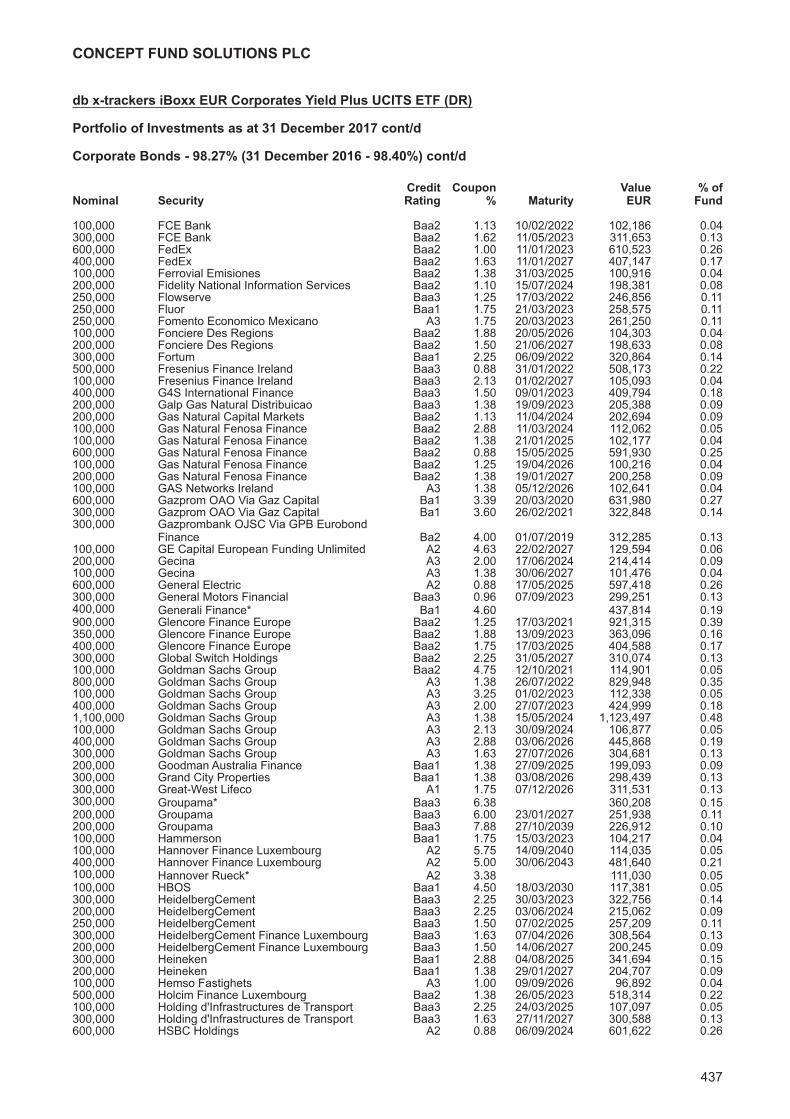
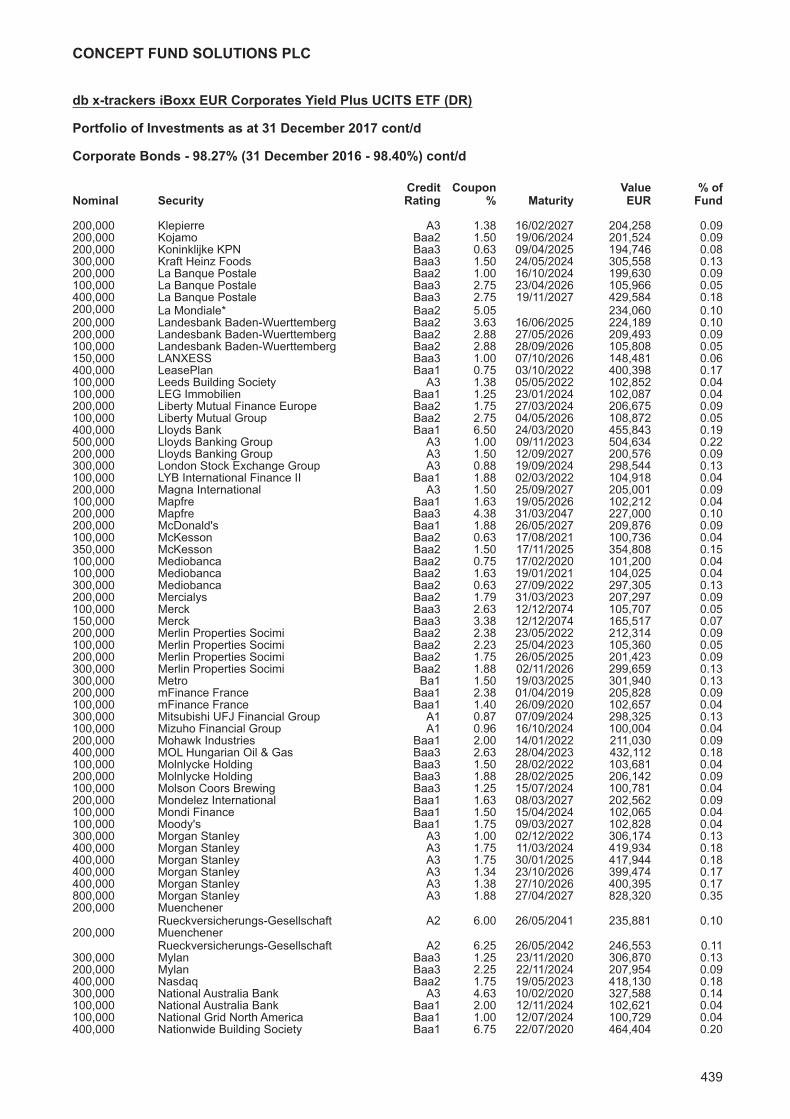
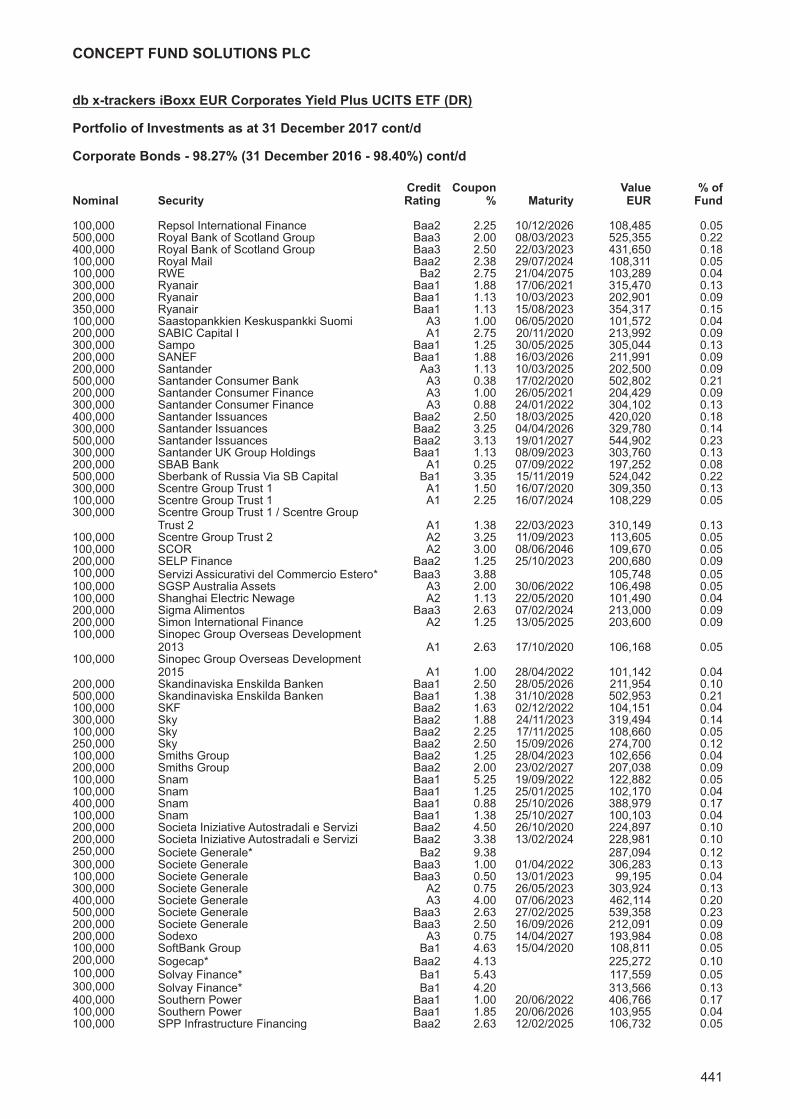
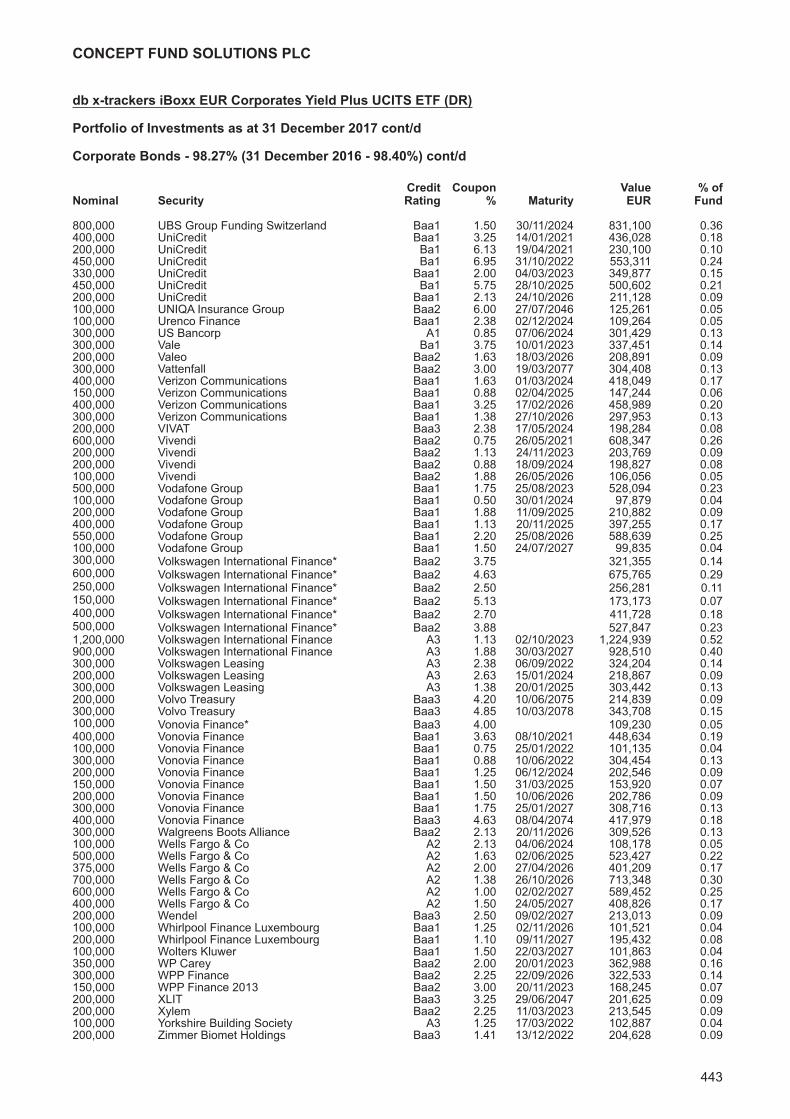
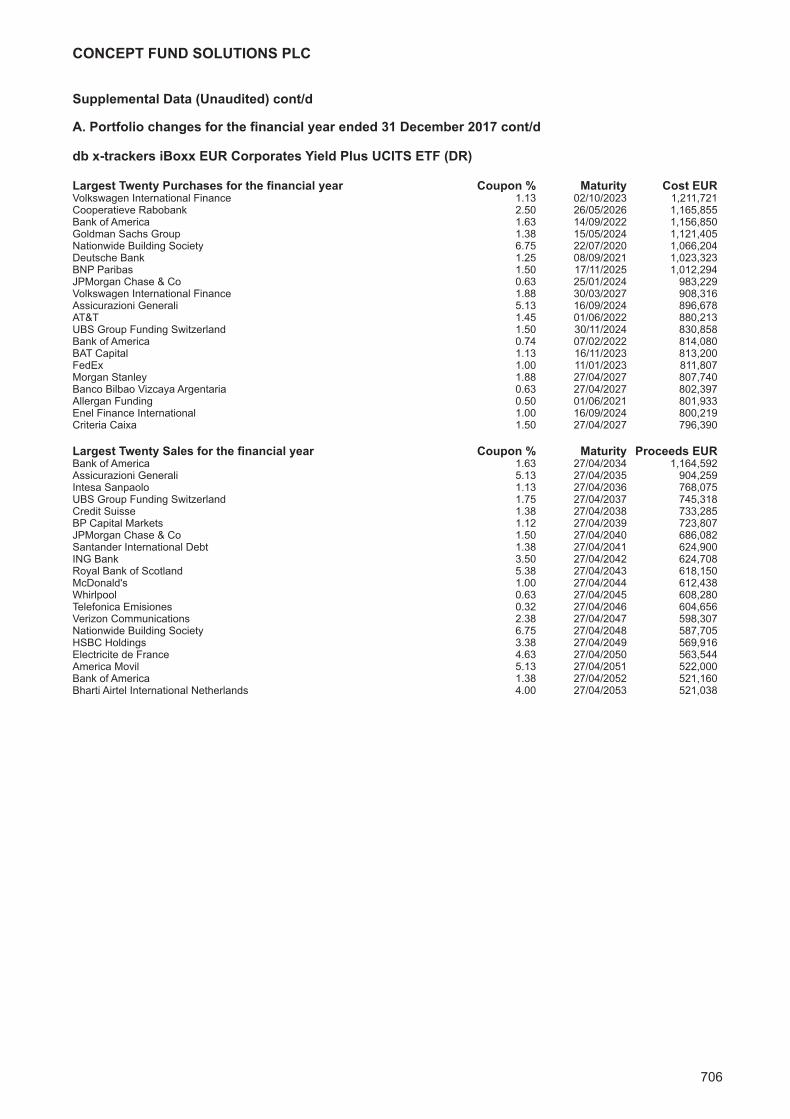
db x-trackers iBoxx EUR Corporates Yield Plus UCITS ETF (DR)Investment Manager’s Report 431Portfolio of Investments 432
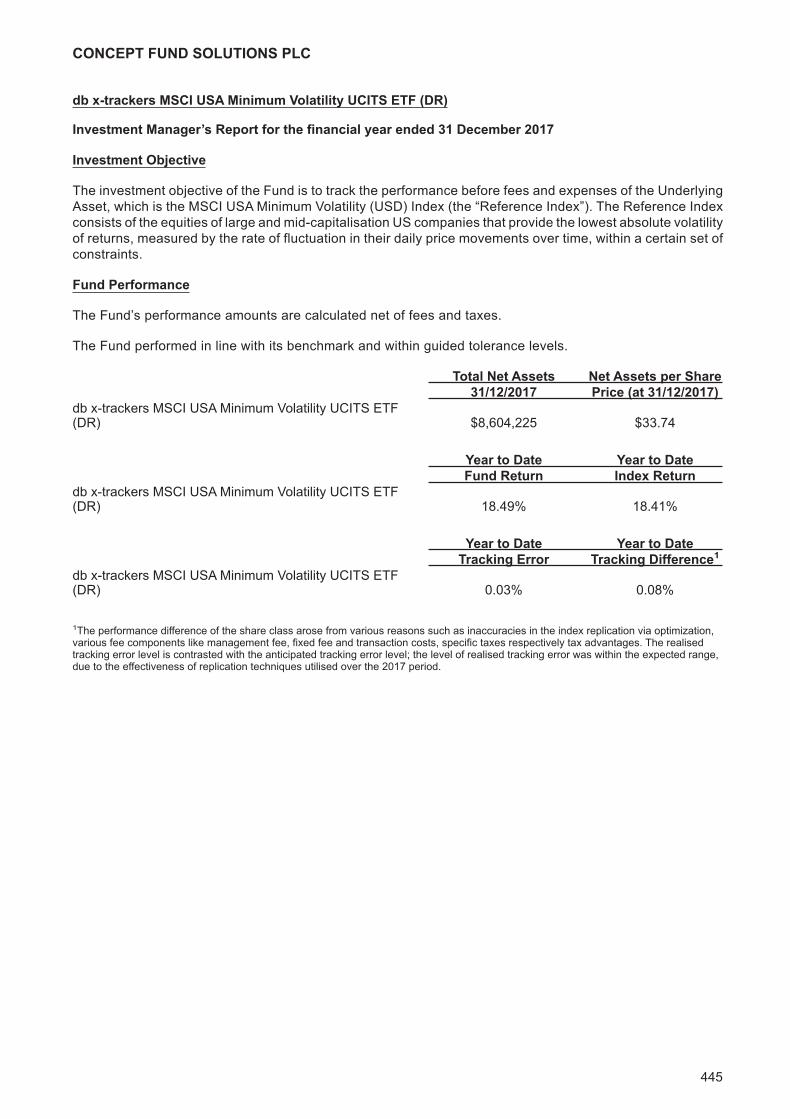
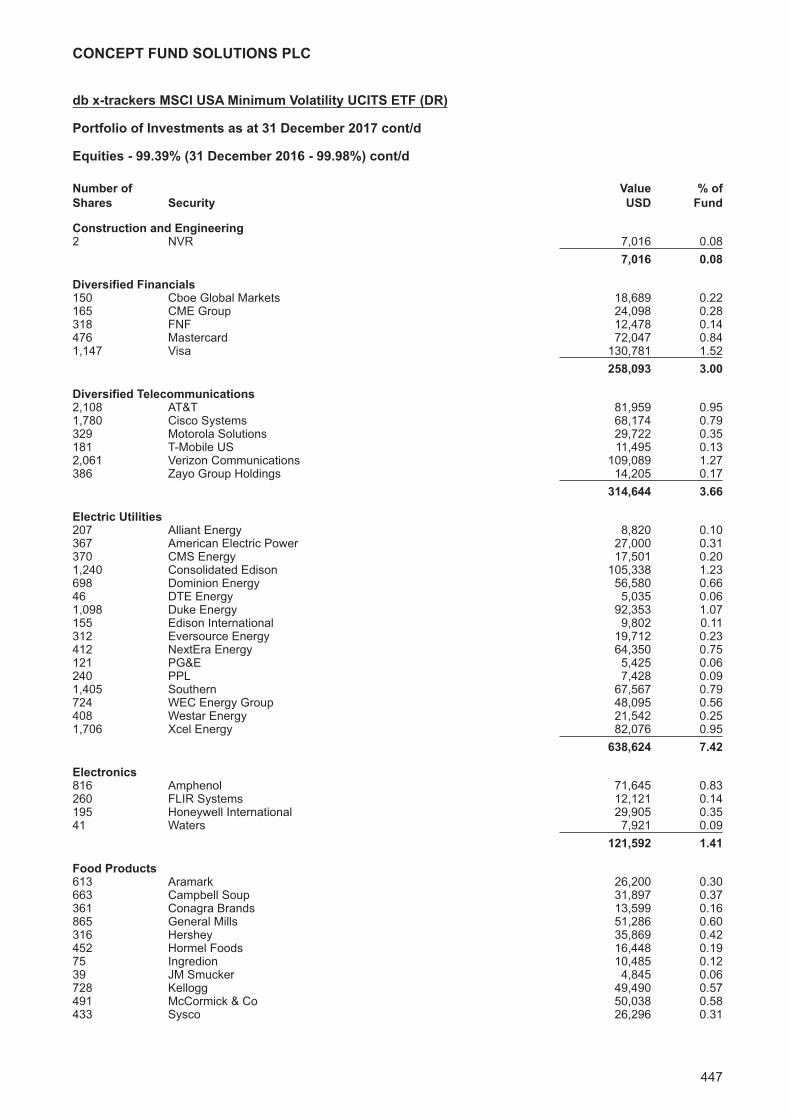
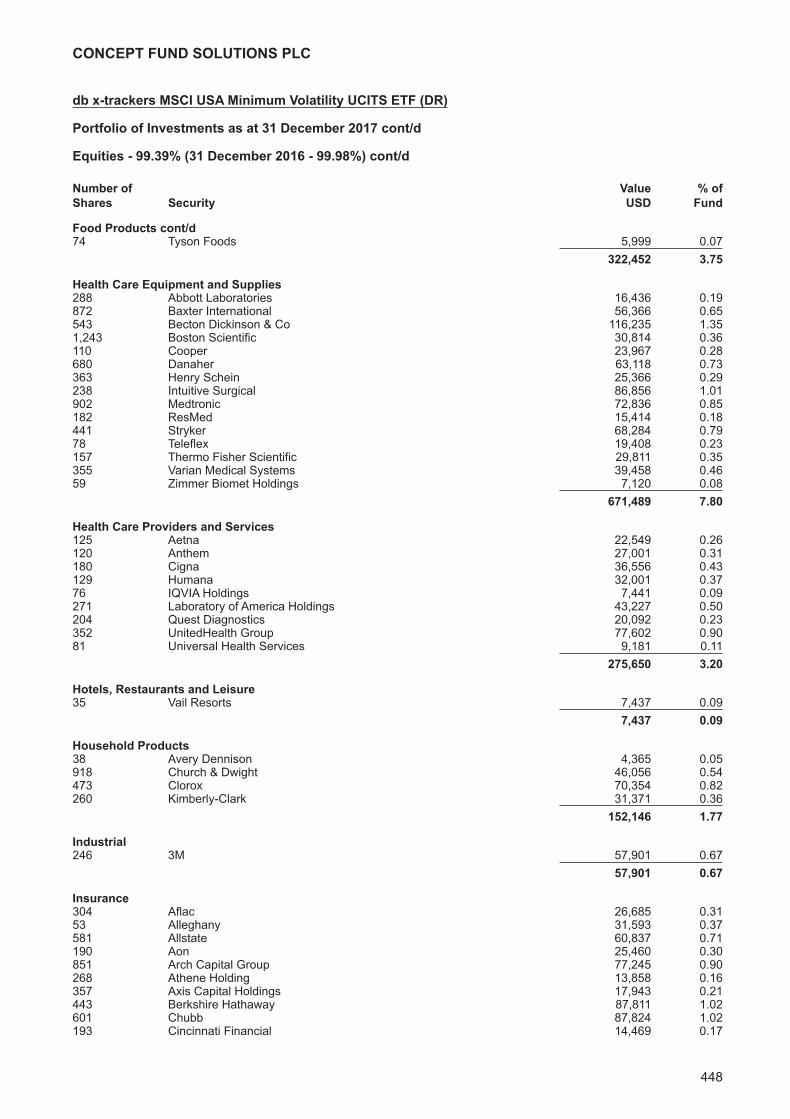
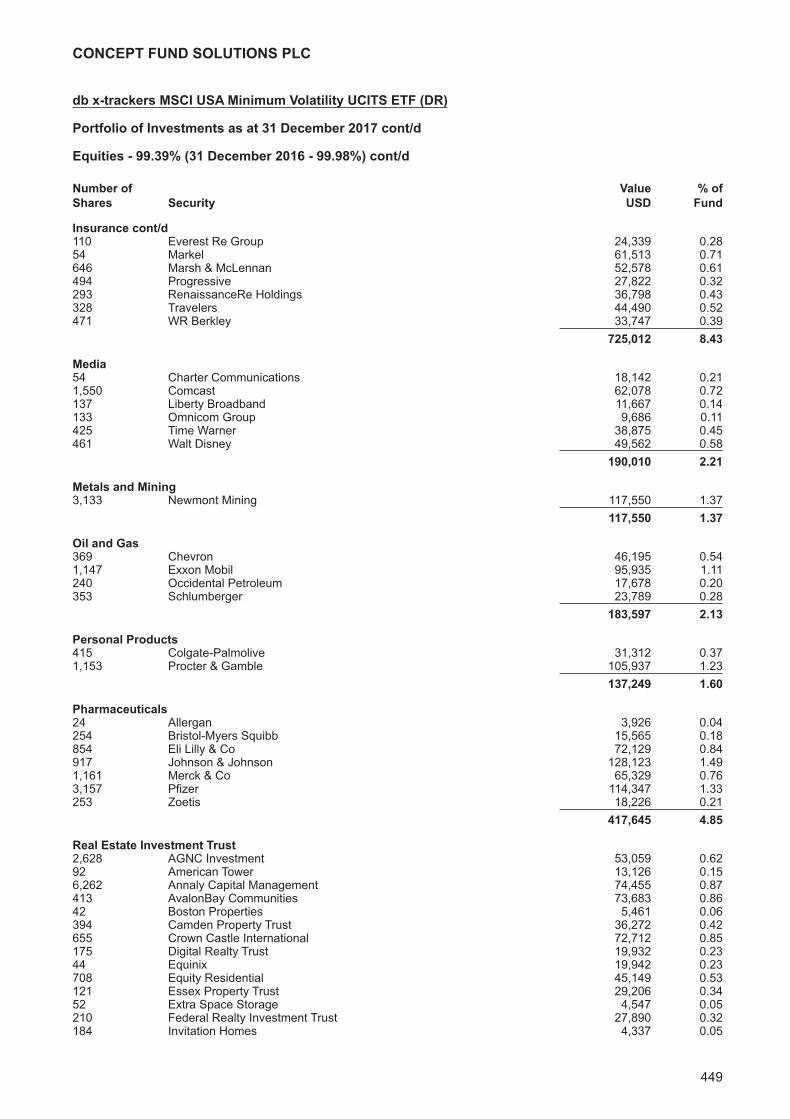
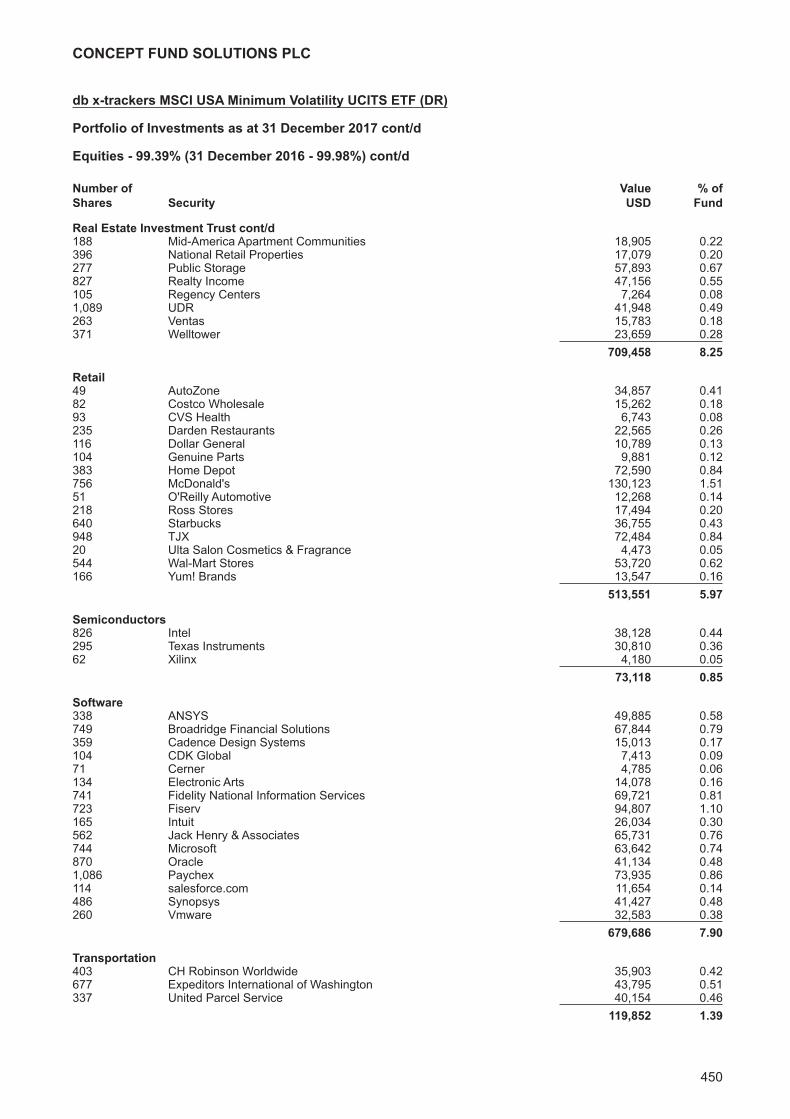
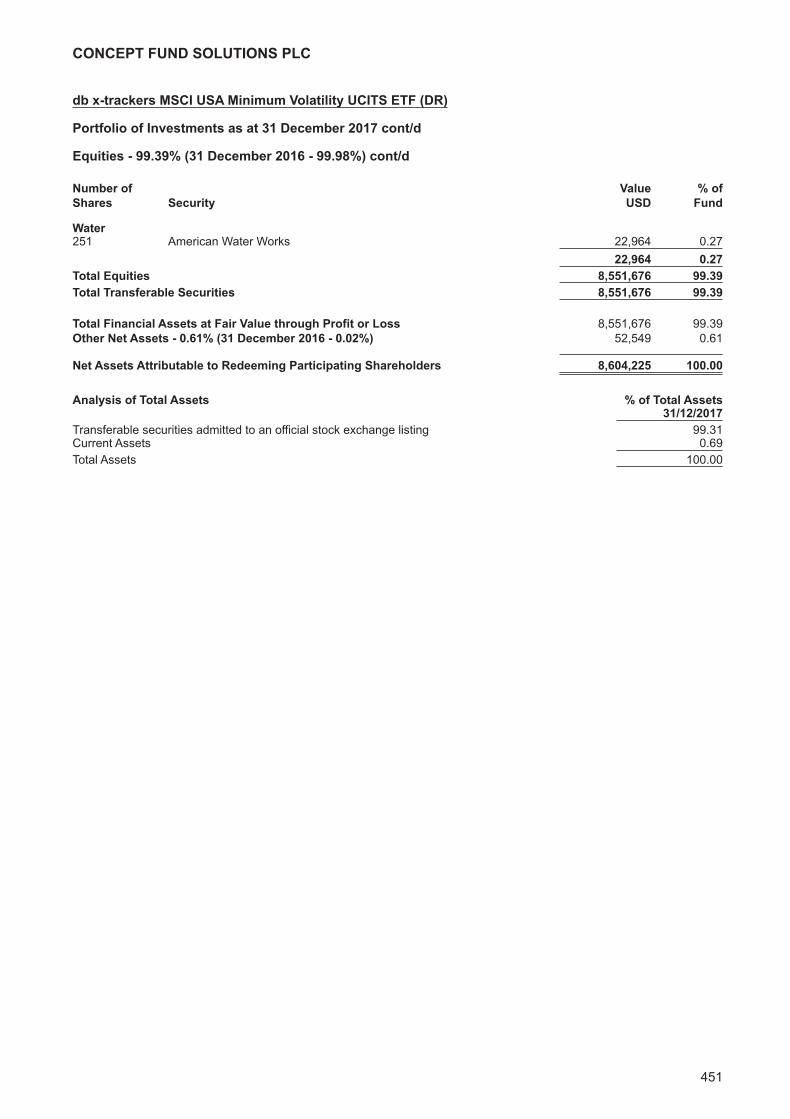
db x-trackers MSCI USA Minimum Volatility UCITS ETF (DR)Investment Manager’s Report 445Portfolio of Investments 446
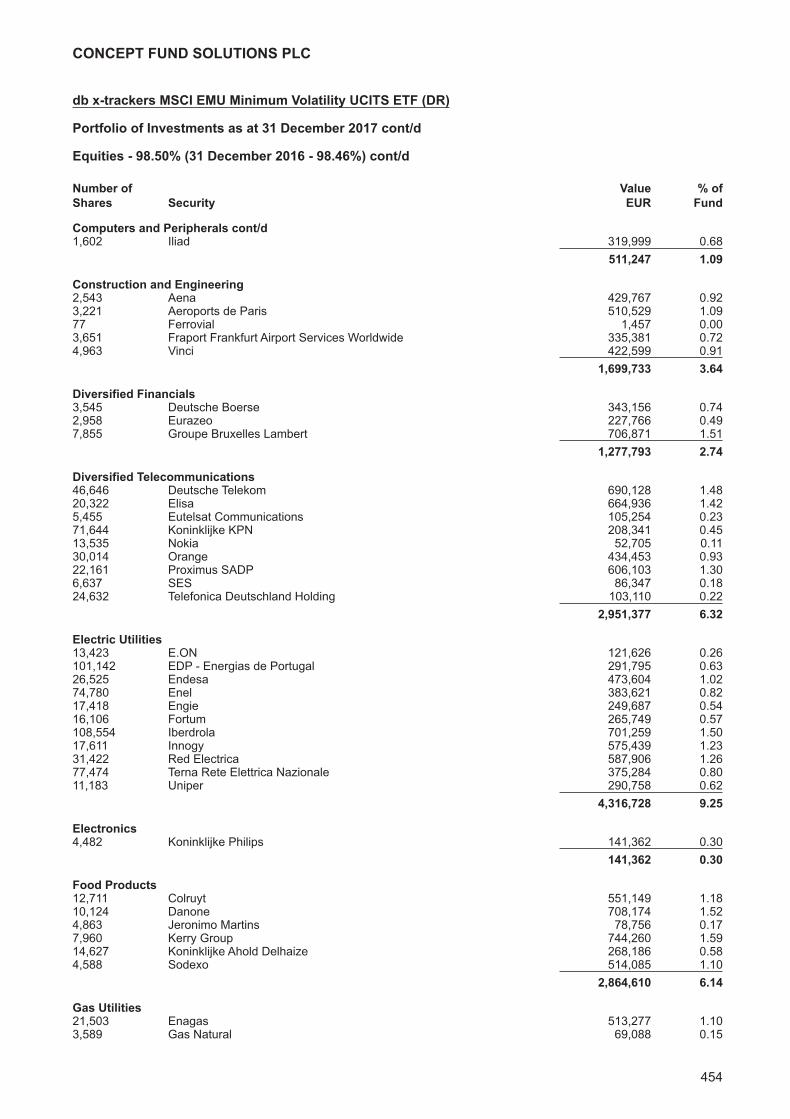
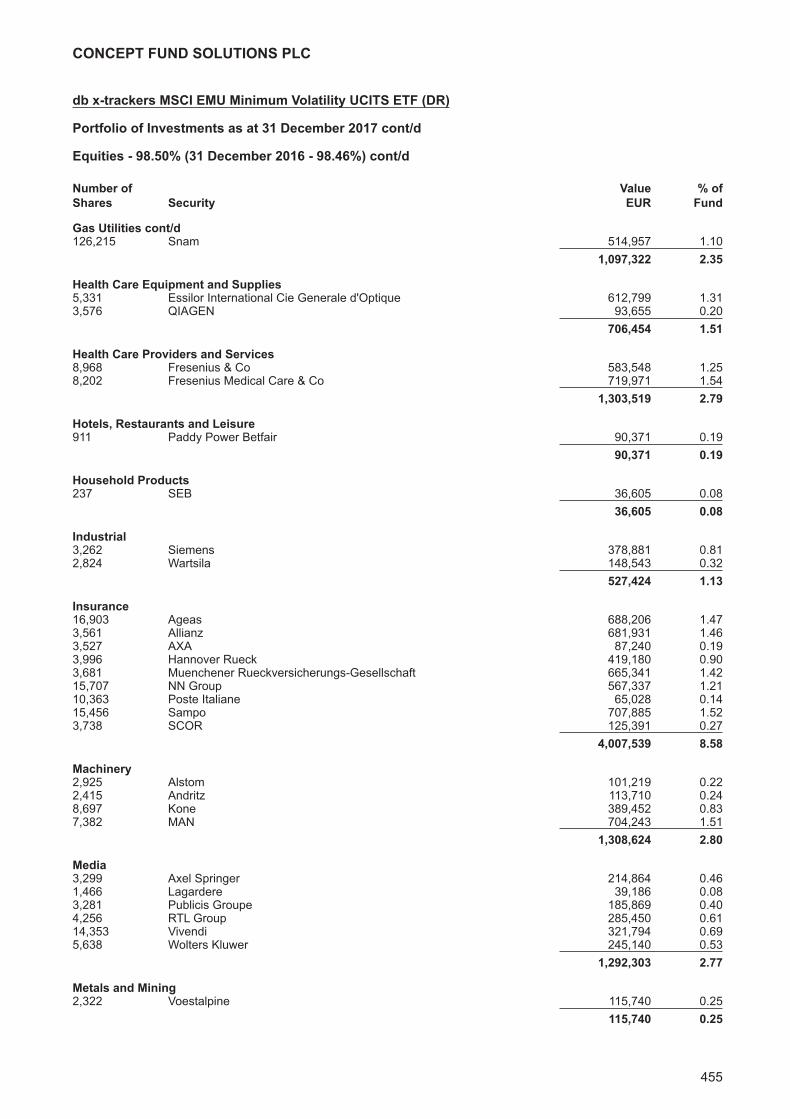
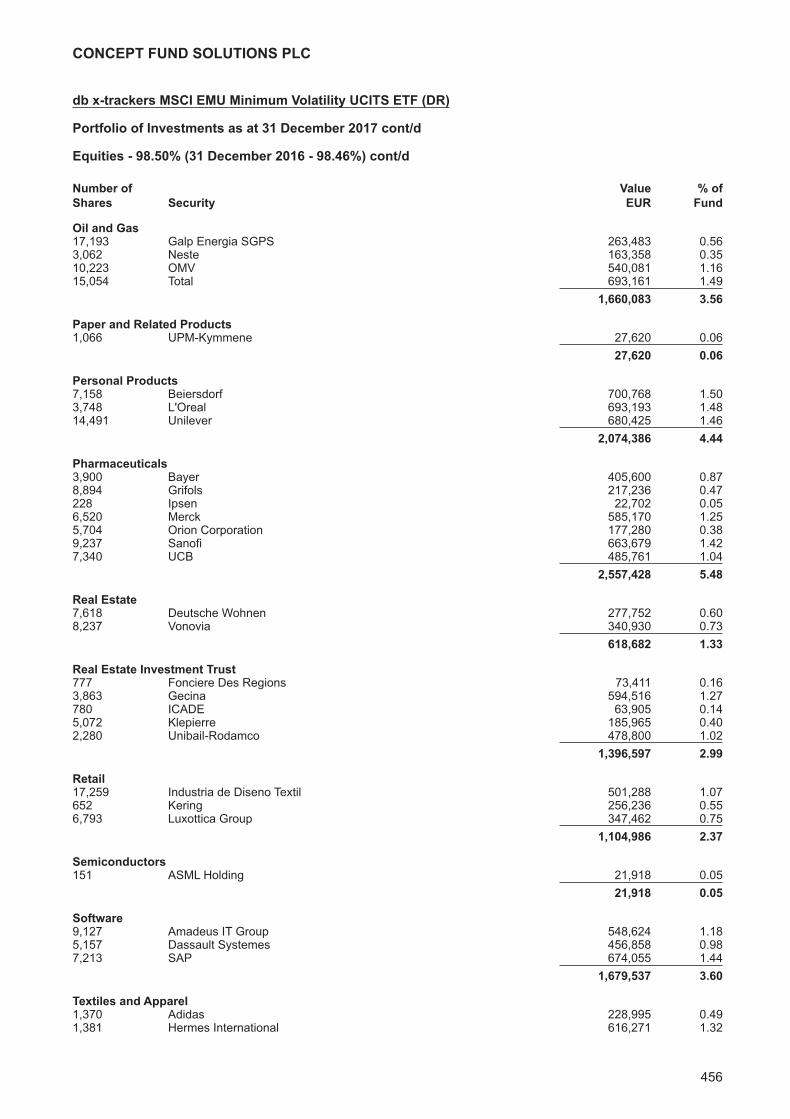
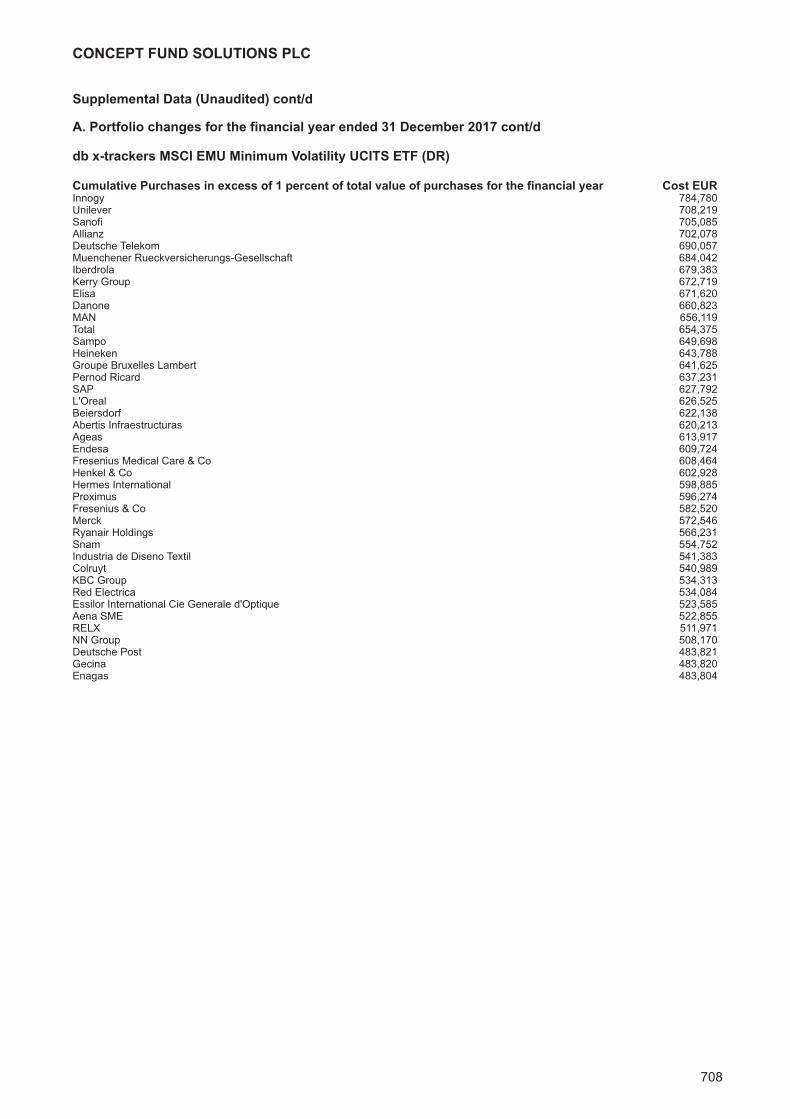
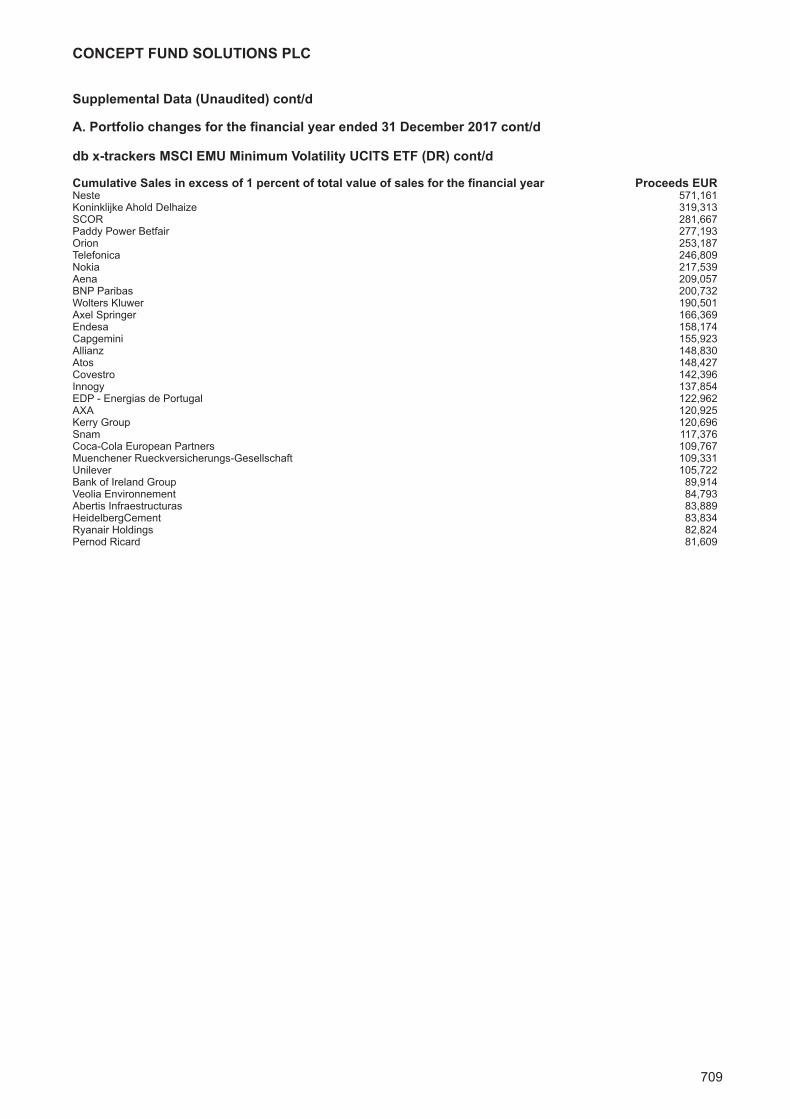
db x-trackers MSCI EMU Minimum Volatility UCITS ETF (DR)Investment Manager’s Report 452Portfolio of Investments 453
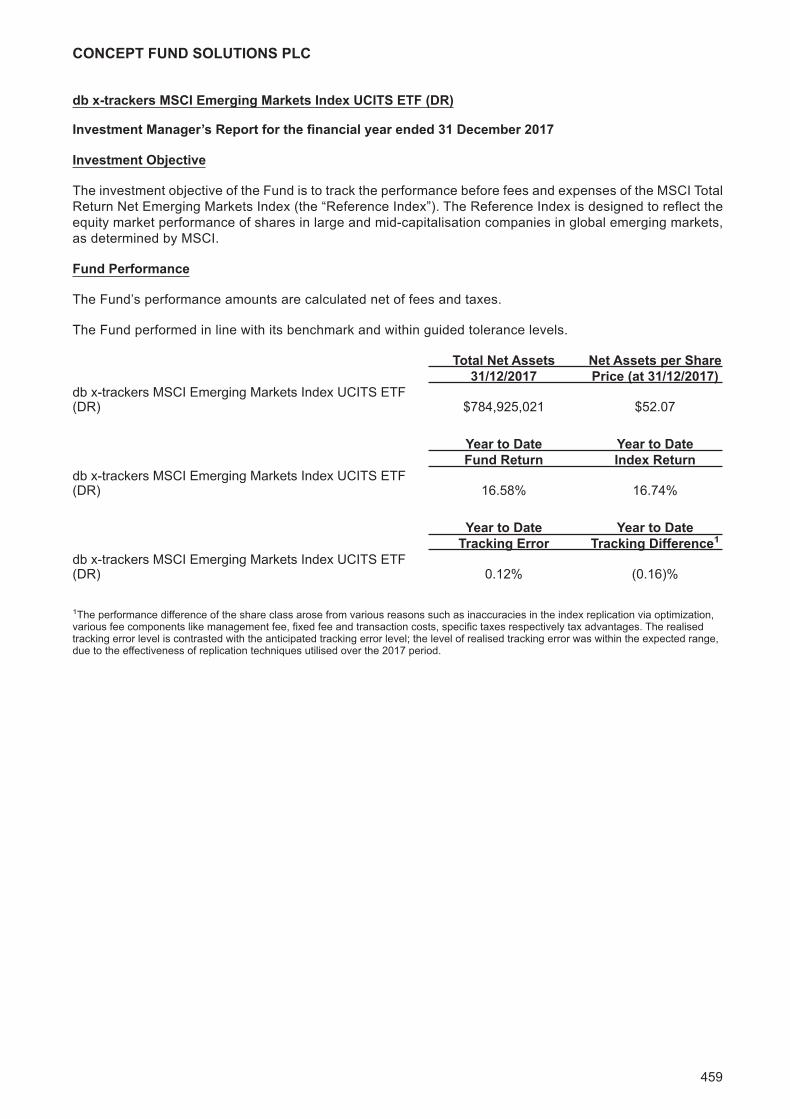
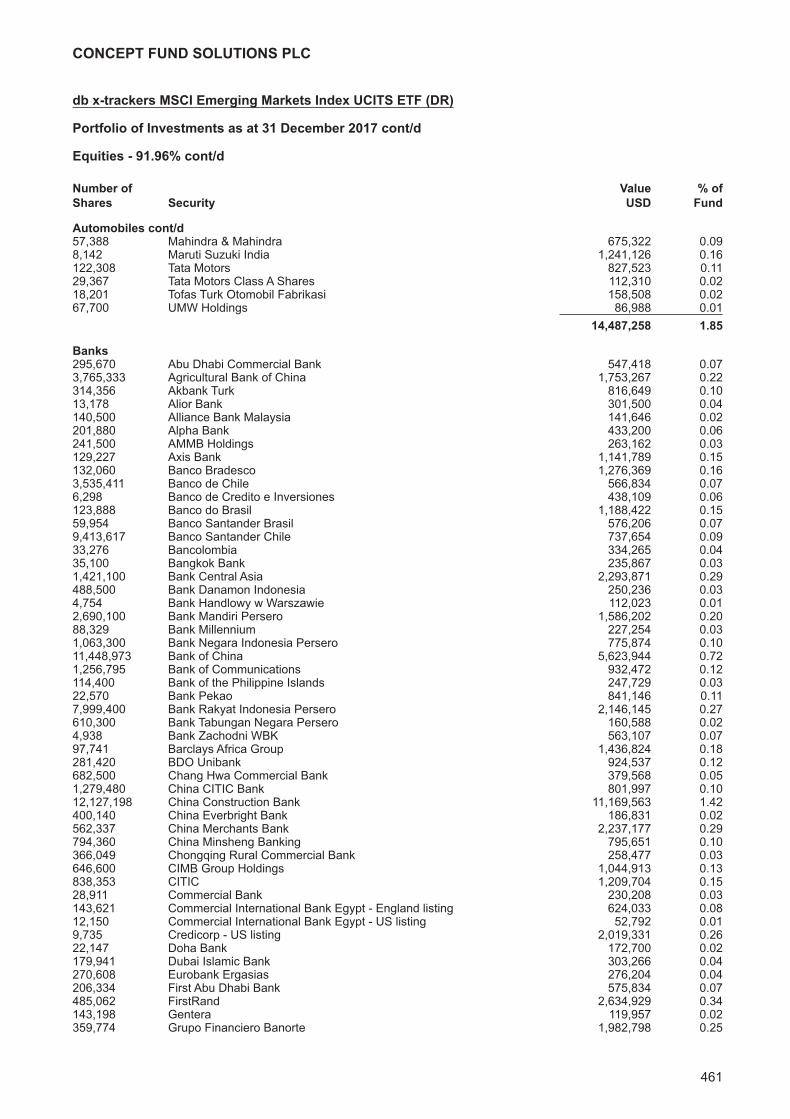
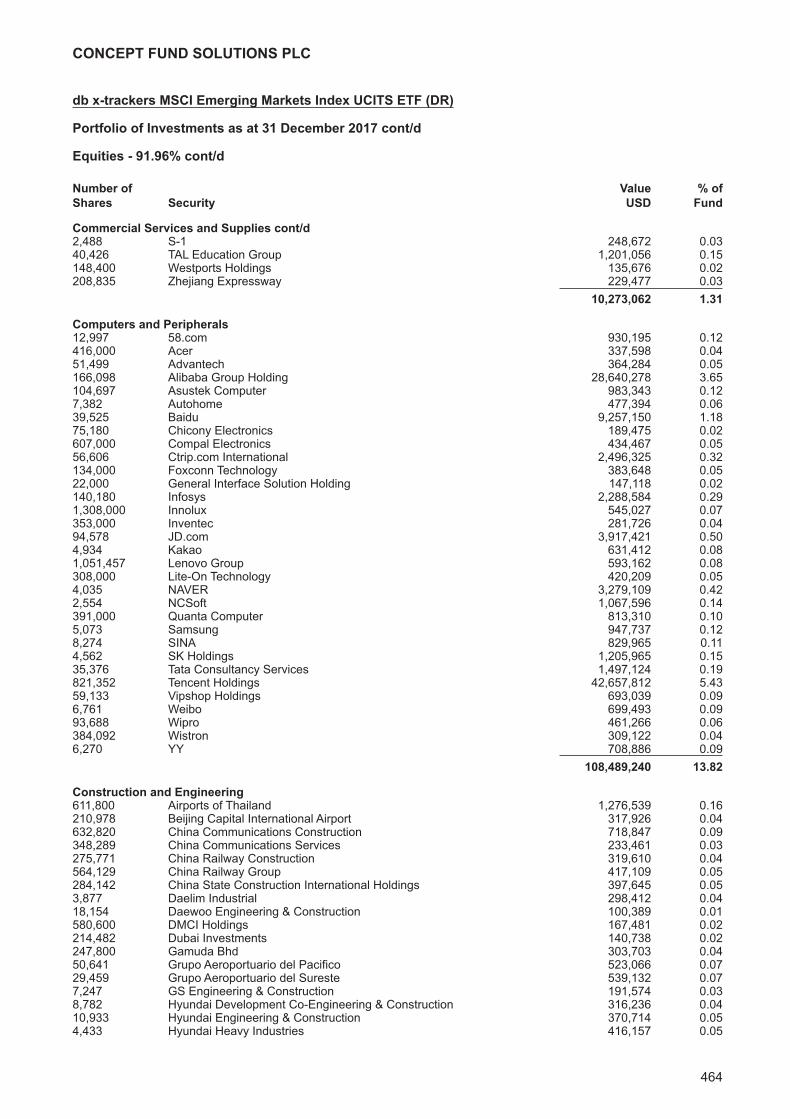
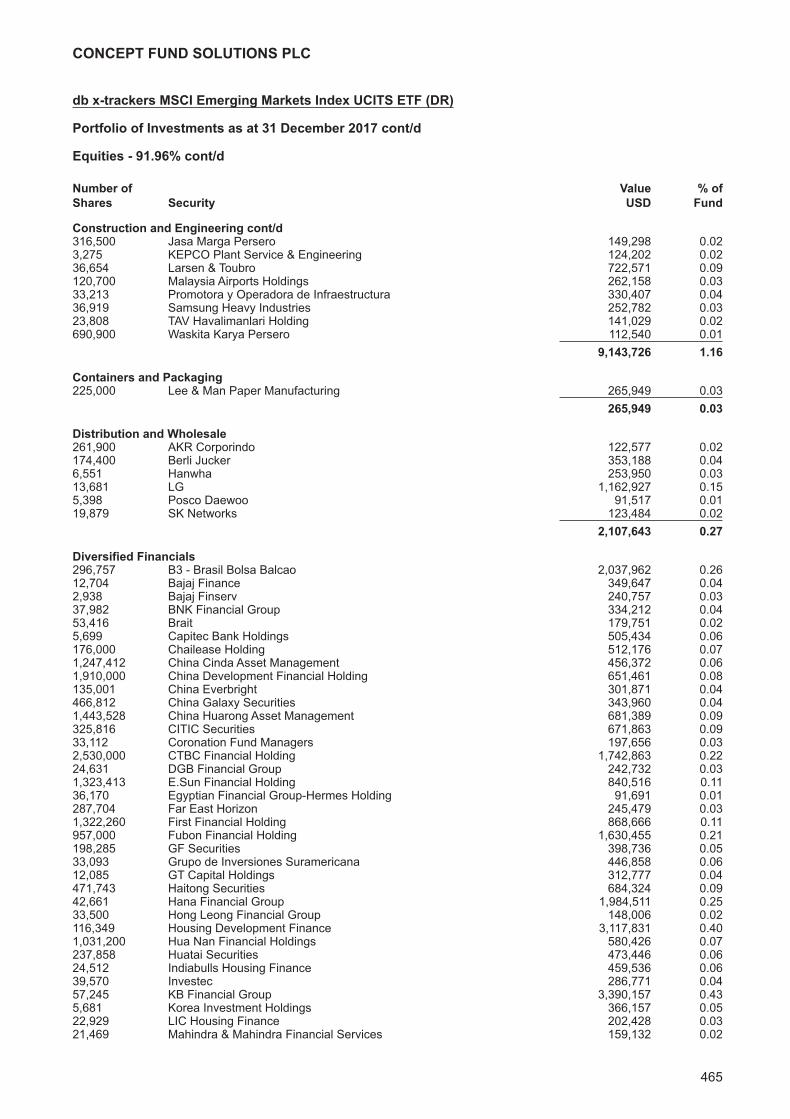
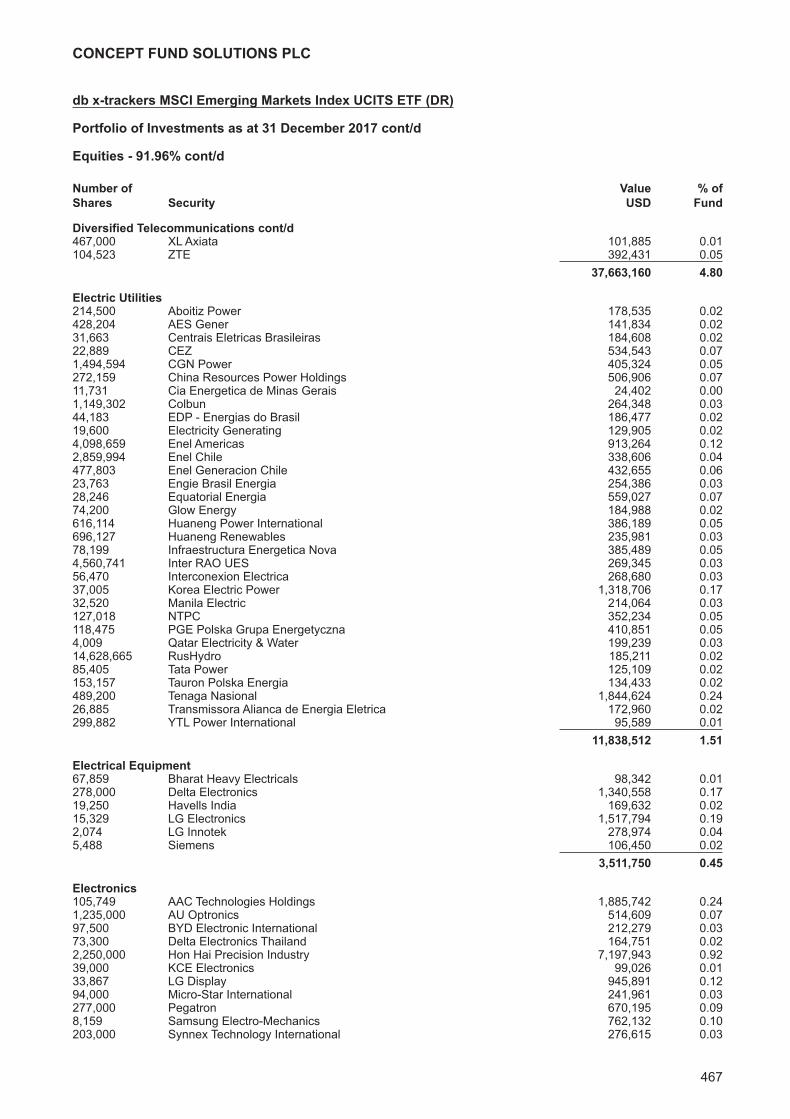
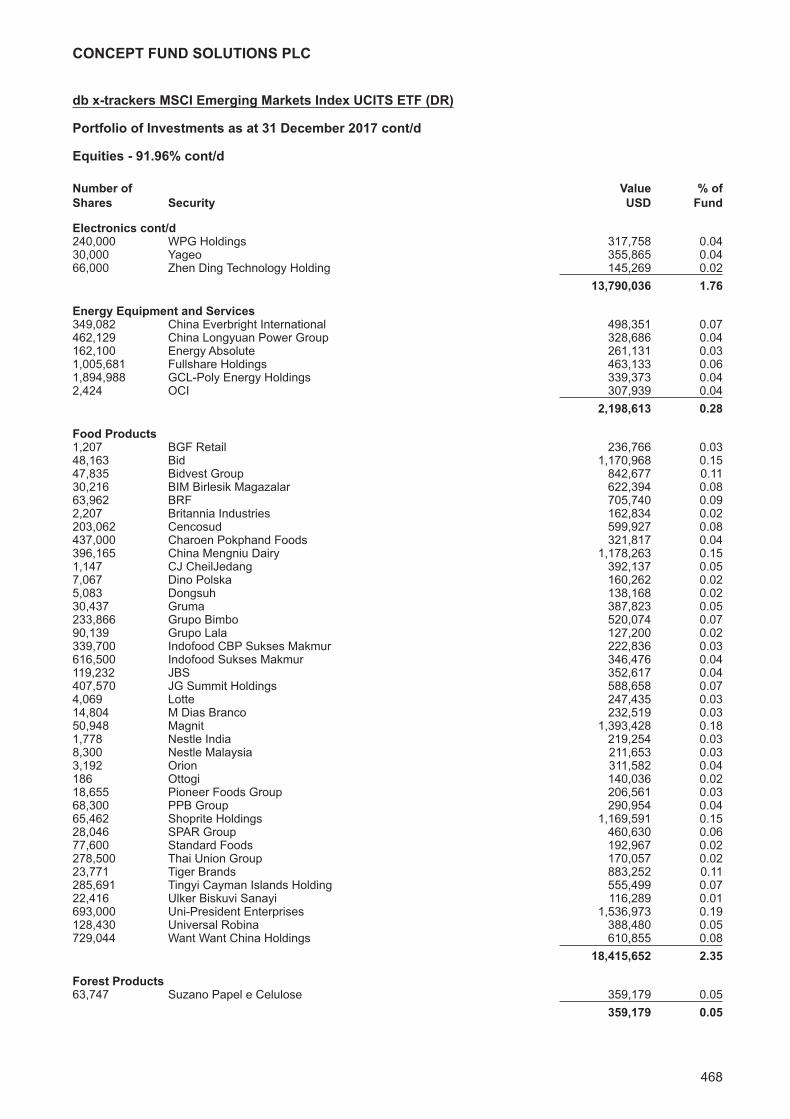
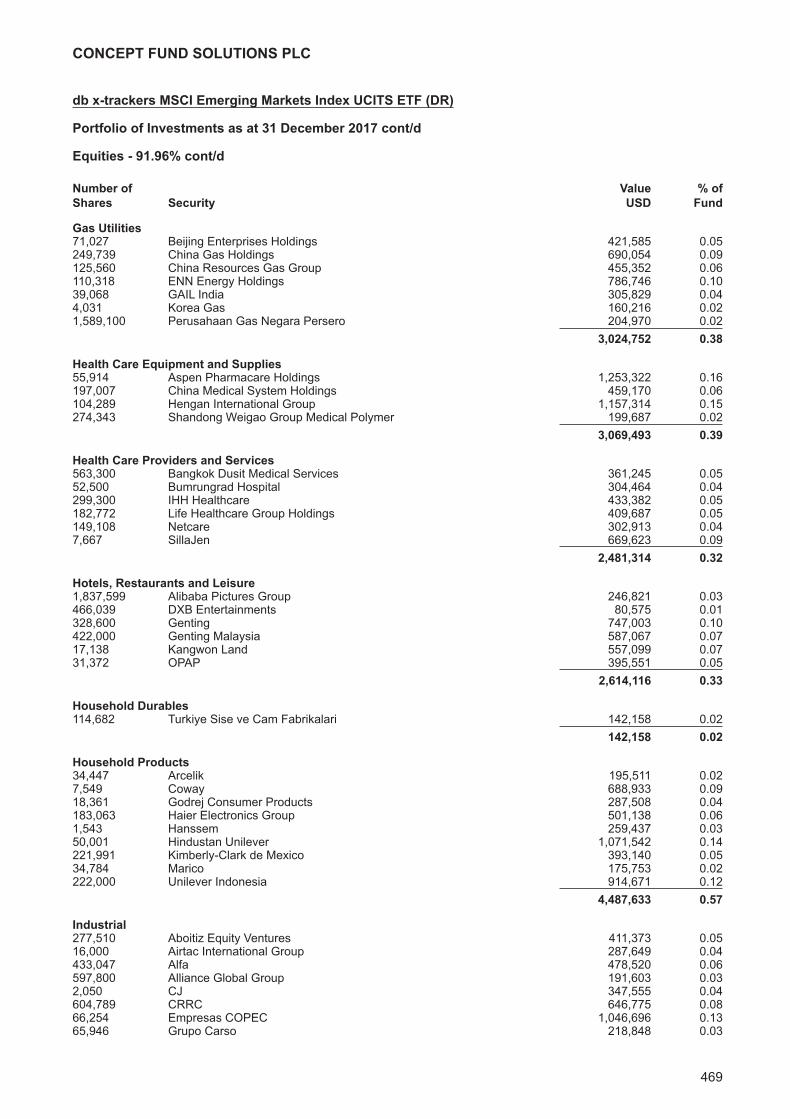
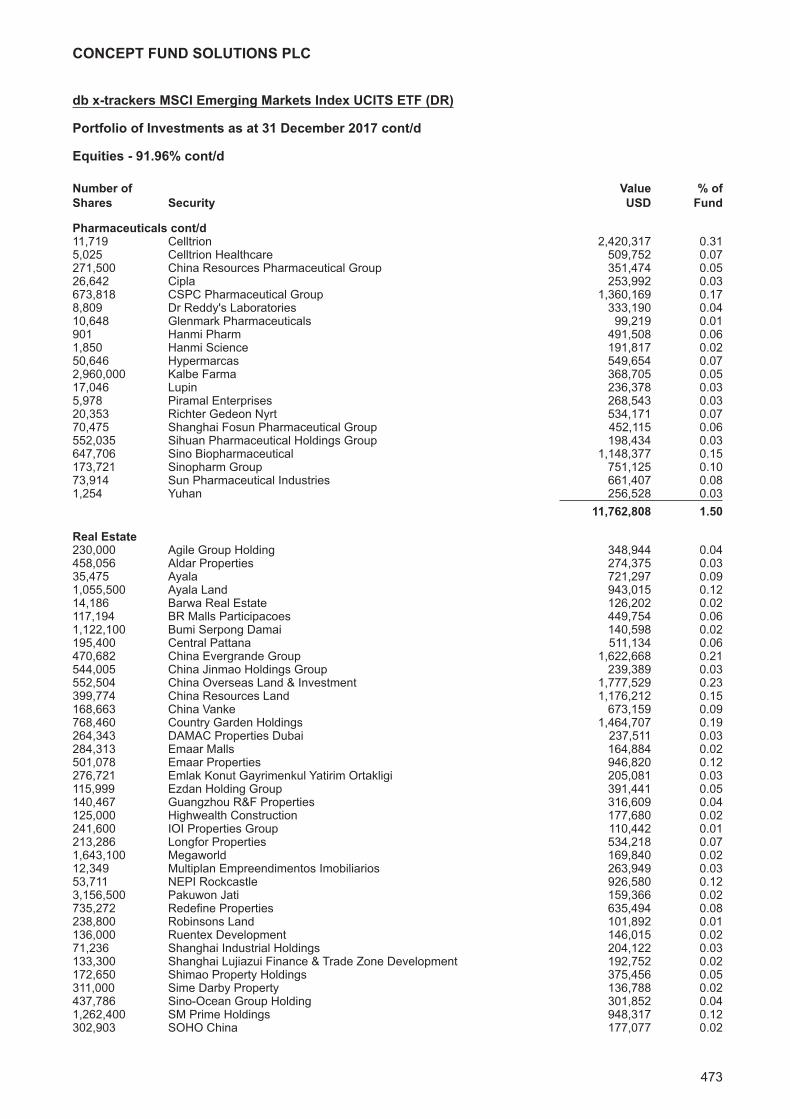
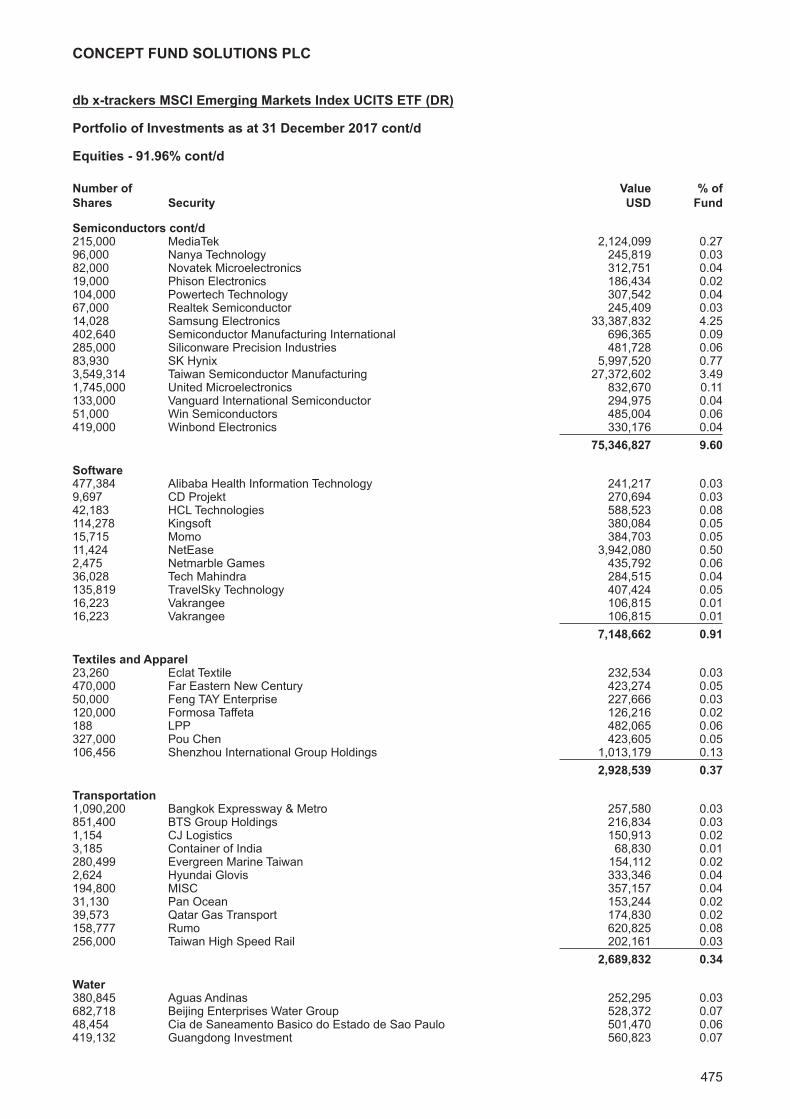
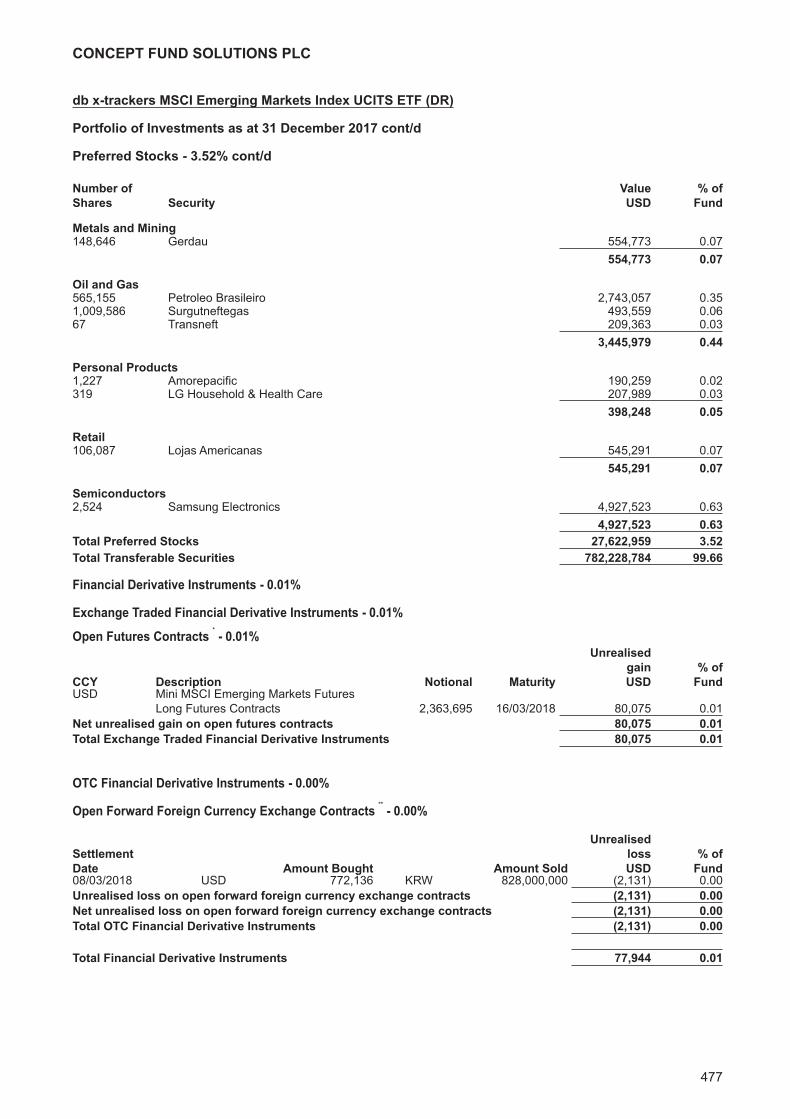
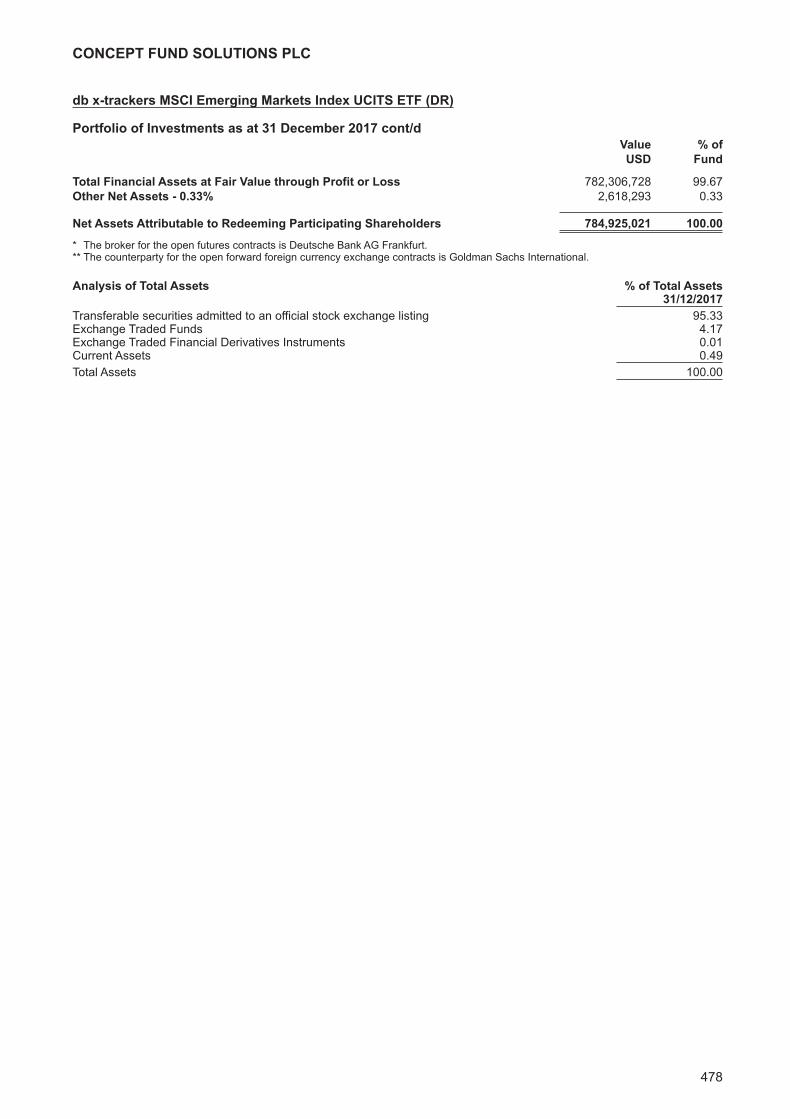
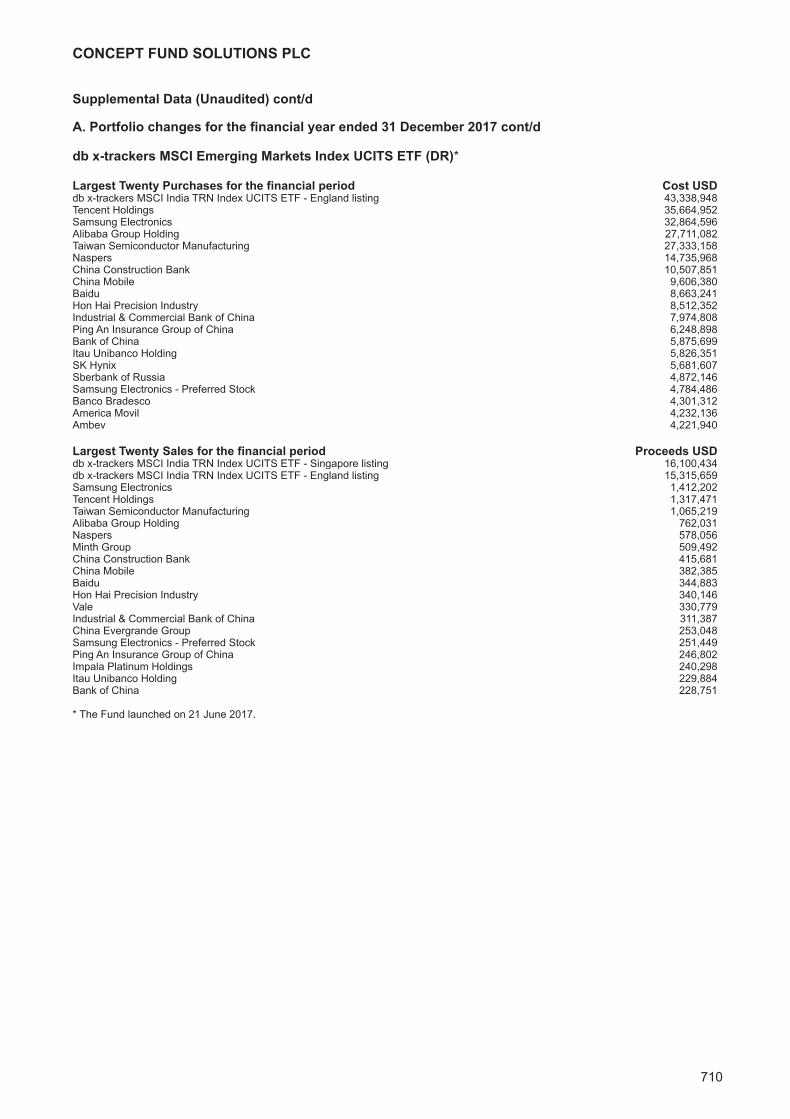
db x-trackers MSCI Emerging Markets Index UCITS ETF (DR)Investment Manager’s Report 459Portfolio of Investments 460
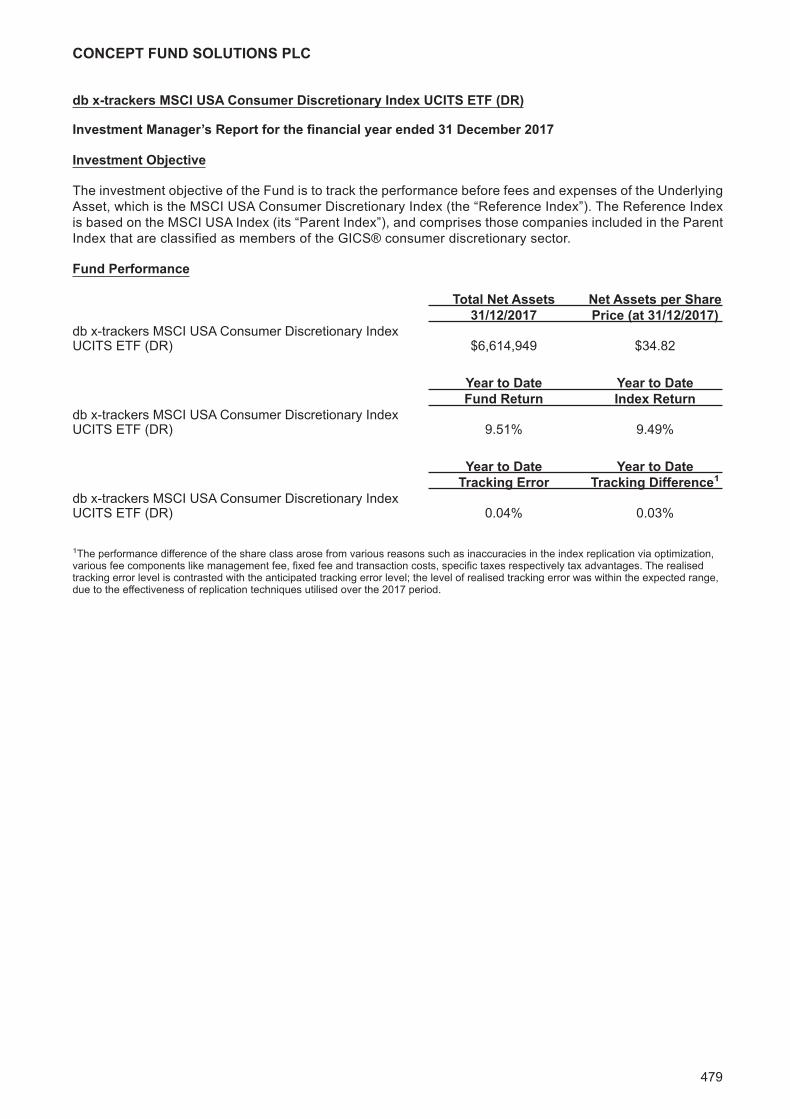
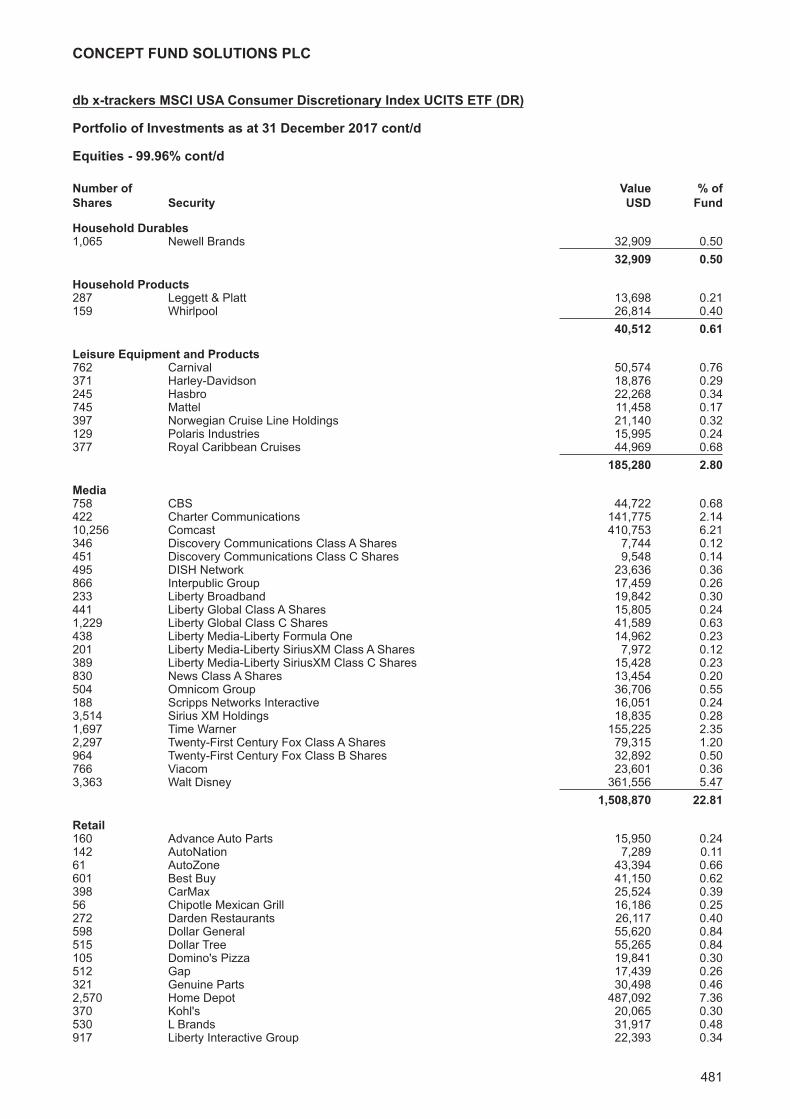
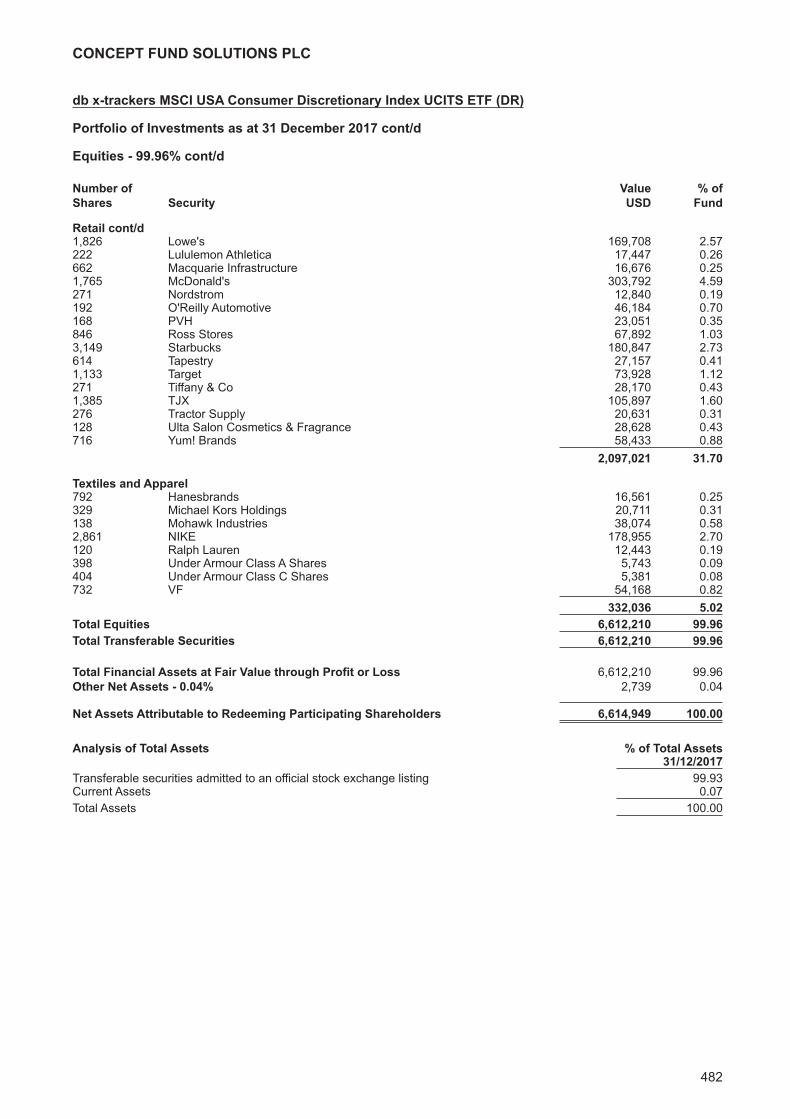
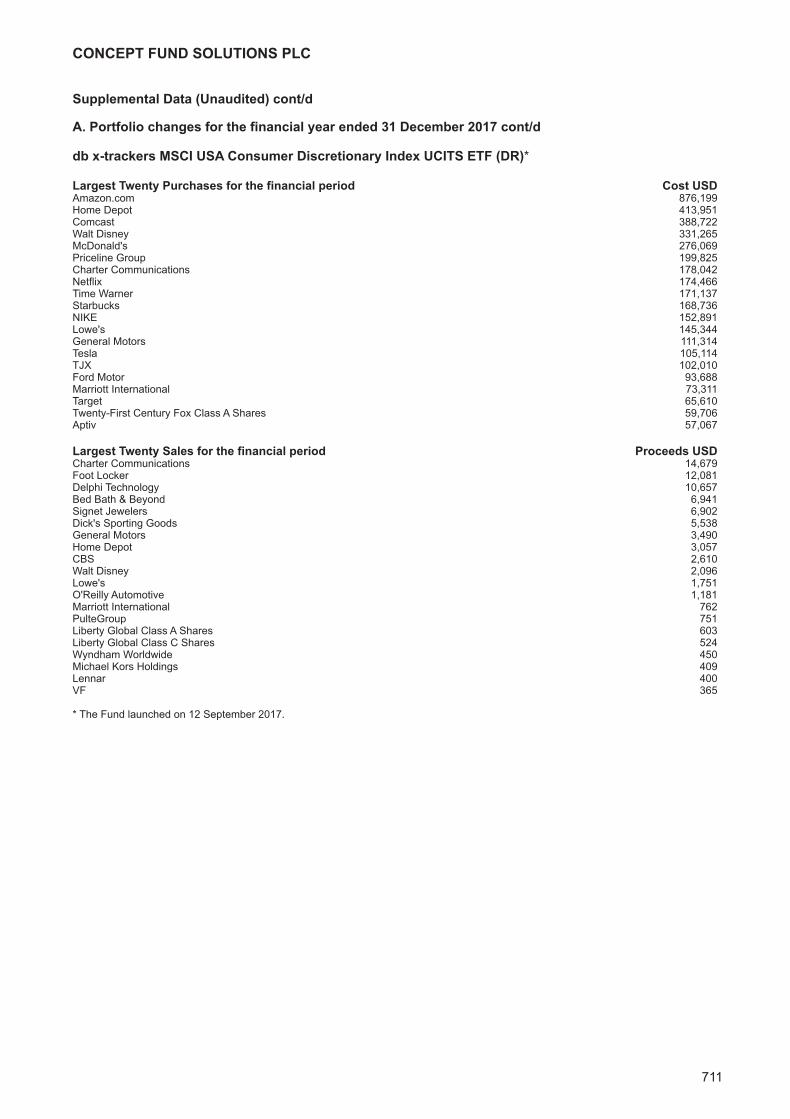
db x-trackers MSCI USA Consumer Discretionary Index UCITS ETF (DR)Investment Manager’s Report 479Portfolio of Investments 480
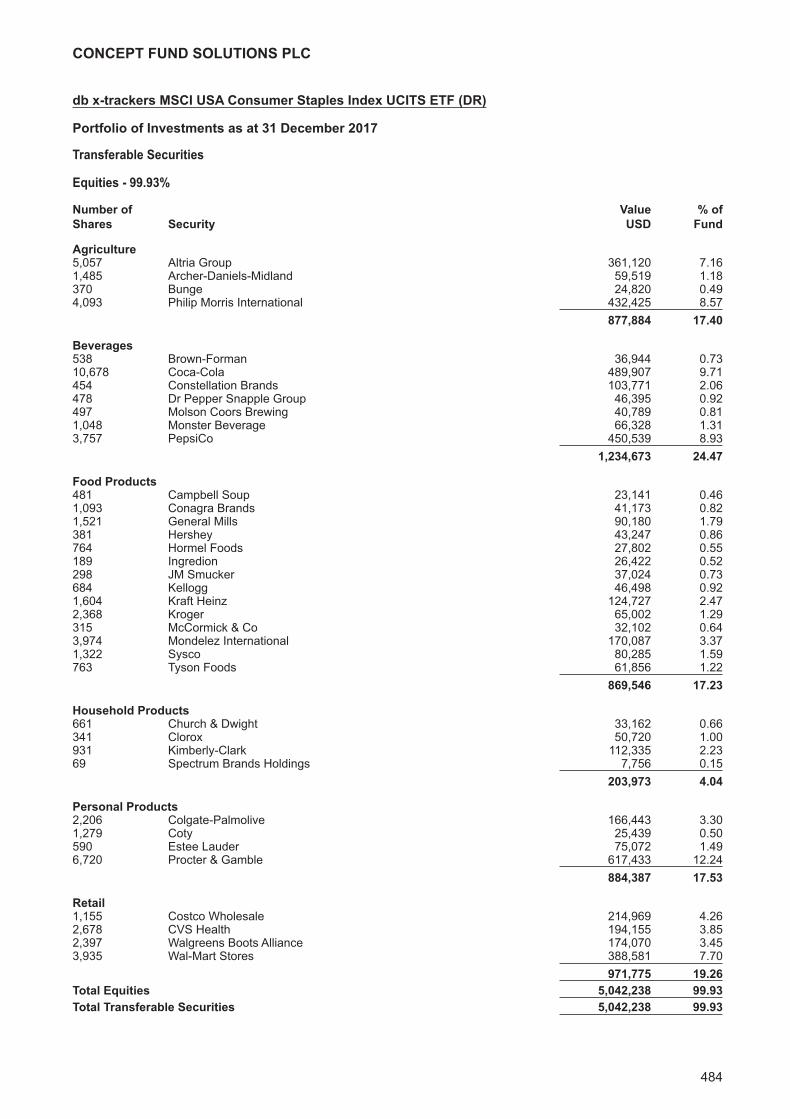
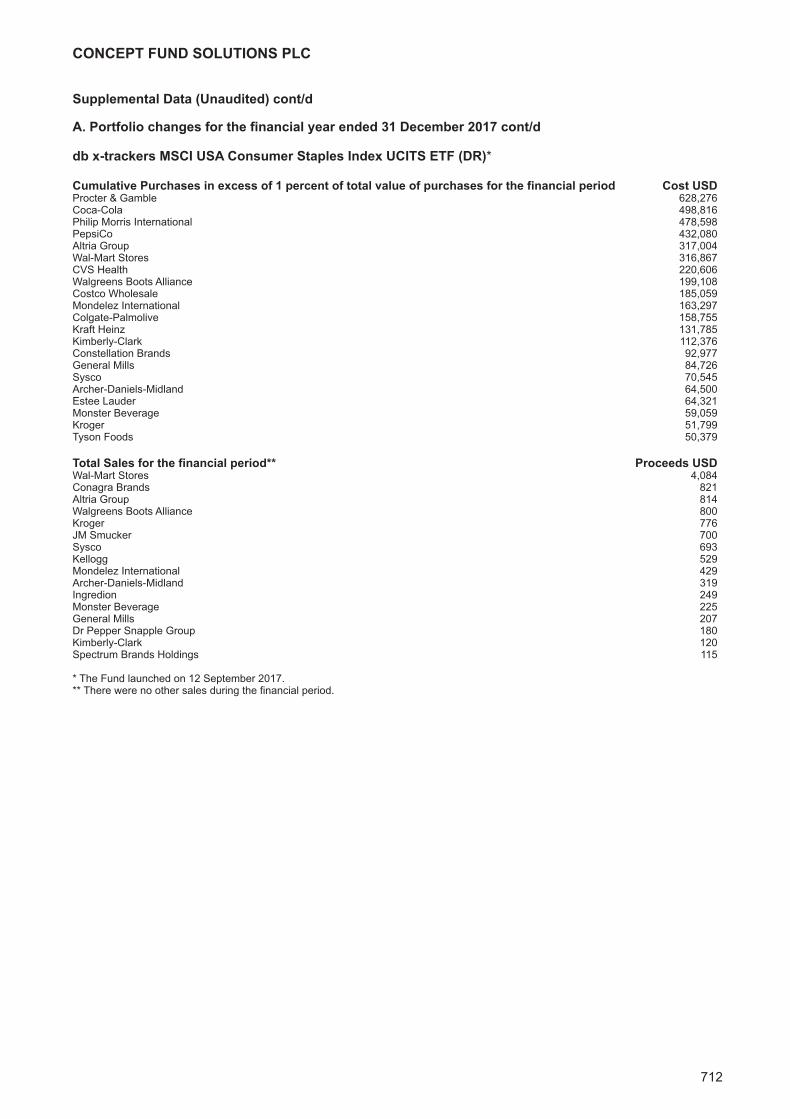
db x-trackers MSCI USA Consumer Staples Index UCITS ETF (DR)Investment Manager’s Report 483Portfolio of Investments 484
CONCEPT FUND SOLUTIONS PLC
CONTENTS CONT/DPage
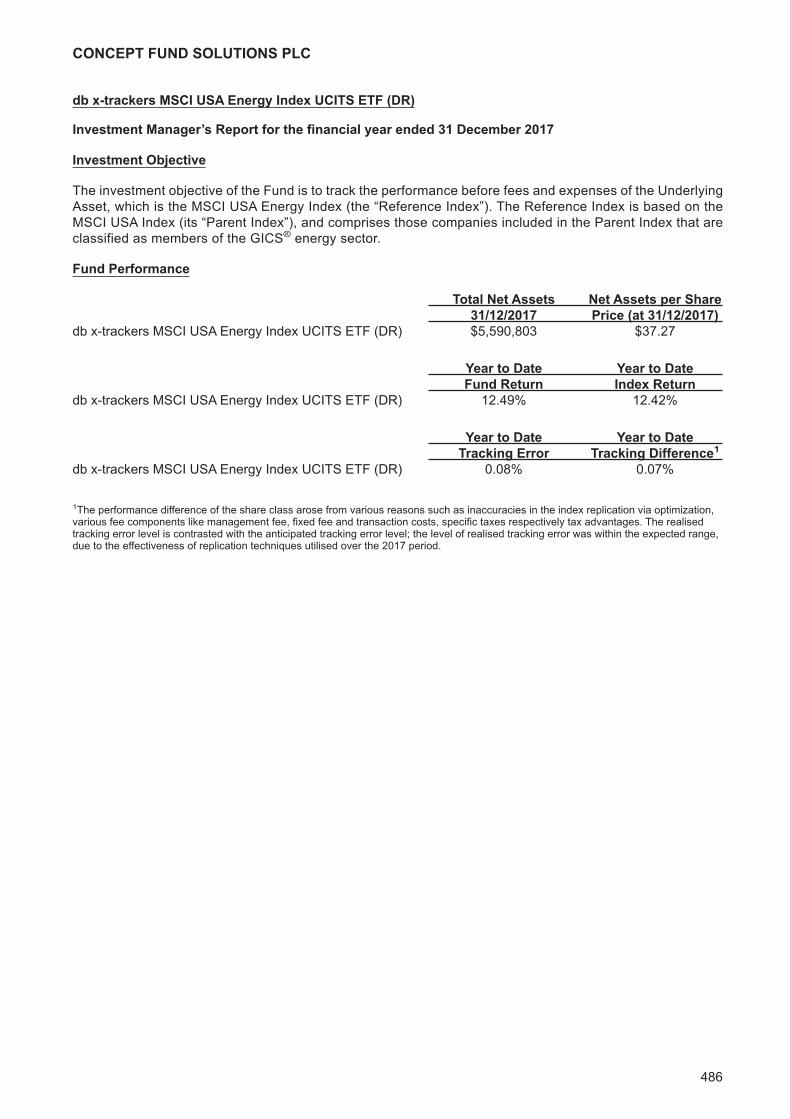
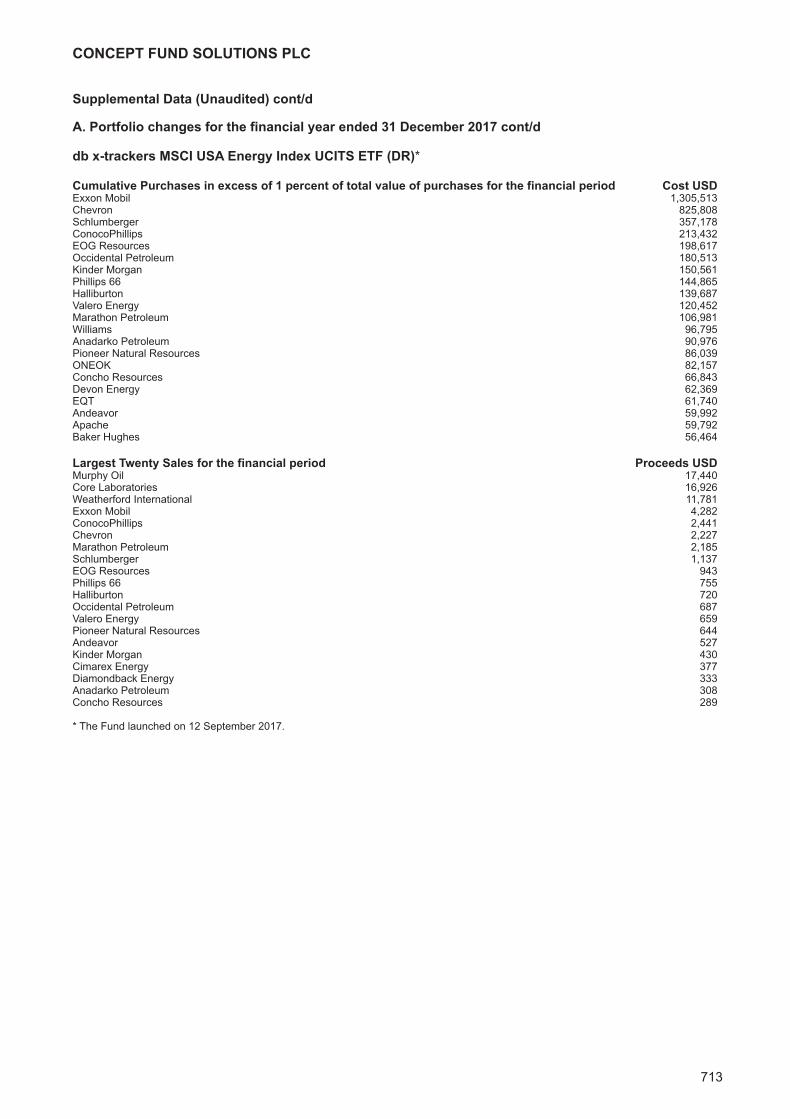
db x-trackers MSCI USA Energy Index UCITS ETF (DR)Investment Manager’s Report 486Portfolio of Investments 487
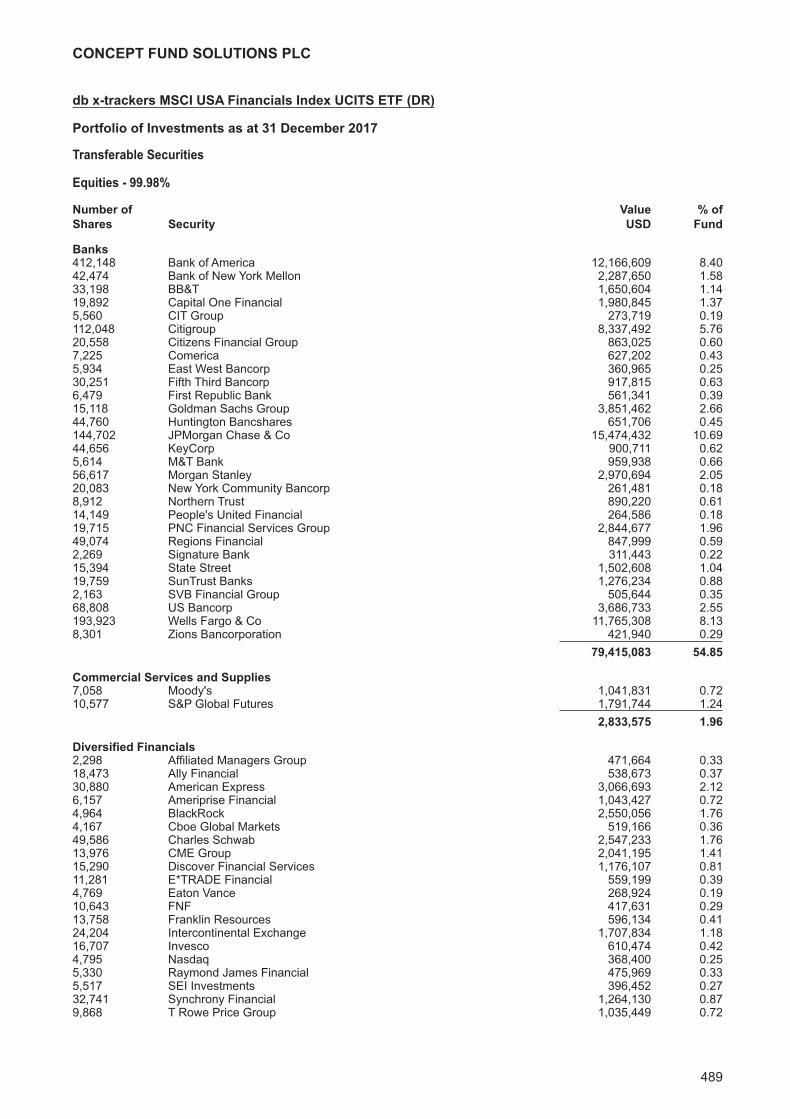
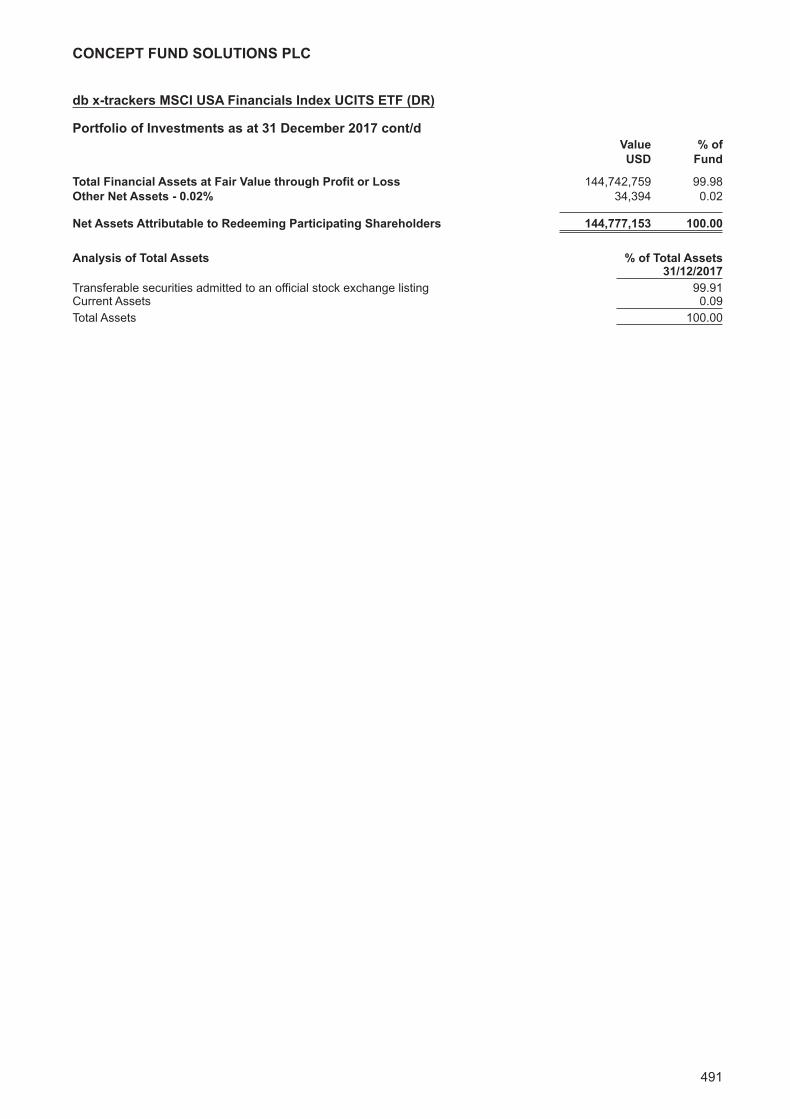
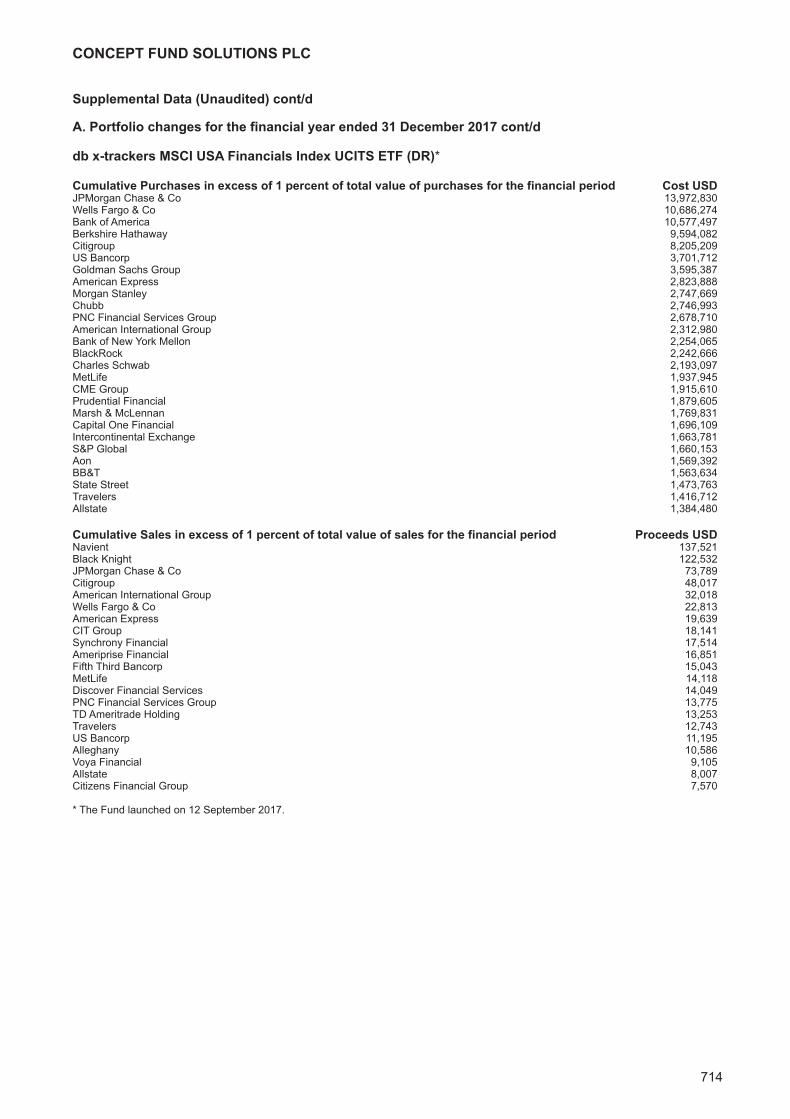
db x-trackers MSCI USA Financials Index UCITS ETF (DR)Investment Manager’s Report 488Portfolio of Investments 489
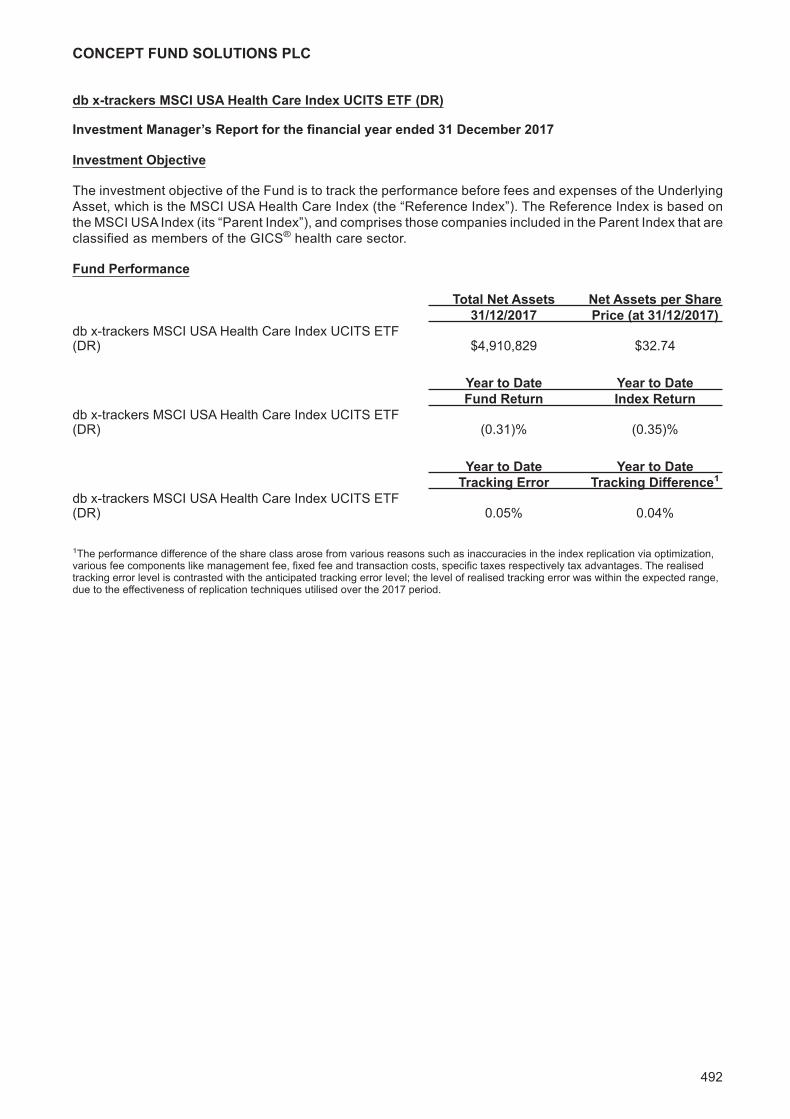
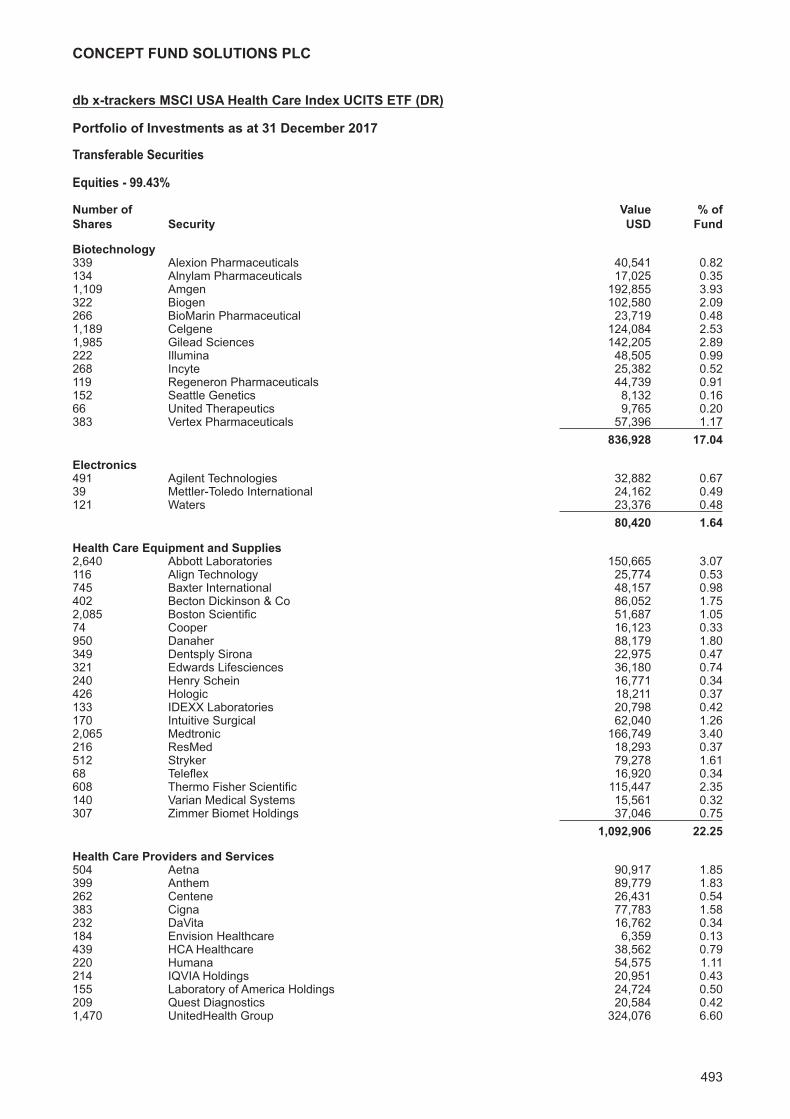
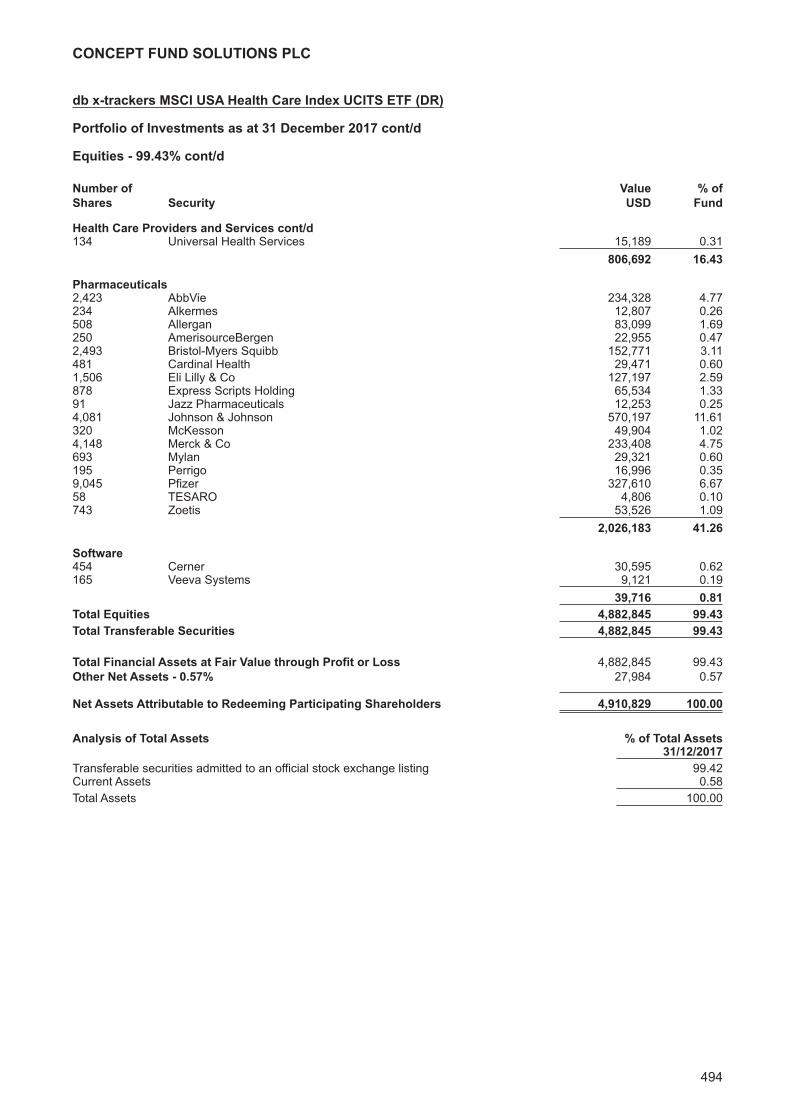
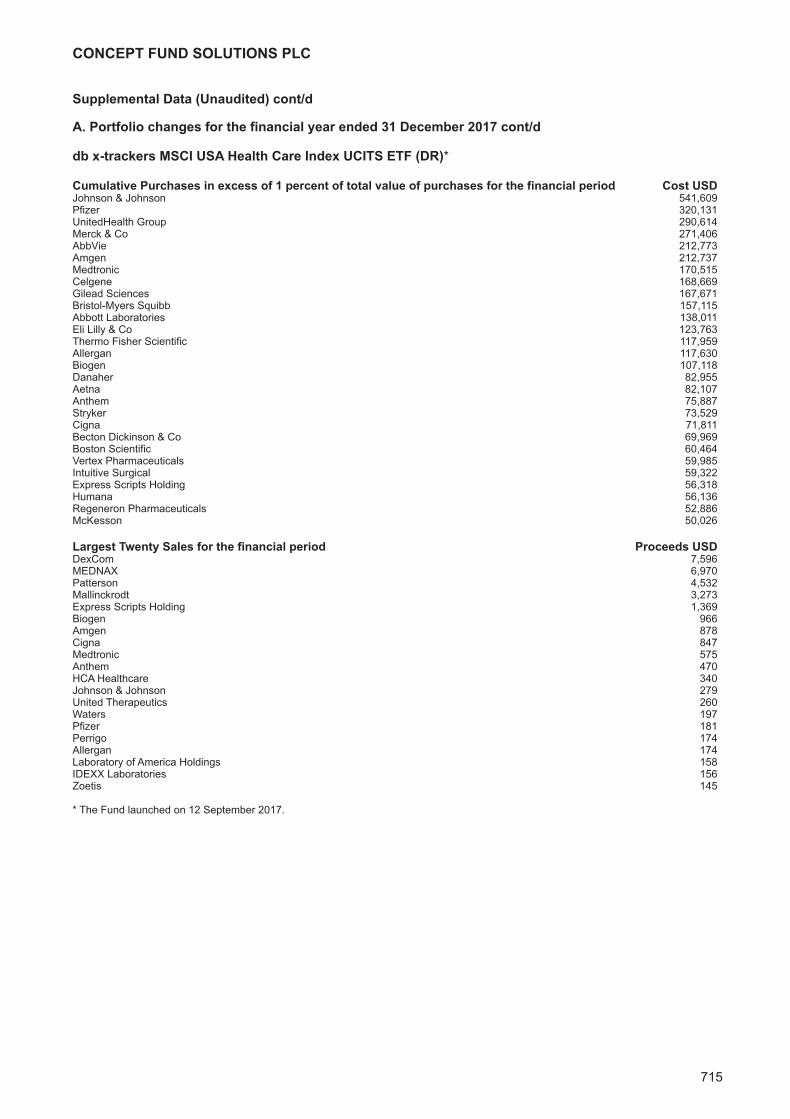
db x-trackers MSCI USA Health Care Index UCITS ETF (DR)Investment Manager’s Report 492Portfolio of Investments 493
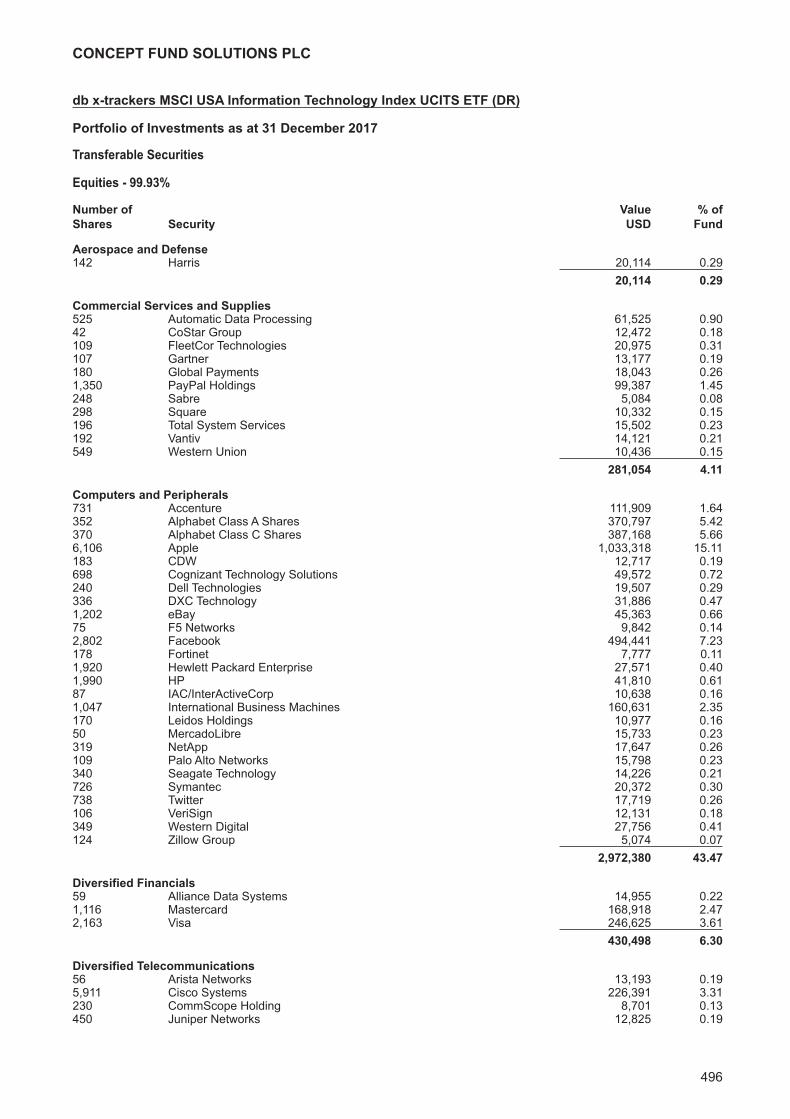
db x-trackers MSCI USA Information Technology Index UCITS ETF (DR)Investment Manager’s Report 495Portfolio of Investments 496
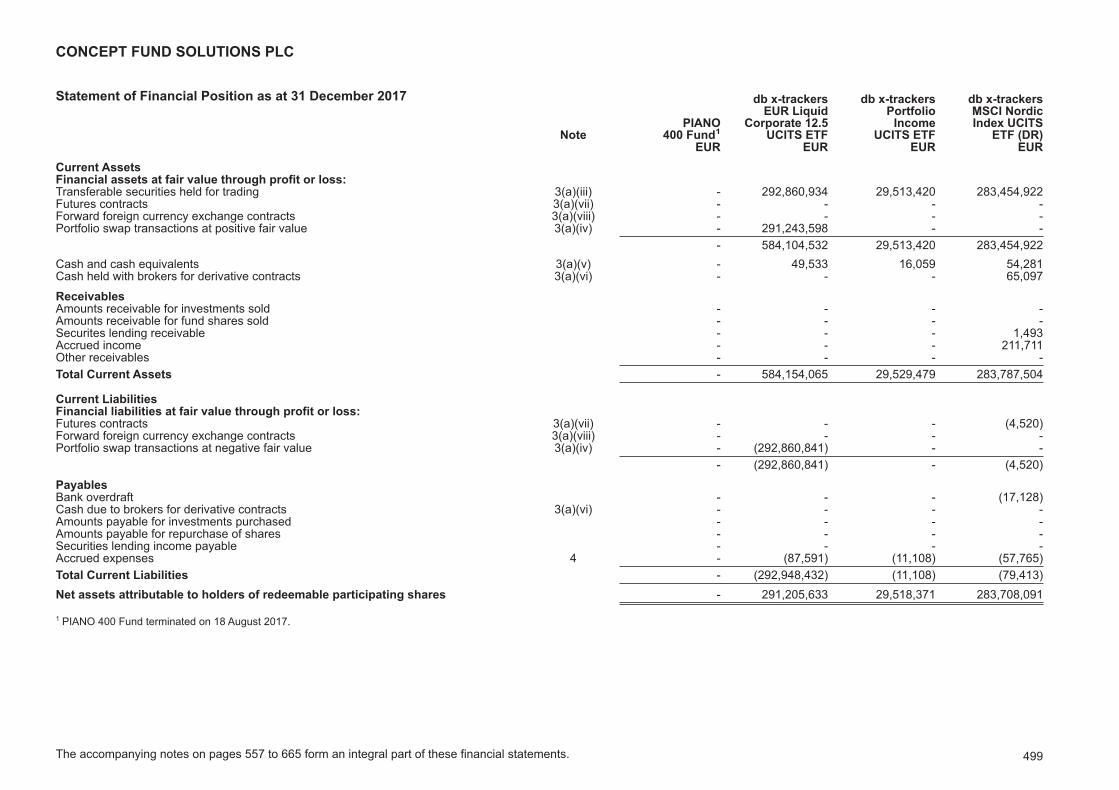
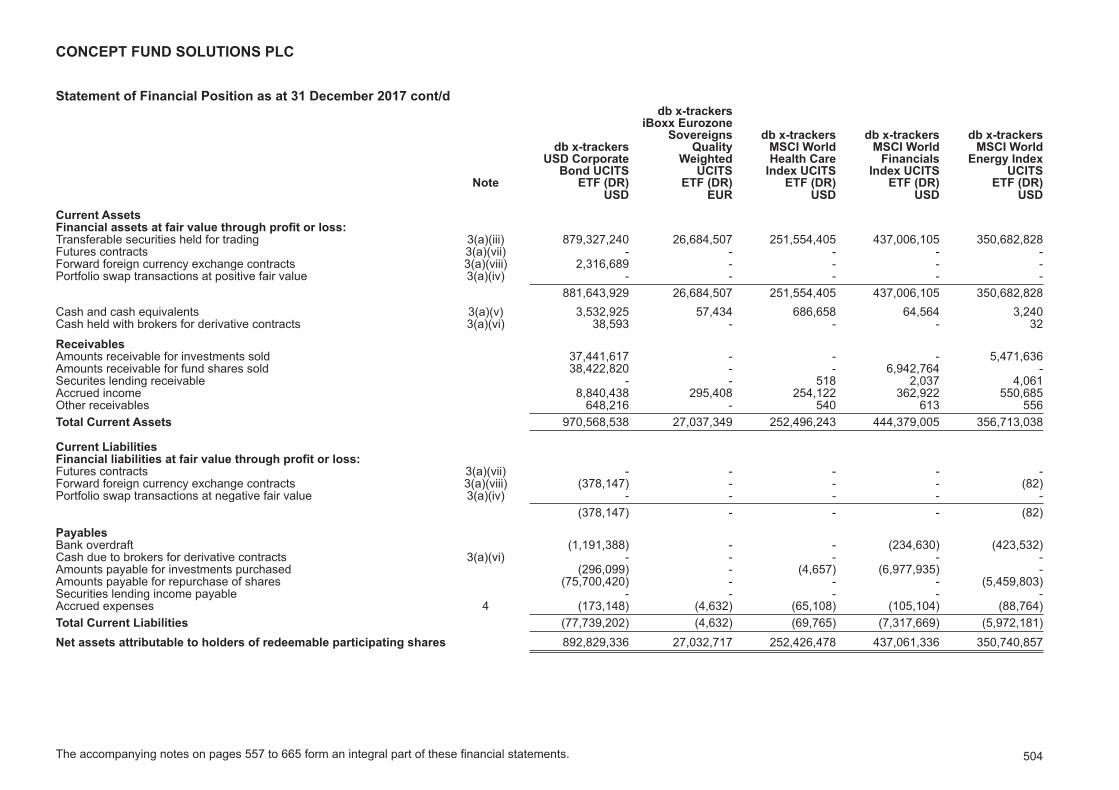
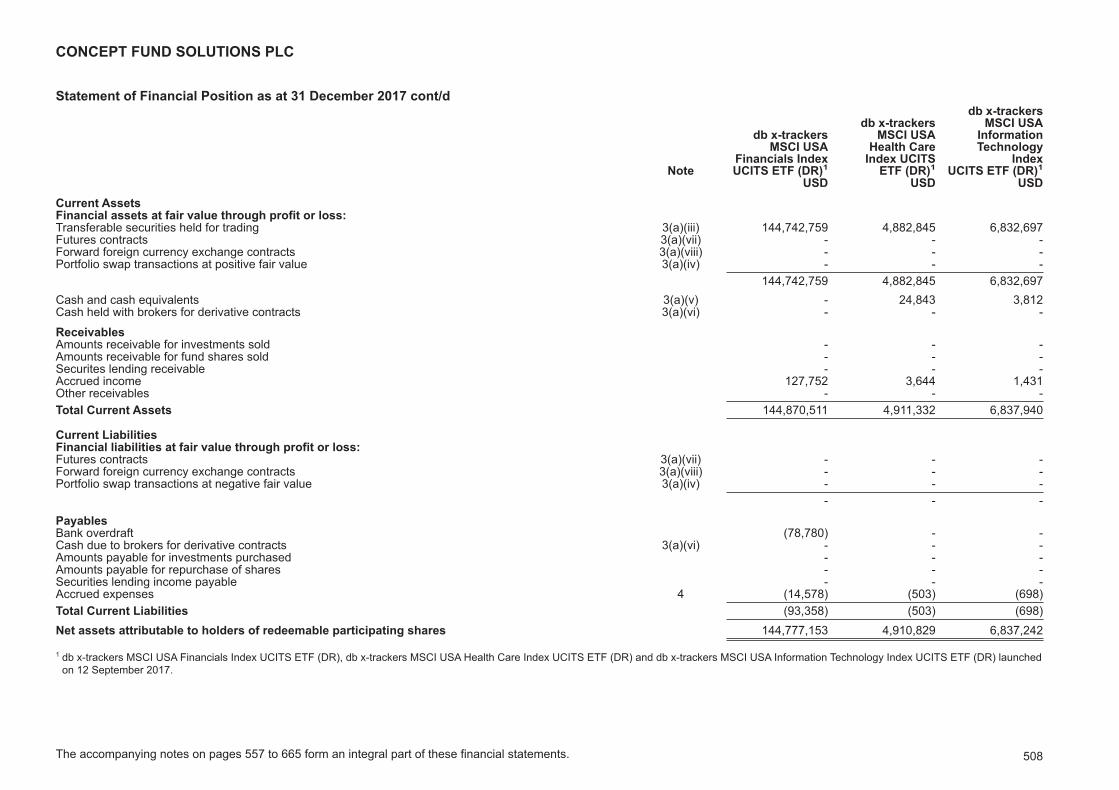
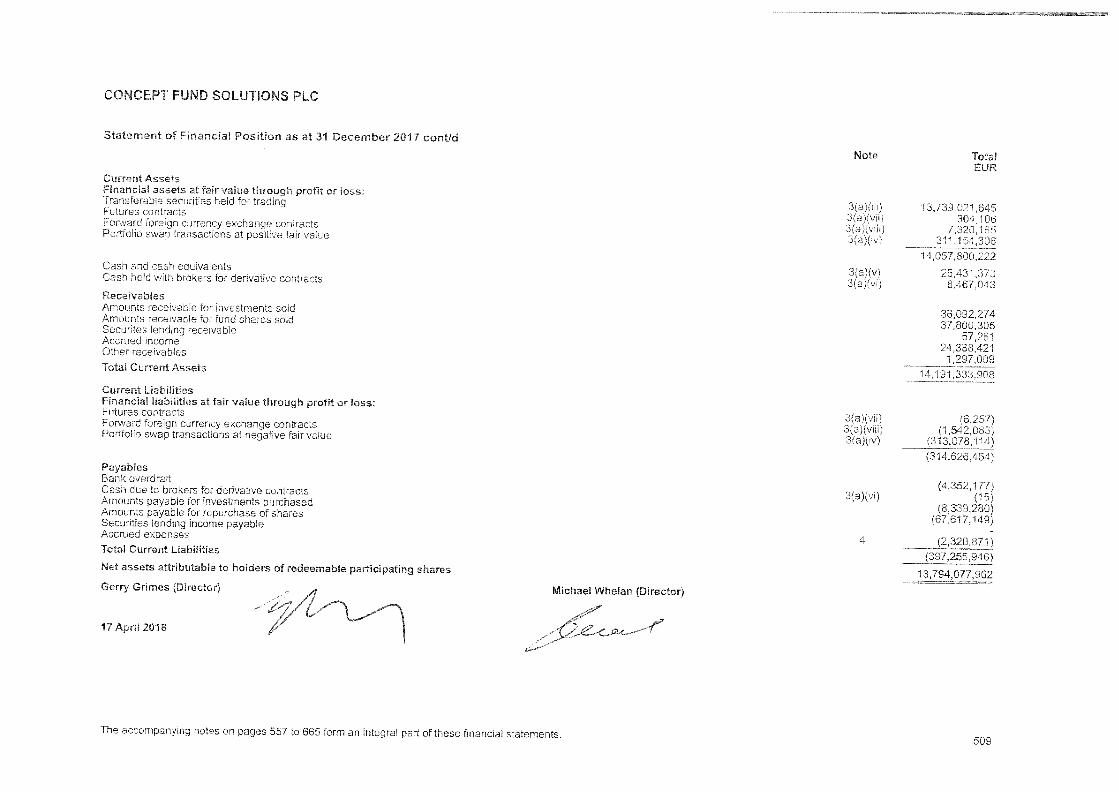
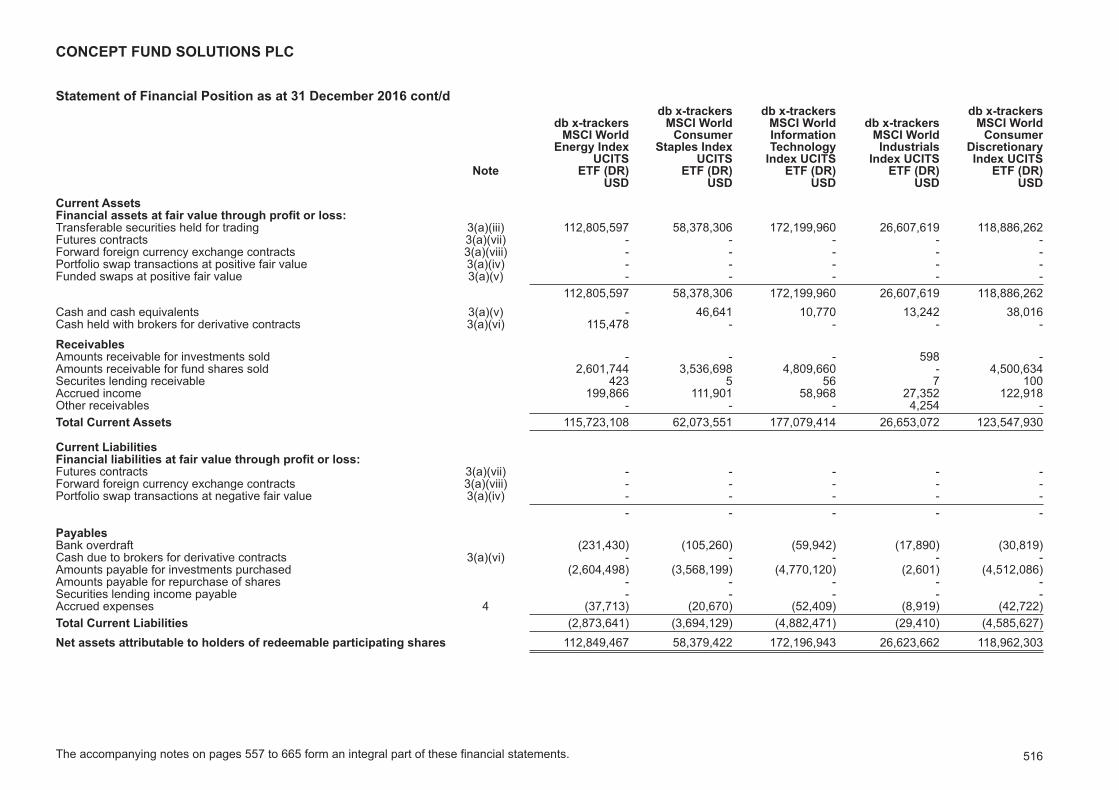
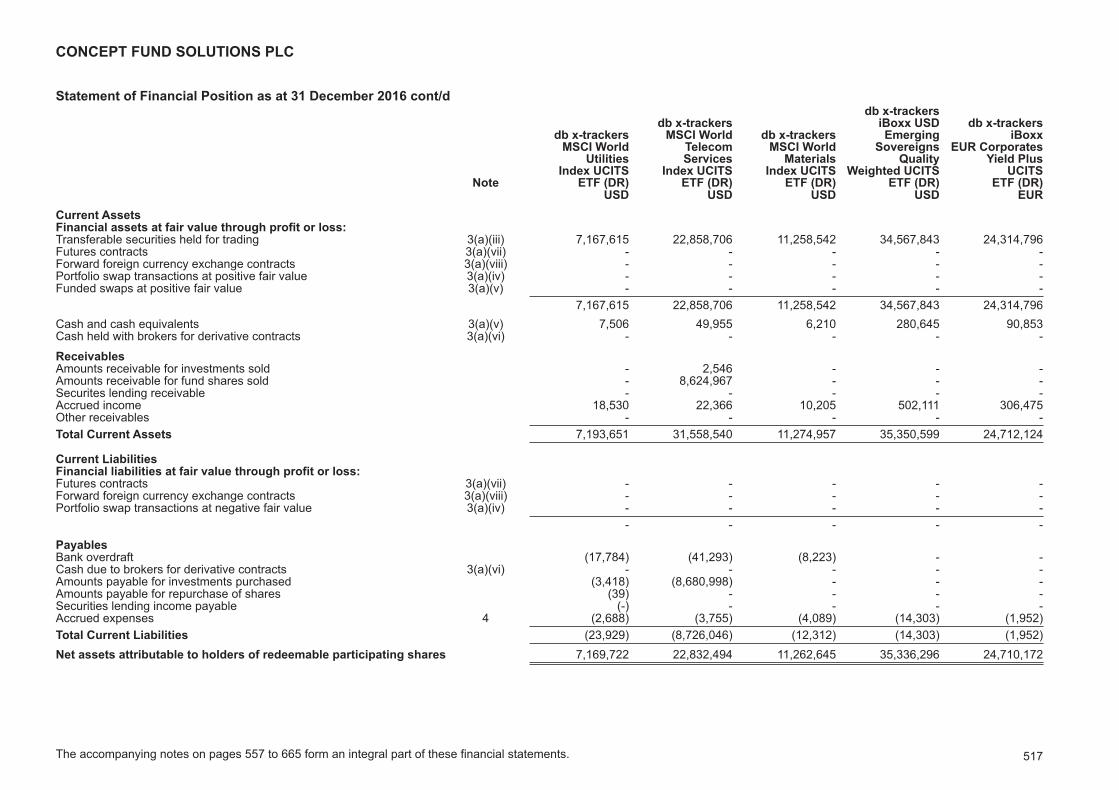
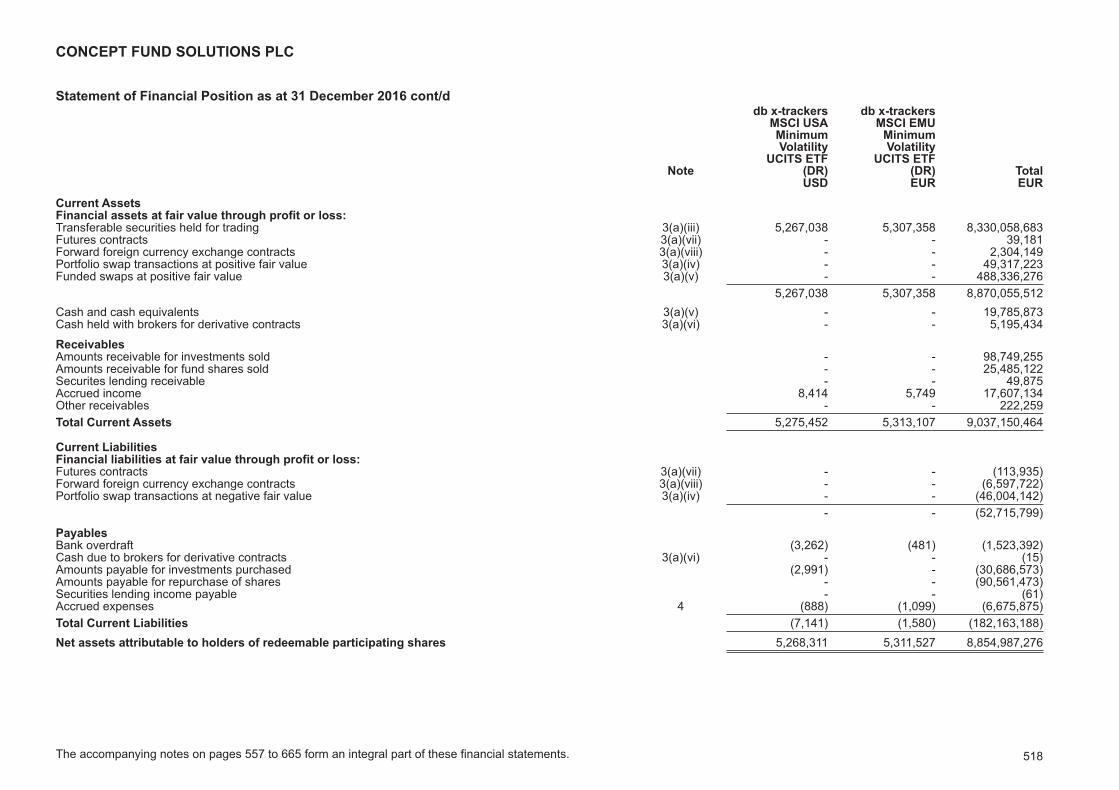
Statement of Financial Position 499
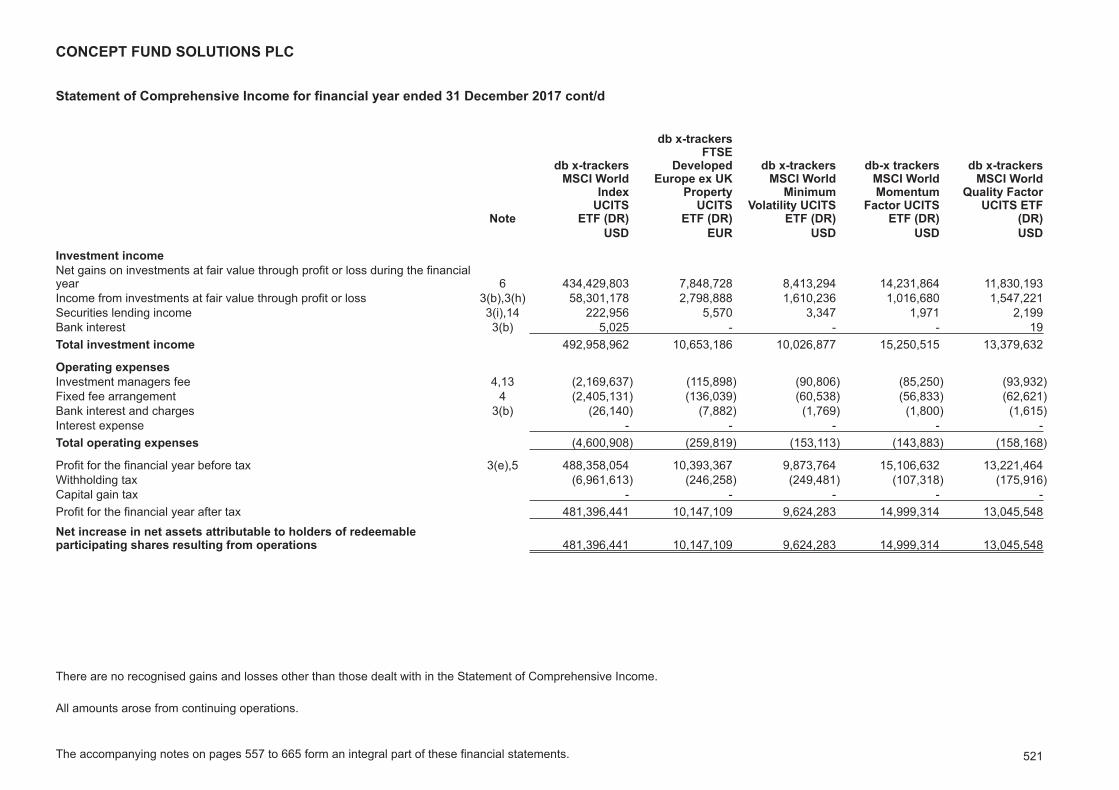
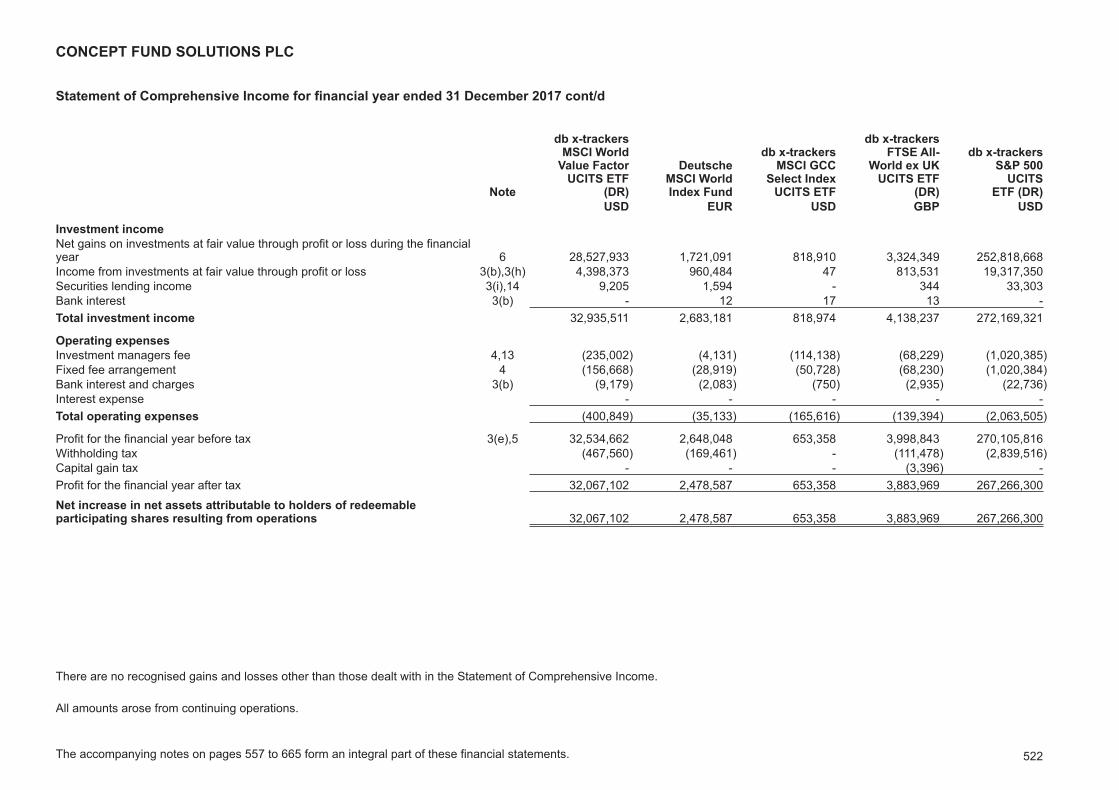
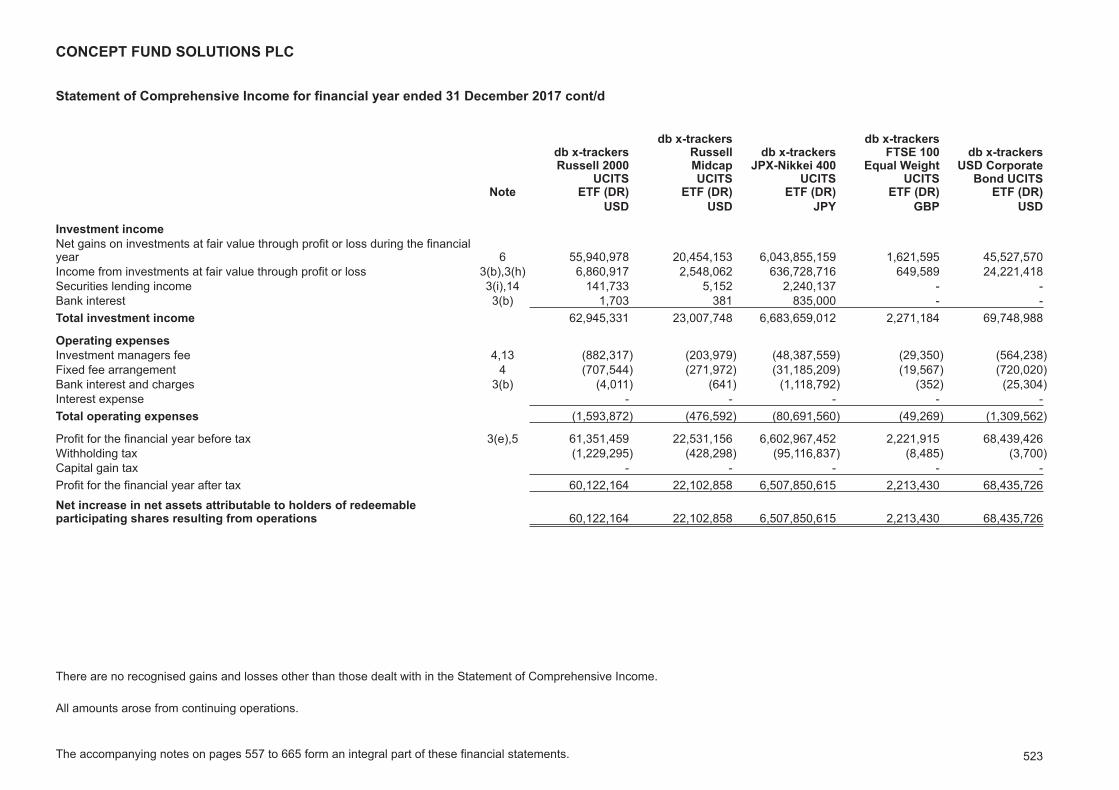
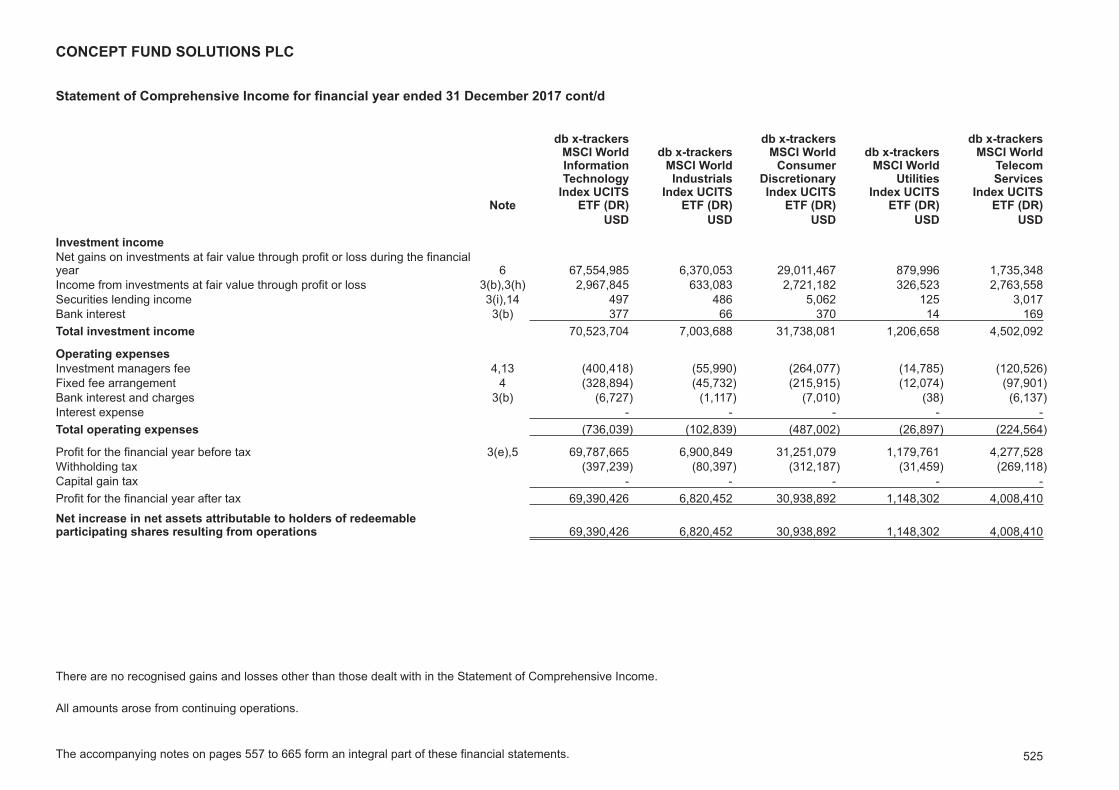
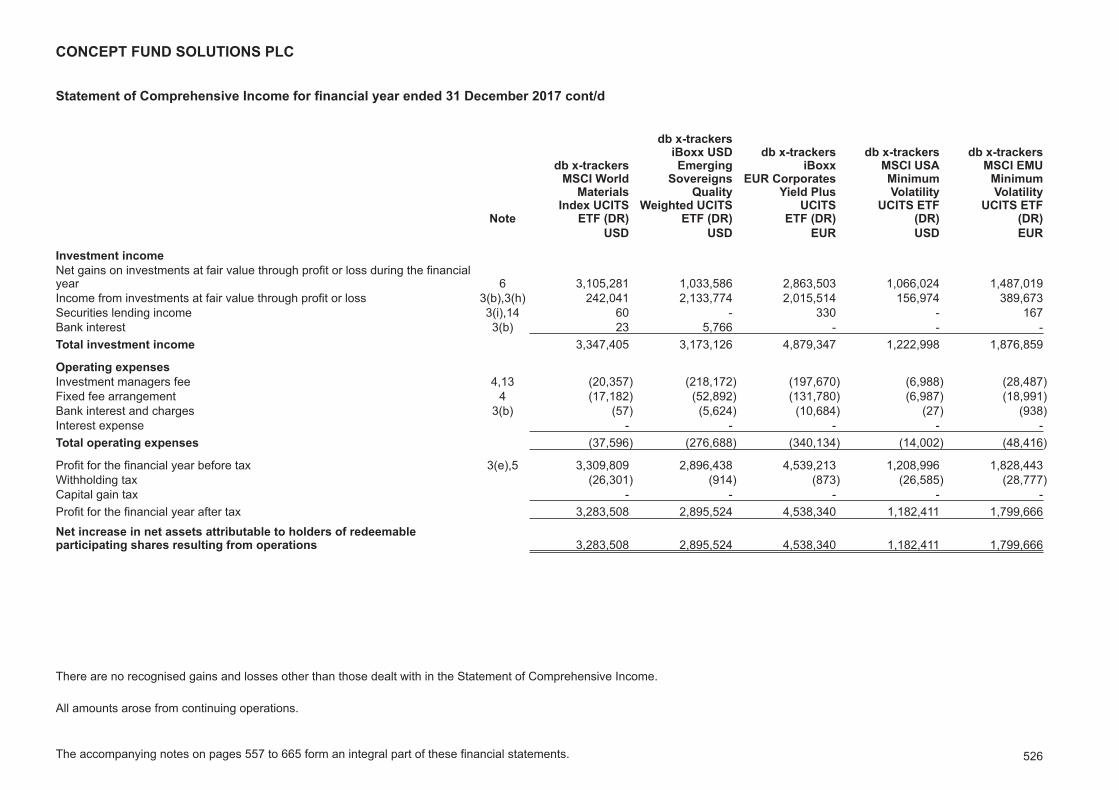
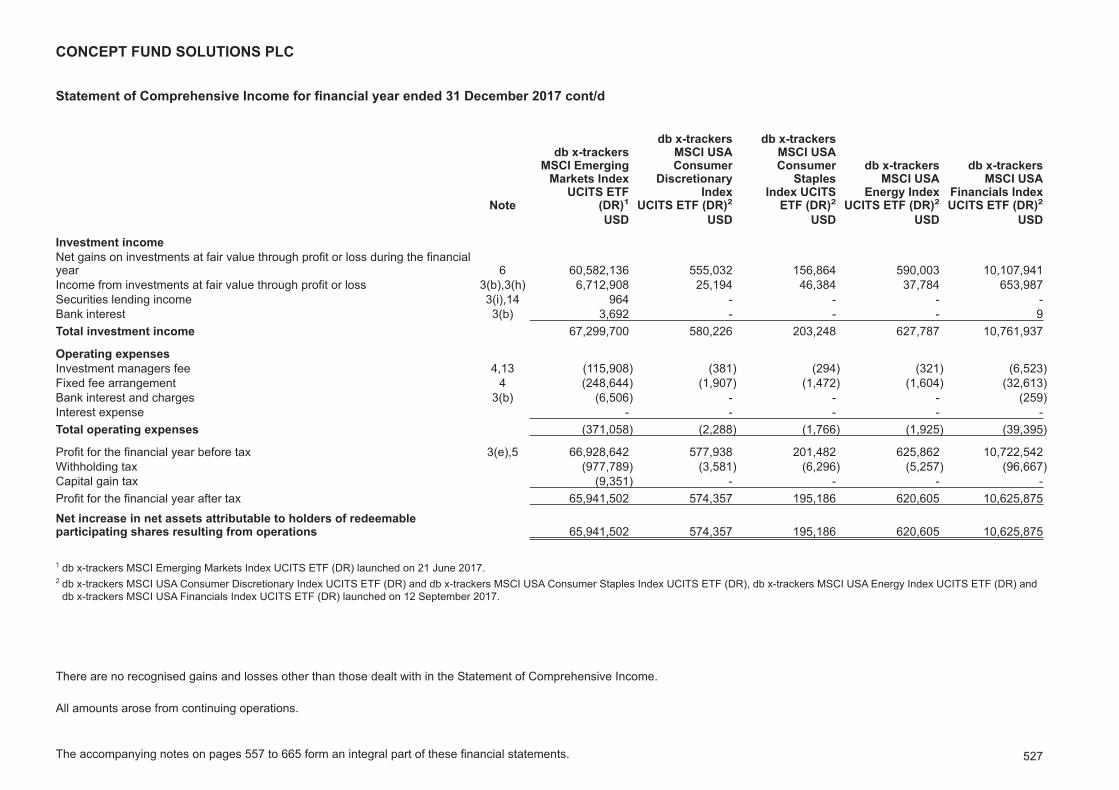
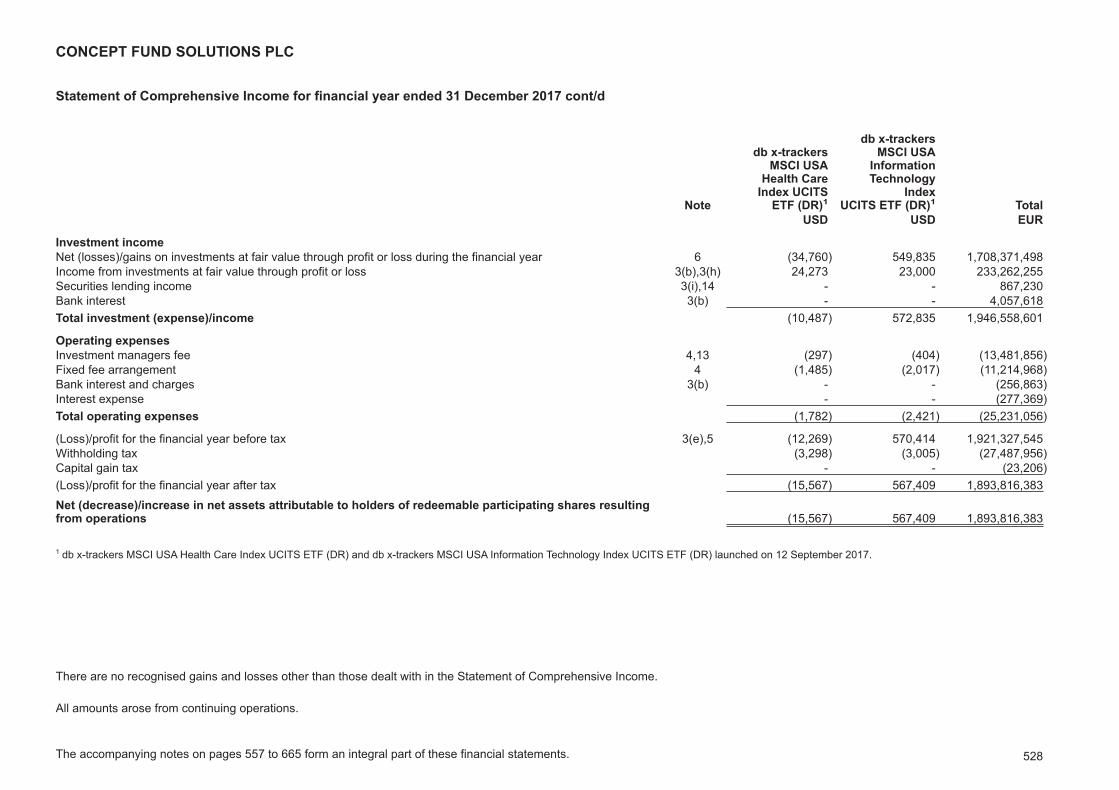
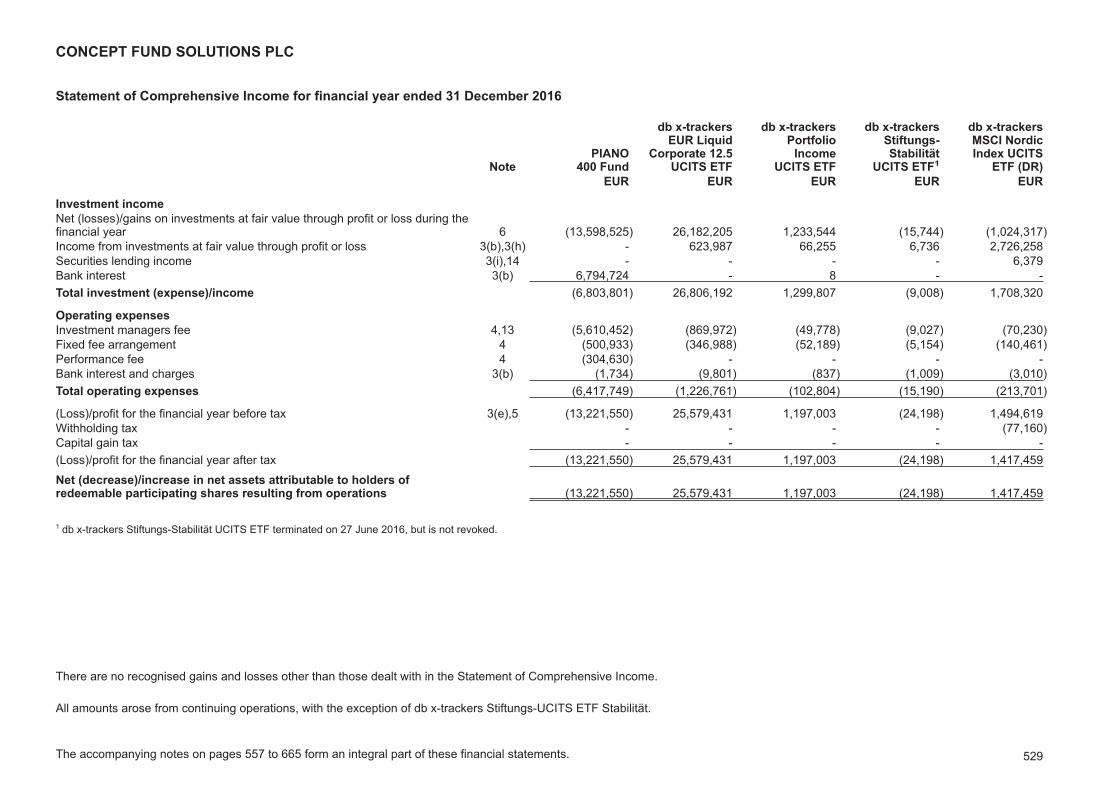
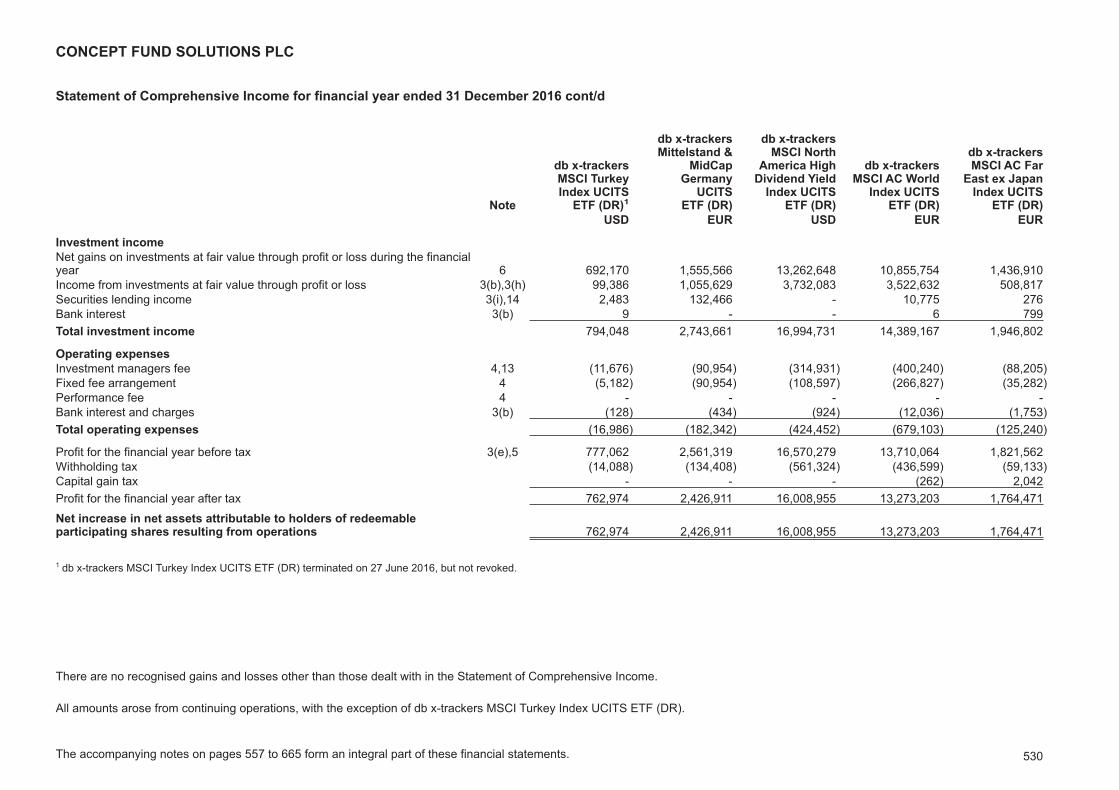
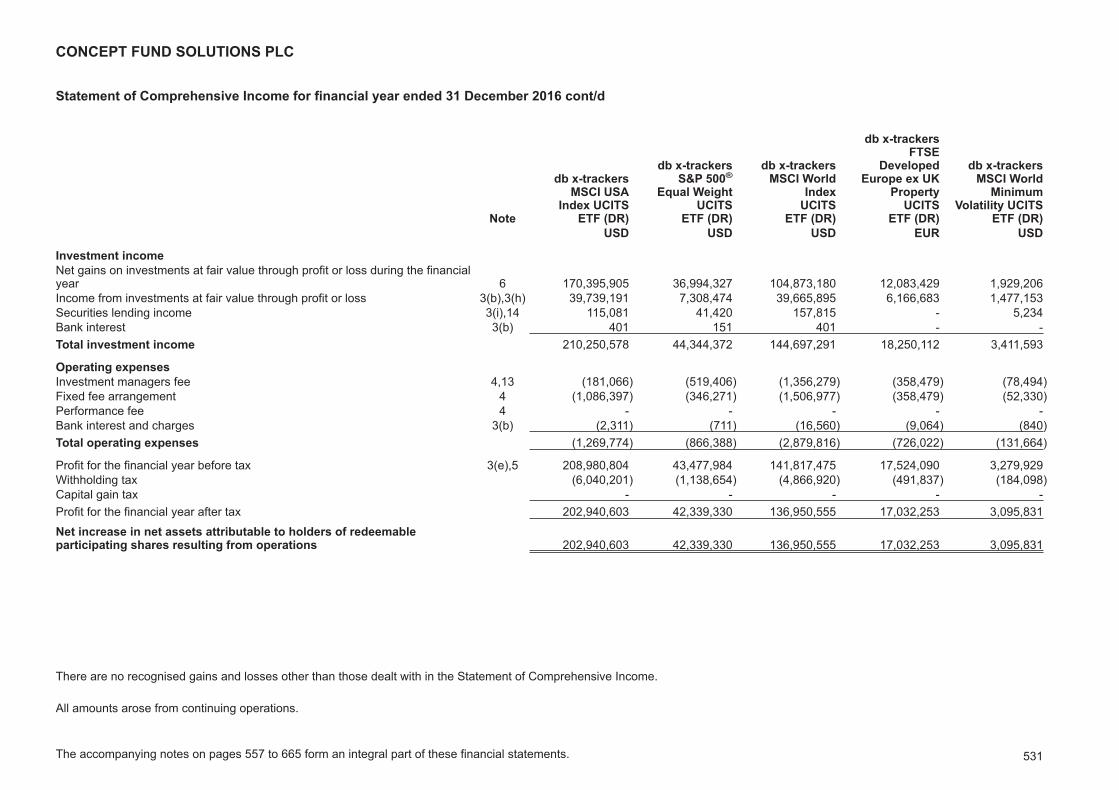
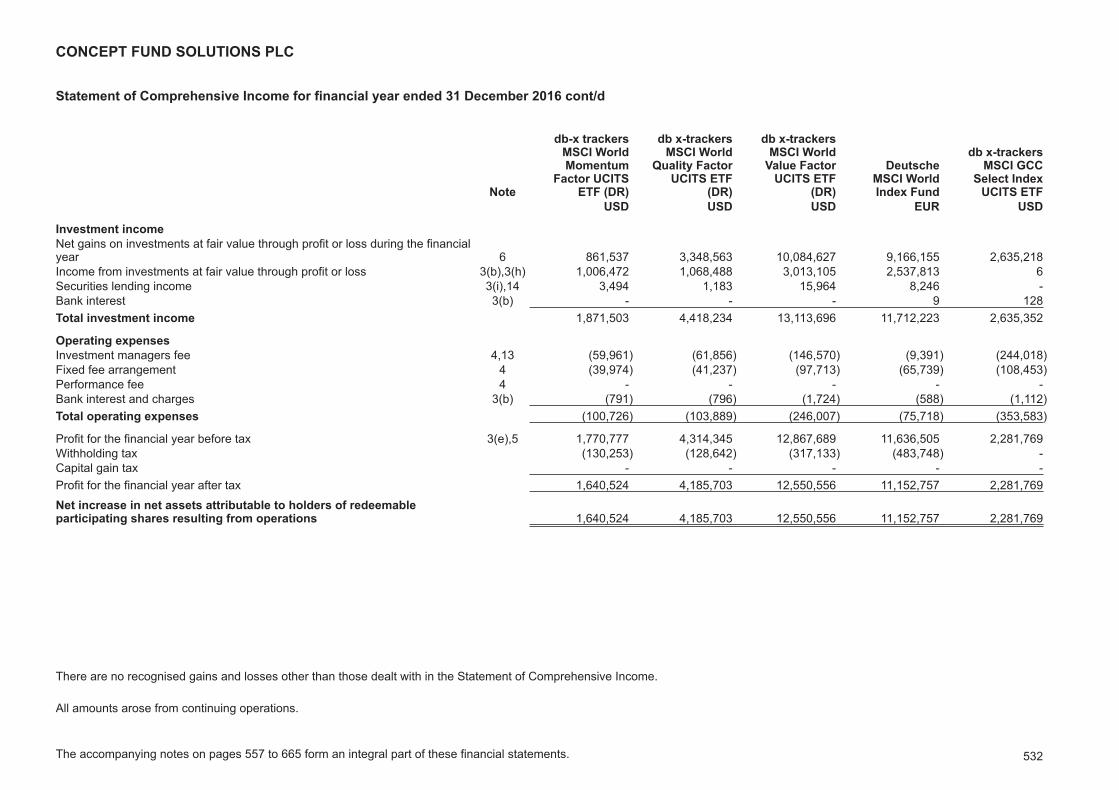
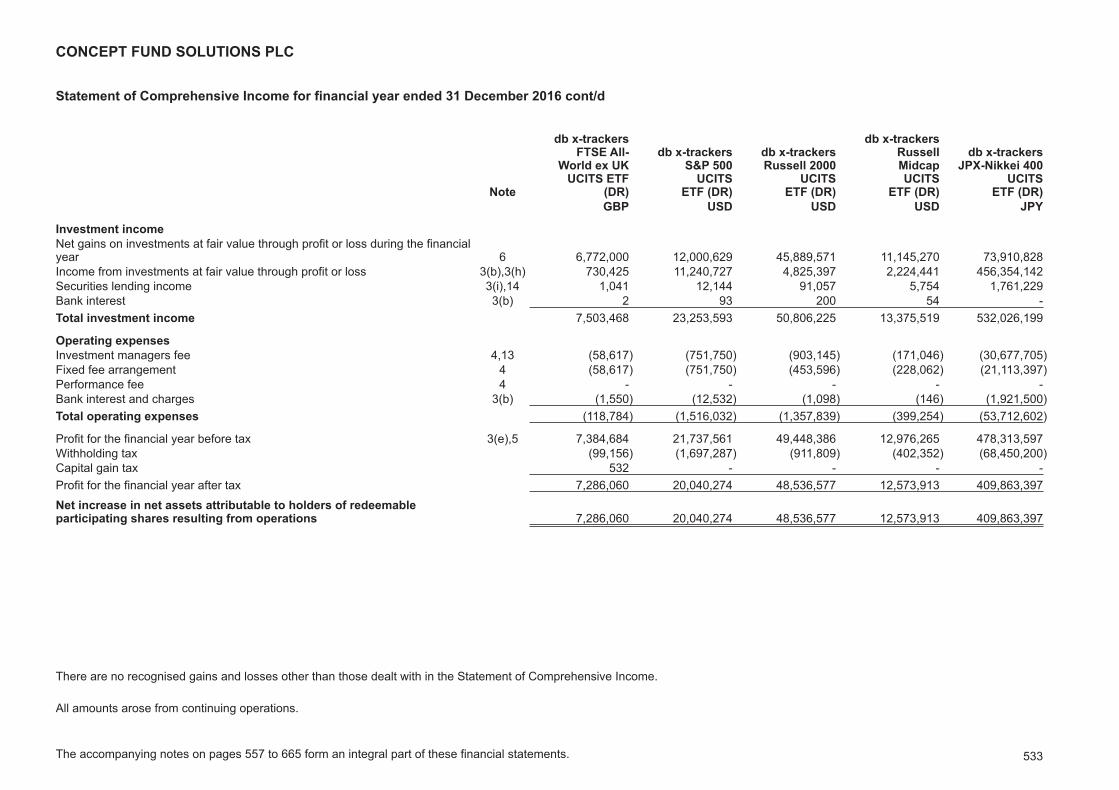
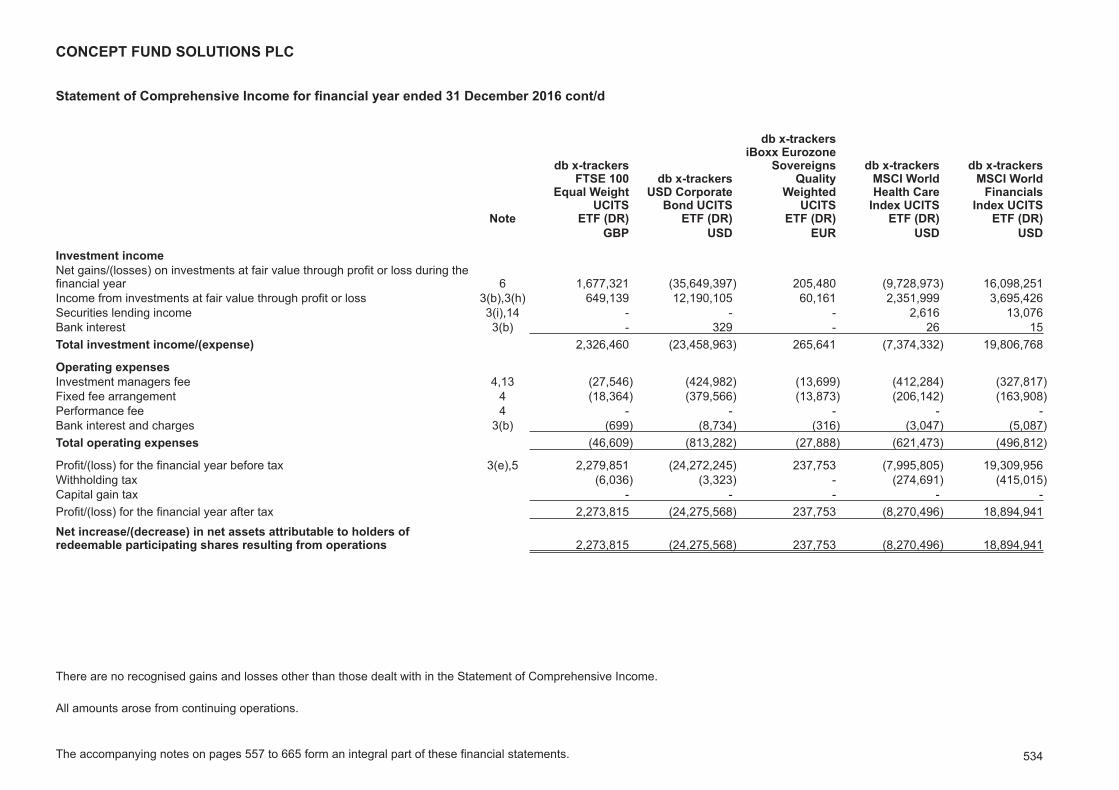
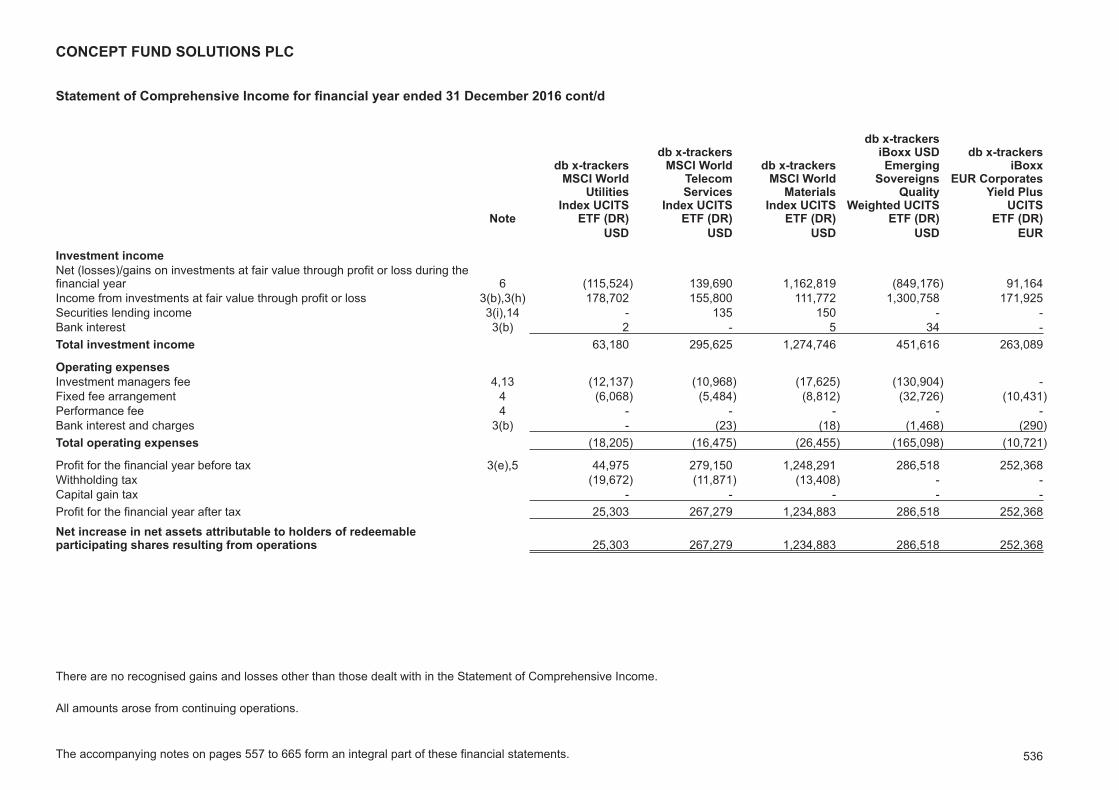
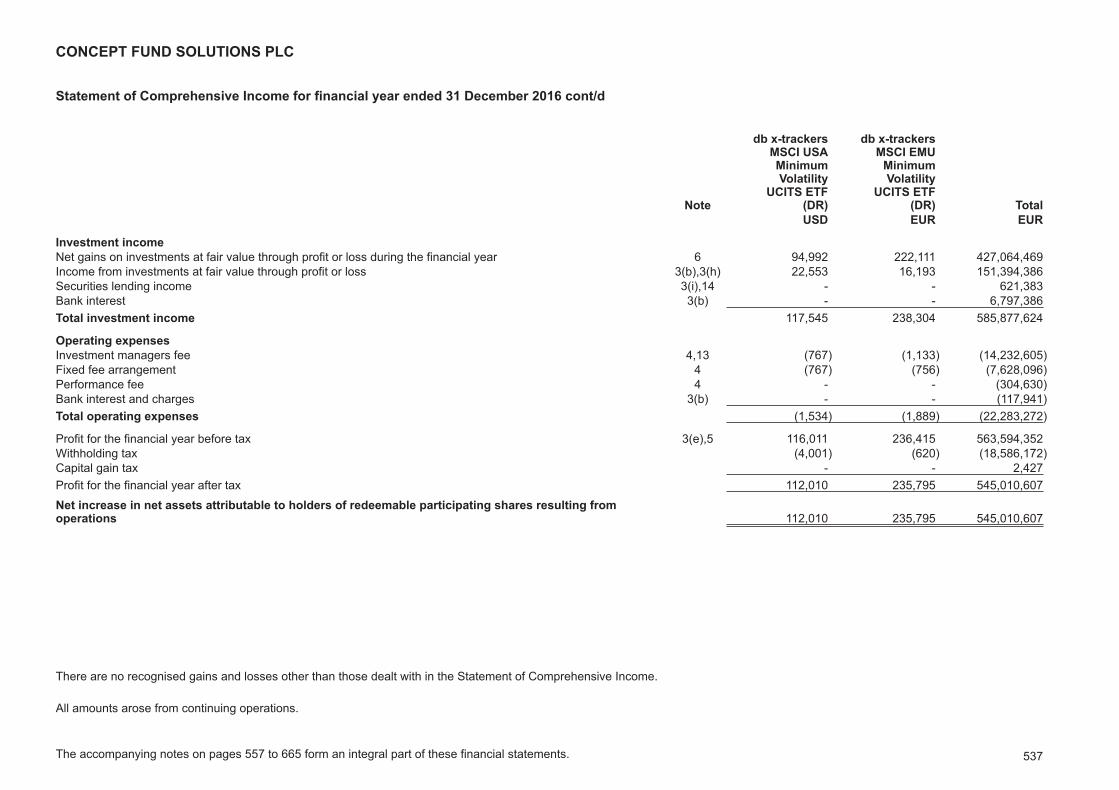
Statement of Comprehensive Income 519
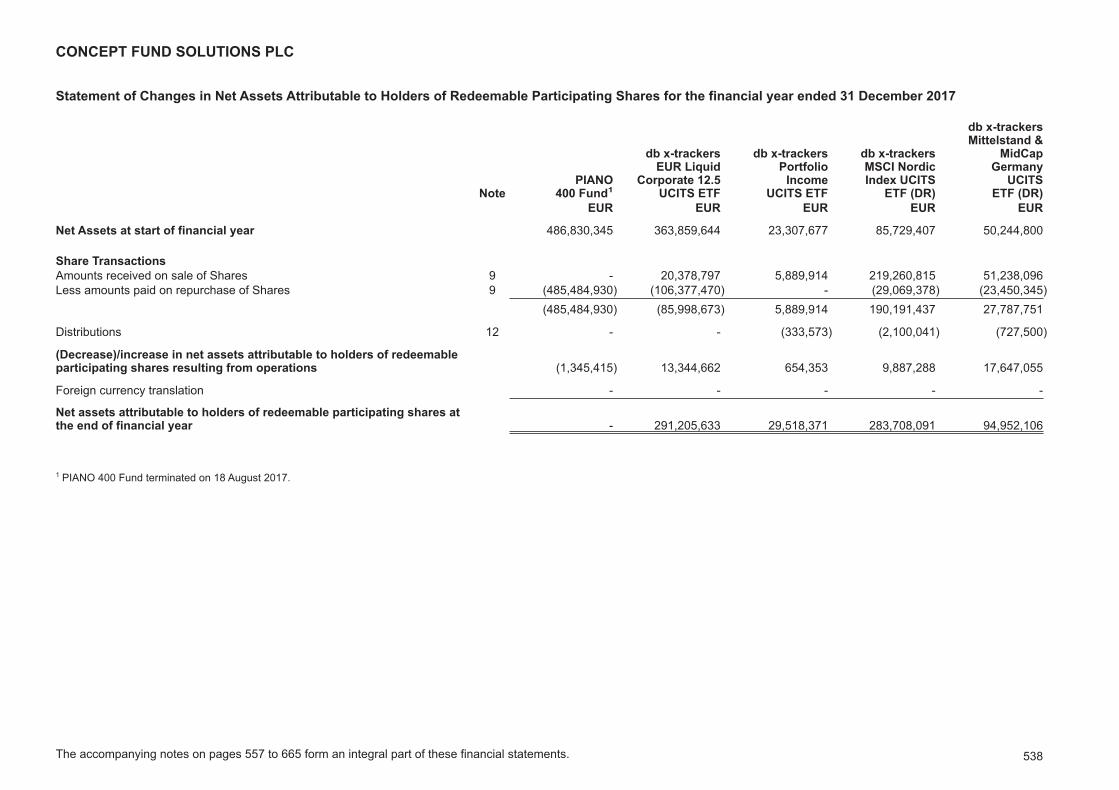
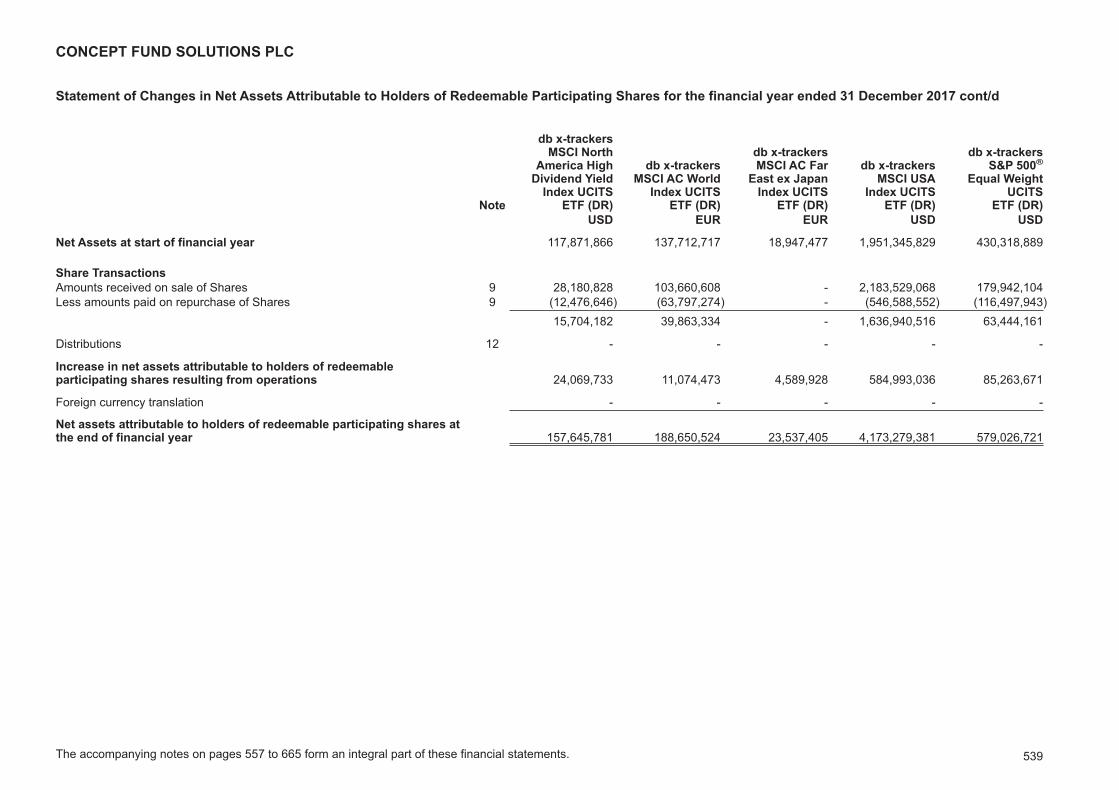
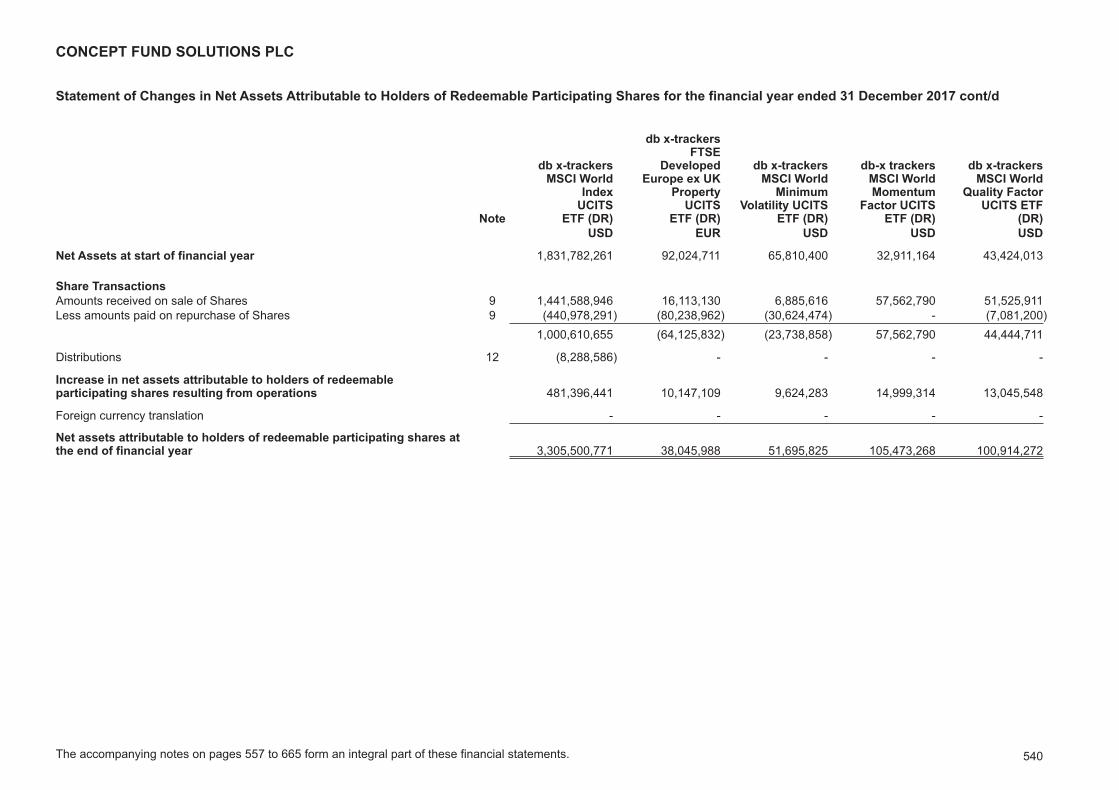
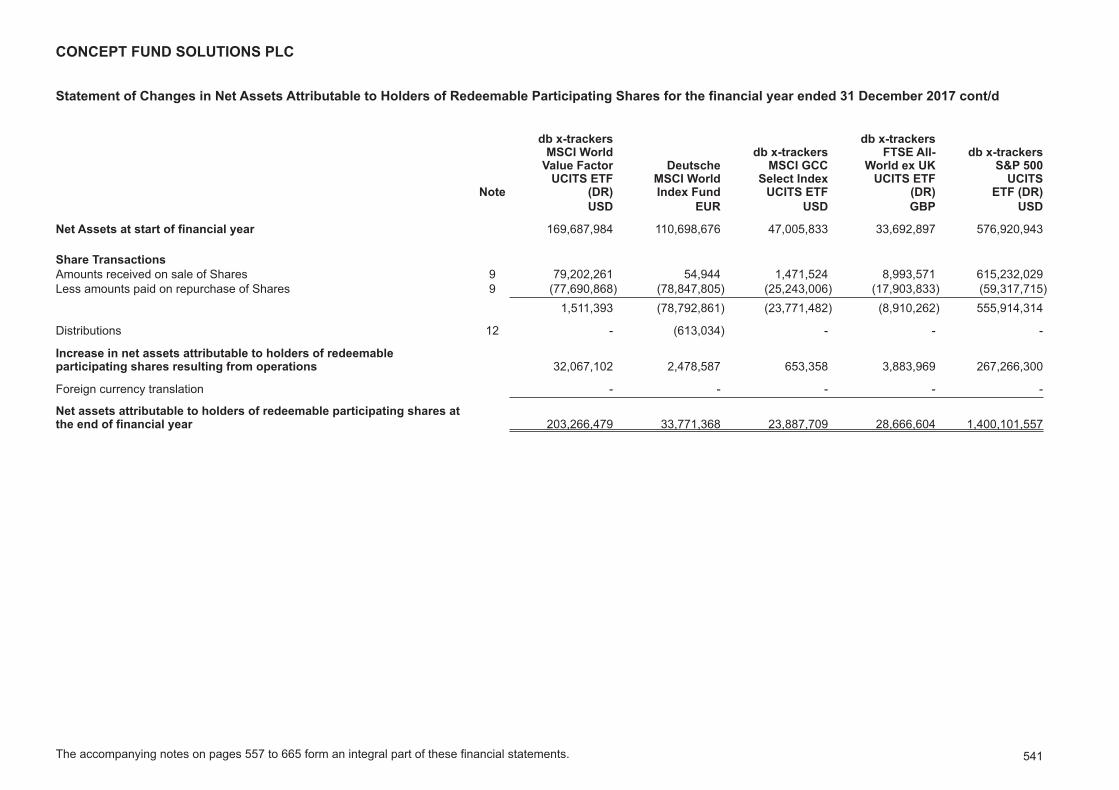
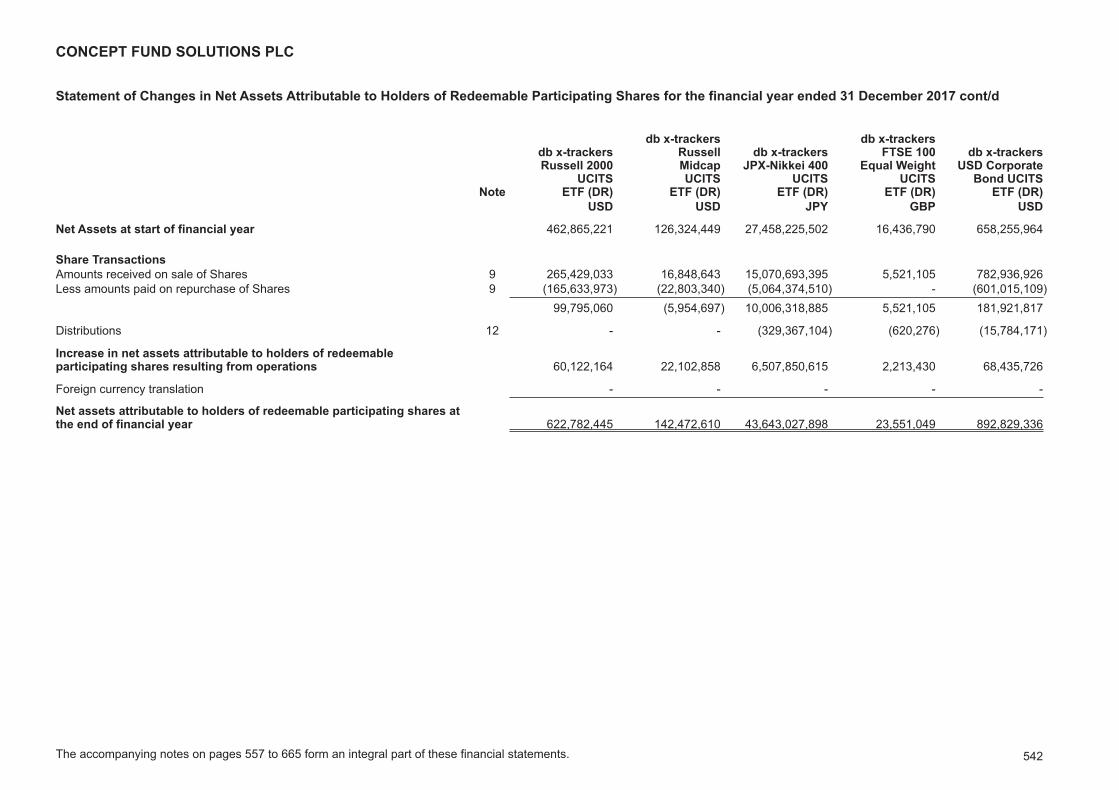
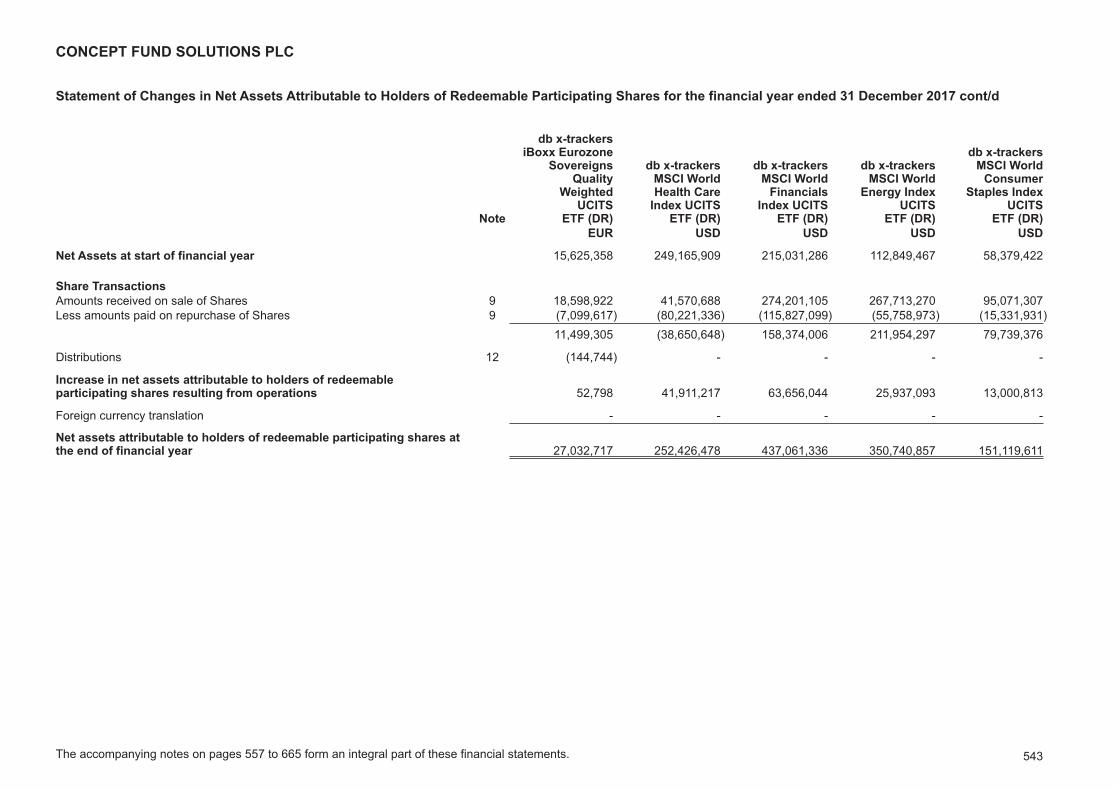
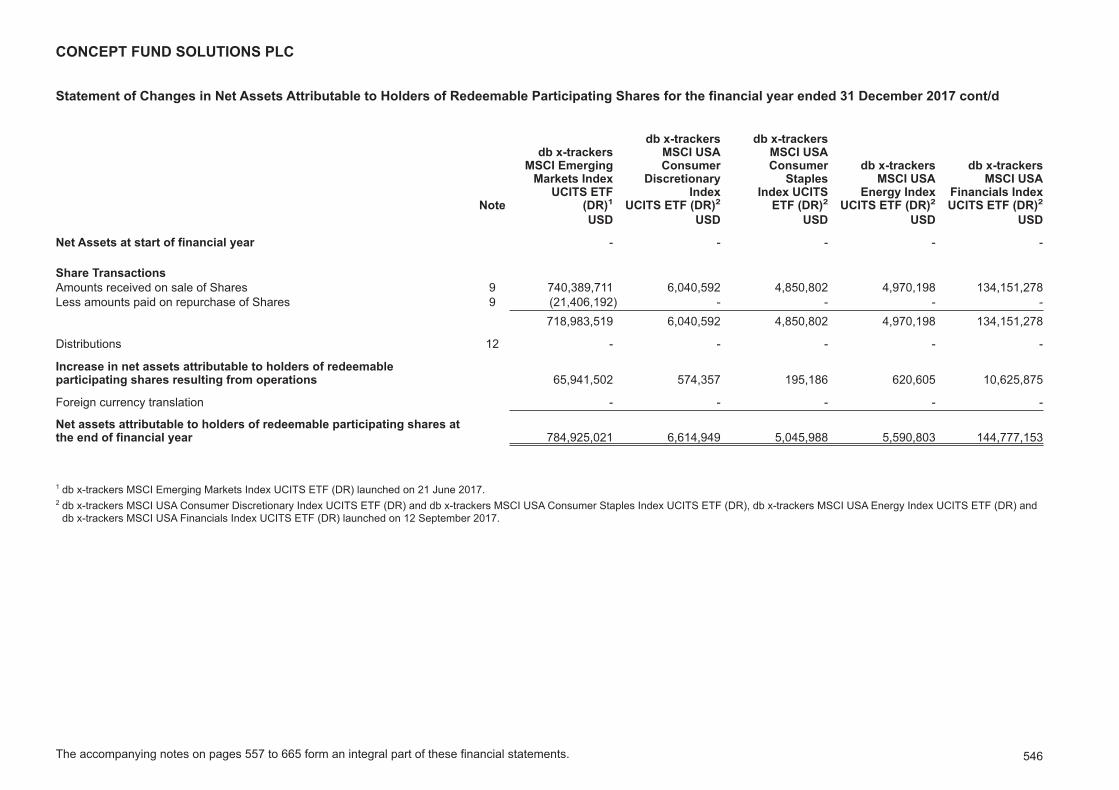
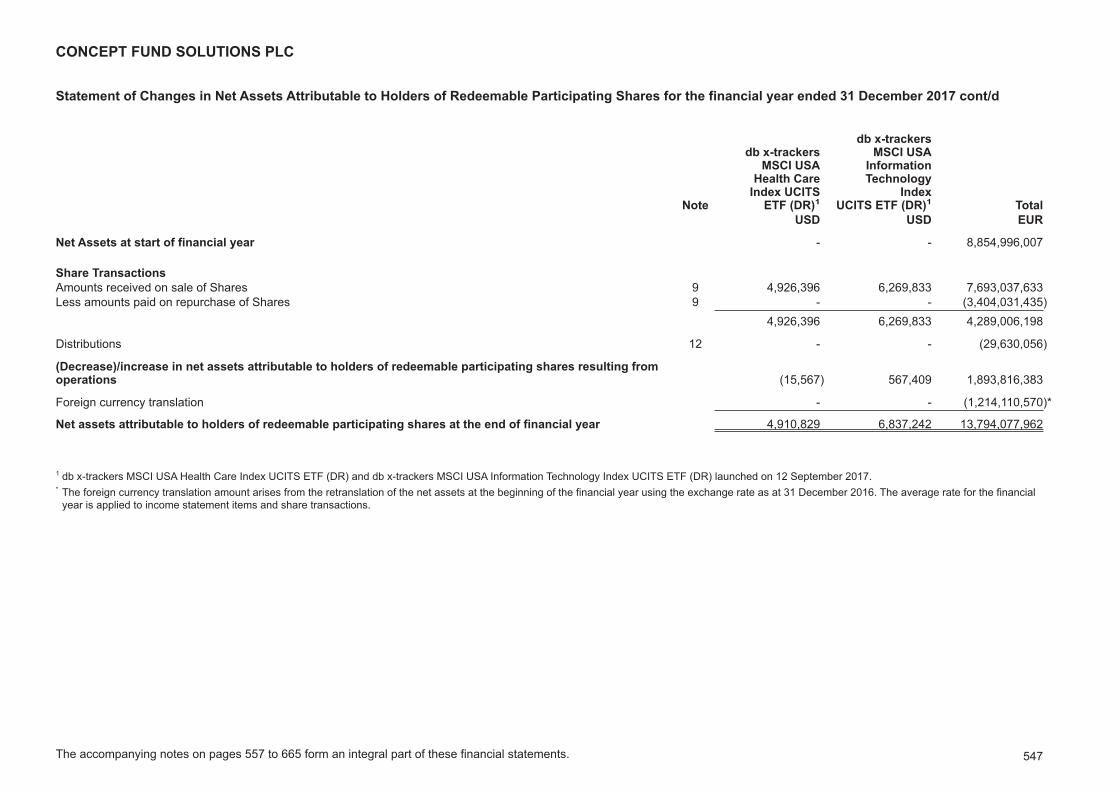
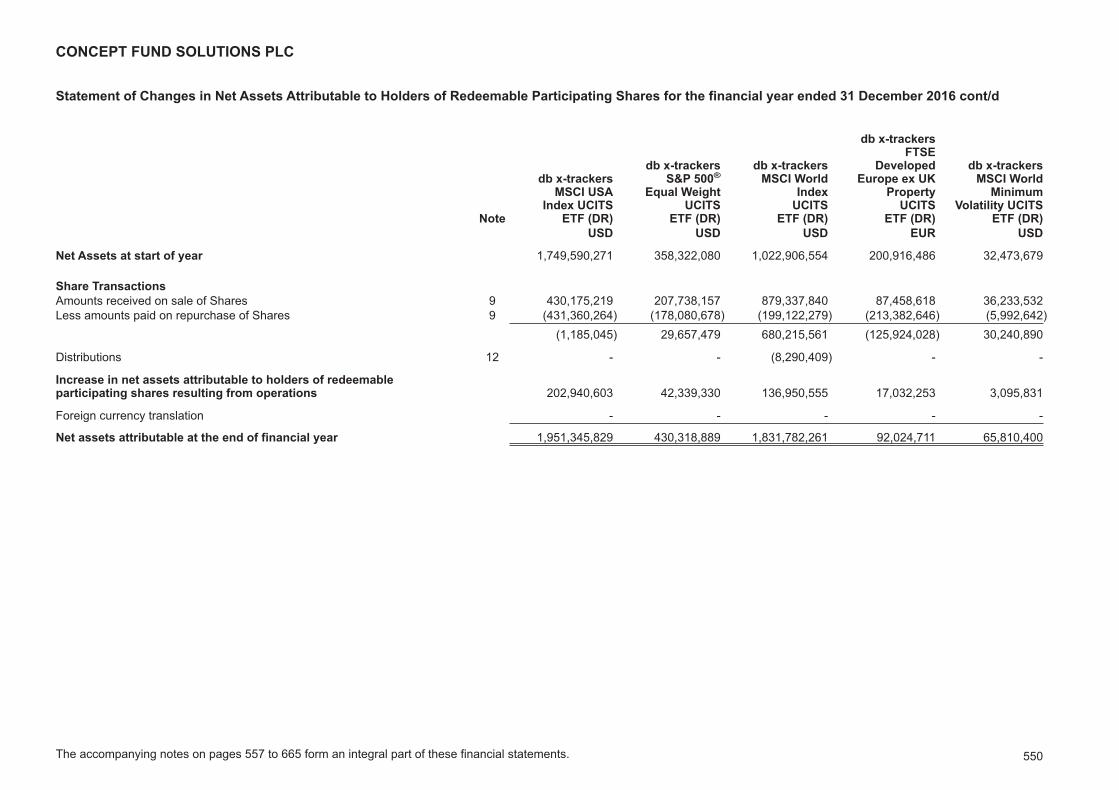
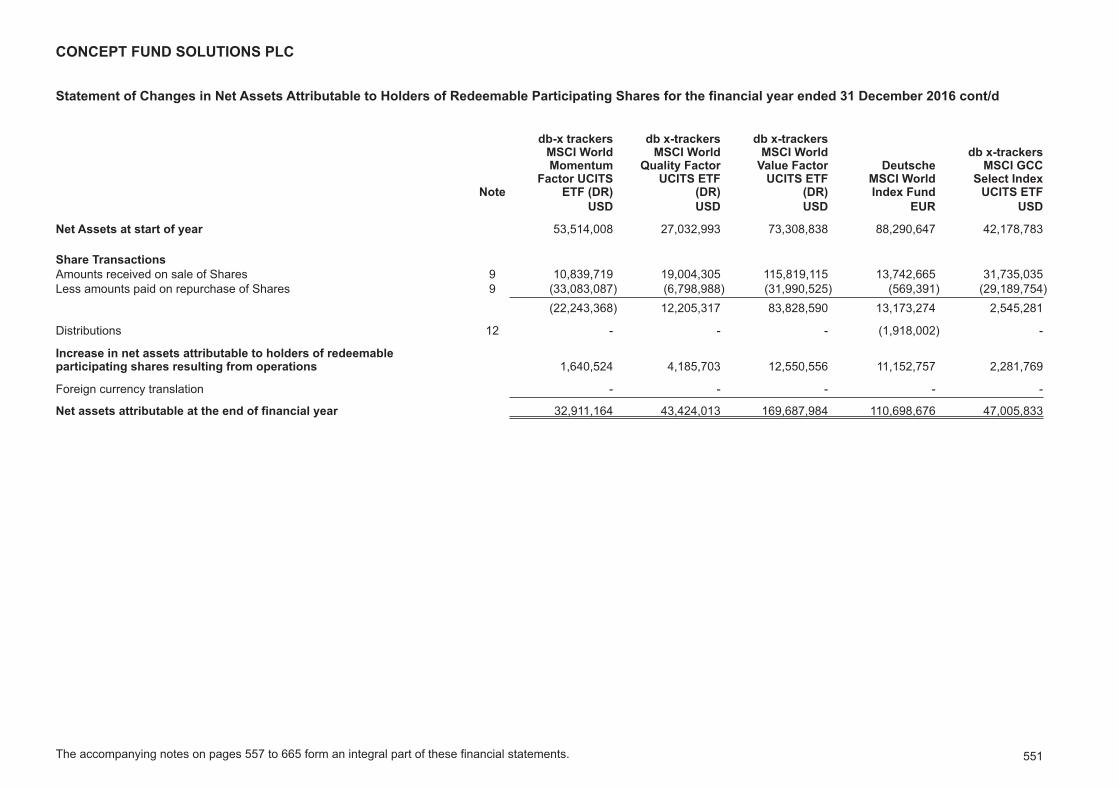
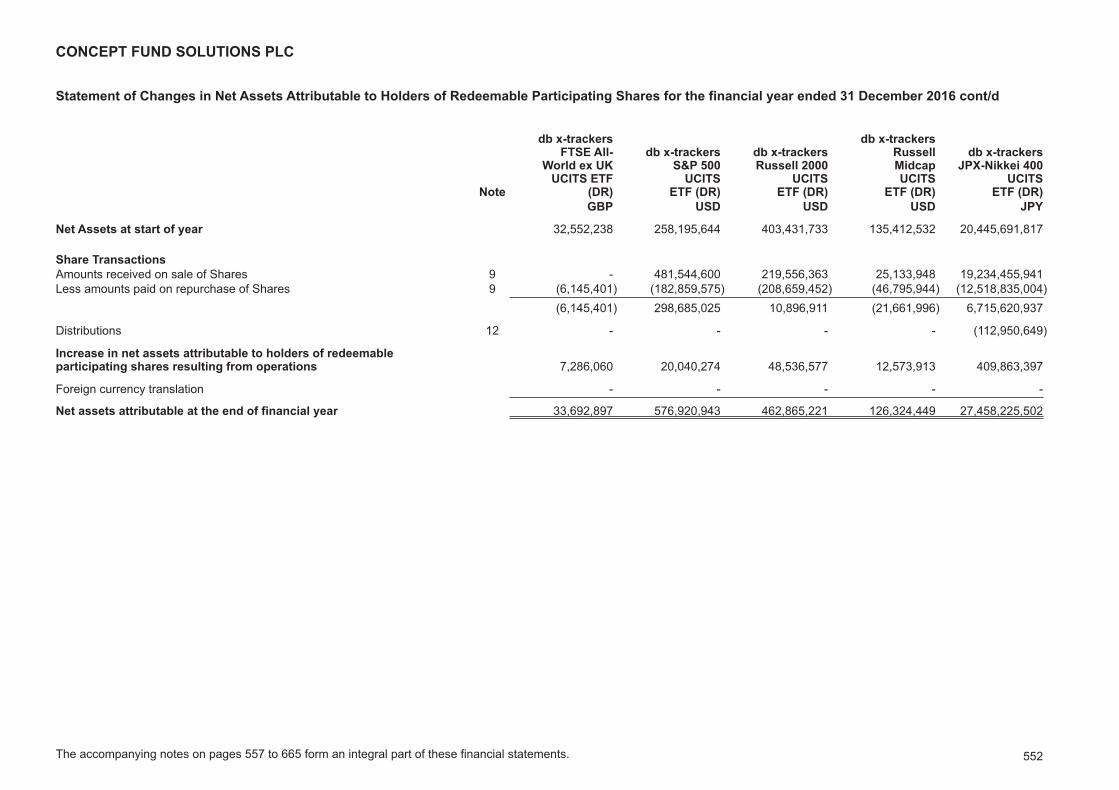
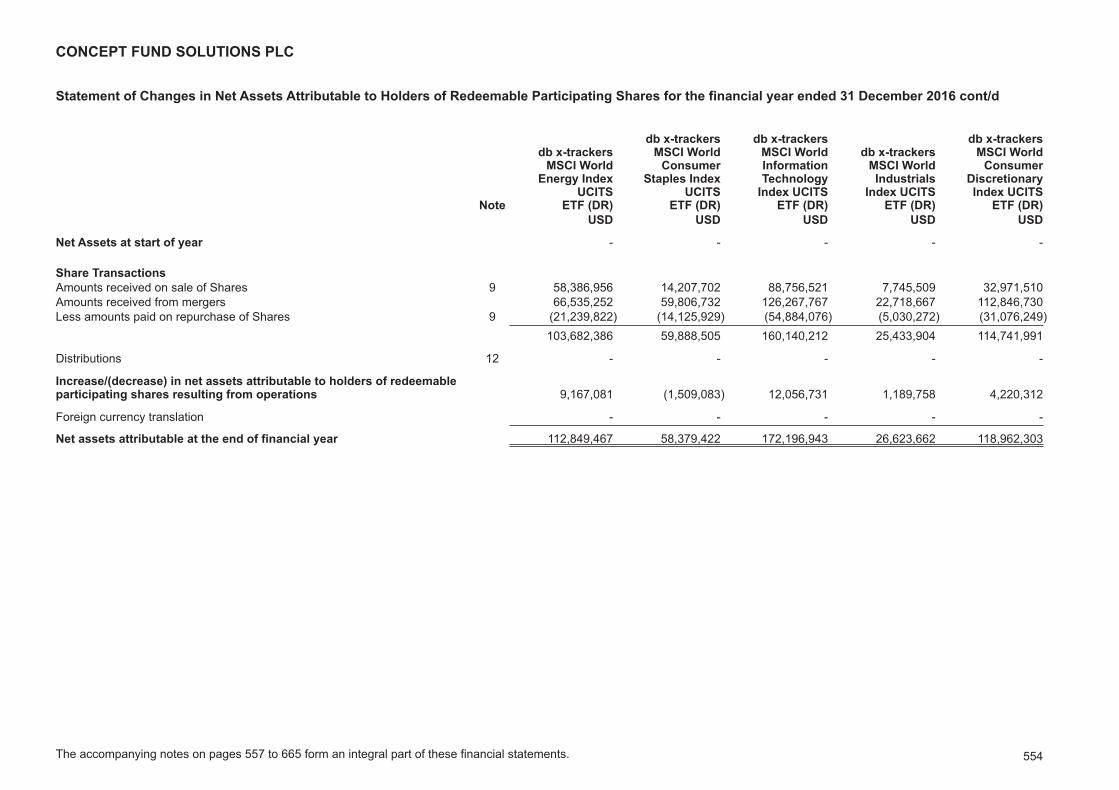
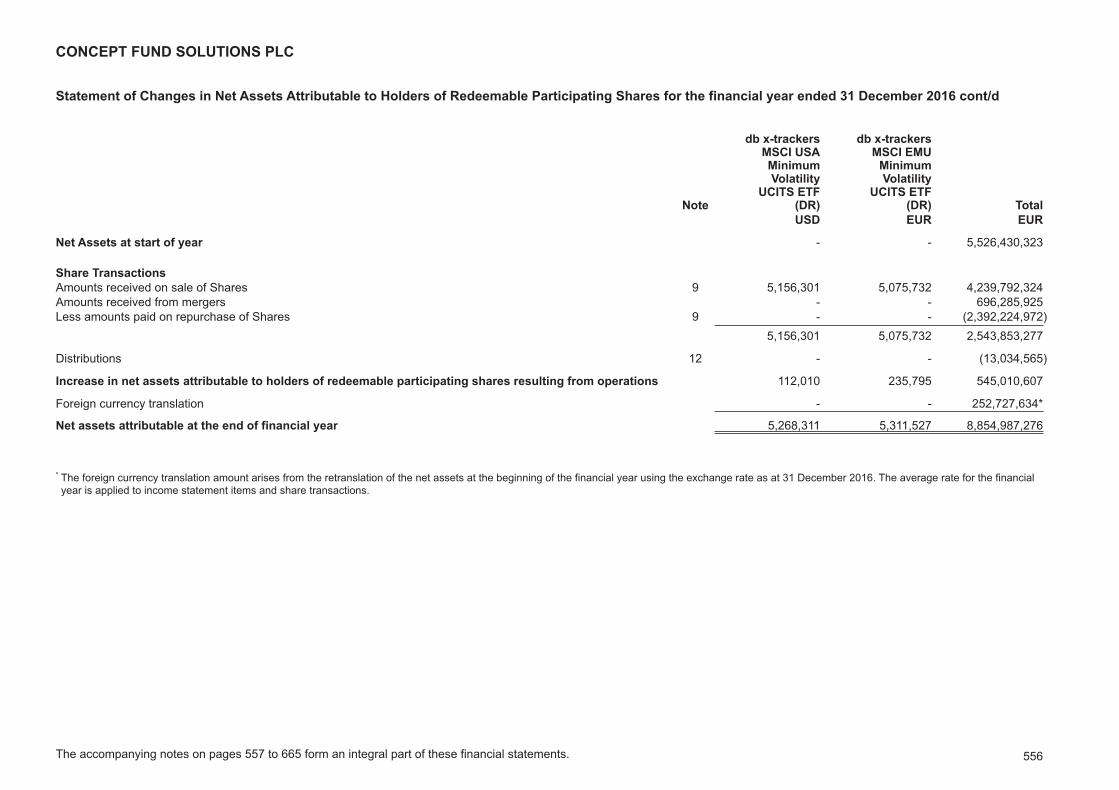
Statement of Changes in Net Assets Attributable to Holders of Redeemable Participating Shares 538
Deutsche International Corporate Services (Ireland) Limited (until 15 December 2017)Institutional Cash & Securities ServicesPinnacle 2Eastpoint Business ParkDublin 3Ireland
Deutsche Asset Management S.A. (from 15 December 2017)2, Konrad AdenauerL-115 LuxembourgGrand Duchy of Luxembourg
Distributor
Deutsche Asset Management (UK) LimitedWinchester House1 Great Winchester StreetLondon EC2N 2DBUnited Kingdom
Depositary
State Street Custodial Services (Ireland) Limited78 Sir John Rogerson’s QuayDublin 2Ireland
Administrator
State Street Fund Services (Ireland) Limited78 Sir John Rogerson’s QuayDublin 2Ireland
Deutsche Bank AG, London BranchWinchester House1 Great Winchester StreetLondon EC2N 2DBUnited Kingdom
CONCEPT FUND SOLUTIONS PLC
5
The following information is derived from and should be read in conjunction with the full text and definitionssection of the prospectus of Concept Fund Solutions plc (the “Prospectus”). Capitalised terms used hereinshall have the same meaning as capitalised terms used in the Prospectus of the Company unless otherwisedefined herein.
Concept Fund Solutions plc (the “Company”) is an investment company with variable capital incorporated on17 November 2004, authorised and regulated by the Central Bank of Ireland (the "Central Bank") under theEuropean Communities (Undertakings for Collective Investments in Transferable Securities) Regulations2011, as amended, and under the Central Bank (Supervision and Enforcement) Act 2013 (Section 48(1)(Undertakings for Collective Investments in Transferable Securities) Regulations 2015 (together the "UCITSRegulations").
The Company has listed the following funds on the Irish Stock Exchange: db x-trackers MSCI World IndexUCITS ETF (DR), db x-trackers JPX-Nikkei 400 UCITS ETF (DR), db x-trackers FTSE All-World ex UK UCITSETF (DR), db x-trackers S&P 500 UCITS ETF (DR), db x-trackers FTSE 100 Equal Weight UCITS ETF (DR),db x-trackers iBoxx USD Emerging Sovereigns Quality Weighted UCITS ETF (DR) and db x-trackers MSCIUSA Minimum Volatility UCITS ETF (DR).
The Company is structured as an open-ended umbrella fund with segregated liability between the Funds.Shares representing interests in different Funds may be issued from time to time by the Directors with priorconsent by the Central Bank. Shares of more than one class may be issued in relation to a Fund. All shares ofeach class will rank pari passu save as provided for in each relevant Supplement to the Prospectus.
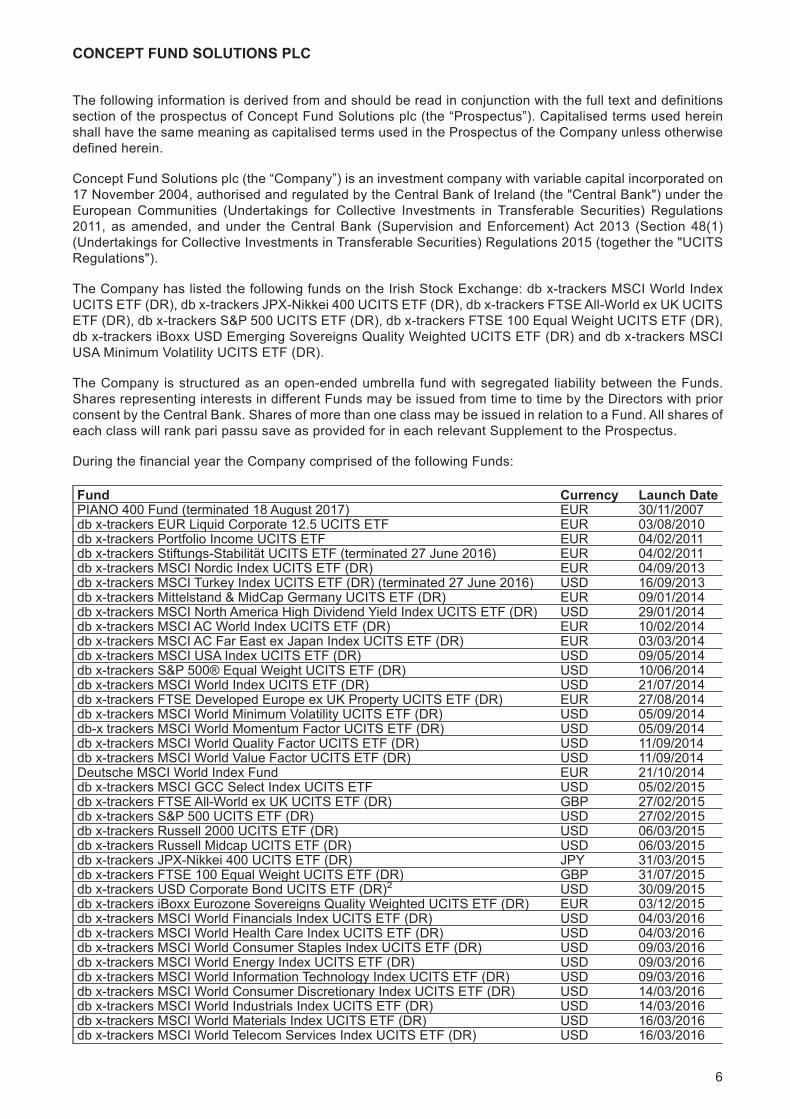
During the financial year the Company comprised of the following Funds:
Fund Currency Launch DatePIANO 400 Fund (terminated 18 August 2017) EUR 30/11/2007db x-trackers EUR Liquid Corporate 12.5 UCITS ETF EUR 03/08/2010db x-trackers Portfolio Income UCITS ETF EUR 04/02/2011db x-trackers Stiftungs-Stabilität UCITS ETF (terminated 27 June 2016) EUR 04/02/2011db x-trackers MSCI Nordic Index UCITS ETF (DR) EUR 04/09/2013db x-trackers MSCI Turkey Index UCITS ETF (DR) (terminated 27 June 2016) USD 16/09/2013db x-trackers Mittelstand & MidCap Germany UCITS ETF (DR) EUR 09/01/2014db x-trackers MSCI North America High Dividend Yield Index UCITS ETF (DR) USD 29/01/2014db x-trackers MSCI AC World Index UCITS ETF (DR) EUR 10/02/2014db x-trackers MSCI AC Far East ex Japan Index UCITS ETF (DR) EUR 03/03/2014db x-trackers MSCI USA Index UCITS ETF (DR) USD 09/05/2014db x-trackers S&P 500® Equal Weight UCITS ETF (DR) USD 10/06/2014db x-trackers MSCI World Index UCITS ETF (DR) USD 21/07/2014db x-trackers FTSE Developed Europe ex UK Property UCITS ETF (DR) EUR 27/08/2014db x-trackers MSCI World Minimum Volatility UCITS ETF (DR) USD 05/09/2014db-x trackers MSCI World Momentum Factor UCITS ETF (DR) USD 05/09/2014db x-trackers MSCI World Quality Factor UCITS ETF (DR) USD 11/09/2014db x-trackers MSCI World Value Factor UCITS ETF (DR) USD 11/09/2014Deutsche MSCI World Index Fund EUR 21/10/2014db x-trackers MSCI GCC Select Index UCITS ETF USD 05/02/2015db x-trackers FTSE All-World ex UK UCITS ETF (DR) GBP 27/02/2015db x-trackers S&P 500 UCITS ETF (DR) USD 27/02/2015db x-trackers Russell 2000 UCITS ETF (DR) USD 06/03/2015db x-trackers Russell Midcap UCITS ETF (DR) USD 06/03/2015db x-trackers JPX-Nikkei 400 UCITS ETF (DR) JPY 31/03/2015db x-trackers FTSE 100 Equal Weight UCITS ETF (DR) GBP 31/07/2015db x-trackers USD Corporate Bond UCITS ETF (DR)2 USD 30/09/2015db x-trackers iBoxx Eurozone Sovereigns Quality Weighted UCITS ETF (DR) EUR 03/12/2015db x-trackers MSCI World Financials Index UCITS ETF (DR) USD 04/03/2016db x-trackers MSCI World Health Care Index UCITS ETF (DR) USD 04/03/2016db x-trackers MSCI World Consumer Staples Index UCITS ETF (DR) USD 09/03/2016db x-trackers MSCI World Energy Index UCITS ETF (DR) USD 09/03/2016db x-trackers MSCI World Information Technology Index UCITS ETF (DR) USD 09/03/2016db x-trackers MSCI World Consumer Discretionary Index UCITS ETF (DR) USD 14/03/2016db x-trackers MSCI World Industrials Index UCITS ETF (DR) USD 14/03/2016db x-trackers MSCI World Materials Index UCITS ETF (DR) USD 16/03/2016db x-trackers MSCI World Telecom Services Index UCITS ETF (DR) USD 16/03/2016
CONCEPT FUND SOLUTIONS PLC
6
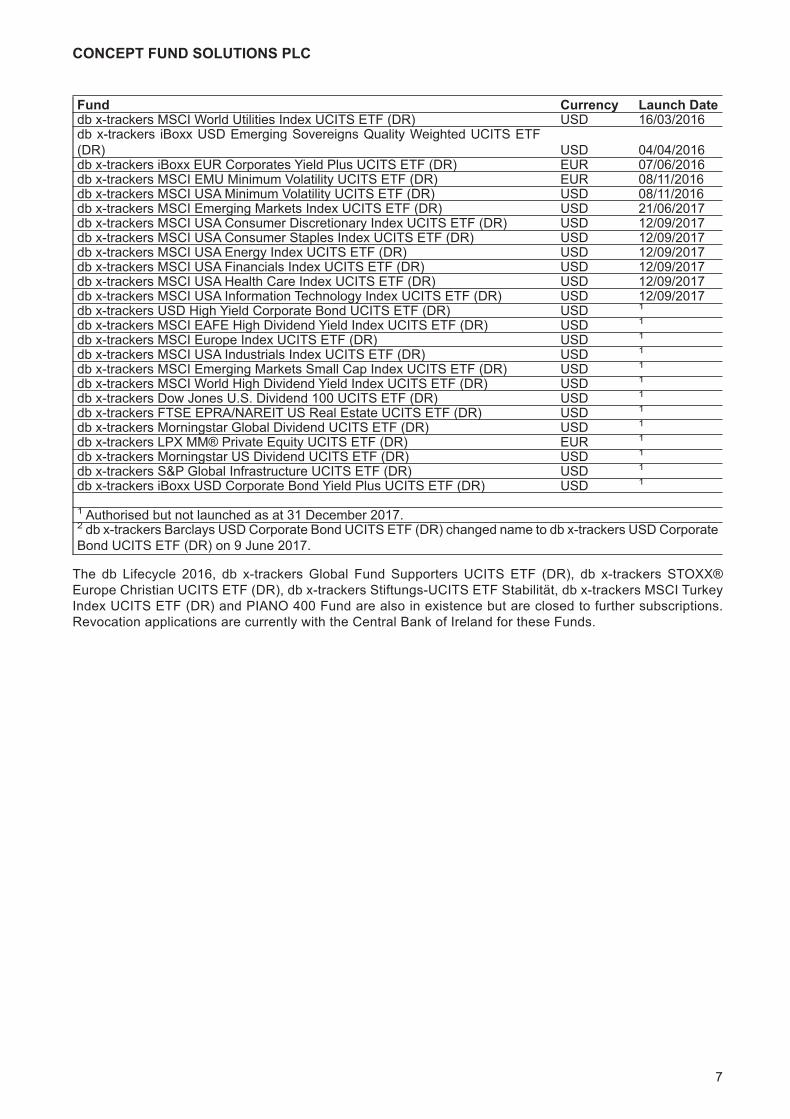
Fund Currency Launch Datedb x-trackers MSCI World Utilities Index UCITS ETF (DR) USD 16/03/2016db x-trackers iBoxx USD Emerging Sovereigns Quality Weighted UCITS ETF(DR) USD 04/04/2016db x-trackers iBoxx EUR Corporates Yield Plus UCITS ETF (DR) EUR 07/06/2016db x-trackers MSCI EMU Minimum Volatility UCITS ETF (DR) EUR 08/11/2016db x-trackers MSCI USA Minimum Volatility UCITS ETF (DR) USD 08/11/2016db x-trackers MSCI Emerging Markets Index UCITS ETF (DR) USD 21/06/2017db x-trackers MSCI USA Consumer Discretionary Index UCITS ETF (DR) USD 12/09/2017db x-trackers MSCI USA Consumer Staples Index UCITS ETF (DR) USD 12/09/2017db x-trackers MSCI USA Energy Index UCITS ETF (DR) USD 12/09/2017db x-trackers MSCI USA Financials Index UCITS ETF (DR) USD 12/09/2017db x-trackers MSCI USA Health Care Index UCITS ETF (DR) USD 12/09/2017db x-trackers MSCI USA Information Technology Index UCITS ETF (DR) USD 12/09/2017db x-trackers USD High Yield Corporate Bond UCITS ETF (DR) USD 1
db x-trackers MSCI EAFE High Dividend Yield Index UCITS ETF (DR) USD 1
db x-trackers MSCI Europe Index UCITS ETF (DR) USD 1
db x-trackers MSCI USA Industrials Index UCITS ETF (DR) USD 1
db x-trackers MSCI Emerging Markets Small Cap Index UCITS ETF (DR) USD 1
db x-trackers MSCI World High Dividend Yield Index UCITS ETF (DR) USD 1
db x-trackers Dow Jones U.S. Dividend 100 UCITS ETF (DR) USD 1
db x-trackers FTSE EPRA/NAREIT US Real Estate UCITS ETF (DR) USD 1
db x-trackers Morningstar Global Dividend UCITS ETF (DR) USD 1
db x-trackers Morningstar US Dividend UCITS ETF (DR) USD 1
db x-trackers S&P Global Infrastructure UCITS ETF (DR) USD 1
db x-trackers iBoxx USD Corporate Bond Yield Plus UCITS ETF (DR) USD 1
1 Authorised but not launched as at 31 December 2017.2 db x-trackers Barclays USD Corporate Bond UCITS ETF (DR) changed name to db x-trackers USD CorporateBond UCITS ETF (DR) on 9 June 2017.
The db Lifecycle 2016, db x-trackers Global Fund Supporters UCITS ETF (DR), db x-trackers STOXX®Europe Christian UCITS ETF (DR), db x-trackers Stiftungs-UCITS ETF Stabilität, db x-trackers MSCI TurkeyIndex UCITS ETF (DR) and PIANO 400 Fund are also in existence but are closed to further subscriptions.Revocation applications are currently with the Central Bank of Ireland for these Funds.
CONCEPT FUND SOLUTIONS PLC
7
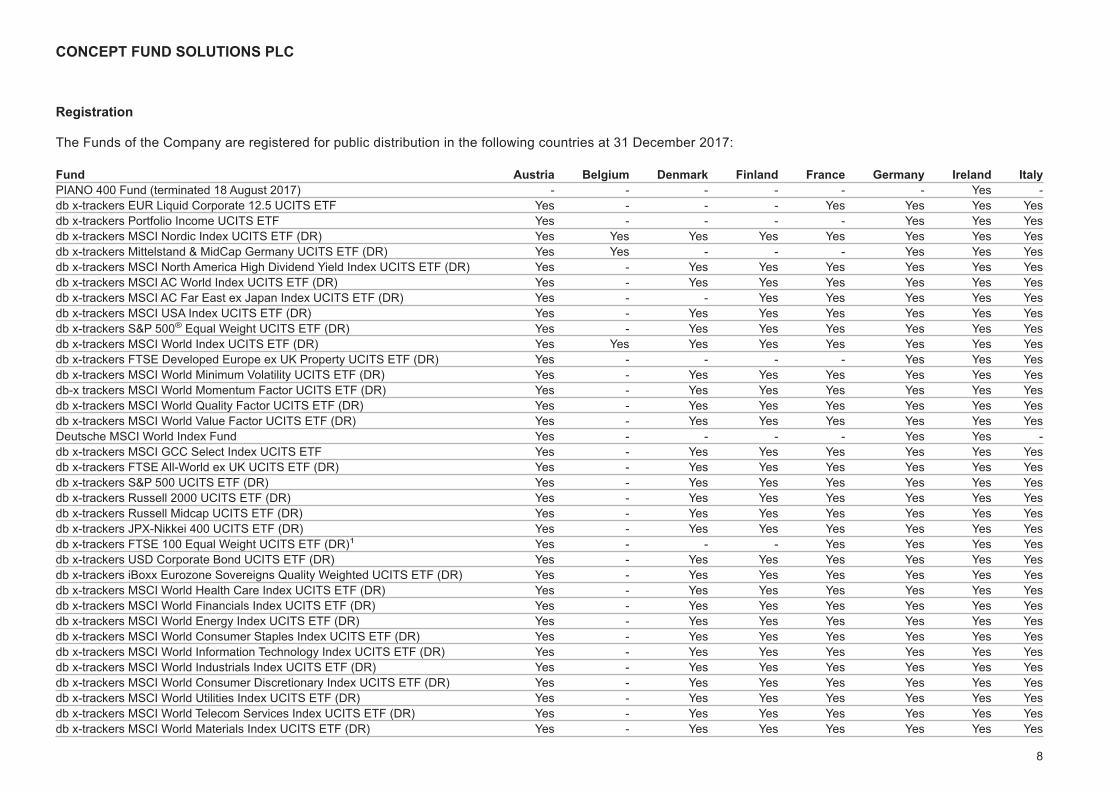
Registration
The Funds of the Company are registered for public distribution in the following countries at 31 December 2017:
Fund Austria Belgium Denmark Finland France Germany Ireland ItalyPIANO 400 Fund (terminated 18 August 2017) - - - - - - Yes -db x-trackers EUR Liquid Corporate 12.5 UCITS ETF Yes - - - Yes Yes Yes Yesdb x-trackers Portfolio Income UCITS ETF Yes - - - - Yes Yes Yesdb x-trackers MSCI Nordic Index UCITS ETF (DR) Yes Yes Yes Yes Yes Yes Yes Yesdb x-trackers Mittelstand & MidCap Germany UCITS ETF (DR) Yes Yes - - - Yes Yes Yesdb x-trackers MSCI North America High Dividend Yield Index UCITS ETF (DR) Yes - Yes Yes Yes Yes Yes Yesdb x-trackers MSCI AC World Index UCITS ETF (DR) Yes - Yes Yes Yes Yes Yes Yesdb x-trackers MSCI AC Far East ex Japan Index UCITS ETF (DR) Yes - - Yes Yes Yes Yes Yesdb x-trackers MSCI USA Index UCITS ETF (DR) Yes - Yes Yes Yes Yes Yes Yesdb x-trackers S&P 500® Equal Weight UCITS ETF (DR) Yes - Yes Yes Yes Yes Yes Yesdb x-trackers MSCI World Index UCITS ETF (DR) Yes Yes Yes Yes Yes Yes Yes Yesdb x-trackers FTSE Developed Europe ex UK Property UCITS ETF (DR) Yes - - - - Yes Yes Yesdb x-trackers MSCI World Minimum Volatility UCITS ETF (DR) Yes - Yes Yes Yes Yes Yes Yesdb-x trackers MSCI World Momentum Factor UCITS ETF (DR) Yes - Yes Yes Yes Yes Yes Yesdb x-trackers MSCI World Quality Factor UCITS ETF (DR) Yes - Yes Yes Yes Yes Yes Yesdb x-trackers MSCI World Value Factor UCITS ETF (DR) Yes - Yes Yes Yes Yes Yes YesDeutsche MSCI World Index Fund Yes - - - - Yes Yes -db x-trackers MSCI GCC Select Index UCITS ETF Yes - Yes Yes Yes Yes Yes Yesdb x-trackers FTSE All-World ex UK UCITS ETF (DR) Yes - Yes Yes Yes Yes Yes Yesdb x-trackers S&P 500 UCITS ETF (DR) Yes - Yes Yes Yes Yes Yes Yesdb x-trackers Russell 2000 UCITS ETF (DR) Yes - Yes Yes Yes Yes Yes Yesdb x-trackers Russell Midcap UCITS ETF (DR) Yes - Yes Yes Yes Yes Yes Yesdb x-trackers JPX-Nikkei 400 UCITS ETF (DR) Yes - Yes Yes Yes Yes Yes Yesdb x-trackers FTSE 100 Equal Weight UCITS ETF (DR)1 Yes - - - Yes Yes Yes Yesdb x-trackers USD Corporate Bond UCITS ETF (DR) Yes - Yes Yes Yes Yes Yes Yesdb x-trackers iBoxx Eurozone Sovereigns Quality Weighted UCITS ETF (DR) Yes - Yes Yes Yes Yes Yes Yesdb x-trackers MSCI World Health Care Index UCITS ETF (DR) Yes - Yes Yes Yes Yes Yes Yesdb x-trackers MSCI World Financials Index UCITS ETF (DR) Yes - Yes Yes Yes Yes Yes Yesdb x-trackers MSCI World Energy Index UCITS ETF (DR) Yes - Yes Yes Yes Yes Yes Yesdb x-trackers MSCI World Consumer Staples Index UCITS ETF (DR) Yes - Yes Yes Yes Yes Yes Yesdb x-trackers MSCI World Information Technology Index UCITS ETF (DR) Yes - Yes Yes Yes Yes Yes Yesdb x-trackers MSCI World Industrials Index UCITS ETF (DR) Yes - Yes Yes Yes Yes Yes Yesdb x-trackers MSCI World Consumer Discretionary Index UCITS ETF (DR) Yes - Yes Yes Yes Yes Yes Yesdb x-trackers MSCI World Utilities Index UCITS ETF (DR) Yes - Yes Yes Yes Yes Yes Yesdb x-trackers MSCI World Telecom Services Index UCITS ETF (DR) Yes - Yes Yes Yes Yes Yes Yesdb x-trackers MSCI World Materials Index UCITS ETF (DR) Yes - Yes Yes Yes Yes Yes Yes
CONCEPT FUND SOLUTIONS PLC
8
GENERAL INFORMATION CONT/D
Registration cont/d
Fund Austria Belgium Denmark Finland France Germany Ireland Italydb x-trackers iBoxx USD Emerging Sovereigns Quality Weighted UCITS ETF (DR) Yes - Yes Yes Yes Yes Yes Yesdb x-trackers iBoxx EUR Corporates Yield Plus UCITS ETF (DR) Yes Yes Yes Yes Yes Yes Yes Yesdb x-trackers MSCI USA Minimum Volatility UCITS ETF (DR) Yes - Yes Yes Yes Yes Yes Yesdb x-trackers MSCI EMU Minimum Volatility UCITS ETF (DR) Yes - Yes Yes Yes Yes Yes Yesdb x-trackers MSCI Emerging Markets Index UCITS ETF (DR) Yes - Yes Yes Yes Yes Yes Yesdb x-trackers MSCI USA Consumer Discretionary Index UCITS ETF (DR) Yes - Yes Yes Yes Yes Yes Yesdb x-trackers MSCI USA Consumer Staples Index UCITS ETF (DR) Yes - Yes Yes Yes Yes Yes Yesdb x-trackers MSCI USA Energy Index UCITS ETF (DR) Yes - Yes Yes Yes Yes Yes Yesdb x-trackers MSCI USA Financials Index UCITS ETF (DR) Yes - Yes Yes Yes Yes Yes Yesdb x-trackers MSCI USA Health Care Index UCITS ETF (DR) Yes - Yes Yes Yes Yes Yes Yesdb x-trackers MSCI USA Information Technology Index UCITS ETF (DR) Yes - Yes Yes Yes Yes Yes Yes
1 The following Sub-Fund is eligible for investment in a “plan d'épargne en actions” (“PEA”): db x-trackers FTSE 100 Equal Weight UCITS ETF (DR). As from 20 April 2016, the Sub-Fund db x-trackers FTSE 100 EqualWeight UCITS ETF (DR) complied with the PEA eligibility criteria as set out in the French Monetary and Financial Code (“Code monétaire et financier”).”
Fund Luxembourg Netherlands Norway Singapore Spain Sweden SwitzerlandUnited
KingdomPIANO 400 Fund (terminated 18 August 2017) - - - - - - - -db x-trackers EUR Liquid Corporate 12.5 UCITS ETF Yes Yes - - Yes Yes - Yesdb x-trackers Portfolio Income UCITS ETF - - - - - - Yes Yesdb x-trackers MSCI Nordic Index UCITS ETF (DR) Yes Yes Yes - Yes Yes - Yesdb x-trackers Mittelstand & MidCap Germany UCITS ETF (DR) - Yes - - Yes - - Yesdb x-trackers MSCI North America High Dividend Yield Index UCITS ETF (DR) Yes Yes Yes - Yes Yes Yes Yesdb x-trackers MSCI AC World Index UCITS ETF (DR) Yes Yes Yes - Yes Yes Yes Yesdb x-trackers MSCI AC Far East ex Japan Index UCITS ETF (DR) Yes Yes - - Yes Yes - Yesdb x-trackers MSCI USA Index UCITS ETF (DR) Yes Yes Yes - Yes Yes Yes Yesdb x-trackers S&P 500® Equal Weight UCITS ETF (DR) Yes Yes Yes - Yes Yes Yes Yesdb x-trackers MSCI World Index UCITS ETF (DR) Yes Yes Yes - Yes Yes Yes Yesdb x-trackers FTSE Developed Europe ex UK Property UCITS ETF (DR) - Yes - - - - - Yesdb x-trackers MSCI World Minimum Volatility UCITS ETF (DR) Yes Yes Yes - Yes Yes - Yesdb-x trackers MSCI World Momentum Factor UCITS ETF (DR) Yes Yes Yes - Yes Yes - Yesdb x-trackers MSCI World Quality Factor UCITS ETF (DR) Yes Yes Yes - Yes Yes - Yesdb x-trackers MSCI World Value Factor UCITS ETF (DR) Yes Yes Yes - Yes Yes - YesDeutsche MSCI World Index Fund Yes Yes - - - Yes - Yesdb x-trackers MSCI GCC Select Index UCITS ETF Yes Yes Yes - Yes Yes Yes Yesdb x-trackers FTSE All-World ex UK UCITS ETF (DR) Yes Yes Yes - Yes Yes - Yesdb x-trackers S&P 500 UCITS ETF (DR) Yes Yes Yes - Yes Yes Yes Yes
CONCEPT FUND SOLUTIONS PLC
9
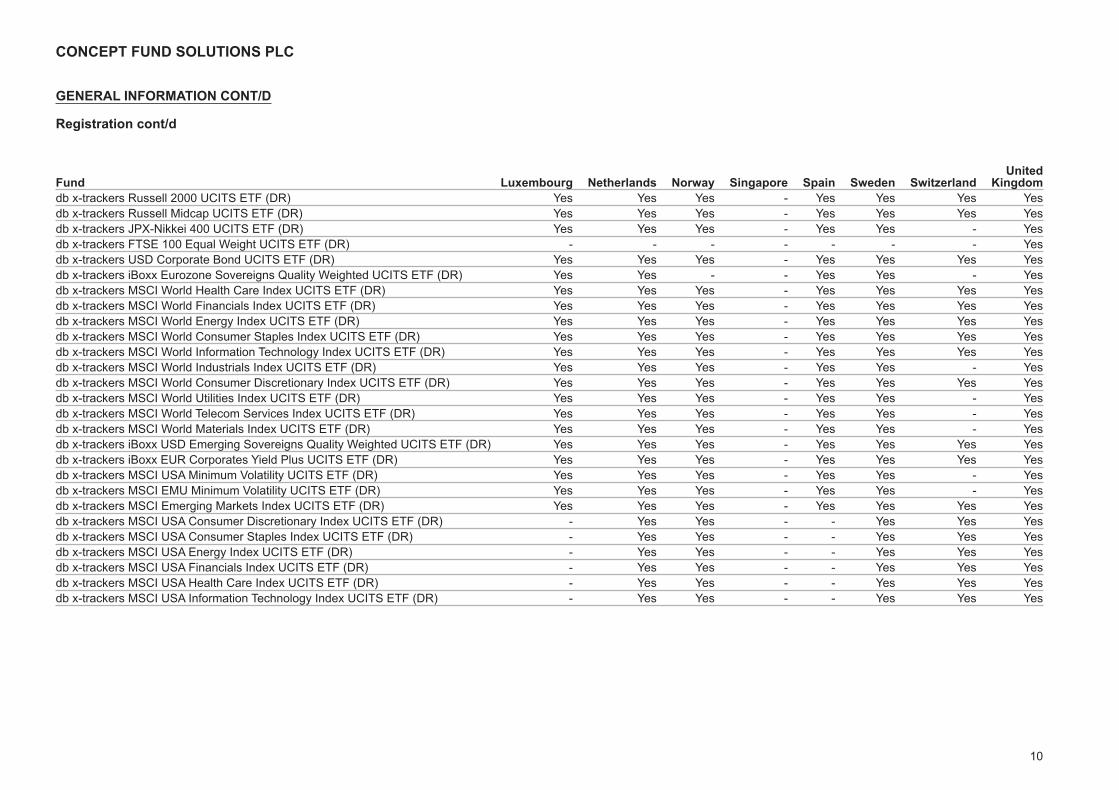
GENERAL INFORMATION CONT/D
Registration cont/d
Fund Luxembourg Netherlands Norway Singapore Spain Sweden SwitzerlandUnited
Kingdomdb x-trackers Russell 2000 UCITS ETF (DR) Yes Yes Yes - Yes Yes Yes Yesdb x-trackers Russell Midcap UCITS ETF (DR) Yes Yes Yes - Yes Yes Yes Yesdb x-trackers JPX-Nikkei 400 UCITS ETF (DR) Yes Yes Yes - Yes Yes - Yesdb x-trackers FTSE 100 Equal Weight UCITS ETF (DR) - - - - - - - Yesdb x-trackers USD Corporate Bond UCITS ETF (DR) Yes Yes Yes - Yes Yes Yes Yesdb x-trackers iBoxx Eurozone Sovereigns Quality Weighted UCITS ETF (DR) Yes Yes - - Yes Yes - Yesdb x-trackers MSCI World Health Care Index UCITS ETF (DR) Yes Yes Yes - Yes Yes Yes Yesdb x-trackers MSCI World Financials Index UCITS ETF (DR) Yes Yes Yes - Yes Yes Yes Yesdb x-trackers MSCI World Energy Index UCITS ETF (DR) Yes Yes Yes - Yes Yes Yes Yesdb x-trackers MSCI World Consumer Staples Index UCITS ETF (DR) Yes Yes Yes - Yes Yes Yes Yesdb x-trackers MSCI World Information Technology Index UCITS ETF (DR) Yes Yes Yes - Yes Yes Yes Yesdb x-trackers MSCI World Industrials Index UCITS ETF (DR) Yes Yes Yes - Yes Yes - Yesdb x-trackers MSCI World Consumer Discretionary Index UCITS ETF (DR) Yes Yes Yes - Yes Yes Yes Yesdb x-trackers MSCI World Utilities Index UCITS ETF (DR) Yes Yes Yes - Yes Yes - Yesdb x-trackers MSCI World Telecom Services Index UCITS ETF (DR) Yes Yes Yes - Yes Yes - Yesdb x-trackers MSCI World Materials Index UCITS ETF (DR) Yes Yes Yes - Yes Yes - Yesdb x-trackers iBoxx USD Emerging Sovereigns Quality Weighted UCITS ETF (DR) Yes Yes Yes - Yes Yes Yes Yesdb x-trackers iBoxx EUR Corporates Yield Plus UCITS ETF (DR) Yes Yes Yes - Yes Yes Yes Yesdb x-trackers MSCI USA Minimum Volatility UCITS ETF (DR) Yes Yes Yes - Yes Yes - Yesdb x-trackers MSCI EMU Minimum Volatility UCITS ETF (DR) Yes Yes Yes - Yes Yes - Yesdb x-trackers MSCI Emerging Markets Index UCITS ETF (DR) Yes Yes Yes - Yes Yes Yes Yesdb x-trackers MSCI USA Consumer Discretionary Index UCITS ETF (DR) - Yes Yes - - Yes Yes Yesdb x-trackers MSCI USA Consumer Staples Index UCITS ETF (DR) - Yes Yes - - Yes Yes Yesdb x-trackers MSCI USA Energy Index UCITS ETF (DR) - Yes Yes - - Yes Yes Yesdb x-trackers MSCI USA Financials Index UCITS ETF (DR) - Yes Yes - - Yes Yes Yesdb x-trackers MSCI USA Health Care Index UCITS ETF (DR) - Yes Yes - - Yes Yes Yesdb x-trackers MSCI USA Information Technology Index UCITS ETF (DR) - Yes Yes - - Yes Yes Yes
CONCEPT FUND SOLUTIONS PLC
10
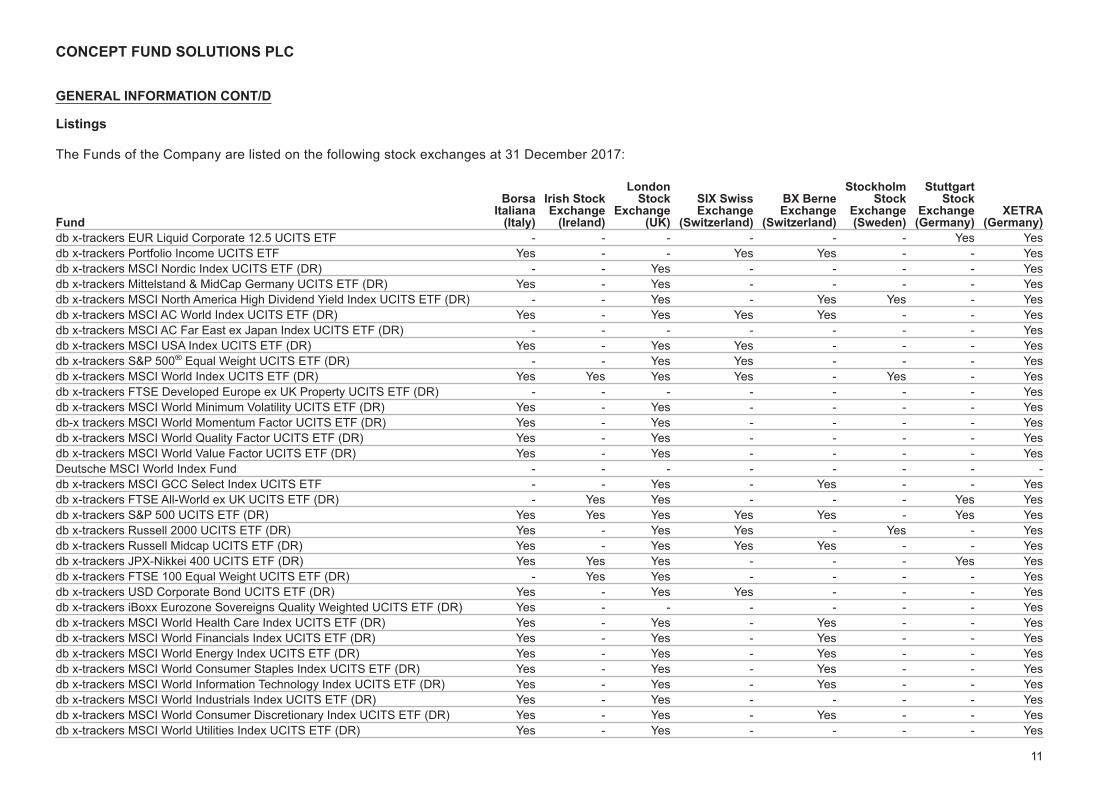
GENERAL INFORMATION CONT/D
Listings
The Funds of the Company are listed on the following stock exchanges at 31 December 2017:
Fund
BorsaItaliana
(Italy)
Irish StockExchange
(Ireland)
LondonStock
Exchange(UK)
SIX SwissExchange
(Switzerland)
BX BerneExchange
(Switzerland)
StockholmStock
Exchange(Sweden)
StuttgartStock
Exchange(Germany)
XETRA(Germany)
db x-trackers EUR Liquid Corporate 12.5 UCITS ETF - - - - - - Yes Yesdb x-trackers Portfolio Income UCITS ETF Yes - - Yes Yes - - Yesdb x-trackers MSCI Nordic Index UCITS ETF (DR) - - Yes - - - - Yesdb x-trackers Mittelstand & MidCap Germany UCITS ETF (DR) Yes - Yes - - - - Yesdb x-trackers MSCI North America High Dividend Yield Index UCITS ETF (DR) - - Yes - Yes Yes - Yesdb x-trackers MSCI AC World Index UCITS ETF (DR) Yes - Yes Yes Yes - - Yesdb x-trackers MSCI AC Far East ex Japan Index UCITS ETF (DR) - - - - - - - Yesdb x-trackers MSCI USA Index UCITS ETF (DR) Yes - Yes Yes - - - Yesdb x-trackers S&P 500® Equal Weight UCITS ETF (DR) - - Yes Yes - - - Yesdb x-trackers MSCI World Index UCITS ETF (DR) Yes Yes Yes Yes - Yes - Yesdb x-trackers FTSE Developed Europe ex UK Property UCITS ETF (DR) - - - - - - - Yesdb x-trackers MSCI World Minimum Volatility UCITS ETF (DR) Yes - Yes - - - - Yesdb-x trackers MSCI World Momentum Factor UCITS ETF (DR) Yes - Yes - - - - Yesdb x-trackers MSCI World Quality Factor UCITS ETF (DR) Yes - Yes - - - - Yesdb x-trackers MSCI World Value Factor UCITS ETF (DR) Yes - Yes - - - - YesDeutsche MSCI World Index Fund - - - - - - - -db x-trackers MSCI GCC Select Index UCITS ETF - - Yes - Yes - - Yesdb x-trackers FTSE All-World ex UK UCITS ETF (DR) - Yes Yes - - - Yes Yesdb x-trackers S&P 500 UCITS ETF (DR) Yes Yes Yes Yes Yes - Yes Yesdb x-trackers Russell 2000 UCITS ETF (DR) Yes - Yes Yes - Yes - Yesdb x-trackers Russell Midcap UCITS ETF (DR) Yes - Yes Yes Yes - - Yesdb x-trackers JPX-Nikkei 400 UCITS ETF (DR) Yes Yes Yes - - - Yes Yesdb x-trackers FTSE 100 Equal Weight UCITS ETF (DR) - Yes Yes - - - - Yesdb x-trackers USD Corporate Bond UCITS ETF (DR) Yes - Yes Yes - - - Yesdb x-trackers iBoxx Eurozone Sovereigns Quality Weighted UCITS ETF (DR) Yes - - - - - - Yesdb x-trackers MSCI World Health Care Index UCITS ETF (DR) Yes - Yes - Yes - - Yesdb x-trackers MSCI World Financials Index UCITS ETF (DR) Yes - Yes - Yes - - Yesdb x-trackers MSCI World Energy Index UCITS ETF (DR) Yes - Yes - Yes - - Yesdb x-trackers MSCI World Consumer Staples Index UCITS ETF (DR) Yes - Yes - Yes - - Yesdb x-trackers MSCI World Information Technology Index UCITS ETF (DR) Yes - Yes - Yes - - Yesdb x-trackers MSCI World Industrials Index UCITS ETF (DR) Yes - Yes - - - - Yesdb x-trackers MSCI World Consumer Discretionary Index UCITS ETF (DR) Yes - Yes - Yes - - Yesdb x-trackers MSCI World Utilities Index UCITS ETF (DR) Yes - Yes - - - - Yes
CONCEPT FUND SOLUTIONS PLC
11
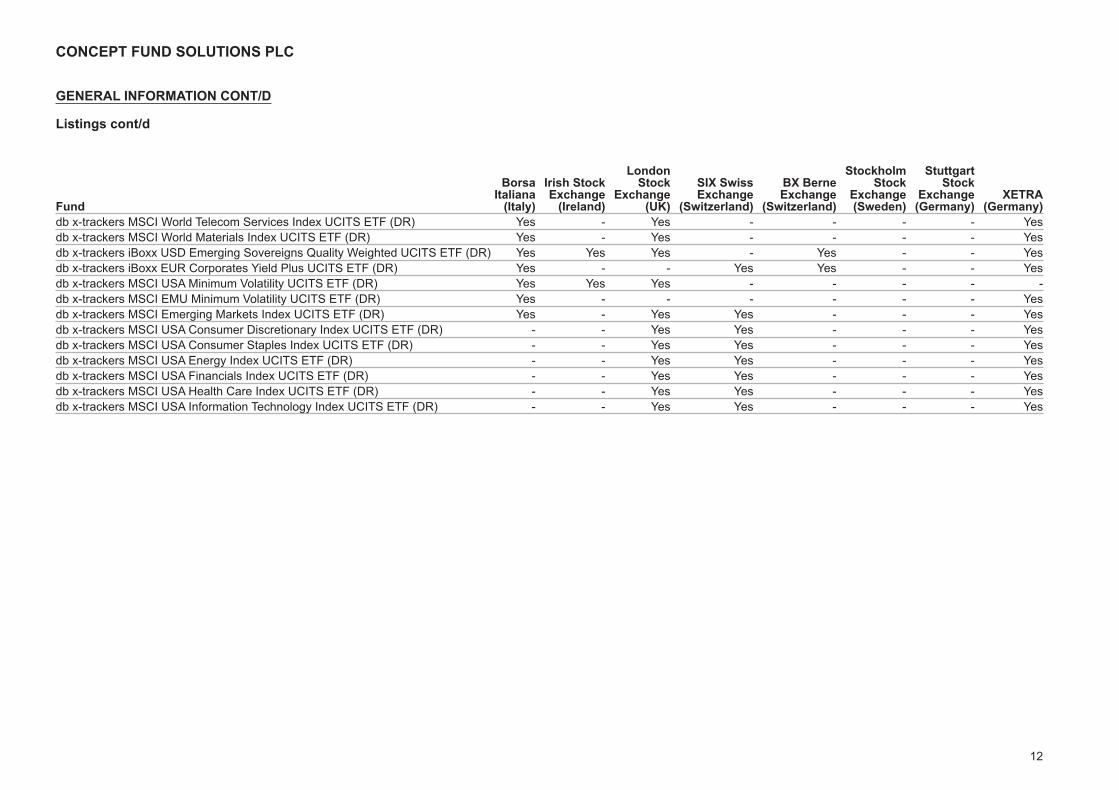
GENERAL INFORMATION CONT/D
Listings cont/d
Fund
BorsaItaliana
(Italy)
Irish StockExchange
(Ireland)
LondonStock
Exchange(UK)
SIX SwissExchange
(Switzerland)
BX BerneExchange
(Switzerland)
StockholmStock
Exchange(Sweden)
StuttgartStock
Exchange(Germany)
XETRA(Germany)
db x-trackers MSCI World Telecom Services Index UCITS ETF (DR) Yes - Yes - - - - Yesdb x-trackers MSCI World Materials Index UCITS ETF (DR) Yes - Yes - - - - Yesdb x-trackers iBoxx USD Emerging Sovereigns Quality Weighted UCITS ETF (DR) Yes Yes Yes - Yes - - Yesdb x-trackers iBoxx EUR Corporates Yield Plus UCITS ETF (DR) Yes - - Yes Yes - - Yesdb x-trackers MSCI USA Minimum Volatility UCITS ETF (DR) Yes Yes Yes - - - - -db x-trackers MSCI EMU Minimum Volatility UCITS ETF (DR) Yes - - - - - - Yesdb x-trackers MSCI Emerging Markets Index UCITS ETF (DR) Yes - Yes Yes - - - Yesdb x-trackers MSCI USA Consumer Discretionary Index UCITS ETF (DR) - - Yes Yes - - - Yesdb x-trackers MSCI USA Consumer Staples Index UCITS ETF (DR) - - Yes Yes - - - Yesdb x-trackers MSCI USA Energy Index UCITS ETF (DR) - - Yes Yes - - - Yesdb x-trackers MSCI USA Financials Index UCITS ETF (DR) - - Yes Yes - - - Yesdb x-trackers MSCI USA Health Care Index UCITS ETF (DR) - - Yes Yes - - - Yesdb x-trackers MSCI USA Information Technology Index UCITS ETF (DR) - - Yes Yes - - - Yes
CONCEPT FUND SOLUTIONS PLC
12
GENERAL INFORMATION CONT/D
Valuation of Assets
The Net Asset Value of a Fund shall be expressed in the currency in which the shares are designated or in suchother currency as the Directors may determine either generally or in relation to a particular class or in a specificcase, and shall be calculated by ascertaining the value of the assets of the Fund and deducting from suchvalue the liabilities of the Fund (excluding shareholders equity) as at the valuation point for such TransactionDay.
The Net Asset Value per share of a Fund will be calculated by dividing the Net Asset Value of the Fund by thenumber of shares in the Fund then in issue or deemed to be in issue as at the Valuation Day for suchTransaction Day and rounding the result mathematically to four decimal places or such other number ofdecimal places as may be determined by the Directors from time to time.
In the event the shares of any Fund are further divided into classes, the Net Asset Value per class shall bedetermined by notionally allocating the Net Asset Value of the Fund amongst the classes making suchadjustments for subscriptions, repurchases, fees, dividends accumulation or distribution of income and theexpenses, liabilities or assets attributable to each such class (including the gains/losses on and costs offinancial instruments employed for currency hedging between the currencies in which the assets of the Fundare designated and the designated currency of the class, which gains/losses and costs shall accrue solely tothat class) and any other factor differentiating the classes as appropriate. The Net Asset Value of the Fund, asallocated between each class, shall be divided by the number of shares of the relevant class which are in issueor deemed to be in issue and rounding the result mathematically to four decimal places as determined by theDirectors or such other number of decimal places as may be determined by the Directors from time to time.
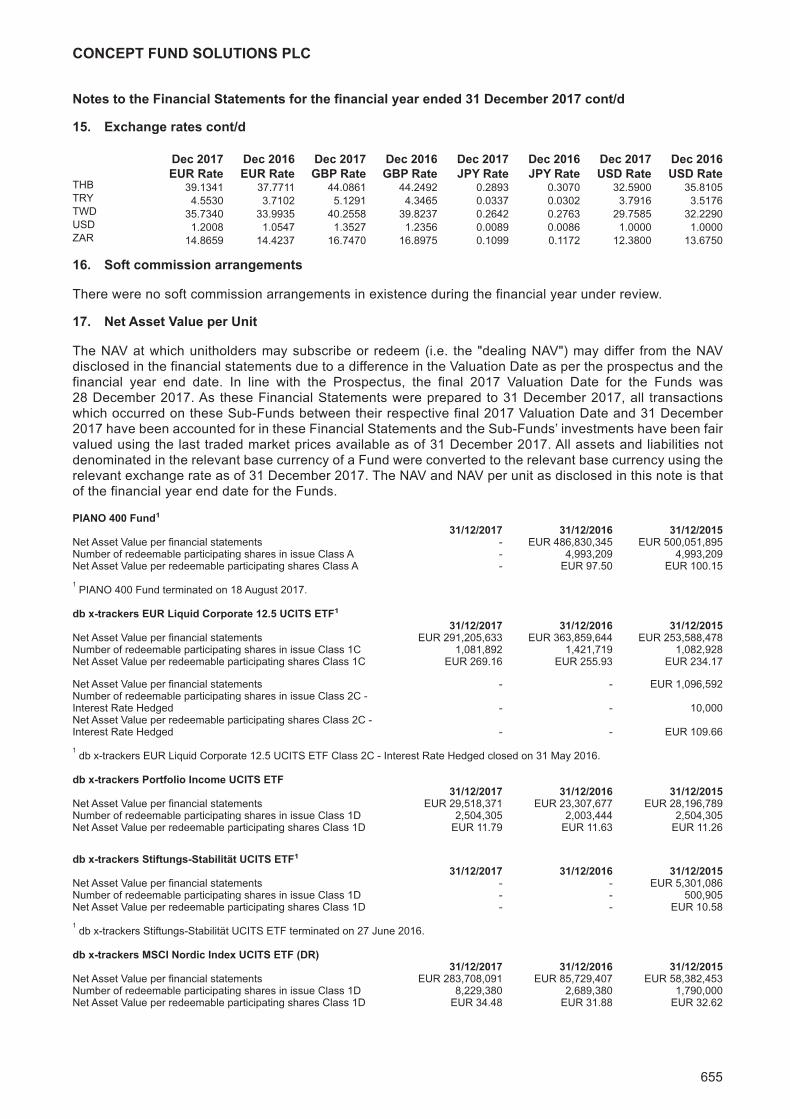
Please note, for the purposes of the financial statements the year-end NAVs per unit used to calculate theperformance of each sub-fund is the NAV per unit as at the 31st of December 2017. For the purposes of thecalculation of the performance data in the KIIDs the NAVs per unit as at the last business day of the year, asdefined in the Company’s prospectus, the 28th of December 2017, have been used. This means that therecould be a difference in the performance figures in the financial statements and the KIIDs.
Dealing
For the PIANO 400 Fund a Dealing Day was, in respect of subscriptions each Dividend Valuation Date inrespect of which a dividend has been declared and paid (as defined in the Supplement) and in respect ofredemptions is each Business Day. PIANO 400 Fund terminated on 18 August 2017.
All other Funds deal on every Business Day as set out in the relevant Supplements. The business daydefinition was updated to mean - '(unless otherwise defined in the Supplement for the relevant Fund) a daywhich is a London Banking Day' in the updated prospectus for the Company dated 15 December 2017.
Applications must be received by the Administrator before the Cut-off Time on the relevant Transaction Day asspecified in the relevant Supplement to the Prospectus.
Applications should be addressed to the Administrator:
State Street Fund Services (Ireland) Limited78 Sir John Rogerson's QuayDublin 2IrelandTel: 353-1-776 8000Fax: 353-1-523 3717
CONCEPT FUND SOLUTIONS PLC
13
GENERAL INFORMATION CONT/D
Tracking error and tracking difference
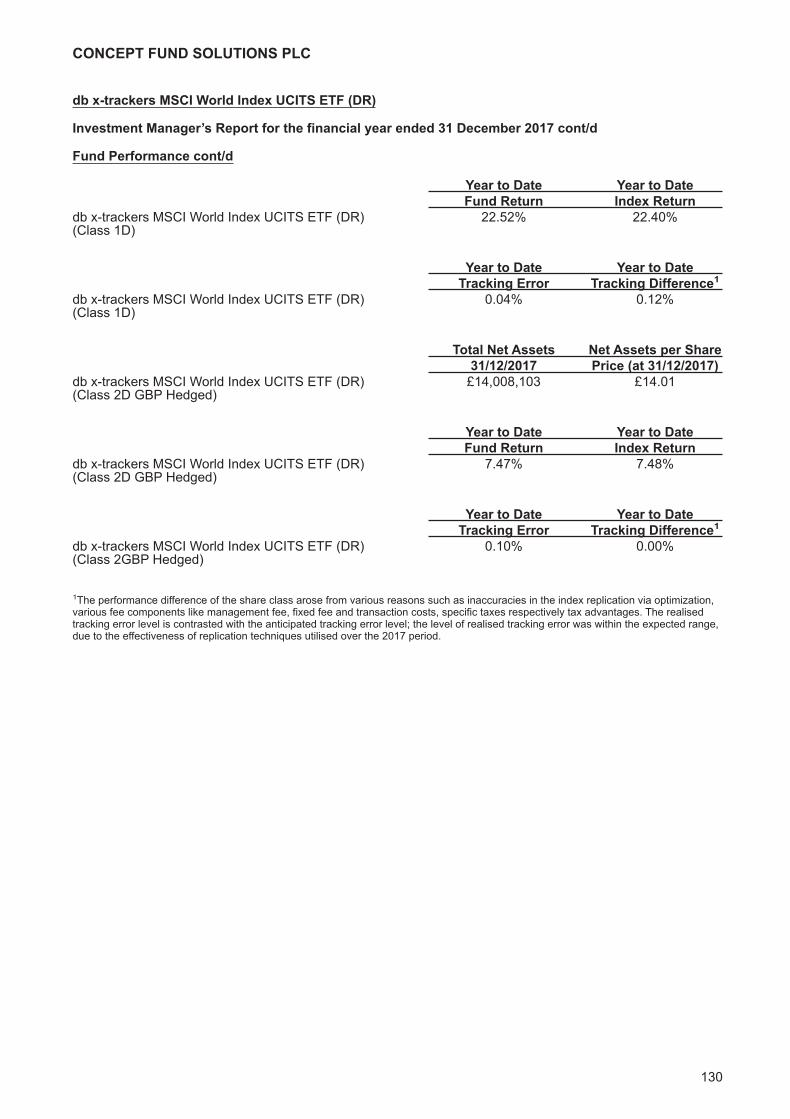
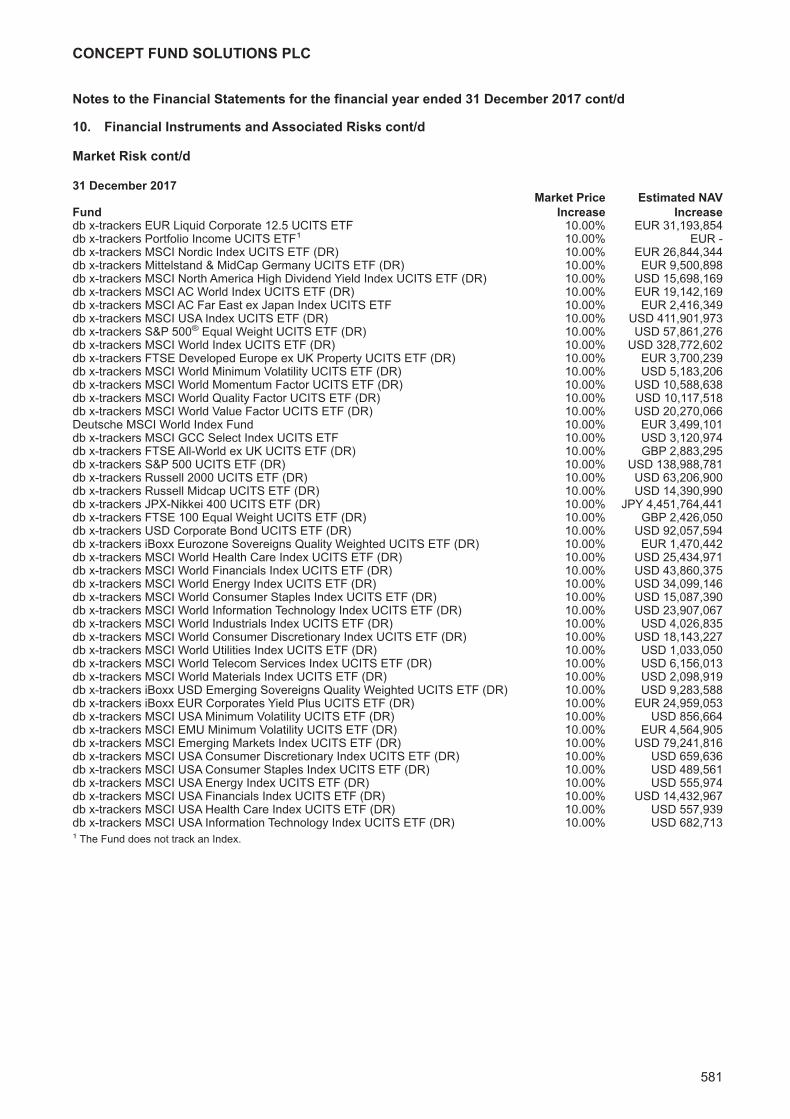
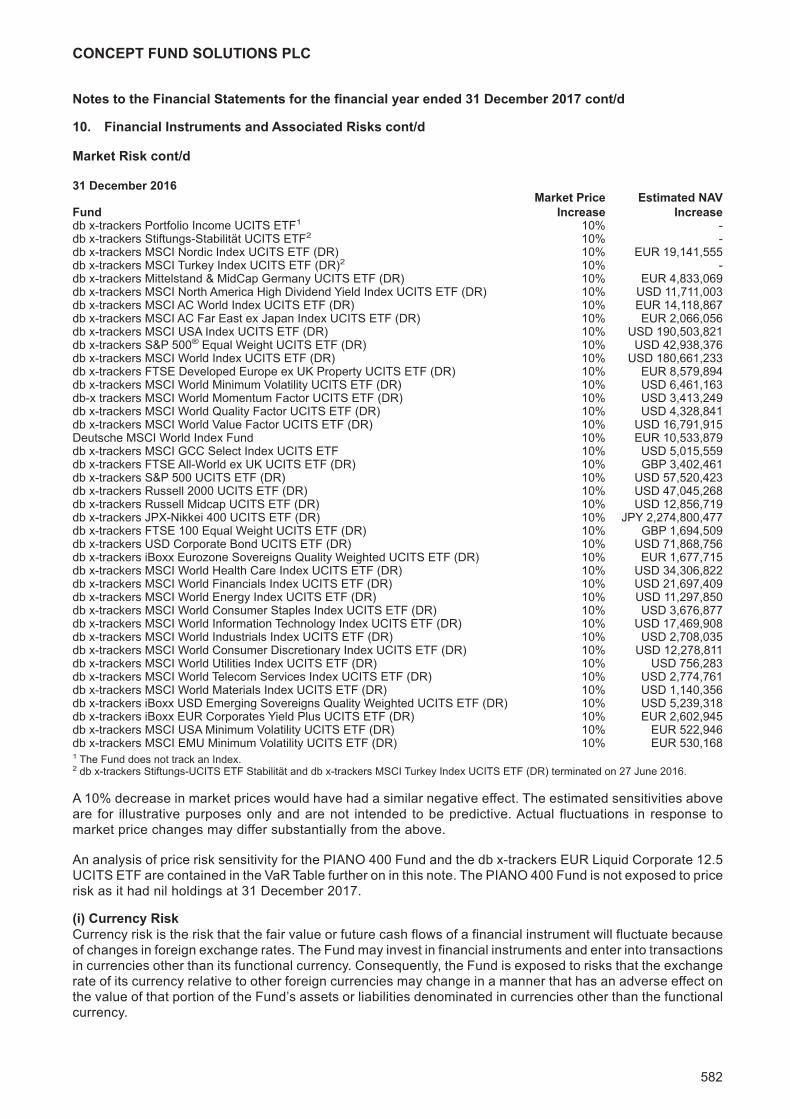
Funds which track an index are subject to tracking error risks which may result in the value and performanceof the Funds not tracking exactly the value and performance of the corresponding Index. The tracking error isdefined as the volatility (as measured by the standard deviation) of the difference between the return of theFund and the return of its Index, over a given period of time (the "tracking error”). It should be differentiatedfrom the tracking difference, which is simply the difference between the return of the Fund and the return of itsIndex, over a given period of time (the “tracking difference”). The tracking difference indicates the extent towhich a Fund has outperformed or underperformed its Index. In contrast, the tracking error measures howconsistently the Fund return matches its Index. Hence, while the tracking difference shows how a Fund’sperformance compares with that of its Index over a given period of time, the tracking error indicates theconsistency of the difference of return during this same period of time. The anticipated level of tracking error,in normal market conditions, is disclosed for each share class in the supplements to the Prospectus for therelevant Funds. Investors’ attention is drawn to the fact that these figures are only estimates of the trackingerror level in normal market conditions and should not be understood as strict limits. Tracking error andtracking difference for the financial year to date is outlined in the Investment Manager's Reports for therelevant Funds where they apply.
CONCEPT FUND SOLUTIONS PLC
14
DIRECTORS’ REPORT FOR THE FINANCIAL YEAR ENDED 31 DECEMBER 2017
The Directors present to the shareholders their Annual Report, together with the Audited Financial Statements,for the financial year ended 31 December 2017 of the Company.
Results, Activities and Future Developments
The results of operations are set out on pages 519 to 537. A review of activities is contained in the InvestmentManager’s Reports. The Directors intend to continue to pursue the investment objectives of the Funds as setout in the Prospectus and the individual Investment Manager's Report.
Principal Risk Uncertainties
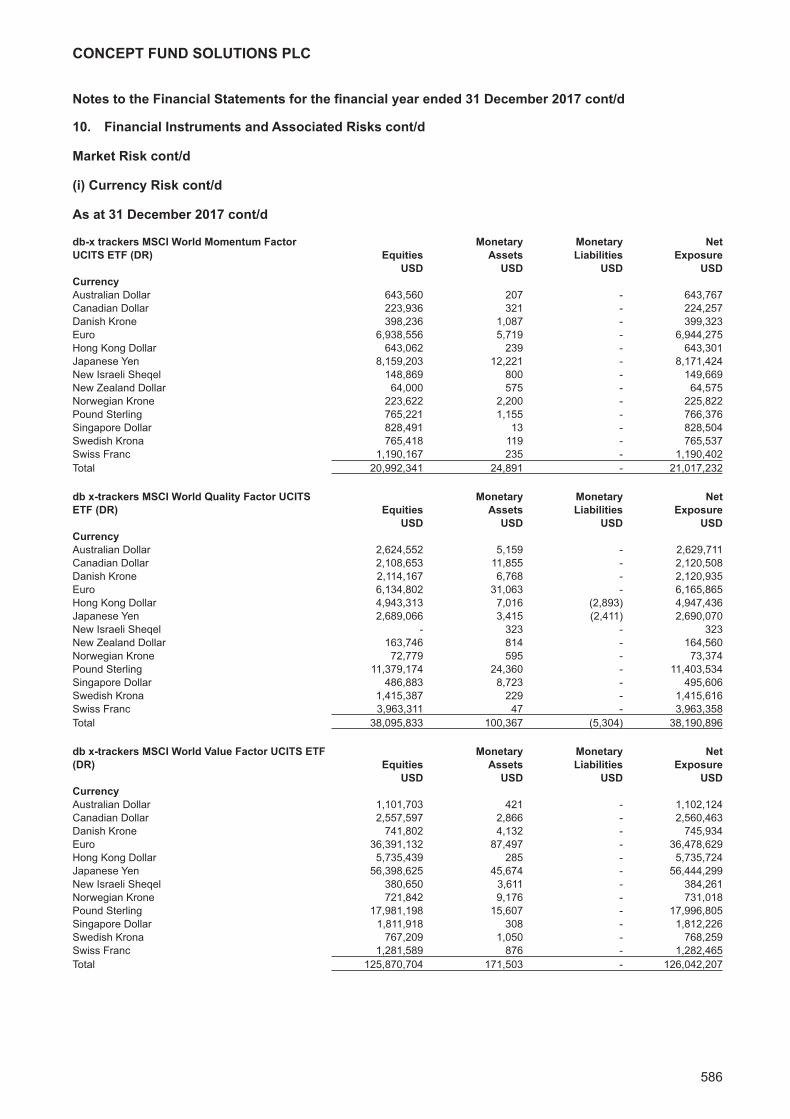
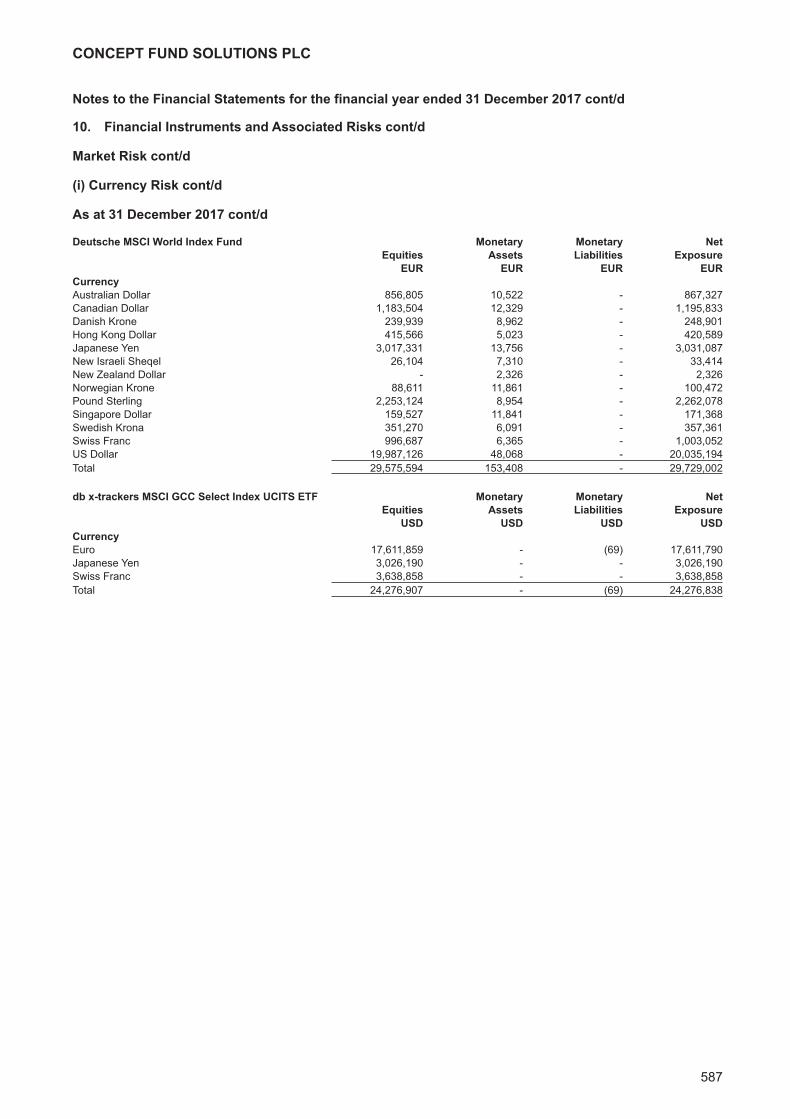
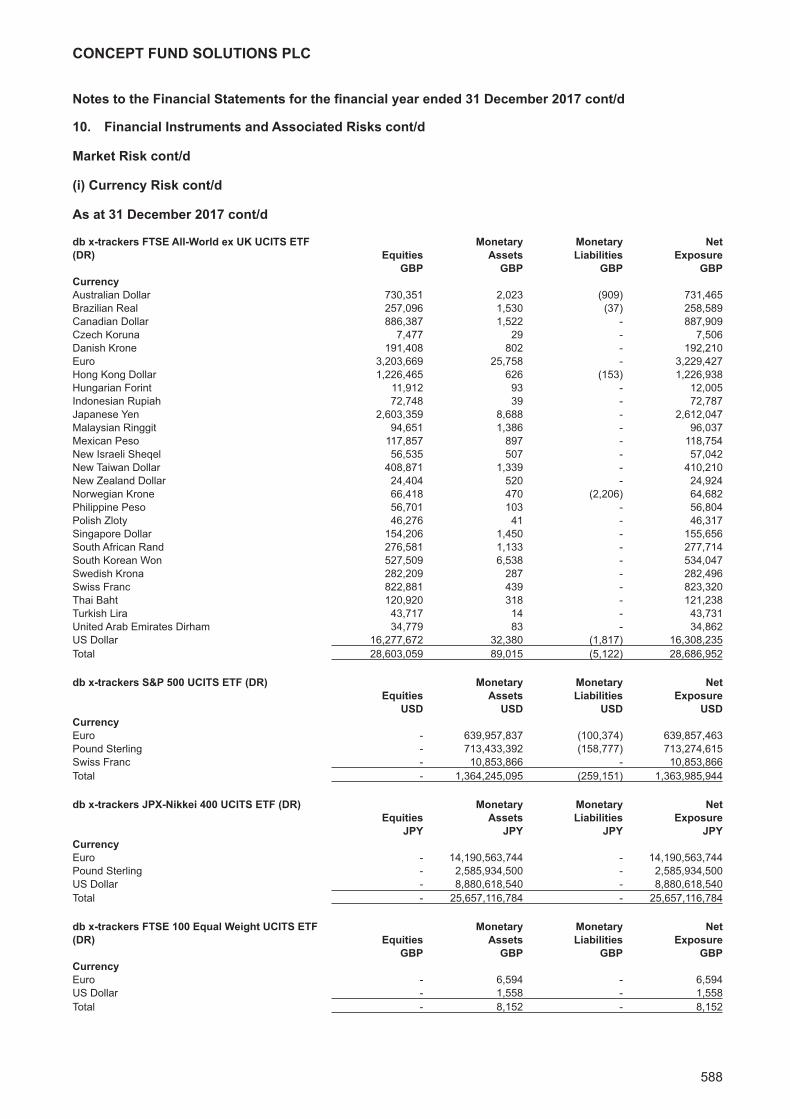
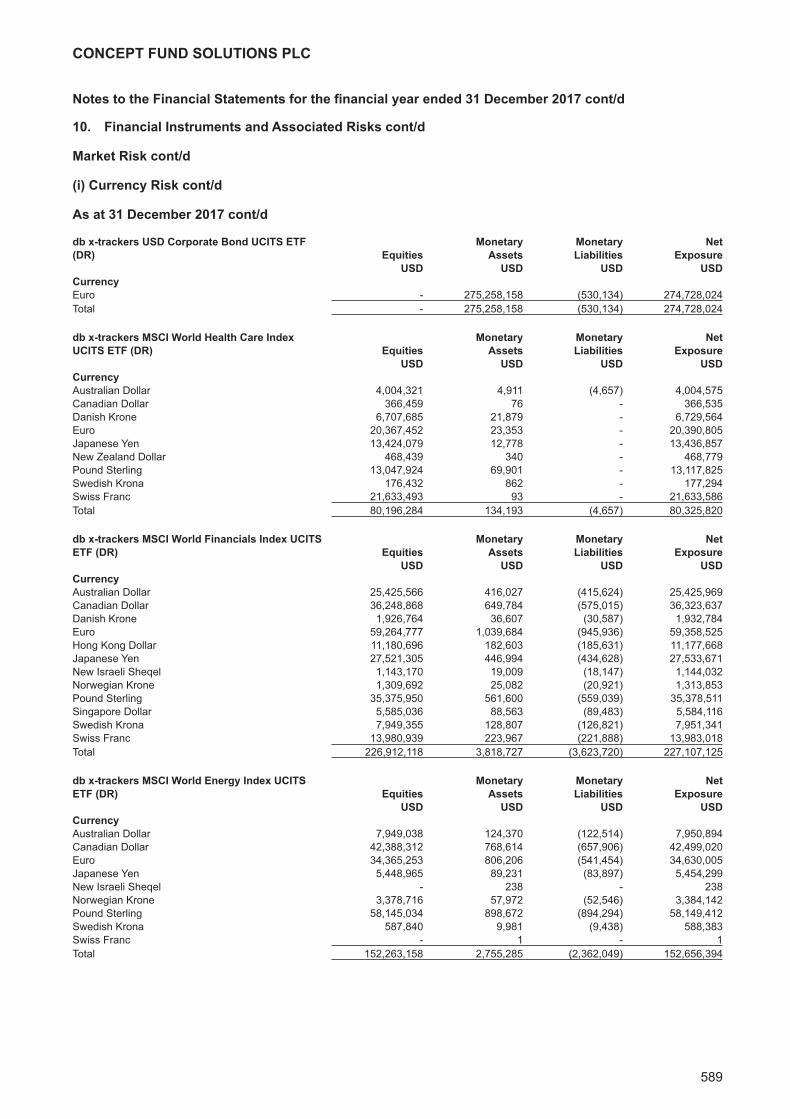
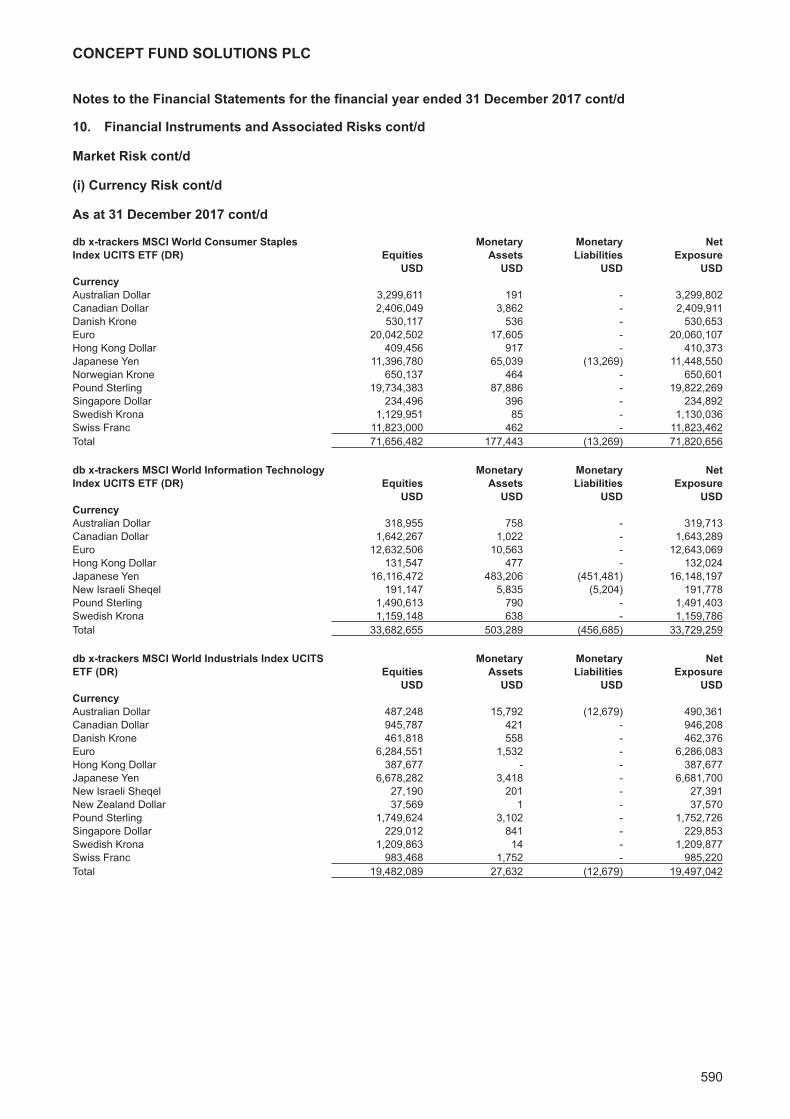
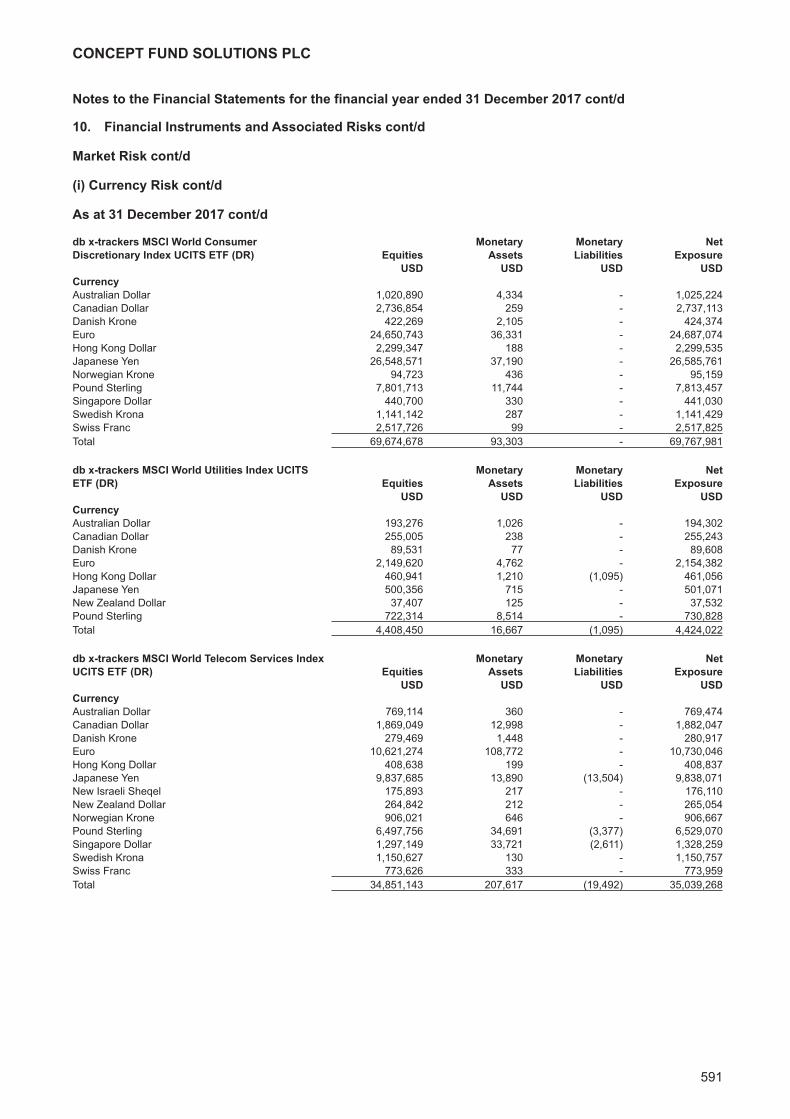
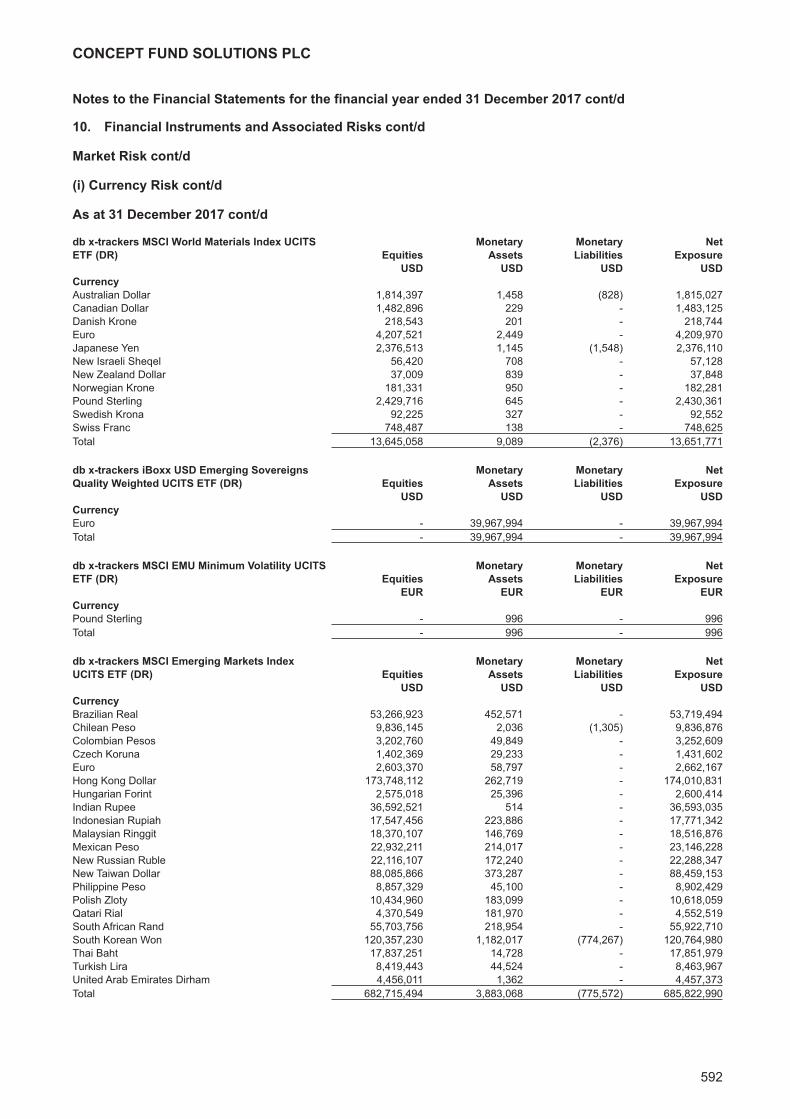
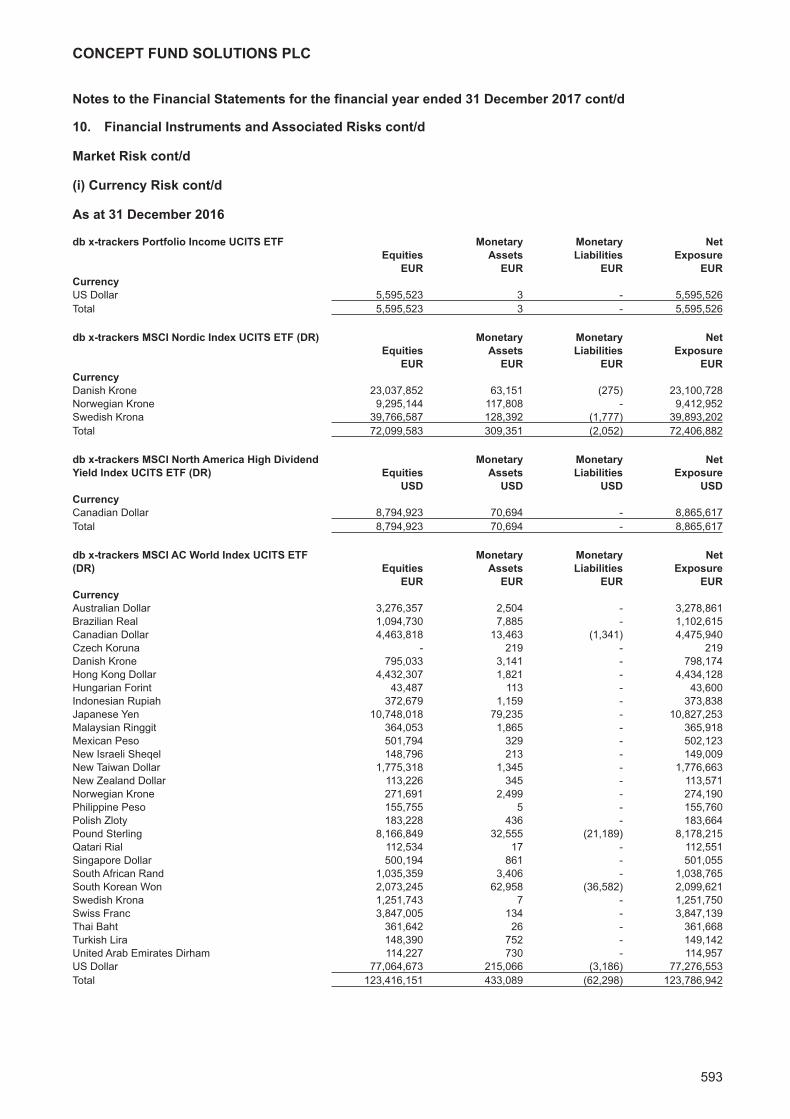
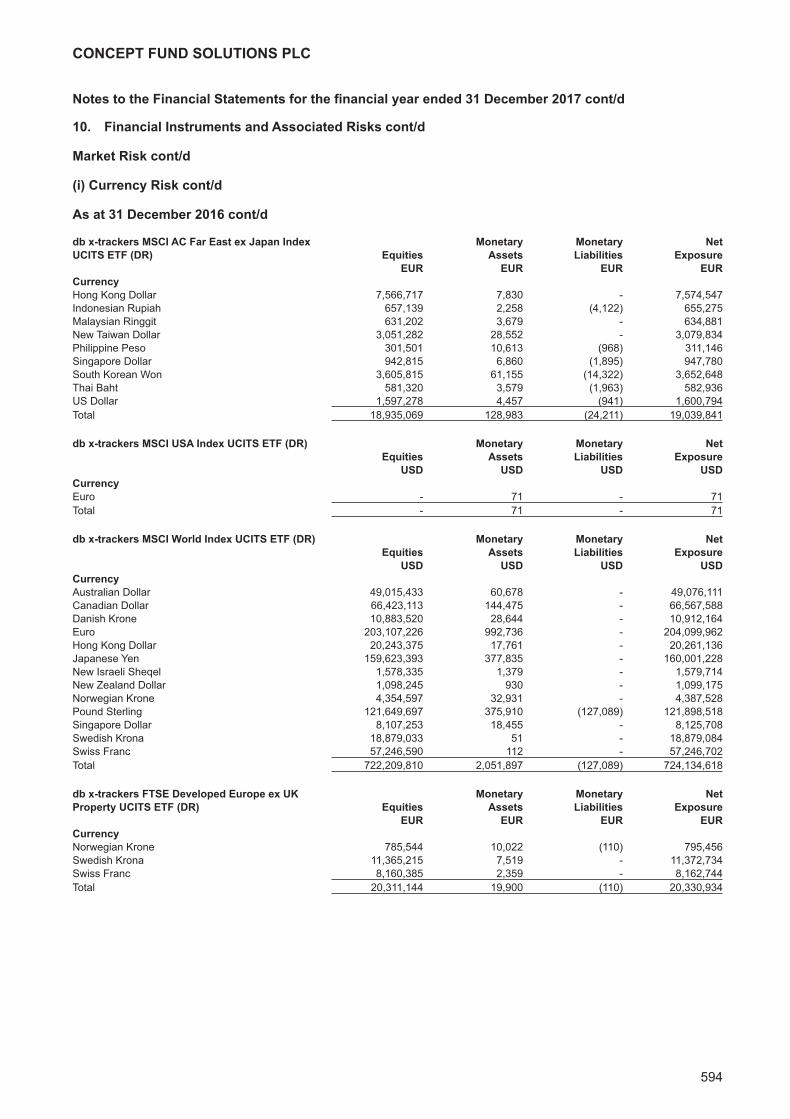
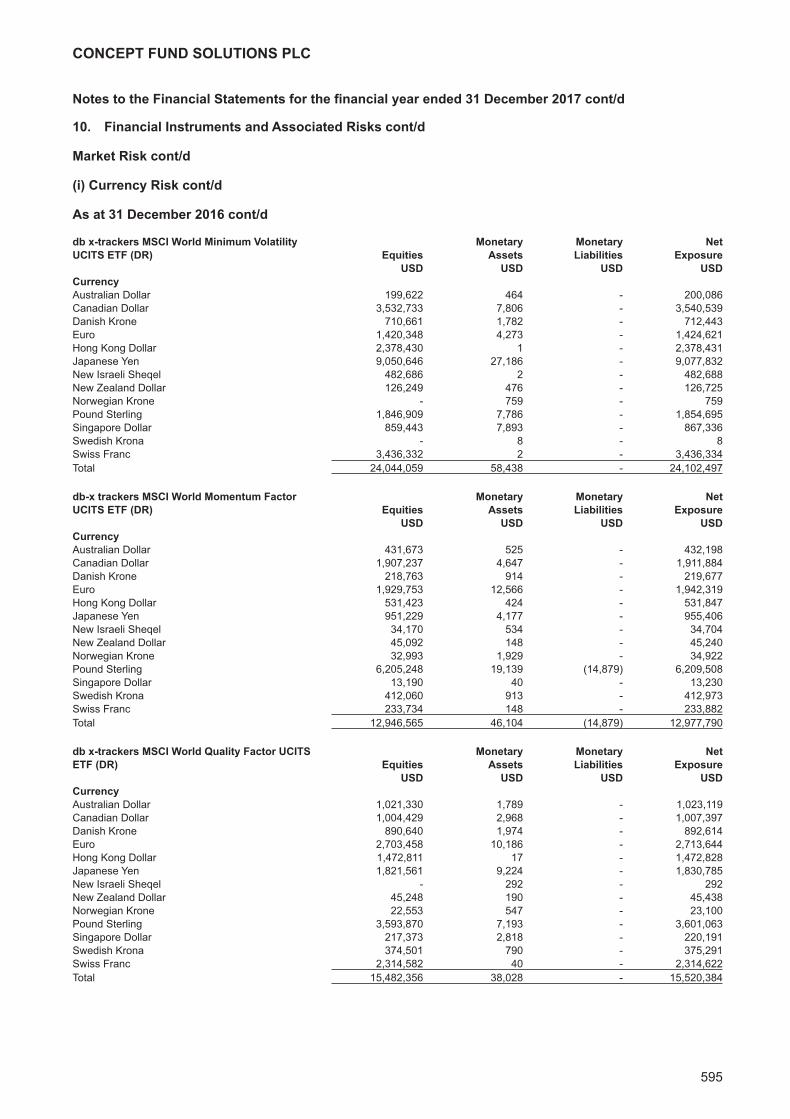
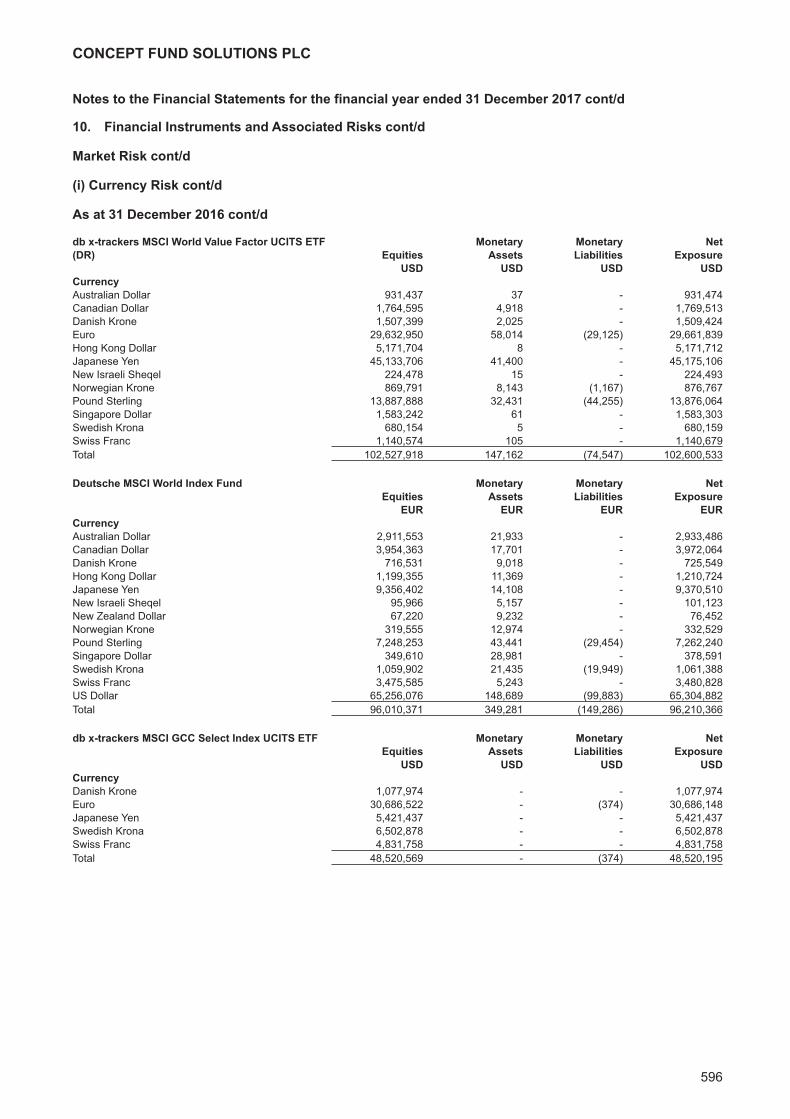
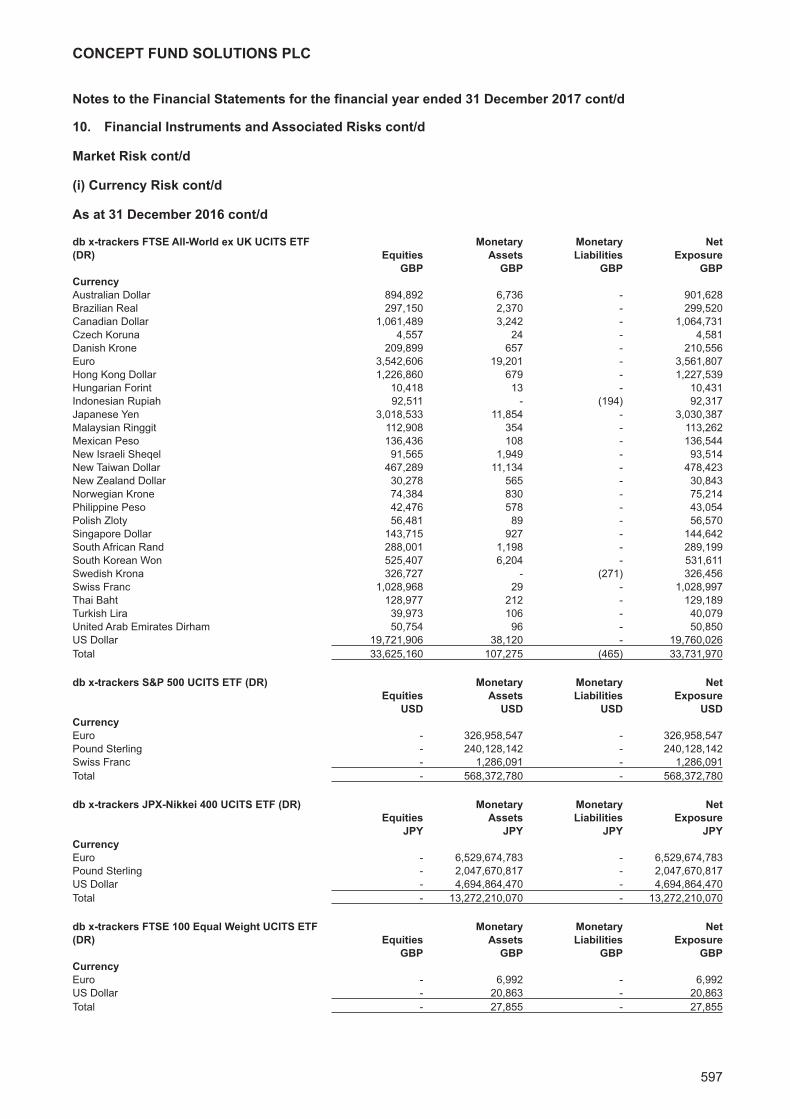
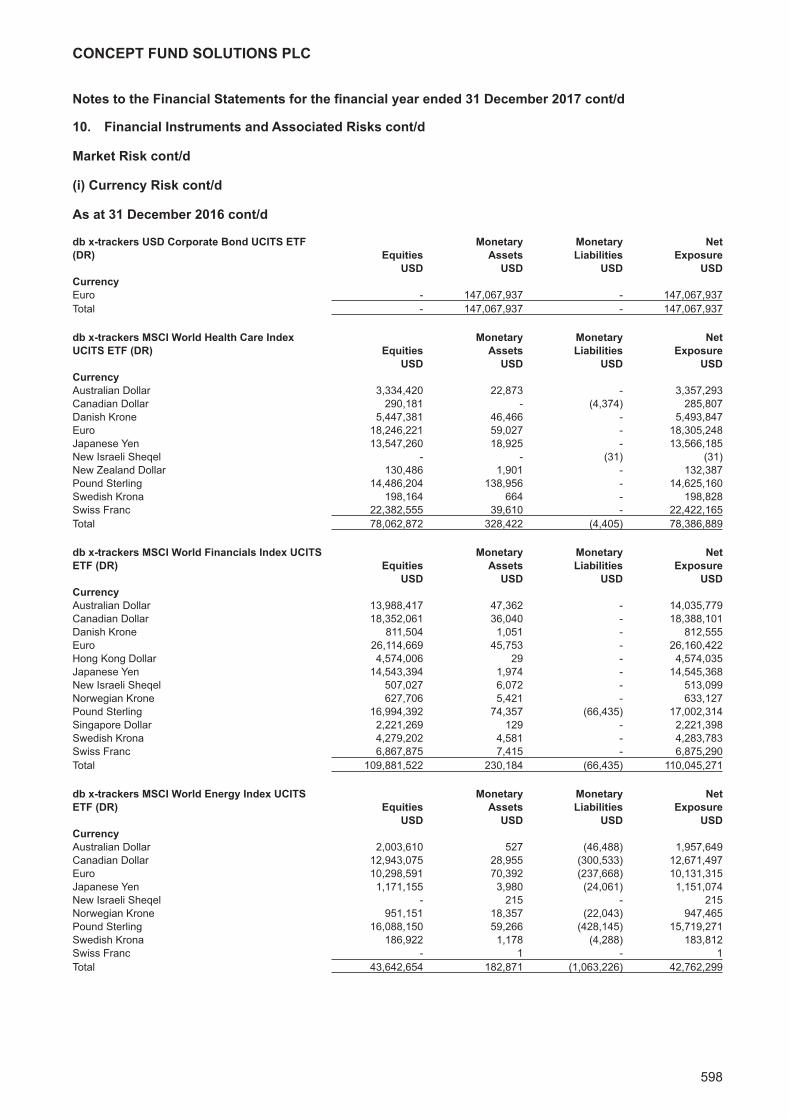
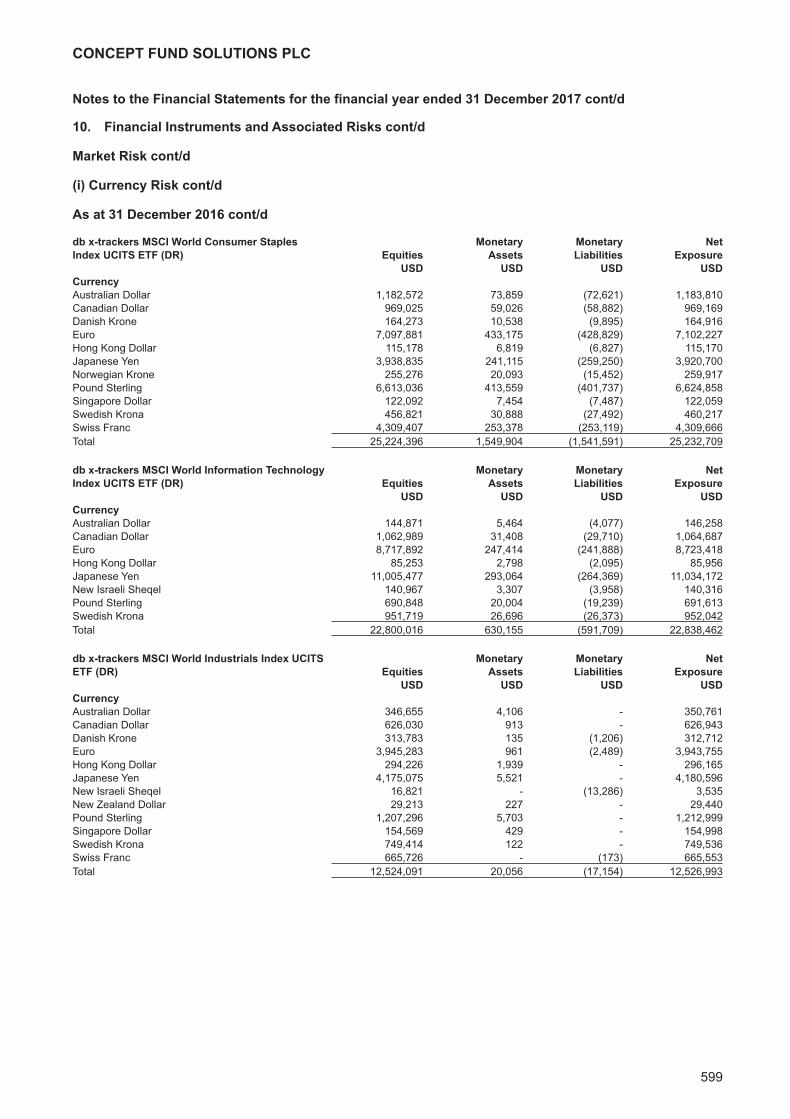
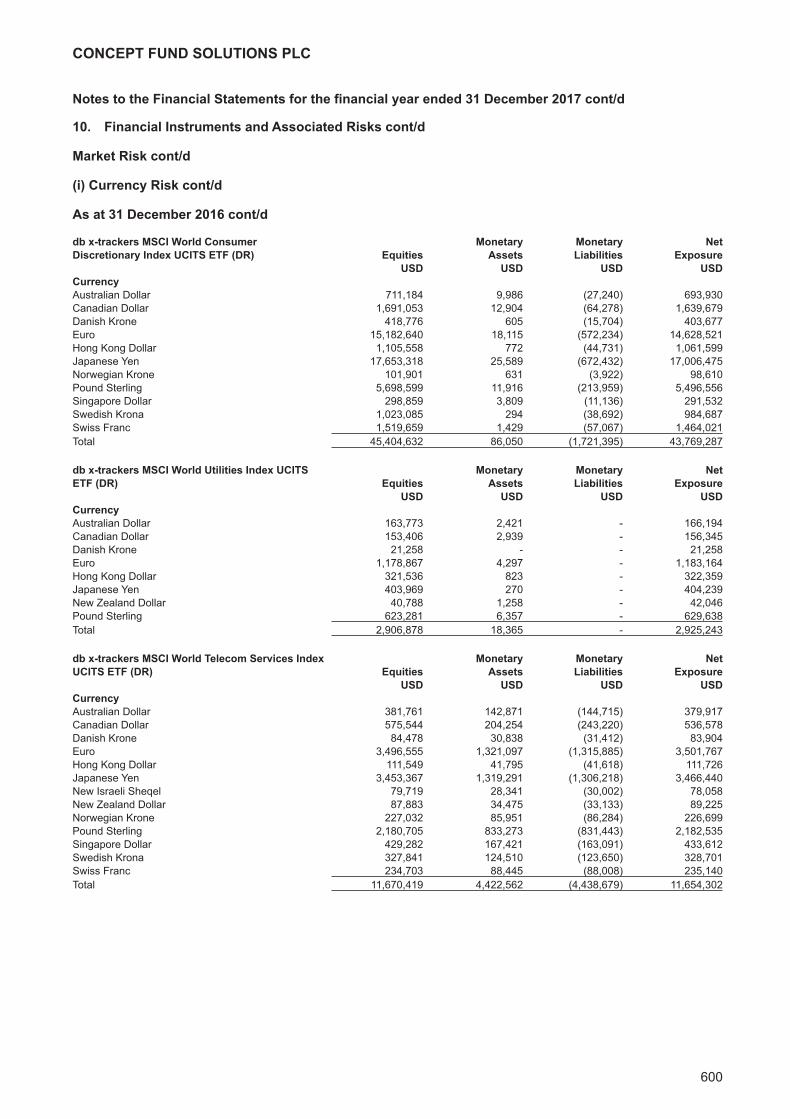
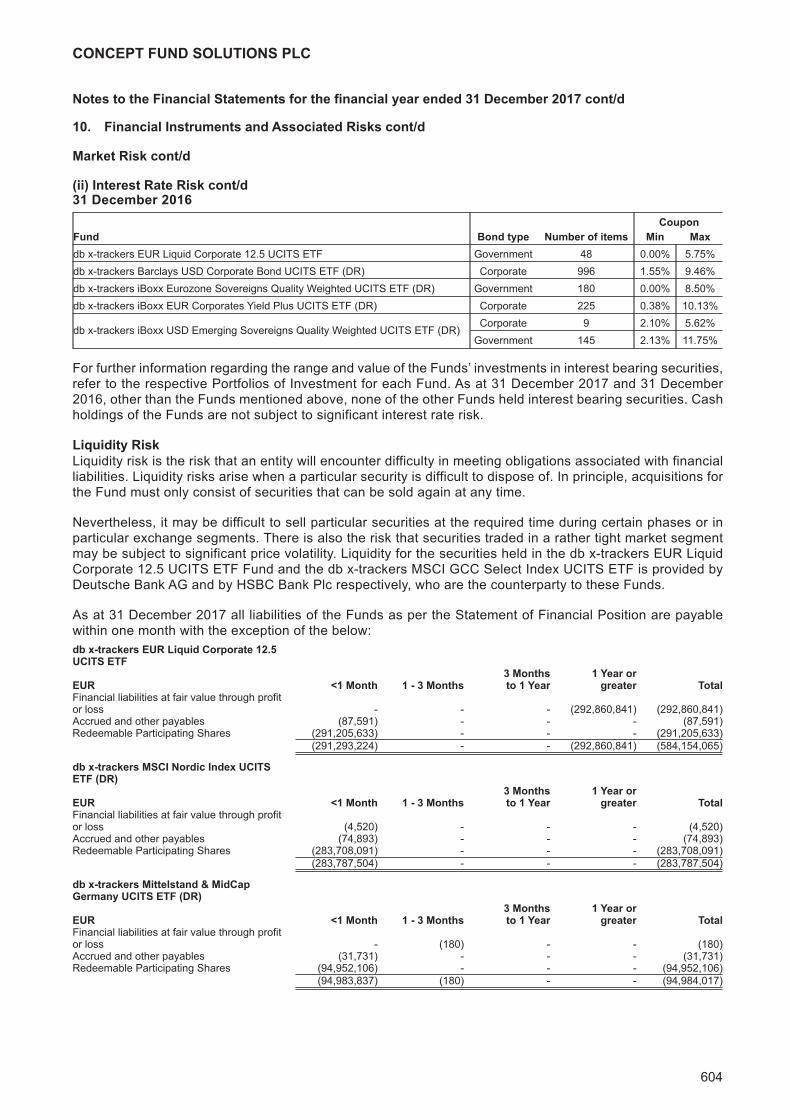
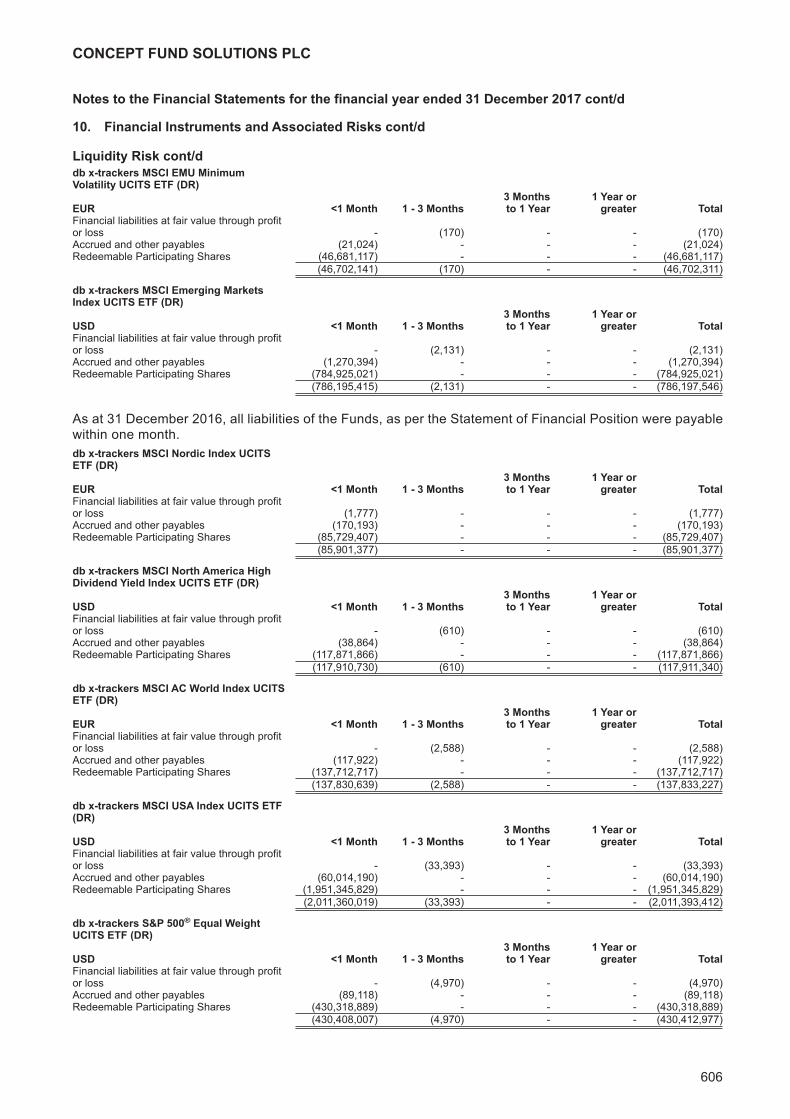
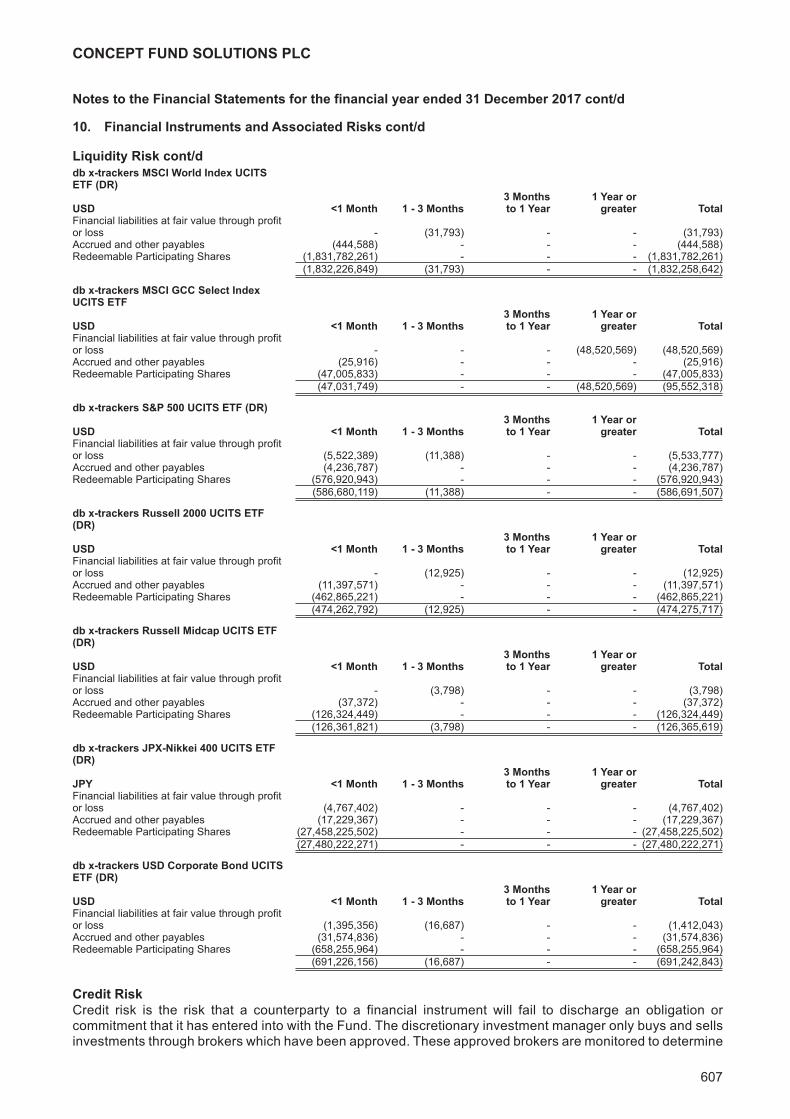
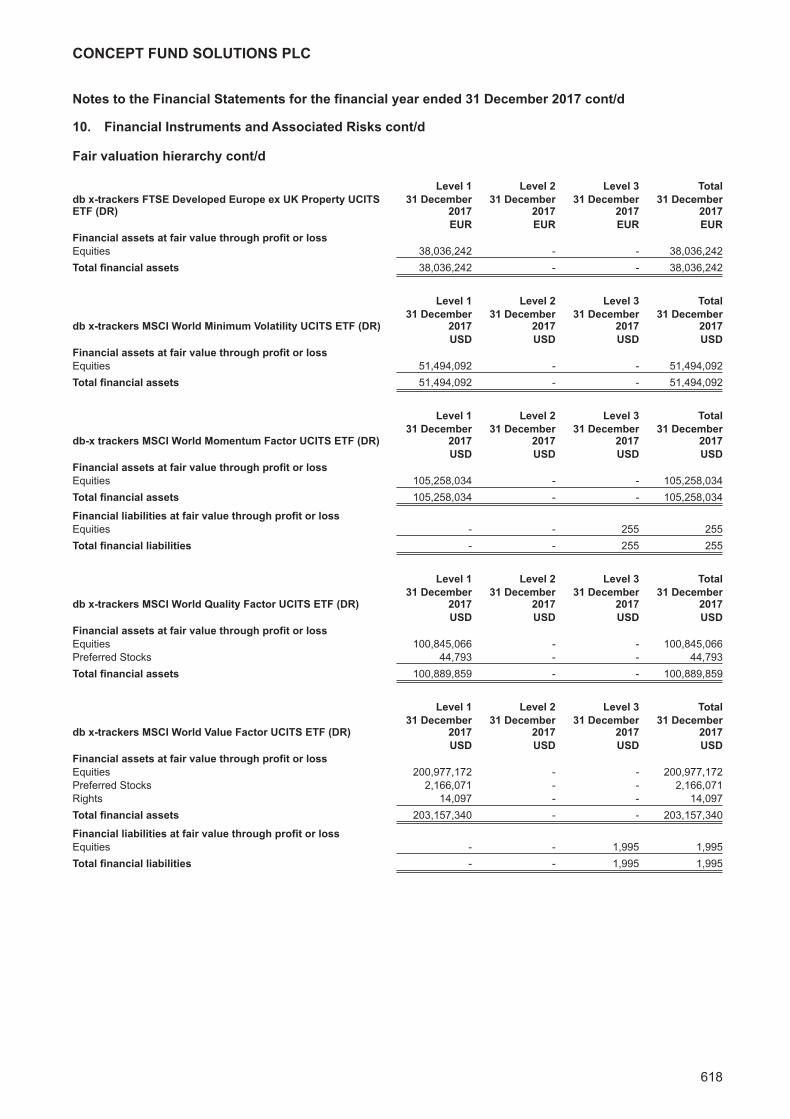
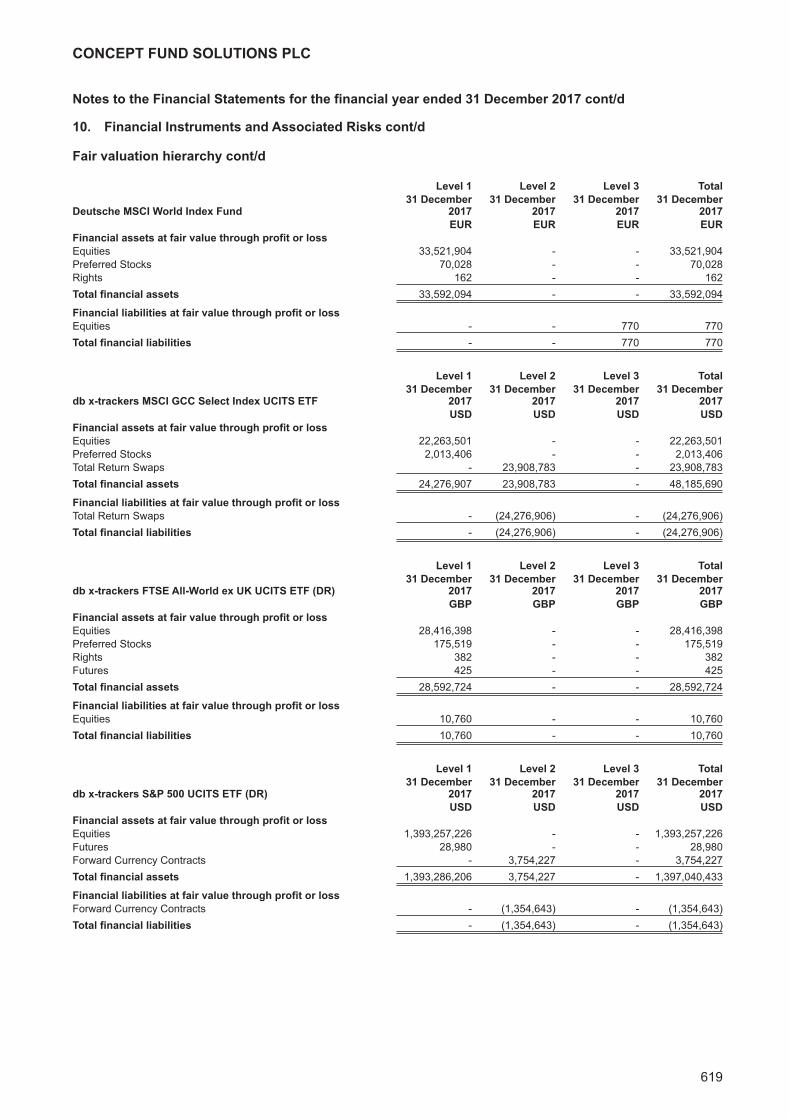
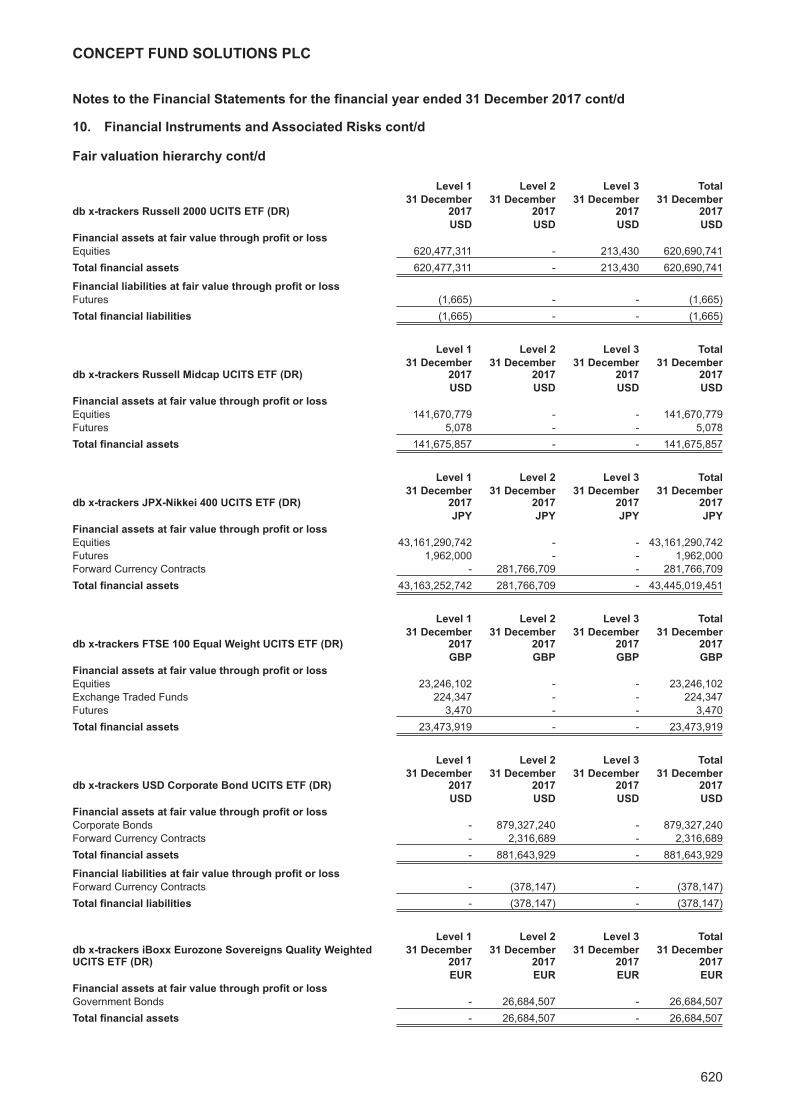
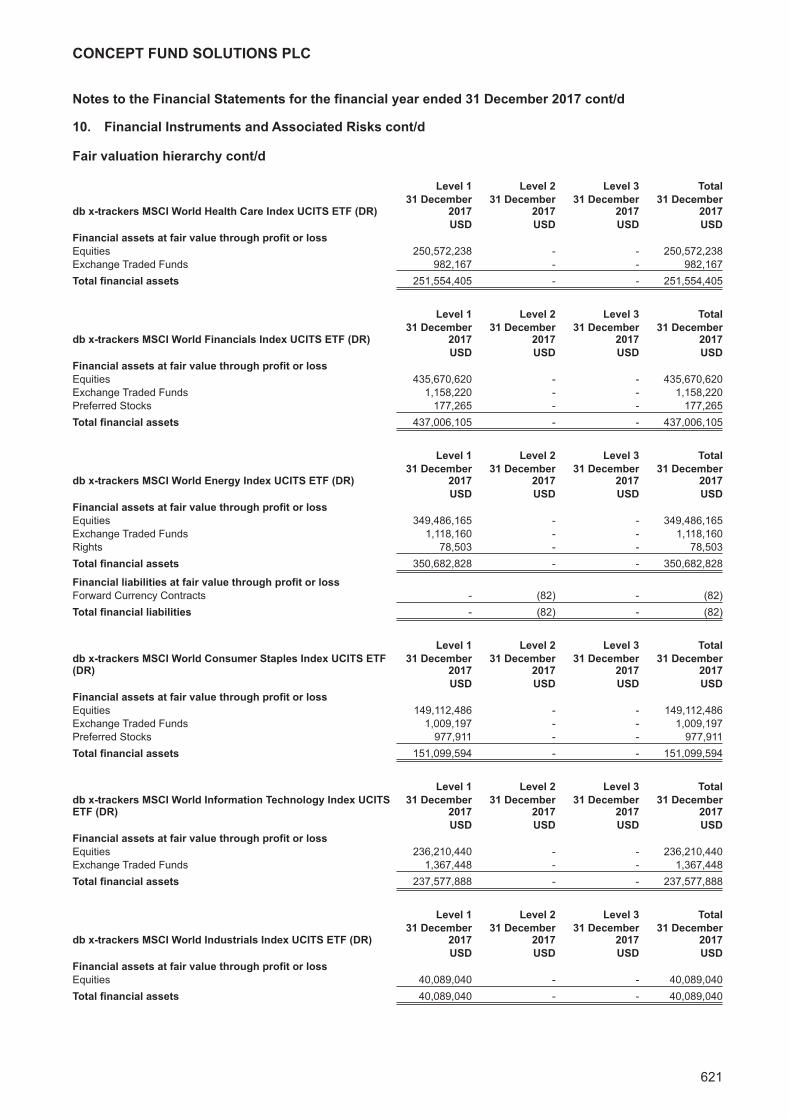
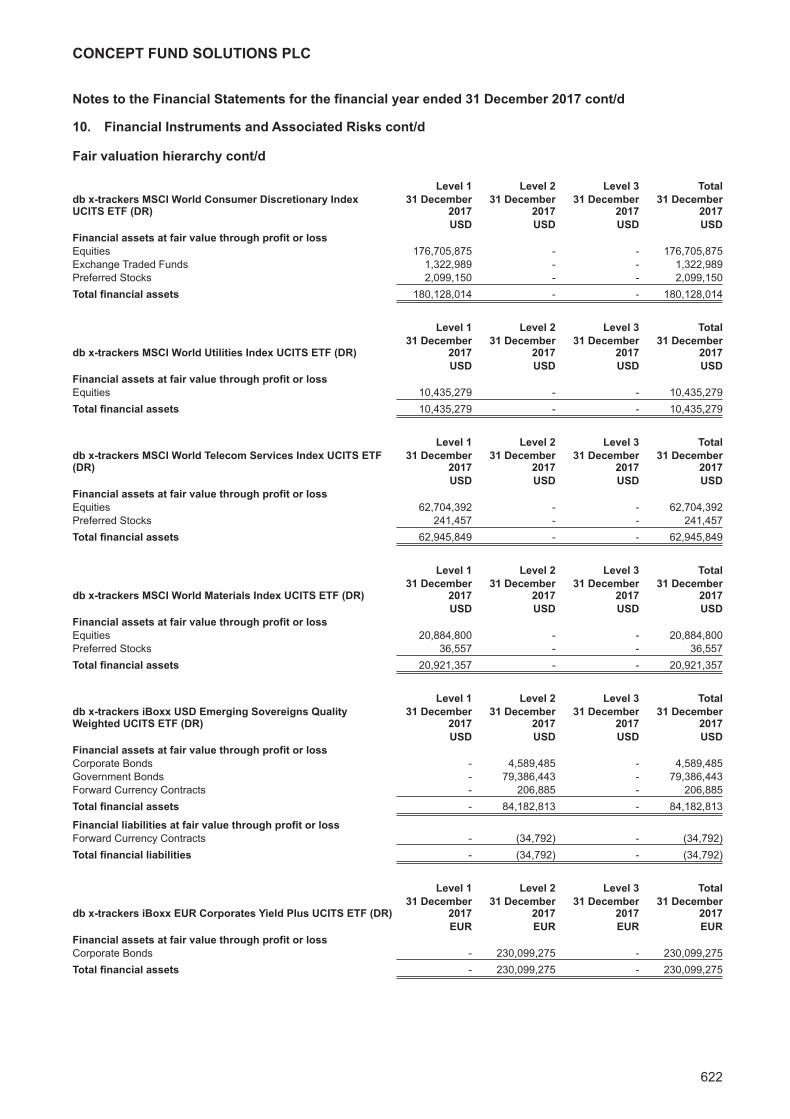
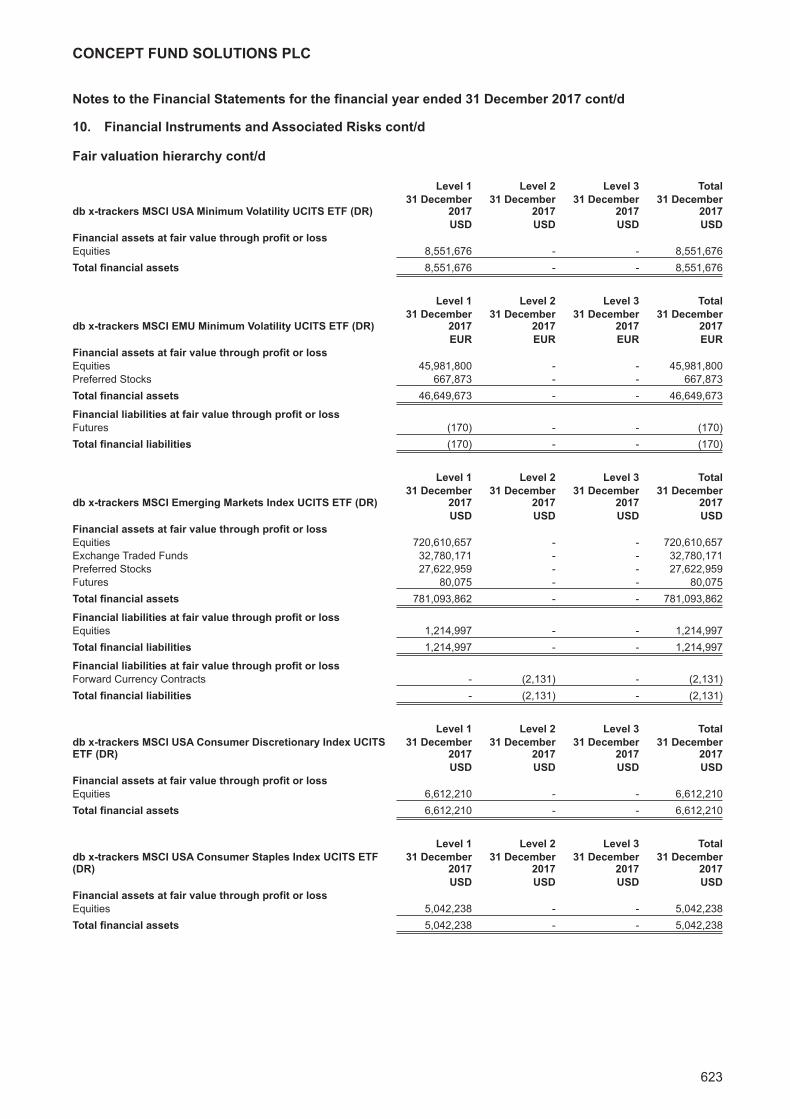
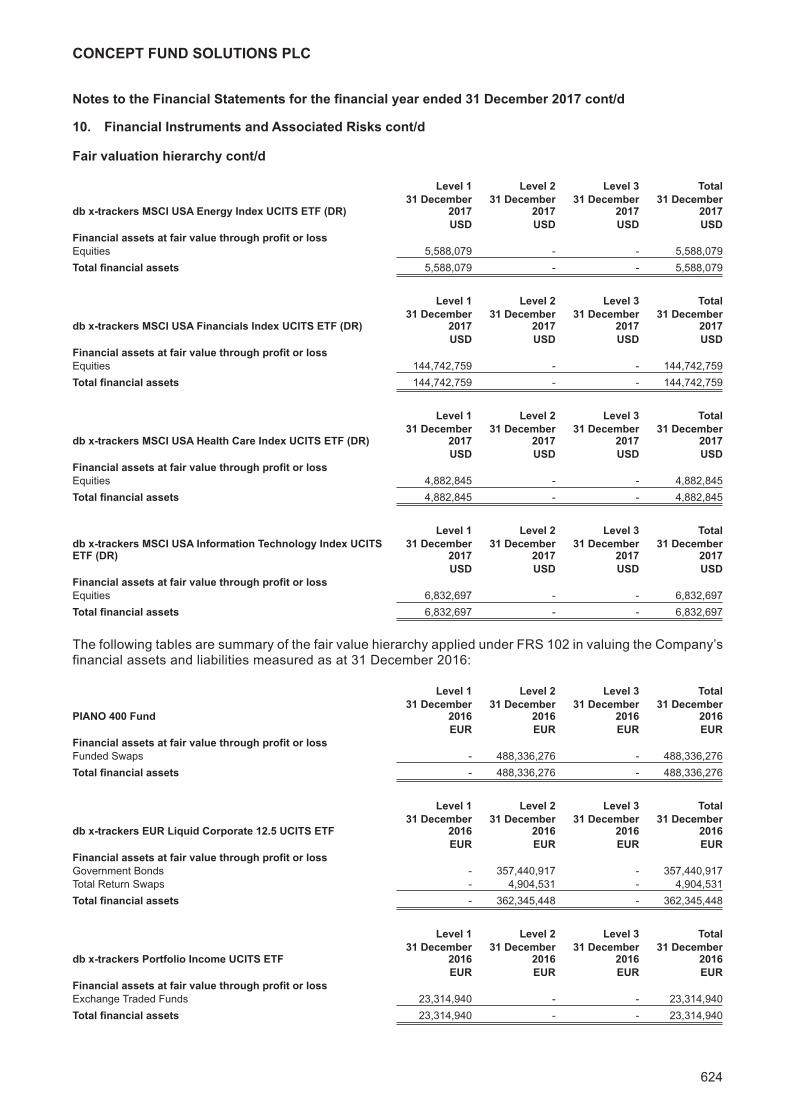
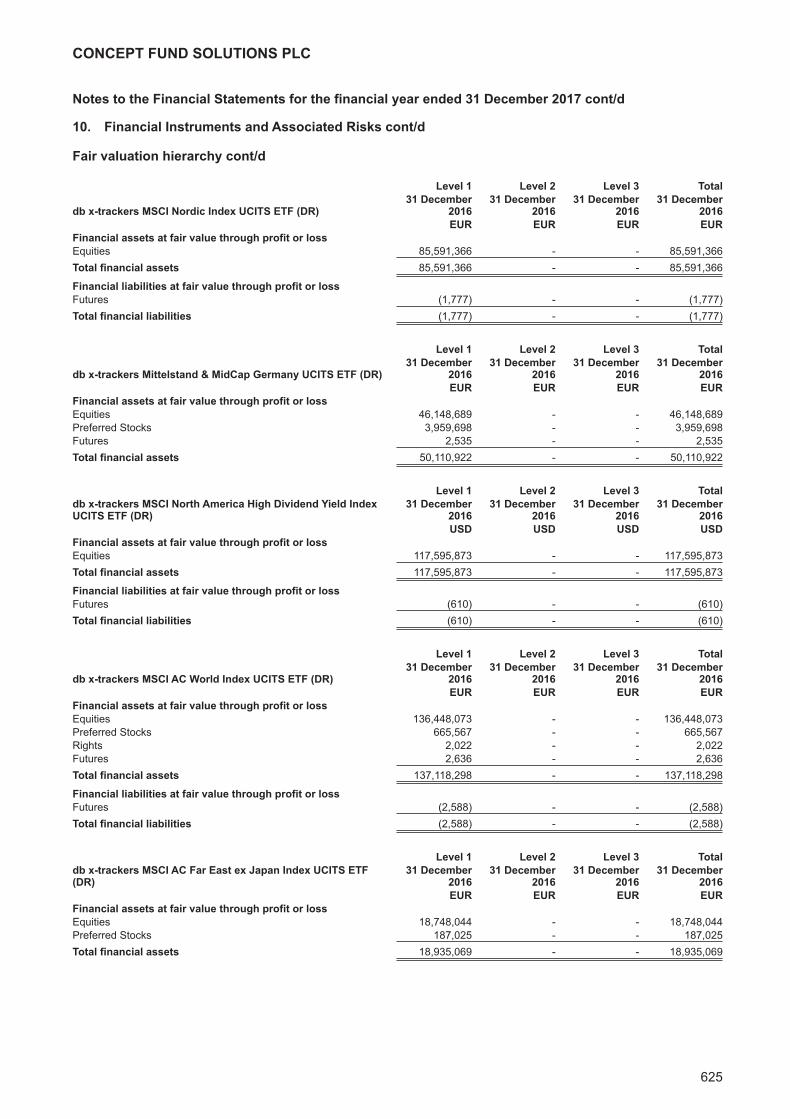
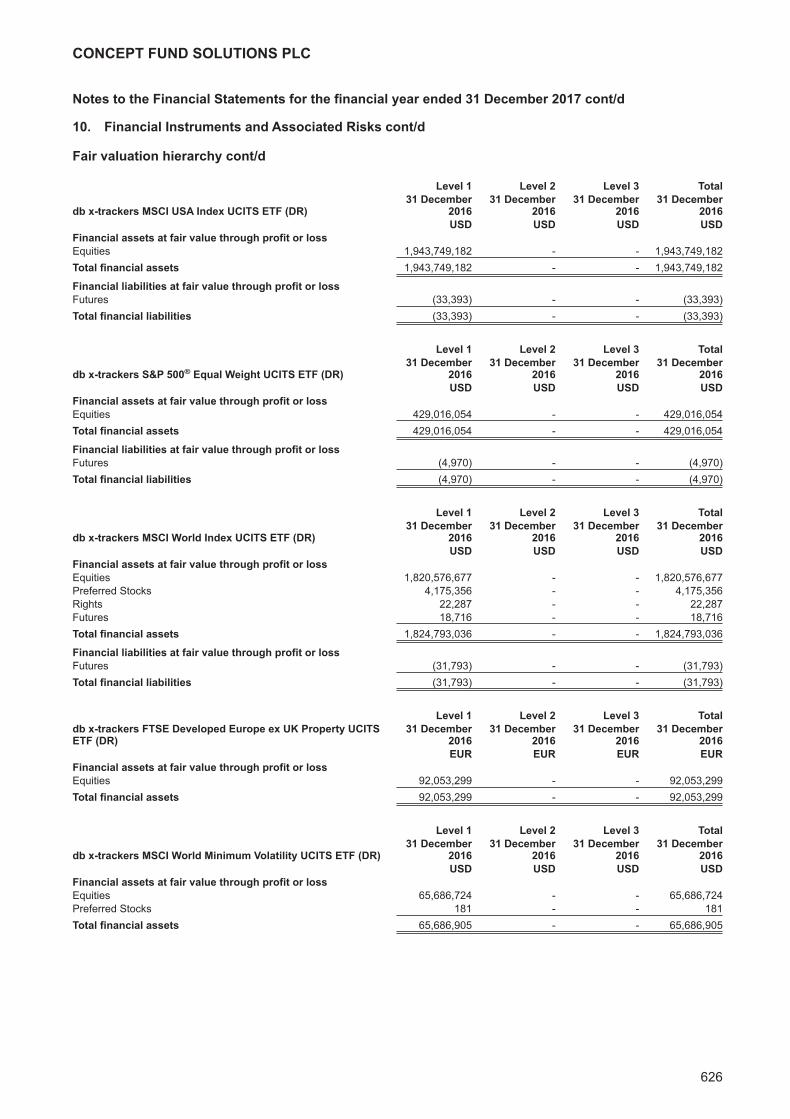
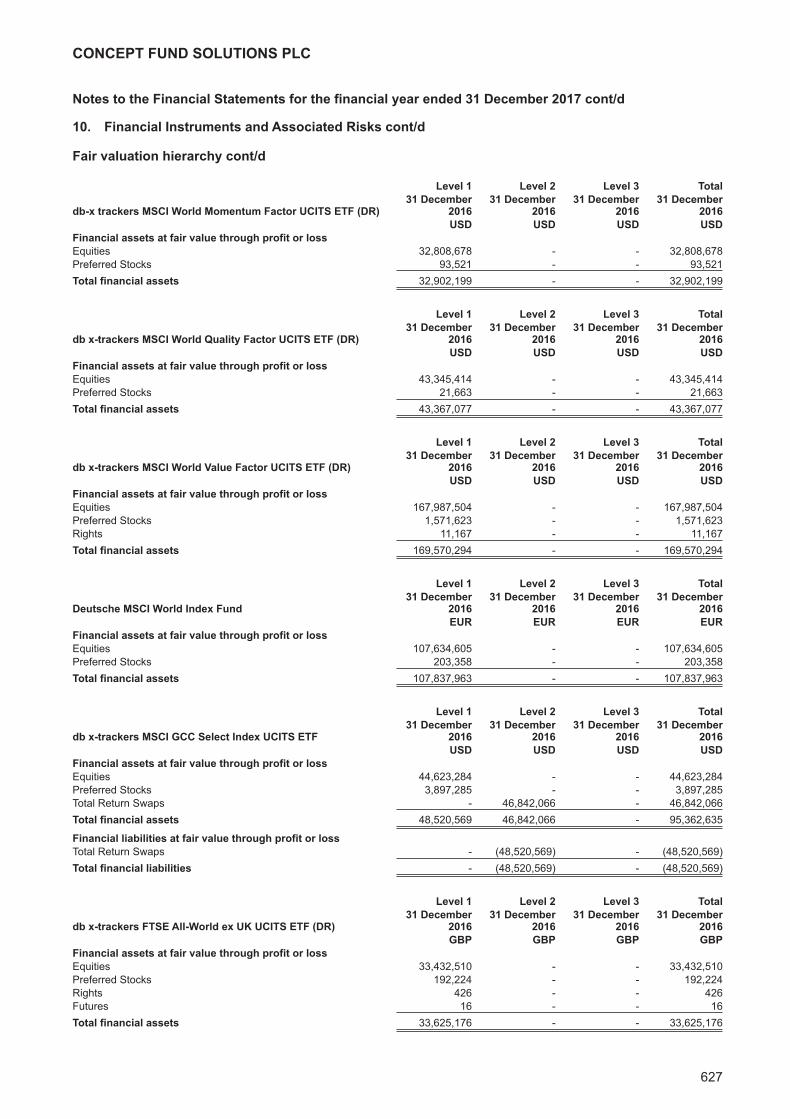
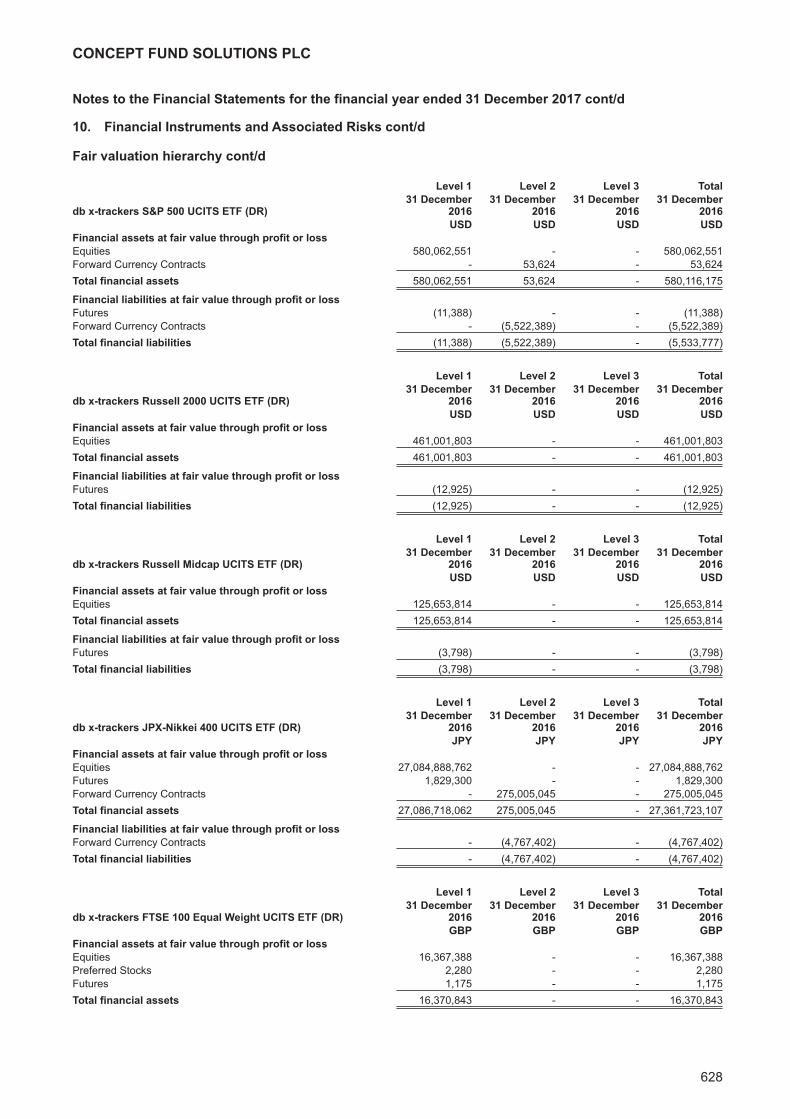
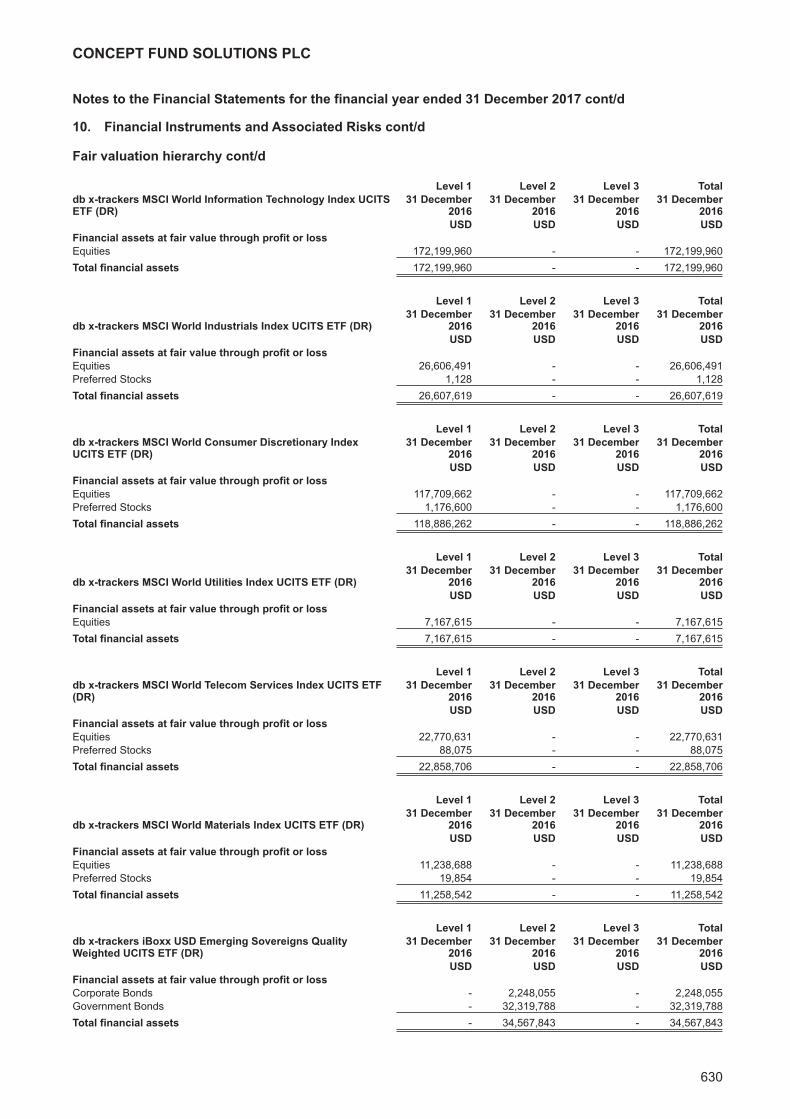
A detailed analysis of the risks facing each Fund is included in note 10 of the notes to the financial statements.
Financial Instruments
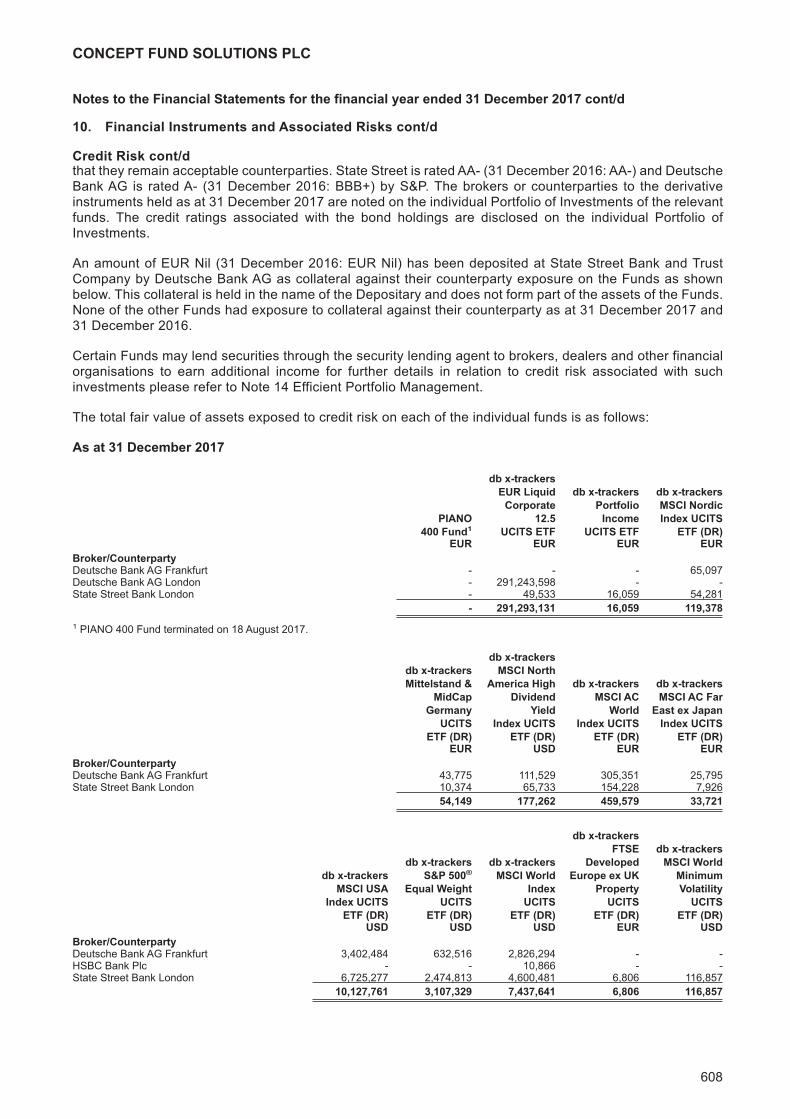
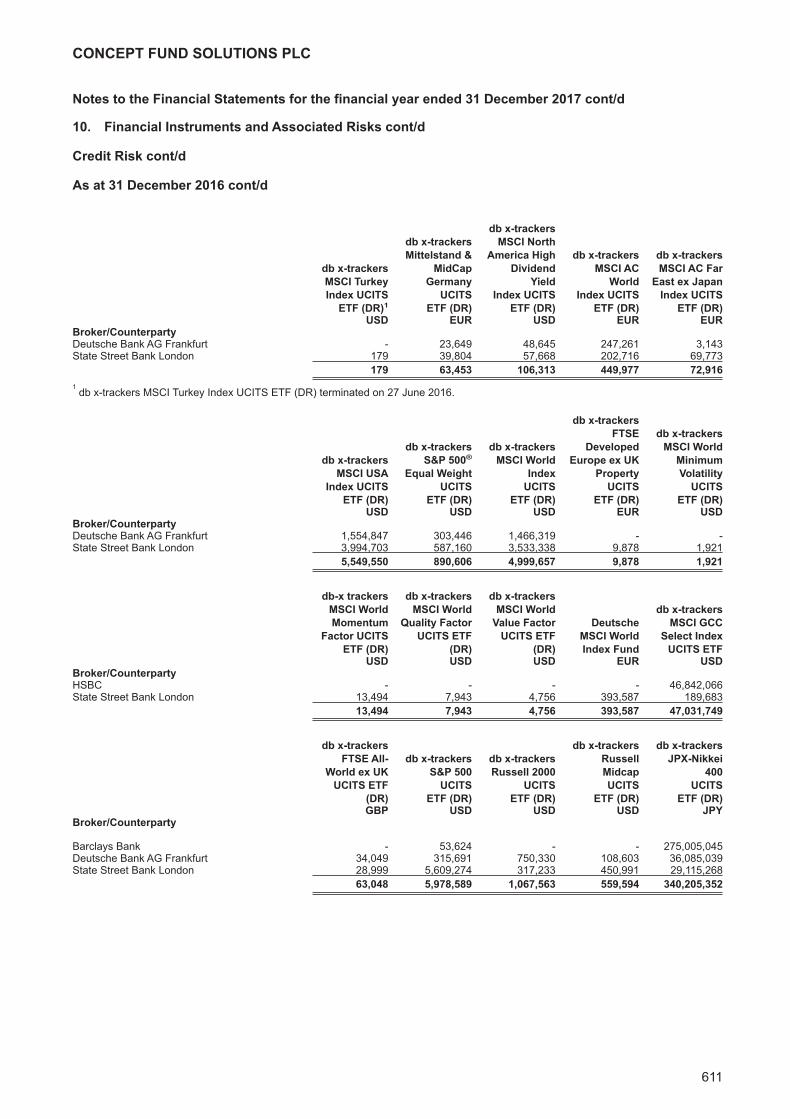
The information required in relation to the use by the Company of financial instruments and financial riskmanagement objectives and policies of the Company and the exposure of the Company to market risk,currency risk, interest rate risk, liquidity risk and credit risk are outlined in note 10 of the financial statements.
DirectorsThe Directors of the Company are:
Michael WhelanMr. Whelan is a vastly experienced financial services professional who was Chief Country Officer for DeutscheBank in Ireland from 2007 until 2015. During that period he led the substantial growth of the business in Irelandand was responsible for governance of the main operating legal entities, liaison with the Deutsche Bank's Irishbased clients and interface with the Central Bank. He led a senior team which established and operated twohighly successful businesses. A fellow of the Association of Chartered Certified Accountants (FCCA) he iscurrently Chairman and Director of a number of Irish registered mutual funds.
Tom MurrayMr. Murray is currently a non executive director of several regulated funds and investment management firms,including UCITs, AIFs and AIFMs. He has over 25 years' experience working in investment banking, havingbeen Director of Treasury in Investec Bank (Ireland Branch) and a founder director of Gandon Securities Ltdwhich was acquired by Investec in 2000. In addition, between 2004 and 2008 he was a Director of CorporateFinance in Merrion Stockbrokers. He was also CFO of Wang International Finance Ltd between 1982 and1988. He graduated in Commerce in 1976 and qualified as a Chartered Accountant with Coopers & Lybrandin 1980. He was a Member of the National Futures Association in the 1990s and has also obtained a Diplomain Directors Duties & Responsibilities from the Institute of Chartered Accountants.
Alex McKennaMr McKenna joined Deutsche Bank in 2005 and is currently a director within the Deutsche Asset Managementdivision of Deutsche Bank AG, based in London. Mr McKenna has extensive experience in structuring andmanagement of UCITS and non-UCITS funds and sits on the boards of Deutsche Asset Management fundsdomiciled in Luxembourg as well as Ireland. Prior to joining Deutsche Bank he was vice president and lawyerat JP Morgan, a lawyer in the capital markets practice of Simmons & Simmons and a barrister in privatepractice. Mr McKenna has a degree in History from Cambridge University and was called to the Bar of England& Wales in 1995.
CONCEPT FUND SOLUTIONS PLC
15
DIRECTORS’ REPORT FOR THE FINANCIAL YEAR ENDED 31 DECEMBER 2017 CONT/D
Directors cont/d
Gerry GrimesMr Grimes has over 30 years investment management and banking experience. Mr Grimes previously workedin the Central Bank of Ireland in a number of senior investment positions, including Head of ReserveManagement. He was a founder and Managing Director of Allied Irish Capital Management Ltd, where hemanaged a group of investment professionals with circa USD 1.4 billion under management, across a rangeof asset classes.
Mr Grimes is an independent director of investment funds/special purpose vehicles and also lectures in RiskManagement at University College Cork. He holds a First Class Honours Degree in Economics and Historyfrom University College Dublin and the Diploma for Non Executive Directors from the FinancialTimes/Pearson. He is a past Deputy President of AIMA, the leading representative body for the globalalternative asset management industry.
Manooj MistryMr. Mistry is head of Passive Asset Management for the EMEA region for Deutsche Bank's Asset Managementdivision. He joined Deutsche Bank in May 2006 and was part of the team that launched the db X-trackers ETFbusiness in 2007. Prior to Deutsche Bank, Mr. Mistry was with Merrill Lynch International in London where hewas responsible for the development of the LDRS ETFs, the first ETFs to be launched in Europe in 2000. AtMerrill Lynch, Mr. Mistry was also responsible for the development of a number of fund platforms offeringsolutions for retail and institutional investors. Mr. Mistry graduated in Economics and Business Finance fromBrunel University.
Directors’ and Secretary’s Interests in Shares and Contracts
The Directors and Company Secretary (Goodbody Secretarial Limited) who held office on 31 December 2017had no interests in the Shares of the Company at that date or at any time during the financial period.
Accounting Records
The Directors are responsible for ensuring that proper books and accounting records as outlined inSection 281 to 285 of the Companies Act, 2014 (the "Irish Companies Act") are kept by the Company whichdisclose with reasonable accuracy at any time the financial position of the Company and to enable them toensure that the financial statements comply with the Irish Companies Act. To achieve this, the Directors haveappointed an experienced Administrator to ensure that the requirements of Sections 281 to 286 of the IrishCompanies Act are complied with. The books and accounting records are maintained at the Administrator’soffice, 78 Sir John Rogerson's Quay, Dublin 2, Ireland.
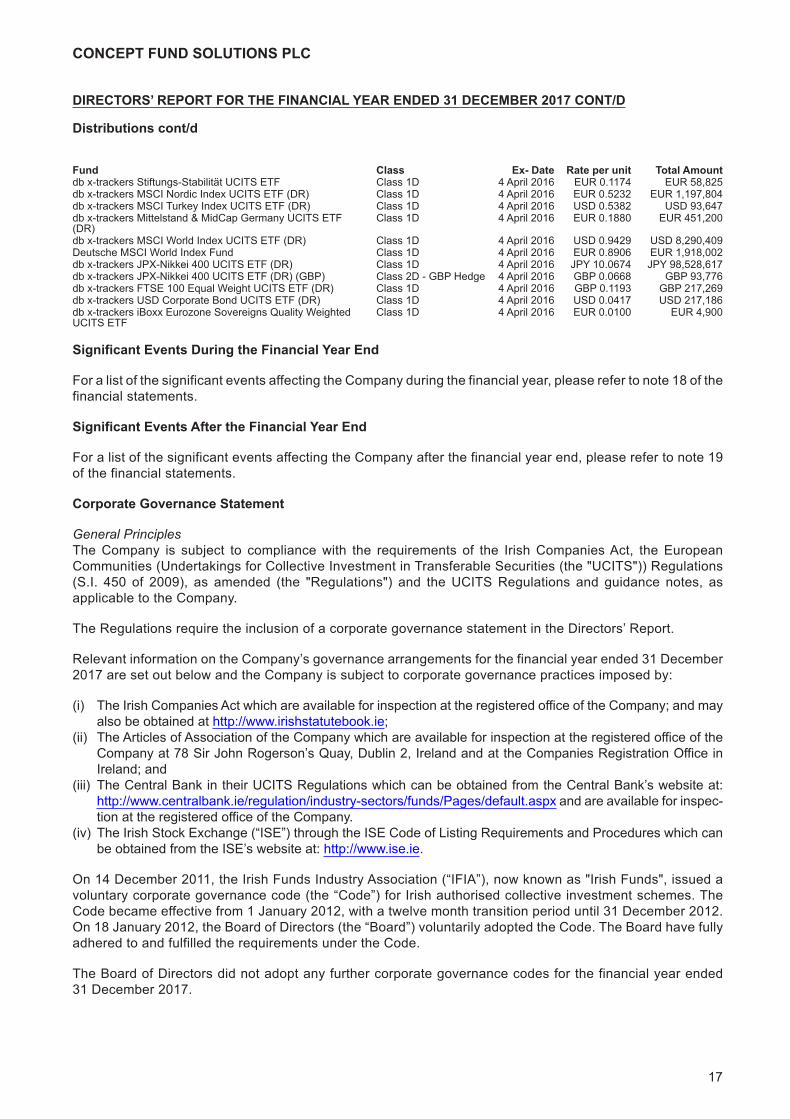
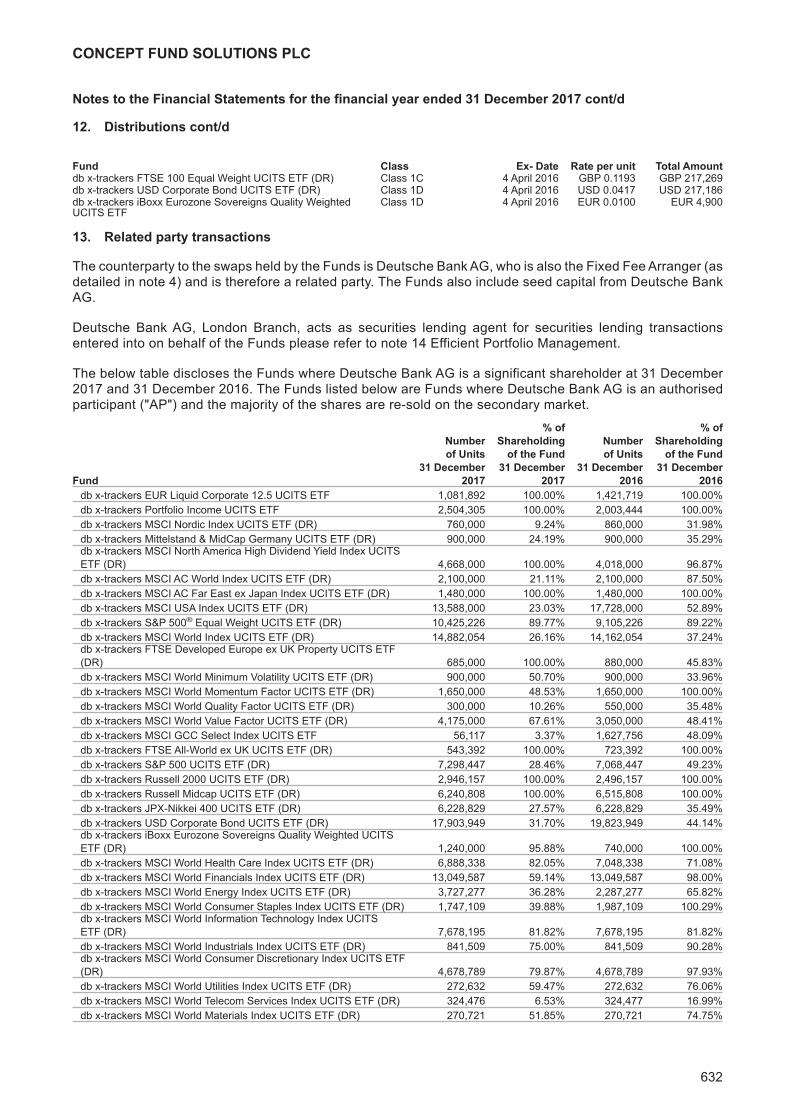
Distributions
The following distributions were paid during the financial year ended 31 December 2017.
Fund Class Ex-Date Rate per unit Total Amountdb x-trackers Portfolio Income UCITS ETF Class 1D 10 April 2017 EUR 0.1332 EUR 333,573db x-trackers MSCI Nordic Index UCITS ETF (DR) Class 1D 10 April 2017 EUR 0.8436 EUR 2,100,041db x-trackers Mittelstand & MidCap Germany UCITS ETF(DR)
Class 1D 10 April 2017 EUR 0.2425 EUR 727,500
db x-trackers MSCI World Index UCITS ETF (DR) Class 1D 10 April 2017 USD 0.9835 USD 8,288,586Deutsche MSCI World Index Fund Class 1D 10 April 2017 EUR 0.7911 EUR 613,034db x-trackers JPX-Nikkei 400 UCITS ETF (DR) Class 1D 10 April 2017 JPY 30.2521 JPY 289,473,360db x-trackers JPX-Nikkei 400 UCITS ETF (DR) Class 2D - GBP Hedge 10 April 2017 GBP 0.2690 GBP 288,860db x-trackers FTSE 100 Equal Weight UCITS ETF (DR) Class 1D 10 April 2017 GBP 0.4216 GBP 620,276db x-trackers USD Corporate Bond UCITS ETF (DR) Class 1D 10 April 2017 USD 0.4670 USD 13,303,586db x-trackers USD Corporate Bond UCITS ETF (DR) Class 2D 10 April 2017 EUR 0.2508 EUR 2,340,395db x-trackers iBoxx Eurozone Sovereigns Quality WeightedUCITS ETF (DR)
Class 1D 10 April 2017 EUR 0.1209 EUR 144,744
db x-trackers iBoxx USD Emerging Sovereigns QualityWeighted UCITS ETF (DR)
Class 1D 10 April 2017 USD 0.4480 USD 1,473,922
The following distributions were paid during the financial year ended 31 December 2016.
Fund Class Ex- Date Rate per unit Total Amountdb x-trackers Portfolio Income UCITS ETF Class 1D 4 April 2016 EUR 0.1633 EUR 408,929
CONCEPT FUND SOLUTIONS PLC
16
DIRECTORS’ REPORT FOR THE FINANCIAL YEAR ENDED 31 DECEMBER 2017 CONT/D
Distributions cont/d
Fund Class Ex- Date Rate per unit Total Amountdb x-trackers Stiftungs-Stabilität UCITS ETF Class 1D 4 April 2016 EUR 0.1174 EUR 58,825db x-trackers MSCI Nordic Index UCITS ETF (DR) Class 1D 4 April 2016 EUR 0.5232 EUR 1,197,804db x-trackers MSCI Turkey Index UCITS ETF (DR) Class 1D 4 April 2016 USD 0.5382 USD 93,647db x-trackers Mittelstand & MidCap Germany UCITS ETF(DR)
Class 1D 4 April 2016 EUR 0.1880 EUR 451,200
db x-trackers MSCI World Index UCITS ETF (DR) Class 1D 4 April 2016 USD 0.9429 USD 8,290,409Deutsche MSCI World Index Fund Class 1D 4 April 2016 EUR 0.8906 EUR 1,918,002db x-trackers JPX-Nikkei 400 UCITS ETF (DR) Class 1D 4 April 2016 JPY 10.0674 JPY 98,528,617db x-trackers JPX-Nikkei 400 UCITS ETF (DR) (GBP) Class 2D - GBP Hedge 4 April 2016 GBP 0.0668 GBP 93,776db x-trackers FTSE 100 Equal Weight UCITS ETF (DR) Class 1D 4 April 2016 GBP 0.1193 GBP 217,269db x-trackers USD Corporate Bond UCITS ETF (DR) Class 1D 4 April 2016 USD 0.0417 USD 217,186db x-trackers iBoxx Eurozone Sovereigns Quality WeightedUCITS ETF
Class 1D 4 April 2016 EUR 0.0100 EUR 4,900
Significant Events During the Financial Year End
For a list of the significant events affecting the Company during the financial year, please refer to note 18 of thefinancial statements.
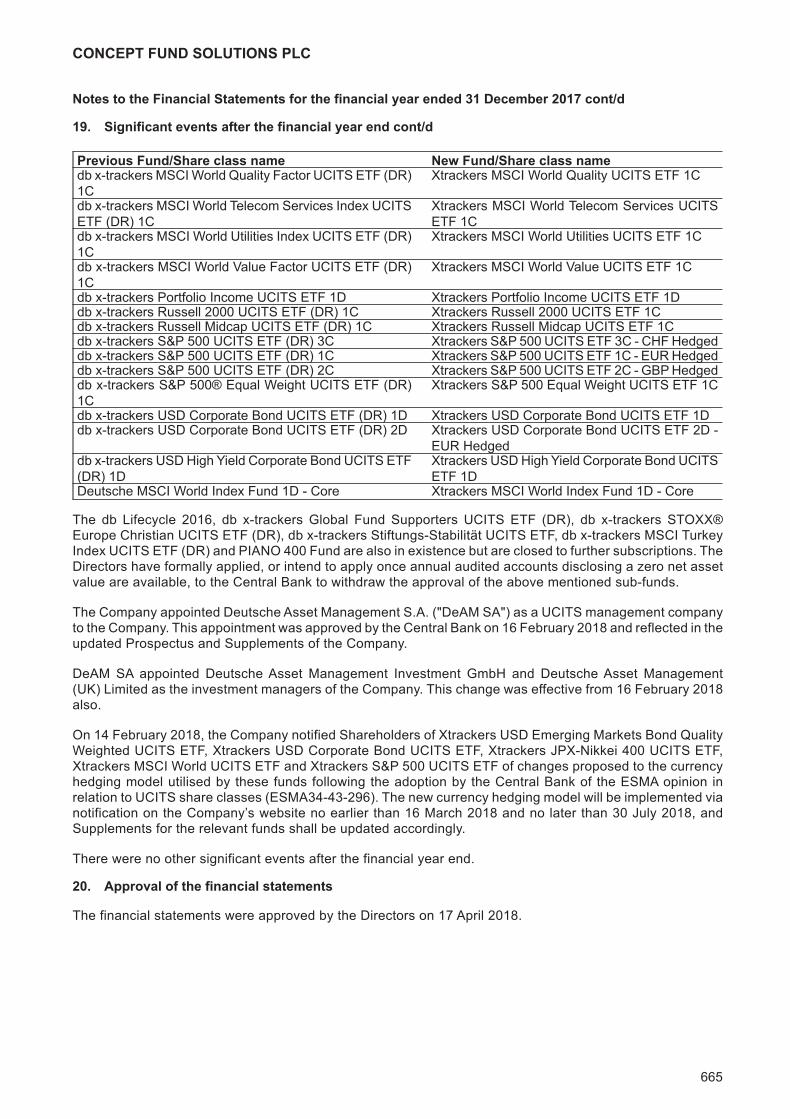
Significant Events After the Financial Year End
For a list of the significant events affecting the Company after the financial year end, please refer to note 19of the financial statements.
Corporate Governance Statement
General PrinciplesThe Company is subject to compliance with the requirements of the Irish Companies Act, the EuropeanCommunities (Undertakings for Collective Investment in Transferable Securities (the "UCITS")) Regulations(S.I. 450 of 2009), as amended (the "Regulations") and the UCITS Regulations and guidance notes, asapplicable to the Company.
The Regulations require the inclusion of a corporate governance statement in the Directors’ Report.
Relevant information on the Company’s governance arrangements for the financial year ended 31 December2017 are set out below and the Company is subject to corporate governance practices imposed by:
(i) The Irish Companies Act which are available for inspection at the registered office of the Company; and mayalso be obtained at http://www.irishstatutebook.ie;
(ii) The Articles of Association of the Company which are available for inspection at the registered office of theCompany at 78 Sir John Rogerson’s Quay, Dublin 2, Ireland and at the Companies Registration Office inIreland; and
(iii) The Central Bank in their UCITS Regulations which can be obtained from the Central Bank’s website at:http://www.centralbank.ie/regulation/industry-sectors/funds/Pages/default.aspx and are available for inspec-tion at the registered office of the Company.
(iv) The Irish Stock Exchange (“ISE”) through the ISE Code of Listing Requirements and Procedures which canbe obtained from the ISE’s website at: http://www.ise.ie.
On 14 December 2011, the Irish Funds Industry Association (“IFIA”), now known as "Irish Funds", issued avoluntary corporate governance code (the “Code”) for Irish authorised collective investment schemes. TheCode became effective from 1 January 2012, with a twelve month transition period until 31 December 2012.On 18 January 2012, the Board of Directors (the “Board”) voluntarily adopted the Code. The Board have fullyadhered to and fulfilled the requirements under the Code.
The Board of Directors did not adopt any further corporate governance codes for the financial year ended31 December 2017.
DIRECTORS’ REPORT FOR THE FINANCIAL YEAR ENDED 31 DECEMBER 2017 CONT/D
Corporate Governance Statement cont/d
General Principles cont/dInternal Control and Risk Management Systems in Relation to Financial ReportingThe Board is responsible for establishing and maintaining adequate internal control and risk managementsystems of the Company in relation to the financial reporting process. Such systems are designed to managerather than eliminate the risk of error or fraud in achieving the Company’s financial reporting objectives andcan only provide reasonable and not absolute assurance against material misstatement or loss.
The Board has procedures in place to ensure that all relevant books of account are properly maintained andare readily available, including production of annual and half yearly financial statements. The Board hasappointed the Administrator to maintain the books and records of the Company. The Administrator isauthorised and regulated by the Central Bank and must comply with the rules imposed by the Central Bank.From time to time, the Board of Directors examines and evaluates the Administrator’s financial accounting andreporting routines. The annual financial statements of the Company are produced by the Administrator andreviewed by the Investment Manager. They are required to be approved by the Board and the annual and halfyearly financial statements of the Company are required to be filed with the Central Bank.
During the period of these financial statements, the Board was responsible for the review and approval of theunaudited half yearly financial statements as set out in the Statement of Directors’ Responsibilities. Thestatutory financial statements are required to be audited by independent auditors who report annually to theBoard on their findings. The Board monitors and evaluates the independent auditor’s performance,qualifications and independence. As part of its review procedures, the Board receives presentations fromrelevant parties including consideration of Irish accounting standards and their impact on the annual financialstatements, and presentations and reports on the audit process. The Board evaluates and discussessignificant accounting and reporting issues as the need arises.
The Company's financial statements will be published electronically on a web site maintained by DeutscheAsset Management (UK) Limited in its capacity as Global Distributor, namely www.xtrackers.com. TheDirectors are responsible for ensuring that the financial statements provided to the Investment Manager forpublication on the website are consistent with the manually signed financial statements. Legislation in theRepublic of Ireland governing the preparation and dissemination of financial statements may differ fromlegislation in other jurisdictions.
Dealings with shareholdersThe convening and conduct of shareholders’ meetings are governed by the Articles of Association of theCompany and the Irish Companies Act. Although the Directors may convene an extraordinary general meetingof the Company at any time, the Directors were required to convene the first annual general meeting of theCompany within eighteen months of incorporation and subsequent annual general meetings within fifteenmonths of the date of the previous annual general meeting thereafter, provided that an annual general meetingis held once in each financial year within six months of the end of each accounting period of the Company.
At least twenty-one clear days’ notice of every annual general meeting and any meeting convened for thepassing of a special resolution must be given to shareholders and fourteen days’ notice must be given in thecase of any other general meeting unless the auditors of the Company and all the shareholders of theCompany entitled to attend and vote agree to shorter notice. Two shareholders present either in person or byproxy constitutes a quorum at a general meeting. The share capital of the Company is divided into differentclasses of shares and the Irish Companies Act and the Articles of Association provide that the quorum for ageneral meeting convened to consider any alteration to the rights attached to any class of shares, is two ormore shareholders present in person or by proxy, holding or representing by proxy at least one third of theissued shares of the relevant class.
Every holder of participating shares or subscriber shares present, in person or by proxy who votes on a showof hands is entitled to one vote. On a poll, every holder of participating shares present, in person or by proxy,is entitled to one vote in respect of each share held by him, and every holder of subscriber shares is entitledto one vote in respect of all subscriber shares held by him. At any general meeting, a resolution put to the voteof the meeting is decided on a show of hands unless, before or upon the declaration of the result of the show
DIRECTORS’ REPORT FOR THE FINANCIAL YEAR ENDED 31 DECEMBER 2017 CONT/D
Corporate Governance Statement cont/d
Dealings with shareholders cont/dof hands, a poll is demanded by the chairman of the general meeting, or by at least two members orshareholders present, in person or by proxy, having the right to vote at such meeting, or any holder or holdersof participating shares present, in person or by proxy, representing at least one tenth of the shares in issuehaving the right to vote at such meeting.
Shareholders may resolve to sanction an ordinary resolution or special resolution at a shareholders’ meeting.Alternatively, a resolution in writing signed by all of the shareholders and holders of non-participating sharesfor the time being entitled to attend and vote on such resolution at a general meeting of the Company, will bevalid and effective for all purposes as if the resolution had been passed at a general meeting of the Companyduly convened and held. An ordinary resolution of the Company (or of the shareholders of a particular fund orclass of shares) requires a simple majority of the votes cast by the shareholders voting, in person or by proxy,at the meeting at which the resolution is proposed. A special resolution of the Company (or of the shareholdersof a particular fund or class of shares) requires a majority of not less than 75% of shareholders present, inperson or by proxy, and voting in general meeting in order to pass a special resolution including a resolutionto amend the Articles of Association.
Board composition and activitiesIn accordance with the Irish Companies Act and the Articles of Association, unless otherwise determined by anordinary resolution of the Company in general meeting, the number of Directors may not be less than two.Details of the current Directors are set out on page 4, under the heading “Directors”.
The business of the Company is managed by the Directors, who exercise all such powers of the Company asare not by the Companies Act or by the Articles of Association of the Company required to be exercised by theCompany in general meeting. The Board is responsible for the Company’s overall direction and strategy andto this end it reserves the decision making power on issues such as the determination of medium and long termgoals, review of managerial performance, organisational structure and capital needs and commitments toachieve the Company’s strategic goals. To achieve these responsibilities, the Board meets on a quarterly basisto review the operations of the Company, address matters of strategic importance and to receive reports fromthe Administrator, Depositary and the Investment Manager.
A Director may, and the Company Secretary on the requisition of a Director will, at any time summon a meetingof the Directors and ad hoc meetings in addition to the four quarterly meetings are convened as required.
Questions arising at any meeting of the Directors are determined by the Chairman. In the case of an equalityof votes, the Chairman of the meeting at which the show of hands takes place or at which the poll is demandedshall be entitled to a second or casting vote. The quorum necessary for the transaction of business at ameeting of the Directors is two.
In December 2012 the Company established an Audit Committee. There were no other sub-committees of theBoard in operation during the financial year or at the financial year end.
Compliance statement
The Directors acknowledge that they are responsible for securing the Company’s compliance with its relevantobligations. These include all requirements of the Company under Section 225 of Irish Companies Act, and alltax law within the Republic of Ireland (the “relevant obligations”).
In keeping with this responsibility, the Directors have:
• drawn up a compliance policy statement setting out the Company’s compliance with the relevant obliga-tions;
• appointed the Investment Manager, and relies on the Investment Manager's risk and compliance depart-ments to implement these procedures and secure material compliance with the relevant obligations; and
• performed a review of this policy statement, and its implementation by the Investment Manager.
CONCEPT FUND SOLUTIONS PLC
19
IUM
Independent auditors' report to the members of Concept Fund Solutions plc
Report on the audit of the financial statements
Opinion
In our opinion, Concept Fund Solutions plc's financial statements:
• give a true and fair view of the Company's and Funds' (as listed on page 6 and 7) assets, liabilities and financial position as at 31 December 2017 and of their results for the year then ended;
• have been properly prepared in accordance with Generally Accepted Accounting Practice in Ireland (accounting standards issued by the Financial Reporting Council of the UK, including Financial Reporting Standard 102 "The Financial Reporting Standard applicable in the UK and Republic of Ireland", and promulgated by the Institute of Chartered Accountants in Ireland and Irish law); and
• have been properly prepared in accordance with the requirements of the Companies Act 2014 and the European Communities (Undertakings for Collective Investment in Transferable Securities) Regulations 2011 (as amended).
We have audited the financial statements, included within the Annual Report, which comprise:
• the Statement of Financial Position as at 31 December 2017;
• the Statement of Comprehensive Income for the year then ended;
• the Statement of Changes in Net Assets Attributable to Holders of Redeemable Participating Shares for the year then ended;
• the Portfolio of Investments for each of the Funds as at 31 December 2017; and
• the notes to the financial statements for the Company and for each of its Funds, which include a description of the significant accounting policies.
Our opinion is consistent with our reporting to the Audit Committee.
Basis for opinion
We conducted our audit in accordance with International Standards on Auditing (Ireland) ("ISAs (Ireland)") and applicable law.
Our responsibilities under ISAs (Ireland) are further described in the Auditors' responsibilities for the audit of the financial statements section of our report. We believe that the audit evidence we have obtained is sufficient and appropriate to provide a basis for our opinion.
Independence
We remained independent of the Company in accordance with the ethical requirements that are relevant to our audit of the financial statements in Ireland, which includes IAASA's Ethical Standard as applicable to listed public interest entities, and we have fulfilled our other ethical responsibilities in accordance with these requirements.
To the best of our knowledge and belief, we declare that non-audit services prohibited by IAASA's Ethical Standard were not provided to the Company.
Other than those disclosed in note 8, we have provided no non-audit services to the Company in the period from 1 January 2017 to 31 December 2017.
PricewaterhouseCoopers, One Spencer Dock, North Wall Quay, Dublin, Ireland T. +353 (0)1 792 6000, www.pwc.ie
I:! PWC
Our audit approach
Overview
Materiality
materiality
) Audit scope
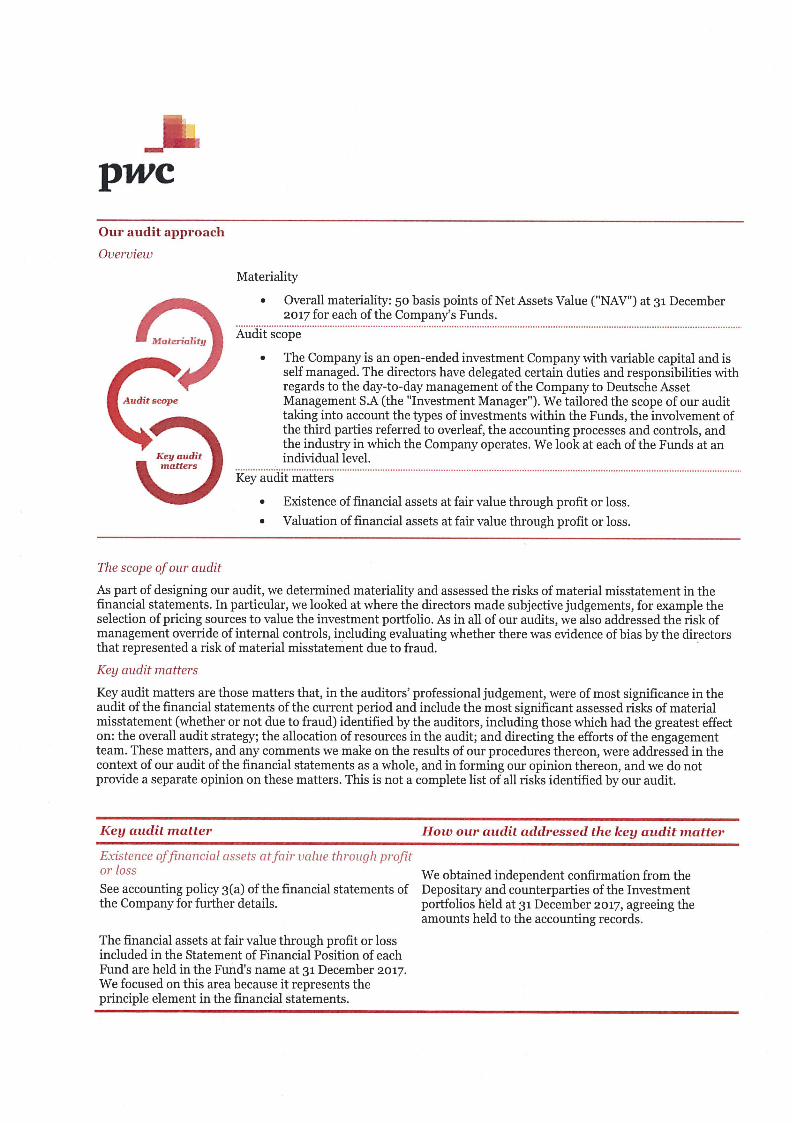
• Overall materiality: 50 basis points of Net Assets Value ("NAy") at 31 December 2017 for each of the Company's Funds.
Mat eruihty
C. The Company is an open-ended investment Company with variable capital and is
self managed. The directors have delegated certain duties and responsibilities with regards to the day-to-day management of the Company to Deutsche Asset
Audit scope Management S.A (the "Investment Manager"). We tailored the scope of our audit
Q taking into account the types of investments within the Funds, the involvement of the third parties referred to overleaf, the accounting processes and controls, and the industry in which the Company operates. We look at each of the Funds at an
Key audit individual level. matters
Key audit matters
Existence of financial assets at fair value through profit or loss.
. Valuation of financial assets at fair value through profit or loss.
The scope of our audit
As part of designing our audit, we determined materiality and assessed the risks of material misstatement in the financial statements. In particular, we looked at where the directors made subjective judgements, for example the selection of pricing sources to value the investment portfolio. As in all of our audits, we also addressed the risk of management override of internal controls, including evaluating whether there was evidence of bias by the directors that represented a risk of material misstatement due to fraud.
Key audit matters
Key audit matters are those matters that, in the auditors' professional judgement, were of most significance in the audit of the financial statements of the current period and include the most significant assessed risks of material misstatement (whether or not due to fraud) identified by the auditors, including those which had the greatest effect on: the overall audit strategy; the allocation of resources in the audit; and directing the efforts of the engagement team. These matters, and any comments we make on the results of our procedures thereon, were addressed in the context of our audit of the financial statements as a whole, and in forming our opinion thereon, and we do not provide a separate opinion on these matters. This is not a complete list of all risks identified by our audit.
Key audit matter How our audit addressed the key audit matter
Existeiue offinaucial assets attair value throucjli profit or loss
See accounting policy 3(a) of the financial statements of the Company for further details.
The financial assets at fair value through profit or loss included in the Statement of Financial Position of each Fund are held in the Fund's name at 31 December 2017. We focused on this area because it represents the principle element in the financial statements.
We obtained independent confirmation from the Depositary and counterparties of the Investment portfolios held at 31 December 2017, agreeing the amounts held to the accounting records.
1! PWC Key audit matter How our audit addressed the key audit matter
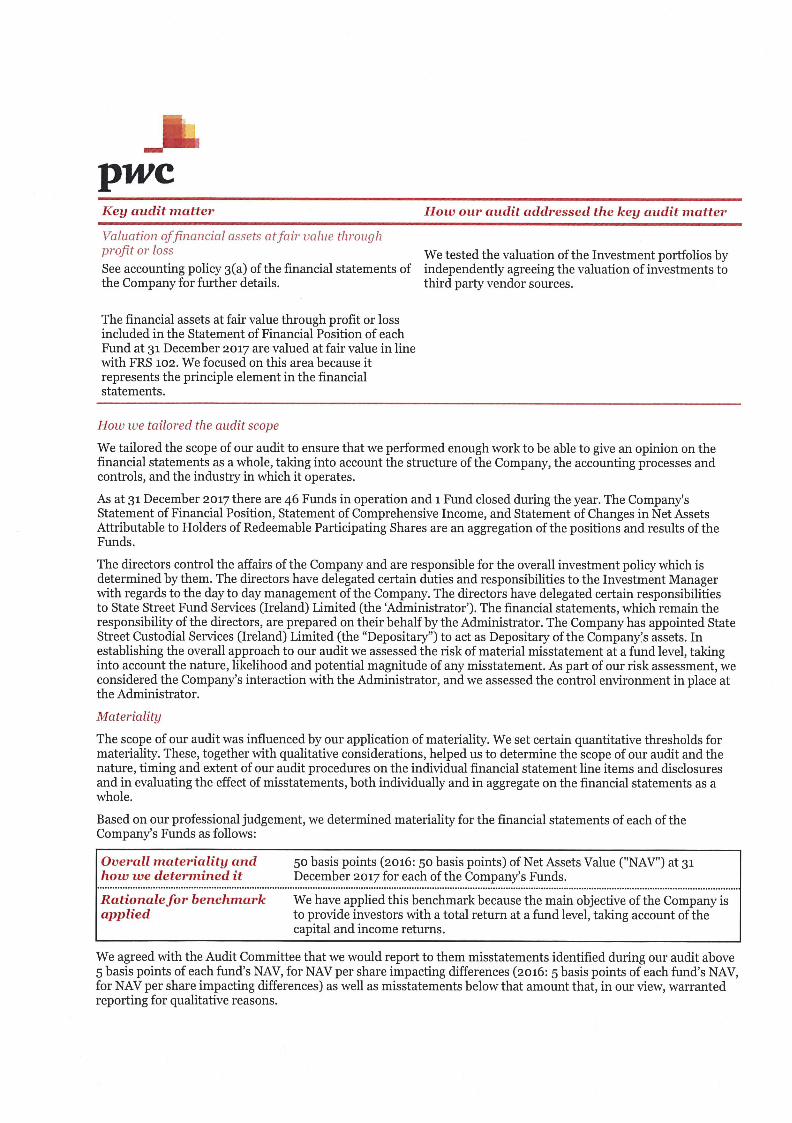
Valuation ottmuuciul (isscts at fan i'ulu(' t/iiuuqli profit or loss
See accounting policy 3(a) of the financial statements of the Company for further details.
The financial assets at fair value through profit or loss included in the Statement of Financial Position of each Fund at 31 December 2017 are valued at fair value in line with FRS 102. We focused on this area because it represents the principle element in the financial statements.
How We tailored the audit scope
We tested the valuation of the Investment portfolios by independently agreeing the valuation of investments to third party vendor sources.
We tailored the scope of our audit to ensure that we performed enough work to be able to give an opinion on the financial statements as a whole, taking into account the structure of the Company, the accounting processes and controls, and the industry in which it operates.
As at 31 December 2017 there are 46 Funds in operation and 1 Fund closed during the year. The Company's Statement of Financial Position, Statement of Comprehensive Income, and Statement of Changes in Net Assets Attributable to Holders of Redeemable Participating Shares are an aggregation of the positions and results of the Funds.
The directors control the affairs of the Company and are responsible for the overall investment policy which is determined by them. The directors have delegated certain duties and responsibilities to the Investment Manager with regards to the day to day management of the Company. The directors have delegated certain responsibilities to State Street Fund Services (Ireland) Limited (the 'Administrator'). The financial statements, which remain the responsibility of the directors, are prepared on their behalf by the Administrator. The Company has appointed State Street Custodial Services (Ireland) Limited (the "Depositary") to act as Depositary of the Company's assets. In establishing the overall approach to our audit we assessed the risk of material misstatement at a fund level, taking into account the nature, likelihood and potential magnitude of any misstatement. As part of our risk assessment, we considered the Company's interaction with the Administrator, and we assessed the control environment in place at the Administrator.
Materiality
The scope of our audit was influenced by our application of materiality. We set certain quantitative thresholds for materiality. These, together with qualitative considerations, helped us to determine the scope of our audit and the nature, timing and extent of our audit procedures on the individual financial statement line items and disclosures and in evaluating the effect of misstatements, both individually and in aggregate on the financial statements as a whole.
Based on our professional judgement, we determined materiality for the financial statements of each of the Company's Funds as follows:
Overall materiality and 50 basis points (2016: 50 basis points) of Net Assets Value ("NAV") at 31 how we determined it December 2017 for each of the Company's Funds.
Rationale for benchmark We have applied this benchmark because the main objective of the Company is applied to provide investors with a total return at a fund level, taking account of the
capital and income returns.
We agreed with the Audit Committee that we would report to them misstatements identified during our audit above 5 basis points of each fund's NAV, for NAV per share impacting differences (2016: 5 basis points of each fund's NAV, for NAV per share impacting differences) as well as misstatements below that amount that, in our view, warranted reporting for qualitative reasons.
PWC Conclusions relating to going concern
We have nothing to report in respect of the following matters in relation to which ISAs (Ireland) require us to report to you where:
• the directors' use of the going concern basis of accounting in the preparation of the financial statements is not appropriate; or
• the directors have not disclosed in the financial statements any identified material uncertainties that may cast significant doubt about the Company's and Funds' ability to continue to adopt the going concern basis of accounting for a period of at least twelve months from the date when the financial statements are authorised for issue.
However, because not all future events or conditions can be predicted, this statement is not a guarantee as to the Company's and Funds' ability to continue as going concerns.
Reporting on other information
The other information comprises all of the information in the Annual Report other than the financial statements and our auditors' report thereon. The directors are responsible for the other information. Our opinion on the financial statements does not cover the other information and, accordingly, we do not express an audit opinion or, except to the extent otherwise explicitly stated in this report, any form of assurance thereon. In connection with our audit of the financial statements, our responsibility is to read the other information and, in doing so, consider whether the other information is materially inconsistent with the financial statements or our knowledge obtained in the audit, or otherwise appears to be materially misstated. If we identify an apparent material inconsistency or material misstatement, we are required to perform procedures to conclude whether there is a material misstatement of the financial statements or a material misstatement of the other information. If, based on the work we have performed, we conclude that there is a material misstatement of this other information, we are required to report that fact. We have nothing to report based on these responsibilities.
With respect to the Directors' Report, we also considered whether the disclosures required by the Companies Act 2014 have been included.
Based on the responsibilities described above and our work undertaken in the course of the audit, ISAs (Ireland) and the Companies Act 2014 require us to also report certain opinions and matters as described below:
Directors' Report
• In our opinion, based on the work undertaken in the course of the audit, the information given in the Directors' Report for the year ended 31 December 2017 is consistent with the financial statements and has been prepared in accordance with applicable legal requirements.
• Based on our knowledge and understanding of the Company and its environment obtained in the course of the audit, we have not identified any material misstatements in the Directors' Report.
Corporate governance sta ternent
• In our opinion, based on the work undertaken in the course of the audit of the financial statements, the description of the main features of the internal control and risk management systems in relation to the financial reporting process included in the Corporate Governance Statement, is consistent with the financial statements and has been prepared in accordance with section 1373(2)(c) of the Companies Act 2014.
• Based on our knowledge and understanding of the Company and its environment obtained in the course of the audit of the financial statements, we have not identified material misstatements in the description of the main features of the internal control and risk management systems in relation to the financial reporting process included in the Corporate Governance Statement.
• In our opinion, based on the work undertaken during the course of the audit of the financial statements, the information required by section 1373(2)(a),(b),(e) and (f) is contained in the Corporate Governance Statement.
Pwe Responsibilities for the financial statements and the audit
Responsibilities of the directors for the financial statements
As explained more fully in the Statement of Directors' Responsibilities set out on page 21, the directors are responsible for the preparation of the financial statements in accordance with the applicable framework and for being satisfied that they give a true and fair view.
The directors are also responsible for such internal control as they determine is necessary to enable the preparation of financial statements that are free from material misstatement, whether due to fraud or error.
In preparing the financial statements, the directors are responsible for assessing the Company's and Funds' ability to continue as going concerns, disclosing as applicable, matters related to going concern and using the going concern basis of accounting unless the directors either intend to liquidate the Company or to cease operations, or have no realistic alternative but to do so.
Auditors' responsibilities for the audit of the fivancial statements
Our objectives are to obtain reasonable assurance about whether the financial statements as a whole are free from material misstatement, whether due to fraud or error, and to issue an auditors' report that includes our opinion. Reasonable assurance is a high level of assurance, but is not a guarantee that an audit conducted in accordance with ISAs (Ireland) will always detect a material misstatement when it exists. Misstatements can arise from fraud or error and are considered material if, individually or in the aggregate, they could reasonably be expected to influence the economic decisions of users taken on the basis of these financial statements.
A further description of our responsibilities for the audit of the financial statements is located on the IAASA website at:
https: // of auditors responsibilitie s for audit.pdf.
This description forms part of our auditors' report.
Use of this report
This report, including the opinions, has been prepared for and only for the Company's members as a body in accordance with section 391 of the Companies Act 2014 and for no other purpose. We do not, in giving these opinions, accept or assume responsibility for any other purpose or to any other person to whom this report is shown or into whose hands it may come save where expressly agreed by our prior consent in writing.
Other required reporting
Companies Act 2014 opinions on other matters
• We have obtained all the information and explanations which we consider necessary for the purposes of our audit.
• In our opinion the accounting records of the Company were sufficient to permit the financial statements to be readily and properly audited.
• The financial statements are in agreement with the accounting records.
Companies Act 2014 exception reporting
Directors' remuneration and transactions
Under the Companies Act 2014 we are required to report to you if, in our opinion, the disclosures of directors' remuneration and transactions specified by sections 305 to 312 of that Act have not been made. We have no exceptions to report arising from this responsibility.
I %Ii Appointment
We were appointed by the directors on 10 June 2014 to audit the financial statements for the year ended 31 December 2014 and subsequent financial periods. The period of total uninterrupted engagement is 4 years, covering the years ended 31 December 2014 to 31 December 2017.
A4k-4a ~~, — Andrew O'Callaghan fi
for and on behalf of PricewaterhouseCoopers Chartered Accountants and Statutory Audit Firm Dublin 17 April 2018
INVESTMENT MANAGER’S REPORT
Equity markets in the fiscal year 2017
Prices up sharply in the equity marketsIn the reporting period, international equity markets saw a significant upswing in prices on the whole, despiteapparent regional differences. This growth was driven by robust economic data and thriving corporate profits withcorporate takeovers further generating widespread momentum. Additional support came from various centralbanks prolonging their expansionary monetary policy, although the trend was set to change in the United Statesthanks to interest rate hikes by the U.S. Federal Reserve. In contrast, the European Central Bank and some of itscounterparts in other countries preserved historically low key interest rates.
Among the key factors influencing markets during the reporting period were political events. For instance,continued uncertainty regarding “Brexit” and the U.K.’s preparations to leave the European Union persisted. Theoutcome of the presidential election 2016 in the U.S., which caught many market participants off-guard, resultedin a sharp, but short uptick in volatility in equity markets. In 2017, however, investors began to focus on expectedpositive effects of government expenditure and tax reductions.
From a global viewpoint, both the equity markets in industrialized countries and emerging markets experienced ahealthy jump in stock prices against this backdrop during the reporting period. Over 2017, developed marketequities across the globe – as measured against the MSCI World index – gained 23.1% in U.S. dollar terms(+8.0% in Euro terms).
European equity market upswingUsing the MSCI Europe index as a benchmark, European equities were up 10.8% on a Euro basis. Theperformance of European equity markets was noticeably better than in previous years, although a variety ofpolitical uncertainties including “Brexit”, possible election successes by populist parties, and concerns aboutItalian banks put a damper on stock market sentiment at times. In addition, the significant appreciation of the Euroagainst the U.S. dollar at the end of the year weighed on stock prices.
At an economic level, promising data out of Europe provided support. The extension of the ECB's bond purchaseprogram, government support for Italian banks and the publication of solid corporate financials also contributed tothe buoyant climate in equity markets across Europe. Later in the reporting period, relief increasingly also camefrom the political world. Political parties critical of the EU were not successful in elections, most voters in theNetherlands and France lending support to pro-European political parties. This development benefited stockmarkets in Southern Europe in particular, as they had suffered disproportionately from the uncertainty. In contrast,political developments in the United Kingdom led to a rather underwhelming result for U.K. equities.
German stocks again profited from the German economy's strong export focus in the reporting period. Economicforecasts coupled with financial results and profit expectations by German companies indicated a stable upwardtrend. Against this background, the equity market in Germany produced a noteworthy gain of 12.5% on a Eurobasis over 2017, measured in terms of the DAX index.
Share price upswing continues in the U.S.In the United States, healthy economic performance helped continue to push up stock prices. The labor marketsituation and consumer sentiment provided further optimism. Moreover, corporate profits, which often exceededforecasts, provided favorable impetus. Growth expectations also picked up, supported by the implementation ofeconomic measures, such as tax reform, by the new U.S. president. At the sector level, individual technologystocks in particular saw substantial share price climbs, whereas growth for companies in less cyclical industriesfell behind, sometimes significantly. Possible additional interest rate hikes by the Fed and concerns about futureU.S. trade and foreign policy were factors causing uncertainty, as was the trend in the U.S. dollar exchange rateand downward pressure from relatively weak energy prices, which continued to be felt in certain industries. Duringthe entire reporting period through the end of December 2017, U.S. stocks gained 21.8% on a U.S. dollar basis(+6.9% in Euro terms) measured against the S&P 500 Index.
Positive climate for Japanese stocksThe Japanese equity market also saw share prices jump sharply over the fiscal year. Material factors driving thisdevelopment were improvement in growth expectations and the positive equity market environment after the U.S.presidential election. Japan's economy again expanded at a moderate pace overall. Also advantageous was theunmistakable decline in the value of the Yen due to the dependence of many Japanese companies on exports.During the reporting period, the Bank of Japan held firm on its expansive monetary policy. Measured against the
CONCEPT FUND SOLUTIONS PLC
29
INVESTMENT MANAGER’S REPORT CONT/D
Positive climate for Japanese stocks cont/d
Nikkei 225 index, Japanese stocks were up 21.3% on a Yen basis over the entire 12-month period. In Euro terms,this gain was only 10.3% due to the weakening Yen.
Ongoing price rally in emerging marketsEmerging market equities continued on last year's positive trajectory, often exceeded last year’s breakoutperformance. The MSCI Emerging Markets index rose by 37.5% in U.S. dollar terms (+20.6% on a Euro basis).Apart from solid economic numbers, factors including improved growth and inflation expectations further drovethe share price trend in emerging equity markets. Investor sentiment was provided a further boost from therelatively modest speed of key interest rate hikes on the part of the U.S. Federal Reserve in conjunction with aweak U.S. dollar, and waning fears of accelerating protectionism. Some concerns still weighed on investorsentiment, however, with political developments, such as those in Brazil and North Korea providing some cautionin the emerging markets as a whole.
Fading of economic concerns in ChinaIn China, the concerns surrounding an accelerated weakening of economic expansion continued to fade into thebackground. Economic data pointed to robust performance by the Chinese economy, despite the pace of growthoverall falling somewhat in recent years. In the reporting period, the positive trend in corporate profits furtherpropelled the rise in Chinese stock prices. With a 32.5% gain in 2017, measured by the CSI 300 index in U.S.dollars terms (+16.3% on a Euro basis), the performance of Chinese equities was very positive and close to theaverage of the Emerging Markets.
Bond markets in the fiscal year 2017
Difficult market environmentThe performance of the international bond markets were characterized by repeated periods of high volatility inthe fiscal year towards the end of 2017. This development was attributable to unease regarding a change ofdirection in interest rates emanating from the United States – in view of negative rates in some industrializedcountries – in addition to soaring debt levels worldwide. Elections in the U.S. and Europe as well as “Brexit”,the pending departure of the United Kingdom from the European Union, gave rise to additional anxiety, as didgeopolitical crises, particularly with respect to North Korea. In contrast, the global economy settled into anincreasingly stable, moderate growth trajectory after previously experiencing weakness.
Turnaround on interest rates after record-low bond yieldsIn the reporting period, the bond markets experienced volatility – although uneven and varying in intensity – butultimately saw rising yields, particularly in the case of government bonds, in tandem with declining prices.Long-term interest rates in the United States (“U.S.”) and the Eurozone were able to break out of their historicallows.
As a result of the financial market crisis, the last decade has seen anemic economic growth and low inflation. Inorder to combat looming deflation, central banks in the industrialized countries had opened the monetaryfloodgates with an extremely relaxed monetary policy featuring zero interest and major bond purchase programs.Bond yields hit new all-time lows in the course of this cash flood.
Yields of the international bond markets continued to rise in 2017, especially in government bonds of industrializedcountries. The ongoing upturn in commodity and energy prices lead market participants to expect that the centralbanks could discontinue their quantitative easing and thereby slow down their extremely expansionary monetarypolicy. The yield increase in US government bonds following the US presidential election, driven by electoralpromises for reductions in corporate taxation, deregulation and increases in public-sector spending, lostmomentum over 2017 due to failures to deliver on these policies. As a result, in the US, Japan and the Eurozonethe uptrend in yields increase weakened markedly in the face of volatility.
On the whole, annual yields on 10-year government bonds increased from 0.21% to 0.43% p.a. in Germany andfrom -0.19% to 0.15% p.a. in Switzerland. In the United States, the 10-year government bond yield changed onlymarginally from 2.44% to 2.41% p.a. in the past year 2017, similarly, the yield in Japan remained unchanged at0.06% p.a.
CONCEPT FUND SOLUTIONS PLC
30
INVESTMENT MANAGER’S REPORT CONT/D
Turnaround on interest rates after record-low bond yields cont/d
In the meantime, the approaches taken by the central banks in the U.S. and the Eurozone continued to diverge.Whereas the U.S. Federal Reserve (“Fed”) again hiked the key interest rate three times during the reporting periodby three-quarters of a percentage point to a corridor between 1.25% – 1.50% p.a., the European Central Bank(“ECB”) remained true to its zero-interest policy. The Fed justified its interest rate increases by citing a robusteconomy and full employment in the U.S. labor market. The Bank of Japan in turn kept its key interest rate at-0.10% p.a.
In view of the low-interest environment still prevailing during the reporting period, only higher-risk interest-bearingsecurities such as corporate bonds with investment-grade status, high-yield bonds and emerging market bondsoffered opportunities of producing positive returns. After an initial rise in yields, these interest-bearing securitiessaw yields slide considerably from the beginning of the year through the end of 2017, and prices increase,sometimes sharply. Above all, high-yield and emerging market bonds outperformed government bonds issued byindustrial countries. This trend was supported by factors including greater interest from investors seeking positiveor higher returns. At the same time, concern grew on the investor side that central banks would distort bondmarkets with their expanded quantitative easing, and therefore the very low yields would no longer adequatelyreflect the risks. Ultimately, the bond purchase programs conducted over the past 10 years by central banks likethe Fed, the ECB, the Bank of England and the Bank of Japan led to sharply lower yields overall not only forgovernment bonds, but also corporate bonds, extending all the way to negative yields on some investment-gradecorporate bonds at times. In addition to heightened investor interest, emerging market bonds benefited from thenoticeable price rally and ongoing normalization in the commodity markets.
Strong euro and weak dollarCurrency market performance was a roller coaster ride this past fiscal year. Whereas the U.S. dollar devaluedover the year against the main hard currencies amidst high levels of volatility, the Euro, was able to gainconsiderable strength against many currencies in the past twelve months. On the whole, the European commoncurrency gained 14.1% (on a U.S. dollar basis) against the greenback during the reporting period. Currencyfluctuations stemmed less from interest rate differences or economic data, but instead were dominated by politicalevents. For one, the U.S. president has to date, been unable to fulfill expectations of delivering on fiscal stimuli.Secondly, the new president of France has vigorously defended a unified Europe. Moreover, the Eurozone'seconomic stability also improved since the beginning of 2017.
Past PerformancePlease note, following a review of past performance data in the financial statements, we have identified isolatedinstances where there were misstatements in relation to the Funds’ performance for years 2016 and 2015. Detailsof these misstatements are set out in the tables below.
Impacted Performance Year: 2016Misstated
PerformanceActual Performance Tracking Difference
Former Share Class Name Share Class NameShare
Class NetIndex
ShareClass Net
Index Misstated Actual
db x-trackers US CorporateBond UCITS ETF (DR) - 1D
Xtrackers USD CorporateBond UCITS ETF - 1D
6.17% 6.63% 6.53% 6.98% -0.46% -0.45%
db x-trackers iBoxxEurozone SovereignsQuality Weighted UCITSETF (DR) - 1D
Xtrackers EurozoneGovernment Bond QualityWeighted UCITS ETF - 1D
3.42% 3.67% 3.17% 3.42% Nomisstate-
ment
-0.25%
db x-trackers EUR LiquidCorporate 12.5 UCITS ETF -1C
Xtrackers EUR Credit 12.5Swap UCITS ETF - 1C
9.68% 9.68% 9.29% 9.68% 0.00% -0.38%
db x-trackers MSCI GulfStates Investable IndexUCITS ETF - 1C
Xtrackers MSCI GCC SelectSwap UCITS ETF - 1C
8.69% 9.27% 7.99% 9.27% -0.58% -1.29%
CONCEPT FUND SOLUTIONS PLC
31
INVESTMENT MANAGER’S REPORT CONT/D
Past Performance cont/d
Impacted Performance Year: 2015Misstated
PerformanceActual Performance Tracking Difference
Former Share Class Name Share Class NameShare
Class NetIndex
ShareClass Net
Index Misstated Actual
db x-trackers FTSEDeveloped Europe ex UKProperty UCITS ETF (DR) -1C
Xtrackers FTSE DevelopedEurope ex UK Real EstateUCITS ETF - 1C
18.92% 18.65% 18.82% 18.55% Nomisstate-
ment
0.27%
db x-trackers S&P 500Equal Weight UCITS ETF(DR) - 1C
Xtrackers S&P 500 EqualWeight UCITS ETF - 1C
-5.25% -5.26% -2.75% -2.80% 0.01% 0.05%
db x-trackers MSCI WorldMomentum Factor UCITSETF (DR) - 1C
Xtrackers MSCI WorldMomentum UCITS ETF - 1C
5.17% 5.13% 0.93% 0.97% 0.04% -0.04%
db x-trackers MSCI WorldQuality Factor UCITS ETF(DR) - 1C
Xtrackers MSCI WorldQuality UCITS ETF - 1C
2.93% 2.92% -1.52% -1.59% 0.01% 0.07%
The nature of these misstatements is such that they had no impact on the calculation and publication of the netasset value of the Funds or the overall financial statements for the periods.
Deutsche Asset Management S.A.
CONCEPT FUND SOLUTIONS PLC
32
PIANO 400 Fund
Investment Manager’s Report for the financial year ended 31 December 2017
Investment Objective
The Fund’s investment objective is to gain exposure to the Underlying Asset through the use of DerivativeContracts. The Underlying Asset is a notional portfolio of assets selected by the Strategy Agent. The purposeof the Strategy is to achieve the investment objective of the Fund and in particular, aim to ensure that aShareholder receives a minimum Repurchase Price at the Final Repurchase Date equal to the PrincipalProtection Amount.
Fund Performance
The PIANO 400 Fund was launched on 30th November 2007. The NAV per share of each class at launch was100 (in the relevant currency).
Over the period since inception, the Net Asset Value per share rose to a high of EUR 108.253, as at 22ndJanuary 2008.
The fund subsequently paid a special dividend on 29th June 2012 and the Net Asset Value per Share was resetat 100. The fund was again reset to pay a dividend to a price of 100 as of 31st March 2014. A dividend has alsobeen paid as of 30th June 2015 and 2nd July 2015 reducing the NAV by 3.4046 and 0.96261 respectively.
There were no dividends paid on the Fund during the financial year ended 31 December 2017.
The PIANO 400 Fund was terminated 18 August 2017. The Fund Performance data disclosed below coversthe period from 1 January 2017 to 18 August 2017, date of termination.
Total Net Assets Net Assets per Share18/08/2017 Price (at 18/08/2017)
PIANO 400 Fund Nil Nil
Year to Date Year to DateFund Return Index Return*
PIANO 400 Fund (0.08)% N/A
The fund did not track an index.
CONCEPT FUND SOLUTIONS PLC
33
db x-trackers EUR Liquid Corporate 12.5 UCITS ETF
Investment Manager’s Report for the financial year ended 31 December 2017
Investment Objective
The investment objective of the Fund is to track the performance before fees and expenses of the UnderlyingAsset, which is the db x-trackers EUR Liquid Corporate 12.5 Index Fund (DBECDR) (the “Index”). The Indexis intended to create a liquid and diversified investment alternative to a portfolio of Euro denominated andlongdated corporate bonds.
In order to achieve the investment objective, the Fund will adopt an Indirect Investment Policy. In order toachieve the investment objective, the Fund may invest in transferable securities (the “Invested Assets”) and/oruse index swap agreements (the “Swap“). The purpose of the Swap is to exchange the performance and/orincome of the Invested Assets against the performance of the Index.
Invested Assets that the Fund will invest in include (i) bonds with investment grade or equivalent long-termcredit ratings issued by (a) sovereign states that are OECD Member States and/or supranationalorganisations/entities and/or (b) financial institutions or corporates and/or (ii) in units of exchange traded funds(“ETFs”) and/or UCITS and/or other collective investment undertakings. The Fund may invest in ancillaryliquid assets which will include secured and/or unsecured cash deposits.
Fund Performance
The Fund’s performance amounts are calculated net of fees and taxes.
The Fund performed in line with its benchmark and within guided tolerance levels.
The Fund has tracked the Index within its anticipated tracking error. The anticipated tracking error for bothshare classes of the Fund is 1.00%.
Total Net Assets Net Assets per Share31/12/2017 Price (at 31/12/2017)
db x-trackers EUR Liquid Corporate 12.5 UCITS ETF €291,205,633 €269.16
Year to Date Year to DateFund Return Index Return
db x-trackers EUR Liquid Corporate 12.5 UCITS ETF 5.17% 5.54%
Year to Date Year to DateTracking Error Tracking Difference1
db x-trackers EUR Liquid Corporate 12.5 UCITS ETF 0.01% (0.37)%
1The performance difference of the share class arose from various reasons such as various fee components like management fee, fixedfee and transaction costs, specific taxes respectively tax advantages, as well as positive or negative swap adjustments. The realisedtracking error level is contrasted with the anticipated tracking error level; the level of realised tracking error was within the expected range,due to the effectiveness of replication techniques utilised over the 2017 period.
CONCEPT FUND SOLUTIONS PLC
34
db x-trackers EUR Liquid Corporate 12.5 UCITS ETF
Portfolio of Investments as at 31 December 2017
Transferable Securities
Government Bonds - 100.57% (31 December 2016 - 98.23%)
Total Financial Derivative Instruments (1,617,243) (0.56)
Total Financial Assets at Fair Value through Profit or Loss 291,243,691 100.01Other Net Liabilities - (0.01)% (31 December 2016 - 0.42%) (38,058) (0.01)
Net Assets Attributable to Redeeming Participating Shareholders 291,205,633 100.00
* The counterparty for the Liquid Corporate Swap is Deutsche Bank AG London, the Index is the db-x EUR Liquid Corporate 12.5 Index.
Analysis of Total Assets % of Total Assets31/12/2017
Transferable securities admitted to an official stock exchange listing and transferable securities dealtin another regulated market 50.13OTC Financial Derivative Instruments 49.86Current Assets 0.01Total Assets 100.00
CONCEPT FUND SOLUTIONS PLC
36
db x-trackers Portfolio Income UCITS ETF
Investment Manager’s Report for the financial year ended 31 December 2017
Investment Objective
The investment objective of the Fund is to replicate the performance before fees and expenses of the PortfolioIncome Strategy (the “Strategy”).The Strategy is a balanced and diversified portfolio of exchange-traded funds(“ETFs”) linked to equities, fixed income, commodities and alternative investments.
In order to achieve the investment objective, the Fund will adopt a Direct Investment Policy. In order to seekto achieve its investment objective, the Fund will invest in ETFs that comprise all or a representation of all ofthe ETFs in the Strategy as may be proposed by the Allocation Agent, which the Investment Manager mayaccept, reject or amend in its sole discretion in consultation with the Allocation Agent. Accordingly theInvestment Manager retains discretion in respect of the Strategy and the appointment of the Allocation Agentis in an investment advisory capacity. The Fund may invest in ancillary liquid assets which will include securedand/or unsecured cash deposits.
Fund Performance
The Fund’s performance amounts are calculated net of fees and taxes.
The Fund performed in line with the Strategy and within guided tolerance levels.
Total Net Assets Net Assets per Share31/12/2017 Price (at 31/12/2017)
db x-trackers Portfolio Income UCITS ETF €29,518,371 €11.79
Year to Date Year to Date
Fund Return Underlying AssetReturn
db x-trackers Portfolio Income UCITS ETF 2.47% N/A*
*The Fund does not track a benchmark.
CONCEPT FUND SOLUTIONS PLC
37
db x-trackers Portfolio Income UCITS ETF
Portfolio of Investments as at 31 December 2017
Transferable Securities
Exchange Traded Funds - 99.98% (31 December 2016 - 100.03%)
Number ofShares Security
ValueEUR
% ofFund
254,141 db x-trackers iBoxx EUR Corporates Yield Plus UCITS ETF (DR) 4,113,552 13.94209,117 db x-trackers iBoxx USD Emerging Sovereigns Quality Weighted UCITS
ETF (DR) 2,351,800 7.9730,814 db x-trackers II EUR Corporate Bond UCITS ETF (DR) 4,699,967 15.928,071 db x-trackers II Eurozone Inflation-Linked Bond UCITS ETF (DR) 1,760,237 5.9612,044 db x-trackers II iBoxx Germany Covered UCITS ETF 2,351,296 7.9714,237 db x-trackers II iBoxx Sovereigns Eurozone Yield Plus UCITS ETF 2,338,477 7.9230,226 db x-trackers MSCI Emerging Markets Index UCITS ETF (DR) 1,206,986 4.0927,514 db x-trackers MSCI Europe Small Cap Index UCITS ETF (DR) 1,205,448 4.0820,638 db x-trackers MSCI World Quality Factor UCITS ETF (DR) 593,375 2.0121,729 db x-trackers MSCI World Value Factor UCITS ETF (DR) 596,064 2.023,309 db x-trackers Russell 2000 UCITS ETF (DR) 587,578 1.9952,142 db x-trackers Stoxx Europe 600 UCITS ETF (DR) 4,157,177 14.0820,312 db x-trackers Stoxx Global Select Dividend 100 UCITS ETF 597,565 2.02235,332 db x-trackers USD Corporate Bond UCITS ETF (DR) 2,953,898 10.01Total Exchange Traded Funds 29,513,420 99.98Total Transferable Securities 29,513,420 99.98
Total Financial Assets at Fair Value through Profit or Loss 29,513,420 99.98Other Net Assets - 0.02% (31 December 2016 - (0.03)%) 4,951 0.02
Net Assets Attributable to Redeeming Participating Shareholders 29,518,371 100.00
Analysis of Total Assets % of Total Assets31/12/2017
Investment Manager’s Report for the financial year ended 31 December 2017
Investment Objective
The investment objective of the Fund is to track the performance before fees and expenses of the UnderlyingAsset, which is the MSCI Nordic Total Return Net Index (the “Reference Index”). The Reference Index isdesigned to reflect the equity market performance of the Nordic countries.
The Reference Index is calculated and maintained by MSCI Inc (and its subsidiaries). The Reference Index isa free float-adjusted market capitalisation weighted index that is designed to measure the large and mediumcapitalisation equity market performance of the Nordic countries. As of March 2013, the Reference Indexconsists of the following 4 developed country indices: Denmark, Finland, Norway and Sweden.
The Reference Index is calculated in Euro on an end-of-day basis. Changes to the Reference Index are madeduring the Semi-annual Index Reviews in May and November and the Quarterly Index Reviews in Februaryand August.
The Reference Index may also be re-balanced at other times in order to reflect corporate activity such asmergers and acquisitions. To achieve the aim, the Fund will attempt to replicate the Index by buying all (or, onan exceptional basis, a substantial number of) the shares in the Index in the same proportion as the Index asdetermined by the Investment Manager.
Fund Performance
The Fund’s performance amounts are calculated net of fees and taxes.
The Fund performed in line with its benchmark and within guided tolerance levels.
The Fund has tracked the Reference Index within its anticipated tracking error. The anticipated tracking errorfor the Fund is 1.00%.
Total Net Assets Net Assets per Share31/12/2017 Price (at 31/12/2017)
db x-trackers MSCI Nordic Index UCITS ETF (DR) €283,708,091 €34.48
Year to Date Year to DateFund Return Index Return
db x-trackers MSCI Nordic Index UCITS ETF (DR) 10.91% 10.32%
Year to Date Year to DateTracking Error Tracking Difference1
db x-trackers MSCI Nordic Index UCITS ETF (DR) 0.19% 0.59%
1The performance difference of the share class arose from various reasons such as inaccuracies in the index replication via optimization,various fee components like management fee, fixed fee and transaction costs, specific taxes respectively tax advantages. The realisedtracking error level is contrasted with the anticipated tracking error level; the level of realised tracking error was within the expected range,due to the effectiveness of replication techniques utilised over the 2017 period.
CONCEPT FUND SOLUTIONS PLC
39
db x-trackers MSCI Nordic Index UCITS ETF (DR)
Portfolio of Investments as at 31 December 2017
Transferable Securities
Equities - 99.91% (31 December 2016 - 99.84%)
Number ofShares Security
ValueEUR
% ofFund
Agriculture67,315 Swedish Match 2,212,897 0.78
2,212,897 0.78
Auto Components43,143 Nokian Renkaat 1,630,805 0.58
1,630,805 0.58
Automobiles577,331 Volvo 8,966,890 3.16
8,966,890 3.16
Banks277,628 Danske Bank 9,008,858 3.17362,012 DNB 5,606,123 1.981,125,144 Nordea Bank 11,364,106 4.01562,680 Skandinaviska Enskilda Banken 5,511,448 1.94565,674 Svenska Handelsbanken 6,455,606 2.28335,457 Swedbank 6,752,438 2.38
44,698,579 15.76
Beverages39,630 Carlsberg 3,965,426 1.40
3,965,426 1.40
Biotechnology21,524 Genmab 2,974,732 1.0525,788 H Lundbeck 1,091,033 0.38
4,065,765 1.43
Chemicals83,751 Novozymes 3,987,638 1.4065,756 Yara International 2,521,979 0.89
6,509,617 2.29
Commercial Services and Supplies61,879 ISS 1,997,131 0.70115,925 Securitas 1,688,488 0.60
3,685,619 1.30
Construction and Engineering125,931 Skanska 2,177,507 0.77
2,177,507 0.77
Diversified Financials168,706 Investor 6,419,426 2.2686,745 Kinnevik 2,446,652 0.8614,027 L E Lundbergforetagen 874,587 0.31
9,740,665 3.43
Diversified Telecommunications52,672 Elisa 1,723,428 0.6124,490 Millicom International Cellular 1,379,992 0.492,161,857 Nokia 8,418,271 2.97300,635 TDC 1,539,628 0.54133,905 Tele2 1,372,888 0.481,138,074 Telefonaktiebolaget LM Ericsson 6,233,531 2.20278,077 Telenor 4,980,138 1.75
CONCEPT FUND SOLUTIONS PLC
40
db x-trackers MSCI Nordic Index UCITS ETF (DR)
Portfolio of Investments as at 31 December 2017 cont/d
Equities - 99.91% (31 December 2016 - 99.84%) cont/d
Health Care Equipment and Supplies4 Arjo 10 0.0044,005 Coloplast 2,916,747 1.0384,512 Getinge 1,022,924 0.3643,033 William Demant Holding 1,002,791 0.35
SEK OMXS30 Index FuturesLong Futures Contracts 228,691 19/01/2018 (4,520) 0.00
Net unrealised loss on open futures contracts (4,520) 0.00Total Exchange Traded Financial Derivative Instruments (4,520) 0.00
Total Financial Derivative Instruments (4,520) 0.00
CONCEPT FUND SOLUTIONS PLC
42
db x-trackers MSCI Nordic Index UCITS ETF (DR)
Portfolio of Investments as at 31 December 2017 cont/dValueEUR
% ofFund
Total Financial Assets at Fair Value through Profit or Loss 283,450,402 99.91Other Net Assets - 0.09% (31 December 2016 - 0.16%) 257,689 0.09
Net Assets Attributable to Redeeming Participating Shareholders 283,708,091 100.00
* The broker for the open futures contracts is Deutsche Bank AG Frankfurt.
Analysis of Total Assets % of Total Assets31/12/2017
Transferable securities admitted to an official stock exchange listing 99.88Current Assets 0.12Total Assets 100.00
CONCEPT FUND SOLUTIONS PLC
43
db x-trackers Mittelstand & MidCap Germany UCITS ETF (DR)
Investment Manager’s Report for the financial year ended 31 December 2017
Investment Objective
The investment objective of the Fund is to track the performance before fees and expenses of the UnderlyingAsset, which is the Solactive Mittelstand & MidCap Deutschland Index (the “Reference Index”). The ReferenceIndex is designed to reflect the performance of companies incorporated in Germany with a primary listing onXetra, which rank from 31 to 100 (in descending order).
The Reference Index is calculated and maintained by Solactive AG. The Reference Index is weighted basedon free float market capitalisation reflecting the performance of companies incorporated in Germany with aprimary listing on Xetra that rank from 31 to 100 based on their free float market capitalisation. This means thatthe 100 largest companies by Free Float Market Capitalisation are ranked in descending order, i.e. thecompany ranked 1st has a higher Free Float Market Capitalisation than the company ranked 2nd and onlythose ranked from 31 to 100 are included.
The Reference Index excludes companies from the banking, insurance and diversified financials (i.e. financialservices, consumer finance and capital markets) sectors and is calculated in Euro.
Fund Performance
The Fund’s performance amounts are calculated net of fees and taxes.
The Fund performed in line with its benchmark and within guided tolerance levels.
The Fund has tracked the Reference Index within its anticipated tracking error. The anticipated tracking errorfor the Fund is 1.00%.
Total Net Assets Net Assets per Share31/12/2017 Price (at 31/12/2017)
db x-trackers Mittelstand & MidCap Germany UCITS ETF(DR) €94,952,106 €25.52
Year to Date Year to DateFund Return Index Return
db x-trackers Mittelstand & MidCap Germany UCITS ETF(DR) 30.99% 31.01%
Year to Date Year to DateTracking Error Tracking Difference1
db x-trackers Mittelstand & MidCap Germany UCITS ETF(DR) 0.08% (0.02)%
1The performance difference of the share class arose from various reasons such as inaccuracies in the index replication via optimization,various fee components like management fee, fixed fee and transaction costs, specific taxes respectively tax advantages. The realisedtracking error level is contrasted with the anticipated tracking error level; the level of realised tracking error was within the expected range,due to the effectiveness of replication techniques utilised over the 2017 period.
CONCEPT FUND SOLUTIONS PLC
44
db x-trackers Mittelstand & MidCap Germany UCITS ETF (DR)
Portfolio of Investments as at 31 December 2017
Transferable Securities
Equities - 92.65% (31 December 2016 - 91.85%)
Number ofShares Security
ValueEUR
% ofFund
Aerospace and Defense24,803 MTU Aero Engines 3,705,568 3.90
3,705,568 3.90
Auto Components4,864 Grammer 252,198 0.2730,628 Hella & Co 1,579,486 1.6619,946 Rheinmetall 2,111,284 2.22
EUR Mini DAX Index FuturesLong Futures Contracts 130,825 16/03/2018 (180) 0.00
Net unrealised loss on open futures contracts (180) 0.00Total Exchange Traded Financial Derivative Instruments (180) 0.00
Total Financial Derivative Instruments (180) 0.00
ValueEUR
% ofFund
Total Financial Assets at Fair Value through Profit or Loss 94,819,559 99.86Other Net Assets - 0.14% (31 December 2016 - 0.27%) 132,547 0.14
Net Assets Attributable to Redeeming Participating Shareholders 94,952,106 100.00
* The broker for the open futures contracts is Deutsche Bank AG Frankfurt.
Analysis of Total Assets % of Total Assets31/12/2017
Transferable securities admitted to an official stock exchange listing 99.83Current Assets 0.17Total Assets 100.00
CONCEPT FUND SOLUTIONS PLC
48
db x-trackers MSCI North America High Dividend Yield Index UCITS ETF (DR)
Investment Manager’s Report for the financial year ended 31 December 2017
Investment Objective
The investment objective of the Fund is to track the performance before fees and expenses of the UnderlyingAsset, which is the MSCI North America High Dividend Yield Index (the “Reference Index”). The ReferenceIndex is based on the MSCI North America Index (its “Parent Index”) and comprises certain companies fromthe USA and Canada that are included in the Parent Index and offer a higher than average dividend yield.
The Reference Index is based on the Parent Index, which is calculated and maintained by MSCI Inc. TheParent Index includes large and medium capitalisation companies and aims to include 85% of the cumulativefree float market capitalisation of the USA and Canada.
The Reference Index includes only securities that offer a higher than average dividend yield relative to theParent Index and that pass dividend sustainability screens:
• Securities included in the Reference Index must have a dividend yield which is at least 30% higher thanthe dividend yield of the Parent Index; and
• Securities included in the Reference Index must have sustainable dividend yields, meaning that securitiesare not considered for inclusion if they have a dividend payout that is either (i) extremely high (defined tobe the top 5% of securities within the universe of securities with positive payout), (ii) zero or (iii) negative,and therefore future dividend payments might be in jeopardy.
The Reference Index is calculated in US Dollars on an end-of-day basis.
Fund Performance
The Fund’s performance amounts are calculated net of fees and taxes.
The Fund performed in line with its benchmark and within guided tolerance levels.
The Fund has tracked the Reference Index within its anticipated tracking error. The anticipated tracking errorfor the Fund is 1.00%.
Total Net Assets Net Assets per Share31/12/2017 Price (at 31/12/2017)
db x-trackers MSCI North America High Dividend YieldIndex UCITS ETF (DR) $157,645,781 $33.77
Year to Date Year to DateFund Return Index Return
db x-trackers MSCI North America High Dividend YieldIndex UCITS ETF (DR) 18.84% 18.77%
Year to Date Year to DateTracking Error Tracking Difference1
db x-trackers MSCI North America High Dividend YieldIndex UCITS ETF (DR) 0.05% 0.08%
1The performance difference of the share class arose from various reasons such as inaccuracies in the index replication via optimization,various fee components like management fee, fixed fee and transaction costs, specific taxes respectively tax advantages. The realisedtracking error level is contrasted with the anticipated tracking error level; the level of realised tracking error was within the expected range,due to the effectiveness of replication techniques utilised over the 2017 period.
CONCEPT FUND SOLUTIONS PLC
49
db x-trackers MSCI North America High Dividend Yield Index UCITS ETF (DR)
Portfolio of Investments as at 31 December 2017
Transferable Securities
Equities - 99.78% (31 December 2016 - 99.77%)
Number ofShares Security
ValueUSD
% ofFund
Aerospace and Defense11,916 Boeing 3,514,147 2.235,494 Lockheed Martin 1,763,849 1.12
5,277,996 3.35
Agriculture40,725 Altria Group 2,908,172 1.8511,923 Archer-Daniels-Midland 477,874 0.3032,945 Philip Morris International 3,480,639 2.21
6,866,685 4.36
Automobiles27,797 General Motors 1,139,399 0.72
1,139,399 0.72
Banks13,749 Bank of Montreal 1,103,805 0.7025,392 Bank of Nova Scotia 1,643,960 1.0417,128 BB&T 851,604 0.549,242 Canadian Imperial Bank of Commerce 903,879 0.577,303 People's United Financial 136,566 0.0930,878 Royal Bank of Canada 2,529,731 1.6010,172 SunTrust Banks 657,009 0.42
7,826,554 4.96
Beverages85,940 Coca-Cola 3,942,927 2.503,852 Dr Pepper Snapple Group 373,875 0.2430,236 PepsiCo 3,625,901 2.30
Electric Utilities4,931 Alliant Energy 210,110 0.135,143 Ameren 303,386 0.1910,425 American Electric Power 766,967 0.496,567 Consolidated Edison 557,867 0.353,802 DTE Energy 416,167 0.2614,835 Duke Energy 1,247,772 0.796,906 Edison International 436,735 0.286,716 Eversource Energy 424,317 0.278,857 Fortis 325,948 0.216,310 Hydro One 112,809 0.079,945 NextEra Energy 1,553,309 0.984,233 OGE Energy 139,308 0.0910,869 PG&E 487,257 0.312,366 Pinnacle West Capital 201,536 0.1314,537 PPL 449,920 0.2910,722 Public Service Enterprise Group 552,183 0.356,689 WEC Energy Group 444,350 0.283,012 Westar Energy 159,034 0.1010,762 Xcel Energy 517,760 0.33
9,306,735 5.90
Electrical Equipment13,565 Emerson Electric 945,345 0.60
945,345 0.60
Electronics2,586 Garmin 154,048 0.10
154,048 0.10
CONCEPT FUND SOLUTIONS PLC
51
db x-trackers MSCI North America High Dividend Yield Index UCITS ETF (DR)
Portfolio of Investments as at 31 December 2017 cont/d
Equities - 99.78% (31 December 2016 - 99.77%) cont/d
Number ofShares Security
ValueUSD
% ofFund
Food Products3,854 Campbell Soup 185,416 0.1212,232 General Mills 725,236 0.462,404 JM Smucker 298,673 0.195,486 Kellogg 372,938 0.2310,629 Sysco 645,499 0.41
2,227,762 1.41
Gas Utilities2,703 Canadian Utilities 80,705 0.055,056 Sempra Energy 540,587 0.34
621,292 0.39
Hotels, Restaurants and Leisure8,386 Las Vegas Sands 582,743 0.372,179 Wyndham Worldwide 252,481 0.16
USD S&P 500 E Mini Index FuturesLong Futures Contracts 264,215 16/03/2018 3,385 0.00
Net unrealised gain on open futures contracts 3,385 0.00Total Exchange Traded Financial Derivative Instruments 3,385 0.00
Total Financial Derivative Instruments 3,385 0.00
ValueUSD
% ofFund
Total Financial Assets at Fair Value through Profit or Loss 157,292,787 99.78Other Net Assets - 0.22% (31 December 2016 - 0.23%) 352,994 0.22
Net Assets Attributable to Redeeming Participating Shareholders 157,645,781 100.00
* The broker for the open futures contracts is Deutsche Bank AG Frankfurt.
Analysis of Total Assets % of Total Assets31/12/2017
Transferable securities admitted to an official stock exchange listing 99.74Current Assets 0.26Total Assets 100.00
CONCEPT FUND SOLUTIONS PLC
54
db x-trackers MSCI AC World Index UCITS ETF (DR)
Investment Manager’s Report for the financial year ended 31 December 2017
Investment Objective
The investment objective of the Fund is to track the performance before fees and expenses of the UnderlyingAsset, which is the MSCI ACWI EUR Index (the “Reference Index”). The Reference Index includes large andmid cap stocks across 24 Developed Markets and 21 Emerging Markets countries.
The Reference Index is calculated and maintained by MSCI Inc (and its subsidiaries). The Reference Indexincludes large and medium capitalisation stocks across developed market and emerging market countries. Asof 28 June 2013, the Reference Index includes representation across 24 developed markets and 21 emergingmarket countries, and contains 2,424 constituents.
The Reference Index is calculated in Euro on an end-of-day basis.
Fund Performance
The Fund’s performance amounts are calculated net of fees and taxes.
The Fund performed in line with its benchmark and within guided tolerance levels.
The Fund has tracked the Reference Index within its anticipated tracking error. The anticipated tracking errorfor the Fund is 1.00%.
Total Net Assets Net Assets per Share31/12/2017 Price (at 31/12/2017)
db x-trackers MSCI AC World Index UCITS ETF (DR) €188,650,524 €18.96
Year to Date Year to DateFund Return Index Return
db x-trackers MSCI AC World Index UCITS ETF (DR) 8.76% 8.89%
Year to Date Year to DateTracking Error Tracking Difference1
db x-trackers MSCI AC World Index UCITS ETF (DR) 0.17% (0.13)%
1The performance difference of the share class arose from various reasons such as inaccuracies in the index replication via optimization,various fee components like management fee, fixed fee and transaction costs, specific taxes respectively tax advantages. The realisedtracking error level is contrasted with the anticipated tracking error level; the level of realised tracking error was within the expected range,due to the effectiveness of replication techniques utilised over the 2017 period.
CONCEPT FUND SOLUTIONS PLC
55
db x-trackers MSCI AC World Index UCITS ETF (DR)
Portfolio of Investments as at 31 December 2017
Transferable Securities
Equities - 99.14% (31 December 2016 - 99.08%)
Number ofShares Security
ValueEUR
% ofFund
Aerospace and Defense2,711 Airbus 225,013 0.122,477 Arconic 56,211 0.0319,261 BAE Systems 124,331 0.072,966 Boeing 728,434 0.3912,977 Cobham 18,464 0.015,082 Embraer 25,517 0.011,505 General Dynamics 254,990 0.13480 Harris 56,622 0.031,367 IHI 37,896 0.021,716 Kawasaki Heavy Industries 50,172 0.03243 L3 Technologies 40,038 0.023,180 Leonardo 31,546 0.021,445 Lockheed Martin 386,340 0.203,952 Meggitt 21,468 0.01678 Northrop Grumman 173,289 0.091,711 Raytheon 267,664 0.14597 Rockwell Collins 67,426 0.049,921 Rolls-Royce Holdings 94,664 0.051,272 Safran 109,278 0.06421 Thales 37,840 0.02231 TransDigm Group 52,829 0.034,141 United Technologies 439,929 0.231,614 Zodiac Aerospace 40,237 0.02
3,340,198 1.77
Agriculture8,894 Altria Group 528,914 0.282,554 Archer-Daniels-Midland 85,247 0.0511,706 British American Tobacco 661,738 0.35921 Bunge 51,450 0.0314,261 Genting Plantations 30,813 0.02184,416 Golden Agri-Resources 42,520 0.024,986 Imperial Tobacco Group 177,832 0.095,431 Japan Tobacco 145,782 0.08775 KT&G 69,631 0.048,306 Kuala Lumpur Kepong 42,729 0.027,369 Philip Morris International 648,347 0.3430,472 Sime Darby Plantation 37,623 0.022,312 Swedish Match 76,004 0.04
2,598,630 1.38
Airlines59,755 Air China 60,347 0.031,075 American Airlines Group 46,579 0.03899 Delta Air Lines 41,925 0.022,746 Deutsche Lufthansa 84,357 0.053,614 International Consolidated Airlines Group 26,151 0.011,818 Latam Airlines Group 21,045 0.011,223 Southwest Airlines 66,660 0.04813 United Continental Holdings 45,633 0.02
Portfolio of Investments as at 31 December 2017 cont/d
Equities - 99.14% (31 December 2016 - 99.08%) cont/d
Number ofShares Security
ValueEUR
% ofFund
Auto Components cont/d886 Cie Generale des Etablissements Michelin 105,921 0.06430 Continental 96,772 0.053,223 Denso 161,138 0.0911,845 GKN 42,620 0.02668 Goodyear Tire & Rubber 17,974 0.01349 Hyundai Mobis 71,401 0.043,127 JTEKT 44,754 0.021,066 Koito Manufacturing 62,414 0.0363 Lear 9,268 0.01302 Linamar 14,695 0.011,639 Magna International 77,607 0.041,172 Nokian Renkaat 44,302 0.026,378 Sumitomo Electric Industries 89,821 0.052,211 Toyoda Gosei 46,861 0.021,148 Valeo 71,486 0.04550 WABCO Holdings 65,727 0.04
1,388,976 0.74
Automobiles1,369 Bayerische Motoren Werke 118,870 0.0616,970 Brilliance China Automotive Holdings 37,783 0.028,053 BYD 58,422 0.035,128 Daimler 363,063 0.19896 Ferrari 78,355 0.045,296 Fiat Chrysler Automobiles 78,963 0.0416,912 Ford Motor 175,909 0.094,123 Ford Otomotiv Sanayi 54,560 0.0331,273 Geely Automobile Holdings 90,284 0.055,427 General Motors 185,254 0.1014,661 Great Wall Motor 13,979 0.014,064 Hino Motors 43,864 0.027,744 Honda Motor 221,093 0.12941 Hyundai Motor 114,192 0.061,568 Kia Motors 40,862 0.025,383 Mahindra & Mahindra - England listing 104,450 0.06226 Mahindra & Mahindra - US listing 4,385 0.003,127 Mazda Motor 34,941 0.023,649 Mitsubishi Motors 21,958 0.0114,188 Nissan Motor 117,840 0.062,430 PACCAR 143,841 0.083,392 Peugeot 57,511 0.03774 Renault 64,946 0.032,584 Subaru 68,444 0.041,718 Suzuki Motor 82,985 0.044,022 Tata Motors 110,766 0.06625 Tesla 162,054 0.0912,283 Toyota Motor 654,966 0.356,437 Volvo 99,977 0.05
3,404,517 1.80
Banks2,845 ABN Amro Group 76,530 0.04149,098 Agricultural Bank of China 57,816 0.0327,888 Akbank Turk 60,334 0.032,781 Alior Bank 52,987 0.0315,314 Australia & New Zealand Banking Group 286,678 0.153,516 Axis Bank - England listing 127,956 0.07148 Axis Bank - US listing 5,386 0.0031,383 Banco Bilbao Vizcaya Argentaria 223,196 0.12798 Banco de Chile 64,150 0.03
CONCEPT FUND SOLUTIONS PLC
57
db x-trackers MSCI AC World Index UCITS ETF (DR)
Portfolio of Investments as at 31 December 2017 cont/d
Equities - 99.14% (31 December 2016 - 99.08%) cont/d
Number ofShares Security
ValueEUR
% ofFund
Banks cont/d38,033 Banco de Sabadell 62,983 0.032,264 Banco do Brasil 18,086 0.0176,369 Banco Santander 418,426 0.221,114 Bancolombia 36,793 0.0252,450 Bank Central Asia 70,505 0.0412,845 Bank Leumi Le-Israel 64,614 0.03154,428 Bank Mandiri Persero 75,831 0.0485,072 Bank Negara Indonesia Persero 51,695 0.0350,033 Bank of America 1,229,992 0.65345,903 Bank of China 141,501 0.0811,125 Bank of East Asia 40,117 0.026,105 Bank of Ireland Group 43,315 0.023,792 Bank of Montreal 253,524 0.136,076 Bank of New York Mellon 272,529 0.146,621 Bank of Nova Scotia 356,983 0.1916,143 Bank of the Philippine Islands 29,111 0.021,664 Bank Pekao 51,644 0.03137,605 Bank Rakyat Indonesia Persero 30,744 0.0212,974 Bankia 51,727 0.0378,978 Barclays 180,702 0.104,684 Barclays Africa Group 57,342 0.033,822 BB&T 158,253 0.0813,892 BDO Unibank 38,007 0.021,886 Bendigo & Adelaide Bank 14,336 0.015,134 BNP Paribas 319,591 0.1727,423 BOC Hong Kong Holdings 115,686 0.0620,407 CaixaBank 79,363 0.042,511 Canadian Imperial Bank of Commerce 204,513 0.112,919 Capital One Financial 242,067 0.13115,378 Chang Hwa Commercial Bank 53,437 0.0382,768 China CITIC Bank 43,205 0.02400,632 China Construction Bank 307,292 0.1625,819 China Merchants Bank 85,541 0.0520,279 CIMB Group Holdings 27,291 0.011,814 CIT Group 74,370 0.0417,963 CITIC 21,585 0.0113,695 Citigroup 848,638 0.452,139 Citizens Financial Group 74,779 0.04577 Comerica 41,713 0.029,405 Commercial International Bank Egypt 34,070 0.025,849 Commerzbank 73,142 0.048,732 Commonwealth Bank of Australia 456,946 0.24492 Credicorp 84,990 0.054,340 Credit Agricole 59,892 0.0311,447 Credit Suisse Group 170,211 0.092,554 Danske Bank 82,876 0.046,529 DBS Group Holdings 101,103 0.059,886 Deutsche Bank 156,940 0.083,769 DNB 58,367 0.031,514 Erste Group Bank 54,663 0.034,215 Fifth Third Bancorp 106,498 0.0610,602 First Abu Dhabi Bank 24,640 0.01529 First Republic Bank 38,168 0.0223,109 FirstRand 104,540 0.061,955 Goldman Sachs Group 414,770 0.2210,288 Grupo Financiero Banorte 47,218 0.039,748 Hachijuni Bank 46,625 0.025,000 Hang Seng Bank 103,334 0.0510,761 Hong Leong Bank 37,644 0.0295,177 HSBC Holdings 822,276 0.443,028 Huntington Bancshares 36,715 0.02
CONCEPT FUND SOLUTIONS PLC
58
db x-trackers MSCI AC World Index UCITS ETF (DR)
Portfolio of Investments as at 31 December 2017 cont/d
Equities - 99.14% (31 December 2016 - 99.08%) cont/d
Number ofShares Security
ValueEUR
% ofFund
Banks cont/d14,470 ICICI Bank 117,249 0.06374,761 Industrial & Commercial Bank of China 251,118 0.1316,855 ING Groep 258,303 0.1464,177 Intesa Sanpaolo 177,770 0.092,287 Japan Post Bank 24,802 0.0117,786 JPMorgan Chase & Co 1,583,973 0.8410,335 Kasikornbank 61,269 0.03560 KBC Group 39,822 0.025,239 KeyCorp 88,000 0.05430 Komercni Banka As 15,412 0.0189,532 Krung Thai Bank 43,926 0.027,942 Kyushu Financial Group 40,042 0.02327,287 Lloyds Banking Group 250,939 0.13592 M&T Bank 84,299 0.041,960 Macquarie Group 127,194 0.0762,455 Mitsubishi UFJ Financial Group 381,554 0.201,261 Mizrahi Tefahot Bank 19,405 0.01118,921 Mizuho Financial Group 179,871 0.106,703 Moneta Money Bank 21,635 0.016,184 Morgan Stanley 270,215 0.1414,309 National Australia Bank 275,600 0.152,230 National Bank of Canada 92,962 0.0510,020 Natixis 66,092 0.045,142 New York Community Bancorp 55,754 0.0313,994 Nordea Bank 141,341 0.07821 Northern Trust 68,296 0.042,010 OTP Bank 69,461 0.049,847 Oversea-Chinese Banking 76,027 0.044,215 People's United Financial 65,640 0.032,694 PNC Financial Services Group 323,715 0.175,040 Powszechna Kasa Oszczednosci Bank Polski 53,522 0.034,098 Public Bank 17,523 0.011,192 Qatar National Bank 34,613 0.021,886 Raiffeisen Bank International 56,957 0.034,617 Regions Financial 66,440 0.048,931 Resona Holdings 44,440 0.027,603 Royal Bank of Canada 518,728 0.2822,961 Royal Bank of Scotland Group 71,909 0.0414,094 Sberbank of Russia - England listing 198,710 0.11592 Sberbank of Russia - US listing 8,396 0.005,847 Skandinaviska Enskilda Banken 57,271 0.033,451 Societe Generale 148,566 0.085,526 Standard Bank Group 72,731 0.0415,850 Standard Chartered 139,292 0.072,435 State Bank of India - England listing 98,755 0.05102 State Bank of India - US listing 4,137 0.002,408 State Street 195,740 0.105,792 Sumitomo Mitsui Financial Group 208,438 0.112,087 Sumitomo Mitsui Trust Holdings 69,011 0.041,810 SunTrust Banks 97,358 0.052,679 Suruga Bank 47,868 0.03122 SVB Financial Group 23,751 0.016,279 Svenska Handelsbanken 71,657 0.044,617 Swedbank 92,936 0.05201,152 Taiwan Business Bank 47,229 0.039,804 Toronto-Dominion Bank 479,923 0.258,324 Turkiye Halk Bankasi 19,709 0.0118,203 UBS Group 279,070 0.159,474 UniCredit 147,605 0.084,532 United Overseas Bank 74,698 0.049,209 US Bancorp 410,908 0.22
CONCEPT FUND SOLUTIONS PLC
59
db x-trackers MSCI AC World Index UCITS ETF (DR)
Portfolio of Investments as at 31 December 2017 cont/d
Equities - 99.14% (31 December 2016 - 99.08%) cont/d
Number ofShares Security
ValueEUR
% ofFund
Banks cont/d1,040 VTB Bank - England listing 1,585 0.0024,788 VTB Bank - Germany listing 37,777 0.0223,405 Wells Fargo & Co 1,182,529 0.6317,180 Westpac Banking 350,817 0.195,139 Yamaguchi Financial Group 50,869 0.03
Building Products11,144 Anhui Conch Cement 43,629 0.021,862 Asahi Glass 67,173 0.045,389 Boral 27,344 0.0174,071 Cemex 46,345 0.0332,040 China National Building Material 23,858 0.01
CONCEPT FUND SOLUTIONS PLC
60
db x-trackers MSCI AC World Index UCITS ETF (DR)
Portfolio of Investments as at 31 December 2017 cont/d
Equities - 99.14% (31 December 2016 - 99.08%) cont/d
Number ofShares Security
ValueEUR
% ofFund
Building Products cont/d1,569 Cie de Saint-Gobain 72,143 0.044,862 CRH 145,641 0.08939 Daikin Industries 92,567 0.056,577 Fletcher Building 29,605 0.02563 Fortune Brands Home & Security 32,088 0.02119 Geberit 43,637 0.021,245 HeidelbergCement 112,361 0.0630,409 Indocement Tunggal Prakarsa 40,970 0.024,731 James Hardie Industries 69,705 0.044,261 Johnson Controls International 135,232 0.072,110 LafargeHolcim 99,083 0.05281 Martin Marietta Materials 51,726 0.031,222 Masco 44,716 0.0216 Sika 105,830 0.0656,366 Taiwan Cement 57,495 0.031,024 Titan Cement 23,450 0.01600 Vulcan Materials 64,142 0.03
Portfolio of Investments as at 31 December 2017 cont/d
Equities - 99.14% (31 December 2016 - 99.08%) cont/d
Number ofShares Security
ValueEUR
% ofFund
Commercial Services and Supplies cont/d554 United Rentals 79,312 0.04403 Vantiv 24,684 0.011,266 Verisk Analytics 101,213 0.051,091 Waste Connections 64,453 0.032,823 Waste Management 202,885 0.114,146 Western Union 65,636 0.031,100 Wirecard 102,377 0.0538,062 Zhejiang Expressway 34,830 0.02
3,946,805 2.09
Computers and Peripherals475 58.com 28,311 0.023,150 Accenture 401,593 0.215,507 Alibaba Group Holding 790,783 0.421,433 Alphabet Class A Shares 1,257,097 0.671,520 Alphabet Class C Shares 1,324,557 0.701,962 Amazon.com 1,910,809 1.0125,693 Apple 3,620,941 1.924,369 Asustek Computer 34,173 0.02342 Atos 41,502 0.029,005 Auto Trader Group 35,790 0.021,310 Baidu 255,509 0.142,676 BlackBerry 24,972 0.01627 Capgemini 62,004 0.03826 CGI Group 37,497 0.02331 Check Point Software Technologies 28,563 0.022,698 Cognizant Technology Solutions 159,570 0.082,308 Computershare 24,504 0.011,760 Ctrip.com International 64,637 0.031,144 Dell Technologies 77,435 0.041,273 DXC Technology 100,606 0.056,171 eBay 193,949 0.10480 Expedia 47,876 0.03663 F5 Networks 72,451 0.0411,354 Facebook 1,668,493 0.881,009 Fortinet 36,711 0.0212,589 Fujitsu 74,704 0.048,979 Hewlett Packard Enterprise 107,377 0.069,413 HP 164,696 0.09289 Iliad 57,728 0.0313,811 Infosys 186,554 0.10326 Ingenico Group 29,017 0.024,487 International Business Machines 573,281 0.3049,521 Inventec 32,913 0.022,895 JD.com 99,859 0.0543,250 Lenovo Group 20,319 0.0132,713 Lite-On Technology 37,168 0.021,892 M3 55,458 0.03182 MercadoLibre 47,692 0.03173 NAVER 117,081 0.06102 NCSoft 35,507 0.02860 NEC 19,327 0.011,071 NetApp 49,340 0.032,056 Netflix 328,672 0.17563 Palo Alto Networks 67,956 0.04249 Priceline Group 360,341 0.1932,615 Quanta Computer 56,497 0.034,041 Rakuten 30,844 0.02251 Samsung 39,050 0.021,445 Seagate Technology 50,349 0.03
CONCEPT FUND SOLUTIONS PLC
63
db x-trackers MSCI AC World Index UCITS ETF (DR)
Portfolio of Investments as at 31 December 2017 cont/d
Equities - 99.14% (31 December 2016 - 99.08%) cont/d
Number ofShares Security
ValueEUR
% ofFund
Computers and Peripherals cont/d3,715 SEEK 46,000 0.02426 Shopify 35,990 0.02328 SINA 27,400 0.01281 SK Holdings 61,861 0.031,075 Start Today 27,219 0.012,805 Symantec 65,546 0.04504 TDK 33,496 0.0227,607 Tencent Holdings 1,194,037 0.631,199 Trend Micro 56,639 0.03638 TripAdvisor 18,309 0.013,173 Twitter 63,444 0.031,198 United Internet 68,693 0.04528 VeriSign 50,320 0.032,377 Vipshop Holdings 23,200 0.01250 Weibo 21,540 0.011,315 Western Digital 87,094 0.0518,394 Wipro 83,790 0.0412,437 Yahoo Japan 47,534 0.03595 Zillow Group 20,276 0.01
16,974,451 9.00
Construction and Engineering2,408 ACS Actividades de Construccion y Servicios 78,549 0.04405 Aena 68,445 0.0419,335 Airports of Thailand 33,597 0.025,899 Barratt Developments 43,029 0.02567 Berkeley Group Holdings 26,808 0.011,713 Bouygues 74,190 0.0433,342 China Communications Construction 31,541 0.0238,806 China Communications Services 21,662 0.0141,004 China Railway Group 25,248 0.0111,329 China State Construction International Holdings 13,203 0.011,388 CIMIC Group 46,515 0.035,643 Daewoo Engineering & Construction 25,987 0.013,127 Daiwa House Industry 100,026 0.051,591 DR Horton 67,665 0.042,841 Ferrovial 53,766 0.036,358 Grupo Aeroportuario del Pacifico 54,690 0.033,554 Grupo Aeroportuario del Sureste 54,166 0.03339 Hyundai Heavy Industries 26,503 0.014,478 Kajima 35,885 0.026,659 Larsen & Toubro - England listing 107,305 0.06279 Larsen & Toubro - US listing 4,496 0.001,470 LendLease Group 15,655 0.011,240 Lennar 65,304 0.033 NVR 8,765 0.012,215 Persimmon 68,321 0.041,669 PulteGroup 46,214 0.022,031 Samsung Heavy Industries 11,581 0.015,180 Sekisui House 77,947 0.0425,669 Singapore Technologies Engineering 52,146 0.033,664 Skanska 63,355 0.0314,199 Sydney Airport 65,203 0.032,033 Taisei 84,314 0.0519,190 Taylor Wimpey 44,620 0.022,923 Vinci 248,893 0.13
1,845,594 0.98
Containers and Packaging8,337 Amcor 83,736 0.04
CONCEPT FUND SOLUTIONS PLC
64
db x-trackers MSCI AC World Index UCITS ETF (DR)
Portfolio of Investments as at 31 December 2017 cont/d
Equities - 99.14% (31 December 2016 - 99.08%) cont/d
Number ofShares Security
ValueEUR
% ofFund
Containers and Packaging cont/d1,090 Ball 34,358 0.02938 CCL Industries 36,210 0.02613 Sealed Air 25,167 0.011,743 WestRock 91,751 0.05
271,222 0.14
Distribution and Wholesale1,334 Fastenal 60,757 0.031,190 Ferguson 71,453 0.04990 HD Supply Holdings 33,003 0.028,759 ITOCHU 136,173 0.071,397 Jardine Cycle & Carriage 35,405 0.02777 LG 55,003 0.031,262 LKQ 42,743 0.0211,212 Marubeni 67,643 0.047,467 Mitsubishi 171,840 0.095,732 Mitsui & Co 77,630 0.042,682 Rexel 40,552 0.026,882 Sumitomo 97,427 0.05174 WW Grainger 34,233 0.02
923,862 0.49
Diversified Financials5,481 3i Group 56,405 0.03207 Affiliated Managers Group 35,382 0.02249 Alliance Data Systems 52,562 0.032,191 Ally Financial 53,206 0.034,226 American Express 349,504 0.18626 Ameriprise Financial 88,348 0.052,142 ASX 76,541 0.0413,530 B3 - Brasil Bolsa Balcao 77,379 0.04703 BlackRock 300,748 0.164,965 Brait 13,914 0.013,623 Brookfield Asset Management 131,768 0.07504 Capitec Bank Holdings 37,224 0.0292 Cboe Global Markets 9,545 0.0016,166 Chailease Holding 39,178 0.026,629 Charles Schwab 283,587 0.1529,643 China Everbright 55,200 0.0316,450 CITIC Securities 28,249 0.011,762 CME Group 214,307 0.11119,452 CTBC Financial Holding 68,528 0.041,356 Deutsche Boerse 131,261 0.071,482 Discover Financial Services 94,933 0.051,295 E*TRADE Financial 53,459 0.03128,196 E.Sun Financial Holding 67,804 0.04989 EXOR 50,538 0.0379,288 First Financial Holding 43,378 0.02876 FNF 28,626 0.01743 Franklin Resources 26,811 0.0149,000 Fubon Financial Holding 69,522 0.04875 Groupe Bruxelles Lambert 78,741 0.042,274 GT Capital Holdings 49,012 0.0320,446 Haitong Securities 24,700 0.011,829 Hana Financial Group 70,854 0.043,822 Hargreaves Lansdown 77,587 0.045,351 Hong Kong Exchanges & Clearing 136,696 0.071,681 IGM Financial 49,328 0.032,506 Intercontinental Exchange 147,255 0.081,517 Invesco 46,162 0.02
CONCEPT FUND SOLUTIONS PLC
65
db x-trackers MSCI AC World Index UCITS ETF (DR)
Portfolio of Investments as at 31 December 2017 cont/d
Equities - 99.14% (31 December 2016 - 99.08%) cont/d
Number ofShares Security
ValueEUR
% ofFund
Diversified Financials cont/d2,826 Investor 107,532 0.062,160 Japan Exchange Group 31,313 0.02876 Julius Baer Group 44,617 0.022,140 KB Financial Group 105,542 0.062,554 London Stock Exchange Group 109,131 0.064,544 Mastercard 572,768 0.3050,000 Mega Financial Holding 33,651 0.024,558 NH Investment & Securities 49,285 0.0319,570 Nomura Holdings 96,222 0.051,045 Onex 64,032 0.034,682 ORIX 65,919 0.0357 Partners Group Holding 32,539 0.023,030 PSG Group 55,032 0.03678 Schroders 26,855 0.012,250 Shinhan Financial Group 86,463 0.0412,317 Singapore Exchange 57,104 0.033,498 Synchrony Financial 112,473 0.061,207 T Rowe Price Group 105,472 0.06117,958 Taiwan Cooperative Financial Holding 54,797 0.032,104 TD Ameritrade Holding 89,588 0.059,449 Visa 897,214 0.476,469 Wharf Real Estate Investment 35,835 0.0214,662 Worldpay Group 70,364 0.04
6,121,990 3.24
Diversified Telecommunications155,908 America Movil 112,480 0.06232 Arista Networks 45,515 0.02127,414 Asia Pacific Telecom 35,585 0.0229,230 AT&T 946,421 0.5048,849 Axiata Group 55,185 0.031,546 BCE 62,044 0.0324,531 Bezeq The Israeli Telecommunication 30,952 0.0238,137 BT Group 116,730 0.064,831 CenturyLink 67,106 0.0327,795 China Mobile 234,660 0.1266,730 China Telecom 26,445 0.0142,982 China Unicom Hong Kong 48,353 0.0231,250 Chunghwa Telecom 92,699 0.0524,935 Cisco Systems 795,312 0.42722 CommScope Holding 22,746 0.0114,981 Deutsche Telekom 221,644 0.1211,458 Emirates Telecommunications Group 45,465 0.021,685 Eutelsat Communications 32,512 0.024,489 Hellenic Telecommunications Organization 51,624 0.031,540 Juniper Networks 36,551 0.029,277 KDDI 192,336 0.1016,707 Koninklijke KPN 48,584 0.024,340 Mobile TeleSystems 36,829 0.02616 Motorola Solutions 46,344 0.027,931 MTN Group 72,876 0.04815 Nice 61,485 0.033,329 Nippon Telegraph & Telephone 130,458 0.0727,154 Nokia 105,738 0.065,581 NTT DOCOMO 109,788 0.062,181 O2 Czech Republic 23,622 0.0110,147 Orange 146,878 0.08115,558 PCCW 55,889 0.032,115 Proximus SADP 57,845 0.03760 Rogers Communications 32,354 0.02
CONCEPT FUND SOLUTIONS PLC
66
db x-trackers MSCI AC World Index UCITS ETF (DR)
Portfolio of Investments as at 31 December 2017 cont/d
Equities - 99.14% (31 December 2016 - 99.08%) cont/d
Number ofShares Security
ValueEUR
% ofFund
Diversified Telecommunications cont/d429 Samsung SDI 68,245 0.042,436 SES 31,692 0.0224,356 Singapore Telecommunications 54,184 0.031,000 Singapore Telecommunications (Board Lot 10) 2,231 0.004,334 SoftBank Group 285,793 0.1520,328 Spark New Zealand 43,704 0.025,709 Sprint 28,003 0.0130 Swisscom 13,293 0.015,901 TDC 30,221 0.0271,387 Telecom Italia 51,434 0.0315,813 Telefonaktiebolaget LM Ericsson 86,612 0.0524,786 Telefonica 201,386 0.11248,355 Telekomunikasi Indonesia Persero 67,684 0.045,118 Telenor 91,659 0.053,350 Telia 12,454 0.0115,703 Telstra 37,129 0.021,388 T-Mobile US 73,411 0.0494,098 Tower Bersama Infrastructure 37,109 0.02161,897 True 25,649 0.0119,090 Verizon Communications 841,467 0.455,787 Vodacom Group 56,710 0.03133,557 Vodafone Group 353,575 0.191,044 Zayo Group Holdings 31,995 0.02
6,726,695 3.57
Electric Utilities6,976 AES 62,916 0.032,408 AGL Energy 38,208 0.022,327 Alliant Energy 82,573 0.051,993 Ameren 97,907 0.052,331 American Electric Power 142,814 0.0848,634 AusNet Services 57,179 0.031,012 CenterPoint Energy 23,901 0.01106,918 CGN Power 24,147 0.013,420 Chubu Electric Power 35,408 0.028,108 CLP Holdings 69,057 0.04324 CMS Energy 12,762 0.01964 Consolidated Edison 68,198 0.043,541 Dominion Energy 239,035 0.13480 DTE Energy 43,755 0.023,821 Duke Energy 267,642 0.149,902 E.ON 89,722 0.051,063 Edison International 55,983 0.0325,157 EDP - Energias de Portugal 72,578 0.043,913 Electricite de France 40,773 0.0233,284 Enel 170,747 0.095,976 Enel Americas 55,590 0.038,906 Enel Chile 42,127 0.022,699 Enel Generacion Chile 60,485 0.037,934 Engie 113,734 0.061,492 Entergy 101,127 0.053,531 Equatorial Energia 58,197 0.03851 Eversource Energy 44,775 0.024,266 Exelon 140,009 0.082,857 FirstEnergy 72,853 0.043,420 Fortis 104,813 0.063,391 Fortum 55,952 0.0324,003 Iberdrola 155,059 0.081,099 Innogy 35,910 0.02493 Interconexion Electrica 48,835 0.03
CONCEPT FUND SOLUTIONS PLC
67
db x-trackers MSCI AC World Index UCITS ETF (DR)
Portfolio of Investments as at 31 December 2017 cont/d
Equities - 99.14% (31 December 2016 - 99.08%) cont/d
Number ofShares Security
ValueEUR
% ofFund
Electric Utilities cont/d5,341 Kansai Electric Power 54,488 0.031,460 Korea Electric Power 43,328 0.023,803 Kyushu Electric Power 33,203 0.022,065 NextEra Energy 268,598 0.149,445 Origin Energy 57,953 0.03546 Orsted 24,838 0.011,893 PG&E 70,672 0.041,099 Pinnacle West Capital 77,959 0.048,000 Power Assets Holdings 56,205 0.032,857 PPL 73,638 0.042,233 Public Service Enterprise Group 95,769 0.054,403 Red Electrica 82,380 0.042,503 RWE 42,551 0.021,342 SCANA 44,458 0.024,743 Southern 189,949 0.104,074 SSE 60,582 0.0330,636 Tenaga Nasional 96,202 0.0515,395 Terna Rete Elettrica Nazionale 74,573 0.043,151 Tohoku Electric Power 33,567 0.0212,193 Tokyo Electric Power Holdings 40,202 0.02913 WEC Energy Group 50,508 0.031,467 Xcel Energy 58,775 0.03
Energy Equipment and Services40,814 China Everbright International 48,523 0.0251,227 Energy Absolute 68,723 0.0445,809 Fullshare Holdings 17,568 0.011,372 Vestas Wind Systems 79,017 0.04
213,831 0.11
Food Products4,147 Ajinomoto 65,024 0.031,491 Associated British Foods 47,367 0.0224 Barry Callebaut 41,696 0.0272 BGF Retail 11,762 0.011,955 Bid 39,583 0.022,698 BRF 24,791 0.01541 Calbee 14,658 0.011,705 Campbell Soup 68,311 0.041,521 Carrefour 27,439 0.01331 Casino Guichard Perrachon 16,735 0.0119,924 China Mengniu Dairy 49,348 0.031 Chocoladefabriken Lindt & Spruengli 60,234 0.03647 Chr Hansen Holding 50,575 0.038,461 Compass Group 152,507 0.083,169 Conagra Brands 99,414 0.053,007 Danone 210,340 0.1185,913 First Pacific 48,507 0.033,666 General Mills 181,010 0.10392 Hershey 37,055 0.021,044 Hormel Foods 31,638 0.02427 ICA Gruppen 12,938 0.01295 Ingredion 34,345 0.0212,358 J Sainsbury 33,607 0.0236,920 JG Summit Holdings 44,407 0.02619 JM Smucker 64,044 0.031,927 Kellogg 109,092 0.06504 Kerry Group 47,124 0.021,040 Kikkoman 35,059 0.026,973 Koninklijke Ahold Delhaize 127,850 0.073,122 Kraft Heinz 202,171 0.115,376 Kroger 122,894 0.06256 Loblaw 11,608 0.01273 Lotte 13,825 0.01814 M Dias Branco 10,647 0.011,430 Magnit - England listing 32,570 0.0260 Magnit - US listing 1,367 0.00165 McCormick & Co 14,003 0.01463 MEIJI Holdings 32,824 0.028,230 Mondelez International 293,341 0.15
CONCEPT FUND SOLUTIONS PLC
69
db x-trackers MSCI AC World Index UCITS ETF (DR)
Portfolio of Investments as at 31 December 2017 cont/d
Equities - 99.14% (31 December 2016 - 99.08%) cont/d
Forest Products2,785 Suzano Papel e Celulose 13,068 0.01340 West Fraser Timber 17,529 0.01
30,597 0.02
Gas Utilities1,263 Canadian Utilities 31,404 0.0229,730 Centrica 45,985 0.0227,111 China Gas Holdings 62,384 0.0310,650 China Resources Gas Group 32,164 0.025,321 ENN Energy Holdings 31,602 0.022,278 GAIL India 90,206 0.0596 GAIL India 3,801 0.0052,400 Hong Kong & China Gas 85,519 0.0519,804 National Grid 195,235 0.104,081 Osaka Gas 65,467 0.03917 Sempra Energy 81,650 0.0418,495 Snam 75,460 0.041,317 Toho Gas 30,084 0.021,566 Tokyo Gas 29,851 0.02
860,812 0.46
Health Care Equipment and Supplies8,703 Abbott Laboratories 413,624 0.22306 Align Technology 56,621 0.032,332 Aspen Pharmacare Holdings 43,531 0.022,859 Baxter International 153,902 0.081,225 Becton Dickinson & Co 218,374 0.116,295 Boston Scientific 129,957 0.07275 Cochlear 30,671 0.021,099 Coloplast 72,844 0.04215 Cooper 39,011 0.023,127 Danaher 241,712 0.131,604 Dentsply Sirona 87,934 0.05950 Edwards Lifesciences 89,169 0.05821 Essilor International Cie Generale d'Optique 94,374 0.053,655 Getinge 44,240 0.02
CONCEPT FUND SOLUTIONS PLC
70
db x-trackers MSCI AC World Index UCITS ETF (DR)
Portfolio of Investments as at 31 December 2017 cont/d
Equities - 99.14% (31 December 2016 - 99.08%) cont/d
Number ofShares Security
ValueEUR
% ofFund
Health Care Equipment and Supplies cont/d8,069 Hengan International Group 74,570 0.04550 Henry Schein 32,007 0.02960 Hologic 34,177 0.02368 IDEXX Laboratories 47,925 0.02491 Intuitive Surgical 149,222 0.08402 Lonza Group 90,453 0.057,275 Medtronic 489,221 0.261,397 Olympus 44,615 0.022,181 QIAGEN 57,120 0.031,294 ResMed 91,263 0.053,432 Smith & Nephew 49,798 0.03564 Sonova Holding 73,357 0.041,641 Stryker 211,603 0.111,186 Sysmex 77,769 0.0442 Teleflex 8,703 0.002,704 Terumo 106,745 0.062,208 Thermo Fisher Scientific 349,146 0.18867 Zimmer Biomet Holdings 87,126 0.05
3,790,784 2.01
Health Care Providers and Services1,900 Aetna 285,427 0.151,488 Anthem 278,826 0.15861 Centene 72,333 0.041,113 Cigna 188,240 0.101,397 DaVita 84,055 0.05621 Envision Healthcare 17,873 0.0170 Eurofins Scientific 35,532 0.021,618 Fresenius & Co 105,283 0.06917 Fresenius Medical Care & Co 80,494 0.041,334 HCA Healthcare 97,584 0.05671 Humana 138,620 0.0745,482 IHH Healthcare 54,844 0.03693 IQVIA Holdings 56,500 0.03302 Laboratory of America Holdings 40,117 0.022,850 Mediclinic International 20,853 0.011,139 Quest Diagnostics 93,421 0.059,438 Ryman Healthcare 59,197 0.034,866 Sonic Healthcare 72,455 0.044,858 UnitedHealth Group 891,901 0.47447 Universal Health Services 42,195 0.02
2,715,750 1.44
Hotels, Restaurants and Leisure5,810 Aristocrat Leisure 89,690 0.0516,245 Galaxy Entertainment Group 108,507 0.06637 Hilton Worldwide Holdings 42,364 0.02820 InterContinental Hotels Group 43,592 0.021,916 Kangwon Land 51,868 0.031,715 Las Vegas Sands 99,247 0.051,347 Marriott International 152,255 0.081,194 Melco Resorts & Entertainment 28,876 0.0127,005 MGM China Holdings 68,037 0.041,903 MGM Resorts International 52,916 0.031,510 Oriental Land 114,642 0.06381 Paddy Power Betfair 37,795 0.0212,897 Sands China 55,438 0.039,762 Tabcorp Holdings 35,481 0.02812 Whitbread 36,590 0.02975 Wyndham Worldwide 94,082 0.05
CONCEPT FUND SOLUTIONS PLC
71
db x-trackers MSCI AC World Index UCITS ETF (DR)
Portfolio of Investments as at 31 December 2017 cont/d
Equities - 99.14% (31 December 2016 - 99.08%) cont/d
Number ofShares Security
ValueEUR
% ofFund
Hotels, Restaurants and Leisure cont/d389 Wynn Resorts 54,615 0.03
Media2,924 Altice Class A Shares 25,573 0.01892 Axel Springer 58,096 0.032,395 CBS 117,676 0.061,117 Charter Communications 312,514 0.1624,224 Comcast 807,937 0.43841 Dentsu 29,687 0.021,840 Discovery Communications 32,439 0.02925 DISH Network 36,783 0.0210,652 Grupo Televisa 33,360 0.022,386 Interpublic Group 40,058 0.0211,232 ITV 20,941 0.011,727 JCDecaux 58,036 0.032,002 Lagardere 53,514 0.03463 Liberty Broadband 32,836 0.021,990 Liberty Global Class A Shares 59,395 0.032,065 Liberty Global Class C Shares 58,194 0.031,144 Liberty Media-Liberty SiriusXM 37,784 0.022,082 Naspers 483,320 0.261,119 Omnicom Group 67,869 0.045,479 Pearson 45,428 0.021,766 ProSiebenSat.1 Media 50,693 0.03613 Publicis Groupe 34,727 0.02473 RTL Group 31,724 0.022,153 Schibsted 47,787 0.024,243 Shaw Communications 80,909 0.0425,658 Singapore Press Holdings 42,370 0.021,168 Sky 13,316 0.011,021 Telenet Group Holding 59,310 0.032,230 Thomson Reuters 81,209 0.044,036 Time Warner 307,439 0.166,163 Twenty-First Century Fox Class A Shares 177,222 0.09587 Twenty-First Century Fox Class B Shares 16,679 0.011,938 Viacom 49,725 0.03
CONCEPT FUND SOLUTIONS PLC
75
db x-trackers MSCI AC World Index UCITS ETF (DR)
Portfolio of Investments as at 31 December 2017 cont/d
Equities - 99.14% (31 December 2016 - 99.08%) cont/d
Number ofShares Security
ValueEUR
% ofFund
Media cont/d5,847 Vivendi 131,090 0.077,725 Walt Disney 691,634 0.372,409 Wolters Kluwer 104,743 0.057,067 WPP 106,761 0.06
4,438,778 2.35
Metals and Mining129,033 Adaro Energy 14,731 0.011,792 Agnico Eagle Mines 69,129 0.0424,889 Alumina 39,394 0.026,580 Anglo American 114,859 0.061,817 Antofagasta 20,572 0.013,224 ArcelorMittal 87,419 0.055,759 Barrick Gold 69,588 0.0413,853 BHP Billiton - Australia listing 266,818 0.1410,174 BHP Billiton - England listing 174,500 0.092,660 BlueScope Steel 26,630 0.012,650 Boliden 75,633 0.043,718 Cameco 28,690 0.023,774 Catcher Technology 34,641 0.0213,948 China Shenhua Energy 30,089 0.0222,884 China Steel 15,850 0.019,519 Eregli Demir ve Celik Fabrikalari 20,949 0.013,718 First Quantum Minerals 43,518 0.029,248 Fortescue Metals Group 29,396 0.02813 Franco-Nevada 54,285 0.036,328 Freeport-McMoRan 99,916 0.0557,790 Glencore 253,901 0.134,115 Goldcorp 43,843 0.0229,098 Grupo Mexico 80,392 0.043,424 JFE Holdings 68,495 0.049,725 Kinross Gold 35,034 0.023,276 Kobe Steel 25,308 0.012,285 Maruichi Steel Tube 55,744 0.031,781 MISUMI Group 43,185 0.022,283 MMC Norilsk Nickel - England listing 35,629 0.0296 MMC Norilsk Nickel - US listing 1,512 0.004,973 Newcrest Mining 73,919 0.043,294 Newmont Mining 102,924 0.053,432 Nippon Steel & Sumitomo Metal 73,349 0.043,326 Norsk Hydro 21,114 0.011,406 Nucor 74,445 0.04400 POSCO 103,460 0.05554 Randgold Resources 46,246 0.021,081 Rio Tinto - Australia listing 53,379 0.036,080 Rio Tinto - England listing 270,002 0.1431,560 South32 71,743 0.041,100 Steel Dynamics 39,509 0.022,216 Sumitomo Metal Mining 84,826 0.058,471 Tata Steel - England listing 80,421 0.04356 Tata Steel - Germany listing 3,380 0.003,200 Teck Resources 69,911 0.042,006 ThyssenKrupp 48,575 0.037,388 Turquoise Hill Resources 21,066 0.0114,688 Vale 148,459 0.086,106 Vedanta 105,919 0.064,031 Wheaton Precious Metals 74,456 0.0481,569 Zijin Mining Group 25,634 0.01
3,552,387 1.88
CONCEPT FUND SOLUTIONS PLC
76
db x-trackers MSCI AC World Index UCITS ETF (DR)
Portfolio of Investments as at 31 December 2017 cont/d
Equities - 99.14% (31 December 2016 - 99.08%) cont/d
Number ofShares Security
ValueEUR
% ofFund
Oil and Gas2,578 Anadarko Petroleum 115,160 0.06826 Andeavor 78,652 0.041,659 Antero Resources 26,250 0.014,637 APA Group 25,159 0.011,729 Apache 60,791 0.031,804 Baker Hughes 47,534 0.0394,499 BP 556,450 0.292,400 Cabot Oil & Gas 57,162 0.031,765 Caltex Australia 39,145 0.025,037 Canadian Natural Resources 150,386 0.084,867 Cenovus Energy 37,136 0.021,297 Cheniere Energy 58,153 0.039,004 Chevron 938,716 0.5066,181 China Oilfield Services 53,653 0.03116,000 China Petroleum & Chemical 70,808 0.04665 Cimarex Energy 67,569 0.0483,000 CNOOC 99,207 0.05686 Concho Resources 85,819 0.055,733 ConocoPhillips 262,062 0.141,298 Cosan Industria e Comercio 13,524 0.013,902 Crescent Point Energy 24,846 0.01379 DCC 31,872 0.022,232 Devon Energy 76,953 0.043,078 Ecopetrol 37,501 0.028,856 Enbridge 289,364 0.155,153 Encana 57,437 0.0310,147 Eni 140,029 0.072,510 EOG Resources 225,561 0.121,480 EQT 70,155 0.0420,266 Exxon Mobil 1,411,599 0.752,114 Galp Energia SGPS 32,397 0.0230,617 Gazprom - England listing 112,443 0.061,285 Gazprom - US listing 4,719 0.002,945 Grupa Lotos 40,725 0.024,135 Halliburton 168,286 0.09827 Helmerich & Payne 44,518 0.021,532 Hess 60,563 0.031,460 HollyFrontier 62,276 0.035,209 Inpex 54,258 0.039,004 JXTG Holdings 48,391 0.039,752 Kinder Morgan 146,751 0.0881,122 Kunlun Energy 70,345 0.042,672 Lukoil - England listing 127,325 0.07112 Lukoil - US listing 5,377 0.002,629 Lundin Petroleum 50,219 0.034,218 Marathon Oil 59,469 0.032,971 Marathon Petroleum 163,247 0.092,315 National Oilwell Varco 69,442 0.041,088 Neste 58,045 0.031,145 Newfield Exploration 30,065 0.023,070 Noble Energy 74,500 0.04483 Novatek - England listing 48,348 0.0320 Novatek - US listing 2,002 0.003,840 Occidental Petroleum 235,555 0.126,703 Oil Search 34,012 0.022,115 ONEOK 94,143 0.052,293 Pembina Pipeline 69,360 0.04100,000 PetroChina 58,059 0.0315,674 Petroleo Brasileiro 66,542 0.042,680 Phillips 66 225,751 0.12786 Pioneer Natural Resources 113,141 0.06
CONCEPT FUND SOLUTIONS PLC
77
db x-trackers MSCI AC World Index UCITS ETF (DR)
Portfolio of Investments as at 31 December 2017 cont/d
Equities - 99.14% (31 December 2016 - 99.08%) cont/d
Number ofShares Security
ValueEUR
% ofFund
Oil and Gas cont/d897 Plains GP Holdings 16,397 0.01864 Polski Koncern Naftowy Orlen 21,949 0.011,144 PrairieSky Royalty 24,377 0.014,389 PTT 49,347 0.0311,828 PTT Exploration & Production 30,224 0.021,457 Range Resources 20,700 0.018,998 Reliance Industries - England listing 213,935 0.11378 Reliance Industries - US listing 8,987 0.007,611 Repsol 112,224 0.0620,882 Royal Dutch Shell Class A Shares 583,405 0.3119,529 Royal Dutch Shell Class B Shares 551,875 0.2911,286 Santos 40,064 0.022,728 Sasol 78,574 0.047,072 Schlumberger 396,887 0.211,917 Seven Generations Energy 22,654 0.013,900 Showa Shell Sekiyu 44,112 0.02521 SK Innovation 82,881 0.047,336 Statoil 130,859 0.077,786 Suncor Energy 238,826 0.139,118 Surgutneftegas - England listing 35,802 0.02383 Surgutneftegas - US listing 1,502 0.00899 Targa Resources 36,251 0.021,360 Tatneft - England listing 56,017 0.0357 Tatneft - US listing 2,387 0.002,539 TechnipFMC 66,203 0.0310,825 Total 498,437 0.262,703 Tourmaline Oil 40,926 0.024,686 TransCanada 190,549 0.101,912 Tupras Turkiye Petrol Rafinerileri 51,024 0.032,106 Ultrapar Participacoes 39,654 0.022,629 Valero Energy 201,225 0.114,038 Williams 102,531 0.054,981 Woodside Petroleum 107,325 0.06
11,737,037 6.22
Paper and Related Products2,178 International Paper 105,091 0.062,433 Klabin 10,750 0.0118,097 Nine Dragons Paper Holdings 24,137 0.016,878 Sappi 41,409 0.024,383 UPM-Kymmene 113,564 0.06
294,951 0.16
Personal Products251 Amorepacific 59,454 0.03291 Amorepacific Group 31,918 0.02970 Beiersdorf 94,963 0.054,738 Colgate-Palmolive 297,703 0.162,332 Coty 38,627 0.021,811 Essity 42,919 0.02746 Estee Lauder 79,048 0.042,314 Kao 130,334 0.0778 LG Household & Health Care 72,144 0.041,196 Lion 18,877 0.01998 L'Oreal 184,580 0.10677 Pola Orbis Holdings 19,794 0.0112,408 Procter & Gamble 949,406 0.502,558 Shiseido 102,986 0.051,941 Unicharm 42,036 0.026,964 Unilever - England listing 323,655 0.17
CONCEPT FUND SOLUTIONS PLC
78
db x-trackers MSCI AC World Index UCITS ETF (DR)
Portfolio of Investments as at 31 December 2017 cont/d
Equities - 99.14% (31 December 2016 - 99.08%) cont/d
Number ofShares Security
ValueEUR
% ofFund
Personal Products cont/d7,463 Unilever - Netherlands listing 350,425 0.19
Real Estate96,335 Ayala Land 71,676 0.04306 Azrieli Group 14,262 0.0111,562 BR Malls Participacoes 36,952 0.022,411 CBRE Group 86,959 0.0527,242 Central Pattana 59,344 0.038,582 China Evergrande Group 24,639 0.0165,349 China Jinmao Holdings Group 23,948 0.0116,808 China Overseas Land & Investment 45,033 0.0231,938 China Resources Land 78,254 0.0411,338 CK Asset Holdings 82,495 0.04
CONCEPT FUND SOLUTIONS PLC
79
db x-trackers MSCI AC World Index UCITS ETF (DR)
Portfolio of Investments as at 31 December 2017 cont/d
Equities - 99.14% (31 December 2016 - 99.08%) cont/d
Number ofShares Security
ValueEUR
% ofFund
Real Estate cont/d53,069 Country Garden Holdings 84,236 0.04617 Daito Trust Construction 104,795 0.061,857 Deutsche Wohnen 67,706 0.0439,923 Emaar Properties 62,822 0.0310,512 Ezdan Holding Group 29,541 0.023,876 First Capital Realty 53,379 0.0334,533 Global Logistic Properties 72,520 0.0416,805 Guangzhou R&F Properties 31,544 0.026,526 Hulic 61,077 0.036,229 Hysan Development 27,505 0.01275 Jones Lang LaSalle 34,107 0.025,675 Mitsubishi Estate 82,228 0.044,117 Mitsui Fudosan 76,849 0.043,472 NEPI Rockcastle 49,880 0.0355,215 New World Development 69,055 0.041,177 REA Group 58,764 0.0382,709 Redefine Properties 59,531 0.0318,059 Ruentex Development 16,147 0.0132,858 Shimao Property Holdings 59,506 0.0330,472 Sime Darby Property 11,161 0.0116,794 Sino Land 24,761 0.0133,730 Sino-Ocean Group Holding 19,368 0.0149,752 SM Prime Holdings 31,124 0.0263,328 SOHO China 30,831 0.022,232 Sumitomo Realty & Development 61,101 0.035,203 Sun Hung Kai Properties 72,278 0.048,252 UOL Group 45,612 0.021,866 Vonovia 77,234 0.044,283 Wheelock & Co 25,460 0.01
2,023,684 1.07
Real Estate Investment Trust3,296 AGNC Investment 55,418 0.03182 Alexandria Real Estate Equities 19,793 0.012,034 American Tower 241,664 0.138,434 Annaly Capital Management 83,511 0.0432,046 Ascendas Real Estate Investment Trust 54,317 0.03527 AvalonBay Communities 78,299 0.04827 Boston Properties 89,553 0.053,571 British Land 27,818 0.011,001 Camden Property Trust 76,742 0.0450,203 CapitaLand Commercial Trust 60,378 0.032,782 Colony NorthStar 26,435 0.011,710 Crown Castle International 158,084 0.081,092 Digital Realty Trust 103,580 0.063,472 Duke Realty 78,675 0.04330 Equinix 124,552 0.072,208 Equity Residential 117,259 0.06389 Essex Property Trust 78,192 0.04501 Extra Space Storage 36,486 0.0227,253 Fibra Uno Administracion 33,802 0.02585 Fonciere Des Regions 55,271 0.032,209 GGP 43,028 0.023,446 Goodman Group 18,899 0.012,454 HCP 53,298 0.032,977 Host Hotels & Resorts 49,212 0.03749 ICADE 61,366 0.031,757 Invitation Homes 34,487 0.021,786 Iron Mountain 56,117 0.036 Japan Real Estate Investment 23,730 0.01
CONCEPT FUND SOLUTIONS PLC
80
db x-trackers MSCI AC World Index UCITS ETF (DR)
Portfolio of Investments as at 31 December 2017 cont/d
Equities - 99.14% (31 December 2016 - 99.08%) cont/d
Number ofShares Security
ValueEUR
% ofFund
Real Estate Investment Trust cont/d23 Japan Retail Fund Investment 35,128 0.023,869 Kimco Realty 58,480 0.031,993 Klepierre 73,073 0.042,757 Land Securities Group 31,307 0.021,910 Liberty Property Trust 68,412 0.0415,921 Link REIT 122,880 0.071,118 Macerich 61,151 0.03306 Mid-America Apartment Communities 25,626 0.016 Nippon Building Fund 24,440 0.0116 Nippon Prologis REIT 28,187 0.0225 Nomura Real Estate Master Fund 25,856 0.012,154 Prologis 115,718 0.06673 Public Storage 117,136 0.061,910 Realty Income 90,696 0.05744 Regency Centers 42,863 0.026,648 Resilient REIT 67,598 0.04857 SBA Communications 116,589 0.0615,333 Scentre Group 41,847 0.021,314 Simon Property Group 187,930 0.10416 SL Green Realty 34,966 0.022,578 UDR 82,699 0.0417 Unibail-Rodamco - France listing 3,570 0.00412 Unibail-Rodamco - Netherlands listing 86,520 0.051,322 Ventas 66,067 0.044,212 VEREIT 27,325 0.01752 Vornado Realty Trust 48,960 0.032,066 Welltower 109,718 0.066,076 Westfield 37,558 0.023,766 Weyerhaeuser 110,584 0.06
3,882,850 2.06
Retail293 Advance Auto Parts 24,325 0.015,539 Aeon 77,903 0.042,089 Alimentation Couche-Tard 91,069 0.05138,879 Astra International 70,753 0.04203 AutoZone 120,260 0.061,838 Best Buy 104,803 0.06134 BGF 1,590 0.001,025 CarMax 54,741 0.03142 Chipotle Mexican Grill 34,179 0.022,359 Cie Financiere Richemont 178,007 0.091,954 Costco Wholesale 302,863 0.1623,071 CP ALL 45,394 0.025,430 CVS Health 327,844 0.171,011 Darden Restaurants 80,843 0.041,607 Dollar General 124,473 0.07959 Dollar Tree 85,701 0.05451 Dollarama 47,077 0.02230 Domino's Pizza 36,193 0.021,851 Domino's Pizza Enterprises 56,304 0.03450 Dufry 55,722 0.03173 E-Mart 36,470 0.02917 FamilyMart UNY Holdings 53,554 0.03230 Fast Retailing 76,361 0.044,210 Foschini Group 55,884 0.031,855 Gap 52,616 0.03802 Genuine Parts 63,456 0.034,958 Hennes & Mauritz 85,377 0.056,108 Home Depot 964,065 0.51
CONCEPT FUND SOLUTIONS PLC
81
db x-trackers MSCI AC World Index UCITS ETF (DR)
Portfolio of Investments as at 31 December 2017 cont/d
Equities - 99.14% (31 December 2016 - 99.08%) cont/d
Number ofShares Security
ValueEUR
% ofFund
Retail cont/d578 Hugo Boss 41,003 0.026,552 Industria de Diseno Textil 190,303 0.104,437 Isetan Mitsukoshi Holdings 45,823 0.02354 Kering 139,122 0.078,106 Kingfisher 30,838 0.021,075 Kohl's 48,549 0.031,265 L Brands 63,440 0.036,771 Lojas Renner 60,329 0.0386 Lotte Shopping 13,313 0.014,788 Lowe's 370,583 0.20539 Lululemon Athletica 35,276 0.021,694 Macquarie Infrastructure 35,536 0.0211,348 Marks & Spencer Group 40,244 0.024,270 McDonald's 612,052 0.321,411 McDonald's Holdings Japan 51,686 0.03602 Next 30,688 0.02365 Nitori Holdings 43,348 0.02525 Nordstrom 20,715 0.01351 O'Reilly Automotive 70,311 0.04698 Pandora 63,327 0.03356 PVH 40,679 0.022,650 Raia Drogasil 61,074 0.03974 Restaurant Brands International 50,023 0.031,472 Ross Stores 98,374 0.05140 Ryohin Keikaku 36,327 0.02520 Samsung C&T 50,968 0.037,721 Starbucks 369,268 0.2012,000 Steinhoff International Holdings 3,754 0.00276 Swatch Group 93,731 0.051,472 Tapestry 54,219 0.032,954 Target 160,517 0.09792 Tiffany & Co 68,561 0.043,801 TJX 242,026 0.13402 Tractor Supply 25,025 0.011,442 Travis Perkins 25,455 0.015,328 Truworths International 33,858 0.02324 Tsuruha Holdings 36,695 0.02404 Ulta Salon Cosmetics & Fragrance 75,249 0.044,067 Walgreens Boots Alliance 245,957 0.1343,117 Wal-Mart de Mexico 88,439 0.057,810 Wal-Mart Stores 642,270 0.346,332 Woolworths Holdings 27,818 0.011,765 Yum China Holdings 58,824 0.032,168 Yum! Brands 147,344 0.08
8,050,768 4.27
Semiconductors3,573 Advanced Micro Devices 30,588 0.021,509 Analog Devices 111,881 0.064,562 Applied Materials 194,212 0.104,075 ASM Pacific Technology 47,275 0.031,704 ASML Holding 247,336 0.131,855 Broadcom 396,860 0.21120,000 Hanergy Thin Film Power Group - 0.007,014 Infineon Technologies 160,165 0.0822,977 Intel 883,260 0.471,149 KLA-Tencor 100,537 0.05650 Lam Research 99,638 0.053,048 Marvell Technology Group 54,497 0.031,993 Maxim Integrated Products 86,770 0.05
CONCEPT FUND SOLUTIONS PLC
82
db x-trackers MSCI AC World Index UCITS ETF (DR)
Portfolio of Investments as at 31 December 2017 cont/d
Equities - 99.14% (31 December 2016 - 99.08%) cont/d
Textiles and Apparel851 Adidas 142,245 0.082,062 Asics 27,378 0.012,203 Burberry Group 44,473 0.022,700 Gildan Activewear 72,877 0.042,709 Hanesbrands 47,173 0.03145 Hermes International 64,706 0.031,317 LVMH Moet Hennessy Louis Vuitton 323,192 0.171,075 Michael Kors Holdings 56,355 0.03201 Mohawk Industries 46,183 0.027,000 NIKE 364,632 0.19993 Under Armour Class A Shares 11,933 0.01998 Under Armour Class C Shares 11,070 0.011,190 VF 73,334 0.049,457 Yue Yuen Industrial Holdings 30,929 0.02
1,316,480 0.70
Transportation41 AP Moller - Maersk Class A Shares 57,050 0.0323 AP Moller - Maersk Class B Shares 33,486 0.028,272 Aurizon Holdings 26,725 0.01223,457 BTS Group Holdings 47,393 0.023,247 Canadian National Railway 223,690 0.12628 Canadian Pacific Railway 95,861 0.05745 Central Japan Railway 111,141 0.061,321 CH Robinson Worldwide 98,008 0.055,312 CSX 243,349 0.135,712 Deutsche Post 227,052 0.121,529 DSV 100,339 0.051,667 East Japan Railway 135,497 0.07241 Expeditors International of Washington 12,983 0.011,149 FedEx 238,775 0.132,886 Kamigumi 53,188 0.03429 Kansas City Southern 37,591 0.022,018 Keihan Holdings 49,529 0.031,470 Keikyu 23,527 0.01517 Knight-Swift Transportation Holdings 18,823 0.01365 Kuehne + Nagel International 53,806 0.0315,152 MTR 73,928 0.042,552 Nagoya Railroad 53,523 0.031,681 Norfolk Southern 202,846 0.113,898 Odakyu Electric Railway 69,448 0.043,648 Qatar Gas Transport 13,421 0.018,158 Rumo 26,564 0.014,268 Union Pacific 476,631 0.253,700 United Parcel Service 367,134 0.19471 West Japan Railway 28,646 0.021,366 Yamato Holdings 22,898 0.01
3,222,852 1.71
Water670 American Water Works 51,048 0.0361,878 Beijing Enterprises Water Group 39,881 0.024,452 Cia de Saneamento Basico do Estado de Sao Paulo 38,371 0.02
CONCEPT FUND SOLUTIONS PLC
84
db x-trackers MSCI AC World Index UCITS ETF (DR)
Portfolio of Investments as at 31 December 2017 cont/d
Equities - 99.14% (31 December 2016 - 99.08%) cont/d
Number ofShares Security
ValueEUR
% ofFund
Water cont/d3,427 United Utilities Group 32,024 0.014,321 Veolia Environnement 91,929 0.05
253,253 0.13Total Equities 187,024,651 99.14
Preferred Stocks - 0.53%(31 December 2016 - 0.48%)
Net unrealised gain on open futures contracts 4,075 0.00Total Exchange Traded Financial Derivative Instruments 4,075 0.00
Total Financial Derivative Instruments 4,075 0.00
ValueEUR
% ofFund
Total Financial Assets at Fair Value through Profit or Loss 188,022,876 99.67Other Net Assets - 0.33%(31 December 2016 - 0.44%) 627,648 0.33
Net Assets Attributable to Redeeming Participating Shareholders 188,650,524 100.00
* The broker for the open futures contracts is Deutsche Bank AG Frankfurt.
Analysis of Total Assets % of Total Assets31/12/2017
Transferable securities admitted to an official stock exchange listing 99.63Current Assets 0.37Total Assets 100.00
CONCEPT FUND SOLUTIONS PLC
86
db x-trackers MSCI AC Far East ex Japan Index UCITS ETF (DR)
Investment Manager’s Report for the financial year ended 31 December 2017
Investment Objective
The investment objective of the Fund is to track the performance before fees and expenses of the UnderlyingAsset, which is the MSCI AC Far East ex Japan monthly Euro Hedged Index (the “Reference Index”) linked tothe MSCI AC Far East ex Japan Total Return Net Index. The Reference Index is designed to reflect the equitymarket performance of the Far East, excluding Japan.
The Reference Index is calculated and maintained by MSCI Inc (and its subsidiaries). The Reference Index isa free float-adjusted market capitalisation weighted index that is designed to measure the equity marketperformance of the Far East, excluding Japan. As of March 2013 the Reference Index consists of the following9 developed and emerging market country indices: China, Hong Kong, Indonesia, Korea, Malaysia,Philippines, Singapore, Taiwan and Thailand. The Reference Index covers approximately 85% of the freefloat-adjusted market capitalisation in each country.
The Reference Index is calculated in US Dollars on an end of day basis. The Reference Index is reviewedquarterly - in February, May, August and November - with the objective of reflecting change in the underlyingequity markets in a timely manner, while limiting undue index turnover.
The Reference Index intends to provide a hedge against exchange rate fluctuations at the Reference Indexversus the Euro by locking in foreign exchange rate on a one month forward looking basis.
Fund Performance
The Fund’s performance amounts are calculated net of fees and taxes.
The Fund performed in line with its benchmark and within guided tolerance levels.
The Fund has tracked the Reference Index within its anticipated tracking error. The anticipated tracking errorfor the Fund is 2.00%.
Total Net Assets Net Assets per Share31/12/2017 Price (at 31/12/2017)
db x-trackers MSCI AC Far East ex Japan Index UCITSETF (DR) €23,537,405 €15.90
Year to Date Year to DateFund Return Index Return
db x-trackers MSCI AC Far East ex Japan Index UCITSETF (DR) 24.23% 24.87%
Year to Date Year to DateTracking Error Tracking Difference1
db x-trackers MSCI AC Far East ex Japan Index UCITSETF (DR) 0.10% (0.64)%
1The performance difference of the share class arose from various reasons such as inaccuracies in the index replication via optimization,various fee components like management fee, fixed fee and transaction costs, specific taxes respectively tax advantages. The realisedtracking error level is contrasted with the anticipated tracking error level; the level of realised tracking error was within the expected range,due to the effectiveness of replication techniques utilised over the 2017 period.
CONCEPT FUND SOLUTIONS PLC
87
db x-trackers MSCI AC Far East ex Japan Index UCITS ETF (DR)
Portfolio of Investments as at 31 December 2017
Transferable Securities
Equities - 98.85% (31 December 2016 - 98.95%)
Number ofShares Security
ValueEUR
% ofFund
Aerospace and Defense14,890 AviChina Industry & Technology 6,599 0.03255 Hanwha Techwin 7,052 0.03467 Korea Aerospace Industries 17,237 0.07
30,888 0.13
Agriculture959 British American Tobacco Malaysia 7,893 0.0354,072 Charoen Pokphand Indonesia 9,957 0.0448,913 Golden Agri-Resources 11,278 0.053,425 Gudang Garam 17,617 0.0861,950 Hanjaya Mandala Sampoerna 17,986 0.083,970 HAP Seng Consolidated 7,802 0.0314,668 IOI 13,703 0.06784 KT&G 70,440 0.303,363 Kuala Lumpur Kepong 17,301 0.0715,673 Sime Darby Plantation 19,351 0.08
193,328 0.82
Airlines12,455 Air China 12,578 0.0510,563 AirAsia 7,282 0.0317,000 China Airlines 5,542 0.0213,386 China Southern Airlines 11,508 0.0515,223 Eva Airways 6,752 0.03325 Korean Air Lines 8,558 0.043,667 Singapore Airlines 24,382 0.11
76,602 0.33
Auto Components13,285 Cheng Shin Rubber Industry 19,518 0.083,488 Fuyao Glass Industry Group 12,243 0.05515 Hankook Tire 21,874 0.091,261 Hanon Systems 13,635 0.06454 Hyundai Mobis 92,882 0.39115 Hyundai Wia 5,815 0.034,597 Minth Group 23,090 0.106,000 Nexteer Automotive Group 11,902 0.0512,860 Weichai Power 11,727 0.05
212,686 0.90
Automobiles20,321 Brilliance China Automotive Holdings 45,244 0.194,228 BYD 30,673 0.1318,316 Dongfeng Motor Group 18,458 0.0832,787 Geely Automobile Holdings 94,655 0.4021,183 Great Wall Motor 20,197 0.0813,952 Guangzhou Automobile Group 27,526 0.121,027 Hyundai Motor 124,629 0.531,787 Kia Motors 46,569 0.20
407,951 1.73
Banks173,500 Agricultural Bank of China 67,278 0.296,722 Alliance Bank Malaysia 5,644 0.0211,572 AMMB Holdings 10,501 0.041,862 Bangkok Bank 10,420 0.0465,701 Bank Central Asia 88,317 0.3822,331 Bank Danamon Indonesia 9,526 0.04
CONCEPT FUND SOLUTIONS PLC
88
db x-trackers MSCI AC Far East ex Japan Index UCITS ETF (DR)
Portfolio of Investments as at 31 December 2017 cont/d
Equities - 98.85% (31 December 2016 - 98.95%) cont/d
Number ofShares Security
ValueEUR
% ofFund
Banks cont/d124,286 Bank Mandiri Persero 61,030 0.2649,660 Bank Negara Indonesia Persero 30,177 0.13528,512 Bank of China 216,201 0.9257,853 Bank of Communications 35,746 0.158,084 Bank of East Asia 29,151 0.124,974 Bank of the Philippine Islands 8,970 0.04369,630 Bank Rakyat Indonesia Persero 82,584 0.3513,403 BDO Unibank 36,669 0.1625,048 BOC Hong Kong Holdings 105,667 0.4531,363 Chang Hwa Commercial Bank 14,526 0.0659,405 China CITIC Bank 31,009 0.13563,524 China Construction Bank 432,232 1.8419,542 China Everbright Bank 7,599 0.0325,832 China Merchants Bank 85,584 0.3637,366 China Minsheng Banking 31,168 0.1317,047 Chongqing Rural Commercial Bank 10,024 0.0430,122 CIMB Group Holdings 40,538 0.1739,008 CITIC 46,874 0.2011,970 DBS Group Holdings 185,359 0.795,122 Hang Seng Bank 105,856 0.454,367 Hong Leong Bank 15,277 0.07494,935 Industrial & Commercial Bank of China 331,643 1.411,745 Industrial Bank of Korea 22,330 0.103,879 Kasikornbank - Non-voting Rights 22,996 0.108,480 Kasikornbank - Voting Rights 51,789 0.2224,742 Krung Thai Bank 12,139 0.0528,173 Malayan Banking 56,814 0.244,566 Metropolitan Bank & Trust 7,724 0.0320,966 Oversea-Chinese Banking 161,875 0.6919,392 Public Bank 82,921 0.355,515 RHB Bank 5,674 0.021,520 Security Bank 6,375 0.0312,156 Siam Commercial Bank 46,594 0.2027,375 Taiwan Business Bank 6,427 0.0382,595 TMB Bank 6,374 0.038,892 United Overseas Bank 146,561 0.622,505 Woori Bank 30,691 0.13
Building Products8,146 Anhui Conch Cement 31,892 0.1415,837 Asia Cement 12,498 0.0519,845 China National Building Material 14,778 0.0613,052 Indocement Tunggal Prakarsa 17,585 0.08971 Nien Made Enterprise 8,641 0.0420,933 Semen Indonesia Persero 12,720 0.05
CONCEPT FUND SOLUTIONS PLC
89
db x-trackers MSCI AC Far East ex Japan Index UCITS ETF (DR)
Portfolio of Investments as at 31 December 2017 cont/d
Equities - 98.85% (31 December 2016 - 98.95%) cont/d
Number ofShares Security
ValueEUR
% ofFund
Building Products cont/d23,179 Taiwan Cement 23,643 0.10
121,757 0.52
Chemicals19,578 Formosa Chemicals & Fibre 56,432 0.2427,434 Formosa Plastics 75,775 0.32718 Hanwha Chemical 17,650 0.079,935 Indorama Ventures 13,519 0.0673,108 IRPC 13,170 0.0639 KCC 11,559 0.054,261 Kingboard Chemical Holdings 19,178 0.08120 Kumho Petrochemical 9,288 0.04306 LG Chem 96,405 0.41103 Lotte Chemical 29,485 0.1231,395 Nan Ya Plastics 68,441 0.2916,357 Petronas Chemicals Group 25,917 0.1115,148 PTT Global Chemical 32,902 0.1423,514 Sinopec Shanghai Petrochemical 11,147 0.05
480,868 2.04
Commercial Services and Supplies11,138 China Conch Venture Holdings 21,476 0.098,449 China Merchants Port Holdings 18,407 0.0810,869 COSCO Shipping Ports 9,414 0.0434,946 Hutchison Port Holdings Trust 12,077 0.053,766 International Container Terminal Services 6,628 0.038,247 Jiangsu Expressway 10,455 0.04892 New Oriental Education & Technology Group 69,827 0.30114 S-1 9,489 0.041,921 TAL Education Group 47,529 0.207,287 Westports Holdings 5,548 0.029,252 Zhejiang Expressway 8,466 0.04
Construction and Engineering28,800 Airports of Thailand 50,043 0.2110,208 Beijing Capital International Airport 12,810 0.0629,267 China Communications Construction 27,686 0.1216,902 China Communications Services 9,435 0.0412,976 China Railway Construction 12,524 0.0526,323 China Railway Group 16,208 0.0713,450 China State Construction International Holdings 15,675 0.074,365 CK Infrastructure Holdings 31,225 0.13184 Daelim Industrial 11,794 0.05831 Daewoo Engineering & Construction 3,827 0.0226,538 DMCI Holdings 6,375 0.0311,474 Gamuda Bhd 11,711 0.05330 GS Engineering & Construction 7,265 0.03396 Hyundai Development Co-Engineering & Construction 11,875 0.05530 Hyundai Engineering & Construction 14,966 0.06206 Hyundai Heavy Industries 16,105 0.07152 KEPCO Plant Service & Engineering 4,801 0.025,946 Malaysia Airports Holdings 10,755 0.051,753 Samsung Heavy Industries 9,996 0.044,597 SATS 14,896 0.066,594 Sembcorp Industries 12,451 0.0510,286 Singapore Technologies Engineering 20,896 0.0915,538 Yangzijiang Shipbuilding Holdings 14,233 0.06
347,552 1.48
Containers and Packaging11,000 Lee & Man Paper Manufacturing 10,828 0.05
10,828 0.05
Distribution and Wholesale11,990 AKR Corporindo 4,673 0.027,719 Berli Jucker 13,018 0.06317 Hanwha 10,234 0.04659 Jardine Cycle & Carriage 16,701 0.07644 LG 45,588 0.1939,295 Li & Fung 17,959 0.08
108,173 0.46
Diversified Financials1,712 BNK Financial Group 12,545 0.058,029 Chailease Holding 19,458 0.0858,359 China Cinda Asset Management 17,781 0.0889,555 China Development Financial Holding 25,437 0.115,972 China Everbright 11,121 0.0522,534 China Galaxy Securities 13,827 0.0666,925 China Huarong Asset Management 26,308 0.1115,289 CITIC Securities 26,255 0.11116,377 CTBC Financial Holding 66,764 0.281,193 DGB Financial Group 9,791 0.0462,611 E.Sun Financial Holding 33,115 0.1413,936 Far East Horizon 9,902 0.0461,327 First Financial Holding 33,552 0.1444,251 Fubon Financial Holding 62,784 0.27
CONCEPT FUND SOLUTIONS PLC
91
db x-trackers MSCI AC Far East ex Japan Index UCITS ETF (DR)
Portfolio of Investments as at 31 December 2017 cont/d
Equities - 98.85% (31 December 2016 - 98.95%) cont/d
Number ofShares Security
ValueEUR
% ofFund
Diversified Financials cont/d8,908 GF Securities 14,918 0.06615 GT Capital Holdings 13,255 0.0621,867 Haitong Securities 26,416 0.111,971 Hana Financial Group 76,355 0.337,807 Hong Kong Exchanges & Clearing 199,437 0.851,492 Hong Leong Financial Group 5,490 0.0247,392 Hua Nan Financial Holdings 22,215 0.1011,036 Huatai Securities 18,293 0.082,645 KB Financial Group 130,448 0.55257 Korea Investment Holdings 13,794 0.0672,151 Mega Financial Holding 48,560 0.212,525 Mirae Asset Daewoo 18,051 0.08915 NH Investment & Securities 9,894 0.04210 Samsung Card 6,469 0.03461 Samsung Securities 13,125 0.062,842 Shinhan Financial Group 109,213 0.465,296 Singapore Exchange 24,554 0.1172,847 SinoPac Financial Holdings 19,713 0.0863,116 Taishin Financial Holding 24,463 0.1052,694 Taiwan Cooperative Financial Holding 24,479 0.108,083 Wharf Real Estate Investment 44,776 0.1969,465 Yuanta Financial Holding 26,826 0.11
1,259,384 5.35
Diversified Telecommunications6,827 Advanced Info Service 33,320 0.1414,000 Asia Pacific Telecom 3,910 0.0218,191 Axiata Group 20,551 0.0941,361 China Mobile 349,191 1.4892,054 China Telecom 36,480 0.1541,757 China Unicom Hong Kong 46,975 0.2025,262 Chunghwa Telecom 74,936 0.3221,100 DiGi.Com 22,144 0.0910,740 Far EasTone Telecommunications 22,091 0.09222 Globe Telecom 7,036 0.0326,098 HKT Trust & HKT 27,691 0.124,559 HTC 9,326 0.04212 KT 4,989 0.0212,790 Maxis 15,818 0.078,500 Meitu 9,852 0.0428,670 PCCW 13,866 0.06588 PLDT 14,517 0.06367 Samsung SDI 58,382 0.2554,355 Singapore Telecommunications 120,921 0.51133 SK Telecom 27,624 0.124,103 StarHub 7,287 0.0310,858 Taiwan Mobile 32,664 0.147,526 Telekom Malaysia 9,757 0.04335,648 Telekomunikasi Indonesia Persero 91,474 0.3913,529 Tower Bersama Infrastructure 5,335 0.0269,469 True 11,006 0.054,958 ZTE 15,502 0.07
1,092,645 4.64
Electric Utilities10,350 Aboitiz Power 7,174 0.0370,311 CGN Power 15,879 0.0712,732 China Resources Power Holdings 19,748 0.0810,935 CLP Holdings 93,134 0.407,382 Energy Development 707 0.00
CONCEPT FUND SOLUTIONS PLC
92
db x-trackers MSCI AC Far East ex Japan Index UCITS ETF (DR)
Portfolio of Investments as at 31 December 2017 cont/d
Equities - 98.85% (31 December 2016 - 98.95%) cont/d
Number ofShares Security
ValueEUR
% ofFund
Electric Utilities cont/d3,623 Glow Energy 7,522 0.0318,049 HK Electric Investments & HK Electric Investments 13,748 0.0628,776 Huaneng Power International 15,021 0.0633,655 Huaneng Renewables 9,501 0.041,721 Korea Electric Power 51,074 0.221,500 Manila Electric 8,223 0.049,238 Power Assets Holdings 64,903 0.2822,726 Tenaga Nasional 71,363 0.30
377,997 1.61
Electrical Equipment13,006 Delta Electronics 52,229 0.22708 LG Electronics 58,380 0.2596 LG Innotek 10,754 0.05
121,363 0.52
Electronics4,901 AAC Technologies Holdings 72,781 0.3159,620 AU Optronics 20,689 0.094,500 BYD Electronic International 8,159 0.043,070 Delta Electronics Thailand 5,746 0.03103,744 Hon Hai Precision Industry 276,387 1.171,549 LG Display 36,028 0.154,412 Micro-Star International 9,458 0.0413,046 Pegatron 26,286 0.11375 Samsung Electro-Mechanics 29,171 0.1210,298 Synnex Technology International 11,686 0.0510,733 WPG Holdings 11,834 0.051,000 Yageo 9,879 0.043,229 Zhen Ding Technology Holding 5,919 0.03
524,023 2.23
Energy Equipment and Services16,259 China Everbright International 19,330 0.0822,071 China Longyuan Power Group 13,073 0.067,686 Energy Absolute 10,311 0.0444,968 Fullshare Holdings 17,245 0.0786,542 GCL-Poly Energy Holdings 12,907 0.06117 OCI 12,378 0.05
85,244 0.36
Food Products63 BGF Retail 10,292 0.0420,584 Charoen Pokphand Foods 12,624 0.0527,297 China Huishan Dairy Holdings - 0.0018,726 China Mengniu Dairy 46,381 0.2052 CJ CheilJedang 14,805 0.06259 Dongsuh 5,863 0.0314,690 First Pacific 8,294 0.0417,006 Indofood CBP Sukses Makmur 9,290 0.0431,175 Indofood Sukses Makmur 14,591 0.0619,140 JG Summit Holdings 23,021 0.10201 Lotte 10,179 0.04400 Nestle Malaysia 8,494 0.04145 Orion 11,787 0.058 Ottogi 5,016 0.023,370 PPB Group 11,955 0.054,085 Standard Foods 8,459 0.0414,084 Thai Union Group 7,162 0.0313,117 Tingyi Cayman Islands Holding 21,240 0.09
CONCEPT FUND SOLUTIONS PLC
93
db x-trackers MSCI AC Far East ex Japan Index UCITS ETF (DR)
Portfolio of Investments as at 31 December 2017 cont/d
Equities - 98.85% (31 December 2016 - 98.95%) cont/d
Number ofShares Security
ValueEUR
% ofFund
Food Products cont/d32,702 Uni-President Enterprises 60,400 0.265,856 Universal Robina 14,751 0.0633,833 Want Want China Holdings 23,608 0.1058,629 WH Group 55,088 0.2310,604 Wilmar International 20,418 0.09
403,718 1.72
Gas Utilities3,459 Beijing Enterprises Holdings 17,098 0.0711,833 China Gas Holdings 27,228 0.125,842 China Resources Gas Group 17,644 0.075,019 ENN Energy Holdings 29,808 0.1355,650 Hong Kong & China Gas 90,823 0.39180 Korea Gas 5,958 0.0375,769 Perusahaan Gas Negara Persero 8,139 0.03
196,698 0.84
Health Care Equipment and Supplies8,893 China Medical System Holdings 17,261 0.084,840 Hengan International Group 44,729 0.1912,854 Shandong Weigao Group Medical Polymer 7,791 0.03
69,781 0.30
Health Care Providers and Services24,879 Bangkok Dusit Medical Services 13,287 0.062,461 Bumrungrad Hospital 11,885 0.0514,213 IHH Healthcare 17,139 0.07354 SillaJen 25,748 0.11
68,059 0.29
Hotels, Restaurants and Leisure82,421 Alibaba Pictures Group 9,219 0.042,772 City Developments 21,575 0.0915,675 Galaxy Entertainment Group 104,700 0.4515,971 Genting 30,236 0.1320,418 Genting Malaysia 23,655 0.1040,655 Genting Singapore 33,188 0.1428,000 Golden Resorts Group 22,371 0.10806 Kangwon Land 21,819 0.091,638 Melco Resorts & Entertainment 39,613 0.176,665 MGM China Holdings 16,792 0.0716,112 Sands China 69,257 0.298,346 Shangri-La Asia 15,773 0.0713,417 SJM Holdings 10,005 0.0410,599 Wynn Macau 27,946 0.12
Household Products354 Coway 26,904 0.128,370 Haier Electronics Group 19,081 0.0872 Hanssem 10,082 0.0410,436 Unilever Indonesia 35,808 0.15
91,875 0.39
CONCEPT FUND SOLUTIONS PLC
94
db x-trackers MSCI AC Far East ex Japan Index UCITS ETF (DR)
Portfolio of Investments as at 31 December 2017 cont/d
Equities - 98.85% (31 December 2016 - 98.95%) cont/d
Number ofShares Security
ValueEUR
% ofFund
Industrial13,139 Aboitiz Equity Ventures 16,220 0.071,000 Airtac International Group 14,972 0.0629,352 Alliance Global Group 7,835 0.0396 CJ 13,554 0.0618,016 CK Hutchison Holdings 188,278 0.8027,484 CRRC 24,477 0.104,400 Hartalega Holdings 9,670 0.041,527 Hiwin Technologies 13,760 0.0619,334 IJM 12,134 0.051,425 Jardine Matheson Holdings 72,093 0.311,468 Jardine Strategic Holdings 48,387 0.219,660 Keppel 44,244 0.19670 Largan Precision 75,374 0.3210,360 NWS Holdings 15,561 0.07629 Siam Cement - Non-voting Rights 7,779 0.032,129 Siam Cement - Voting Rights 26,657 0.1115,673 Sime Darby 7,128 0.034,748 Sunny Optical Technology Group 50,530 0.213,315 Swire Pacific 25,550 0.118,083 Wharf Holdings 23,249 0.1029,069 YTL 8,195 0.043,656 Zhuzhou CRRC Times Electric 19,805 0.08
725,452 3.08
Insurance80,922 AIA Group 574,565 2.4454,233 Cathay Financial Holding 81,196 0.3549,691 China Life Insurance 129,958 0.5516,797 China Life Insurance - Taiwan 14,078 0.0617,594 China Pacific Insurance Group 70,380 0.3010,692 China Taiping Insurance Holdings 33,373 0.14328 DB Insurance 18,167 0.0817,009 Fosun International 31,383 0.131,735 Hanwha Life Insurance 9,326 0.04434 Hyundai Marine & Fire Insurance 15,868 0.07218 ING Life Insurance Korea 9,056 0.045,105 New China Life Insurance 29,041 0.1245,807 People's Insurance Group of China 18,787 0.0830,430 PICC Property & Casualty 48,690 0.2134,796 Ping An Insurance Group of China 301,550 1.28207 Samsung Fire & Marine Insurance 42,994 0.18466 Samsung Life Insurance 45,131 0.1956,527 Shin Kong Financial Holding 16,610 0.07
1,490,153 6.33
Leisure Equipment and Products1,986 Giant Manufacturing 9,087 0.04
9,087 0.04
Machinery258 Doosan Bobcat 7,185 0.03346 Doosan Heavy Industries & Construction 4,132 0.024,402 Haitian International Holdings 11,020 0.0566 Hyundai Robotics 19,561 0.0819,431 Shanghai Electric Group 6,665 0.0312,778 Teco Electric and Machinery 10,191 0.0411,218 United Tractors 24,375 0.10
83,129 0.35
CONCEPT FUND SOLUTIONS PLC
95
db x-trackers MSCI AC Far East ex Japan Index UCITS ETF (DR)
Portfolio of Investments as at 31 December 2017 cont/d
Equities - 98.85% (31 December 2016 - 98.95%) cont/d
Number ofShares Security
ValueEUR
% ofFund
Media11,389 Astro Malaysia Holdings 6,211 0.03469 Cheil Worldwide 7,734 0.03127 CJ E&M 9,652 0.049,996 I-CABLE Communications 244 0.0010,826 Singapore Press Holdings 17,877 0.0742,350 Surya Citra Media 6,447 0.03
48,165 0.20
Metals and Mining95,861 Adaro Energy 10,944 0.0525,851 Aluminum of China 15,394 0.0714,720 Banpu 7,335 0.034,372 Catcher Technology 40,130 0.1724,000 China Molybdenum 12,835 0.0522,560 China Shenhua Energy 48,667 0.2184,903 China Steel 58,805 0.25138 Hyosung 14,975 0.06533 Hyundai Steel 24,297 0.108,011 Jiangxi Copper 10,582 0.0557 Korea Zinc 21,860 0.09493 POSCO 127,515 0.548,700 Press Metal Aluminium Holdings 9,649 0.0411,912 Yanzhou Coal Mining 11,599 0.0539,195 Zijin Mining Group 12,318 0.05
426,905 1.81
Oil and Gas11,681 China Oilfield Services 9,470 0.04170,785 China Petroleum & Chemical 104,250 0.44119,229 CNOOC 142,511 0.6121,204 Dialog Group 10,952 0.058,927 Formosa Petrochemical 28,854 0.12340 GS Holdings 16,451 0.0722,239 Kunlun Energy 19,285 0.08140,744 PetroChina 81,714 0.351,736 Petronas Dagangan 8,666 0.044,780 Petronas Gas 17,194 0.076,999 PTT 78,692 0.339,355 PTT Exploration & Production 23,905 0.1026,818 Sapura Energy 3,918 0.02431 SK Innovation 68,563 0.29298 S-Oil 27,122 0.127,413 Thai Oil 19,606 0.08
661,153 2.81
Paper and Related Products11,051 Nine Dragons Paper Holdings 14,739 0.06
14,739 0.06
Personal Products215 Amorepacific 50,927 0.21195 Amorepacific Group 21,388 0.0963 LG Household & Health Care 58,270 0.25
130,585 0.55
Pharmaceuticals541 Celltrion 93,048 0.40232 Celltrion Healthcare 19,599 0.0812,500 China Resources Pharmaceutical Group 13,476 0.06
CONCEPT FUND SOLUTIONS PLC
96
db x-trackers MSCI AC Far East ex Japan Index UCITS ETF (DR)
Portfolio of Investments as at 31 December 2017 cont/d
Equities - 98.85% (31 December 2016 - 98.95%) cont/d
Number ofShares Security
ValueEUR
% ofFund
Pharmaceuticals cont/d32,253 CSPC Pharmaceutical Group 54,219 0.2342 Hanmi Pharm 19,080 0.08140,470 Kalbe Farma 14,571 0.063,232 Shanghai Fosun Pharmaceutical Group 17,267 0.0725,190 Sihuan Pharmaceutical Holdings Group 7,541 0.0329,701 Sino Biopharmaceutical 43,854 0.198,065 Sinopharm Group 29,040 0.1255 Yuhan 9,370 0.04
321,065 1.36
Real Estate10,000 Agile Group Holding 12,634 0.051,669 Ayala 28,260 0.1249,210 Ayala Land 36,614 0.1651,275 Bumi Serpong Damai 5,350 0.0217,037 CapitaLand 37,477 0.168,690 Central Pattana 18,930 0.0821,833 China Evergrande Group 62,682 0.2724,639 China Jinmao Holdings Group 9,029 0.0425,917 China Overseas Land & Investment 69,438 0.2918,329 China Resources Land 44,910 0.198,054 China Vanke 26,769 0.1117,208 CK Asset Holdings 125,206 0.5335,288 Country Garden Holdings 56,013 0.2417,733 Global Logistic Properties 37,240 0.166,251 Guangzhou R&F Properties 11,733 0.056,062 Hang Lung Group 18,566 0.0813,725 Hang Lung Properties 27,927 0.127,955 Henderson Land Development 43,643 0.195,290 Highwealth Construction 6,262 0.037,801 Hongkong Land Holdings 45,735 0.194,210 Hysan Development 18,590 0.0811,000 IOI Properties Group 4,188 0.024,456 Kerry Properties 16,686 0.0710,000 Longfor Properties 20,859 0.0982,600 Megaworld 7,110 0.0340,415 New World Development 50,546 0.21156,800 Pakuwon Jati 6,593 0.036,340 Ruentex Development 5,669 0.023,217 Shanghai Industrial Holdings 7,677 0.037,926 Shimao Property Holdings 14,354 0.0615,673 Sime Darby Property 5,741 0.0220,977 Sino Land 30,928 0.1319,822 Sino-Ocean Group Holding 11,382 0.0558,349 SM Prime Holdings 36,502 0.1614,069 SOHO China 6,849 0.039,500 SP Setia Group 7,819 0.039,643 Sun Hung Kai Properties 133,956 0.5713,758 Sunac China Holdings 47,413 0.207,791 Swire Properties 20,915 0.093,335 UOL Group 18,434 0.085,414 Wheelock & Co 32,183 0.14
1,228,812 5.22
Real Estate Investment Trust16,896 Ascendas Real Estate Investment Trust 28,638 0.1216,820 CapitaLand Commercial Trust 20,229 0.0916,694 CapitaLand Mall Trust 22,158 0.0914,808 Link REIT 114,290 0.48
CONCEPT FUND SOLUTIONS PLC
97
db x-trackers MSCI AC Far East ex Japan Index UCITS ETF (DR)
Portfolio of Investments as at 31 December 2017 cont/d
Equities - 98.85% (31 December 2016 - 98.95%) cont/d
Number ofShares Security
ValueEUR
% ofFund
Real Estate Investment Trust cont/d17,091 Suntec Real Estate Investment Trust 22,898 0.10
208,213 0.88
Retail7,350 ANTA Sports Products 27,757 0.12134,740 Astra International 68,644 0.29118 BGF 1,400 0.0132,778 CP ALL 64,494 0.27142 E-Mart 29,935 0.1377,493 GOME Retail Holdings 7,760 0.03178 GS Retail 5,580 0.0228,091 Home Product Center 9,188 0.041,848 Hotai Motor 18,307 0.08210 Hotel Shilla 13,869 0.06107 Hyundai Department Store 8,698 0.042,885 Jollibee Foods 12,176 0.0576 Lotte Shopping 11,765 0.0517,033 Matahari Department Store 10,455 0.0414,716 Minor International 16,452 0.073,800 President Chain Store 30,201 0.133,428 Robinson 6,395 0.034,112 Ruentex Industries 5,823 0.02511 Samsung C&T 50,086 0.214,868 Shanghai Pharmaceuticals Holding 10,968 0.0547 Shinsegae 10,968 0.051,626 SM Investments 26,854 0.1116,323 Sun Art Retail Group 14,363 0.062,553 Yum China Holdings 85,086 0.36
db x-trackers MSCI AC Far East ex Japan Index UCITS ETF (DR)
Portfolio of Investments as at 31 December 2017 cont/dValueEUR
% ofFund
Total Financial Assets at Fair Value through Profit or Loss 23,514,933 99.90Other Net Assets - 0.10% (31 December 2016 - 0.07%) 22,472 0.10
Net Assets Attributable to Redeeming Participating Shareholders 23,537,405 100.00
Analysis of Total Assets % of Total Assets31/12/2017
Transferable securities admitted to an official stock exchange listing 99.67Current Assets 0.33Total Assets 100.00
CONCEPT FUND SOLUTIONS PLC
100
db x-trackers MSCI USA Index UCITS ETF (DR)
Investment Manager’s Report for the financial year ended 31 December 2017
Investment Objective
The investment objective of the Fund is to track the performance before fees and expenses of the UnderlyingAsset, which is the MSCI Total Return Net USA Index (the “Reference Index”). The Reference Index isdesigned to reflect the performance of the shares of certain companies in the USA. The companies making upthe Reference Index are large and medium sized companies.
The Reference Index is calculated and maintained by MSCI Inc (and its subsidiaries). The Reference Index isa free float-adjusted market capitalisation weighted index reflecting the performance of large and midcapitalisation companies in the United States. According to the MSCI index methodology the Reference Indextargets an 85% free float-adjusted market representation level within each industry group in the USA market.
The Reference Index is calculated in US Dollars on an end of day basis.
The Reference Index has a base date of 31 December 1969.
Fund Performance
The Fund’s performance amounts are calculated net of fees and taxes.
The Fund performed in line with its benchmark and within guided tolerance levels.
The Fund has tracked the Reference Index within its anticipated tracking error. The anticipated tracking errorfor the Fund is 1.00%.
Total Net Assets Net Assets per Share31/12/2017 Price (at 31/12/2017)
db x-trackers MSCI USA Index UCITS ETF (DR) $4,173,279,381 $70.72
Year to Date Year to DateFund Return Index Return
db x-trackers MSCI USA Index UCITS ETF (DR) 21.47% 21.19%
Year to Date Year to DateTracking Error Tracking Difference1
db x-trackers MSCI USA Index UCITS ETF (DR) 0.03% 0.28%
1The performance difference of the share class arose from various reasons such as inaccuracies in the index replication via optimization,various fee components like management fee, fixed fee and transaction costs, specific taxes respectively tax advantages. The realisedtracking error level is contrasted with the anticipated tracking error level; the level of realised tracking error was within the expected range,due to the effectiveness of replication techniques utilised over the 2017 period.
CONCEPT FUND SOLUTIONS PLC
101
db x-trackers MSCI USA Index UCITS ETF (DR)
Portfolio of Investments as at 31 December 2017
Transferable Securities
Equities - 99.51% (31 December 2016 - 99.61%)
Number ofShares Security
ValueUSD
% ofFund
Aerospace and Defense68,953 Arconic 1,878,969 0.0597,575 Boeing 28,775,843 0.6944,226 General Dynamics 8,997,780 0.2220,769 Harris 2,941,929 0.0713,601 L3 Technologies 2,690,958 0.0645,045 Lockheed Martin 14,461,697 0.3528,729 Northrop Grumman 8,817,217 0.2150,409 Raytheon 9,469,331 0.2328,247 Rockwell Collins 3,830,858 0.0920,563 Spirit AeroSystems Holdings 1,794,122 0.049,008 TransDigm Group 2,473,777 0.06131,834 United Technologies 16,818,063 0.40
102,950,544 2.47
Agriculture332,388 Altria Group 23,735,827 0.5797,480 Archer-Daniels-Midland 3,906,999 0.0924,362 Bunge 1,634,203 0.04269,151 Philip Morris International 28,435,803 0.68
57,712,832 1.38
Airlines21,184 American Airlines Group 1,102,204 0.0331,449 Delta Air Lines 1,761,144 0.0425,970 Southwest Airlines 1,699,736 0.0413,186 United Continental Holdings 888,736 0.02
Automobiles642,321 Ford Motor 8,022,589 0.19227,305 General Motors 9,317,232 0.2261,042 PACCAR 4,338,865 0.1123,164 Tesla 7,212,112 0.17
28,890,798 0.69
Banks1,738,751 Bank of America 51,327,929 1.23179,188 Bank of New York Mellon 9,651,066 0.23140,144 BB&T 6,967,960 0.1783,911 Capital One Financial 8,355,857 0.2023,489 CIT Group 1,156,363 0.03472,643 Citigroup 35,169,366 0.8486,855 Citizens Financial Group 3,646,173 0.0930,499 Comerica 2,647,618 0.0626,358 East West Bancorp 1,603,357 0.04127,744 Fifth Third Bancorp 3,875,753 0.0927,365 First Republic Bank 2,370,904 0.0663,737 Goldman Sachs Group 16,237,638 0.39189,044 Huntington Bancshares 2,752,481 0.07
CONCEPT FUND SOLUTIONS PLC
102
db x-trackers MSCI USA Index UCITS ETF (DR)
Portfolio of Investments as at 31 December 2017 cont/d
Equities - 99.51% (31 December 2016 - 99.61%) cont/d
Number ofShares Security
ValueUSD
% ofFund
Banks cont/d610,484 JPMorgan Chase & Co 65,285,159 1.56188,639 KeyCorp 3,804,849 0.0923,702 M&T Bank 4,052,805 0.10238,899 Morgan Stanley 12,535,031 0.3084,847 New York Community Bancorp 1,104,708 0.0337,618 Northern Trust 3,757,662 0.0959,759 People's United Financial 1,117,493 0.0383,120 PNC Financial Services Group 11,993,385 0.29207,286 Regions Financial 3,581,902 0.089,552 Signature Bank 1,311,108 0.0364,843 State Street 6,329,325 0.1583,238 SunTrust Banks 5,376,342 0.139,118 SVB Financial Group 2,131,515 0.05290,102 US Bancorp 15,543,665 0.37818,114 Wells Fargo & Co 49,634,976 1.1935,076 Zions Bancorporation 1,782,913 0.04
Electric Utilities114,734 AES 1,242,569 0.0340,156 Alliant Energy 1,711,047 0.0442,163 Ameren 2,487,195 0.0685,458 American Electric Power 6,287,145 0.1571,153 CenterPoint Energy 2,017,899 0.0549,008 CMS Energy 2,318,078 0.0553,845 Consolidated Edison 4,574,133 0.11111,672 Dominion Energy 9,052,132 0.2231,187 DTE Energy 3,413,729 0.08121,630 Duke Energy 10,230,299 0.2457,184 Edison International 3,616,316 0.0931,208 Entergy 2,540,019 0.0655,056 Eversource Energy 3,478,438 0.08166,828 Exelon 6,574,692 0.1677,225 FirstEnergy 2,364,630 0.0681,530 NextEra Energy 12,734,171 0.3034,678 OGE Energy 1,141,253 0.0389,122 PG&E 3,995,339 0.1019,411 Pinnacle West Capital 1,653,429 0.04119,148 PPL 3,687,631 0.0987,932 Public Service Enterprise Group 4,528,498 0.1123,589 SCANA 938,370 0.02173,674 Southern 8,351,983 0.2044,552 Vistra Energy 816,193 0.0254,843 WEC Energy Group 3,643,221 0.0926,044 Westar Energy 1,375,123 0.0388,236 Xcel Energy 4,245,034 0.10
109,018,566 2.61
CONCEPT FUND SOLUTIONS PLC
106
db x-trackers MSCI USA Index UCITS ETF (DR)
Portfolio of Investments as at 31 December 2017 cont/d
Equities - 99.51% (31 December 2016 - 99.61%) cont/d
Media59,988 CBS 3,539,292 0.0833,508 Charter Communications 11,257,348 0.27815,575 Comcast 32,663,779 0.7826,665 Discovery Communications Class A Shares 596,763 0.0135,998 Discovery Communications Class C Shares 762,078 0.0239,443 DISH Network 1,883,403 0.0468,188 Interpublic Group 1,374,670 0.0318,575 Liberty Broadband 1,581,847 0.0435,180 Liberty Global Class A Shares 1,260,851 0.0398,055 Liberty Global Class C Shares 3,318,181 0.0834,941 Liberty Media-Liberty Formula One 1,193,585 0.0315,987 Liberty Media-Liberty SiriusXM Class A Shares 634,044 0.0231,014 Liberty Media-Liberty SiriusXM Class C Shares 1,230,015 0.0366,264 News Class A Shares 1,074,139 0.0340,006 Omnicom Group 2,913,637 0.0714,951 Scripps Networks Interactive 1,276,516 0.03279,857 Sirius XM Holdings 1,500,034 0.04134,833 Time Warner 12,333,174 0.30182,412 Twenty-First Century Fox Class A Shares 6,298,686 0.1576,138 Twenty-First Century Fox Class B Shares 2,597,829 0.0661,107 Viacom 1,882,707 0.04267,592 Walt Disney 28,768,816 0.69
Software124,449 Activision Blizzard 7,880,111 0.1985,595 Adobe Systems 14,999,668 0.3629,723 Akamai Technologies 1,933,184 0.0514,708 ANSYS 2,170,754 0.0534,412 Autodesk 3,607,410 0.0920,235 Broadridge Financial Solutions 1,832,886 0.0454,829 CA 1,824,709 0.0448,647 Cadence Design Systems 2,034,418 0.0521,862 CDK Global 1,558,323 0.0452,323 Cerner 3,526,047 0.0826,302 Citrix Systems 2,314,576 0.0653,594 Electronic Arts 5,630,586 0.1357,691 Fidelity National Information Services 5,428,146 0.13
CONCEPT FUND SOLUTIONS PLC
113
db x-trackers MSCI USA Index UCITS ETF (DR)
Portfolio of Investments as at 31 December 2017 cont/d
Equities - 99.51% (31 December 2016 - 99.61%) cont/d
Number ofShares Security
ValueUSD
% ofFund
Software cont/d76,651 First Data 1,280,838 0.0336,504 Fiserv 4,786,770 0.1142,231 Intuit 6,663,207 0.1613,456 Jack Henry & Associates 1,573,814 0.041,270,096 Microsoft 108,644,012 2.6015,622 MSCI 1,976,808 0.05538,509 Oracle 25,460,705 0.6156,110 Paychex 3,819,969 0.0930,767 Red Hat 3,695,117 0.09118,484 salesforce.com 12,112,619 0.2929,474 ServiceNow 3,843,115 0.0923,998 Splunk 1,987,994 0.0530,306 SS&C Technologies Holdings 1,226,787 0.0326,097 Synopsys 2,224,508 0.0518,389 Take-Two Interactive Software 2,018,744 0.0518,851 Veeva Systems 1,042,083 0.0312,392 Vmware 1,552,965 0.0423,270 Workday 2,367,490 0.06
241,018,363 5.78
Textiles and Apparel63,205 Hanesbrands 1,321,616 0.0326,288 Michael Kors Holdings 1,654,830 0.0410,941 Mohawk Industries 3,018,622 0.07227,411 NIKE 14,224,558 0.349,612 Ralph Lauren 996,668 0.0332,074 Under Armour Class A Shares 462,828 0.0132,624 Under Armour Class C Shares 434,552 0.0157,977 VF 4,290,298 0.10
26,403,972 0.63
Transportation24,393 CH Robinson Worldwide 2,173,172 0.05158,718 CSX 8,731,077 0.2131,405 Expeditors International of Washington 2,031,589 0.0544,275 FedEx 11,048,384 0.2715,215 JB Hunt Transport Services 1,749,421 0.0418,340 Kansas City Southern 1,929,735 0.0524,907 Knight-Swift Transportation Holdings 1,088,934 0.0350,074 Norfolk Southern 7,255,723 0.1710,741 Old Dominion Freight Line 1,412,979 0.03139,095 Union Pacific 18,652,639 0.45119,686 United Parcel Service 14,260,587 0.34
70,334,240 1.69
Water31,007 American Water Works 2,836,830 0.07
2,836,830 0.07Total Equities 4,152,962,024 99.51
CONCEPT FUND SOLUTIONS PLC
114
db x-trackers MSCI USA Index UCITS ETF (DR)
Portfolio of Investments as at 31 December 2017 cont/d
Exchange Traded Funds - 0.17% (31 December 2016 - 0.00%)
Number ofShares Security
ValueUSD
% ofFund
38,000 db x-trackers MSCI USA Consumer Discretionary Index UCITS ETF (DR) 1,322,989 0.0332,000 db x-trackers MSCI USA Consumer Staples Index UCITS ETF (DR) 1,009,197 0.0330,000 db x-trackers MSCI USA Energy Index UCITS ETF (DR) 1,118,160 0.0356,000 db x-trackers MSCI USA Financials Index UCITS ETF (DR) 1,158,220 0.0330,000 db x-trackers MSCI USA Health Care Index UCITS ETF (DR) 982,167 0.0248,000 db x-trackers MSCI USA Information Technology Index UCITS ETF (DR) 1,367,448 0.03Total Exchange Traded Funds 6,958,181 0.17Total Transferable Securities 4,159,920,205 99.68
Financial Derivative Instruments - 0.00% (31 December 2016 - 0.00%)
USD S&P 500 E Mini Index FuturesLong Futures Contracts 10,066,230 16/03/2018 102,570 0.00
Net unrealised gain on open futures contracts 102,570 0.00Total Exchange Traded Financial Derivative Instruments 102,570 0.00
Total Financial Derivative Instruments 102,570 0.00
ValueUSD
% ofFund
Total Financial Assets at Fair Value through Profit or Loss 4,160,022,775 99.68Other Net Assets - 0.32% (31 December 2016 - 0.39%) 13,256,606 0.32
Net Assets Attributable to Redeeming Participating Shareholders 4,173,279,381 100.00
* The broker for the open futures contracts is Deutsche Bank AG Frankfurt.
Analysis of Total Assets % of Total Assets31/12/2017
Transferable securities admitted to an official stock exchange listing 99.51Exchange Traded Funds 0.17Current Assets 0.32Total Assets 100.00
CONCEPT FUND SOLUTIONS PLC
115
db x-trackers S&P 500® Equal Weight UCITS ETF (DR)
Investment Manager’s Report for the financial year ended 31 December 2017
Investment Objective
The investment objective of the Fund is to track the performance before fees and expenses of the UnderlyingAsset, which is the S&P 500® Equal Weight Index (the “Reference Index”). The Reference Index is designedto measure the performance of the companies in the S&P 500 Index with each company in the ReferenceIndex being allocated a fixed weight of 0.20%. The Reference Index contains shares of large public companiestraded on the New York Stock Exchange Euronext or the NASDAQ OMX Markets.
The Reference Index is calculated and maintained by Standard & Poor’s Financial Services LLC. TheReference Index is an equal weighted index which measures the performance of the companies in the S&P500 Index (which is a capitalisation weighted index comprising 500 large-cap common stocks of publicly heldcompanies actively traded on either the NYSE Euronext or the NASDAQ OMX markets) in equal weights. Eachcompany in the Reference Index is allocated a fixed weight of 0.20%.
The Reference Index is calculated is US Dollars on a real time basis.
Fund Performance
The Fund’s performance amounts are calculated net of fees and taxes.
The Fund performed in line with its benchmark and within guided tolerance levels.
The Fund has tracked the Reference Index within its anticipated tracking error. The anticipated tracking errorfor the Fund is 1.00%.
Total Net Assets Net Assets per Share31/12/2017 Price (at 31/12/2017)
1The performance difference of the share class arose from various reasons such as inaccuracies in the index replication via optimization,various fee components like management fee, fixed fee and transaction costs, specific taxes respectively tax advantages. The realisedtracking error level is contrasted with the anticipated tracking error level; the level of realised tracking error was within the expected range,due to the effectiveness of replication techniques utilised over the 2017 period.
CONCEPT FUND SOLUTIONS PLC
116
db x-trackers S&P 500® Equal Weight UCITS ETF (DR)
Portfolio of Investments as at 31 December 2017
Transferable Securities
Equities - 99.38% (31 December 2016 - 99.70%)
Number ofShares Security
ValueUSD
% ofFund
Aerospace and Defense46,728 Arconic 1,273,338 0.223,993 Boeing 1,177,576 0.205,686 General Dynamics 1,156,817 0.207,971 Harris 1,129,092 0.205,896 L3 Technologies 1,166,523 0.203,619 Lockheed Martin 1,161,880 0.203,736 Northrop Grumman 1,146,616 0.206,078 Raytheon 1,141,752 0.208,493 Rockwell Collins 1,151,821 0.204,174 TransDigm Group 1,146,264 0.209,301 United Technologies 1,186,528 0.20
12,838,207 2.22
Agriculture15,962 Altria Group 1,139,847 0.2027,551 Archer-Daniels-Midland 1,104,244 0.1910,736 Philip Morris International 1,134,258 0.19
3,378,349 0.58
Airlines16,405 Alaska Air Group 1,205,931 0.2122,379 American Airlines Group 1,164,379 0.2021,365 Delta Air Lines 1,196,440 0.2118,024 Southwest Airlines 1,179,671 0.2017,979 United Continental Holdings 1,211,785 0.21
Automobiles90,590 Ford Motor 1,131,469 0.2027,179 General Motors 1,114,067 0.1915,879 PACCAR 1,128,680 0.19
3,374,216 0.58
Banks39,268 Bank of America 1,159,191 0.2020,900 Bank of New York Mellon 1,125,674 0.1922,930 BB&T 1,140,080 0.2011,913 Capital One Financial 1,186,297 0.2015,084 Citigroup 1,122,400 0.1927,329 Citizens Financial Group 1,147,271 0.2013,352 Comerica 1,159,087 0.2037,581 Fifth Third Bancorp 1,140,208 0.204,562 Goldman Sachs Group 1,162,215 0.2076,861 Huntington Bancshares 1,119,096 0.1910,776 JPMorgan Chase & Co 1,152,386 0.2057,389 KeyCorp 1,157,536 0.206,648 M&T Bank 1,136,742 0.2021,581 Morgan Stanley 1,132,355 0.2011,689 Northern Trust 1,167,614 0.2060,607 People's United Financial 1,133,351 0.207,939 PNC Financial Services Group 1,145,518 0.2066,777 Regions Financial 1,153,907 0.20
CONCEPT FUND SOLUTIONS PLC
117
db x-trackers S&P 500® Equal Weight UCITS ETF (DR)
Portfolio of Investments as at 31 December 2017 cont/d
Equities - 99.38% (31 December 2016 - 99.70%) cont/d
Number ofShares Security
ValueUSD
% ofFund
Banks cont/d11,702 State Street 1,142,232 0.2017,499 SunTrust Banks 1,130,260 0.1920,635 US Bancorp 1,105,623 0.1919,246 Wells Fargo & Co 1,167,655 0.2022,408 Zions Bancorporation 1,138,999 0.20
db x-trackers S&P 500® Equal Weight UCITS ETF (DR)
Portfolio of Investments as at 31 December 2017 cont/d
Equities - 99.38% (31 December 2016 - 99.70%) cont/d
Number ofShares Security
ValueUSD
% ofFund
Commercial Services and Supplies cont/d11,503 Global Payments 1,153,061 0.2041,991 H&R Block 1,101,004 0.1925,091 IHS Markit 1,132,859 0.207,495 Moody's 1,106,337 0.1930,134 Nielsen Holdings 1,096,878 0.1915,656 PayPal Holdings 1,152,595 0.2028,999 Quanta Services 1,134,151 0.2017,555 Republic Services 1,186,893 0.2020,874 Robert Half International 1,159,342 0.206,672 S&P Global Futures 1,130,237 0.1917,182 Stericycle 1,168,204 0.2014,918 Total System Services 1,179,865 0.206,954 United Rentals 1,195,462 0.2111,874 Verisk Analytics 1,139,904 0.2013,509 Waste Management 1,165,827 0.2058,952 Western Union 1,120,677 0.19
24,044,506 4.15
Computers and Peripherals7,588 Accenture 1,161,647 0.20544 Alphabet Class A Shares 573,050 0.10551 Alphabet Class C Shares 576,566 0.10983 Amazon.com 1,149,589 0.206,747 Apple 1,141,795 0.2015,920 Cognizant Technology Solutions 1,130,638 0.2039,138 CSRA 1,171,009 0.2011,905 DXC Technology 1,129,785 0.1930,372 eBay 1,146,239 0.209,743 Expedia 1,166,919 0.208,603 F5 Networks 1,128,886 0.196,385 Facebook 1,126,697 0.1979,673 Hewlett Packard Enterprise 1,144,104 0.2054,221 HP 1,139,183 0.207,380 International Business Machines 1,132,240 0.2019,539 NetApp 1,080,897 0.196,061 Netflix 1,163,470 0.20666 Priceline Group 1,157,335 0.2028,175 Seagate Technology 1,178,842 0.2040,908 Symantec 1,147,878 0.2033,212 TripAdvisor 1,144,486 0.2010,112 VeriSign 1,157,217 0.2014,043 Western Digital 1,116,840 0.19
25,165,312 4.35
Construction and Engineering22,438 DR Horton 1,145,909 0.2022,639 Fluor 1,169,304 0.2016,653 Jacobs Engineering Group 1,098,432 0.1918,349 Lennar 1,160,391 0.2033,437 PulteGroup 1,111,780 0.19
5,685,816 0.98
Containers and Packaging28,880 Ball 1,093,108 0.199,659 Packaging of America 1,164,393 0.2023,904 Sealed Air 1,178,467 0.2017,728 WestRock 1,120,587 0.20
4,556,555 0.79
CONCEPT FUND SOLUTIONS PLC
119
db x-trackers S&P 500® Equal Weight UCITS ETF (DR)
Portfolio of Investments as at 31 December 2017 cont/d
Equities - 99.38% (31 December 2016 - 99.70%) cont/d
Number ofShares Security
ValueUSD
% ofFund
Distribution and Wholesale21,213 Fastenal 1,160,139 0.2028,391 LKQ 1,154,662 0.205,091 WW Grainger 1,202,749 0.21
3,517,550 0.61
Diversified Financials5,697 Affiliated Managers Group 1,169,309 0.204,903 Alliance Data Systems 1,242,812 0.2111,585 American Express 1,150,506 0.206,715 Ameriprise Financial 1,137,991 0.202,214 BlackRock 1,137,354 0.209,112 Cboe Global Markets 1,135,264 0.2022,186 Charles Schwab 1,139,695 0.207,469 CME Group 1,090,847 0.1915,456 Discover Financial Services 1,188,876 0.2022,643 E*TRADE Financial 1,122,414 0.1925,578 Franklin Resources 1,108,295 0.1916,109 Intercontinental Exchange 1,136,651 0.2030,304 Invesco 1,107,308 0.197,623 Mastercard 1,153,817 0.2014,507 Nasdaq 1,114,573 0.1989,657 Navient 1,194,231 0.2112,756 Raymond James Financial 1,139,111 0.2030,408 Synchrony Financial 1,174,053 0.2011,104 T Rowe Price Group 1,165,143 0.2010,152 Visa 1,157,531 0.20
Electric Utilities106,306 AES 1,151,294 0.2025,435 Alliant Energy 1,083,785 0.1918,087 Ameren 1,066,952 0.1814,859 American Electric Power 1,093,177 0.1939,565 CenterPoint Energy 1,122,064 0.1922,924 CMS Energy 1,084,305 0.1912,855 Consolidated Edison 1,092,032 0.1913,625 Dominion Energy 1,104,443 0.199,899 DTE Energy 1,083,545 0.1912,986 Duke Energy 1,092,253 0.1915,941 Edison International 1,008,109 0.1713,600 Entergy 1,106,904 0.1917,528 Eversource Energy 1,107,419 0.1927,774 Exelon 1,094,573 0.1934,824 FirstEnergy 1,066,311 0.187,186 NextEra Energy 1,122,381 0.1940,411 NRG Energy 1,150,905 0.2021,435 PG&E 960,931 0.1712,599 Pinnacle West Capital 1,073,183 0.1833,181 PPL 1,026,952 0.1821,996 Public Service Enterprise Group 1,132,794 0.2025,027 SCANA 995,574 0.17
CONCEPT FUND SOLUTIONS PLC
120
db x-trackers S&P 500® Equal Weight UCITS ETF (DR)
Portfolio of Investments as at 31 December 2017 cont/d
Equities - 99.38% (31 December 2016 - 99.70%) cont/d
Number ofShares Security
ValueUSD
% ofFund
Electric Utilities cont/d22,391 Southern 1,076,783 0.1916,577 WEC Energy Group 1,101,210 0.1922,329 Xcel Energy 1,074,248 0.19
Media19,902 CBS 1,174,218 0.203,529 Charter Communications 1,185,603 0.2030,132 Comcast 1,206,787 0.2126,038 Discovery Communications Class A Shares 582,730 0.1034,366 Discovery Communications Class C Shares 727,528 0.1223,555 DISH Network 1,124,751 0.1956,555 Interpublic Group 1,140,149 0.20
CONCEPT FUND SOLUTIONS PLC
123
db x-trackers S&P 500® Equal Weight UCITS ETF (DR)
Portfolio of Investments as at 31 December 2017 cont/d
Equities - 99.38% (31 December 2016 - 99.70%) cont/d
Number ofShares Security
ValueUSD
% ofFund
Media cont/d52,084 News Class A Shares 844,282 0.1516,599 News Class B Shares 275,543 0.0515,561 Omnicom Group 1,133,308 0.2013,975 Scripps Networks Interactive 1,193,185 0.2112,616 Time Warner 1,153,985 0.2024,245 Twenty-First Century Fox Class A Shares 837,180 0.1410,105 Twenty-First Century Fox Class B Shares 344,783 0.0638,875 Viacom 1,197,739 0.2110,922 Walt Disney 1,174,224 0.20
db x-trackers S&P 500® Equal Weight UCITS ETF (DR)
Portfolio of Investments as at 31 December 2017 cont/d
Equities - 99.38% (31 December 2016 - 99.70%) cont/d
Number ofShares Security
ValueUSD
% ofFund
Software cont/d34,151 CA 1,136,545 0.2026,218 Cadence Design Systems 1,096,437 0.1916,236 Cerner 1,094,144 0.1913,036 Citrix Systems 1,147,168 0.2010,873 Electronic Arts 1,142,317 0.2011,926 Fidelity National Information Services 1,122,117 0.198,643 Fiserv 1,133,357 0.197,360 Intuit 1,161,261 0.2013,571 Microsoft 1,160,863 0.2023,061 Oracle 1,090,324 0.1916,539 Paychex 1,125,975 0.199,113 Red Hat 1,094,471 0.1911,047 salesforce.com 1,129,335 0.1912,618 Synopsys 1,075,558 0.19
21,609,640 3.73
Textiles and Apparel55,191 Hanesbrands 1,154,044 0.2018,424 Michael Kors Holdings 1,159,791 0.204,072 Mohawk Industries 1,123,465 0.2018,625 NIKE 1,164,994 0.2011,161 Ralph Lauren 1,157,284 0.2044,241 Under Armour Class A Shares 638,397 0.1144,527 Under Armour Class C Shares 593,099 0.1015,566 VF 1,151,884 0.20
8,142,958 1.41
Transportation12,915 CH Robinson Worldwide 1,150,597 0.2020,234 CSX 1,113,072 0.1917,718 Expeditors International of Washington 1,146,177 0.204,744 FedEx 1,183,818 0.2010,154 JB Hunt Transport Services 1,167,507 0.2010,226 Kansas City Southern 1,075,980 0.198,111 Norfolk Southern 1,175,284 0.208,841 Union Pacific 1,185,578 0.219,560 United Parcel Service 1,139,074 0.20
USD S&P 500 E Mini Index FuturesLong Futures Contracts 2,646,370 16/03/2018 29,630 0.00
Net unrealised gain on open futures contracts 29,630 0.00Total Exchange Traded Financial Derivative Instruments 29,630 0.00
Total Financial Derivative Instruments 29,630 0.00
ValueUSD
% ofFund
Total Financial Assets at Fair Value through Profit or Loss 575,459,305 99.38Other Net Assets - 0.62% (31 December 2016 - 0.30%) 3,567,416 0.62
Net Assets Attributable to Redeeming Participating Shareholders 579,026,721 100.00
* The broker for the open futures contracts is Deutsche Bank AG Frankfurt.
Analysis of Total Assets % of Total Assets31/12/2017
Transferable securities admitted to an official stock exchange listing 99.36Current Assets 0.64Total Assets 100.00
CONCEPT FUND SOLUTIONS PLC
128
db x-trackers MSCI World Index UCITS ETF (DR)
Investment Manager’s Report for the financial year ended 31 December 2017
Investment Objective
The investment objective of the Fund is to track the performance before fees and expenses of the UnderlyingAsset, which is the MSCI Total Return Net World Index (the “Reference Index”). The Reference Index isdesigned to reflect the performance of the shares of certain companies in various developed countries. Thecompanies making up the Reference Index are large and medium sized companies based on the combinedvalue of a company’s readily available shares as compared to other companies.
The Reference Index is calculated and maintained by MSCI Inc (and its subsidiaries). The Reference Index isa free float-adjusted market capitalisation weighted index reflecting the performance of large andmid-capitalisation companies in the global developed markets. According to the MSCI index methodology theReference Index targets an 85% free float-adjusted market representation level within each industry group inthe global developed markets.
As of 30 June 2013, the Reference Index consists of the following 23 developed markets: Australia, Austria,Belgium, Canada, Denmark, Finland, France, Germany, Ireland, Hong Kong, Ireland, Israel, Italy, Japan,Netherlands, New Zealand, Norway, Portugal, Singapore, Spain, Sweden, Switzerland, the United Kingdom,and the United States.
The underlying constituents of the Reference Index are listed in multiple currencies.
The Reference Index is calculated in U.S. Dollars on an end of day basis.
The Reference Index has a base date of 31 December 1969.
Fund Performance
The Fund’s performance amounts are calculated net of fees and taxes.
The Fund performed in line with its benchmark and within guided tolerance levels.
The Fund has tracked the Reference Index within its anticipated tracking error. The anticipated tracking errorfor the Fund is 1.00%.
Total Net Assets Net Assets per Share31/12/2017 Price (at 31/12/2017)
db x-trackers MSCI World Index UCITS ETF (DR) $2,694,667,445 $59.23(Class 1C)
Year to Date Year to DateFund Return Index Return
db x-trackers MSCI World Index UCITS ETF (DR) 22.52% 22.40%(Class 1C)
Year to Date Year to DateTracking Error Tracking Difference1
db x-trackers MSCI World Index UCITS ETF (DR) 0.04% 0.12%(Class 1C)
Total Net Assets Net Assets per Share31/12/2017 Price (at 31/12/2017)
db x-trackers MSCI World Index UCITS ETF (DR) $591,883,867 $56.99(Class 1D)
CONCEPT FUND SOLUTIONS PLC
129
db x-trackers MSCI World Index UCITS ETF (DR)
Investment Manager’s Report for the financial year ended 31 December 2017 cont/d
Fund Performance cont/d
Year to Date Year to DateFund Return Index Return
db x-trackers MSCI World Index UCITS ETF (DR) 22.52% 22.40%(Class 1D)
Year to Date Year to DateTracking Error Tracking Difference1
db x-trackers MSCI World Index UCITS ETF (DR) 0.04% 0.12%(Class 1D)
Total Net Assets Net Assets per Share31/12/2017 Price (at 31/12/2017)
db x-trackers MSCI World Index UCITS ETF (DR) £14,008,103 £14.01(Class 2D GBP Hedged)
Year to Date Year to DateFund Return Index Return
db x-trackers MSCI World Index UCITS ETF (DR) 7.47% 7.48%(Class 2D GBP Hedged)
Year to Date Year to DateTracking Error Tracking Difference1
db x-trackers MSCI World Index UCITS ETF (DR) 0.10% 0.00%(Class 2GBP Hedged)
1The performance difference of the share class arose from various reasons such as inaccuracies in the index replication via optimization,various fee components like management fee, fixed fee and transaction costs, specific taxes respectively tax advantages. The realisedtracking error level is contrasted with the anticipated tracking error level; the level of realised tracking error was within the expected range,due to the effectiveness of replication techniques utilised over the 2017 period.
CONCEPT FUND SOLUTIONS PLC
130
db x-trackers MSCI World Index UCITS ETF (DR)
Portfolio of Investments as at 31 December 2017
Transferable Securities
Equities - 99.23% (31 December 2016 - 99.39%)
Number ofShares Security
ValueUSD
% ofFund
Aerospace and Defense46,940 Airbus 4,678,342 0.1428,040 Arconic 764,090 0.02248,280 BAE Systems 1,924,482 0.0645,888 Boeing 13,532,830 0.4115,495 CAE 288,765 0.01150,490 Cobham 257,116 0.01129 Dassault Aviation 201,049 0.011,241 Elbit Systems 166,222 0.0021,123 General Dynamics 4,297,474 0.1310,956 Harris 1,551,917 0.0511,648 IHI 387,750 0.0115,201 Kawasaki Heavy Industries 533,688 0.025,563 L3 Technologies 1,100,640 0.0330,601 Leonardo 364,517 0.0120,938 Lockheed Martin 6,722,145 0.2078,640 Meggitt 512,966 0.024,864 MTU Aero Engines 872,599 0.0313,641 Northrop Grumman 4,186,559 0.1324,126 Raytheon 4,532,069 0.1414,130 Rockwell Collins 1,916,311 0.06151,528 Rolls-Royce Holdings 1,736,176 0.0525,957 Safran 2,677,743 0.087,612 Spirit AeroSystems Holdings 664,147 0.026,999 Thales 755,387 0.024,057 TransDigm Group 1,114,133 0.0362,194 United Technologies 7,934,089 0.2416,008 Zodiac Aerospace 479,215 0.01
64,152,421 1.94
Agriculture154,854 Altria Group 11,058,124 0.3350,979 Archer-Daniels-Midland 2,043,238 0.06186,327 British American Tobacco 12,648,060 0.388,897 Bunge 596,811 0.02572,777 Golden Agri-Resources 158,581 0.0176,351 Imperial Tobacco Group 3,269,965 0.1091,011 Japan Tobacco 2,933,519 0.09124,749 Philip Morris International 13,179,732 0.4015,100 Swedish Match 596,070 0.02
46,484,100 1.41
Airlines12,015 American Airlines Group 625,140 0.026,092 ANA Holdings 254,496 0.0118,875 Delta Air Lines 1,057,000 0.0321,221 Deutsche Lufthansa 782,813 0.029,234 easyJet 182,873 0.0155,014 International Consolidated Airlines Group 478,016 0.0111,266 Japan Airlines 440,839 0.0122,147 Ryanair Holdings 400,242 0.0124,745 Singapore Airlines 197,567 0.0114,052 Southwest Airlines 919,703 0.034,418 United Continental Holdings 297,773 0.01
5,636,462 0.17
Auto Components11,146 Aisin Seiki 626,313 0.0221,056 Aptiv 1,786,180 0.05
CONCEPT FUND SOLUTIONS PLC
131
db x-trackers MSCI World Index UCITS ETF (DR)
Portfolio of Investments as at 31 December 2017 cont/d
Equities - 99.23% (31 December 2016 - 99.39%) cont/d
Number ofShares Security
ValueUSD
% ofFund
Auto Components cont/d5,562 Autoliv 706,819 0.0217,803 BorgWarner 909,555 0.0353,025 Bridgestone 2,465,557 0.0712,895 Cie Generale des Etablissements Michelin 1,851,150 0.068,310 Continental 2,245,695 0.0738,715 Denso 2,324,275 0.074,649 Faurecia 363,590 0.01143,187 GKN 618,666 0.0225,295 Goodyear Tire & Rubber 817,281 0.0219,702 JTEKT 338,598 0.019,816 Koito Manufacturing 690,126 0.026,805 Lear 1,202,171 0.043,990 Linamar 233,136 0.0132,668 Magna International 1,857,431 0.0655,689 Minth Group 335,888 0.0126,582 NGK Insulators 502,144 0.0214,427 NGK Spark Plug 350,782 0.016,832 NOK 159,565 0.009,101 Nokian Renkaat 413,097 0.0112,354 Stanley Electric 501,727 0.0150,765 Sumitomo Electric Industries 858,476 0.0311,827 Sumitomo Rubber Industries 220,057 0.0111,823 Toyota Industries 759,863 0.0222,691 Valeo 1,696,693 0.054,696 WABCO Holdings 673,876 0.027,482 Yokohama Rubber 183,513 0.01
25,692,224 0.78
Automobiles26,336 Bayerische Motoren Werke 2,745,936 0.0876,397 Daimler 6,495,017 0.2012,189 Ferrari 1,279,967 0.0495,311 Fiat Chrysler Automobiles 1,706,441 0.05294,028 Ford Motor 3,672,410 0.11106,911 General Motors 4,382,282 0.1314,395 Hino Motors 186,566 0.01139,394 Honda Motor 4,778,869 0.1435,736 Isuzu Motors 598,614 0.0249,874 Mazda Motor 669,193 0.0242,976 Mitsubishi Motors 310,541 0.01191,666 Nissan Motor 1,911,556 0.0628,374 PACCAR 2,016,824 0.0640,365 Peugeot 821,814 0.0317,971 Renault 1,810,742 0.0553,438 Subaru 1,699,675 0.0530,600 Suzuki Motor 1,774,881 0.0510,662 Tesla 3,319,614 0.10211,948 Toyota Motor 13,571,069 0.413,075 Volkswagen 622,918 0.02118,100 Volvo 2,202,610 0.07
56,577,539 1.71
Banks32,530 ABN Amro Group 1,050,769 0.0358,220 AIB Group 384,508 0.0111,281 Aozora Bank 439,123 0.01234,172 Australia & New Zealand Banking Group 5,263,951 0.16539,939 Banco Bilbao Vizcaya Argentaria 4,611,128 0.14441,057 Banco de Sabadell 877,053 0.031,320,626 Banco Santander 8,688,642 0.26
CONCEPT FUND SOLUTIONS PLC
132
db x-trackers MSCI World Index UCITS ETF (DR)
Portfolio of Investments as at 31 December 2017 cont/d
Equities - 99.23% (31 December 2016 - 99.39%) cont/d
Number ofShares Security
ValueUSD
% ofFund
Banks cont/d64,501 Bank Hapoalim 475,446 0.01117,131 Bank Leumi Le-Israel 707,513 0.02811,698 Bank of America 23,961,325 0.7283,925 Bank of East Asia 363,407 0.0158,933 Bank of Ireland Group 502,090 0.023,630 Bank of Kyoto 189,153 0.0153,393 Bank of Montreal 4,286,525 0.1383,739 Bank of New York Mellon 4,510,183 0.1495,493 Bank of Nova Scotia 6,182,523 0.1934,523 Bank of Queensland 343,468 0.0176,092 Bankia 364,297 0.0158,973 Bankinter 559,720 0.021,416,656 Barclays 3,892,170 0.1266,864 BB&T 3,324,478 0.1038,097 Bendigo & Adelaide Bank 347,738 0.0191,378 BNP Paribas 6,830,488 0.21319,419 BOC Hong Kong Holdings 1,618,077 0.05341,540 CaixaBank 1,594,962 0.0535,103 Canadian Imperial Bank of Commerce 3,433,115 0.1040,305 Capital One Financial 4,013,572 0.1242,499 Chiba Bank 353,875 0.0112,452 CIT Group 613,012 0.02224,204 Citigroup 16,683,020 0.5046,100 Citizens Financial Group 1,935,278 0.0613,024 Comerica 1,130,613 0.0382,266 Commerzbank 1,235,307 0.04138,074 Commonwealth Bank of Australia 8,676,285 0.2695,247 Concordia Financial Group 574,949 0.02106,137 Credit Agricole 1,758,801 0.05198,792 Credit Suisse Group 3,549,493 0.1159,067 Danske Bank 2,301,559 0.07151,282 DBS Group Holdings 2,813,048 0.09171,748 Deutsche Bank 3,273,981 0.1092,180 DNB 1,714,143 0.058,460 East West Bancorp 514,622 0.0221,702 Erste Group Bank 940,888 0.0365,222 Fifth Third Bancorp 1,978,835 0.0610,926 First Republic Bank 946,629 0.0368,418 Fukuoka Financial Group 384,453 0.0129,726 Goldman Sachs Group 7,572,996 0.2326,051 Hachijuni Bank 149,623 0.0071,847 Hang Seng Bank 1,783,009 0.051,630,277 HSBC Holdings 16,912,882 0.5178,415 Huntington Bancshares 1,141,722 0.03317,963 ING Groep 5,851,239 0.181,089,252 Intesa Sanpaolo 3,623,088 0.1161,439 Investec 444,647 0.0125,272 Japan Post Bank 329,108 0.01287,088 JPMorgan Chase & Co 30,701,191 0.9323,152 KBC Group 1,976,924 0.0695,903 KeyCorp 1,934,364 0.0630,327 Kyushu Financial Group 183,604 0.015,800,025 Lloyds Banking Group 5,339,976 0.1612,420 M&T Bank 2,123,696 0.0624,684 Macquarie Group 1,923,516 0.0642,995 Mediobanca 488,405 0.01988,540 Mitsubishi UFJ Financial Group 7,251,926 0.228,513 Mizrahi Tefahot Bank 157,305 0.002,078,513 Mizuho Financial Group 3,775,089 0.11114,224 Morgan Stanley 5,993,333 0.18211,643 National Australia Bank 4,894,917 0.15
CONCEPT FUND SOLUTIONS PLC
133
db x-trackers MSCI World Index UCITS ETF (DR)
Portfolio of Investments as at 31 December 2017 cont/d
Equities - 99.23% (31 December 2016 - 99.39%) cont/d
Number ofShares Security
ValueUSD
% ofFund
Banks cont/d30,397 National Bank of Canada 1,521,609 0.0559,814 Natixis 473,755 0.0133,575 New York Community Bancorp 437,146 0.01232,687 Nordea Bank 2,822,085 0.0919,893 Northern Trust 1,987,112 0.06275,860 Oversea-Chinese Banking 2,557,547 0.0819,511 People's United Financial 364,856 0.0139,570 PNC Financial Services Group 5,709,555 0.1710,721 Raiffeisen Bank International 388,788 0.01110,286 Regions Financial 1,905,742 0.06149,005 Resona Holdings 890,326 0.03117,699 Royal Bank of Canada 9,642,685 0.29243,131 Royal Bank of Scotland Group 914,329 0.0395,052 Seven Bank 325,700 0.019,757 Shinsei Bank 168,810 0.0142,198 Shizuoka Bank 436,027 0.013,328 Signature Bank 456,801 0.01143,387 Skandinaviska Enskilda Banken 1,686,494 0.0563,623 Societe Generale 3,288,956 0.10272,954 Standard Chartered 2,880,429 0.0930,610 State Street 2,987,842 0.09111,340 Sumitomo Mitsui Financial Group 4,811,390 0.1524,427 Sumitomo Mitsui Trust Holdings 969,924 0.0341,049 SunTrust Banks 2,651,355 0.0810,558 Suruga Bank 226,531 0.013,892 SVB Financial Group 909,833 0.03128,049 Svenska Handelsbanken 1,754,760 0.0575,349 Swedbank 1,821,260 0.06149,686 Toronto-Dominion Bank 8,798,734 0.27295,326 UBS Group 5,436,786 0.16164,665 UniCredit 3,080,630 0.09117,953 United Overseas Bank 2,334,523 0.07135,784 US Bancorp 7,275,307 0.22384,870 Wells Fargo & Co 23,350,063 0.71268,746 Westpac Banking 6,589,761 0.2013,139 Yamaguchi Financial Group 156,175 0.0014,150 Zions Bancorporation 719,244 0.02
Portfolio of Investments as at 31 December 2017 cont/d
Equities - 99.23% (31 December 2016 - 99.39%) cont/d
Number ofShares Security
ValueUSD
% ofFund
Diversified Telecommunications cont/d27,316 T-Mobile US 1,734,839 0.05328,869 Verizon Communications 17,407,036 0.532,164,261 Vodafone Group 6,880,104 0.2114,293 Zayo Group Holdings 525,982 0.02
115,037,997 3.48
Electric Utilities39,062 AES 423,041 0.0148,513 AGL Energy 924,327 0.0315,262 Alliant Energy 650,314 0.0218,290 Ameren 1,078,927 0.0341,573 American Electric Power 3,058,526 0.096,222 Atco 223,465 0.01115,811 AusNet Services 163,500 0.0027,035 CenterPoint Energy 766,713 0.0251,584 Chubu Electric Power 641,308 0.0217,385 Chugoku Electric Power 186,891 0.01146,553 CLP Holdings 1,498,844 0.0519,264 CMS Energy 911,187 0.0327,240 Consolidated Edison 2,314,038 0.0751,242 Dominion Energy 4,153,677 0.1316,728 DTE Energy 1,831,047 0.0657,849 Duke Energy 4,865,679 0.15175,903 E.ON 1,913,904 0.0628,180 Edison International 1,782,103 0.05174,025 EDP - Energias de Portugal 602,876 0.028,380 Electric Power Development 225,773 0.0156,829 Electricite de France 711,064 0.024,197 Emera 157,369 0.0030,358 Endesa 650,884 0.02639,768 Enel 3,941,038 0.12156,380 Engie 2,691,843 0.0813,441 Entergy 1,093,963 0.0329,497 Eversource Energy 1,863,620 0.0676,109 Exelon 2,999,456 0.0932,256 FirstEnergy 987,679 0.0334,138 Fortis 1,256,318 0.0430,057 Fortum 595,525 0.02224,417 HK Electric Investments & HK Electric Investments 205,260 0.0115,940 Hydro One 284,972 0.01467,569 Iberdrola 3,627,012 0.118,378 Innogy 328,720 0.0162,055 Kansai Electric Power 760,194 0.0243,349 Kyushu Electric Power 454,462 0.0172,978 Meridian Energy 151,813 0.0038,003 NextEra Energy 5,935,689 0.1811,852 OGE Energy 390,049 0.01129,902 Origin Energy 957,099 0.0316,683 Orsted 911,317 0.0343,309 PG&E 1,941,542 0.068,868 Pinnacle West Capital 755,376 0.0291,749 Power Assets Holdings 774,033 0.0257,270 PPL 1,772,507 0.0544,277 Public Service Enterprise Group 2,280,266 0.0742,092 Red Electrica 945,680 0.0339,175 RWE 799,703 0.028,688 SCANA 345,609 0.0182,312 Southern 3,958,384 0.1294,407 SSE 1,685,759 0.05153,443 Terna Rete Elettrica Nazionale 892,528 0.03
CONCEPT FUND SOLUTIONS PLC
142
db x-trackers MSCI World Index UCITS ETF (DR)
Portfolio of Investments as at 31 December 2017 cont/d
Equities - 99.23% (31 December 2016 - 99.39%) cont/d
Number ofShares Security
ValueUSD
% ofFund
Electric Utilities cont/d41,157 Tohoku Electric Power 526,474 0.02139,857 Tokyo Electric Power Holdings 553,717 0.0213,402 Uniper 418,421 0.0118,035 Vistra Energy 330,401 0.0129,194 WEC Energy Group 1,939,357 0.069,601 Westar Energy 506,933 0.0144,325 Xcel Energy 2,132,476 0.06
Forest Products4,342 West Fraser Timber 268,813 0.01
268,813 0.01
Gas Utilities6,991 Atmos Energy 600,457 0.027,331 Canadian Utilities 218,885 0.01547,786 Centrica 1,017,417 0.0320,630 Enagas 591,320 0.0219,609 Gas Natural 453,270 0.01802,983 Hong Kong & China Gas 1,573,651 0.05277,287 National Grid 3,282,499 0.1024,707 NiSource 634,229 0.0222,302 Osaka Gas 429,608 0.0119,335 Sempra Energy 2,067,298 0.06148,864 Snam 729,324 0.027,477 Toho Gas 205,095 0.0024,576 Tokyo Gas 562,532 0.0212,417 UGI 582,978 0.02
12,948,563 0.39
Health Care Equipment and Supplies139,315 Abbott Laboratories 7,950,707 0.246,670 Align Technology 1,482,007 0.0540,338 Baxter International 2,607,448 0.0821,681 Becton Dickinson & Co 4,641,035 0.14113,181 Boston Scientific 2,805,757 0.096,272 Cochlear 839,994 0.0311,872 Coloplast 944,912 0.0389,040 ConvaTec Group 247,522 0.013,174 Cooper 691,551 0.0251,348 Danaher 4,766,121 0.1416,429 Dentsply Sirona 1,081,521 0.0317,577 Edwards Lifesciences 1,981,104 0.0617,758 Essilor International Cie Generale d'Optique 2,451,172 0.0762,038 Fisher & Paykel Healthcare 633,142 0.0214,911 Getinge 216,722 0.0110,355 Henry Schein 723,607 0.0223,025 Hologic 984,319 0.036,318 IDEXX Laboratories 988,009 0.039,068 Intuitive Surgical 3,309,276 0.106,689 Lonza Group 1,807,300 0.05111,102 Medtronic 8,971,486 0.2720,299 Olympus 778,444 0.0213,554 QIAGEN 426,259 0.019,331 ResMed 790,242 0.0217,054 Shimadzu 387,859 0.0162,819 Smith & Nephew 1,094,522 0.035,563 Sonova Holding 868,844 0.03972 Straumann Holding 686,734 0.0227,552 Stryker 4,266,152 0.1315,326 Sysmex 1,206,761 0.043,302 Teleflex 821,604 0.03
CONCEPT FUND SOLUTIONS PLC
145
db x-trackers MSCI World Index UCITS ETF (DR)
Portfolio of Investments as at 31 December 2017 cont/d
Equities - 99.23% (31 December 2016 - 99.39%) cont/d
Number ofShares Security
ValueUSD
% ofFund
Health Care Equipment and Supplies cont/d22,530 Terumo 1,068,000 0.0332,236 Thermo Fisher Scientific 6,120,972 0.197,073 Varian Medical Systems 786,164 0.0212,662 William Demant Holding 354,309 0.0117,423 Zimmer Biomet Holdings 2,102,433 0.06
71,884,011 2.17
Health Care Providers and Services27,212 Aetna 4,908,773 0.1521,748 Anthem 4,893,517 0.152,777 BioMerieux 249,063 0.0115,176 Centene 1,530,955 0.0520,507 Cigna 4,164,767 0.1215,621 DaVita 1,128,617 0.037,261 Envision Healthcare 250,940 0.01979 Eurofins Scientific 596,726 0.0235,248 Fresenius & Co 2,754,140 0.0819,044 Fresenius Medical Care & Co 2,007,356 0.0623,983 HCA Healthcare 2,106,667 0.06128,254 Healthscope 210,659 0.0111,837 Humana 2,936,405 0.0910,014 IQVIA Holdings 980,371 0.037,580 Laboratory of America Holdings 1,209,086 0.0428,575 Mediclinic International 251,063 0.019,205 Quest Diagnostics 906,600 0.0312,892 Ramsay Health Care 707,054 0.0253,393 Ryman Healthcare 402,135 0.0123,876 Sonic Healthcare 426,902 0.0177,696 UnitedHealth Group 17,128,860 0.526,680 Universal Health Services 757,178 0.02
50,507,834 1.53
Hotels, Restaurants and Leisure16,364 Accor 844,945 0.0354,110 Aristocrat Leisure 1,003,035 0.0332,583 City Developments 304,521 0.0144,229 Crown Resorts 450,410 0.01220,777 Galaxy Entertainment Group 1,770,780 0.05451,240 Genting Singapore 442,326 0.01283,968 Golden Resorts Group 272,442 0.0113,487 Hilton Worldwide Holdings 1,077,072 0.0315,346 InterContinental Hotels Group 979,631 0.0333,068 Las Vegas Sands 2,297,895 0.0726,233 Marriott International 3,560,605 0.1115,595 Melco Resorts & Entertainment 452,879 0.0144,839 Merlin Entertainments 220,120 0.01126,378 MGM China Holdings 382,337 0.0132,484 MGM Resorts International 1,084,641 0.0319,929 Oriental Land 1,816,874 0.055,157 Paddy Power Betfair 614,299 0.02218,228 Sands China 1,126,412 0.0313,264 Sega Sammy Holdings 164,608 0.0195,325 Shangri-La Asia 216,323 0.01144,598 Tabcorp Holdings 631,083 0.026,236 Toho 216,170 0.012,526 Vail Resorts 536,699 0.0214,259 Whitbread 771,554 0.028,750 Wyndham Worldwide 1,013,863 0.03166,170 Wynn Macau 526,103 0.02
CONCEPT FUND SOLUTIONS PLC
146
db x-trackers MSCI World Index UCITS ETF (DR)
Portfolio of Investments as at 31 December 2017 cont/d
Equities - 99.23% (31 December 2016 - 99.39%) cont/d
Number ofShares Security
ValueUSD
% ofFund
Hotels, Restaurants and Leisure cont/d8,035 Wynn Resorts 1,354,621 0.04
24,132,248 0.73
Household Durables2,034 Disco 452,662 0.0113,373 Finning International 338,554 0.0130,689 Fuji Electric 231,291 0.0116,454 Makita 691,609 0.0234,650 Newell Brands 1,070,685 0.03105,263 Sandvik 1,847,486 0.063,346 Schindler Holding - Non-voting Rights 770,147 0.022,665 Schindler Holding - Voting Rights 603,009 0.024,867 SMC 2,003,830 0.065,763 Snap-on 1,004,491 0.0313,347 Stanley Black & Decker 2,264,853 0.07108,310 Techtronic Industries 705,921 0.028,909 THK 334,532 0.01
Insurance20,436 Admiral Group 553,449 0.02116,315 Aegon 742,352 0.0233,904 Aflac 2,976,093 0.0916,575 Ageas 810,361 0.02992,438 AIA Group 8,461,488 0.261,067 Alleghany 636,028 0.0237,382 Allianz 8,596,112 0.2631,434 Allstate 3,291,454 0.104,346 American Financial Group 471,715 0.0177,123 American International Group 4,594,988 0.14216,263 AMP 877,889 0.0321,917 Aon 2,936,878 0.098,651 Arch Capital Group 785,251 0.0211,868 Arthur J Gallagher & Co 751,007 0.02101,177 Assicurazioni Generali 1,846,699 0.064,114 Assurant 414,856 0.016,832 Athene Holding 353,283 0.01324,657 Aviva 2,224,445 0.07159,398 AXA 4,734,406 0.146,009 Axis Capital Holdings 302,012 0.013,414 Baloise Holding 531,456 0.02102,426 Berkshire Hathaway 20,302,882 0.617,254 Brighthouse Financial 425,375 0.0145,767 Challenger 502,227 0.0238,515 Chubb 5,628,197 0.1710,232 Cincinnati Financial 767,093 0.0215,986 CNP Assurances 369,619 0.0197,451 Dai-ichi Life Holdings 2,010,440 0.0694,823 Direct Line Insurance Group 489,613 0.012,434 Everest Re Group 538,547 0.022,109 Fairfax Financial Holdings 1,126,652 0.0321,156 Gjensidige Forsikring 400,651 0.0119,932 Great-West Lifeco 558,373 0.025,129 Hannover Rueck 646,069 0.0233,535 Hartford Financial Services Group 1,887,350 0.065,721 Industrial Alliance Insurance & Financial Services 273,140 0.01157,379 Insurance Australia Group 891,201 0.039,143 Intact Financial 766,131 0.02131,556 Japan Post Holdings 1,508,836 0.05549,127 Legal & General Group 2,030,158 0.0620,973 Lincoln National 1,612,195 0.0519,647 Loews 982,939 0.03162,251 Manulife Financial 3,395,364 0.1091,566 Mapfre 294,453 0.01972 Markel 1,107,234 0.0343,173 Marsh & McLennan 3,513,850 0.11253,672 Medibank 652,768 0.02
CONCEPT FUND SOLUTIONS PLC
148
db x-trackers MSCI World Index UCITS ETF (DR)
Portfolio of Investments as at 31 December 2017 cont/d
Equities - 99.23% (31 December 2016 - 99.39%) cont/d
Number ofShares Security
ValueUSD
% ofFund
Insurance cont/d77,028 MetLife 3,894,536 0.1237,508 MS&AD Insurance Group Holdings 1,269,911 0.0413,434 Muenchener Rueckversicherungs-Gesellschaft 2,915,778 0.0924,028 NN Group 1,042,164 0.03393,007 Old Mutual 1,231,810 0.0447,283 Poste Italiane 356,278 0.0117,976 Power Financial 495,543 0.0121,864 Power of Canada 564,857 0.0226,698 Principal Financial Group 1,883,811 0.0650,956 Progressive 2,869,842 0.09204,613 Prudential 5,274,237 0.1635,804 Prudential Financial 4,116,744 0.1294,864 QBE Insurance Group 792,433 0.025,234 Reinsurance Group of America 816,138 0.022,189 RenaissanceRe Holdings 274,917 0.0175,293 RSA Insurance Group 644,218 0.0233,168 Sampo 1,824,129 0.0616,146 SCOR 650,374 0.0224,022 Sompo Holdings 930,599 0.039,745 Sony Financial Holdings 172,668 0.0142,113 St James's Place 698,432 0.02211,959 Standard Life Aberdeen 1,251,852 0.0450,617 Sun Life Financial 2,095,862 0.06106,061 Suncorp Group 1,149,765 0.032,518 Swiss Life Holding 891,442 0.0327,326 Swiss Re 2,558,745 0.0837,578 T&D Holdings 642,812 0.0259,503 Tokio Marine Holdings 2,715,534 0.089,160 Torchmark 830,904 0.0224,093 Travelers 3,267,975 0.1015,445 Tryg 386,598 0.0192,182 UnipolSai Assicurazioni 215,518 0.0117,649 Unum Group 968,754 0.0313,918 Voya Financial 688,523 0.0211,668 Willis Towers Watson 1,758,251 0.055,202 WR Berkley 372,723 0.0116,044 XL Group 564,107 0.0211,996 Zurich Insurance Group 3,651,117 0.11
156,303,480 4.73
Leisure Equipment and Products13,360 Bandai Namco Holdings 437,032 0.0129,980 Carnival - Non-voting Rights 1,989,773 0.0612,602 Carnival - Voting Rights 833,956 0.034,409 Flight Centre Travel Group 152,562 0.0117,211 Harley-Davidson 875,696 0.039,842 Hasbro 894,539 0.0324,959 Mattel 383,869 0.019,350 Nintendo 3,418,788 0.1012,577 Norwegian Cruise Line Holdings 669,725 0.026,283 Polaris Industries 779,029 0.0215,122 Royal Caribbean Cruises 1,803,752 0.054,970 Shimano 699,285 0.0228,460 TUI 592,889 0.0210,624 Yamaha 392,329 0.0117,640 Yamaha Motor 578,605 0.02
14,501,829 0.44
Machinery151,371 ABB 4,057,271 0.12
CONCEPT FUND SOLUTIONS PLC
149
db x-trackers MSCI World Index UCITS ETF (DR)
Portfolio of Investments as at 31 December 2017 cont/d
Equities - 99.23% (31 December 2016 - 99.39%) cont/d
Number ofShares Security
ValueUSD
% ofFund
Machinery cont/d4,705 AGCO 336,078 0.0113,778 Alstom 572,527 0.0221,806 Amada Holdings 296,941 0.015,549 Andritz 313,739 0.0150,843 Atlas Copco Class A Shares 2,199,523 0.0736,653 Atlas Copco Class B Shares 1,408,371 0.0447,402 Caterpillar 7,469,607 0.2372,324 CNH Industrial 970,077 0.0312,014 Cognex 734,776 0.0212,657 Cummins 2,235,732 0.0710,403 Daifuku 567,017 0.0222,802 Deere & Co 3,568,741 0.1116,062 FANUC 3,858,302 0.1211,516 Flowserve 485,169 0.0113,175 GEA Group 632,980 0.0216,964 Hexagon 851,360 0.02392,537 Hitachi 3,059,106 0.098,301 Hitachi Construction Machinery 301,754 0.0122,179 Husqvarna 211,564 0.015,409 IDEX 713,826 0.024,606 KION Group 398,113 0.0178,939 Komatsu 2,857,641 0.0930,511 Kone 1,640,632 0.0598,178 Kubota 1,925,648 0.063,595 MAN 411,830 0.019,545 Metso 326,313 0.015,177 Middleby 698,636 0.02159,595 Mitsubishi Electric 2,651,416 0.0821,792 Mitsubishi Heavy Industries 814,419 0.026,789 Nabtesco 260,350 0.0111,299 Rockwell Automation 2,218,559 0.078,665 Roper Technologies 2,244,235 0.076,712 Sumitomo Heavy Industries 284,210 0.015,312 Wabtec 432,556 0.0116,208 Weir Group 465,476 0.0112,019 Xylem 819,696 0.0217,372 Yaskawa Electric 765,663 0.02
54,059,854 1.63
Media33,844 Altice Class A Shares 355,436 0.012,594 Axel Springer 202,872 0.0131,928 CBS 1,883,752 0.0615,836 Charter Communications 5,320,263 0.16378,616 Comcast 15,163,571 0.4617,284 Dentsu 732,633 0.0218,129 Discovery Communications Class A Shares 405,727 0.0127,861 Discovery Communications Class C Shares 589,817 0.0219,865 DISH Network 948,554 0.0312,150 Hakuhodo DY Holdings 157,794 0.0035,904 Interpublic Group 723,825 0.02368,354 ITV 824,671 0.026,689 JCDecaux 269,921 0.0112,782 Lagardere 410,269 0.016,721 Liberty Broadband 572,360 0.0214,069 Liberty Global Class A Shares 504,233 0.0252,959 Liberty Global Class C Shares 1,792,133 0.0519,900 Liberty Media-Liberty Formula One 679,784 0.029,177 Liberty Media-Liberty SiriusXM Class A Shares 363,960 0.0111,747 Liberty Media-Liberty SiriusXM Class C Shares 465,886 0.01
CONCEPT FUND SOLUTIONS PLC
150
db x-trackers MSCI World Index UCITS ETF (DR)
Portfolio of Investments as at 31 December 2017 cont/d
Equities - 99.23% (31 December 2016 - 99.39%) cont/d
Number ofShares Security
ValueUSD
% ofFund
Media cont/d22,834 News Class A Shares 370,139 0.0121,816 Omnicom Group 1,588,859 0.0551,205 Pearson 509,809 0.0221,239 ProSiebenSat.1 Media 732,086 0.0217,104 Publicis Groupe 1,163,505 0.034,654 RTL Group 374,822 0.018,785 Schibsted 234,142 0.017,965 Scripps Networks Interactive 680,052 0.0231,863 Shaw Communications 729,598 0.02105,937 Singapore Press Holdings 210,067 0.01125,825 Sirius XM Holdings 674,422 0.0274,730 Sky 1,023,041 0.033,783 Telenet Group Holding 263,881 0.0122,198 Thomson Reuters 970,692 0.0362,064 Time Warner 5,676,994 0.1791,871 Twenty-First Century Fox Class A Shares 3,172,306 0.1030,436 Twenty-First Century Fox Class B Shares 1,038,476 0.0331,517 Viacom 971,039 0.0390,083 Vivendi 2,425,209 0.07124,622 Walt Disney 13,398,111 0.4122,829 Wolters Kluwer 1,191,920 0.04111,268 WPP 2,018,443 0.06
Oil and Gas10,153 AltaGas 231,916 0.0148,583 Anadarko Petroleum 2,605,992 0.0813,778 Andeavor 1,575,377 0.0512,586 Antero Resources 239,134 0.0187,709 APA Group 571,451 0.0229,081 Apache 1,227,800 0.0445,882 ARC Resources 540,133 0.0229,032 Baker Hughes 918,573 0.031,585,375 BP 11,209,906 0.3432,107 Cabot Oil & Gas 918,260 0.0324,989 Caltex Australia 665,512 0.0293,985 Canadian Natural Resources 3,369,493 0.1081,714 Cenovus Energy 748,694 0.0214,463 Cheniere Energy 778,688 0.02152,217 Chevron 19,056,046 0.587,553 Cimarex Energy 921,542 0.0313,588 Concho Resources 2,041,189 0.06100,895 ConocoPhillips 5,538,127 0.175,333 Continental Resources 282,489 0.0135,334 Crescent Point Energy 270,162 0.015,341 DCC 539,349 0.0243,883 Devon Energy 1,816,756 0.056,507 Diamondback Energy 821,509 0.02134,115 Enbridge 5,262,056 0.1673,813 Encana 987,944 0.03204,859 Eni 3,394,727 0.1047,351 EOG Resources 5,109,646 0.1517,678 EQT 1,006,232 0.03340,052 Exxon Mobil 28,441,949 0.8640,063 Galp Energia SGPS 737,250 0.0272,360 Halliburton 3,536,233 0.119,141 Helmerich & Payne 590,874 0.0218,640 Hess 884,841 0.0312,329 HollyFrontier 631,491 0.0231,351 Husky Energy 444,136 0.0115,123 Idemitsu Kosan 607,471 0.0225,848 Imperial Oil 809,304 0.0280,164 Inpex 1,002,673 0.0338,271 Inter Pipeline 795,079 0.0245,375 John Wood Group 398,977 0.01276,138 JXTG Holdings 1,782,089 0.0518,854 Keyera 532,989 0.02167,773 Kinder Morgan 3,031,658 0.0911,089 Koninklijke Vopak 486,954 0.0112,716 Lundin Petroleum 291,672 0.0167,631 Marathon Oil 1,144,993 0.0341,979 Marathon Petroleum 2,769,774 0.0830,210 National Oilwell Varco 1,088,164 0.03
CONCEPT FUND SOLUTIONS PLC
152
db x-trackers MSCI World Index UCITS ETF (DR)
Portfolio of Investments as at 31 December 2017 cont/d
Equities - 99.23% (31 December 2016 - 99.39%) cont/d
Number ofShares Security
ValueUSD
% ofFund
Oil and Gas cont/d13,345 Neste 854,917 0.0311,780 Newfield Exploration 371,423 0.0132,947 Noble Energy 960,076 0.0361,654 Occidental Petroleum 4,541,434 0.14105,861 Oil Search 645,006 0.0210,500 OMV 666,102 0.0234,647 ONEOK 1,851,882 0.0616,669 Parsley Energy 490,735 0.0146,287 Pembina Pipeline 1,681,249 0.0536,800 Phillips 66 3,722,320 0.1114,608 Pioneer Natural Resources 2,524,993 0.0810,051 Plains GP Holdings 220,619 0.0119,430 PrairieSky Royalty 497,167 0.0215,078 Range Resources 257,231 0.01111,759 Repsol 1,978,782 0.06362,367 Royal Dutch Shell Class A Shares 12,156,759 0.37302,678 Royal Dutch Shell Class B Shares 10,270,993 0.31133,133 Santos 567,508 0.02113,690 Schlumberger 7,661,569 0.2315,041 Seven Generations Energy 213,440 0.0115,820 Showa Shell Sekiyu 214,866 0.0191,599 Statoil 1,962,032 0.06137,477 Suncor Energy 5,063,701 0.1516,488 Targa Resources 798,349 0.0232,606 TechnipFMC 1,020,894 0.03190,375 Total 10,525,995 0.3214,965 Tourmaline Oil 272,080 0.0170,843 TransCanada 3,459,176 0.1036,403 Valero Energy 3,345,800 0.109,386 Vermilion Energy 342,194 0.0167,018 Williams 2,043,379 0.0678,005 Woodside Petroleum 2,018,264 0.06
205,858,209 6.23
Paper and Related Products34,911 International Paper 2,022,743 0.0637,984 Mondi 992,203 0.0386,657 Oji Holdings 576,944 0.0241,886 Stora Enso 664,923 0.0250,934 UPM-Kymmene 1,584,696 0.05
5,841,509 0.18
Personal Products6,721 Beiersdorf 790,110 0.0268,191 Colgate-Palmolive 5,145,011 0.1631,807 Coty 632,641 0.0257,457 Essity 1,635,112 0.0518,942 Estee Lauder 2,410,180 0.0742,251 Kao 2,857,615 0.092,174 Kose 339,464 0.0113,840 Lion 262,303 0.0120,714 L'Oreal 4,600,331 0.145,806 Pola Orbis Holdings 203,841 0.01205,238 Procter & Gamble 18,857,267 0.5734,601 Shiseido 1,672,766 0.0530,318 Unicharm 788,430 0.02102,462 Unilever - England listing 5,718,168 0.17131,696 Unilever - Netherlands listing 7,425,491 0.22
53,338,730 1.61
CONCEPT FUND SOLUTIONS PLC
153
db x-trackers MSCI World Index UCITS ETF (DR)
Portfolio of Investments as at 31 December 2017 cont/d
Equities - 99.23% (31 December 2016 - 99.39%) cont/d
Real Estate8,171 Aeon Mall 159,866 0.003,168 Azrieli Group 177,305 0.01184,817 CapitaLand 488,180 0.0128,363 CBRE Group 1,228,401 0.04237,833 CK Asset Holdings 2,077,954 0.066,020 Daito Trust Construction 1,227,781 0.0430,837 Deutsche Wohnen 1,350,080 0.04
CONCEPT FUND SOLUTIONS PLC
154
db x-trackers MSCI World Index UCITS ETF (DR)
Portfolio of Investments as at 31 December 2017 cont/d
Equities - 99.23% (31 December 2016 - 99.39%) cont/d
Number ofShares Security
ValueUSD
% ofFund
Real Estate cont/d10,090 First Capital Realty 166,858 0.00183,162 Global Logistic Properties 461,880 0.0148,160 Hang Lung Group 177,120 0.00141,795 Hang Lung Properties 346,448 0.0196,451 Henderson Land Development 635,415 0.0275,724 Hongkong Land Holdings 533,097 0.0215,926 Hulic 178,982 0.0159,372 Hysan Development 314,811 0.014,873 Jones Lang LaSalle 725,736 0.0243,937 Kerry Properties 197,560 0.01109,883 Mitsubishi Estate 1,911,857 0.0682,858 Mitsui Fudosan 1,857,225 0.06376,774 New World Development 565,838 0.0218,167 Nomura Real Estate Holdings 407,366 0.014,495 REA Group 269,483 0.01256,783 Sino Land 454,617 0.0130,404 Sumitomo Realty & Development 999,432 0.03126,752 Sun Hung Kai Properties 2,114,344 0.0669,621 Swire Properties 224,432 0.016,170 Swiss Prime Site 569,831 0.0211,467 Tokyo Tatemono 154,929 0.0045,192 Tokyu Fudosan Holdings 326,955 0.0129,708 UOL Group 197,179 0.0144,207 Vonovia 2,197,137 0.0753,405 Wheelock & Co 381,206 0.01
23,079,305 0.70
Real Estate Investment Trust22,525 AGNC Investment 454,780 0.016,282 Alexandria Real Estate Equities 820,366 0.0334,122 American Tower 4,868,186 0.1581,735 Annaly Capital Management 971,829 0.03194,944 Ascendas Real Estate Investment Trust 396,773 0.0111,759 AvalonBay Communities 2,097,923 0.0613,649 Boston Properties 1,774,779 0.0587,411 British Land 817,666 0.0320,123 Brixmor Property Group 375,495 0.019,571 Camden Property Trust 881,106 0.03197,310 CapitaLand Commercial Trust 284,951 0.01122,707 CapitaLand Mall Trust 195,575 0.0148,771 Colony NorthStar 556,477 0.0233,161 Crown Castle International 3,681,203 0.1181 Daiwa House REIT Investment 192,487 0.0186,022 Dexus 656,001 0.0217,685 Digital Realty Trust 2,014,321 0.0628,133 Duke Realty 765,499 0.026,264 Equinix 2,838,970 0.0932,420 Equity Residential 2,067,423 0.066,325 Essex Property Trust 1,526,665 0.059,286 Extra Space Storage 812,061 0.025,125 Federal Realty Investment Trust 680,651 0.023,565 Fonciere Des Regions 404,455 0.012,999 Gecina 554,225 0.0244,664 GGP 1,044,691 0.03138,771 Goodman Group 913,905 0.03155,429 GPT Group 621,217 0.028,582 H&R Real Estate Investment Trust 146,304 0.0070,285 Hammerson 520,077 0.0236,953 HCP 963,734 0.0354,915 Host Hotels & Resorts 1,090,063 0.03
CONCEPT FUND SOLUTIONS PLC
155
db x-trackers MSCI World Index UCITS ETF (DR)
Portfolio of Investments as at 31 December 2017 cont/d
Equities - 99.23% (31 December 2016 - 99.39%) cont/d
Number ofShares Security
ValueUSD
% ofFund
Real Estate Investment Trust cont/d1,880 ICADE 184,957 0.0122,081 Invitation Homes 520,449 0.0218,142 Iron Mountain 684,498 0.0244 Japan Prime Realty Investment 139,831 0.0085 Japan Real Estate Investment 403,684 0.01238 Japan Retail Fund Investment 436,492 0.0137,090 Kimco Realty 673,184 0.0217,729 Klepierre 780,561 0.0251,126 Land Securities Group 697,140 0.0212,945 Liberty Property Trust 556,764 0.02183,164 Link REIT 1,697,547 0.058,037 Macerich 527,870 0.027,475 Mid-America Apartment Communities 751,686 0.02357,884 Mirvac Group 657,810 0.028,201 National Retail Properties 353,709 0.0182 Nippon Building Fund 401,083 0.01180 Nippon Prologis REIT 380,772 0.01328 Nomura Real Estate Master Fund 407,343 0.0142,867 Prologis 2,765,350 0.0812,291 Public Storage 2,568,819 0.0821,306 Realty Income 1,214,868 0.0413,014 Regency Centers 900,309 0.0314,308 RioCan Real Estate Investment Trust 278,178 0.0111,112 SBA Communications 1,815,256 0.06503,634 Scentre Group 1,650,514 0.0577,153 Segro 612,644 0.0225,129 Simon Property Group 4,315,654 0.137,581 SL Green Realty 765,150 0.02260,638 Stockland 913,284 0.03114,859 Suntec Real Estate Investment Trust 184,785 0.0117,864 UDR 688,121 0.02161 Unibail-Rodamco - France listing 40,599 0.007,980 Unibail-Rodamco - Netherlands listing 2,012,301 0.06173 United Urban Investment 248,942 0.0129,184 Ventas 1,751,332 0.0558,552 VEREIT 456,120 0.01380,436 Vicinity Centres 809,358 0.0212,671 Vornado Realty Trust 990,619 0.0329,852 Welltower 1,903,662 0.06147,939 Westfield 1,098,093 0.0360,417 Weyerhaeuser 2,130,303 0.06
76,359,499 2.31
Retail5,984 Advance Auto Parts 596,545 0.0245,966 Aeon 776,301 0.0238,744 Alimentation Couche-Tard 2,028,189 0.063,771 AutoNation 193,565 0.012,559 AutoZone 1,820,396 0.0620,637 Best Buy 1,413,015 0.044,918 Canadian Tire 643,330 0.0212,642 CarMax 810,731 0.021,810 Chipotle Mexican Grill 523,144 0.0242,942 Cie Financiere Richemont 3,890,999 0.1235,371 Costco Wholesale 6,583,251 0.2083,151 CVS Health 6,028,448 0.1810,523 Darden Restaurants 1,010,418 0.0322,730 Dollar General 2,114,117 0.0619,692 Dollar Tree 2,113,149 0.068,943 Dollarama 1,120,953 0.03
CONCEPT FUND SOLUTIONS PLC
156
db x-trackers MSCI World Index UCITS ETF (DR)
Portfolio of Investments as at 31 December 2017 cont/d
Equities - 99.23% (31 December 2016 - 99.39%) cont/d
Number ofShares Security
ValueUSD
% ofFund
Retail cont/d3,547 Domino's Pizza 670,241 0.029,998 Domino's Pizza Enterprises 365,191 0.0113,582 Don Quijote Holdings 710,146 0.022,749 Dufry 408,753 0.015,101 FamilyMart UNY Holdings 357,727 0.014,894 Fast Retailing 1,951,083 0.0624,000 Gap 817,440 0.039,994 Genuine Parts 949,530 0.0354,296 Harvey Norman Holdings 177,090 0.0179,926 Hennes & Mauritz 1,652,699 0.0595,581 Home Depot 18,115,467 0.554,178 Hugo Boss 355,902 0.0185,022 Industria de Diseno Textil 2,965,333 0.0924,859 Isetan Mitsukoshi Holdings 308,282 0.0115,127 J Front Retailing 285,083 0.016,465 Kering 3,050,927 0.09164,874 Kingfisher 753,183 0.0212,240 Kohl's 663,775 0.0218,277 L Brands 1,100,641 0.033,801 Lawson 252,725 0.0132,363 Liberty Interactive Group 790,304 0.0268,096 Lowe's 6,328,842 0.199,823 Lululemon Athletica 771,990 0.0212,644 Luxottica Group 776,606 0.0219,331 Macquarie Infrastructure 486,948 0.02122,045 Marks & Spencer Group 519,723 0.0213,136 Marui Group 240,564 0.0165,941 McDonald's 11,349,765 0.344,255 McDonald's Holdings Japan 187,160 0.0113,871 Next 849,071 0.037,677 Nitori Holdings 1,094,816 0.0313,471 Nordstrom 638,256 0.028,033 O'Reilly Automotive 1,932,258 0.0610,093 Pandora 1,099,578 0.035,604 PVH 768,925 0.0217,742 Restaurant Brands International 1,094,157 0.0332,372 Ross Stores 2,597,853 0.082,319 Ryohin Keikaku 722,565 0.021,338 Shimamura 147,281 0.00116,331 Starbucks 6,680,889 0.204,800 Sundrug 223,276 0.012,070 Swatch Group (Bearer) 844,144 0.035,601 Swatch Group (Registered) 428,193 0.0120,569 Takashimaya 216,554 0.0118,824 Tapestry 832,586 0.0343,451 Target 2,835,178 0.098,326 Tiffany & Co 865,488 0.0352,762 TJX 4,034,183 0.1212,983 Tractor Supply 970,479 0.0315,145 Travis Perkins 321,038 0.012,640 Tsuruha Holdings 359,031 0.015,787 Ulta Salon Cosmetics & Fragrance 1,294,320 0.0414,998 USS 317,667 0.0173,722 Walgreens Boots Alliance 5,353,692 0.16121,005 Wal-Mart Stores 11,949,244 0.3642,079 Yamada Denki 231,967 0.0127,915 Yum! Brands 2,278,143 0.078,019 Zalando 424,793 0.01
140,435,296 4.25
CONCEPT FUND SOLUTIONS PLC
157
db x-trackers MSCI World Index UCITS ETF (DR)
Portfolio of Investments as at 31 December 2017 cont/d
Equities - 99.23% (31 December 2016 - 99.39%) cont/d
Software58,487 Activision Blizzard 3,703,397 0.1139,745 Adobe Systems 6,964,914 0.2111,191 Akamai Technologies 727,863 0.0237,661 Amadeus IT Group 2,718,375 0.085,737 ANSYS 846,724 0.0316,245 Autodesk 1,702,963 0.0511,633 Broadridge Financial Solutions 1,053,717 0.0319,603 CA 652,388 0.0218,359 Cadence Design Systems 767,773 0.0211,484 CDK Global 818,580 0.0326,439 Cerner 1,781,724 0.0512,884 Citrix Systems 1,133,792 0.041,780 Constellation Software 1,082,562 0.038,894 Dassault Systemes 946,134 0.0315,028 Dena 309,898 0.0125,476 Electronic Arts 2,676,509 0.0828,214 Fidelity National Information Services 2,654,655 0.0844,049 First Data 736,059 0.0218,323 Fiserv 2,402,695 0.0720,325 Intuit 3,206,878 0.106,827 Jack Henry & Associates 798,486 0.025,825 Konami Holdings 320,595 0.0130,103 Micro Focus International 1,027,412 0.03593,559 Microsoft 50,773,037 1.546,019 Mixi 270,361 0.017,832 MSCI 991,061 0.0314,388 Nexon 418,932 0.0127,988 Open Text 998,718 0.03249,139 Oracle 11,779,292 0.365,055 Oracle Japan 419,118 0.01
CONCEPT FUND SOLUTIONS PLC
158
db x-trackers MSCI World Index UCITS ETF (DR)
Portfolio of Investments as at 31 December 2017 cont/d
Equities - 99.23% (31 December 2016 - 99.39%) cont/d
Number ofShares Security
ValueUSD
% ofFund
Software cont/d29,602 Paychex 2,015,304 0.0615,445 Red Hat 1,854,944 0.06103,823 Sage Group 1,120,763 0.0354,906 salesforce.com 5,613,040 0.1779,573 SAP 8,929,267 0.2715,320 ServiceNow 1,997,575 0.0611,215 Splunk 929,051 0.0310,283 SS&C Technologies Holdings 416,256 0.0110,200 Synopsys 869,448 0.037,515 Take-Two Interactive Software 824,997 0.034,626 Ubisoft Entertainment 356,291 0.016,600 Veeva Systems 364,848 0.014,307 Vmware 539,753 0.029,929 Workday 1,010,176 0.03
131,526,325 3.98
Textiles and Apparel15,633 Adidas 3,137,758 0.0913,930 Asics 222,089 0.0128,144 Burberry Group 682,247 0.0217,764 Gildan Activewear 575,758 0.0239,302 Hanesbrands 821,805 0.022,918 Hermes International 1,563,631 0.0522,359 LVMH Moet Hennessy Louis Vuitton 6,588,669 0.2014,953 Michael Kors Holdings 941,291 0.035,590 Mohawk Industries 1,542,281 0.05106,849 NIKE 6,683,405 0.203,455 Ralph Lauren 358,249 0.0116,726 Under Armour Class A Shares 241,356 0.0112,581 Under Armour Class C Shares 167,579 0.0028,011 VF 2,072,814 0.0652,338 Yue Yuen Industrial Holdings 205,541 0.01
25,804,473 0.78
Transportation360 AP Moller - Maersk Class A Shares 601,510 0.02428 AP Moller - Maersk Class B Shares 748,261 0.02155,091 Aurizon Holdings 601,670 0.0261,834 Canadian National Railway 5,115,203 0.1511,863 Canadian Pacific Railway 2,174,434 0.0712,766 Central Japan Railway 2,286,888 0.0712,394 CH Robinson Worldwide 1,104,181 0.03143,406 ComfortDelGro 212,469 0.0176,339 CSX 4,199,408 0.1382,344 Deutsche Post 3,930,428 0.1214,265 DSV 1,124,101 0.0329,060 East Japan Railway 2,836,349 0.0911,908 Expeditors International of Washington 770,329 0.0220,615 FedEx 5,144,267 0.1617,670 Hankyu Hanshin Holdings 710,565 0.027,836 JB Hunt Transport Services 900,983 0.037,246 Kamigumi 160,358 0.006,785 Kansas City Southern 713,918 0.0214,215 Keihan Holdings 418,942 0.0130,352 Keikyu 583,330 0.0211,830 Keio 520,352 0.0215,236 Keisei Electric Railway 489,608 0.0115,546 Kintetsu Group Holdings 596,171 0.028,983 Knight-Swift Transportation Holdings 392,737 0.015,005 Kuehne + Nagel International 885,954 0.03
CONCEPT FUND SOLUTIONS PLC
159
db x-trackers MSCI World Index UCITS ETF (DR)
Portfolio of Investments as at 31 December 2017 cont/d
Equities - 99.23% (31 December 2016 - 99.39%) cont/d
Number ofShares Security
ValueUSD
% ofFund
Transportation cont/d12,683 Kyushu Railway 393,494 0.019,173 Mitsui OSK Lines 306,174 0.01106,311 MTR 622,855 0.0213,006 Nagoya Railroad 327,546 0.014,964 Nippon Express 330,052 0.0113,732 Nippon Yusen 335,102 0.0124,250 Norfolk Southern 3,513,825 0.1120,920 Odakyu Electric Railway 447,556 0.014,042 Old Dominion Freight Line 531,725 0.0284,107 Royal Mail 514,835 0.0213,339 Seibu Holdings 252,334 0.0114,140 Tobu Railway 456,898 0.0131,861 Tokyu 508,532 0.0166,385 Union Pacific 8,902,228 0.2755,320 United Parcel Service 6,591,378 0.2011,014 West Japan Railway 804,369 0.0224,258 Yamato Holdings 488,282 0.01
62,549,601 1.89
Water12,535 American Water Works 1,146,827 0.0422,261 Severn Trent 651,055 0.0227,409 Suez 482,665 0.0171,323 United Utilities Group 800,320 0.0234,224 Veolia Environnement 874,322 0.03
3,955,189 0.12Total Equities 3,280,057,161 99.23
Exchange Traded Funds - 0.21% (31 December 2016 - 0.00%)
38,000 db x-trackers MSCI USA Consumer Discretionary Index UCITS ETF (DR) 1,322,989 0.0432,000 db x-trackers MSCI USA Consumer Staples Index UCITS ETF (DR) 1,009,197 0.0330,000 db x-trackers MSCI USA Energy Index UCITS ETF (DR) 1,118,160 0.0356,000 db x-trackers MSCI USA Financials Index UCITS ETF (DR) 1,158,220 0.0430,000 db x-trackers MSCI USA Health Care Index UCITS ETF (DR) 982,167 0.0348,000 db x-trackers MSCI USA Information Technology Index UCITS ETF (DR) 1,367,448 0.04Total Exchange Traded Funds 6,958,181 0.21
Preferred Stocks - 0.24% (31 December 2016 - 0.23%)
Total Financial Derivative Instruments 16,800 0.00
ValueUSD
% ofFund
Total Financial Assets at Fair Value through Profit or Loss 3,294,945,758 99.68Other Net Assets - 0.32% (31 December 2016 - 0.38%) 10,555,013 0.32
Net Assets Attributable to Redeeming Participating Shareholders 3,305,500,771 100.00
* The broker for the open futures contracts is Deutsche Bank AG Frankfurt.** The counterparties for the open forward foreign currency exchange contracts are HSBC Bank Plc and Merrill Lynch International.
Analysis of Total Assets % of Total Assets31/12/2017
Transferable securities admitted to an official stock exchange listing 99.45Exchange Traded Funds 0.21Current Assets 0.34Total Assets 100.00
CONCEPT FUND SOLUTIONS PLC
162
db x-trackers FTSE Developed Europe ex UK Property UCITS ETF (DR)
Investment Manager’s Report for the financial year ended 31 December 2017
Investment Objective
The investment objective of the Fund is to track the performance before fees and expenses of the Underlyingasset, which is the FTSE EPRA/NAREIT Developed Europe ex UK Capped Net Index (the “Reference Index”).The Reference Index is designed to reflect the performance of the shares of certain property companies(including real estate investment trusts, “REITs”) listed in European developed countries, excluding the UnitedKingdom.
The Reference Index is calculated and maintained by FTSE International Limited.
The Reference Index is part of the FTSE EPRA/NAREIT Global Real Estate Index Series which is designed torepresent general trends in eligible listed real estate stocks worldwide. The Reference Index is a marketcapitalisation-weighted index reflecting the performance of European listed equity REITS and propertycompanies and offers a diverse representation of the real estate markets in developed countries in Europe,excluding the United Kingdom, by both geography and property type.
Relevant real estate activities are defined as the ownership, trading and development of income-producingreal estate. Generally, in order to be eligible for inclusion in the Reference Index, real estate companies musthave derived, in the previous full financial year, at least 75% of their total earnings before interest, tax,depreciation and amortisation (“EBITDA”) from relevant real estate activities and need to provide an auditedannual report in English. The Reference Index covers companies listed in developed countries in Europe,excluding the UK.
The Reference Index is calculated in Euro on an end of day basis.
The Reference Index is reviewed on an annual basis and each constituent of the Reference Index is cappedon a quarterly basis at 10% and the total weight of those constituents whose individual weights exceed 5% iscapped at 40% in aggregate.
Fund Performance
The Fund’s performance amounts are calculated net of fees and taxes.
The Fund performed in line with its benchmark and within guided tolerance levels.
The Fund has tracked the Reference Index within its anticipated tracking error. The anticipated tracking errorfor the Fund is 1.00%.
Total Net Assets Net Assets per Share31/12/2017 Price (at 31/12/2017)
db x-trackers FTSE Developed Europe ex UK PropertyUCITS ETF (DR) €38,045,988 €55.54
Year to Date Year to DateFund Return Index Return
db x-trackers FTSE Developed Europe ex UK PropertyUCITS ETF (DR) 15.88% 15.45%
CONCEPT FUND SOLUTIONS PLC
163
db x-trackers FTSE Developed Europe ex UK Property UCITS ETF (DR)
Investment Manager’s Report for the financial year ended 31 December 2017 cont/d
Fund Performance cont/d
Year to Date Year to DateTracking Error Tracking Difference1
db x-trackers FTSE Developed Europe ex UK PropertyUCITS ETF (DR) 0.33% 0.44%
1The performance difference of the share class arose from various reasons such as inaccuracies in the index replication via optimization,various fee components like management fee, fixed fee and transaction costs, specific taxes respectively tax advantages. The realisedtracking error level is contrasted with the anticipated tracking error level; the level of realised tracking error was within the expected range,due to the effectiveness of replication techniques utilised over the 2017 period.
CONCEPT FUND SOLUTIONS PLC
164
db x-trackers FTSE Developed Europe ex UK Property UCITS ETF (DR)
Portfolio of Investments as at 31 December 2017
Transferable Securities
Equities - 99.97% (31 December 2016 - 100.03%)
Number ofShares Security
ValueEUR
% ofFund
Real Estate7,813 ADLER Real Estate 103,796 0.277,646 ADO Properties 323,273 0.853,690 Allreal Holding 519,674 1.3728,099 BUWOG 807,846 2.1218,157 CA Immobilien Anlagen 468,541 1.2370,715 Castellum 995,464 2.624,046 Catena 63,993 0.17100,739 Citycon 217,395 0.579,380 D Carnegie & Co 116,635 0.3113,408 Deutsche EuroShop 455,269 1.2093,164 Deutsche Wohnen 3,396,760 8.9311,313 DIC Asset 119,126 0.3122,084 Dios Fastigheter 125,228 0.3328,698 Entra 356,469 0.9434,609 Fabege 614,626 1.6125,435 Fastighets Balder 567,605 1.4928,570 Grand City Properties 561,401 1.4839,366 Hemfosa Fastigheter 440,045 1.1628,725 Hufvudstaden 383,914 1.01147,985 Klovern 161,358 0.4249,511 Kungsleden 299,638 0.7916,599 LEG Immobilien 1,581,719 4.161,599 Mobimo Holding 357,328 0.9417,554 Pandox 282,998 0.7410,293 PSP Swiss Property 812,318 2.1318,543 Swiss Prime Site 1,426,165 3.7538,467 TAG Immobilien 609,317 1.6036,979 Technopolis 154,572 0.4122,166 TLG Immobilien 490,866 1.2991,653 Vonovia 3,793,518 9.9749,967 Wallenstam 400,994 1.0517,399 Wihlborgs Fastigheter 347,394 0.91
Total Financial Assets at Fair Value through Profit or Loss 38,036,242 99.97Other Net Assets - 0.03% (31 December 2016 - (0.03)%) 9,746 0.03
Net Assets Attributable to Redeeming Participating Shareholders 38,045,988 100.00
Analysis of Total Assets % of Total Assets31/12/2017
Transferable securities admitted to an official stock exchange listing 99.43Current Assets 0.57Total Assets 100.00
CONCEPT FUND SOLUTIONS PLC
166
db x-trackers MSCI World Minimum Volatility UCITS ETF (DR)
Investment Manager’s Report for the financial year ended 31 December 2017
Investment Objective
The investment objective of the Fund is to track the performance before fees and expenses of the UnderlyingAsset, which is the MSCI World Minimum Volatility (USD) Index (the “Reference Index”).
The Reference Index consists of global equities from developed markets that provide the lowest absolutevolatility of returns, measured by the rate of fluctuation in their daily price movements over time, within acertain set of constraints.
The Reference Index is based on the Parent Index which is calculated and maintained by MSCI Inc. (the “IndexSponsor”). The Parent Index is designed to reflect the performance of the shares of certain listed large andmedium sized companies across developed markets countries. The Reference Index is designed to reflect theperformance characteristics of a portfolio based on the universe of eligible securities constituting the ParentIndex with the lowest forecasted volatility of returns, subject to certain risk diversification constraints as furtherdescribed below. Volatility of returns measures the rate of daily price movements of a security over a givenperiod of time. For example, a security with a low volatility would have smaller fluctuations in its daily pricemovements over time, compared to one with a higher volatility.
The Reference Index is calculated in US Dollars on an end of day basis.
Fund Performance
The Fund’s performance amounts are calculated net of fees and taxes.
The Fund performed in line with its benchmark and within guided tolerance levels.
The Fund has tracked the Reference Index within its anticipated tracking error. The anticipated tracking errorfor the Fund is 1.00%.
Total Net Assets Net Assets per Share31/12/2017 Price (at 31/12/2017)
db x-trackers MSCI World Minimum Volatility UCITS ETF(DR) $51,695,825 $29.12
Year to Date Year to DateFund Return Index Return
db x-trackers MSCI World Minimum Volatility UCITS ETF(DR) 17.28% 17.32%
Year to Date Year to DateTracking Error Tracking Difference1
db x-trackers MSCI World Minimum Volatility UCITS ETF(DR) 0.03% (0.05)%
1The performance difference of the share class arose from various reasons such as inaccuracies in the index replication via optimization,various fee components like management fee, fixed fee and transaction costs, specific taxes respectively tax advantages. The realisedtracking error level is contrasted with the anticipated tracking error level; the level of realised tracking error was within the expected range,due to the effectiveness of replication techniques utilised over the 2017 period.
CONCEPT FUND SOLUTIONS PLC
167
db x-trackers MSCI World Minimum Volatility UCITS ETF (DR)
Portfolio of Investments as at 31 December 2017
Transferable Securities
Equities - 99.61% (31 December 2016 - 99.81%)
Number ofShares Security
ValueUSD
% ofFund
Aerospace and Defense276 General Dynamics 56,152 0.111,241 Harris 175,788 0.34509 L3 Technologies 100,706 0.201,647 Lockheed Martin 528,769 1.022,072 Northrop Grumman 635,917 1.232,556 Raytheon 480,145 0.93311 Spirit AeroSystems Holdings 27,135 0.05
2,004,612 3.88
Agriculture6,418 Altria Group 458,309 0.89926 Philip Morris International 97,832 0.19
556,141 1.08
Airlines2,994 ANA Holdings 125,075 0.243,012 Japan Airlines 117,860 0.233,997 Ryanair Holdings 72,234 0.1413,931 Singapore Airlines 111,227 0.21
426,396 0.82
Banks3,830 Bank Hapoalim 28,231 0.064,690 Bank Leumi Le-Israel 28,329 0.061,051 Bank of Montreal 84,377 0.166,573 BOC Hong Kong Holdings 33,297 0.06550 Canadian Imperial Bank of Commerce 53,791 0.1019,817 Hang Seng Bank 491,794 0.953,598 Mizrahi Tefahot Bank 66,485 0.133,555 Oversea-Chinese Banking 32,959 0.062,718 Toronto-Dominion Bank 159,767 0.311,238 US Bancorp 66,332 0.13
1,045,362 2.02
Beverages10,351 Coca-Cola 474,904 0.92437 Constellation Brands 99,885 0.191,880 Dr Pepper Snapple Group 182,473 0.354,651 Kirin Holdings 117,276 0.234,973 PepsiCo 596,362 1.153,588 Suntory Beverage & Food 159,573 0.31
1,630,473 3.15
Biotechnology450 Gilead Sciences 32,238 0.061,796 H Lundbeck 91,242 0.18
Electric Utilities1,459 Ameren 86,066 0.17815 American Electric Power 59,960 0.1237,464 CLP Holdings 383,156 0.747,340 Consolidated Edison 623,533 1.214,258 Dominion Energy 345,154 0.67294 DTE Energy 32,181 0.064,130 Duke Energy 347,374 0.67534 Edison International 33,770 0.071,153 Eversource Energy 72,847 0.1468,396 HK Electric Investments & HK Electric Investments 62,558 0.121,727 NextEra Energy 269,740 0.523,056 Orsted 166,936 0.321,826 PG&E 81,860 0.1613,229 Power Assets Holdings 111,605 0.228,635 Southern 415,257 0.80903 Uniper 28,192 0.053,447 WEC Energy Group 228,984 0.44734 Westar Energy 38,755 0.086,392 Xcel Energy 307,519 0.59
Gas Utilities61,671 Hong Kong & China Gas 120,860 0.242,321 National Grid 27,476 0.0528,696 Snam 140,589 0.27
288,925 0.56
Health Care Equipment and Supplies3,047 Abbott Laboratories 173,892 0.343,726 Baxter International 240,849 0.472,558 Becton Dickinson & Co 547,565 1.062,509 Boston Scientific 62,198 0.121,021 Coloplast 81,263 0.16128 Cooper 27,889 0.051,052 Danaher 97,647 0.192,077 Henry Schein 145,141 0.281,172 Intuitive Surgical 427,710 0.832,329 Medtronic 188,067 0.36407 ResMed 34,469 0.071,359 Sonova Holding 212,252 0.41241 Straumann Holding 170,270 0.332,110 Stryker 326,712 0.632,406 Terumo 114,053 0.22170 Thermo Fisher Scientific 32,279 0.061,306 Varian Medical Systems 145,162 0.282,971 William Demant Holding 83,135 0.16
3,110,553 6.02
Health Care Providers and Services1,026 Aetna 185,080 0.36252 Anthem 56,702 0.11206 Cigna 41,837 0.08327 Humana 81,119 0.161,119 Laboratory of America Holdings 178,492 0.346,603 Ryman Healthcare 49,731 0.101,779 UnitedHealth Group 392,198 0.76
985,159 1.91
Hotels, Restaurants and Leisure1,769 Oriental Land 161,275 0.311,168 Sankyo 36,756 0.07852 Toho 29,534 0.06
227,565 0.44
CONCEPT FUND SOLUTIONS PLC
171
db x-trackers MSCI World Minimum Volatility UCITS ETF (DR)
Portfolio of Investments as at 31 December 2017 cont/d
Equities - 99.61% (31 December 2016 - 99.81%) cont/d
Real Estate1,095 Azrieli Group 61,284 0.12813 Daito Trust Construction 165,812 0.322,702 First Capital Realty 44,683 0.091,454 Swiss Prime Site 134,284 0.26
Software138 Adobe Systems 24,183 0.051,119 Amadeus IT Group 80,769 0.161,347 ANSYS 198,804 0.382,420 Broadridge Financial Solutions 219,204 0.42488 Dassault Systemes 51,913 0.10
CONCEPT FUND SOLUTIONS PLC
174
db x-trackers MSCI World Minimum Volatility UCITS ETF (DR)
Portfolio of Investments as at 31 December 2017 cont/d
Equities - 99.61% (31 December 2016 - 99.81%) cont/d
Number ofShares Security
ValueUSD
% ofFund
Software cont/d1,994 Fidelity National Information Services 187,615 0.362,032 Fiserv 266,456 0.52329 Intuit 51,910 0.102,009 Jack Henry & Associates 234,973 0.451,469 Konami Holdings 80,850 0.16648 Microsoft 55,430 0.11995 Open Text 35,505 0.071,288 Oracle 60,897 0.12989 Oracle Japan 82,000 0.164,586 Paychex 312,215 0.602,567 Synopsys 218,811 0.421,208 Vmware 151,386 0.29
2,312,921 4.47
Textiles and Apparel19,145 Yue Yuen Industrial Holdings 75,186 0.15
75,186 0.15
Transportation2,248 CH Robinson Worldwide 200,274 0.39273 East Japan Railway 26,646 0.053,710 Expeditors International of Washington 240,000 0.461,064 Hankyu Hanshin Holdings 42,787 0.085,781 Keikyu 111,104 0.221,401 Kuehne + Nagel International 247,996 0.482,726 Kyushu Railway 84,575 0.1638,920 MTR 228,025 0.444,746 Nagoya Railroad 119,524 0.232,849 Tobu Railway 92,058 0.181,909 United Parcel Service 227,457 0.44
1,620,446 3.13
Water642 American Water Works 58,737 0.11
58,737 0.11Total Equities 51,494,092 99.61
Preferred Stocks (31 December 2016 - 0.00%)
Total Transferable Securities 51,494,092 99.61
Total Financial Assets at Fair Value through Profit or Loss 51,494,092 99.61Other Net Assets - 0.39% (31 December 2016 - 0.19%) 201,733 0.39
Net Assets Attributable to Redeeming Participating Shareholders 51,695,825 100.00
Analysis of Total Assets % of Total Assets31/12/2017
Transferable securities admitted to an official stock exchange listing 99.57Current Assets 0.43Total Assets 100.00
CONCEPT FUND SOLUTIONS PLC
175
db-x trackers MSCI World Momentum Factor UCITS ETF (DR)
Investment Manager’s Report for the financial year ended 31 December 2017
Investment Objective
The investment objective of the Fund is to track the performance before fees and expenses of the UnderlyingAsset, which is the MSCI World Momentum Index (USD) Index (the “Reference Index”).
The Reference Index is based on the MSCI World Index (the “Parent Index”), which is designed to reflect theperformance of the shares of certain listed large and medium sized companies across developed marketscountries.
The aim of the Reference Index is to replicate the performance of shares from the Parent Index that have highprice momentum, measured by a combination of a risk-adjusted 12-month and 6-month stock performance.
The Reference Index is calculated in US Dollars on an end of day basis.
Fund Performance
The Fund’s performance amounts are calculated net of fees and taxes.
The Fund performed in line with its benchmark and within guided tolerance levels.
The Fund has tracked the Reference Index within its anticipated tracking error.
Total Net Assets Net Assets per Share31/12/2017 Price (at 31/12/2017)
db-x trackers MSCI World Momentum Factor UCITS ETF(DR) $105,473,268 $31.02
Year to Date Year to DateFund Return Index Return
db-x trackers MSCI World Momentum Factor UCITS ETF(DR) 31.96% 32.09%
Year to Date Year to DateTracking Error Tracking Difference1
db-x trackers MSCI World Momentum Factor UCITS ETF(DR) 0.04% (0.13)%
1The performance difference of the share class arose from various reasons such as inaccuracies in the index replication via optimization,various fee components like management fee, fixed fee and transaction costs, specific taxes respectively tax advantages. The realisedtracking error level is contrasted with the anticipated tracking error level; the level of realised tracking error was within the expected range,due to the effectiveness of replication techniques utilised over the 2017 period.
CONCEPT FUND SOLUTIONS PLC
176
db-x trackers MSCI World Momentum Factor UCITS ETF (DR)
Portfolio of Investments as at 31 December 2017
Transferable Securities
Equities - 99.80% (31 December 2016 - 99.69%)
Number ofShares Security
ValueUSD
% ofFund
Aerospace and Defense4,796 Airbus 478,000 0.458,122 Boeing 2,395,259 2.27210 Elbit Systems 28,128 0.031,577 General Dynamics 320,841 0.311,302 Harris 184,428 0.18518 L3 Technologies 102,486 0.101,492 Northrop Grumman 457,910 0.432,363 Raytheon 443,890 0.422,195 Rockwell Collins 297,686 0.282,777 Safran 286,477 0.271,484 Spirit AeroSystems Holdings 129,479 0.12
5,124,584 4.86
Airlines1,139 ANA Holdings 47,582 0.043,905 Deutsche Lufthansa 144,050 0.14
Automobiles1,784 Ferrari 187,338 0.1812,008 Fiat Chrysler Automobiles 214,990 0.203,452 Suzuki Motor 200,225 0.1912,955 Volvo 241,616 0.23
844,169 0.80
Banks11,772 Bank Leumi Le-Israel 71,107 0.0783,807 Bank of America 2,473,983 2.3424,702 BOC Hong Kong Holdings 125,133 0.1224,188 Citigroup 1,799,829 1.711,102 Comerica 95,665 0.0910,294 Commerzbank 154,575 0.156,809 Credit Agricole 112,832 0.1117,115 DBS Group Holdings 318,249 0.30926 East West Bancorp 56,329 0.054,825 Fifth Third Bancorp 146,390 0.146,641 Hang Seng Bank 164,808 0.1629,204 JPMorgan Chase & Co 3,123,076 2.96835 M&T Bank 142,777 0.13864 Mizrahi Tefahot Bank 15,965 0.019,716 Morgan Stanley 509,798 0.4832,287 Oversea-Chinese Banking 299,338 0.283,998 PNC Financial Services Group 576,871 0.551,437 Raiffeisen Bank International 52,112 0.057,082 Regions Financial 122,377 0.12444 SVB Financial Group 103,794 0.101,305 Zions Bancorporation 66,333 0.06
10,531,341 9.98
Beverages3,312 Asahi Group Holdings 164,351 0.16
CONCEPT FUND SOLUTIONS PLC
177
db-x trackers MSCI World Momentum Factor UCITS ETF (DR)
Portfolio of Investments as at 31 December 2017 cont/d
Equities - 99.80% (31 December 2016 - 99.69%) cont/d
Insurance3,668 Allstate 384,076 0.36655 American Financial Group 71,094 0.072,623 Aon 351,482 0.331,521 Arthur J Gallagher & Co 96,249 0.09321 Baloise Holding 49,970 0.0510,966 Berkshire Hathaway 2,173,681 2.062,963 Chubb 432,983 0.411,487 Lincoln National 114,306 0.113,767 Marsh & McLennan 306,596 0.297,861 Progressive 442,732 0.42672 Reinsurance Group of America 104,785 0.10193 Swiss Life Holding 68,327 0.07852 Torchmark 77,285 0.071,597 Unum Group 87,659 0.081,086 Willis Towers Watson 163,649 0.16
4,924,874 4.67
Leisure Equipment and Products2,078 Carnival 137,917 0.13489 Flight Centre Travel Group 16,920 0.02543 Polaris Industries 67,327 0.061,273 Royal Caribbean Cruises 151,843 0.14
Software5,977 Activision Blizzard 378,464 0.366,050 Adobe Systems 1,060,202 1.013,999 Amadeus IT Group 288,648 0.27957 ANSYS 141,244 0.132,036 Autodesk 213,434 0.201,110 Broadridge Financial Solutions 100,544 0.103,882 Cadence Design Systems 162,345 0.162,601 Electronic Arts 273,261 0.262,081 Fidelity National Information Services 195,801 0.191,515 Fiserv 198,662 0.192,086 Intuit 329,129 0.31717 Jack Henry & Associates 83,860 0.0859,088 Microsoft 5,054,387 4.79811 MSCI 102,624 0.101,929 Nexon 56,166 0.05532 Oracle Japan 44,109 0.041,927 Red Hat 231,433 0.221,501 Synopsys 127,945 0.121,759 Take-Two Interactive Software 193,103 0.18813 Ubisoft Entertainment 62,617 0.06634 Veeva Systems 35,048 0.03608 Vmware 76,195 0.07
9,409,221 8.92
Textiles and Apparel2,246 LVMH Moet Hennessy Louis Vuitton 661,843 0.63507 Mohawk Industries 139,881 0.132,703 VF 200,022 0.19
1,001,746 0.95
Transportation5,454 CSX 300,025 0.287,923 Deutsche Post 378,179 0.362,200 DSV 173,363 0.161,294 Kamigumi 28,637 0.03
CONCEPT FUND SOLUTIONS PLC
184
db-x trackers MSCI World Momentum Factor UCITS ETF (DR)
Portfolio of Investments as at 31 December 2017 cont/d
Equities - 99.80% (31 December 2016 - 99.69%) cont/d
Number ofShares Security
ValueUSD
% ofFund
Transportation cont/d1,133 Keisei Electric Railway 36,409 0.04460 Kuehne + Nagel International 81,426 0.081,811 Norfolk Southern 262,414 0.25728 Old Dominion Freight Line 95,768 0.09
1,356,221 1.29Total Equities 105,258,289 99.80
Preferred Stocks (31 December 2016 - 0.28%)
Total Transferable Securities 105,258,289 99.80
Total Financial Assets at Fair Value through Profit or Loss 105,258,289 99.80Other Net Assets - 0.20% (31 December 2016 - 0.03%) 214,979 0.20
Net Assets Attributable to Redeeming Participating Shareholders 105,473,268 100.00
Analysis of Total Assets % of Total Assets31/12/2017
Transferable securities admitted to an official stock exchange listing 99.78Current Assets 0.22Total Assets 100.00
CONCEPT FUND SOLUTIONS PLC
185
db x-trackers MSCI World Quality Factor UCITS ETF (DR)
Investment Manager’s Report for the financial year ended 31 December 2017
Investment Objective
The investment objective of the Fund is to track the performance before fees and expenses of the UnderlyingAsset, which is the MSCI World Sector Neutral Quality Index (USD) Index (the “Reference Index”).
The Reference Index is based on the MSCI World Index (the “Parent Index”), which is designed to reflect theperformance of the shares of certain listed large and medium sized companies across developed marketscountries.
The aim of the Reference Index is to reflect the performance of shares chosen from the Parent Index on thebasis that they exhibit higher quality characteristics relative to their peers within the corresponding GICS®sector. The Reference Index targets a fixed number of securities at rebalancing, 300, and the stock’s weightis determined by the product of the quality score and its market capitalization weight in the Parent Index. Thesecurity weights are then updated to implement sector neutrality, i.e. the weight of each sector in theReference Index is in line with the weight in the Parent Index.
The Reference Index is calculated in US Dollars on an end of day basis.
Fund Performance
The Fund’s performance amounts are calculated net of fees and taxes.
The Fund performed in line with its benchmark and within guided tolerance levels.
The Fund has tracked the Reference Index within its anticipated tracking error. The anticipated tracking errorfor the Fund is 1.00%.
Total Net Assets Net Assets per Share31/12/2017 Price (at 31/12/2017)
db x-trackers MSCI World Quality Factor UCITS ETF (DR) $100,914,272 $34.50
Year to Date Year to DateFund Return Index Return
db x-trackers MSCI World Quality Factor UCITS ETF (DR) 23.15% 23.21%
Year to Date Year to DateTracking Error Tracking Difference1
db x-trackers MSCI World Quality Factor UCITS ETF (DR) 0.04% (0.06)%
1The performance difference of the share class arose from various reasons such as inaccuracies in the index replication via optimization,various fee components like management fee, fixed fee and transaction costs, specific taxes respectively tax advantages. The realisedtracking error level is contrasted with the anticipated tracking error level; the level of realised tracking error was within the expected range,due to the effectiveness of replication techniques utilised over the 2017 period.
CONCEPT FUND SOLUTIONS PLC
186
db x-trackers MSCI World Quality Factor UCITS ETF (DR)
Portfolio of Investments as at 31 December 2017
Transferable Securities
Equities - 99.93% (31 December 2016 - 99.82%)
Number ofShares Security
ValueUSD
% ofFund
Aerospace and Defense35,398 BAE Systems 274,379 0.272,591 General Dynamics 527,139 0.521,806 Northrop Grumman 554,280 0.552,253 Raytheon 423,226 0.42854 Thales 92,170 0.09
1,871,194 1.85
Agriculture26,270 Altria Group 1,875,941 1.868,515 Imperial Tobacco Group 364,681 0.36
Banks7,805 Canadian Imperial Bank of Commerce 763,338 0.762,724 East West Bancorp 165,701 0.1613,282 Hang Seng Bank 329,616 0.3310,004 Seven Bank 34,279 0.033,426 Suruga Bank 73,508 0.07
1,366,442 1.35
Beverages2,480 Brown-Forman 170,302 0.1723,608 Diageo 870,248 0.861,667 Dr Pepper Snapple Group 161,799 0.163,792 Monster Beverage 239,996 0.24
db x-trackers MSCI World Quality Factor UCITS ETF (DR)
Portfolio of Investments as at 31 December 2017 cont/d
Equities - 99.93% (31 December 2016 - 99.82%) cont/d
Number ofShares Security
ValueUSD
% ofFund
Industrial7,203 3M 1,695,370 1.681,324 AO Smith 81,135 0.083,024 Illinois Tool Works 504,555 0.502,736 IMI 49,336 0.051,150 Wartsila 72,636 0.07
2,403,032 2.38
Insurance5,645 Admiral Group 152,878 0.156,964 Aflac 611,300 0.60226,939 AIA Group 1,934,873 1.921,310 American Financial Group 142,187 0.144,354 Aon 583,436 0.582,208 Arch Capital Group 200,420 0.201,872 Athene Holding 96,801 0.101,471 Axis Capital Holdings 73,933 0.0722,999 Direct Line Insurance Group 118,754 0.12761 Everest Re Group 168,379 0.173,843 Gjensidige Forsikring 72,779 0.075,315 Great-West Lifeco 148,894 0.151,154 Hannover Rueck 145,362 0.141,855 Industrial Alliance Insurance & Financial Services 88,564 0.0941,795 Insurance Australia Group 236,675 0.23128,326 Legal & General Group 474,430 0.4711,519 Marsh & McLennan 937,532 0.9363,176 Medibank 162,569 0.165,070 Principal Financial Group 357,739 0.3510,341 Progressive 582,405 0.58713 RenaissanceRe Holdings 89,546 0.098,253 Sampo 453,887 0.451,899 Torchmark 172,258 0.174,705 Travelers 638,186 0.632,761 Tryg 69,110 0.07
8,712,897 8.63
Leisure Equipment and Products1,414 Hasbro 128,518 0.13
128,518 0.13
Machinery6,668 Atlas Copco Class A Shares 288,465 0.283,874 Atlas Copco Class B Shares 148,856 0.151,349 Cummins 238,287 0.244,878 Kone 262,299 0.26469 Middleby 63,292 0.061,445 Rockwell Automation 283,726 0.28
1,284,925 1.27
Media4,556 Interpublic Group 91,849 0.0950,877 ITV 113,904 0.112,729 Omnicom Group 198,753 0.202,740 ProSiebenSat.1 Media 94,445 0.09454 RTL Group 36,564 0.04
535,515 0.53
Metals and Mining2,479 Boliden 84,960 0.092,014 Cameco 18,662 0.02
CONCEPT FUND SOLUTIONS PLC
191
db x-trackers MSCI World Quality Factor UCITS ETF (DR)
Portfolio of Investments as at 31 December 2017 cont/d
Equities - 99.93% (31 December 2016 - 99.82%) cont/d
Number ofShares Security
ValueUSD
% ofFund
Metals and Mining cont/d4,090 Rio Tinto - Australia listing 242,516 0.2411,606 Rio Tinto - England listing 618,894 0.61
965,032 0.96
Oil and Gas8,844 Chevron 1,107,180 1.10871 Concho Resources 130,842 0.1323,851 Exxon Mobil 1,994,898 1.983,161 Galp Energia SGPS 58,170 0.061,681 Imperial Oil 52,632 0.054,515 Inpex 56,473 0.061,733 Inter Pipeline 36,003 0.031,066 Keyera 30,135 0.03366 Koninklijke Vopak 16,072 0.012,176 Marathon Petroleum 143,572 0.142,672 Pembina Pipeline 97,053 0.102,296 Phillips 66 232,240 0.2320,479 Royal Dutch Shell Class A Shares 687,034 0.6816,945 Royal Dutch Shell Class B Shares 575,007 0.571,991 TechnipFMC 62,338 0.0611,736 Total 648,893 0.642,508 Valero Energy 230,510 0.234,343 Woodside Petroleum 112,369 0.11
Pharmaceuticals13,675 AstraZeneca 947,326 0.9414,590 Bristol-Myers Squibb 894,075 0.8923,068 Johnson & Johnson 3,223,061 3.1926,628 Novo Nordisk 1,436,531 1.421,416 Orion Corporation 52,846 0.05997 Recordati 44,368 0.058,310 Roche Holding 2,102,017 2.08
8,700,224 8.62
Real Estate3,389 CBRE Group 146,778 0.151,442 Daito Trust Construction 294,096 0.2913,945 Henderson Land Development 91,869 0.0912,960 Hongkong Land Holdings 91,238 0.09507 Jones Lang LaSalle 75,508 0.0733,738 Sino Land 59,731 0.0615,618 Sun Hung Kai Properties 260,523 0.2613,498 Swire Properties 43,512 0.04
1,063,255 1.05
Real Estate Investment Trust13,191 Dexus 100,594 0.10
CONCEPT FUND SOLUTIONS PLC
192
db x-trackers MSCI World Quality Factor UCITS ETF (DR)
Portfolio of Investments as at 31 December 2017 cont/d
Equities - 99.93% (31 December 2016 - 99.82%) cont/d
Number ofShares Security
ValueUSD
% ofFund
Real Estate Investment Trust cont/d24,814 GPT Group 99,176 0.1026,340 Link REIT 244,117 0.242,876 Public Storage 601,084 0.6061,586 Scentre Group 201,830 0.201,083 Unibail-Rodamco 273,098 0.2739,974 Vicinity Centres 85,043 0.0821,086 Westfield 156,513 0.16
1,761,455 1.75
Retail3,411 Best Buy 233,551 0.234,327 Costco Wholesale 805,341 0.803,036 Gap 103,406 0.101,676 Genuine Parts 159,237 0.1616,770 Hennes & Mauritz 346,768 0.34937 Hugo Boss 79,818 0.0816,429 Industria de Diseno Textil 572,998 0.579,289 Lowe's 863,320 0.861,232 Lululemon Athletica 96,823 0.101,958 Next 119,853 0.121,384 O'Reilly Automotive 332,907 0.331,845 Pandora 201,003 0.207,510 Ross Stores 602,678 0.6025,002 Starbucks 1,435,865 1.42704 Sundrug 32,747 0.0311,420 TJX 873,173 0.861,948 Tractor Supply 145,613 0.14894 Ulta Salon Cosmetics & Fragrance 199,952 0.20
Software3,294 Amadeus IT Group 237,761 0.23847 Broadridge Financial Solutions 76,721 0.081,677 Cadence Design Systems 70,132 0.07181 Constellation Software 110,081 0.111,456 Fiserv 190,925 0.192,403 Intuit 379,145 0.38589 Jack Henry & Associates 68,890 0.0743,300 Microsoft 3,703,882 3.67393 Oracle Japan 32,584 0.033,581 Paychex 243,795 0.248,430 Sage Group 91,001 0.09
5,204,917 5.16
Textiles and Apparel5,213 Burberry Group 126,370 0.12447 Hermes International 239,528 0.242,693 Michael Kors Holdings 169,524 0.1720,327 NIKE 1,271,454 1.26
CONCEPT FUND SOLUTIONS PLC
193
db x-trackers MSCI World Quality Factor UCITS ETF (DR)
Portfolio of Investments as at 31 December 2017 cont/d
Equities - 99.93% (31 December 2016 - 99.82%) cont/d
Number ofShares Security
ValueUSD
% ofFund
Textiles and Apparel cont/d4,859 VF 359,566 0.36
2,166,442 2.15
Transportation6,607 Canadian National Railway 546,563 0.541,481 CH Robinson Worldwide 131,942 0.138,059 Deutsche Post 384,671 0.381,712 Expeditors International of Washington 110,749 0.11887 JB Hunt Transport Services 101,987 0.10775 Kuehne + Nagel International 137,186 0.14491 Old Dominion Freight Line 64,591 0.076,339 Union Pacific 850,060 0.84
2,327,749 2.31Total Equities 100,845,066 99.93
Preferred Stocks - 0.05% (31 December 2016 - 0.05%)
Total Financial Assets at Fair Value through Profit or Loss 100,889,859 99.98Other Net Assets - 0.02% (31 December 2016 - 0.13%) 24,413 0.02
Net Assets Attributable to Redeeming Participating Shareholders 100,914,272 100.00
Analysis of Total Assets % of Total Assets31/12/2017
Transferable securities admitted to an official stock exchange listing 99.84Current Assets 0.16Total Assets 100.00
CONCEPT FUND SOLUTIONS PLC
194
db x-trackers MSCI World Value Factor UCITS ETF (DR)
Investment Manager’s Report for the financial year ended 31 December 2017
Investment Objective
The investment objective of the Fund is to track the performance before fees and expenses of the UnderlyingAsset, which is the MSCI World Enhanced Value Index (USD) Index (the “Reference Index”).
The Reference Index is based on the Parent Index which is calculated and maintained by MSCI Inc. TheParent Index is designed to reflect the performance of the shares of certain listed large and medium sizedcompanies across developed markets countries.
The Reference Index is designed to reflect the performance of listed equity securities of large andmid-capitalisation companies in developed markets that exhibit higher value characteristics relative to theirpeers within the corresponding GICS® sector. When determining which securities display the required valuecharacteristics the following are considered: the price of shareholder equity relative to the company’s bookvalue (Price-to-Book-Value), the price of shareholder equity relative to expected future earnings (Price-to-Forward Earnings) and a measure of a company’s value incorporating debt and equity relative to the cashgenerated by the company in its normal business operations (Enterprise Value-to-Cash Flow fromOperations). The Reference Index targets a fixed number of securities at rebalancing, 400, and the stock’sweight is determined by the product of the value score and its market capitalization weight in the Parent Index.The security weights are then updated to implement sector neutrality, i.e. the weight of each sector in theReference Index is in line with the weight in the Parent Index.
The Reference Index is calculated in US Dollar on an end of day basis.
Fund Performance
The Fund’s performance amounts are calculated net of fees and taxes.
The Fund performed in line with its benchmark and within guided tolerance levels.
The Fund has tracked the Reference Index within its anticipated tracking error. The anticipated tracking errorfor the Fund is 1.00%.
Total Net Assets Net Assets per Share31/12/2017 Price (at 31/12/2017)
db x-trackers MSCI World Value Factor UCITS ETF (DR) $203,266,479 $32.92
Year to Date Year to DateFund Return Index Return
db x-trackers MSCI World Value Factor UCITS ETF (DR) 22.21% 22.15%
Year to Date Year to DateTracking Error Tracking Difference1
db x-trackers MSCI World Value Factor UCITS ETF (DR) 0.04% 0.06%
1The performance difference of the share class arose from various reasons such as inaccuracies in the index replication via optimization,various fee components like management fee, fixed fee and transaction costs, specific taxes respectively tax advantages. The realisedtracking error level is contrasted with the anticipated tracking error level; the level of realised tracking error was within the expected range,due to the effectiveness of replication techniques utilised over the 2017 period.
CONCEPT FUND SOLUTIONS PLC
195
db x-trackers MSCI World Value Factor UCITS ETF (DR)
Portfolio of Investments as at 31 December 2017
Transferable Securities
Equities - 98.87%(31 December 2016 - 98.99%)
Number ofShares Security
ValueUSD
% ofFund
Aerospace and Defense4,102 Kawasaki Heavy Industries 144,016 0.0721,067 Meggitt 137,419 0.07
Airlines5,318 American Airlines Group 276,696 0.143,746 ANA Holdings 156,491 0.088,269 Delta Air Lines 463,064 0.2316,770 Deutsche Lufthansa 618,621 0.3037,565 International Consolidated Airlines Group 326,402 0.167,012 Japan Airlines 274,380 0.1325,920 Singapore Airlines 206,949 0.103,928 United Continental Holdings 264,747 0.13
2,587,350 1.27
Auto Components3,847 Aisin Seiki 216,170 0.1111,326 Bridgestone 526,636 0.262,765 Cie Generale des Etablissements Michelin 396,931 0.197,695 Denso 461,973 0.2316,788 GKN 72,536 0.046,205 Goodyear Tire & Rubber 200,484 0.109,557 JTEKT 164,246 0.081,207 Lear 213,229 0.101,231 Linamar 71,927 0.039,041 Magna International 514,052 0.253,431 NGK Insulators 64,813 0.032,062 NOK 48,159 0.0216,324 Sumitomo Electric Industries 276,052 0.144,181 Sumitomo Rubber Industries 77,793 0.041,420 Toyoda Gosei 36,140 0.023,396 Toyota Industries 218,260 0.112,659 Yokohama Rubber 65,218 0.03
3,624,619 1.78
Automobiles7,803 Bayerische Motoren Werke 813,584 0.4022,374 Daimler 1,902,163 0.9439,885 Fiat Chrysler Automobiles 714,098 0.3596,502 Ford Motor 1,205,310 0.5942,847 General Motors 1,756,298 0.868,673 Hino Motors 112,406 0.0645,647 Honda Motor 1,564,924 0.7710,918 Isuzu Motors 182,887 0.0918,672 Mazda Motor 250,535 0.1276,318 Nissan Motor 761,148 0.3820,403 Peugeot 415,396 0.207,124 Renault 717,808 0.3513,462 Subaru 428,179 0.215,482 Suzuki Motor 317,971 0.1660,844 Toyota Motor 3,895,852 1.92
CONCEPT FUND SOLUTIONS PLC
196
db x-trackers MSCI World Value Factor UCITS ETF (DR)
Portfolio of Investments as at 31 December 2017 cont/d
Equities - 98.87%(31 December 2016 - 98.99%) cont/d
Number ofShares Security
ValueUSD
% ofFund
Automobiles cont/d1,033 Volkswagen 209,260 0.10
15,247,819 7.50
Banks102,170 Banco de Sabadell 203,168 0.10221,147 Banco Santander 1,454,967 0.7221,558 Bank Hapoalim 158,907 0.0829,971 Bank Leumi Le-Israel 181,035 0.0916,149 Bank of Ireland Group 137,584 0.071,093 Bank of Kyoto 56,954 0.03518,386 Barclays 1,424,232 0.7021,813 BNP Paribas 1,630,518 0.808,320 Capital One Financial 828,506 0.4113,099 Chiba Bank 109,071 0.051,913 CIT Group 94,177 0.0543,139 Citigroup 3,209,973 1.5826,171 Commerzbank 392,984 0.1926,765 Concordia Financial Group 161,564 0.0822,243 Credit Agricole 368,590 0.1833,075 Credit Suisse Group 590,564 0.2967,909 Deutsche Bank 1,294,529 0.6418,839 Fukuoka Financial Group 105,860 0.059,903 Hachijuni Bank 56,877 0.03238,190 HSBC Holdings 2,471,040 1.2244,102 ING Groep 811,577 0.4010,194 Japan Post Bank 132,753 0.076,804 Kyushu Financial Group 41,192 0.029,466 Mediobanca 107,530 0.05297,640 Mitsubishi UFJ Financial Group 2,183,486 1.072,203 Mizrahi Tefahot Bank 40,708 0.02651,802 Mizuho Financial Group 1,183,832 0.582,617 Raiffeisen Bank International 94,903 0.0554,485 Resona Holdings 325,556 0.1676,528 Royal Bank of Scotland Group 287,795 0.144,480 Shinsei Bank 77,510 0.049,403 Shizuoka Bank 97,160 0.0519,350 Societe Generale 1,000,288 0.4959,961 Standard Chartered 632,756 0.3136,375 Sumitomo Mitsui Financial Group 1,571,891 0.777,888 Sumitomo Mitsui Trust Holdings 313,209 0.1545,885 UniCredit 858,438 0.425,523 Yamaguchi Financial Group 65,648 0.03
Electric Utilities8,131 AES 88,059 0.0422,914 Chubu Electric Power 284,874 0.144,712 Chugoku Electric Power 50,654 0.0344,399 EDP - Energias de Portugal 153,812 0.085,494 Electric Power Development 148,019 0.0720,276 Electricite de France 253,700 0.12163,623 Enel 1,007,935 0.5057,031 Engie 981,701 0.4820,453 Exelon 806,053 0.40108,323 Iberdrola 840,280 0.4124,481 Kansai Electric Power 299,900 0.1514,783 Kyushu Electric Power 154,982 0.0828,687 Origin Energy 211,362 0.1010,731 RWE 219,058 0.111,684 SCANA 66,989 0.0313,049 Tohoku Electric Power 166,921 0.0875,892 Tokyo Electric Power Holdings 300,469 0.15
CONCEPT FUND SOLUTIONS PLC
199
db x-trackers MSCI World Value Factor UCITS ETF (DR)
Portfolio of Investments as at 31 December 2017 cont/d
Equities - 98.87%(31 December 2016 - 98.99%) cont/d
Number ofShares Security
ValueUSD
% ofFund
Electric Utilities cont/d4,688 Uniper 146,363 0.07
db x-trackers MSCI World Value Factor UCITS ETF (DR)
Portfolio of Investments as at 31 December 2017 cont/d
Equities - 98.87%(31 December 2016 - 98.99%) cont/d
Number ofShares Security
ValueUSD
% ofFund
Health Care Equipment and Supplies4,290 Zimmer Biomet Holdings 517,674 0.25
517,674 0.25
Health Care Providers and Services7,247 Aetna 1,307,286 0.646,727 Anthem 1,513,642 0.755,206 Cigna 1,057,287 0.523,480 Envision Healthcare 120,269 0.062,062 Laboratory of America Holdings 328,910 0.164,907 Mediclinic International 43,113 0.021,109 Universal Health Services 125,705 0.06
4,496,212 2.21
Hotels, Restaurants and Leisure11,412 City Developments 106,657 0.05695 Sankyo 21,871 0.01
128,528 0.06
Household Durables12,883 Fuji Electric 97,094 0.052,931 THK 110,059 0.05
Insurance61,768 Aegon 394,219 0.203,244 Ageas 158,601 0.0815,171 American International Group 903,888 0.4520,278 Assicurazioni Generali 370,117 0.1835,834 AXA 1,064,334 0.522,488 Brighthouse Financial 145,896 0.072,982 CNP Assurances 68,948 0.0319,889 Dai-ichi Life Holdings 410,316 0.204,368 Hartford Financial Services Group 245,831 0.1236,659 Japan Post Holdings 420,448 0.213,956 Lincoln National 304,098 0.1516,734 Mapfre 53,812 0.0315,422 MetLife 779,736 0.389,697 MS&AD Insurance Group Holdings 328,312 0.162,154 Muenchener Rueckversicherungs-Gesellschaft 467,514 0.238,923 NN Group 387,016 0.1954,148 Old Mutual 169,717 0.085,324 Power of Canada 137,546 0.077,511 Prudential Financial 863,615 0.432,340 SCOR 94,257 0.056,362 Sompo Holdings 246,461 0.12
CONCEPT FUND SOLUTIONS PLC
201
db x-trackers MSCI World Value Factor UCITS ETF (DR)
Portfolio of Investments as at 31 December 2017 cont/d
Equities - 98.87%(31 December 2016 - 98.99%) cont/d
Number ofShares Security
ValueUSD
% ofFund
Insurance cont/d617 Swiss Life Holding 218,435 0.115,047 Swiss Re 472,590 0.237,198 T&D Holdings 123,130 0.068,592 Tokio Marine Holdings 392,113 0.1916,571 UnipolSai Assicurazioni 38,742 0.025,422 Voya Financial 268,226 0.133,312 XL Group 116,450 0.06
9,644,368 4.75
Leisure Equipment and Products4,605 Yamaha Motor 151,047 0.07
151,047 0.07
Machinery10,924 Amada Holdings 148,757 0.07222,857 Hitachi 1,736,761 0.8650,635 Mitsubishi Electric 841,220 0.4114,907 Mitsubishi Heavy Industries 557,110 0.274,160 Sumitomo Heavy Industries 176,149 0.09
3,459,997 1.70
Media2,156 Discovery Communications Class A Shares 48,251 0.023,158 Discovery Communications Class C Shares 66,855 0.031,471 Lagardere 47,215 0.027,059 News Class A Shares 114,427 0.0612,409 Pearson 123,547 0.067,542 Viacom 232,369 0.12
Oil and Gas1,941 Andeavor 221,934 0.112,162 Antero Resources 41,078 0.023,988 Baker Hughes 126,180 0.06246,272 BP 1,741,346 0.865,091 Crescent Point Energy 38,926 0.0238,909 Eni 644,763 0.322,417 HollyFrontier 123,799 0.06
CONCEPT FUND SOLUTIONS PLC
202
db x-trackers MSCI World Value Factor UCITS ETF (DR)
Portfolio of Investments as at 31 December 2017 cont/d
Equities - 98.87%(31 December 2016 - 98.99%) cont/d
Number ofShares Security
ValueUSD
% ofFund
Oil and Gas cont/d3,504 Idemitsu Kosan 140,751 0.0722,910 Inpex 286,553 0.1488,160 JXTG Holdings 568,951 0.285,470 Marathon Petroleum 360,911 0.182,385 OMV 151,300 0.071,911 Plains GP Holdings 41,946 0.0230,976 Repsol 548,455 0.2763,760 Royal Dutch Shell Class A Shares 2,139,033 1.0551,578 Royal Dutch Shell Class B Shares 1,750,234 0.8629,190 Santos 124,429 0.063,130 Showa Shell Sekiyu 42,511 0.0214,043 Statoil 300,798 0.154,404 TechnipFMC 137,889 0.0740,655 Total 2,247,849 1.112,269 Tourmaline Oil 41,253 0.027,422 Valero Energy 682,156 0.33
12,503,045 6.15
Paper and Related Products23,780 Oji Holdings 158,322 0.0811,340 Stora Enso 180,018 0.0910,372 UPM-Kymmene 322,701 0.16
Real Estate5,309 Aeon Mall 103,871 0.05113,787 CapitaLand 300,560 0.15162,703 CK Asset Holdings 1,421,541 0.703,163 Daito Trust Construction 645,095 0.3271,975 Hang Lung Properties 175,856 0.097,103 Hulic 79,826 0.0423,072 Hysan Development 122,336 0.06195,155 Sino Land 345,509 0.1727,051 Sun Hung Kai Properties 451,236 0.2216,969 UOL Group 112,627 0.0552,609 Wheelock & Co 375,524 0.18
4,133,981 2.03
Real Estate Investment Trust7,548 AGNC Investment 152,394 0.0718,554 Annaly Capital Management 220,607 0.1123,601 Host Hotels & Resorts 468,480 0.23
CONCEPT FUND SOLUTIONS PLC
203
db x-trackers MSCI World Value Factor UCITS ETF (DR)
Portfolio of Investments as at 31 December 2017 cont/d
Equities - 98.87%(31 December 2016 - 98.99%) cont/d
Number ofShares Security
ValueUSD
% ofFund
Real Estate Investment Trust cont/d141 Nomura Real Estate Master Fund 175,108 0.09
Software9,161 CA 304,878 0.155,480 First Data 91,571 0.058,968 Micro Focus International 306,077 0.151,981 Mixi 88,982 0.044,821 Nexon 140,372 0.07
931,880 0.46
Textiles and Apparel14,098 Yue Yuen Industrial Holdings 55,365 0.03
55,365 0.03
Transportation160 AP Moller - Maersk Class A Shares 267,338 0.13243 AP Moller - Maersk Class B Shares 424,831 0.216,019 Central Japan Railway 1,078,237 0.5328,212 ComfortDelGro 41,799 0.024,829 Kamigumi 106,868 0.055,815 Mitsui OSK Lines 194,091 0.102,937 Nippon Express 195,279 0.107,045 Nippon Yusen 171,919 0.0947,037 Royal Mail 287,922 0.144,298 West Japan Railway 313,889 0.15
3,082,173 1.52Total Equities 200,979,167 98.87
CONCEPT FUND SOLUTIONS PLC
204
db x-trackers MSCI World Value Factor UCITS ETF (DR)
Portfolio of Investments as at 31 December 2017 cont/d
Preferred Stocks - 1.07%(31 December 2016 - 0.93%)
Diversified Telecommunications151,090 Telecom Italia 108,132 0.05
108,132 0.05Total Preferred Stocks 2,166,071 1.07
Rights - 0.01% (31 December 2016 - 0.01%)
Oil and Gas30,976 Repsol 14,097 0.01
14,097 0.01Total Rights 14,097 0.01Total Transferable Securities 203,159,335 99.95
Total Financial Assets at Fair Value through Profit or Loss 203,159,335 99.95Other Net Assets - 0.05% (31 December 2016 - 0.07%) 107,144 0.05
Net Assets Attributable to Redeeming Participating Shareholders 203,266,479 100.00
Analysis of Total Assets % of Total Assets31/12/2017
Transferable securities admitted to an official stock exchange listing 99.86Current Assets 0.14Total Assets 100.00
CONCEPT FUND SOLUTIONS PLC
205
Deutsche MSCI World Index Fund
Investment Manager’s Report for the financial year ended 31 December 2017
Investment Objective
The investment objective of the Fund is to track the performance before fees and expenses of the UnderlyingAsset, which is the MSCI Total Return Net World Index (the “Reference Index”). The Reference Index isdesigned to reflect the performance of the shares of certain companies in various developed countries. Thecompanies making up the Reference Index are large and medium sized companies based on the combinedvalue of a company’s readily available shares as compared to other companies.
The Reference Index is calculated and maintained by MSCI Inc (and its subsidiaries). The Reference Index isa free float-adjusted market capitalisation weighted index reflecting the performance of large andmid-capitalisation companies in the global developed markets. According to the MSCI index methodology theReference Index targets an 85% free float-adjusted market representation level within each industry group inthe global developed markets.
As of 2 June 2014, the Reference Index consists of the following 23 developed markets: Australia, Austria,Belgium, Canada, Denmark, Finland, France, Germany, Hong Kong, Ireland, Israel, Italy, Japan, Netherlands,New Zealand, Norway, Portugal, Singapore, Spain, Sweden, Switzerland, the United Kingdom, and theUnited States.
The underlying constituents of the Reference Index are listed in multiple currencies.
The Reference Index for Share Classes 1D - Core, 1D - Institutional and 1C - Institutional is calculated in EURon an end of day basis. The Reference Index for Share Class 2D - Institutional is calculated in US Dollars onan end of day basis.
The Reference Index has a base date of 31 December 1969.
Fund Performance
The Fund’s performance amounts are calculated net of fees and taxes.
The Fund performed in line with its benchmark and within guided tolerance levels.
The Fund has tracked the Reference Index within its anticipated tracking error. The anticipated tracking errorfor the Fund is 1.00%.
Total Net Assets Net Assets per Share31/12/2017 Price (at 31/12/2017)
Deutsche MSCI World Index Fund €33,771,368 €46.70
Year to Date Year to DateFund Return Index Return
Deutsche MSCI World Index Fund 8.03% 8.32%
Year to Date Year to DateTracking Error Tracking Difference1
Deutsche MSCI World Index Fund 0.31% (0.29)%
1The performance difference of the share class arose from various reasons such as inaccuracies in the index replication via optimization,various fee components like management fee, fixed fee and transaction costs, specific taxes respectively tax advantages. The realisedtracking error level is contrasted with the anticipated tracking error level; the level of realised tracking error was within the expected range,due to the effectiveness of replication techniques utilised over the 2017 period.
CONCEPT FUND SOLUTIONS PLC
206
Deutsche MSCI World Index Fund
Portfolio of Investments as at 31 December 2017
Transferable Securities
Equities - 99.26% (31 December 2016 - 97.23%)
Number ofShares Security
ValueEUR
% ofFund
Aerospace and Defense658 Airbus 54,614 0.164,461 BAE Systems 28,796 0.08560 Boeing 137,533 0.41160 Harris 18,874 0.06371 IHI 10,285 0.03364 Kawasaki Heavy Industries 10,643 0.0396 L3 Technologies 15,817 0.05276 Lockheed Martin 73,792 0.22192 Northrop Grumman 49,073 0.15319 Raytheon 49,904 0.15261 Rockwell Collins 29,478 0.091,798 Rolls-Royce Holdings 17,156 0.05296 Safran 25,429 0.07132 Thales 11,864 0.0364 TransDigm Group 14,637 0.04827 United Technologies 87,858 0.26
635,753 1.88
Agriculture1,843 Altria Group 109,601 0.32741 Archer-Daniels-Midland 24,733 0.072,351 British American Tobacco 132,901 0.39160 Bunge 8,938 0.031,027 Imperial Tobacco Group 36,629 0.111,225 Japan Tobacco 32,882 0.101,487 Philip Morris International 130,831 0.39470 Swedish Match 15,451 0.05
491,966 1.46
Airlines696 Deutsche Lufthansa 21,381 0.06400 Japan Airlines 13,035 0.041,900 Singapore Airlines 12,633 0.04
47,049 0.14
Auto Components387 Aisin Seiki 18,110 0.05303 Aptiv 21,405 0.06700 Bridgestone 27,106 0.08204 Cie Generale des Etablissements Michelin 24,388 0.07114 Continental 25,656 0.08500 Denso 24,998 0.072,247 GKN 8,085 0.02417 Magna International 19,745 0.06800 NOK 15,560 0.05800 Sumitomo Electric Industries 11,266 0.03200 Toyota Industries 10,705 0.03296 Valeo 18,432 0.06400 Yokohama Rubber 8,170 0.03
233,626 0.69
Automobiles379 Bayerische Motoren Werke 32,909 0.10957 Daimler 67,756 0.201,420 Fiat Chrysler Automobiles 21,172 0.063,930 Ford Motor 40,877 0.121,445 General Motors 49,326 0.151,802 Honda Motor 51,448 0.15
CONCEPT FUND SOLUTIONS PLC
207
Deutsche MSCI World Index Fund
Portfolio of Investments as at 31 December 2017 cont/d
Equities - 99.26% (31 December 2016 - 97.23%) cont/d
Number ofShares Security
ValueEUR
% ofFund
Automobiles cont/d918 Isuzu Motors 12,806 0.04896 Mazda Motor 10,012 0.031,553 Mitsubishi Motors 9,345 0.032,726 Nissan Motor 22,641 0.07495 PACCAR 29,301 0.09428 Peugeot 7,257 0.02217 Renault 18,208 0.05700 Subaru 18,541 0.05400 Suzuki Motor 19,321 0.06176 Tesla 45,634 0.142,563 Toyota Motor 136,667 0.402,057 Volvo 31,949 0.09
625,170 1.85
Banks386 Aozora Bank 12,513 0.043,196 Australia & New Zealand Banking Group 59,829 0.187,014 Banco Bilbao Vizcaya Argentaria 49,884 0.1517,970 Banco Santander 98,458 0.291,595 Bank Hapoalim 9,791 0.0310,565 Bank of America 259,726 0.77733 Bank of Montreal 49,007 0.141,085 Bank of New York Mellon 48,666 0.141,511 Bank of Nova Scotia 81,468 0.243,208 Bankia 12,790 0.0419,819 Barclays 45,346 0.131,183 BB&T 48,983 0.141,185 BNP Paribas 73,766 0.223,900 CaixaBank 15,167 0.04486 Canadian Imperial Bank of Commerce 39,583 0.12543 Capital One Financial 45,030 0.132,816 Citigroup 174,499 0.52600 Citizens Financial Group 20,976 0.06947 Commerzbank 11,842 0.031,440 Commonwealth Bank of Australia 75,355 0.221,793 Credit Agricole 24,743 0.073,100 Credit Suisse Group 46,096 0.141,006 Danske Bank 32,644 0.101,900 DBS Group Holdings 29,422 0.091,799 Deutsche Bank 28,559 0.081,085 DNB 16,802 0.051,335 Fifth Third Bancorp 33,731 0.10192 First Republic Bank 13,853 0.04405 Goldman Sachs Group 85,924 0.251,183 Hang Seng Bank 24,449 0.0718,567 HSBC Holdings 160,408 0.474,147 ING Groep 63,553 0.1912,115 Intesa Sanpaolo 33,559 0.103,478 JPMorgan Chase & Co 309,741 0.92438 KBC Group 31,146 0.091,117 KeyCorp 18,762 0.0668,378 Lloyds Banking Group 52,427 0.16202 M&T Bank 28,764 0.09480 Macquarie Group 31,149 0.091,577 Mediobanca 14,918 0.0414,200 Mitsubishi UFJ Financial Group 86,751 0.2626,800 Mizuho Financial Group 40,536 0.121,595 Morgan Stanley 69,695 0.212,980 National Australia Bank 57,397 0.173,567 Nordea Bank 36,027 0.11
CONCEPT FUND SOLUTIONS PLC
208
Deutsche MSCI World Index Fund
Portfolio of Investments as at 31 December 2017 cont/d
Equities - 99.26% (31 December 2016 - 97.23%) cont/d
Number ofShares Security
ValueEUR
% ofFund
Banks cont/d400 Northern Trust 33,275 0.102,900 Oversea-Chinese Banking 22,390 0.07523 PNC Financial Services Group 62,845 0.191,819 Regions Financial 26,176 0.082,100 Resona Holdings 10,450 0.031,450 Royal Bank of Canada 98,929 0.291,771 Skandinaviska Enskilda Banken 17,347 0.051,100 Societe Generale 47,355 0.143,210 Standard Chartered 28,210 0.08511 State Street 41,538 0.121,560 Sumitomo Mitsui Financial Group 56,140 0.17454 Sumitomo Mitsui Trust Holdings 15,013 0.04510 SunTrust Banks 27,432 0.081,436 Svenska Handelsbanken 16,388 0.051,263 Swedbank 25,423 0.081,641 Toronto-Dominion Bank 80,330 0.243,896 UBS Group 59,730 0.182,107 UniCredit 32,827 0.101,323 United Overseas Bank 21,806 0.061,882 US Bancorp 83,975 0.254,467 Wells Fargo & Co 225,694 0.673,222 Westpac Banking 65,793 0.19
Electric Utilities656 AGL Energy 10,409 0.03274 Ameren 13,460 0.04595 American Electric Power 36,454 0.11834 CenterPoint Energy 19,697 0.061,300 Chubu Electric Power 13,459 0.04796 Chugoku Electric Power 7,126 0.022,385 CLP Holdings 20,313 0.06287 Consolidated Edison 20,304 0.06670 Dominion Energy 45,228 0.13192 DTE Energy 17,502 0.05418 Duke Energy 29,279 0.093,029 E.ON 27,446 0.08319 Edison International 16,800 0.05
CONCEPT FUND SOLUTIONS PLC
213
Deutsche MSCI World Index Fund
Portfolio of Investments as at 31 December 2017 cont/d
Equities - 99.26% (31 December 2016 - 97.23%) cont/d
Number ofShares Security
ValueEUR
% ofFund
Electric Utilities cont/d2,573 EDP - Energias de Portugal 7,423 0.028,223 Enel 42,184 0.121,498 Engie 21,474 0.06311 Entergy 21,080 0.06306 Eversource Energy 16,100 0.051,021 Exelon 33,509 0.10408 FirstEnergy 10,404 0.03580 Fortis 17,775 0.057,700 Iberdrola 49,742 0.151,500 Kansai Electric Power 15,303 0.05511 NextEra Energy 66,467 0.201,914 Origin Energy 11,744 0.03503 PG&E 18,779 0.061,500 Power Assets Holdings 10,539 0.03638 PPL 16,444 0.05488 Public Service Enterprise Group 20,929 0.06511 Red Electrica 9,561 0.03938 RWE 15,946 0.05319 SCANA 10,568 0.03997 Southern 39,928 0.12931 SSE 13,844 0.043,588 Terna Rete Elettrica Nazionale 17,380 0.051,200 Tohoku Electric Power 12,783 0.04273 WEC Energy Group 15,103 0.04638 Xcel Energy 25,561 0.08
818,047 2.42
Electrical Equipment255 AMETEK 15,390 0.041,200 Canon 37,259 0.11800 Emerson Electric 46,429 0.14358 Legrand 22,980 0.07200 Mabuchi Motor 9,034 0.03300 Nidec 35,063 0.10779 Ricoh 6,029 0.02573 Schneider Electric 40,603 0.12
Gas Utilities192 Atmos Energy 13,733 0.049,100 Centrica 14,075 0.04600 Enagas 14,322 0.047,920 Hong Kong & China Gas 12,926 0.043,737 National Grid 36,841 0.11400 Osaka Gas 6,417 0.02223 Sempra Energy 19,856 0.063,820 Snam 15,585 0.05400 Tokyo Gas 7,625 0.02
141,380 0.42
Health Care Equipment and Supplies2,031 Abbott Laboratories 96,527 0.29636 Baxter International 34,236 0.10271 Becton Dickinson & Co 48,310 0.141,756 Boston Scientific 36,252 0.11132 Coloplast 8,749 0.03670 Danaher 51,790 0.15255 Edwards Lifesciences 23,935 0.07242 Essilor International Cie Generale d'Optique 27,818 0.08308 Henry Schein 17,924 0.05150 Intuitive Surgical 45,587 0.1464 Lonza Group 14,401 0.041,420 Medtronic 95,490 0.28361 Olympus 11,529 0.03912 Smith & Nephew 13,233 0.04400 Stryker 51,579 0.15
CONCEPT FUND SOLUTIONS PLC
215
Deutsche MSCI World Index Fund
Portfolio of Investments as at 31 December 2017 cont/d
Equities - 99.26% (31 December 2016 - 97.23%) cont/d
Number ofShares Security
ValueEUR
% ofFund
Health Care Equipment and Supplies cont/d200 Sysmex 13,114 0.04463 Thermo Fisher Scientific 73,213 0.22266 Zimmer Biomet Holdings 26,731 0.08
690,418 2.04
Health Care Providers and Services410 Aetna 61,592 0.18287 Anthem 53,779 0.16255 Centene 21,423 0.06287 Cigna 48,540 0.14330 DaVita 19,855 0.06487 Fresenius & Co 31,689 0.10229 Fresenius Medical Care & Co 20,102 0.06326 HCA Healthcare 23,847 0.07177 Humana 36,566 0.11173 Laboratory of America Holdings 22,981 0.07250 Quest Diagnostics 20,505 0.06164 Ramsay Health Care 7,490 0.02908 UnitedHealth Group 166,704 0.49128 Universal Health Services 12,083 0.04
547,156 1.62
Hotels, Restaurants and Leisure236 Accor 10,148 0.03656 Aristocrat Leisure 10,127 0.033,242 Galaxy Entertainment Group 21,655 0.0622,573 Genting Singapore 18,427 0.06213 Hilton Worldwide Holdings 14,166 0.04179 InterContinental Hotels Group 9,516 0.03523 Las Vegas Sands 30,266 0.09390 Marriott International 44,083 0.13638 MGM Resorts International 17,740 0.05200 Oriental Land 15,184 0.053,274 Sands China 14,073 0.04300 Sankyo 7,862 0.02193 Whitbread 8,697 0.034,498 Wynn Macau 11,860 0.04129 Wynn Resorts 18,111 0.05
Real Estate4,276 CK Asset Holdings 31,112 0.09116 Daito Trust Construction 19,702 0.06539 Deutsche Wohnen 19,652 0.061,540 Henderson Land Development 8,449 0.021,600 Hongkong Land Holdings 9,381 0.031,300 Mitsubishi Estate 18,837 0.061,000 Mitsui Fudosan 18,666 0.0515,436 New World Development 19,305 0.064,000 Sino Land 5,898 0.02795 Sumitomo Realty & Development 21,763 0.062,000 Sun Hung Kai Properties 27,783 0.08256 Swiss Prime Site 19,689 0.06457 Vonovia 18,915 0.06
239,152 0.71
CONCEPT FUND SOLUTIONS PLC
221
Deutsche MSCI World Index Fund
Portfolio of Investments as at 31 December 2017 cont/d
Equities - 99.26% (31 December 2016 - 97.23%) cont/d
Number ofShares Security
ValueEUR
% ofFund
Real Estate Investment Trust499 American Tower 59,287 0.18153 AvalonBay Communities 22,732 0.07181 Boston Properties 19,600 0.061,926 British Land 15,004 0.04376 Crown Castle International 34,760 0.101,049 Dexus 6,662 0.02177 Digital Realty Trust 16,789 0.0579 Equinix 29,817 0.09407 Equity Residential 21,614 0.0673 Essex Property Trust 14,674 0.04160 Extra Space Storage 11,652 0.0396 Federal Realty Investment Trust 10,618 0.03641 GGP 12,486 0.041,934 Goodman Group 10,607 0.031,967 GPT Group 6,547 0.02687 HCP 14,921 0.04827 Host Hotels & Resorts 13,671 0.04487 Iron Mountain 15,302 0.052 Japan Real Estate Investment 7,910 0.02230 Klepierre 8,433 0.021,019 Land Securities Group 11,571 0.03440 Liberty Property Trust 15,760 0.052,000 Link REIT 15,436 0.05254 Macerich 13,893 0.0410,519 Mirvac Group 16,101 0.052 Nippon Building Fund 8,147 0.024 Nippon Prologis REIT 7,047 0.02606 Prologis 32,556 0.10195 Public Storage 33,940 0.10288 Realty Income 13,676 0.04128 SBA Communications 17,413 0.055,242 Scentre Group 14,306 0.04351 Simon Property Group 50,200 0.155,489 Stockland 16,017 0.05132 Unibail-Rodamco 27,720 0.088 United Urban Investment 9,587 0.03444 Ventas 22,189 0.071,698 VEREIT 11,015 0.035,365 Vicinity Centres 9,505 0.03237 Vornado Realty Trust 15,430 0.05443 Welltower 23,526 0.071,967 Westfield 12,159 0.04907 Weyerhaeuser 26,633 0.08
776,913 2.30
Retail80 Advance Auto Parts 6,642 0.02700 Aeon 9,845 0.03417 Alimentation Couche-Tard 18,179 0.0543 AutoZone 25,474 0.08347 Best Buy 19,786 0.06319 CarMax 17,037 0.0532 Chipotle Mexican Grill 7,702 0.02576 Cie Financiere Richemont 43,464 0.13511 Costco Wholesale 79,203 0.231,175 CVS Health 70,942 0.21383 Dollar General 29,666 0.09339 Dollar Tree 30,295 0.09128 Dollarama 13,361 0.04200 Don Quijote Holdings 8,708 0.03
CONCEPT FUND SOLUTIONS PLC
222
Deutsche MSCI World Index Fund
Portfolio of Investments as at 31 December 2017 cont/d
Equities - 99.26% (31 December 2016 - 97.23%) cont/d
Number ofShares Security
ValueEUR
% ofFund
Retail cont/d100 Fast Retailing 33,200 0.10266 Genuine Parts 21,047 0.061,125 Hennes & Mauritz 19,373 0.061,149 Home Depot 181,354 0.541,500 Industria de Diseno Textil 43,567 0.13600 Isetan Mitsukoshi Holdings 6,196 0.0284 Kering 33,012 0.104,175 Kingfisher 15,883 0.05415 Kohl's 18,742 0.06926 Lowe's 71,671 0.21160 Luxottica Group 8,184 0.02785 McDonald's 112,520 0.33161 Next 8,207 0.02100 Nitori Holdings 11,876 0.03112 O'Reilly Automotive 22,435 0.07128 Pandora 11,613 0.03328 Restaurant Brands International 16,845 0.05415 Ross Stores 27,735 0.081,340 Starbucks 64,087 0.1929 Swatch Group 9,849 0.03592 Tapestry 21,806 0.06575 Target 31,245 0.09734 TJX 46,737 0.14321 Travis Perkins 5,667 0.0296 Ulta Salon Cosmetics & Fragrance 17,881 0.05400 USS 7,055 0.02990 Walgreens Boots Alliance 59,872 0.181,339 Wal-Mart Stores 110,115 0.33415 Yum! Brands 28,205 0.08
Software1,000 Activision Blizzard 52,732 0.16594 Adobe Systems 86,686 0.26584 Amadeus IT Group 35,104 0.10223 Autodesk 19,468 0.06496 Cerner 27,836 0.08260 Citrix Systems 19,054 0.06
CONCEPT FUND SOLUTIONS PLC
223
Deutsche MSCI World Index Fund
Portfolio of Investments as at 31 December 2017 cont/d
Equities - 99.26% (31 December 2016 - 97.23%) cont/d
Number ofShares Security
ValueEUR
% ofFund
Software cont/d32 Constellation Software 16,207 0.05319 Electronic Arts 27,910 0.08399 Fidelity National Information Services 31,264 0.09255 Fiserv 27,847 0.08290 Intuit 38,105 0.11436 Micro Focus International 12,392 0.047,248 Microsoft 516,317 1.533,148 Oracle 123,949 0.37447 Paychex 25,343 0.07200 Red Hat 20,003 0.062,189 Sage Group 19,679 0.06743 salesforce.com 63,255 0.191,078 SAP 100,739 0.30200 ServiceNow 21,717 0.06
1,285,607 3.81
Textiles and Apparel229 Adidas 38,278 0.11417 Burberry Group 8,418 0.0333 Hermes International 14,726 0.04313 LVMH Moet Hennessy Louis Vuitton 76,810 0.23402 Michael Kors Holdings 21,074 0.06109 Mohawk Industries 25,044 0.071,468 NIKE 76,469 0.23600 Under Armour 7,210 0.02530 VF 32,662 0.10
300,691 0.89
Transportation10 AP Moller - Maersk 14,559 0.043,214 Aurizon Holdings 10,384 0.03867 Canadian National Railway 59,729 0.18177 Canadian Pacific Railway 27,018 0.08200 Central Japan Railway 29,837 0.09160 CH Robinson Worldwide 11,871 0.031,276 CSX 58,455 0.171,231 Deutsche Post 48,932 0.14255 DSV 16,734 0.05387 East Japan Railway 31,456 0.09319 Expeditors International of Washington 17,185 0.05303 FedEx 62,967 0.19300 Hankyu Hanshin Holdings 10,047 0.03500 Keikyu 8,002 0.02200 Keio 7,326 0.02200 Kintetsu Group Holdings 6,387 0.02137 Kuehne + Nagel International 20,196 0.06454 Nippon Yusen 9,226 0.03387 Norfolk Southern 46,699 0.14500 Odakyu Electric Railway 8,908 0.032,059 Royal Mail 10,496 0.03500 Tokyu 6,646 0.02689 Union Pacific 76,944 0.23718 United Parcel Service 71,244 0.21200 West Japan Railway 12,164 0.04400 Yamato Holdings 6,705 0.02
690,117 2.04
Water315 American Water Works 24,000 0.07740 Severn Trent 18,023 0.05
CONCEPT FUND SOLUTIONS PLC
224
Deutsche MSCI World Index Fund
Portfolio of Investments as at 31 December 2017 cont/d
Equities - 99.26% (31 December 2016 - 97.23%) cont/d
Number ofShares Security
ValueEUR
% ofFund
Water cont/d642 United Utilities Group 5,999 0.02464 Veolia Environnement 9,872 0.03
57,894 0.17Total Equities 33,522,674 99.26
Preferred Stocks - 0.21% (31 December 2016 - 0.19%)
Automobiles212 Volkswagen 35,287 0.11
35,287 0.11
Diversified Telecommunications22,000 Telecom Italia 13,112 0.04
13,112 0.04
Household Products196 Henkel & Co 21,629 0.06
21,629 0.06Total Preferred Stocks 70,028 0.21
Rights - 0.00% (31 December 2016 - 0.00%)
Commercial Services246 Transurban Group 162 0.00
162 0.00Total Rights 162 0.00Total Transferable Securities 33,592,864 99.47
Total Financial Assets at Fair Value through Profit or Loss 33,592,864 99.47Other Net Assets - 0.53% (31 December 2016 - 2.58%) 178,504 0.53
Net Assets Attributable to Redeeming Participating Shareholders 33,771,368 100.00
Analysis of Total Assets % of Total Assets31/12/2017
Transferable securities admitted to an official stock exchange listing 99.46Current Assets 0.54Total Assets 100.00
CONCEPT FUND SOLUTIONS PLC
225
db x-trackers MSCI GCC Select Index UCITS ETF
Investment Manager’s Report for the financial year ended 31 December 2017
Investment Objective
The investment objective of the Fund is to track the performance before fees and expenses of the UnderlyingAsset, which is the MSCI GCC Countries ex Select Securities Index (the “Reference Index”). The ReferenceIndex is designed to reflect the performance of shares of companies from 6 Gulf Cooperation Council equitymarkets: Bahrain, Kuwait, Oman, Qatar, Saudi Arabia and the United Arab Emirates.
The Reference Index is calculated and maintained by MSCI Inc (and its subsidiaries). The Reference Indextracks the performance of the companies included in the MSCI GCC Countries ex Select Securities Indexclassified according to the Index Sponsor’s methodology.
The Reference Index is a custom free float market capitalisation weighted index designed to reflect theperformance of shares of companies from 6 Gulf Cooperation Council equity markets: Bahrain, Kuwait, Oman,Qatar, Saudi Arabia and the United Arab Emirates. According to the Index Sponsor's index methodology, theReference Index targets approximate coverage of 85% of the free float-adjusted market capitalisation withineach country; however the Index Sponsor may exclude certain securities from time to time on the basis thatthey may have restrictions on foreign ownership.
The Reference Index is calculated in US Dollars on an end of day basis.
The Reference Index has a base date of 30 November 2009 when it was set to 1000.
Fund Performance
The Fund’s performance amounts are calculated net of fees and taxes.
The Fund performed in line with its benchmark and within guided tolerance levels.
The Fund has tracked the Reference Index within its anticipated tracking error. The anticipated tracking errorfor the Fund is 1.00%.
Total Net Assets Net Assets per Share31/12/2017 Price (at 31/12/2017)
db x-trackers MSCI GCC Select Index UCITS ETF $23,887,709 $14.36
Year to Date Year to DateFund Return Index Return
db x-trackers MSCI GCC Select Index UCITS ETF 3.41% 4.46%
Year to Date Year to DateTracking Error Tracking Difference1
db x-trackers MSCI GCC Select Index UCITS ETF 0.03% (1.05)%
1The performance difference of the share class arose from various reasons such as various fee components like management fee, fixedfee and transaction costs, specific taxes respectively tax advantages, as well as positive or negative swap adjustments. The realisedtracking error level is contrasted with the anticipated tracking error level; the level of realised tracking error was within the expected range,due to the effectiveness of replication techniques utilised over the 2017 period.
CONCEPT FUND SOLUTIONS PLC
226
db x-trackers MSCI GCC Select Index UCITS ETF
Portfolio of Investments as at 31 December 2017
Transferable Securities
Equities - 93.20% (31 December 2016 - 94.93%)
Number ofShares Security
ValueUSD
% ofFund
Automobiles5,628 Bayerische Motoren Werke 586,806 2.467,322 Daimler 622,492 2.60
1,209,298 5.06
Banks19,083 ABN Amro Group 616,410 2.5834,520 Deutsche Bank 658,045 2.7532,688 ING Groep 601,533 2.5234,200 UBS Group 629,603 2.64
2,505,591 10.49
Building Products5,774 HeidelbergCement 625,741 2.62
Total Financial Derivative Instruments (368,123) (1.54)
Total Financial Assets at Fair Value through Profit or Loss 23,908,784 100.09Other Net Liabilities - (0.09)% (31 December 2016 - 0.35%) (21,075) (0.09)
Net Assets Attributable to Redeeming Participating Shareholders 23,887,709 100.00
* The counterparty for the Total Return Swaps is HSBC Bank Plc, the Index is the MSCI GCC Countries ex Select Index.
Analysis of Total Assets % of Total Assets31/12/2017
Transferable securities admitted to an official stock exchange listing 50.38OTC Financial Derivative Instruments 49.62Total Assets 100.00
CONCEPT FUND SOLUTIONS PLC
229
db x-trackers FTSE All-World ex UK UCITS ETF (DR)
Investment Manager’s Report for the financial year ended 31 December 2017
Investment Objective
The investment objective of the Fund is to track the performance before fees and expenses of the UnderlyingAsset, which is the FTSE All-World ex UK Index (the “Reference Index”). The Reference Index is designed toreflect the equity market performance of shares of companies from developed countries and emergingmarkets worldwide excluding the UK.
The Reference Index comprises large and mid-cap stocks providing coverage of developed and emergingmarkets worldwide excluding the UK. The Reference Index is derived from the FTSE Global Equity IndexSeries (''GEIS'') as the overall index universe, which covers 98% of the world's investable marketcapitalisation. Securities of companies which are listed on a stock exchange or a recognised market areeligible for inclusion in GEIS.
Fund Performance
The Fund’s performance amounts are calculated net of fees and taxes.
The Fund performed in line with its benchmark and within guided tolerance levels.
The Fund has tracked the Reference Index within its anticipated tracking error. The anticipated tracking errorfor the Fund is 2.00%.
Total Net Assets Net Assets per Share31/12/2017 Price (at 31/12/2017)
db x-trackers FTSE All-World ex UK UCITS ETF (DR) £28,666,604 £52.75
Year to Date Year to DateFund Return Index Return
db x-trackers FTSE All-World ex UK UCITS ETF (DR) 13.27% 13.34%
Year to Date Year to DateTracking Error Tracking Difference1
db x-trackers FTSE All-World ex UK UCITS ETF (DR) 0.21% (0.08)%
1The performance difference of the share class arose from various reasons such as inaccuracies in the index replication via optimization,various fee components like management fee, fixed fee and transaction costs, specific taxes respectively tax advantages. The realisedtracking error level is contrasted with the anticipated tracking error level; the level of realised tracking error was within the expected range,due to the effectiveness of replication techniques utilised over the 2017 period.
CONCEPT FUND SOLUTIONS PLC
230
db x-trackers FTSE All-World ex UK UCITS ETF (DR)
Portfolio of Investments as at 31 December 2017
Transferable Securities
Equities - 99.17%(31 December 2016 - 99.22%)
Number ofShares Security
ValueGBP
% ofFund
Aerospace and Defense477 Airbus 35,144 0.12449 Arconic 9,045 0.03519 Boeing 113,146 0.39113 Elbit Systems 11,189 0.041,323 Embraer 5,897 0.02279 General Dynamics 41,961 0.15169 Harris 17,697 0.06119 Korea Aerospace Industries 3,899 0.01110 L3 Technologies 16,088 0.06185 Lockheed Martin 43,906 0.15162 Northrop Grumman 36,754 0.13290 Raytheon 40,271 0.1447 Rockwell Collins 4,712 0.02255 Safran 19,446 0.07704 United Technologies 66,390 0.23453 Zodiac Aerospace 10,025 0.04
475,570 1.66
Agriculture1,720 Altria Group 90,797 0.32576 Archer-Daniels-Midland 17,066 0.061,001 British American Tobacco Malaysia 7,314 0.02150 Bunge 7,438 0.0326,923 Golden Agri-Resources 5,510 0.0214,727 IOI 12,213 0.04938 Japan Tobacco 22,350 0.08161 KT&G 12,841 0.041,343 Philip Morris International 104,888 0.37
280,417 0.98
Airlines2,884 Air China 2,585 0.017,949 Cathay Pacific Airways 9,111 0.0312,164 Eva Airways 4,789 0.02369 Japan Airlines 10,674 0.041,258 Latam Airlines Group 12,926 0.041,298 Singapore Airlines 7,661 0.033,058 Turk Hava Yollari 9,355 0.03
Portfolio of Investments as at 31 December 2017 cont/d
Equities - 99.17%(31 December 2016 - 99.22%) cont/d
Number ofShares Security
ValueGBP
% ofFund
Auto Components cont/d1,155 NHK Spring 9,398 0.03335 Nokian Renkaat 11,241 0.04150 Valeo 8,291 0.036,910 Weichai Power 5,593 0.02
239,728 0.84
Automobiles215 Bayerische Motoren Werke 16,571 0.063,140 Brilliance China Automotive Holdings 6,206 0.02858 Daimler 53,923 0.194,085 Dongfeng Motor Group 3,654 0.01402 Fiat Chrysler Automobiles 5,321 0.023,335 Ford Motor 30,792 0.115,323 Geely Automobile Holdings 13,641 0.05878 General Motors 26,605 0.097,294 Guangzhou Automobile Group 12,774 0.041,598 Honda Motor 40,499 0.14152 Hyundai Motor 16,374 0.06385 Kia Motors 8,906 0.031,343 Mahindra & Mahindra 23,132 0.08708 Mitsubishi Motors 3,782 0.012,315 Nissan Motor 17,068 0.06353 PACCAR 18,548 0.06822 Peugeot 12,372 0.04153 Renault 11,396 0.04597 Subaru 14,037 0.05478 Suzuki Motor 20,495 0.07880 Tata Motors 21,513 0.08121 Tesla 27,849 0.102,297 Toyota Motor 108,725 0.38958 Volvo 13,208 0.05
527,391 1.84
Banks31,822 Agricultural Bank of China 10,954 0.04741 AIB Group 3,618 0.011,716 Alpha Bank 2,722 0.012,502 Australia & New Zealand Banking Group 41,576 0.15735 Axis Bank 23,744 0.085,615 Banco Bilbao Vizcaya Argentaria 35,448 0.121,763 Banco BPM 4,100 0.017,134 Banco de Sabadell 10,487 0.041,510 Banco do Brasil 10,708 0.0414,480 Banco Santander 70,424 0.25367 Bancolombia 10,760 0.0411,163 Bank Central Asia 13,320 0.0514,280 Bank Mandiri Persero 6,224 0.028,782 Bank of America 191,643 0.6772,668 Bank of China 26,388 0.0916,966 Bank of Communications 9,305 0.032,741 Bank of East Asia 8,774 0.031,869 Bank of Ireland Group 11,771 0.04224 Bank of Kyoto 8,629 0.03618 Bank of Montreal 36,677 0.131,005 Bank of New York Mellon 40,014 0.141,070 Bank of Nova Scotia 51,211 0.187,748 Bank of the Philippine Islands 12,403 0.04371 Bank Pekao 10,221 0.041,537 Bankinter 10,784 0.0417 Banque Cantonale Vaudoise 9,478 0.03
CONCEPT FUND SOLUTIONS PLC
232
db x-trackers FTSE All-World ex UK UCITS ETF (DR)
Portfolio of Investments as at 31 December 2017 cont/d
Equities - 99.17%(31 December 2016 - 99.22%) cont/d
Number ofShares Security
ValueGBP
% ofFund
Banks cont/d659 BB&T 24,221 0.081,558 Bendigo & Adelaide Bank 10,513 0.04897 BNP Paribas 49,566 0.173,755 BOC Hong Kong Holdings 14,061 0.054,183 CaixaBank 14,440 0.05399 Canadian Imperial Bank of Commerce 28,847 0.10441 Capital One Financial 32,463 0.1182,730 China Construction Bank 56,328 0.204,919 China Merchants Bank 14,467 0.056,038 CIMB Group Holdings 7,213 0.03387 CIT Group 14,084 0.0512,451 CITIC 13,281 0.052,549 Citigroup 140,212 0.49392 Citizens Financial Group 12,165 0.041,017 Commerzbank 11,289 0.041,478 Commonwealth Bank of Australia 68,656 0.2489 Credicorp 13,685 0.051,003 Credit Agricole 12,287 0.041,514 Credit Suisse Group 19,984 0.07328 Danske Bank 9,448 0.031,983 DBS Group Holdings 27,258 0.101,830 Deutsche Bank 25,788 0.091,106 DNB 15,204 0.057,273 Dubai Islamic Bank 9,061 0.03460 Erste Group Bank 14,743 0.05856 Fifth Third Bancorp 19,199 0.071,286 FinecoBank Banca Fineco 9,743 0.033,827 First Abu Dhabi Bank 7,895 0.03246 First Republic Bank 15,756 0.053,419 FirstRand 13,729 0.05355 Goldman Sachs Group 66,856 0.231,345 Grupo Financiero Banorte 5,480 0.027,307 Grupo Financiero Inbursa 8,868 0.031,103 Hang Seng Bank 20,235 0.073,710 Hong Leong Bank 11,521 0.04609 Huntington Bancshares 6,555 0.022,822 ICICI Bank 20,298 0.0766,169 Industrial & Commercial Bank of China 39,358 0.143,243 ING Groep 44,116 0.1511,463 Intesa Sanpaolo 28,186 0.103,066 JPMorgan Chase & Co 242,379 0.85228 Jyske Bank 9,601 0.031,795 Kasikornbank 9,731 0.0396 KBC Group 6,060 0.02699 KeyCorp 10,422 0.04235 Komercni Banka As 7,477 0.03131 M&T Bank 16,559 0.06341 Macquarie Group 19,643 0.0711,971 Mitsubishi UFJ Financial Group 64,919 0.23533 Mizrahi Tefahot Bank 7,281 0.0321,334 Mizuho Financial Group 28,644 0.101,226 Morgan Stanley 47,554 0.172,313 National Australia Bank 39,546 0.1474 National Bank of Canada 2,738 0.01754 Nedbank Group 11,530 0.042,696 Nordea Bank 24,171 0.08264 Northern Trust 19,494 0.074,051 Oversea-Chinese Banking 27,764 0.10444 PNC Financial Services Group 47,359 0.174,813 Public Bank 18,269 0.061,454 Regions Financial 18,573 0.06
CONCEPT FUND SOLUTIONS PLC
233
db x-trackers FTSE All-World ex UK UCITS ETF (DR)
Portfolio of Investments as at 31 December 2017 cont/d
Equities - 99.17%(31 December 2016 - 99.22%) cont/d
Number ofShares Security
ValueGBP
% ofFund
Banks cont/d4,554 Resona Holdings 20,115 0.071,389 Royal Bank of Canada 84,122 0.292,419 Sberbank of Russia 30,274 0.112,229 Shiga Bank 8,440 0.032,009 Siam Commercial Bank 6,836 0.021,347 Skandinaviska Enskilda Banken 11,712 0.04621 Societe Generale 23,731 0.081,042 Standard Bank Group 12,174 0.04572 State Bank of India 20,592 0.07397 State Street 28,646 0.101,177 Sumitomo Mitsui Financial Group 37,599 0.13387 Sumitomo Mitsui Trust Holdings 11,360 0.04506 SunTrust Banks 24,160 0.081,346 Svenska Handelsbanken 13,635 0.05969 Swedbank 17,314 0.061,605 Toronto-Dominion Bank 69,742 0.243,062 UBS Group 41,670 0.151,869 UniCredit 25,848 0.092,325 Unione di Banche Italiane 7,525 0.031,791 United Overseas Bank 26,204 0.091,470 US Bancorp 58,224 0.208,004 VTB Bank 10,828 0.044,114 Wells Fargo & Co 184,510 0.642,857 Westpac Banking 51,787 0.18
Construction and Engineering122 Aena 18,302 0.0647 Aeroports de Paris 6,613 0.027,490 Airports of Thailand 11,553 0.04263 Bouygues 10,111 0.048,499 China Communications Construction 7,137 0.036,931 China Railway Construction 5,938 0.02
CONCEPT FUND SOLUTIONS PLC
237
db x-trackers FTSE All-World ex UK UCITS ETF (DR)
Portfolio of Investments as at 31 December 2017 cont/d
Equities - 99.17%(31 December 2016 - 99.22%) cont/d
Number ofShares Security
ValueGBP
% ofFund
Construction and Engineering cont/d10,449 China Railway Group 5,711 0.029,543 China State Construction International Holdings 9,872 0.032,039 CK Infrastructure Holdings 12,948 0.05588 COMSYS Holdings 12,598 0.04655 Daiwa House Industry 18,599 0.06393 DR Horton 14,837 0.05652 Ferrovial 10,953 0.041,319 Grupo Aeroportuario del Pacifico 10,071 0.04853 Grupo Aeroportuario del Sureste 11,540 0.0486 Hochtief 11,268 0.0453 Hyundai Heavy Industries 3,678 0.0130,006 Jasa Marga Persero 10,463 0.042,103 Kajima 14,960 0.051,532 Larsen & Toubro 21,914 0.08384 LendLease Group 3,630 0.01339 Lennar 15,848 0.06611 Maeda Road Construction 10,365 0.041,619 Obayashi 14,491 0.05961 Sekisui House 12,836 0.04362 SNC-Lavalin Group 12,185 0.04445 Taisei 16,382 0.06261 Toll Brothers 9,265 0.03425 Vinci 32,124 0.11
356,192 1.24
Containers and Packaging597 Amcor 5,323 0.02510 Ball 14,270 0.053,376 Lee & Man Paper Manufacturing 2,950 0.0174 Packaging of America 6,594 0.02260 Sealed Air 9,476 0.03218 WestRock 10,186 0.04
48,799 0.17
Distribution and Wholesale7,816 Berli Jucker 11,701 0.04261 Fastenal 10,552 0.041,414 ITOCHU 19,514 0.0715,583 Li & Fung 6,322 0.02517 LKQ 15,543 0.051,220 Mitsubishi 24,922 0.091,710 Mitsui & Co 20,558 0.07535 Sumitomo 6,723 0.0261 WW Grainger 10,653 0.04
126,488 0.44
Diversified Financials62 Alliance Data Systems 11,618 0.04770 American Express 56,528 0.20192 Ameriprise Financial 24,053 0.08363 ASX 11,514 0.042,993 B3 - Brasil Bolsa Balcao 15,194 0.05110 BlackRock 41,773 0.15808 Brookfield Asset Management 26,086 0.091,005 Charles Schwab 38,164 0.134,600 China Everbright 7,604 0.03636 CI Financial 11,171 0.043,796 CITIC Securities 5,787 0.02292 CME Group 31,526 0.1116,331 CTBC Financial Holding 8,316 0.03
CONCEPT FUND SOLUTIONS PLC
238
db x-trackers FTSE All-World ex UK UCITS ETF (DR)
Portfolio of Investments as at 31 December 2017 cont/d
Equities - 99.17%(31 December 2016 - 99.22%) cont/d
Number ofShares Security
ValueGBP
% ofFund
Diversified Financials cont/d228 Deutsche Boerse 19,591 0.07449 Discover Financial Services 25,531 0.09115 EXOR 5,216 0.0228,131 First Financial Holding 13,662 0.05369 FNF 10,704 0.04423 Franklin Resources 13,549 0.057,913 Fubon Financial Holding 9,966 0.03146 Groupe Bruxelles Lambert 11,663 0.046,805 Haitong Securities 7,297 0.02664 Hong Kong Exchanges & Clearing 15,057 0.0528,480 Hua Nan Financial Holdings 11,850 0.04518 Intercontinental Exchange 27,019 0.09529 Invesco 14,289 0.051,430 Investec 7,661 0.03663 Investor 22,394 0.08993 Japan Exchange Group 12,778 0.04298 Julius Baer Group 13,473 0.05397 KB Financial Group 17,380 0.06481 Kinnevik 12,043 0.04853 Mastercard 95,443 0.339,862 Mega Financial Holding 5,892 0.023,406 Nomura Holdings 14,866 0.051,277 ORIX 15,960 0.0634 Partners Group Holding 17,229 0.06550 Shinhan Financial Group 18,865 0.07597 Synchrony Financial 17,040 0.06318 T Rowe Price Group 24,667 0.0910,390 Taiwan Cooperative Financial Holding 4,284 0.01356 TD Ameritrade Holding 13,456 0.051,644 Visa 138,569 0.481,574 Wharf Real Estate Investment 7,740 0.03
934,468 3.26
Diversified Telecommunications1,517 Advanced Info Service 6,572 0.0218,164 America Movil 11,632 0.0432 Arista Networks 5,573 0.025,260 AT&T 151,180 0.532 BCE 71 0.00957 CenturyLink 11,800 0.044,649 China Mobile 34,841 0.1226,409 China Telecom 9,290 0.034,266 Cisco Systems 120,782 0.422,805 Deutsche Telekom 36,838 0.13420 Elisa 12,199 0.042,068 Emirates Telecommunications Group 7,284 0.031,025 Hellenic Telecommunications Organization 10,463 0.041,000 HTC 1,816 0.01520 Juniper Networks 10,955 0.041,308 KDDI 24,072 0.081,136 Koninklijke KPN 2,932 0.011,054 LG Uplus 10,189 0.04450 Mobile TeleSystems 3,390 0.0180 Motorola Solutions 5,343 0.021,424 MTN Group 11,615 0.04161 Nice 10,782 0.04663 Nippon Telegraph & Telephone 23,063 0.08871 Nisshinbo Holdings 8,728 0.034,906 Nokia 16,958 0.061,183 NTT DOCOMO 20,658 0.07
CONCEPT FUND SOLUTIONS PLC
239
db x-trackers FTSE All-World ex UK UCITS ETF (DR)
Portfolio of Investments as at 31 December 2017 cont/d
Equities - 99.17%(31 December 2016 - 99.22%) cont/d
Electric Utilities893 AGL Energy 12,578 0.04271 Alliant Energy 8,536 0.0349 Ameren 2,137 0.01492 American Electric Power 26,758 0.09354 CenterPoint Energy 7,421 0.031,110 Centrais Eletricas Brasileiras 4,784 0.021,314 Chubu Electric Power 12,076 0.04429 CLP Holdings 3,243 0.01437 CMS Energy 15,280 0.05346 Consolidated Edison 21,728 0.08552 Dominion Energy 33,077 0.1295 DTE Energy 7,687 0.03615 Duke Energy 38,239 0.131,773 E.ON 14,261 0.05363 Edison International 16,970 0.061,152 Electricite de France 10,655 0.04408 Endesa 6,467 0.026,395 Enel 29,121 0.10684 Enel Americas 5,648 0.02628 Enel Generacion Chile 12,493 0.041,148 Engie 14,608 0.0583 Entergy 4,994 0.02390 Eversource Energy 18,215 0.06801 Exelon 23,336 0.0814 FirstEnergy 317 0.00285 Fortis 7,753 0.03521 Fortum 7,631 0.031,241 Hokkaido Electric Power 6,043 0.02
CONCEPT FUND SOLUTIONS PLC
240
db x-trackers FTSE All-World ex UK UCITS ETF (DR)
Portfolio of Investments as at 31 December 2017 cont/d
Equities - 99.17%(31 December 2016 - 99.22%) cont/d
Number ofShares Security
ValueGBP
% ofFund
Electric Utilities cont/d5,613 Iberdrola 32,187 0.111,927 Infraestructura Energetica Nova 7,022 0.02175 Innogy 5,076 0.021,394 Kansai Electric Power 12,624 0.041,000 Kyushu Electric Power 7,750 0.032,361 Manila Electric 11,489 0.04422 NextEra Energy 48,725 0.17684 NRG Energy 14,400 0.052,859 Origin Energy 15,572 0.05472 PG&E 15,642 0.06639 Power Assets Holdings 3,985 0.01718 PPL 16,427 0.06513 Public Service Enterprise Group 19,530 0.07715 RWE 10,790 0.04140 SCANA 4,117 0.01859 Southern 30,537 0.111,425 Tenaga Nasional 3,972 0.012,993 Terna Rete Elettrica Nazionale 12,870 0.051,164 Tohoku Electric Power 11,007 0.042,301 Tokyo Electric Power Holdings 6,734 0.02248 Uniper 5,724 0.02191 WEC Energy Group 9,379 0.03621 Xcel Energy 22,086 0.08
Energy Equipment and Services29,770 Beijing Jingneng Clean Energy 5,912 0.025,850 Energy Absolute 6,967 0.0323,611 GCL-Poly Energy Holdings 3,126 0.01166 Vestas Wind Systems 8,486 0.03
Gas Utilities310 Canadian Utilities 6,842 0.023,657 China Gas Holdings 7,470 0.033,087 China Resources Gas Group 8,276 0.03150 Enagas 3,178 0.012,388 ENN Energy Holdings 12,589 0.04598 GAIL India 21,020 0.07701 Gas Natural 11,979 0.049,905 Hong Kong & China Gas 14,350 0.05417 Italgas 1,884 0.01281 Korea Gas 8,256 0.03483 NiSource 9,165 0.03264 Sempra Energy 20,866 0.074,545 Snam 16,461 0.06304 Tokyo Gas 5,144 0.02
Real Estate696 Aeon Mall 10,066 0.0410,763 Aldar Properties 4,766 0.0212,461 Ayala Land 8,230 0.0315,988 Cathay Real Estate Development 6,533 0.02436 CBRE Group 13,959 0.051,426 China Evergrande Group 3,634 0.012,967 China Overseas Land & Investment 7,056 0.024,140 China Resources Land 9,004 0.03803 China Vanke 2,369 0.011,953 CK Asset Holdings 12,614 0.044,162 Country Garden Holdings 5,864 0.02121 Daito Trust Construction 18,243 0.06523 Deutsche Wohnen 16,927 0.064,133 Emaar Properties 5,773 0.0212,765 Emlak Konut Gayrimenkul Yatirim Ortakligi 6,993 0.021,024 Gazit-Globe 8,050 0.035,641 Hang Lung Properties 10,189 0.041,458 Henderson Land Development 7,101 0.032,288 Hongkong Land Holdings 11,907 0.042,553 Hysan Development 10,007 0.041,491 Mitsubishi Estate 19,177 0.071,115 Mitsui Fudosan 18,475 0.065,042 New World Development 5,598 0.02601 Nomura Real Estate Holdings 9,962 0.0313,715 Poly Property Group 5,279 0.02156 PSP Swiss Property 10,929 0.042,749 Shanghai Industrial Holdings 5,823 0.02554 Sumitomo Realty & Development 13,462 0.051,094 Sun Hung Kai Properties 13,490 0.05931 Tokyo Tatemono 9,299 0.03402 Vonovia 14,770 0.051,323 Wheelock & Co 6,981 0.02
312,530 1.09
Real Estate Investment Trust675 AGNC Investment 10,074 0.04407 American Tower 42,925 0.151,364 Annaly Capital Management 11,989 0.04152 AvalonBay Communities 20,047 0.07199 Boston Properties 19,128 0.0711,796 CapitaLand Commercial Trust 12,593 0.045,053 Concentradora Fibra Danhos 5,844 0.02354 Crown Castle International 29,050 0.1098 Digital Realty Trust 8,252 0.03496 Duke Realty 9,977 0.0459 Equinix 19,767 0.07380 Equity Residential 17,914 0.0681 Essex Property Trust 14,453 0.0530 Gecina 4,098 0.01266 GGP 4,599 0.023,309 Goodman Group 16,109 0.06
CONCEPT FUND SOLUTIONS PLC
251
db x-trackers FTSE All-World ex UK UCITS ETF (DR)
Portfolio of Investments as at 31 December 2017 cont/d
Equities - 99.17%(31 December 2016 - 99.22%) cont/d
Number ofShares Security
ValueGBP
% ofFund
Real Estate Investment Trust cont/d8,317 Growthpoint Properties 13,737 0.05472 HCP 9,100 0.03302 Hospitality Properties Trust 6,664 0.02871 Host Hotels & Resorts 12,781 0.05384 Iron Mountain 10,710 0.0414,132 Kiwi Property Group 10,439 0.04297 Klepierre 9,666 0.031,135 Link REIT 7,776 0.03162 Park Hotels & Resorts 3,443 0.01588 Prologis 28,041 0.10149 Public Storage 23,021 0.08119 Realty Income 5,016 0.02957 Resilient REIT 8,638 0.03741 RioCan Real Estate Investment Trust 10,650 0.04119 SBA Communications 14,371 0.056,184 Scentre Group 14,982 0.05292 Simon Property Group 37,071 0.13347 UDR 9,881 0.0392 Unibail-Rodamco 17,150 0.06346 Ventas 15,349 0.051,479 VEREIT 8,517 0.036,302 Vicinity Centres 9,911 0.03237 Vornado Realty Trust 13,697 0.05357 Welltower 16,829 0.062,265 Westfield 12,428 0.04600 Weyerhaeuser 15,639 0.05
592,326 2.07
Retail46 Advance Auto Parts 3,390 0.01377 Alimentation Couche-Tard 14,589 0.05790 ANTA Sports Products 2,648 0.01338 Aoyama Trading 9,338 0.0332 AutoZone 16,828 0.06270 Best Buy 13,666 0.05212 CarMax 10,050 0.0427 Chipotle Mexican Grill 5,769 0.02435 Cie Financiere Richemont 29,137 0.10390 Costco Wholesale 53,659 0.191,500 CP ALL 2,620 0.01946 CVS Health 50,700 0.18252 Darden Restaurants 17,887 0.06246 Dollar General 16,914 0.06211 Dollar Tree 16,738 0.06225 Don Quijote Holdings 8,697 0.0335 Dufry 3,847 0.0150 Fast Retailing 14,735 0.05779 Foschini Group 9,179 0.03183 Gap 4,608 0.02174 Genuine Parts 12,221 0.0426,354 GOME Retail Holdings 2,343 0.01834 Hennes & Mauritz 12,748 0.041,100 Home Depot 154,118 0.5419,567 Home Product Center 5,681 0.0281 Hugo Boss 5,101 0.02919 Industria de Diseno Textil 23,694 0.08943 Isetan Mitsukoshi Holdings 8,645 0.033,036 Jollibee Foods 11,374 0.0455 Kering 19,187 0.07217 Kohl's 8,699 0.03
CONCEPT FUND SOLUTIONS PLC
252
db x-trackers FTSE All-World ex UK UCITS ETF (DR)
Portfolio of Investments as at 31 December 2017 cont/d
Equities - 99.17%(31 December 2016 - 99.22%) cont/d
Number ofShares Security
ValueGBP
% ofFund
Retail cont/d287 L Brands 12,776 0.055,707 Li Ning 3,416 0.011,795 Lojas Renner 14,197 0.05799 Lowe's 54,895 0.19174 Lululemon Athletica 10,109 0.04375 Macquarie Infrastructure 6,983 0.02751 McDonald's 95,555 0.3310,869 Minor International 10,786 0.0490 Nitori Holdings 9,488 0.0364 Nordstrom 2,242 0.0194 O'Reilly Automotive 16,715 0.06101 Pandora 8,134 0.03150 PVH 15,215 0.05254 Raia Drogasil 5,196 0.02336 Restaurant Brands International 15,318 0.05406 Ross Stores 24,085 0.0862 Ryohin Keikaku 14,281 0.05137 Samsung C&T 11,920 0.04110 Signet Jewelers 4,598 0.021,255 Starbucks 53,280 0.192,661 Steinhoff International Holdings 739 0.0012,852 Sun Art Retail Group 10,039 0.04211 Swatch Group 11,924 0.04356 Tapestry 11,640 0.04566 Target 27,301 0.10127 Tiffany & Co 9,759 0.03615 TJX 34,761 0.12192 Tractor Supply 10,610 0.0488 Tsuruha Holdings 8,847 0.0355 Ulta Salon Cosmetics & Fragrance 9,094 0.03820 Walgreens Boots Alliance 44,020 0.156,054 Wal-Mart de Mexico 11,023 0.041,370 Wal-Mart Stores 100,009 0.352,093 Woolworths Holdings 8,162 0.03389 Yum China Holdings 11,508 0.04389 Yum! Brands 23,468 0.08179 Zalando 7,010 0.02
Net unrealised gain on open futures contracts 425 0.00Total Exchange Traded Financial Derivative Instruments 425 0.00
Total Financial Derivative Instruments 425 0.00
ValueGBP
% ofFund
Total Financial Assets at Fair Value through Profit or Loss 28,603,484 99.78Other Net Assets - 0.22%(31 December 2016 - 0.21%) 63,120 0.22
Net Assets Attributable to Redeeming Participating Shareholders 28,666,604 100.00
* The broker for the open futures contracts is Deutsche Bank AG Frankfurt.
CONCEPT FUND SOLUTIONS PLC
256
db x-trackers FTSE All-World ex UK UCITS ETF (DR)
Portfolio of Investments as at 31 December 2017 cont/d
Analysis of Total Assets % of Total Assets31/12/2017
Transferable securities admitted to an official stock exchange listing 99.69Current Assets 0.31Total Assets 100.00
CONCEPT FUND SOLUTIONS PLC
257
db x-trackers S&P 500 UCITS ETF (DR)
Investment Manager’s Report for the financial year ended 31 December 2017
Investment Objective
The investment objective of the Fund is to track the performance before fees and expenses of the UnderlyingAsset, which is the S&P 500 Index (the “Reference Index”). The Reference Index is designed to reflect theperformance of shares of 500 companies representing all major US industries.
The Reference Index is calculated and maintained by Standard & Poor’s Financial Services LLC ("S&P"). TheReference Index is a free float market capitalisation weighted index reflecting the performance of 500large-cap common stocks of publicly held companies actively traded on either the NYSE Euronext or theNASDAQ OMX markets. A company's relative weighting in the Reference Index depends on its relative sizebased on the combined value of a company’s readily available shares as compared to other companies onthese stock markets.
The Reference Index is calculated in US Dollars on a real-time basis.
The Reference Index is a free float market capitalisation weighted index reflecting the performance of 500large-cap common stocks of publicly held companies actively traded on either the NYSE Euronext or theNASDAQ OMX markets.
Fund Performance
The Fund’s performance amounts are calculated net of fees and taxes.
The Fund performed in line with its benchmark and within guided tolerance levels.
The Fund has tracked the Reference Index within its anticipated tracking error. The anticipated tracking errorfor all share classes of the Fund is 1.00%.
Total Net Assets Net Assets per Share31/12/2017 Price (at 31/12/2017)
db x-trackers S&P 500 UCITS ETF (DR) €545,968,987 €41.23(Class 1C)
Year to Date Year to DateFund Return Index Return
db x-trackers S&P 500 UCITS ETF (DR) 18.78% 18.66%(Class 1C)
Year to Date Year to DateTracking Error Tracking Difference1
db x-trackers S&P 500 UCITS ETF (DR) 0.17% 0.12%(Class 1C)
Total Net Assets Net Assets per Share31/12/2017 Price (at 31/12/2017)
db x-trackers S&P 500 UCITS ETF (DR) £542,193,691 £45.07(Class 2C)
Year to Date Year to DateFund Return Index Return
db x-trackers S&P 500 UCITS ETF (DR) 19.68% 19.57%(Class 2C)
CONCEPT FUND SOLUTIONS PLC
258
db x-trackers S&P 500 UCITS ETF (DR)
Investment Manager’s Report for the financial year ended 31 December 2017 cont/d
Fund Performance cont/d
Year to Date Year to DateTracking Error Tracking Difference1
db x-trackers S&P 500 UCITS ETF (DR) 0.12% 0.12%(Class 2C)
Total Net Assets Net Assets per Share31/12/2017 Price (at 31/12/2017)
db x-trackers S&P 500 UCITS ETF (DR) CHF10,767,711 CHF28.76(Class 3C)
Year to Date Year to DateFund Return Index Return
db x-trackers S&P 500 UCITS ETF (DR) 18.42% 18.25%(Class 3C)
Year to Date Year to DateTracking Error Tracking Difference1
db x-trackers S&P 500 UCITS ETF (DR) 0.21% 0.18%(Class 3C)
1The performance difference of the share class arose from various reasons such as inaccuracies in the index replication via optimization,various fee components like management fee, fixed fee and transaction costs, specific taxes respectively tax advantages. The realisedtracking error level is contrasted with the anticipated tracking error level; the level of realised tracking error was within the expected range,due to the effectiveness of replication techniques utilised over the 2017 period.
CONCEPT FUND SOLUTIONS PLC
259
db x-trackers S&P 500 UCITS ETF (DR)
Portfolio of Investments as at 31 December 2017
Transferable Securities
Equities - 99.51%(31 December 2016 - 100.55%)
Number ofShares Security
ValueUSD
% ofFund
Aerospace and Defense25,695 Arconic 700,189 0.0534,212 Boeing 10,089,461 0.7216,962 General Dynamics 3,450,919 0.257,289 Harris 1,032,487 0.074,757 L3 Technologies 941,172 0.0715,257 Lockheed Martin 4,898,260 0.3510,638 Northrop Grumman 3,264,908 0.2317,666 Raytheon 3,318,558 0.249,948 Rockwell Collins 1,349,148 0.092,937 TransDigm Group 806,559 0.0645,384 United Technologies 5,789,637 0.41
35,641,298 2.54
Agriculture116,608 Altria Group 8,326,977 0.5934,262 Archer-Daniels-Midland 1,373,221 0.1094,912 Philip Morris International 10,027,453 0.72
19,727,651 1.41
Airlines7,508 Alaska Air Group 551,913 0.0426,025 American Airlines Group 1,354,081 0.1040,084 Delta Air Lines 2,244,704 0.1633,361 Southwest Airlines 2,183,477 0.1615,388 United Continental Holdings 1,037,151 0.07
Automobiles238,198 Ford Motor 2,975,093 0.2178,120 General Motors 3,202,139 0.2321,486 PACCAR 1,527,225 0.11
7,704,457 0.55
Banks592,792 Bank of America 17,499,220 1.2562,578 Bank of New York Mellon 3,370,451 0.2448,211 BB&T 2,397,051 0.1729,623 Capital One Financial 2,949,858 0.21161,574 Citigroup 12,022,721 0.8630,065 Citizens Financial Group 1,262,129 0.0910,628 Comerica 922,617 0.0743,117 Fifth Third Bancorp 1,308,170 0.0921,437 Goldman Sachs Group 5,461,290 0.3966,377 Huntington Bancshares 966,449 0.07212,034 JPMorgan Chase & Co 22,674,916 1.6265,717 KeyCorp 1,325,512 0.109,198 M&T Bank 1,572,766 0.1185,069 Morgan Stanley 4,463,570 0.3213,087 Northern Trust 1,307,260 0.0920,930 People's United Financial 391,391 0.0329,076 PNC Financial Services Group 4,195,376 0.3070,885 Regions Financial 1,224,893 0.09
CONCEPT FUND SOLUTIONS PLC
260
db x-trackers S&P 500 UCITS ETF (DR)
Portfolio of Investments as at 31 December 2017 cont/d
Equities - 99.51%(31 December 2016 - 100.55%) cont/d
Number ofShares Security
ValueUSD
% ofFund
Banks cont/d22,661 State Street 2,211,940 0.1629,090 SunTrust Banks 1,878,923 0.1396,340 US Bancorp 5,161,897 0.37270,828 Wells Fargo & Co 16,431,135 1.1712,296 Zions Bancorporation 625,006 0.04
Electric Utilities40,141 AES 434,727 0.0314,076 Alliant Energy 599,778 0.0414,769 Ameren 871,223 0.0630,056 American Electric Power 2,211,220 0.1626,251 CenterPoint Energy 744,478 0.0517,223 CMS Energy 814,648 0.0618,949 Consolidated Edison 1,609,718 0.1139,327 Dominion Energy 3,187,847 0.2310,963 DTE Energy 1,200,010 0.0942,769 Duke Energy 3,597,301 0.2619,845 Edison International 1,254,998 0.0911,016 Entergy 896,592 0.0619,301 Eversource Energy 1,219,437 0.0958,671 Exelon 2,312,224 0.1727,056 FirstEnergy 828,455 0.0628,746 NextEra Energy 4,489,838 0.3218,277 NRG Energy 520,529 0.0431,339 PG&E 1,404,927 0.106,786 Pinnacle West Capital 578,031 0.0441,748 PPL 1,292,101 0.0930,924 Public Service Enterprise Group 1,592,586 0.118,690 SCANA 345,688 0.02
CONCEPT FUND SOLUTIONS PLC
263
db x-trackers S&P 500 UCITS ETF (DR)
Portfolio of Investments as at 31 December 2017 cont/d
Equities - 99.51%(31 December 2016 - 100.55%) cont/d
Number ofShares Security
ValueUSD
% ofFund
Electric Utilities cont/d61,331 Southern 2,949,408 0.2119,226 WEC Energy Group 1,277,183 0.0931,030 Xcel Energy 1,492,853 0.11
Media22,173 CBS 1,308,207 0.0911,850 Charter Communications 3,981,126 0.28285,035 Comcast 11,415,652 0.829,412 Discovery Communications Class A Shares 210,640 0.0112,419 Discovery Communications Class C Shares 262,910 0.0213,870 DISH Network 662,292 0.0523,911 Interpublic Group 482,046 0.03
CONCEPT FUND SOLUTIONS PLC
266
db x-trackers S&P 500 UCITS ETF (DR)
Portfolio of Investments as at 31 December 2017 cont/d
Equities - 99.51%(31 December 2016 - 100.55%) cont/d
Number ofShares Security
ValueUSD
% ofFund
Media cont/d23,232 News Class A Shares 376,591 0.037,258 News Class B Shares 120,483 0.0114,057 Omnicom Group 1,023,771 0.075,840 Scripps Networks Interactive 498,619 0.0447,580 Time Warner 4,352,143 0.3164,409 Twenty-First Century Fox Class A Shares 2,224,043 0.1626,747 Twenty-First Century Fox Class B Shares 912,608 0.0621,441 Viacom 660,597 0.0592,295 Walt Disney 9,922,635 0.71
Portfolio of Investments as at 31 December 2017 cont/d
Equities - 99.51%(31 December 2016 - 100.55%) cont/d
Number ofShares Security
ValueUSD
% ofFund
Software cont/d19,239 CA 640,274 0.0517,255 Cadence Design Systems 721,604 0.0519,298 Cerner 1,300,492 0.098,765 Citrix Systems 771,320 0.0518,839 Electronic Arts 1,979,225 0.1420,403 Fidelity National Information Services 1,919,718 0.1412,735 Fiserv 1,669,941 0.1214,824 Intuit 2,338,931 0.17471,435 Microsoft 40,326,550 2.88186,179 Oracle 8,802,543 0.6319,492 Paychex 1,327,015 0.0910,807 Red Hat 1,297,921 0.0941,933 salesforce.com 4,286,811 0.319,158 Synopsys 780,628 0.06
79,202,811 5.66
Textiles and Apparel22,063 Hanesbrands 461,337 0.039,218 Michael Kors Holdings 580,273 0.043,855 Mohawk Industries 1,063,595 0.0880,295 NIKE 5,022,452 0.363,363 Ralph Lauren 348,709 0.0211,314 Under Armour Class A Shares 163,261 0.0111,086 Under Armour Class C Shares 147,666 0.0120,042 VF 1,483,108 0.11
9,270,401 0.66
Transportation8,541 CH Robinson Worldwide 760,918 0.0554,615 CSX 3,004,371 0.2210,859 Expeditors International of Washington 702,469 0.0515,076 FedEx 3,762,065 0.275,192 JB Hunt Transport Services 596,976 0.046,327 Kansas City Southern 665,727 0.0517,487 Norfolk Southern 2,533,866 0.1848,103 Union Pacific 6,450,612 0.4641,949 United Parcel Service 4,998,224 0.36
Total Financial Derivative Instruments 2,428,564 0.17
ValueUSD
% ofFund
Total Financial Assets at Fair Value through Profit or Loss 1,395,685,790 99.68Other Net Assets - 0.32%(31 December 2016 - 0.40%) 4,415,767 0.32
Net Assets Attributable to Redeeming Participating Shareholders 1,400,101,557 100.00
* The broker for the open futures contracts is Deutsche Bank AG Frankfurt.** The counterparties for the open forward foreign currency exchange contracts are Barclays Bank Plc and Merrill Lynch International Ltd.
Analysis of Total Assets % of Total Assets31/12/2017
Transferable securities admitted to an official stock exchange listing 99.34OTC Financial Derivative Instruments 0.26Current Assets 0.40Total Assets 100.00
CONCEPT FUND SOLUTIONS PLC
271
db x-trackers Russell 2000 UCITS ETF (DR)
Investment Manager’s Report for the financial year ended 31 December 2017
Investment Objective
The investment objective of the Fund is to track the performance before fees and expenses of the UnderlyingAsset, which is the Russell 2000® Index (the “Reference Index”). The Reference Index is designed to reflectthe performance of the shares of certain companies included on the Russell 3000® Index. The Russell 3000®
Index comprises the 3000 largest shares of US companies, based on the combined value of a company’sshares compared to other companies. The Reference Index consists of approximately 2000 of the smallestsecurities included in the Russell 3000® Index and thus represents approximately 10% of the total marketcapitalisation of that index.
The constituents of the Reference Index are selected on basis of a combination of their market capitalisationand current index membership. The Reference Index is float-adjusted and market capitalisation weighted.
Fund Performance
The Fund’s performance amounts are calculated net of fees and taxes.
The Fund performed in line with its benchmark and within guided tolerance levels.
The Fund has tracked the Reference Index within its anticipated tracking error. The anticipated tracking errorof the Fund is 1.00%.
Total Net Assets Net Assets per Share31/12/2017 Price (at 31/12/2017)
db x-trackers Russell 2000 UCITS ETF (DR) $622,782,445 $211.39
Year to Date Year to DateFund Return Index Return
db x-trackers Russell 2000 UCITS ETF (DR) 14.00% 14.21%
Year to Date Year to DateTracking Error Tracking Difference1
db x-trackers Russell 2000 UCITS ETF (DR) 0.06% (0.21)%
1The performance difference of the share class arose from various reasons such as inaccuracies in the index replication via optimization,various fee components like management fee, fixed fee and transaction costs, specific taxes respectively tax advantages. The realisedtracking error level is contrasted with the anticipated tracking error level; the level of realised tracking error was within the expected range,due to the effectiveness of replication techniques utilised over the 2017 period.
Auto Components29,197 American Axle & Manufacturing Holdings 497,225 0.087,413 Commercial Vehicle Group 79,245 0.0115,214 Cooper Tire & Rubber 537,815 0.095,092 Cooper-Standard Holdings 623,770 0.1043,006 Dana 1,376,622 0.227,966 Dorman Products 487,041 0.086,531 Douglas Dynamics 246,872 0.0410,833 Gentherm 343,948 0.057,307 Horizon Global 102,444 0.0224,768 Meritor 581,057 0.093,245 Miller Industries 83,721 0.0114,614 Modine Manufacturing 295,203 0.055,612 Motorcar Parts of America 140,244 0.0210,031 Spartan Motors 157,988 0.026,369 Standard Motor Products 286,032 0.057,249 Superior Industries International 107,648 0.0215,066 Tenneco 881,964 0.1414,621 Titan International 188,318 0.035,801 Tower International 177,220 0.03
7,194,377 1.15
Automobiles2,188 Blue Bird 43,541 0.0111,308 GATX 702,905 0.11
CONCEPT FUND SOLUTIONS PLC
273
db x-trackers Russell 2000 UCITS ETF (DR)
Portfolio of Investments as at 31 December 2017 cont/d
Equities - 99.66% (31 December 2016 - 99.60%) cont/d
Number ofShares Security
ValueUSD
% ofFund
Automobiles cont/d8,095 Greenbrier 431,464 0.0714,706 Navistar International 630,593 0.106,722 REV Group 218,667 0.0417,268 Wabash National 374,716 0.061,001 Willis Lease Finance 24,995 0.00
2,426,881 0.39
Banks4,765 1st Source 235,629 0.044,358 Access National 121,327 0.022,031 ACNB 60,016 0.013,365 Allegiance Bancshares 126,692 0.022,403 American National Bankshares 92,035 0.0110,737 Ameris Bancorp 517,523 0.082,491 Ames National 69,374 0.013,478 Arrow Financial 118,078 0.026,123 Atlantic Capital Bancshares 107,765 0.0212,806 Banc of California 264,444 0.044,967 BancFirst 254,062 0.048,934 Banco Latinoamericano de Comercio Exterior 240,325 0.0414,536 Bancorp 143,616 0.0225,166 BancorpSouth Bank 791,471 0.1312,452 Bank Mutual 132,614 0.024,566 Bank of Commerce Holdings 52,509 0.011,981 Bank of Marin Bancorp 134,708 0.0215,906 Bank of NT Butterfield & Son 577,229 0.094,183 BankFinancial 64,167 0.011,756 Bankwell Financial Group 60,301 0.019,743 Banner 537,034 0.094,417 Bar Harbor Bankshares 119,303 0.023,715 BCB Bancorp 53,868 0.016,090 Bear State Financial 62,301 0.0120,427 Beneficial Bancorp 336,024 0.0511,833 Berkshire Hills Bancorp 433,088 0.076,987 Blue Hills Bancorp 140,439 0.0217,733 BofI Holding 530,217 0.0824,654 Boston Private Financial Holdings 380,904 0.065,529 Bridge Bancorp 193,515 0.0322,201 Brookline Bancorp 348,556 0.065,533 Bryn Mawr Bank 244,559 0.042,444 BSB Bancorp 71,487 0.011,942 Byline Bancorp 44,608 0.01961 C&F Financial 55,738 0.015,816 Cadence BanCorp 157,730 0.024,508 Camden National 189,922 0.033,249 Capital City Bank Group 74,532 0.0137,991 Capitol Federal Financial 509,459 0.082,537 Capstar Financial Holdings 52,693 0.015,575 Carolina Financial 207,111 0.033,527 Cass Information Systems 205,307 0.0322,540 Cathay General Bancorp 950,512 0.15821 CBTX 24,351 0.0015,946 CenterState Bank 410,291 0.078,813 Central Pacific Financial 262,892 0.042,907 Central Valley Community Bancorp 58,663 0.01859 Century Bancorp 67,217 0.013,605 Charter Financial 63,232 0.0120,964 Chemical Financial 1,120,945 0.18945 Chemung Financial 45,455 0.013,462 Citizens & Northern 83,088 0.01
CONCEPT FUND SOLUTIONS PLC
274
db x-trackers Russell 2000 UCITS ETF (DR)
Portfolio of Investments as at 31 December 2017 cont/d
Equities - 99.66% (31 December 2016 - 99.60%) cont/d
Number ofShares Security
ValueUSD
% ofFund
Banks cont/d4,485 City Holding 302,603 0.052,924 Civista Bancshares 64,328 0.015,817 Clifton Bancorp 99,471 0.024,338 CNB Financial 113,829 0.0211,383 CoBiz Financial 227,546 0.042,507 Codorus Valley Bancorp 69,018 0.0121,333 Columbia Banking System 926,706 0.152,044 Commerce Union Bancshares 52,408 0.0114,519 Community Bank System 780,396 0.126,326 Community Bankers Trust 51,557 0.011,167 Community Financial 44,696 0.014,543 Community Trust Bancorp 213,975 0.038,930 ConnectOne Bancorp 229,947 0.041,364 County Bancorp 40,593 0.018,310 Customers Bancorp 215,977 0.0330,621 CVB Financial 721,431 0.129,295 Dime Community Bancshares 194,730 0.03906 DNB Financial 30,532 0.009,325 Eagle Bancorp 539,917 0.091,975 Entegra Financial 57,769 0.012,782 Enterprise Bancorp 94,727 0.016,544 Enterprise Financial Services 295,462 0.053,195 Equity Bancshares 113,135 0.022,607 ESSA Bancorp 40,852 0.011,362 Evans Bancorp 57,068 0.012,621 Farmers & Merchants Bancorp/Archbold 106,937 0.022,166 Farmers Capital Bank 83,391 0.017,550 Farmers National Banc 111,363 0.023,828 FB Financial 160,738 0.0310,705 FCB Financial Holdings 543,814 0.096,520 Fidelity Southern 142,136 0.024,249 Financial Institutions 132,144 0.022,997 First Bancorp (Maine) 81,608 0.018,315 First Bancorp (North Carolina) 293,603 0.0556,805 First Bancorp (Puerto Rico) 289,705 0.053,061 First Bancshares 104,686 0.0212,043 First Busey 360,567 0.062,423 First Business Financial Services 53,597 0.012,192 First Citizens BancShares 883,376 0.1428,613 First Commonwealth Financial 409,738 0.074,867 First Community Bancshares 139,829 0.024,143 First Connecticut Bancorp 108,339 0.022,911 First Defiance Financial 151,285 0.023,103 First Financial 140,721 0.0218,220 First Financial Bancorp 480,097 0.0818,757 First Financial Bankshares 845,003 0.142,434 First Financial Northwest 37,751 0.018,774 First Foundation 162,670 0.031,329 First Guaranty Bancshares 33,225 0.012,347 First Internet Bancorp 89,538 0.017,699 First Interstate BancSystem 308,345 0.0512,116 First Merchants 509,599 0.082,960 First Mid-Illinois Bancshares 114,078 0.0230,197 First Midwest Bancorp 725,030 0.122,958 First Northwest Bancorp 48,215 0.017,037 First of Long Island 200,554 0.036,281 Flagstar Bancorp 235,035 0.048,211 Flushing Financial 225,802 0.041,562 FNB Bancorp 56,997 0.013,463 Franklin Financial Network 118,088 0.0250,714 Fulton Financial 907,781 0.15
CONCEPT FUND SOLUTIONS PLC
275
db x-trackers Russell 2000 UCITS ETF (DR)
Portfolio of Investments as at 31 December 2017 cont/d
Equities - 99.66% (31 December 2016 - 99.60%) cont/d
Number ofShares Security
ValueUSD
% ofFund
Banks cont/d6,238 German American Bancorp 220,389 0.0423,147 Glacier Bancorp 911,760 0.153,187 Great Southern Bancorp 164,609 0.0317,511 Great Western Bancorp 696,938 0.116,258 Green Bancorp 127,037 0.02867 Greene County Bancorp 28,264 0.007,130 Guaranty Bancorp 197,145 0.03602 Guaranty Bancshares 18,451 0.0024,930 Hancock Holding 1,234,035 0.209,291 Hanmi Financial 281,982 0.043,887 HarborOne Bancorp 74,475 0.017,251 Heartland Financial 389,016 0.0610,675 Heritage Commerce 163,541 0.038,702 Heritage Financial 268,022 0.0421,678 Hilltop Holdings 549,104 0.09385 Hingham Institution for Savings 79,695 0.011,728 Home Bancorp 74,684 0.0146,582 Home BancShares 1,083,031 0.177,982 HomeStreet 231,079 0.044,899 HomeTrust Bancshares 126,149 0.0238,371 Hope Bancorp 700,271 0.116,800 Horizon Bancorp 189,040 0.032,603 Howard Bancorp 57,266 0.0114,957 IBERIABANK 1,159,167 0.198,000 Independent Bank (Massachusetts) 558,800 0.095,984 Independent Bank (Michigan) 133,742 0.025,206 Independent Bank Group 351,926 0.0616,194 International Bancshares 642,902 0.102,413 Investar Holding 58,153 0.0176,683 Investors Bancorp 1,064,360 0.1723,550 Kearny Financial 340,297 0.0513,269 Lakeland Bancorp 255,428 0.047,143 Lakeland Financial 346,364 0.062,606 LCNB 53,293 0.0113,975 LegacyTexas Financial Group 589,885 0.096,864 Live Oak Bancshares 163,706 0.037,662 Macatawa Bank 76,620 0.017,280 MainSource Financial Group 264,337 0.041,901 Malvern Bancorp 49,806 0.0123,962 MB Financial 1,066,788 0.175,231 MBT Financial 55,449 0.014,733 Mercantile Bank 167,406 0.032,139 Merchants Bancorp 42,096 0.0114,159 Meridian Bancorp 291,675 0.052,639 Meta Financial Group 244,503 0.041,061 Metropolitan Bank Holding 44,668 0.01773 Middlefield Banc 37,259 0.014,567 Midland States Bancorp 148,336 0.024,273 MidSouth Bancorp 56,617 0.013,293 MidWestOne Financial Group 110,414 0.021,806 MutualFirst Financial 69,621 0.017,357 National Bank Holdings 238,588 0.041,982 National Bankshares 90,082 0.013,535 National Commerce 142,284 0.0212,619 NBT Bancorp 464,379 0.072,597 Nicolet Bankshares 142,160 0.022,139 Northeast Bancorp 49,518 0.0112,727 Northfield Bancorp 217,377 0.031,993 Northrim BanCorp 67,463 0.0127,991 Northwest Bancshares 468,289 0.071,687 Norwood Financial 55,671 0.01
CONCEPT FUND SOLUTIONS PLC
276
db x-trackers Russell 2000 UCITS ETF (DR)
Portfolio of Investments as at 31 December 2017 cont/d
Equities - 99.66% (31 December 2016 - 99.60%) cont/d
Number ofShares Security
ValueUSD
% ofFund
Banks cont/d9,290 OceanFirst Financial 243,862 0.04372 Oconee Federal Financial 10,676 0.0012,691 OFG Bancorp 119,295 0.021,196 Ohio Valley Banc 48,318 0.012,503 Old Line Bancshares 73,688 0.0139,729 Old National Bancorp 693,271 0.111,069 Old Point Financial 31,803 0.008,490 Old Second Bancorp 115,889 0.025,890 Opus Bank 160,797 0.0311,609 Oritani Financial 190,388 0.032,181 Orrstown Financial Services 55,070 0.014,542 Pacific Mercantile Bancorp 39,743 0.0111,613 Pacific Premier Bancorp 464,520 0.071,245 Paragon Commercial 66,246 0.013,951 Park National 410,904 0.071,702 Parke Bancorp 34,976 0.015,338 PCSB Financial 101,689 0.025,133 Peapack Gladstone Financial 179,758 0.031,338 Penns Woods Bancorp 62,324 0.014,823 Peoples Bancorp 157,326 0.021,369 Peoples Bancorp of North Carolina 42,015 0.012,018 Peoples Financial Services 93,998 0.013,967 People's Utah Bancorp 120,200 0.023,918 Preferred Bank 230,300 0.042,766 Premier Financial Bancorp 55,541 0.011,259 Provident Bancorp 33,301 0.011,649 Provident Financial Holdings 30,342 0.0018,273 Provident Financial Services 492,823 0.082,403 Prudential Bancorp 42,293 0.013,563 QCR Holdings 152,675 0.021,117 RBB Bancorp 30,572 0.0013,394 Renasant 547,681 0.092,822 Republic Bancorp 107,292 0.0214,299 Republic First Bancorp 120,827 0.026,278 Riverview Bancorp 54,430 0.0110,166 S&T Bancorp 404,708 0.066,974 Sandy Spring Bancorp 272,125 0.0412,578 Seacoast Banking of Florida 317,091 0.0513,679 ServisFirst Bancshares 567,678 0.093,673 Shore Bancshares 61,339 0.013,295 SI Financial Group 48,437 0.013,969 Sierra Bancorp 105,417 0.0212,252 Simmons First National 699,589 0.112,117 SmartFinancial 45,939 0.0110,678 South State 930,588 0.151,938 Southern First Bancshares 79,943 0.012,000 Southern Missouri Bancorp 75,180 0.016,289 Southern National Bancorp of Virginia 100,813 0.028,161 Southside Bancshares 274,862 0.0411,094 State Bank Financial 331,045 0.0563,053 Sterling Bancorp 1,551,104 0.256,454 Stock Yards Bancorp 243,316 0.043,192 Summit Financial Group 84,013 0.013,155 Sun Bancorp 76,667 0.012,166 Sunshine Bancorp 49,688 0.012,254 Territorial Bancorp 69,581 0.0114,735 Texas Capital Bancshares 1,309,941 0.211,838 Timberland Bancorp 48,799 0.014,329 Tompkins Financial 352,164 0.0616,721 Towne Bank 514,171 0.086,021 TriCo Bancshares 227,955 0.04
CONCEPT FUND SOLUTIONS PLC
277
db x-trackers Russell 2000 UCITS ETF (DR)
Portfolio of Investments as at 31 December 2017 cont/d
Equities - 99.66% (31 December 2016 - 99.60%) cont/d
Number ofShares Security
ValueUSD
% ofFund
Banks cont/d6,561 TriState Capital Holdings 150,903 0.025,139 Triumph Bancorp 161,879 0.0327,321 TrustCo Bank 251,353 0.0419,952 Trustmark 635,671 0.102,128 Two River Bancorp 38,581 0.0113,388 UMB Financial 962,865 0.1565,510 Umpqua Holdings 1,362,608 0.221,133 Union Bankshares (Vermont) 59,992 0.0112,763 Union Bankshares (Virginia) 461,638 0.0729,584 United Bankshares 1,028,044 0.1621,634 United Community Banks 608,781 0.1014,383 United Community Financial 131,317 0.0214,914 United Financial Bancorp 263,083 0.043,846 United Security Bancshares 42,306 0.012,266 Unity Bancorp 44,754 0.017,684 Univest of Pennsylvania 215,536 0.0376,392 Valley National Bancorp 857,118 0.144,747 Veritex Holdings 130,970 0.028,207 Walker & Dunlop 389,832 0.0625,789 Washington Federal 883,273 0.144,424 Washington Trust Bancorp 235,578 0.042,928 WashingtonFirst Bankshares 100,313 0.027,502 Waterstone Financial 127,909 0.0212,450 WesBanco 506,092 0.084,658 West Bancorporation 117,149 0.027,539 Westamerica Bancorporation 448,947 0.078,119 Western New England Bancorp 88,497 0.0116,406 Wintrust Financial 1,351,362 0.228,935 WSFS Financial 427,540 0.071,514 Xenith Bankshares 51,219 0.01
71,810,492 11.53
Beverages2,461 Boston Beer 470,297 0.081,391 Coca-Cola Bottling Consolidated 299,427 0.053,729 Craft Brew Alliance 71,597 0.012,541 Farmer Brothers 81,693 0.013,816 MGP Ingredients 293,374 0.053,471 National Beverage 338,214 0.057,470 Primo Water 93,898 0.01
Portfolio of Investments as at 31 December 2017 cont/d
Equities - 99.66% (31 December 2016 - 99.60%) cont/d
Number ofShares Security
ValueUSD
% ofFund
Computers and Peripherals cont/d5,486 Shutterstock 236,063 0.044,832 Stamps.com 908,416 0.152,999 StarTek 29,900 0.0114,778 Stratasys 294,969 0.0511,476 Super Micro Computer 240,135 0.0411,598 Sykes Enterprises 364,757 0.069,774 Syntel 224,704 0.045,763 TechTarget 80,221 0.014,074 TeleTech Holdings 163,978 0.037,006 Trade Desk 320,384 0.0520,800 TrueCar 232,960 0.042,668 Tucows 186,893 0.0314,779 Unisys 120,449 0.0214,277 USA Technologies 139,201 0.025,788 Varonis Systems 281,007 0.058,889 VASCO Data Security International 123,557 0.0232,938 VeriFone Systems 583,332 0.0914,907 VirnetX Holding 55,156 0.017,993 Virtusa 352,331 0.068,553 Vocera Communications 258,472 0.0411,347 Web.com Group 247,365 0.047,224 XO Group 133,355 0.0223,628 Yelp 991,431 0.1629,475 Zendesk 997,434 0.1615,717 Zix 68,840 0.01
33,612,659 5.40
Construction and Engineering9,551 Aegion 242,882 0.044,265 Argan 191,925 0.033,551 AV Homes 59,124 0.019,212 Beazer Homes 176,963 0.032,521 Cavco Industries 384,705 0.065,605 Century Communities 174,316 0.0329,800 Chicago Bridge & Iron 480,972 0.0810,896 Comfort Systems 475,610 0.088,921 Dycom Industries 994,067 0.1617,436 EMCOR Group 1,425,393 0.237,583 Exponent 539,151 0.0911,740 Granite Construction 744,668 0.127,000 Green Brick Partners 79,100 0.0110,020 Hill International 54,609 0.0136,263 Hovnanian Enterprises 121,481 0.022,538 IES Holdings 43,781 0.016,379 Installed Building Products 484,485 0.0825,105 KB Home 802,105 0.1341,592 KBR 824,769 0.1311,791 Keane Group 224,147 0.045,302 Layne Christensen 66,540 0.015,101 LGI Homes 382,728 0.067,828 M/I Homes 269,283 0.0419,691 MasTec 963,875 0.1513,284 MDC Holdings 423,494 0.0711,385 Meritage Homes 582,912 0.095,083 Mistras Group 119,298 0.024,697 MYR Group 167,824 0.033,608 New Home 45,208 0.012,376 NV5 Global 128,660 0.028,095 Orion Group Holdings 63,384 0.016,514 PICO Holdings 83,379 0.01
CONCEPT FUND SOLUTIONS PLC
285
db x-trackers Russell 2000 UCITS ETF (DR)
Portfolio of Investments as at 31 December 2017 cont/d
Equities - 99.66% (31 December 2016 - 99.60%) cont/d
Number ofShares Security
ValueUSD
% ofFund
Construction and Engineering cont/d11,660 Primoris Services 317,035 0.057,610 Sterling Construction 123,891 0.0223,979 Taylor Morrison Home 586,766 0.0910,485 TopBuild 794,134 0.1344,362 TRI Pointe Group 794,967 0.1311,061 Tutor Perini 280,396 0.042,530 VSE 122,528 0.0212,865 Willbros Group 18,268 0.008,043 William Lyon Homes 233,890 0.049,316 Winnebago Industries 517,970 0.08
15,610,683 2.51
Containers and Packaging7,551 Greif Class A Shares 457,440 0.071,657 Greif Class B Shares 114,913 0.0225,711 KapStone Paper and Packaging 583,383 0.0912,998 Mobile Mini 448,431 0.074,033 Multi-Color 301,870 0.051,903 UFP Technologies 52,903 0.0116,360 Wesco Aircraft Holdings 121,064 0.02
Portfolio of Investments as at 31 December 2017 cont/d
Equities - 99.66% (31 December 2016 - 99.60%) cont/d
Number ofShares Security
ValueUSD
% ofFund
Electronics cont/d7,986 ZAGG 147,342 0.02
15,389,202 2.47
Energy Equipment and Services40,268 Clean Energy Fuels 81,744 0.017,346 FutureFuel 103,505 0.0211,559 Green Plains 194,769 0.0312,658 Pacific Ethanol 57,594 0.0123,254 Pattern Energy Group 499,728 0.0867,289 Plug Power 158,802 0.0311,213 Renewable Energy Group 132,313 0.021,716 REX American Resources 142,068 0.0212,537 Silver Spring Networks 203,601 0.0325,062 Sunrun 147,866 0.0213,383 TerraForm Power 160,061 0.033,130 TPI Composites 64,040 0.017,959 Vivint Solar 32,234 0.01
1,978,325 0.32
Food Products9,724 Amplify Snack Brands 116,785 0.0219,436 B&G Foods 683,175 0.115,871 Bob Evans Farms 462,752 0.074,740 Calavo Growers 400,056 0.068,497 Cal-Maine Foods 377,692 0.065,761 Chefs' Warehouse 118,101 0.0248,543 Darling Ingredients 880,085 0.1426,884 Dean Foods 310,779 0.059,602 Fresh Del Monte Produce 457,727 0.0723,665 Hostess Brands 350,479 0.064,140 Ingles Markets 143,244 0.024,455 J&J Snack Foods 676,403 0.112,517 John B Sanfilippo & Son 159,200 0.035,562 Lancaster Colony 718,666 0.121,318 Lifeway Foods 10,544 0.0026,725 Performance Food Group 884,598 0.145,958 Sanderson Farms 826,851 0.132,058 Seneca Foods 63,284 0.016,700 Smart & Final Stores 57,285 0.0125,446 Snyder's-Lance 1,274,336 0.2010,836 SpartanNash 289,104 0.0511,293 SUPERVALU 243,929 0.044,961 Tootsie Roll Industries 180,580 0.0314,997 United Natural Foods 738,902 0.122,336 Village Super Market 53,564 0.012,829 Weis Markets 117,092 0.02
10,595,213 1.70
Forest Products3,240 Deltic Timber 296,622 0.05
296,622 0.05
Gas Utilities4,677 Chesapeake Utilities 367,378 0.0625,427 New Jersey Resources 1,022,165 0.168,405 Northwest Natural Gas 501,358 0.0815,442 ONE Gas 1,131,281 0.181,965 RGC Resources 53,212 0.0123,616 South Jersey Industries 737,528 0.1214,047 Southwest Gas Holdings 1,130,503 0.18
CONCEPT FUND SOLUTIONS PLC
290
db x-trackers Russell 2000 UCITS ETF (DR)
Portfolio of Investments as at 31 December 2017 cont/d
Equities - 99.66% (31 December 2016 - 99.60%) cont/d
Number ofShares Security
ValueUSD
% ofFund
Gas Utilities cont/d13,967 Spire 1,049,620 0.1715,153 WGL Holdings 1,300,734 0.21
7,293,779 1.17
Health Care Equipment and Supplies6,485 Abaxis 321,137 0.057,684 Accelerate Diagnostics 201,321 0.0323,891 Accuray 102,731 0.023,710 Analogic 310,712 0.0510,770 AngioDynamics 179,105 0.039,414 AtriCure 171,711 0.03412 Atrion 259,807 0.048,049 AxoGen 227,787 0.049,394 BioTelemetry 280,881 0.0510,749 Cantel Medical 1,105,750 0.189,881 Cardiovascular Systems 234,081 0.0433,346 Cerus 112,709 0.0211,769 ConforMIS 28,010 0.008,130 CONMED 414,386 0.079,435 CryoLife 180,680 0.033,879 Cutera 175,913 0.0324,140 Endologix 129,149 0.023,558 Entellus Medical 86,780 0.013,147 Exactech 155,619 0.021,806 FONAR 43,976 0.0114,966 GenMark Diagnostics 62,408 0.015,798 Genomic Health 198,292 0.038,440 Glaukos 216,486 0.0320,857 Globus Medical 857,223 0.1415,735 Haemonetics 913,889 0.1513,826 Halyard Health 638,485 0.104,447 ICU Medical 960,552 0.155,033 Inogen 599,330 0.1017,188 Insulet 1,185,972 0.199,187 Integer Holdings 416,171 0.0718,809 Integra LifeSciences Holdings 900,199 0.147,861 Intersect ENT 254,696 0.049,588 Invacare 161,558 0.034,216 iRhythm Technologies 236,307 0.0412,184 K2M Group Holdings 219,312 0.048,984 Lantheus Holdings 183,723 0.034,409 LeMaitre Vascular 140,382 0.0214,353 LivaNova 1,147,092 0.1812,019 Luminex 236,774 0.0413,260 Masimo 1,124,448 0.1812,216 Meridian Bioscience 171,024 0.0314,388 Merit Medical Systems 621,562 0.1030,644 MiMedx Group 386,421 0.066,051 NanoString Technologies 45,201 0.019,025 Natus Medical 344,755 0.068,191 Nevro 565,507 0.0917,073 Novocure 344,875 0.0615,010 NuVasive 877,935 0.1419,198 NxStage Medical 465,167 0.072,524 Obalon Therapeutics 16,684 0.0016,674 OraSure Technologies 314,472 0.055,090 Orthofix International 278,423 0.041,368 OrthoPediatrics 26,252 0.007,455 Oxford Immunotec Global 104,146 0.028,666 Penumbra 815,470 0.13
CONCEPT FUND SOLUTIONS PLC
291
db x-trackers Russell 2000 UCITS ETF (DR)
Portfolio of Investments as at 31 December 2017 cont/d
Equities - 99.66% (31 December 2016 - 99.60%) cont/d
Number ofShares Security
ValueUSD
% ofFund
Health Care Equipment and Supplies cont/d2,681 Pulse Biosciences 63,272 0.018,400 Quidel 364,140 0.067,882 Quotient 39,016 0.0111,104 Repligen 402,853 0.061,064 Restoration Robotics 4,894 0.0014,111 Rockwell Medical 82,126 0.014,207 Sientra 59,150 0.0112,000 STAAR Surgical 186,000 0.033,800 Surmodics 106,400 0.023,821 Tactile Systems Technology 110,732 0.02993 Utah Medical Products 80,830 0.0111,140 Varex Imaging 447,494 0.078,975 ViewRay 83,108 0.014,408 Viveve Medical 21,908 0.0030,915 Wright Medical Group 686,313 0.11
23,491,674 3.77
Health Care Providers and Services3,367 AAC Holdings 30,303 0.012,203 Addus HomeCare 76,664 0.013,774 Almost Family 208,891 0.038,424 Amedisys 444,029 0.072,838 American Renal Associates Holdings 49,381 0.017,212 Capital Senior Living 97,290 0.024,652 Chemed 1,130,529 0.184,721 Civitas Solutions 80,729 0.0127,930 Community Health Systems 118,982 0.0214,238 Ensign Group 316,084 0.0513,368 Genesis Healthcare 10,198 0.0029,123 HealthSouth 1,438,967 0.2312,551 Invitae 113,963 0.0225,189 Kindred Healthcare 244,333 0.044,643 LHC Group 284,384 0.057,126 Magellan Health 688,015 0.112,000 Medpace Holdings 72,520 0.0113,017 Molina Healthcare 998,144 0.169,402 Natera 84,524 0.013,294 National HealthCare 200,736 0.031,599 Optinose 30,221 0.013,331 Providence Service 197,662 0.0310,853 RadNet 109,615 0.0231,753 Select Medical Holdings 560,441 0.095,532 Surgery Partners 66,937 0.0115,909 Teladoc 554,429 0.0924,039 Tenet Healthcare 364,431 0.0610,825 Tivity Health 395,654 0.066,729 Triple-S Management 167,216 0.033,570 US Physical Therapy 257,754 0.04
9,393,026 1.51
Hotels, Restaurants and Leisure15,755 AMC Entertainment Holdings 237,901 0.0426,459 Belmond 324,123 0.0524,571 Boyd Gaming 861,214 0.1440,368 Caesars Entertainment 510,655 0.086,223 Century Casinos 56,816 0.013,984 Churchill Downs 927,077 0.1513,842 Eldorado Resorts 458,862 0.071,003 Empire Resorts 27,081 0.017,371 Eros International 71,130 0.01
CONCEPT FUND SOLUTIONS PLC
292
db x-trackers Russell 2000 UCITS ETF (DR)
Portfolio of Investments as at 31 December 2017 cont/d
Equities - 99.66% (31 December 2016 - 99.60%) cont/d
Number ofShares Security
ValueUSD
% ofFund
Hotels, Restaurants and Leisure cont/d3,099 Golden Entertainment 101,182 0.0231,455 ILG 895,838 0.1416,576 IMAX 383,734 0.061,168 Inspired Entertainment 11,446 0.007,149 International Speedway 284,888 0.0524,126 La Quinta Holdings 445,366 0.075,492 Marcus 150,206 0.036,328 Marriott Vacations Worldwide 855,609 0.143,180 Monarch Casino & Resort 142,528 0.0218,164 National CineMedia 124,605 0.0225,058 Penn National Gaming 785,067 0.1315,642 Pinnacle Entertainment 511,963 0.082,683 RCI Hospitality Holdings 75,070 0.014,943 Reading International 82,548 0.014,858 Red Lion Hotels 47,851 0.0120,398 Red Rock Resorts 688,229 0.1115,738 Scientific Games 807,359 0.1320,168 SeaWorld Entertainment 273,680 0.043,427 Speedway Motorsports 64,668 0.01
Household Products31,106 ACCO Brands 379,493 0.0610,433 Central Garden & Pet - Non-voting Rights 393,428 0.063,099 Central Garden & Pet - Voting Rights 120,613 0.022,617 CSS Industries 72,831 0.0110,421 Daktronics 95,144 0.027,314 Ethan Allen Interiors 209,180 0.032,240 Flexsteel Industries 104,787 0.021,741 Hamilton Beach Brands Holding 44,726 0.018,062 Helen of Troy 776,774 0.123,319 Hooker Furniture 140,892 0.027,824 iRobot 600,101 0.1011,611 Sleep Number 436,457 0.074,150 Universal Electronics 196,088 0.035,918 VOXX International 33,141 0.014,086 WD-40 482,148 0.08
4,085,803 0.66
Industrial17,614 Actuant 445,634 0.0715,772 American Outdoor Brands 202,512 0.032,130 American Railcar Industries 88,693 0.0115,415 Axon Enterprise 408,498 0.077,678 AZZ 392,346 0.0614,863 Barnes Group 940,382 0.152,113 Chase 254,617 0.042,159 Core Molding Technologies 46,850 0.016,257 EnPro Industries 585,092 0.0910,730 Fabrinet 307,951 0.0517,448 Federal Signal 350,530 0.06
CONCEPT FUND SOLUTIONS PLC
293
db x-trackers Russell 2000 UCITS ETF (DR)
Portfolio of Investments as at 31 December 2017 cont/d
Equities - 99.66% (31 December 2016 - 99.60%) cont/d
Number ofShares Security
ValueUSD
% ofFund
Industrial cont/d3,526 FreightCar America 60,224 0.013,690 GP Strategies 85,608 0.0123,773 Harsco 443,366 0.0718,726 Hillenbrand 837,052 0.1335,168 HRG Group 596,098 0.109,288 John Bean Technologies 1,029,110 0.176,382 LSB Industries 55,906 0.014,925 Lydall 249,944 0.046,781 Myers Industries 132,230 0.022,416 NL Industries 34,428 0.017,334 Proto Labs 755,402 0.1210,689 Raven Industries 367,167 0.063,728 Standex International 379,697 0.065,003 Sturm Ruger & Co 279,418 0.057,574 Tredegar 145,421 0.0213,127 Trinseo 953,020 0.15
10,427,196 1.67
Insurance13,329 Ambac Financial Group 212,997 0.0325,596 American Equity Investment Life Holding 786,565 0.135,650 AMERISAFE 348,040 0.0625,128 AmTrust Financial Services 253,039 0.048,573 Argo Group International Holdings 528,525 0.083,095 Atlas Financial Holdings 63,602 0.012,731 Baldwin & Lyons 65,407 0.011,686 Blue Capital Reinsurance Holdings 20,316 0.0013,667 Citizens 100,452 0.0249,940 CNO Financial Group 1,233,019 0.203,424 Crawford & Co 32,939 0.002,593 Donegal Group 44,859 0.014,563 eHealth 79,259 0.012,577 EMC Insurance Group 73,934 0.019,402 Employers Holdings 417,449 0.073,325 Enstar Group 667,494 0.1124,061 Essent Group 1,044,729 0.172,905 FBL Financial Group 202,333 0.033,547 Federated National Holding 58,774 0.01148,680 Genworth Financial 462,395 0.072,427 Global Indemnity 101,983 0.028,857 Greenlight Capital Re 178,026 0.033,925 Hallmark Financial Services 40,938 0.012,348 HCI Group 70,205 0.013,469 Health Insurance Innovations 86,552 0.016,373 Heritage Insurance Holdings 114,841 0.0212,090 Horace Mann Educators 533,169 0.081,759 Independence Holding 48,285 0.013,152 Infinity Property & Casualty 334,112 0.05431 Investors Title 85,489 0.017,548 James River Group Holdings 301,995 0.0511,721 Kemper 807,577 0.132,681 Kingstone 50,403 0.014,268 Kinsale Capital Group 192,060 0.0320,648 Maiden Holdings 136,277 0.0226,186 MBIA 191,681 0.03109,508 MGIC Investment 1,545,158 0.2514,517 National General Holdings 285,114 0.05668 National Western Life Group 221,121 0.036,074 Navigators Group 295,804 0.053,028 NI Holdings 51,415 0.01
CONCEPT FUND SOLUTIONS PLC
294
db x-trackers Russell 2000 UCITS ETF (DR)
Portfolio of Investments as at 31 December 2017 cont/d
Equities - 99.66% (31 December 2016 - 99.60%) cont/d
Number ofShares Security
ValueUSD
% ofFund
Insurance cont/d16,871 NMI Holdings 286,807 0.0513,103 Primerica 1,330,610 0.2164,086 Radian Group 1,320,812 0.2111,396 RLI 691,281 0.114,321 Safety Insurance Group 347,408 0.0617,017 Selective Insurance Group 998,898 0.164,662 State Auto Financial 135,757 0.026,212 Stewart Information Services 262,768 0.0427,183 Third Point Reinsurance 398,231 0.067,341 Tiptree 43,679 0.016,618 Trupanion 193,709 0.036,343 United Fire Group 289,114 0.056,052 United Insurance Holdings 104,397 0.029,205 Universal Insurance Holdings 251,757 0.0456,809 WMIH 48,237 0.01
Media1,444 Beasley Broadcast Group 19,350 0.0024,188 Central European Media Enterprises 112,474 0.0210,848 Clear Channel Outdoor Holdings 49,901 0.01327 Daily Journal 75,282 0.0137,496 Entercom Communications 404,957 0.0619,435 Entravision Communications 138,960 0.0217,048 EW Scripps 266,460 0.0433,244 Gannett 385,298 0.0614,987 Global Eagle Entertainment 34,320 0.0118,928 Gray Television 317,044 0.054,270 Hemisphere Media Group 49,318 0.0130,580 Houghton Mifflin Harcourt 284,394 0.052,917 Liberty Media-Liberty Braves Class A Shares 64,320 0.0110,142 Liberty Media-Liberty Braves Class C Shares 225,355 0.0416,779 MDC Partners 163,595 0.03512 Media General - 0.0011,702 Meredith 772,917 0.1217,714 MSG Networks 358,708 0.0637,130 New York Times 686,905 0.1112,968 Nexstar Media Group 1,014,098 0.161,096 Saga Communications 44,333 0.013,403 Salem Media Group 15,314 0.008,351 Scholastic 334,959 0.0521,105 Sinclair Broadcast Group 798,824 0.1329,606 Time 546,231 0.0935,441 TiVo 552,880 0.092,490 Townsquare Media 19,123 0.005,900 tronc 103,781 0.02308 Value Line 5,960 0.006,212 WideOpenWest 65,661 0.0111,502 World Wrestling Entertainment 351,731 0.066,912 Yext 83,151 0.01
8,345,604 1.34
Metals and Mining10,440 Advanced Drainage Systems 248,994 0.0493,282 AK Steel Holding 527,976 0.0837,163 Allegheny Technologies 897,115 0.142,544 Ampco-Pittsburgh 31,546 0.005,681 Arch Coal 529,242 0.089,764 Atkore International Group 209,438 0.0313,712 Carpenter Technology 699,175 0.1114,683 Century Aluminum 288,374 0.054,865 CIRCOR International 236,828 0.0488,123 Cleveland-Cliffs 635,367 0.1021,817 Cloud Peak Energy 97,086 0.0254,793 Coeur Mining 410,947 0.0734,186 Commercial Metals 728,846 0.1210,023 Compass Minerals International 724,162 0.124,145 DMC Global 103,832 0.021,647 Eastern 43,069 0.0145,927 Fairmount Santrol Holdings 240,198 0.0415,059 Ferroglobe Representation & Warranty Insurance Trust - 0.006,412 Global Brass & Copper Holdings 212,237 0.0315,395 Gold Resource 67,738 0.01
CONCEPT FUND SOLUTIONS PLC
296
db x-trackers Russell 2000 UCITS ETF (DR)
Portfolio of Investments as at 31 December 2017 cont/d
Equities - 99.66% (31 December 2016 - 99.60%) cont/d
Oil and Gas45,176 Abraxas Petroleum 111,133 0.02646 Adams Resources & Energy 28,101 0.0012,693 Approach Resources 37,571 0.0120,506 Archrock 215,313 0.035,140 Basic Energy Services 120,636 0.0222,150 Bill Barrett 113,630 0.025,996 Bonanza Creek Energy 165,430 0.039,496 Bristow Group 127,911 0.0213,721 C&J Energy Services 459,242 0.0712,616 California Resources 245,255 0.0459,612 Callon Petroleum 724,286 0.126,741 CARBO Ceramics 68,623 0.0122,876 Carrizo Oil & Gas 486,801 0.086,932 Contango Oil & Gas 32,650 0.004,652 CVR Energy 173,241 0.0323,034 Delek US Holdings 804,808 0.13117,222 Denbury Resources 259,061 0.0419,128 Diamond Offshore Drilling 355,590 0.0611,203 Dril-Quip 534,383 0.096,861 Earthstone Energy 72,932 0.0125,658 Eclipse Resources 61,579 0.018,723 Energy XXI Gulf Coast 50,070 0.01126,428 Ensco 747,190 0.1211,093 EP Energy 26,180 0.00
CONCEPT FUND SOLUTIONS PLC
297
db x-trackers Russell 2000 UCITS ETF (DR)
Portfolio of Investments as at 31 December 2017 cont/d
Equities - 99.66% (31 December 2016 - 99.60%) cont/d
Number ofShares Security
ValueUSD
% ofFund
Oil and Gas cont/d5,784 Era Group 62,178 0.017,435 Evolution Petroleum 50,930 0.019,469 Exterran 297,705 0.0516,238 Flotek Industries 75,669 0.0123,833 Forum Energy Technologies 370,603 0.0614,692 Frank's International 97,702 0.0253,120 Gastar Exploration 55,776 0.013,806 Geospace Technologies 49,364 0.014,019 Gulf Island Fabrication 53,955 0.0138,227 Halcon Resources 289,378 0.0541,587 Helix Energy Solutions Group 313,566 0.0510,058 Independence Contract Drilling 40,031 0.01216 Isramco 22,604 0.0016,890 Jagged Peak Energy 266,524 0.0414,871 Jones Energy 16,358 0.003,036 Key Energy Services 35,795 0.0112,614 Lilis Energy 64,458 0.012,352 Mammoth Energy Services 46,170 0.0128,741 Matador Resources 894,707 0.147,714 Matrix Service 137,309 0.0283,745 McDermott International 551,042 0.093,302 Midstates Petroleum 54,747 0.0126,480 MRC Global 448,042 0.073,642 Natural Gas Services Group 95,420 0.023,109 NCS Multistage Holdings 45,827 0.0124,719 Newpark Resources 212,583 0.0371,965 Noble 325,282 0.0531,641 NOW 349,000 0.0678,969 Oasis Petroleum 664,129 0.1115,024 Oil States International 425,179 0.074,611 Panhandle Oil and Gas 94,756 0.019,337 Par Pacific Holdings 180,017 0.0339,420 Parker Drilling 39,420 0.0119,550 PDC Energy 1,007,607 0.164,202 Penn Virginia 164,340 0.033,405 PHI 39,396 0.0122,346 Pioneer Energy Services 68,155 0.0116,862 ProPetro Holding 339,938 0.051,739 Ranger Energy Services 16,051 0.006,405 Resolute Energy 201,565 0.0314,670 Ring Energy 203,913 0.03751 Rosehill Resources 5,903 0.0034,496 Rowan 540,207 0.0921,353 Sanchez Energy 113,384 0.0210,300 SandRidge Energy 217,021 0.034,863 SEACOR Holdings 224,768 0.047,886 Select Energy Services 143,841 0.0219,637 SemGroup 593,037 0.092,053 SilverBow Resources 61,015 0.015,148 Solaris Oilfield Infrastructure 110,219 0.0269,757 SRC Energy 595,027 0.105,749 Stone Energy 184,888 0.0345,118 Superior Energy Services 434,486 0.0716,934 Tellurian 164,937 0.0333,610 TETRA Technologies 143,515 0.029,529 Thermon Group Holdings 225,551 0.045,756 Trecora Resources 77,706 0.0157,697 Ultra Petroleum 522,735 0.0815,312 Unit 336,864 0.0527,655 W&T Offshore 91,538 0.01
CONCEPT FUND SOLUTIONS PLC
298
db x-trackers Russell 2000 UCITS ETF (DR)
Portfolio of Investments as at 31 December 2017 cont/d
Equities - 99.66% (31 December 2016 - 99.60%) cont/d
Number ofShares Security
ValueUSD
% ofFund
Oil and Gas cont/d14,384 WildHorse Resource Development 264,810 0.04
19,840,259 3.19
Paper and Related Products4,770 Clearwater Paper 216,558 0.034,909 Neenah 445,001 0.072,619 Orchids Paper Products 33,523 0.0112,798 PH Glatfelter 274,389 0.049,003 Schweitzer-Mauduit International 408,376 0.0710,125 Verso 177,897 0.03
1,555,744 0.25
Personal Products6,111 Elf Beauty 136,336 0.025,095 Inter Parfums 221,378 0.043,477 Revlon 75,799 0.01
Real Estate13,814 Alexander & Baldwin 383,200 0.06
CONCEPT FUND SOLUTIONS PLC
300
db x-trackers Russell 2000 UCITS ETF (DR)
Portfolio of Investments as at 31 December 2017 cont/d
Equities - 99.66% (31 December 2016 - 99.60%) cont/d
Number ofShares Security
ValueUSD
% ofFund
Real Estate cont/d5,044 Community Healthcare Trust 141,736 0.021,157 Consolidated-Tomoka Land 73,469 0.019,428 Farmland Partners 81,835 0.013,095 Forestar Group 68,090 0.011,927 FRP Holdings 85,270 0.01198 Griffin Industrial Realty 7,267 0.0010,866 HFF 528,522 0.094,708 Marcus & Millichap 153,528 0.021,972 Maui Land & Pineapple 34,116 0.015,268 RE/MAX Holdings 255,498 0.043,152 Redfin 98,721 0.022,054 RMR Group 121,802 0.023,030 Safety Income & Growth 53,328 0.0113,121 St Joe 236,834 0.041,735 Stratus Properties 51,529 0.01493 Transcontinental Realty Investors 15,441 0.005,324 Trinity Place Holdings 37,002 0.01
2,427,188 0.39
Real Estate Investment Trust24,529 Acadia Realty Trust 671,113 0.118,256 AG Mortgage Investment Trust 156,947 0.038,339 Agree Realty 428,958 0.07629 Alexander's 248,990 0.0414,570 Altisource Residential 172,800 0.0311,941 American Assets Trust 456,624 0.0728,647 Anworth Mortgage Asset 155,840 0.0231,796 Apollo Commercial Real Estate Finance 586,636 0.097,890 Ares Commercial Real Estate 101,781 0.0213,189 Armada Hoffler Properties 204,825 0.0312,312 ARMOUR Residential REIT 316,665 0.057,790 Ashford Hospitality Prime 75,797 0.0122,646 Ashford Hospitality Trust 152,408 0.026,674 Bluerock Residential Growth REIT 67,474 0.0128,113 Capstead Mortgage 243,177 0.0422,214 CareTrust REIT 372,307 0.0612,759 CatchMark Timber Trust 167,526 0.0349,761 CBL & Associates Properties 281,647 0.0525,974 Cedar Realty Trust 157,922 0.0313,207 Chatham Lodging Trust 300,591 0.053,464 Cherry Hill Mortgage Investment 62,317 0.0117,495 Chesapeake Lodging Trust 473,940 0.088,678 City Office REIT 112,901 0.024,638 Clipper Realty 46,334 0.013,504 CorEnergy Infrastructure Trust 133,853 0.02123,653 Cousins Properties 1,143,790 0.1845,762 CYS Investments 367,469 0.0659,151 DiamondRock Hospitality 667,815 0.1114,705 Dynex Capital 103,082 0.0212,472 Easterly Government Properties 266,152 0.049,899 EastGroup Properties 874,874 0.1422,505 Education Realty Trust 785,875 0.132,644 Ellington Residential Mortgage REIT 31,834 0.0035,184 First Industrial Realty Trust 1,107,240 0.1818,210 Four Corners Property Trust 467,997 0.0730,908 Franklin Street Properties 331,952 0.0536,200 GEO Group 854,320 0.149,149 Getty Realty 248,487 0.048,018 Gladstone Commercial 168,859 0.035,330 Global Medical REIT 43,706 0.01
CONCEPT FUND SOLUTIONS PLC
301
db x-trackers Russell 2000 UCITS ETF (DR)
Portfolio of Investments as at 31 December 2017 cont/d
Equities - 99.66% (31 December 2016 - 99.60%) cont/d
Number ofShares Security
ValueUSD
% ofFund
Real Estate Investment Trust cont/d20,044 Global Net Lease 412,506 0.0727,961 Government Properties Income Trust 518,397 0.0847,337 Gramercy Property Trust 1,262,004 0.204,608 Great Ajax 63,683 0.0136,284 Healthcare Realty Trust 1,165,442 0.1911,390 Hersha Hospitality Trust 198,186 0.0324,800 Independence Realty Trust 250,232 0.0412,508 InfraREIT 232,399 0.0433,250 Invesco Mortgage Capital 592,847 0.1035,393 Investors Real Estate Trust 201,032 0.0319,469 iStar 220,000 0.043,869 Jernigan Capital 73,550 0.0124,489 Kite Realty Group Trust 479,984 0.083,121 KKR Real Estate Finance Trust 62,451 0.0133,663 LaSalle Hotel Properties 944,920 0.1564,063 Lexington Realty Trust 618,208 0.1011,638 LTC Properties 506,835 0.0826,777 Mack-Cali Realty 577,312 0.098,454 MedEquities Realty Trust 94,854 0.0221,018 Monmouth Real Estate Investment 374,120 0.0613,482 MTGE Investment 249,417 0.0411,906 National Health Investors 897,474 0.1413,064 National Storage Affiliates Trust 356,125 0.0624,117 New Senior Investment Group 182,325 0.0332,707 New York Mortgage Trust 201,802 0.035,048 NexPoint Residential Trust 141,041 0.0216,037 NorthStar Realty Europe 215,377 0.034,231 One Liberty Properties 109,668 0.0212,984 Orchid Island Capital 120,492 0.022,880 Owens Realty Mortgage 46,109 0.0120,286 Pebblebrook Hotel Trust 754,031 0.1220,175 Pennsylvania Real Estate Investment Trust 239,881 0.0419,176 PennyMac Mortgage Investment Trust 308,158 0.0553,244 Physicians Realty Trust 957,860 0.1511,963 Potlatch 596,954 0.1010,782 Preferred Apartment Communities 218,335 0.035,847 PS Business Parks 731,401 0.1214,584 QTS Realty Trust 789,869 0.1327,957 Quality Care Properties 386,086 0.0626,697 RAIT Financial Trust 10,011 0.0023,244 Ramco-Gershenson Properties Trust 342,384 0.0522,654 Redwood Trust 335,732 0.058,863 Resource Capital 83,046 0.0132,025 Retail Opportunity Investments 638,899 0.1022,775 Rexford Industrial Realty 664,119 0.1150,175 RLJ Lodging Trust 1,102,345 0.1813,076 Ryman Hospitality Properties 902,505 0.1452,466 Sabra Health Care REIT 984,787 0.163,342 Saul Centers 206,368 0.0318,764 Select Income REIT 471,539 0.087,556 Seritage Growth Properties 305,716 0.0528,018 STAG Industrial 765,732 0.1230,658 Summit Hotel Properties 466,921 0.0766,740 Sunstone Hotel Investors 1,103,212 0.185,153 Sutherland Asset Management 78,068 0.0115,812 Terreno Realty 554,369 0.0914,056 Tier REIT 286,602 0.059,159 UMH Properties 136,469 0.023,742 Universal Health Realty Income Trust 281,062 0.0430,462 Urban Edge Properties 776,476 0.128,700 Urstadt Biddle Properties 189,138 0.03
CONCEPT FUND SOLUTIONS PLC
302
db x-trackers Russell 2000 UCITS ETF (DR)
Portfolio of Investments as at 31 December 2017 cont/d
Equities - 99.66% (31 December 2016 - 99.60%) cont/d
Number ofShares Security
ValueUSD
% ofFund
Real Estate Investment Trust cont/d55,291 Washington Prime Group 393,672 0.0623,316 Washington Real Estate Investment Trust 725,594 0.1212,035 Western Asset Mortgage Capital 119,748 0.0210,971 Whitestone REIT 158,092 0.0331,831 Xenia Hotels & Resorts 687,231 0.11
42,734,029 6.86
Retail20,201 Abercrombie & Fitch 352,103 0.0647,984 American Eagle Outfitters 902,099 0.142,090 America's Car-Mart 93,319 0.015,485 Asbury Automotive Group 351,040 0.0650,823 Ascena Retail Group 119,434 0.021,483 At Home Group 45,068 0.0117,466 Barnes & Noble 117,022 0.0211,222 Barnes & Noble Education 92,469 0.012,995 Bassett Furniture Industries 112,612 0.026,091 Big 5 Sporting Goods 46,292 0.0112,602 Big Lots 707,602 0.11298 Biglari Holdings 123,491 0.025,956 BJ's Restaurants 216,798 0.0327,417 Bloomin' Brands 585,079 0.0919,359 BMC Stock Holdings 489,783 0.085,124 Bojangles' 60,463 0.013,592 Boot Barn Holdings 59,663 0.0113,766 Brinker International 534,671 0.098,438 Buckle 200,403 0.034,578 Buffalo Wild Wings 715,770 0.114,007 Build-A-Bear Workshop 36,864 0.0112,444 Caleres 416,625 0.0710,130 Carrols Restaurant Group 123,080 0.026,885 Cato 109,609 0.0212,673 Cheesecake Factory 610,585 0.1038,033 Chico's FAS 335,451 0.055,101 Children's Place 741,430 0.124,862 Chuy's Holdings 136,379 0.023,919 Citi Trends 103,697 0.025,449 Conn's 193,712 0.034,637 Container Store Group 21,979 0.005,686 Cracker Barrel Old Country Store 903,449 0.1412,277 Dave & Buster's Entertainment 677,322 0.116,204 Del Frisco's Restaurant Group 94,611 0.029,726 Del Taco Restaurants 117,879 0.0218,930 Denny's 250,633 0.044,132 Dillard's 248,127 0.045,082 DineEquity 257,810 0.0419,425 DSW 415,889 0.072,788 Duluth Holdings 49,766 0.015,969 El Pollo Loco Holdings 59,093 0.0122,727 Express 230,679 0.0414,647 EZCORP 178,693 0.037,568 Fiesta Restaurant Group 143,792 0.0211,676 Finish Line 169,652 0.0313,710 FirstCash 924,740 0.1515,978 Five Below 1,059,661 0.172,781 Fogo De Chao 32,260 0.014,357 Foundation Building Materials 64,440 0.0110,881 Francesca's Holdings 79,540 0.0110,554 Fred's 42,744 0.017,319 Freshpet 138,695 0.02
CONCEPT FUND SOLUTIONS PLC
303
db x-trackers Russell 2000 UCITS ETF (DR)
Portfolio of Investments as at 31 December 2017 cont/d
Equities - 99.66% (31 December 2016 - 99.60%) cont/d
Number ofShares Security
ValueUSD
% ofFund
Retail cont/d2,575 Gaia 31,930 0.015,731 Genesco 186,258 0.038,123 GMS 305,750 0.0519,911 GNC Holdings 73,472 0.015,871 Group 1 Automotive 416,665 0.0717,723 Guess? 299,164 0.055,949 Habit Restaurants 56,813 0.015,516 Haverty Furniture 124,937 0.026,106 Hibbett Sports 124,562 0.029,540 HSN 384,939 0.063,810 J Alexander's Holdings 36,957 0.013,480 J. Jill 27,144 0.008,706 Jack in the Box 854,146 0.1491,411 JC Penney 288,859 0.054,503 Kirkland's 53,878 0.0114,280 La-Z-Boy 445,536 0.076,961 Lithia Motors 790,700 0.138,319 Lumber Liquidators Holdings 261,133 0.046,709 MarineMax 126,800 0.024,456 Movado Group 143,483 0.02845 Nathan's Famous 63,798 0.015,406 National Vision Holdings 219,538 0.043,449 Noodles & Co 18,107 0.00151,462 Office Depot 536,176 0.0914,077 Ollie's Bargain Outlet Holdings 749,600 0.127,682 Papa John's International 431,037 0.078,058 Party City Holdco 112,409 0.023,394 PC Connection 88,957 0.012,779 PCM 27,512 0.002,131 PetIQ 46,541 0.015,840 PetMed Express 265,720 0.0423,535 Pier 1 Imports 97,435 0.026,707 Potbelly 82,496 0.016,534 PriceSmart 562,577 0.093,779 Red Robin Gourmet Burgers 213,136 0.0310,429 Regis 160,189 0.035,945 RH 512,518 0.089,005 Rush Enterprises Class A Shares 457,544 0.071,504 Rush Enterprises Class B Shares 72,508 0.018,675 Ruth's Hospitality Group 187,814 0.033,489 Sears Holdings 12,491 0.006,599 Shake Shack 285,077 0.053,410 Shoe Carnival 91,218 0.0111,526 Sonic 316,735 0.057,430 Sonic Automotive 137,084 0.0210,676 Sportsman's Warehouse Holdings 70,568 0.0114,524 Tailored Brands 317,059 0.0519,794 Texas Roadhouse 1,042,748 0.1711,685 Tile Shop Holdings 112,176 0.023,865 Tilly's 57,047 0.015,925 Vera Bradley 72,167 0.016,269 Vitamin Shoppe 27,584 0.008,590 Wingstop 334,838 0.05636 Winmark 82,298 0.015,625 Zoe's Kitchen 94,050 0.025,411 Zumiez 112,684 0.02
Water10,736 American States Water 621,722 0.102,310 Artesian Resources 89,074 0.0114,204 California Water Service Group 644,151 0.103,499 Connecticut Water Service 200,877 0.034,281 Consolidated Water 53,941 0.012,983 Global Water Resources 27,861 0.014,682 Middlesex Water 186,859 0.034,822 SJW Group 307,788 0.053,768 York Water 127,735 0.02
USD Russell 2000 Mini Index FuturesLong Futures Contracts 1,692,035 16/03/2018 (1,665) 0.00
Net unrealised loss on open futures contracts (1,665) 0.00Total Exchange Traded Financial Derivative Instruments (1,665) 0.00
Total Financial Derivative Instruments (1,665) 0.00
ValueUSD
% ofFund
Total Financial Assets at Fair Value through Profit or Loss 620,689,076 99.66Other Net Assets - 0.34%(31 December 2016 - 0.40%) 2,093,369 0.34
Net Assets Attributable to Redeeming Participating Shareholders 622,782,445 100.00
* The broker for the open futures contracts is Deutsche Bank AG Frankfurt.
Analysis of Total Assets % of Total Assets31/12/2017
Transferable securities admitted to an official stock exchange listing 99.32Current Assets 0.68Total Assets 100.00
CONCEPT FUND SOLUTIONS PLC
308
db x-trackers Russell Midcap UCITS ETF (DR)
Investment Manager’s Report for the financial year ended 31 December 2017
Investment Objective
The investment objective of the Fund is to track the performance before fees and expenses of the UnderlyingAsset, which is the Russell Midcap Index (the “Reference Index”). The Reference Index is designed to reflectthe performance of the shares of certain US companies. The companies making up the Reference Index aremedium sized companies.
The Reference Index is calculated and maintained by Frank Russell Company.
The Reference Index is a free float-adjusted market capitalisation weighted index reflecting the performanceof the mid-cap segment of the U.S. equity universe.
The Reference Index is a subset of the Russell 1000® Index. It includes approximately 800 of the smallestsecurities based on a combination of their market cap and current index membership.
The Reference Index represents approximately 27% of the total market capitalisation of the Russell 1000companies. The Reference Index is constructed to provide a comprehensive and unbiased barometer for themid-cap segment.
The Reference Index is calculated in US Dollars on an end of day basis and real time basis.
The Reference Index has a base date of 31 December 1978.
Fund Performance
The Fund’s performance amounts are calculated net of fees and taxes.
The Fund performed in line with its benchmark and within guided tolerance levels.
The Fund has tracked the Reference Index within its anticipated tracking error. The anticipated tracking errorfor the Fund is 1.00%.
Total Net Assets Net Assets per Share31/12/2017 Price (at 31/12/2017)
db x-trackers Russell Midcap UCITS ETF (DR) $142,472,610 $22.83
Year to Date Year to DateFund Return Index Return
db x-trackers Russell Midcap UCITS ETF (DR) 17.75% 17.93%
Year to Date Year to DateTracking Error Tracking Difference1
db x-trackers Russell Midcap UCITS ETF (DR) 0.04% (0.18)%
1The performance difference of the share class arose from various reasons such as inaccuracies in the index replication via optimization,various fee components like management fee, fixed fee and transaction costs, specific taxes respectively tax advantages. The realisedtracking error level is contrasted with the anticipated tracking error level; the level of realised tracking error was within the expected range,due to the effectiveness of replication techniques utilised over the 2017 period.
CONCEPT FUND SOLUTIONS PLC
309
db x-trackers Russell Midcap UCITS ETF (DR)
Portfolio of Investments as at 31 December 2017
Transferable Securities
Equities - 99.44% (31 December 2016 - 99.47%)
Number ofShares Security
ValueUSD
% ofFund
Aerospace and Defense8,502 Arconic 231,680 0.162,374 Harris 336,277 0.24953 HEICO - Restricted Voting Rights 75,335 0.05484 HEICO - Voting Rights 45,665 0.031,541 L3 Technologies 304,887 0.211,143 Orbital 150,305 0.113,233 Rockwell Collins 438,459 0.312,305 Spirit AeroSystems Holdings 201,111 0.14694 Teledyne Technologies 125,718 0.09961 TransDigm Group 263,910 0.18
2,173,347 1.52
Agriculture2,796 Bunge 187,556 0.13
187,556 0.13
Airlines2,397 Alaska Air Group 176,204 0.128,631 American Airlines Group 449,071 0.32619 Copa Holdings 82,983 0.066,386 JetBlue Airways 142,663 0.101,389 Spirit Airlines 62,297 0.045,363 United Continental Holdings 361,466 0.25
Banks2,992 Associated Banc 75,997 0.05839 Bank of Hawaii 71,902 0.052,379 Bank of the Ozarks 115,263 0.082,058 BankUnited 83,802 0.06503 BOK Financial 46,437 0.032,612 CIT Group 128,589 0.099,816 Citizens Financial Group 412,076 0.293,454 Comerica 299,842 0.211,853 Commerce Bancshares 103,471 0.071,115 Cullen/Frost Bankers 105,535 0.072,863 East West Bancorp 174,156 0.1214,080 Fifth Third Bancorp 427,187 0.301,041 First Hawaiian 30,376 0.025,773 First Horizon National 115,402 0.083,193 First Republic Bank 276,641 0.206,395 FNB 88,379 0.06
CONCEPT FUND SOLUTIONS PLC
310
db x-trackers Russell Midcap UCITS ETF (DR)
Portfolio of Investments as at 31 December 2017 cont/d
Equities - 99.44% (31 December 2016 - 99.47%) cont/d
Number ofShares Security
ValueUSD
% ofFund
Banks cont/d21,531 Huntington Bancshares 313,491 0.2221,354 KeyCorp 430,710 0.302,820 M&T Bank 482,192 0.349,402 New York Community Bancorp 122,414 0.094,166 Northern Trust 416,142 0.292,533 PacWest Bancorp 127,663 0.096,767 People's United Financial 126,543 0.091,410 Pinnacle Financial Partners 93,483 0.071,993 Popular 70,732 0.051,321 Prosperity Bancshares 92,562 0.0723,129 Regions Financial 399,669 0.281,076 Signature Bank 147,692 0.109,491 SunTrust Banks 613,024 0.431,045 SVB Financial Group 244,290 0.172,356 Synovus Financial 112,947 0.083,137 TCF Financial 64,308 0.051,098 TFS Financial 16,404 0.011,824 Webster Financial 102,436 0.071,926 Western Alliance Bancorp 109,050 0.083,935 Zions Bancorporation 200,016 0.14
6,840,823 4.80
Beverages1,064 Brown-Forman Class A Shares 71,543 0.053,516 Brown-Forman Class B Shares 241,444 0.173,612 Dr Pepper Snapple Group 350,581 0.243,442 Molson Coors Brewing 282,485 0.20
Portfolio of Investments as at 31 December 2017 cont/d
Equities - 99.44% (31 December 2016 - 99.47%) cont/d
Number ofShares Security
ValueUSD
% ofFund
Diversified Telecommunications cont/d1,912 Telephone & Data Systems 53,154 0.04260 United States Cellular 9,784 0.013,702 Zayo Group Holdings 136,234 0.10
1,693,839 1.19
Electric Utilities13,162 AES 142,544 0.104,610 Alliant Energy 196,432 0.144,818 Ameren 284,214 0.201,128 Avangrid 57,054 0.047,105 Calpine 107,499 0.088,571 CenterPoint Energy 243,074 0.175,552 CMS Energy 262,610 0.196,198 Consolidated Edison 526,520 0.373,567 DTE Energy 390,444 0.276,333 Edison International 400,499 0.283,568 Entergy 290,400 0.206,324 Eversource Energy 399,550 0.288,825 FirstEnergy 270,221 0.194,293 Great Plains Energy 138,406 0.102,138 Hawaiian Electric Industries 77,289 0.053,874 MDU Resources Group 104,133 0.075,963 NRG Energy 169,826 0.123,974 OGE Energy 130,784 0.092,215 Pinnacle West Capital 188,674 0.1313,659 PPL 422,746 0.3010,082 Public Service Enterprise Group 519,223 0.372,602 SCANA 103,508 0.074,806 Vistra Energy 88,046 0.066,298 WEC Energy Group 418,376 0.292,824 Westar Energy 149,107 0.1110,130 Xcel Energy 487,354 0.34
Energy Equipment and Services1,623 First Solar 109,585 0.08
109,585 0.08
Food Products4,836 Aramark 206,691 0.141,829 Blue Buffalo Pet Products 59,973 0.043,536 Campbell Soup 170,117 0.127,755 Conagra Brands 292,131 0.203,492 Flowers Foods 67,430 0.052,010 Hain Celestial Group 85,204 0.062,740 Hershey 311,017 0.225,367 Hormel Foods 195,305 0.141,421 Ingredion 198,656 0.142,181 JM Smucker 270,967 0.194,867 Kellogg 330,859 0.232,915 Lamb Weston Holdings 164,552 0.122,385 McCormick & Co 243,055 0.171,046 Pilgrim's Pride 32,489 0.022,336 Pinnacle Foods 138,922 0.101,292 Post Holdings 102,365 0.075 Seaboard 22,050 0.022,619 Sprouts Farmers Market 63,773 0.041,096 TreeHouse Foods 54,208 0.045,554 Tyson Foods 450,263 0.324,052 US Foods Holding 129,380 0.09
3,589,407 2.52
Gas Utilities2,053 Atmos Energy 176,332 0.121,601 National Fuel Gas 87,911 0.066,710 NiSource 172,246 0.125,008 Sempra Energy 535,455 0.383,443 UGI 161,649 0.111,643 Vectren 106,828 0.08
1,240,421 0.87
Health Care Equipment and Supplies817 ABIOMED 153,114 0.111,583 Align Technology 351,727 0.25734 Becton Dickinson & Co 157,120 0.11730 Bio-Techne 94,571 0.062,024 Bruker 69,464 0.05963 Cooper 209,818 0.154,478 Dentsply Sirona 294,787 0.214,166 Edwards Lifesciences 469,550 0.333,141 Henry Schein 219,493 0.151,299 Hill-Rom Holdings 109,493 0.085,554 Hologic 237,433 0.171,733 IDEXX Laboratories 271,007 0.196,544 OPKO Health 32,066 0.021,642 Patterson 59,325 0.044,495 QIAGEN 139,030 0.102,780 ResMed 235,438 0.161,667 STERIS 145,812 0.10
CONCEPT FUND SOLUTIONS PLC
316
db x-trackers Russell Midcap UCITS ETF (DR)
Portfolio of Investments as at 31 December 2017 cont/d
Equities - 99.44% (31 December 2016 - 99.47%) cont/d
Number ofShares Security
ValueUSD
% ofFund
Health Care Equipment and Supplies cont/d897 Teleflex 223,192 0.161,832 Varian Medical Systems 203,627 0.141,458 West Pharmaceutical Services 143,861 0.104,025 Zimmer Biomet Holdings 485,697 0.34
4,305,625 3.02
Health Care Providers and Services1,538 Acadia Healthcare 50,185 0.033,603 Brookdale Senior Living 34,949 0.023,389 Centene 341,882 0.243,049 DaVita 220,290 0.152,385 Envision Healthcare 82,426 0.063,178 IQVIA Holdings 311,126 0.222,030 Laboratory of America Holdings 323,805 0.23722 LifePoint Health 35,956 0.031,816 MEDNAX 97,047 0.072,717 Quest Diagnostics 267,597 0.191,715 Universal Health Services 194,395 0.14886 WellCare Health Plans 178,184 0.12
2,137,842 1.50
Hotels, Restaurants and Leisure665 Choice Hotels International 51,604 0.042,100 Cinemark Holdings 73,122 0.051,090 Dolby Laboratories 67,580 0.053,782 Extended Stay America 71,858 0.051,362 Hilton Grand Vacations 57,136 0.044,325 Hilton Worldwide Holdings 345,395 0.24916 Hyatt Hotels 67,363 0.052,114 International Game Technology 56,042 0.041,030 Lions Gate Entertainment Class A Shares 34,824 0.022,038 Lions Gate Entertainment Class B Shares 64,686 0.05366 Madison Square Garden 77,171 0.059,953 MGM Resorts International 332,331 0.232,208 Regal Entertainment 50,806 0.041,311 Six Flags Entertainment 87,273 0.06798 Vail Resorts 169,551 0.121,976 Wyndham Worldwide 228,959 0.161,587 Wynn Resorts 267,552 0.19
2,103,253 1.48
Household Durables1,170 Lincoln Electric Holdings 107,149 0.089,709 Newell Brands 300,008 0.21887 Regal Beloit 67,944 0.05858 Scotts Miracle-Gro 91,798 0.061,128 Snap-on 196,610 0.143,049 Stanley Black & Decker 517,385 0.362,093 Toro 136,526 0.101,001 Tupperware Brands 62,763 0.04
Insurance295 Alleghany 175,847 0.121,399 American Financial Group 151,847 0.11147 American National Insurance 18,853 0.012,439 Arch Capital Group 221,388 0.163,543 Arthur J Gallagher & Co 224,201 0.161,176 Aspen Insurance Holdings 47,746 0.031,069 Assurant 107,798 0.082,320 Assured Guaranty 78,578 0.062,123 Athene Holding 109,780 0.081,619 Axis Capital Holdings 81,371 0.062,325 Brown & Brown 119,645 0.083,055 Cincinnati Financial 229,033 0.16538 CNA Financial 28,541 0.02487 Erie Indemnity 59,336 0.04809 Everest Re Group 178,999 0.132,125 First American Financial 119,085 0.08839 Hanover Insurance Group 90,679 0.067,069 Hartford Financial Services Group 397,843 0.284,356 Lincoln National 334,846 0.245,527 Loews 276,516 0.19272 Markel 309,843 0.22539 Mercury General 28,804 0.024,832 Old Republic International 103,308 0.075,314 Principal Financial Group 374,956 0.261,045 ProAssurance 59,722 0.0411,555 Progressive 650,778 0.461,279 Reinsurance Group of America 199,434 0.14792 RenaissanceRe Holdings 99,467 0.072,298 Torchmark 208,452 0.154,495 Unum Group 246,731 0.171,524 Validus Holdings 71,506 0.053,584 Voya Financial 177,301 0.1271 White Mountains Insurance Group 60,441 0.042,522 Willis Towers Watson 380,040 0.271,896 WR Berkley 135,848 0.105,002 XL Group 175,870 0.12
6,334,433 4.45
CONCEPT FUND SOLUTIONS PLC
318
db x-trackers Russell Midcap UCITS ETF (DR)
Portfolio of Investments as at 31 December 2017 cont/d
Equities - 99.44% (31 December 2016 - 99.47%) cont/d
Media976 AMC Networks 52,782 0.0494 Cable One 66,115 0.052,994 Discovery Communications Class A Shares 67,006 0.054,037 Discovery Communications Class C Shares 85,463 0.06768 FactSet Research Systems 148,040 0.107,718 Interpublic Group 155,595 0.11868 John Wiley & Sons 57,071 0.04498 Liberty Broadband Class A Shares 42,355 0.032,070 Liberty Broadband Class C Shares 176,281 0.12484 Liberty Media Corp-Liberty Formula One 15,836 0.013,700 Liberty Media-Liberty Formula One 126,392 0.091,780 Liberty Media-Liberty SiriusXM Class A Shares 70,595 0.053,560 Liberty Media-Liberty SiriusXM Class C Shares 141,190 0.107,532 News Class A Shares 122,094 0.092,417 News Class B Shares 40,122 0.034,607 Omnicom Group 335,528 0.231,704 Scripps Networks Interactive 145,487 0.1028,914 Sirius XM Holdings 154,979 0.114,264 TEGNA 60,037 0.041,574 Tribune Media 66,848 0.05193 Viacom Class A Shares 6,736 0.007,004 Viacom Class B Shares 215,793 0.15
2,352,345 1.65
Metals and Mining3,682 Alcoa 198,349 0.14562 CONSOL Energy 22,205 0.0227,001 Freeport-McMoRan 511,939 0.3610,647 Newmont Mining 399,475 0.28
CONCEPT FUND SOLUTIONS PLC
319
db x-trackers Russell Midcap UCITS ETF (DR)
Portfolio of Investments as at 31 December 2017 cont/d
Equities - 99.44% (31 December 2016 - 99.47%) cont/d
Software3,287 Akamai Technologies 213,786 0.151,700 ANSYS 250,903 0.18779 AthenaHealth 103,638 0.071,823 Atlassian 82,983 0.064,138 Autodesk 433,787 0.302,151 Black Knight 94,967 0.072,334 Broadridge Financial Solutions 211,414 0.156,278 CA 208,932 0.155,526 Cadence Design Systems 231,097 0.162,546 CDK Global 181,479 0.135,736 Cerner 386,549 0.273,001 Citrix Systems 264,088 0.18731 Dun & Bradstreet 86,558 0.066,553 Fidelity National Information Services 616,572 0.439,460 First Data 158,077 0.114,227 Fiserv 554,287 0.391,505 Guidewire Software 111,761 0.081,542 Jack Henry & Associates 180,352 0.131,364 Manhattan Associates 67,573 0.051,770 MSCI 223,976 0.165,714 Nuance Communications 93,424 0.066,410 Paychex 436,393 0.312,284 PTC 138,799 0.103,530 Red Hat 423,953 0.303,332 ServiceNow 434,459 0.302,774 Splunk 229,798 0.163,428 SS&C Technologies Holdings 138,765 0.102,984 Synopsys 254,356 0.181,275 Tableau Software 88,230 0.062,222 Take-Two Interactive Software 243,931 0.17681 Tyler Technologies 120,571 0.08566 Ultimate Software Group 123,518 0.092,144 Veeva Systems 118,520 0.082,656 Workday 270,221 0.1915,319 Zynga 61,276 0.04
7,838,993 5.50
Textiles and Apparel937 Carter's 110,088 0.087,232 Hanesbrands 151,221 0.102,862 Michael Kors Holdings 180,163 0.131,233 Mohawk Industries 340,185 0.241,095 Ralph Lauren 113,540 0.082,589 Skechers U.S.A. 97,968 0.073,660 Under Armour Class A Shares 52,814 0.043,687 Under Armour Class C Shares 49,111 0.03
CONCEPT FUND SOLUTIONS PLC
324
db x-trackers Russell Midcap UCITS ETF (DR)
Portfolio of Investments as at 31 December 2017 cont/d
Equities - 99.44% (31 December 2016 - 99.47%) cont/d
Number ofShares Security
ValueUSD
% ofFund
Textiles and Apparel cont/d6,496 VF 480,704 0.34
1,575,794 1.11
Transportation2,793 CH Robinson Worldwide 248,828 0.183,532 Expeditors International of Washington 228,485 0.161,204 Genesee & Wyoming 94,791 0.071,724 JB Hunt Transport Services 198,226 0.142,056 Kansas City Southern 216,332 0.151,052 Kirby 70,274 0.05831 Landstar System 86,507 0.061,218 Old Dominion Freight Line 160,228 0.111,040 Ryder System 87,537 0.062,360 XPO Logistics 216,152 0.15
1,607,360 1.13
Water3,556 American Water Works 325,338 0.233,542 Aqua America 138,953 0.10
USD S&P 500 E Mini Index FuturesLong Futures Contracts 396,323 16/03/2018 5,078 0.00
Net unrealised gain on open futures contracts 5,078 0.00Total Exchange Traded Financial Derivative Instruments 5,078 0.00
Total Financial Derivative Instruments 5,078 0.00
ValueUSD
% ofFund
Total Financial Assets at Fair Value through Profit or Loss 141,675,857 99.44Other Net Assets - 0.56% (31 December 2016 - 0.53%) 796,753 0.56
Net Assets Attributable to Redeeming Participating Shareholders 142,472,610 100.00
* The broker for the open futures contracts is Deutsche Bank AG Frankfurt.
Analysis of Total Assets % of Total Assets31/12/2017
Transferable securities admitted to an official stock exchange listing 99.41Current Assets 0.59Total Assets 100.00
CONCEPT FUND SOLUTIONS PLC
325
db x-trackers JPX-Nikkei 400 UCITS ETF (DR)
Investment Manager’s Report for the financial year ended 31 December 2017
Investment Objective
The investment objective of the Fund is to track the performance before fees and expenses of the UnderlyingAsset, which is the total return version of the JPX-Nikkei Index 400 (the “Reference Index”).
The Reference Index is calculated by a method jointly developed by Japan Exchange Group, Inc (“JPX”) andthe Tokyo Stock Exchange, Inc. (“TSE”). The Reference Index is designed to reflect the performance of theJapanese stock market, specifically companies which have as their main market the TSE 1st section, 2ndsection, Mothers or JASDAQ markets.
The Reference Index is calculated in points on an end of day basis. The Reference Index has a base date of30 August 2013 and a base value of 10,000 points. The Reference Index was calculated from 6 January 2014.The currency of the constituents of the Reference Index is the Japanese Yen.
The Reference Index is calculated based on market capitalisation adjusted by free float weight. Constituentsare capped at 1.5% at the time of the annual review.
Fund Performance
The Fund’s performance amounts are calculated net of fees and taxes.
The Fund performed in line with its benchmark and within guided tolerance levels.
The Fund has tracked the Reference Index within its anticipated tracking error. The anticipated tracking errorfor all share classes of the Fund is 1.00%.
Total Net Assets Net Assets per Share31/12/2017 Price (at 31/12/2017)
db x-trackers JPX-Nikkei 400 UCITS ETF (DR) ¥17,464,244,810 ¥1,674.63(Class 1D)
Year to Date Year to DateFund Return Index Return
db x-trackers JPX-Nikkei 400 UCITS ETF (DR) 19.97% 20.22%(Class 1D)
Year to Date Year to DateTracking Error Tracking Difference1
db x-trackers JPX-Nikkei 400 UCITS ETF (DR) 0.07% (0.25)%(Class 1D)
Total Net Assets Net Assets per Share31/12/2017 Price (at 31/12/2017)
db x-trackers JPX-Nikkei 400 UCITS ETF (DR) £17,404,029 £16.21(Class 2D)
Year to Date Year to DateFund Return Index Return
db x-trackers JPX-Nikkei 400 UCITS ETF (DR) 20.02% 20.48%(Class 2D)
Year to Date Year to DateTracking Error Tracking Difference1
db x-trackers JPX-Nikkei 400 UCITS ETF (DR) 0.12% (0.46)%(Class 2D)
CONCEPT FUND SOLUTIONS PLC
326
db x-trackers JPX-Nikkei 400 UCITS ETF (DR)
Investment Manager’s Report for the financial year ended 31 December 2017 cont/d
Fund Performance cont/d
Total Net Assets Net Assets per Share31/12/2017 Price (at 31/12/2017)
db x-trackers JPX-Nikkei 400 UCITS ETF (DR) €107,212,666 €16.63(Class 3C)
Year to Date Year to DateFund Return Index Return
db x-trackers JPX-Nikkei 400 UCITS ETF (DR) 19.24% 19.66%(Class 3C)
Year to Date Year to DateTracking Error Tracking Difference1
db x-trackers JPX-Nikkei 400 UCITS ETF (DR) 0.09% (0.41)%(Class 3C)
Total Net Assets Net Assets per Share31/12/2017 Price (at 31/12/2017)
db x-trackers JPX-Nikkei 400 UCITS ETF (DR) $80,106,151 $17.25(Class 4C)
Year to Date Year to DateFund Return Index Return
db x-trackers JPX-Nikkei 400 UCITS ETF (DR) 21.52% 22.02%(Class 4C)
Year to Date Year to DateTracking Error Tracking Difference1
db x-trackers JPX-Nikkei 400 UCITS ETF (DR) 0.23% (0.49)%(Class 4C)
1The performance difference of the share class arose from various reasons such as inaccuracies in the index replication via optimization,various fee components like management fee, fixed fee and transaction costs, specific taxes respectively tax advantages. The realisedtracking error level is contrasted with the anticipated tracking error level; the level of realised tracking error was within the expected range,due to the effectiveness of replication techniques utilised over the 2017 period.
CONCEPT FUND SOLUTIONS PLC
327
db x-trackers JPX-Nikkei 400 UCITS ETF (DR)
Portfolio of Investments as at 31 December 2017
Transferable Securities
Equities - 98.90% (31 December 2016 - 98.64%)
Number ofShares Security
ValueJPY
% ofFund
Aerospace and Defense17,560 Kawasaki Heavy Industries 69,449,800 0.16
69,449,800 0.16
Agriculture138,876 Japan Tobacco 504,258,756 1.16
504,258,756 1.16
Airlines41,635 ANA Holdings 195,934,310 0.4539,466 Japan Airlines 173,966,128 0.40
Automobiles31,501 Hino Motors 45,991,460 0.11193,290 Honda Motor 746,485,980 1.7165,023 Isuzu Motors 122,698,401 0.2870,337 Mazda Motor 106,314,376 0.24264,051 Nissan Motor 296,661,299 0.6869,633 Subaru 249,495,039 0.5744,485 Suzuki Motor 290,664,990 0.67100,540 Toyota Motor 725,195,020 1.66
2,583,506,565 5.92
Banks13,408 Aozora Bank 58,794,080 0.1479,232 Chiba Bank 74,319,616 0.1720,631 Chugoku Bank 31,090,917 0.07133,684 Concordia Financial Group 90,905,120 0.2146,243 Gunma Bank 31,537,726 0.0731,900 Hiroshima Bank 31,293,900 0.0714,625 Hokuhoku Financial Group 25,769,250 0.0647,724 Kyushu Financial Group 32,547,768 0.08
CONCEPT FUND SOLUTIONS PLC
328
db x-trackers JPX-Nikkei 400 UCITS ETF (DR)
Portfolio of Investments as at 31 December 2017 cont/d
Equities - 98.90% (31 December 2016 - 98.64%) cont/d
Number ofShares Security
ValueJPY
% ofFund
Banks cont/d731,177 Mitsubishi UFJ Financial Group 604,244,673 1.382,883,748 Mizuho Financial Group 590,014,841 1.35241,353 Resona Holdings 162,454,704 0.3781,854 Seven Bank 31,595,644 0.0719,082 Shinsei Bank 37,190,818 0.0957,746 Shizuoka Bank 67,216,344 0.15127,802 Sumitomo Mitsui Financial Group 622,140,136 1.4343,254 Sumitomo Mitsui Trust Holdings 193,475,142 0.4422,878 Suruga Bank 55,296,126 0.133,056 Tokyo TY Financial Group 9,977,840 0.0227,768 Yamaguchi Financial Group 37,181,352 0.09
2,787,045,997 6.39
Beverages47,110 Asahi Group Holdings 263,344,900 0.60107,992 Kirin Holdings 306,751,276 0.7017,234 Suntory Beverage & Food 86,342,340 0.20
Electric Utilities68,264 Chubu Electric Power 95,603,732 0.2217,502 Electric Power Development 53,118,570 0.1290,741 Kansai Electric Power 125,222,580 0.2952,229 Tohoku Electric Power 75,261,989 0.17
Open Forward Foreign Currency Exchange Contracts**
- 0.65% (31 December 2016 - 0.98%)
SettlementDate Amount Bought Amount Sold
UnrealisedgainJPY
% ofFund
05/01/2018 EUR 5,552,303 JPY 738,286,700 12,774,181 0.0305/01/2018 EUR 99,335,333 JPY 13,260,035,200 177,070,135 0.4105/01/2018 GBP 16,965,753 JPY 2,568,696,400 16,668,318 0.0405/01/2018 USD 78,800,269 JPY 8,801,596,100 75,254,075 0.17Unrealised gain on open forward foreign currency exchange contracts 281,766,709 0.65Net unrealised gain on open forward foreign currency exchange contracts 281,766,709 0.65Total OTC Financial Derivative Instruments 281,766,709 0.65
Total Financial Derivative Instruments 283,728,709 0.65
ValueJPY
% ofFund
Total Financial Assets at Fair Value through Profit or Loss 43,445,019,451 99.55Other Net Assets - 0.45% (31 December 2016 - 0.37%) 198,008,447 0.45
Net Assets Attributable to Redeeming Participating Shareholders 43,643,027,898 100.00
* The broker for the open futures contracts is Deutsche Bank AG Frankfurt.** The counterparties for the open forward foreign currency exchange contracts are Barlcays Bank Plc and HSBC Bank Plc.
Analysis of Total Assets % of Total Assets31/12/2017
Transferable securities admitted to an official stock exchange listing 98.87OTC Financial Derivative Instruments 0.64Current Assets 0.49Total Assets 100.00
CONCEPT FUND SOLUTIONS PLC
337
db x-trackers FTSE 100 Equal Weight UCITS ETF (DR)
Investment Manager’s Report for the financial year ended 31 December 2017
Investment Objective
The investment objective of the Fund is to track the performance before fees and expenses of the UnderlyingAsset, which is the FTSE 100 Semi Annual Equal Weighted Index (the “Reference Index”). The ReferenceIndex is an equal weighted index designed to reflect the performance of large UK listed companies that areconstituents of the FTSE 100 Index with each company in the Reference Index at the time of rebalancing beingallocated a fixed weight of 1%. The Reference Index consists of the largest 100 UK companies listed on theLondon Stock Exchange. The companies are selected on the basis that they have the largest combined valueof shares as compared to other companies on the London Stock Exchange.
Fund Performance
The Fund’s performance amounts are calculated net of fees and taxes.
The Fund performed in line with its benchmark and within guided tolerance levels.
The Fund has tracked the Index within its anticipated tracking error. The anticipated tracking error for bothshare classes of the Fund is 1.00%.
Total Net Assets Net Assets per Share31/12/2017 Price (at 31/12/2017)
1The performance difference of the share class arose from various reasons such as inaccuracies in the index replication via optimization,various fee components like management fee, fixed fee and transaction costs, specific taxes respectively tax advantages. The realisedtracking error level is contrasted with the anticipated tracking error level; the level of realised tracking error was within the expected range,due to the effectiveness of replication techniques utilised over the 2017 period.
CONCEPT FUND SOLUTIONS PLC
338
db x-trackers FTSE 100 Equal Weight UCITS ETF (DR)
Portfolio of Investments as at 31 December 2017
Transferable Securities
Equities - 98.71% (31 December 2016 - 99.58%)
Number ofShares Security
ValueGBP
% ofFund
Aerospace and Defense41,528 BAE Systems 237,955 1.0126,270 Rolls-Royce Holdings 222,507 0.94
460,462 1.95
Agriculture4,662 British American Tobacco 233,939 0.997,422 Imperial Tobacco Group 234,981 1.00
468,920 1.99
Airlines16,157 easyJet 236,538 1.0037,082 International Consolidated Airlines Group 241,404 1.03
477,942 2.03
Auto Components73,019 GKN 233,223 0.99
233,223 0.99
Banks116,414 Barclays 236,437 1.0029,897 HSBC Holdings 229,280 0.97337,040 Lloyds Banking Group 229,389 0.9880,346 Royal Bank of Scotland Group 223,362 0.9530,201 Standard Chartered 235,598 1.00
Chemicals5,280 Croda International 233,587 0.997,414 Johnson Matthey 227,981 0.97
461,568 1.96
Commercial Services and Supplies11,735 Ashtead Group 233,761 0.9910,782 Bunzl 223,403 0.9514,517 Experian 237,498 1.0188,576 G4S 236,498 1.004,333 Intertek Group 224,883 0.9612,927 RELX 224,800 0.9570,733 Rentokil Initial 224,931 0.96
1,605,774 6.82
CONCEPT FUND SOLUTIONS PLC
339
db x-trackers FTSE 100 Equal Weight UCITS ETF (DR)
Portfolio of Investments as at 31 December 2017 cont/d
Equities - 98.71% (31 December 2016 - 99.58%) cont/d
Number ofShares Security
ValueGBP
% ofFund
Computers and Peripherals28,391 Just Eat 221,734 0.94
221,734 0.94
Construction and Engineering37,227 Barratt Developments 241,045 1.025,901 Berkeley Group Holdings 247,665 1.058,731 Persimmon 239,055 1.02115,557 Taylor Wimpey 238,509 1.01
966,274 4.10
Containers and Packaging41,744 DS Smith 216,025 0.92
216,025 0.92
Distribution and Wholesale4,225 Ferguson 225,193 0.96
225,193 0.96
Diversified Financials24,709 3i Group 225,717 0.9614,194 Hargreaves Lansdown 255,776 1.085,947 London Stock Exchange Group 225,570 0.966,566 Schroders 230,860 0.9854,176 Worldpay Group 230,790 0.98
1,168,713 4.96
Diversified Telecommunications88,511 BT Group 240,484 1.0299,699 Vodafone Group 234,293 1.00
Gas Utilities159,067 Centrica 218,399 0.9325,687 National Grid 224,787 0.95
443,186 1.88
Health Care Equipment and Supplies17,305 Smith & Nephew 222,888 0.95
222,888 0.95
Health Care Providers and Services42,028 Mediclinic International 272,972 1.16
CONCEPT FUND SOLUTIONS PLC
340
db x-trackers FTSE 100 Equal Weight UCITS ETF (DR)
Portfolio of Investments as at 31 December 2017 cont/d
Equities - 98.71% (31 December 2016 - 99.58%) cont/d
Number ofShares Security
ValueGBP
% ofFund
Health Care Providers and Services cont/d7,847 NMC Health 226,386 0.96
499,358 2.12
Hotels, Restaurants and Leisure5,180 InterContinental Hotels Group 244,444 1.042,671 Paddy Power Betfair 235,716 1.006,251 Whitbread 250,040 1.06
730,200 3.10
Household Products3,468 Reckitt Benckiser Group 239,951 1.02
239,951 1.02
Industrial15,174 Smiths Group 226,093 0.96
226,093 0.96
Insurance11,833 Admiral Group 236,897 1.0144,531 Aviva 225,549 0.9662,273 Direct Line Insurance Group 237,696 1.0184,292 Legal & General Group 230,370 0.98112,838 Old Mutual 261,446 1.1111,842 Prudential 225,649 0.9637,275 RSA Insurance Group 235,764 1.0018,714 St James's Place 229,434 0.9753,092 Standard Life Aberdeen 231,800 0.98
2,114,605 8.98
Leisure Equipment and Products4,655 Carnival 227,723 0.9716,850 TUI 259,490 1.10
Metals and Mining16,457 Anglo American 255,001 1.0824,635 Antofagasta 247,582 1.0516,763 BHP Billiton 255,217 1.0817,436 Fresnillo 249,160 1.0666,086 Glencore 257,735 1.103,279 Randgold Resources 242,974 1.036,432 Rio Tinto 253,550 1.08
1,761,219 7.48
Oil and Gas45,388 BP 237,243 1.013,132 DCC 233,804 0.995,070 Royal Dutch Shell Class A Shares 125,736 0.544,148 Royal Dutch Shell Class B Shares 104,052 0.44
700,835 2.98
CONCEPT FUND SOLUTIONS PLC
341
db x-trackers FTSE 100 Equal Weight UCITS ETF (DR)
Portfolio of Investments as at 31 December 2017 cont/d
Equities - 98.71% (31 December 2016 - 99.58%) cont/d
Number ofShares Security
ValueGBP
% ofFund
Paper and Related Products12,844 Mondi 248,017 1.069,611 Smurfit Kappa Group 240,948 1.02
Real Estate Investment Trust36,335 British Land 251,256 1.0743,990 Hammerson 240,625 1.0224,422 Land Securities Group 246,174 1.0441,280 Segro 242,314 1.03
980,369 4.16
Retail67,227 Kingfisher 227,026 0.9672,736 Marks & Spencer Group 228,973 0.975,037 Next 227,924 0.97
683,923 2.90
Software9,054 Micro Focus International 228,433 0.9729,044 Sage Group 231,771 0.98
460,204 1.95
Textiles and Apparel13,151 Burberry Group 235,666 1.00
235,666 1.00
Water10,674 Severn Trent 230,772 0.9828,045 United Utilities Group 232,633 0.99
463,405 1.97Total Equities 23,246,102 98.71
Exchange Traded Funds - 0.95% (31 December 2016 - 0.00%)
Net unrealised gain on open futures contracts 3,470 0.01Total Exchange Traded Financial Derivative Instruments 3,470 0.01
Total Financial Derivative Instruments 3,470 0.01
ValueGBP
% ofFund
Total Financial Assets at Fair Value through Profit or Loss 23,473,919 99.67Other Net Assets - 0.33% (31 December 2016 - 0.40%) 77,130 0.33
Net Assets Attributable to Redeeming Participating Shareholders 23,551,049 100.00
* The broker for the open futures contracts is Deutsche Bank AG Frankfurt.
Analysis of Total Assets % of Total Assets31/12/2017
Transferable securities admitted to an official stock exchange listing 99.57Exchange Traded Financial Derivatives Instruments 0.02Current Assets 0.41Total Assets 100.00
CONCEPT FUND SOLUTIONS PLC
343
db x-trackers USD Corporate Bond UCITS ETF (DR)
Investment Manager’s Report for the financial year ended 31 December 2017
Investment Objective
The investment objective of the Fund is to track the performance before fees and expenses of the UnderlyingAsset, which is the Barclays USD Liquid Investment Grade Corporate Index (the “Reference Index”). TheReference Index consists of fixed-rate, investment grade, US Dollar denominated securities. The ReferenceIndex includes securities issued by US and non-US-domiciled industrial, utility and financial companies thatmeet specific maturity, credit quality, and liquidity requirements. The Reference Index is a sub-set of theBarclays USD Corporate Index.
Fund Performance
The Fund’s performance amounts are calculated net of fees and taxes.
The Fund performed in line with its benchmark and within guided tolerance levels.
The Fund has tracked the Reference Index within its anticipated tracking error. The anticipated tracking errorfor both share classes of the Fund is 1.00%.
Total Net Assets Net Assets per Share31/12/2017 Price (at 31/12/2017)
db x-trackers USD Corporate Bond UCITS ETF (DR) $615,858,165 $15.10(Class 1D)
Year to Date Year to DateFund Return Index Return
db x-trackers USD Corporate Bond UCITS ETF (DR) 7.13% 7.32%(Class 1D)
Year to Date Year to DateTracking Error Tracking Difference1
db x-trackers USD Corporate Bond UCITS ETF (DR) 0.10% (0.19)%(Class 1D)
Total Net Assets Net Assets per Share31/12/2017 Price (at 31/12/2017)
db x-trackers USD Corporate Bond UCITS ETF (DR) €230,655,498 €14.71(Class 2D EUR Hedged)
Year to Date Year to DateFund Return Index Return
db x-trackers USD Corporate Bond UCITS ETF (DR) 5.03% 5.22%(Class 2D EUR Hedged)
Year to Date Year to DateTracking Error Tracking Difference1
db x-trackers USD Corporate Bond UCITS ETF (DR) 0.19% (0.19)%(Class 2D EUR Hedged)
1The performance difference of the share class arose from various reasons such as inaccuracies in the index replication via optimization,various fee components like management fee, fixed fee and transaction costs, specific taxes respectively tax advantages. The realisedtracking error level is contrasted with the anticipated tracking error level; the level of realised tracking error was within the expected range,due to the effectiveness of replication techniques utilised over the 2017 period.
CONCEPT FUND SOLUTIONS PLC
344
db x-trackers USD Corporate Bond UCITS ETF (DR)
Portfolio of Investments as at 31 December 2017
Transferable Securities
Corporate Bonds - 98.49% (31 December 2016 - 98.48%)
Nominal SecurityCreditRating
Coupon% Maturity
ValueUSD
% ofFund
419,000 21st Century Fox America Baa1 4.50 15/02/2021 444,182 0.05683,000 21st Century Fox America Baa1 3.00 15/09/2022 691,763 0.08500,000 21st Century Fox America Baa1 6.20 15/12/2034 648,910 0.0760,000 21st Century Fox America Baa1 6.40 15/12/2035 80,186 0.01350,000 21st Century Fox America Baa1 6.65 15/11/2037 481,880 0.05700,000 21st Century Fox America Baa1 6.15 15/02/2041 931,028 0.10200,000 3M A1 2.88 15/10/2027 198,696 0.02300,000 ABB Finance A2 4.38 08/05/2042 326,085 0.041,425,000 Abbott Laboratories Baa3 2.90 30/11/2021 1,439,734 0.16400,000 Abbott Laboratories Baa3 2.55 15/03/2022 396,432 0.04209,000 Abbott Laboratories Baa3 3.25 15/04/2023 211,385 0.02235,000 Abbott Laboratories Baa3 2.95 15/03/2025 231,000 0.03790,000 Abbott Laboratories Baa3 4.75 30/11/2036 886,712 0.101,115,000 Abbott Laboratories Baa3 4.90 30/11/2046 1,280,912 0.14165,000 AbbVie Baa2 2.90 06/11/2022 165,464 0.02200,000 AbbVie Baa2 3.20 06/11/2022 203,078 0.02895,000 AbbVie Baa2 2.85 14/05/2023 893,389 0.101,440,000 AbbVie Baa2 3.60 14/05/2025 1,477,483 0.17905,000 AbbVie Baa2 3.20 14/05/2026 902,737 0.10820,000 AbbVie Baa2 4.50 14/05/2035 900,114 0.10435,000 AbbVie Baa2 4.30 14/05/2036 468,151 0.051,100,000 AbbVie Baa2 4.40 06/11/2042 1,179,805 0.13381,000 AbbVie Baa2 4.70 14/05/2045 427,307 0.05660,000 AbbVie Baa2 4.45 14/05/2046 716,364 0.08747,000 Actavis Baa3 3.25 01/10/2022 750,220 0.081,500,000 AerCap Ireland Capital / AerCap Global
Aviation Trust Baa3 3.95 01/02/2022 1,546,500 0.17200,000 AerCap Ireland Capital / AerCap Global
Portfolio of Investments as at 31 December 2017 cont/d
Corporate Bonds - 98.49% (31 December 2016 - 98.48%) cont/d
Nominal SecurityCreditRating
Coupon% Maturity
ValueUSD
% ofFund
200,000 America Movil A3 6.38 01/03/2035 254,550 0.03800,000 America Movil A3 6.13 30/03/2040 1,016,200 0.11200,000 America Movil A3 4.38 16/07/2042 212,340 0.02527,193 American Airlines 2015-1 Class A Pass
Through Trust A2 3.38 01/05/2027 526,502 0.06250,000 American Express A3 2.50 01/08/2022 246,973 0.03400,000 American Express A3 3.00 30/10/2024 398,760 0.04250,000 American Express A3 4.05 03/12/2042 263,700 0.03615,000 American Express Credit A2 2.25 05/05/2021 609,447 0.07700,000 American Express Credit A2 2.70 03/03/2022 702,548 0.081,000,000 American Express Credit A2 3.30 03/05/2027 1,013,690 0.11300,000 American Honda Finance A2 1.70 09/09/2021 292,161 0.03250,000 American International Group Baa1 3.30 01/03/2021 254,948 0.03949,000 American International Group Baa1 4.88 01/06/2022 1,031,525 0.12605,000 American International Group Baa1 6.25 01/05/2036 778,798 0.09420,000 American International Group Baa1 4.50 16/07/2044 454,663 0.05902,000 American International Group Baa1 4.38 15/01/2055 919,030 0.10100,000 American Tower Baa3 3.30 15/02/2021 101,920 0.01600,000 American Tower Baa3 3.50 31/01/2023 612,366 0.07500,000 American Tower Baa3 5.00 15/02/2024 547,820 0.06200,000 American Tower Baa3 4.00 01/06/2025 206,784 0.02250,000 American Tower Baa3 3.38 15/10/2026 245,658 0.03450,000 American Tower Baa3 3.55 15/07/2027 447,912 0.05500,000 American Water Capital A3 3.75 01/09/2047 515,060 0.06200,000 Ameriprise Financial A3 4.00 15/10/2023 212,904 0.02300,000 AmerisourceBergen Baa2 3.45 15/12/2027 297,348 0.03300,000 Amgen Baa1 4.10 15/06/2021 314,157 0.04700,000 Amgen Baa1 1.85 19/08/2021 682,395 0.08390,000 Amgen Baa1 3.88 15/11/2021 407,761 0.05515,000 Amgen Baa1 2.65 11/05/2022 513,367 0.06595,000 Amgen Baa1 3.63 22/05/2024 618,449 0.07500,000 Amgen Baa1 3.13 01/05/2025 502,770 0.06500,000 Amgen Baa1 2.60 19/08/2026 479,345 0.05300,000 Amgen Baa1 3.20 02/11/2027 299,841 0.03290,000 Amgen Baa1 5.15 15/11/2041 348,821 0.04770,000 Amgen Baa1 4.40 01/05/2045 835,134 0.09300,000 Amgen Baa1 4.56 15/06/2048 335,328 0.041,127,000 Amgen Baa1 4.66 15/06/2051 1,260,392 0.14200,000 Anadarko Finance Ba1 7.50 01/05/2031 256,962 0.03500,000 Anadarko Petroleum Ba1 6.45 15/09/2036 612,975 0.07600,000 Anadarko Petroleum Ba1 6.60 15/03/2046 768,780 0.09130,000 Analog Devices Baa1 3.90 15/12/2025 135,649 0.02630,000 Analog Devices Baa1 3.50 05/12/2026 637,516 0.07400,000 Andeavor Baa3 5.13 15/12/2026 439,056 0.05300,000 Andeavor Logistics / Tesoro Logistics
Portfolio of Investments as at 31 December 2017 cont/d
Corporate Bonds - 98.49% (31 December 2016 - 98.48%) cont/d
Nominal SecurityCreditRating
Coupon% Maturity
ValueUSD
% ofFund
300,000 AT&T Baa1 5.55 15/08/2041 325,722 0.04700,000 AT&T Baa1 5.15 15/03/2042 724,367 0.08300,000 AT&T Baa1 4.30 15/12/2042 282,111 0.03840,000 AT&T Baa1 4.80 15/06/2044 827,291 0.09900,000 AT&T Baa1 4.35 15/06/2045 831,267 0.091,132,000 AT&T Baa1 4.75 15/05/2046 1,107,322 0.12600,000 AT&T Baa1 5.15 15/11/2046 612,012 0.07420,000 AT&T Baa1 5.65 15/02/2047 461,769 0.05600,000 AT&T Baa1 5.45 01/03/2047 642,870 0.07672,000 AT&T Baa1 4.50 09/03/2048 628,945 0.07370,000 AT&T Baa1 4.55 09/03/2049 347,830 0.041,515,000 AT&T Baa1 5.15 14/02/2050 1,527,984 0.171,100,000 AT&T Baa1 5.70 01/03/2057 1,202,806 0.13900,000 AT&T Baa1 5.30 14/08/2058 903,609 0.101,150,000 Australia & New Zealand Banking Group Aa3 2.55 23/11/2021 1,144,790 0.13300,000 Australia & New Zealand Banking Group Aa3 2.63 09/11/2022 297,879 0.03500,000 Baidu A3 2.88 06/07/2022 495,460 0.06400,000 Banco Santander Baa1 3.50 11/04/2022 407,728 0.05200,000 Banco Santander Baa1 3.13 23/02/2023 198,904 0.02600,000 Banco Santander Baa1 4.25 11/04/2027 623,130 0.07200,000 Banco Santander Baa1 3.80 23/02/2028 200,312 0.02400,000 Bank of America A3 5.88 05/01/2021 439,056 0.05700,000 Bank of America A3 2.63 19/04/2021 703,549 0.08500,000 Bank of America A3 5.00 13/05/2021 539,635 0.06700,000 Bank of America A3 5.70 24/01/2022 781,816 0.09600,000 Bank of America A3 2.50 21/10/2022 593,562 0.071,000,000 Bank of America A3 3.30 11/01/2023 1,023,220 0.11300,000 Bank of America A3 2.88 24/04/2023 300,540 0.033,000,000 Bank of America A3 4.10 24/07/2023 3,186,960 0.36700,000 Bank of America A3 4.13 22/01/2024 744,541 0.08700,000 Bank of America A3 4.00 01/04/2024 739,319 0.08630,000 Bank of America Baa2 4.20 26/08/2024 664,114 0.07305,000 Bank of America Baa2 4.00 22/01/2025 316,932 0.041,200,000 Bank of America Baa2 3.95 21/04/2025 1,240,404 0.14500,000 Bank of America A3 3.88 01/08/2025 526,295 0.06400,000 Bank of America A3 3.09 01/10/2025 398,512 0.04750,000 Bank of America Baa2 4.45 03/03/2026 800,692 0.09216,000 Bank of America A3 3.50 19/04/2026 221,059 0.02706,000 Bank of America Baa2 4.25 22/10/2026 743,940 0.08250,000 Bank of America A3 3.25 21/10/2027 247,743 0.031,025,000 Bank of America Baa2 4.18 25/11/2027 1,069,926 0.121,200,000 Bank of America A3 3.82 20/01/2028 1,241,268 0.14900,000 Bank of America A3 3.71 24/04/2028 922,896 0.10150,000 Bank of America A3 3.59 21/07/2028 152,523 0.02800,000 Bank of America A1 6.00 15/10/2036 1,042,168 0.12525,000 Bank of America Baa2 6.11 29/01/2037 670,939 0.08600,000 Bank of America A3 4.24 24/04/2038 650,406 0.071,100,000 Bank of America Baa2 7.75 14/05/2038 1,652,321 0.19600,000 Bank of America A3 5.00 21/01/2044 724,980 0.08400,000 Bank of America A3 4.88 01/04/2044 479,472 0.05500,000 Bank of America A3 4.44 20/01/2048 561,200 0.061,100,000 Bank of Montreal A1 1.90 27/08/2021 1,076,933 0.12210,000 Bank of New York Mellon A1 2.50 15/04/2021 210,456 0.02300,000 Bank of New York Mellon A1 2.05 03/05/2021 296,274 0.03600,000 Bank of New York Mellon A1 3.55 23/09/2021 622,488 0.07800,000 Bank of New York Mellon A1 2.60 07/02/2022 800,960 0.09300,000 Bank of New York Mellon A1 2.66 16/05/2023 299,175 0.03600,000 Bank of New York Mellon A1 2.20 16/08/2023 581,472 0.07300,000 Bank of New York Mellon A1 3.00 24/02/2025 300,087 0.03100,000 Bank of New York Mellon A1 2.80 04/05/2026 97,740 0.01500,000 Bank of New York Mellon A1 2.45 17/08/2026 474,615 0.05450,000 Bank of New York Mellon A1 3.44 07/02/2028 459,841 0.05300,000 Bank of Nova Scotia* Baa3 4.65 298,287 0.03500,000 Bank of Nova Scotia A1 2.45 22/03/2021 499,355 0.06700,000 Bank of Nova Scotia A1 2.80 21/07/2021 705,866 0.08300,000 Bank of Nova Scotia A1 2.70 07/03/2022 299,934 0.03450,000 Bank of Nova Scotia A1 2.45 19/09/2022 444,519 0.05350,000 Bank of Nova Scotia Baa2 4.50 16/12/2025 368,218 0.04
CONCEPT FUND SOLUTIONS PLC
348
db x-trackers USD Corporate Bond UCITS ETF (DR)
Portfolio of Investments as at 31 December 2017 cont/d
Corporate Bonds - 98.49% (31 December 2016 - 98.48%) cont/d
Total Financial Derivative Instruments 1,938,542 0.21
CONCEPT FUND SOLUTIONS PLC
367
db x-trackers USD Corporate Bond UCITS ETF (DR)
Portfolio of Investments as at 31 December 2017 cont/dValueUSD
% ofFund
Total Financial Assets at Fair Value through Profit or Loss 881,265,782 98.70Other Net Assets - 1.30% (31 December 2016 - 1.73%) 11,563,554 1.30
Net Assets Attributable to Redeeming Participating Shareholders 892,829,336 100.00
* These are perpetual bonds which have no maturity date.* The counterparties for the open forward foreign currency exchange contracts are Barclays Bank Plc, HSBC Bank Plc, Merrill Lynch
International Ltd and Morgan Stanley & Co International Plc.
Analysis of Total Assets % of Total Assets31/12/2017
Transferable securities admitted to an official stock exchange listing and transferable securities dealtin another regulated market 90.60OTC Financial Derivative Instruments 0.24Current Assets 9.16Total Assets 100.00
CONCEPT FUND SOLUTIONS PLC
368
db x-trackers iBoxx Eurozone Sovereigns Quality Weighted UCITS ETF (DR)
Investment Manager’s Report for the financial year ended 31 December 2017
Investment Objective
The investment objective of the Fund is to track the performance before fees and expenses of the UnderlyingAsset, which is the Markit iBoxx EUR Eurozone Sovereigns Quality Weighted Index (the “Reference Index”).The Reference Index consists of EUR denominated investment grade sovereign bonds issued by Eurozonecountries. The Reference Index aims to offer a targeted coverage of the EUR denominated sovereign bonduniverse with adjusted weights, by allocating higher weights to countries with relatively solid fundamentals andreducing weights of countries with relatively weak fundamentals.
Fund Performance
The Fund’s performance amounts are calculated net of fees and taxes.
The Fund performed in line with its benchmark and within guided tolerance levels.
The Fund has tracked the Reference Index within its anticipated tracking error. The anticipated tracking errorfor the Fund is 1.00%.
Total Net Assets Net Assets per Share31/12/2017 Price (at 31/12/2017)
1The performance difference of the share class arose from various reasons such as inaccuracies in the index replication via optimization,various fee components like management fee, fixed fee and transaction costs, specific taxes respectively tax advantages. The realisedtracking error level is contrasted with the anticipated tracking error level; the level of realised tracking error was within the expected range,due to the effectiveness of replication techniques utilised over the 2017 period.
CONCEPT FUND SOLUTIONS PLC
369
db x-trackers iBoxx Eurozone Sovereigns Quality Weighted UCITS ETF (DR)
Portfolio of Investments as at 31 December 2017
Transferable Securities
Government Bonds - 98.71% (31 December 2016 - 98.61%)
Nominal SecurityCreditRating
Coupon% Maturity
ValueEUR
% ofFund
55,000 Austria (Republic of) Aa1 4.35 15/03/2019 58,251 0.2243,000 Austria (Republic of) Aa1 1.95 18/06/2019 44,572 0.1650,000 Austria (Republic of) Aa1 0.25 18/10/2019 50,687 0.1985,000 Austria (Republic of) Aa1 3.90 15/07/2020 94,449 0.3590,000 Austria (Republic of) Aa1 3.50 15/09/2021 102,876 0.3856,000 Austria (Republic of) Aa1 3.65 20/04/2022 65,293 0.2428,000 Austria (Republic of) Aa1 0.00 20/09/2022 28,200 0.1063,000 Austria (Republic of) Aa1 3.40 22/11/2022 73,874 0.2730,000 Austria (Republic of) Aa1 0.00 15/07/2023 29,936 0.1170,000 Austria (Republic of) Aa1 1.75 20/10/2023 76,972 0.2860,000 Austria (Republic of) Aa1 1.65 21/10/2024 66,015 0.2466,000 Austria (Republic of) Aa1 1.20 20/10/2025 70,445 0.2640,000 Austria (Republic of) Aa1 4.85 15/03/2026 54,770 0.2067,000 Austria (Republic of) Aa1 0.75 20/10/2026 68,538 0.2545,000 Austria (Republic of) Aa1 0.50 20/04/2027 44,691 0.1752,000 Austria (Republic of) Aa1 6.25 15/07/2027 80,064 0.3040,000 Austria (Republic of) Aa1 2.40 23/05/2034 47,992 0.1874,000 Austria (Republic of) Aa1 4.15 15/03/2037 112,450 0.4237,000 Austria (Republic of) Aa1 3.15 20/06/2044 51,724 0.1926,000 Austria (Republic of) Aa1 1.50 20/02/2047 26,232 0.1021,000 Austria (Republic of) Aa1 3.80 26/01/2062 35,573 0.1317,000 Austria (Republic of) Aa1 1.50 02/11/2086 15,037 0.0620,000 Austria (Republic of) Aa1 2.10 20/09/2117 21,586 0.0827,000 Finland (Government of) Aa1 4.38 04/07/2019 29,034 0.1160,000 Finland (Government of) Aa1 3.38 15/04/2020 65,292 0.2430,000 Finland (Government of) Aa1 0.38 15/09/2020 30,666 0.1132,000 Finland (Government of) Aa1 3.50 15/04/2021 36,047 0.1320,000 Finland (Government of) Aa1 0.00 15/04/2022 20,146 0.0728,000 Finland (Government of) Aa1 1.63 15/09/2022 30,345 0.1153,000 Finland (Government of) Aa1 1.50 15/04/2023 57,291 0.2120,000 Finland (Government of) Aa1 2.00 15/04/2024 22,339 0.0865,000 Finland (Government of) Aa1 0.88 15/09/2025 67,767 0.2530,000 Finland (Government of) Aa1 0.50 15/04/2026 30,257 0.1120,000 Finland (Government of) Aa1 0.50 15/09/2027 19,812 0.0730,000 Finland (Government of) Aa1 2.75 04/07/2028 36,439 0.1328,000 Finland (Government of) Aa1 0.75 15/04/2031 27,563 0.1024,000 Finland (Government of) Aa1 2.63 04/07/2042 31,444 0.129,000 Finland (Government of) Aa1 1.38 15/04/2047 9,054 0.03170,722 France (Republic of) Aa2 0.00 25/02/2019 171,956 0.6445,218 France (Republic of) Aa2 4.25 25/04/2019 48,117 0.1866,090 France (Republic of) Aa2 1.00 25/05/2019 67,556 0.25259,669 France (Republic of) Aa2 8.50 25/10/2019 302,453 1.1250,000 France (Republic of) Aa2 0.50 25/11/2019 50,979 0.19100,000 France (Republic of) Aa2 0.00 25/02/2020 101,028 0.37194,000 France (Republic of) Aa2 3.50 25/04/2020 211,900 0.7875,361 France (Republic of) Aa2 0.00 25/05/2020 76,197 0.28153,000 France (Republic of) Aa2 2.50 25/10/2020 165,613 0.6180,000 France (Republic of) Aa2 0.25 25/11/2020 81,462 0.30131,594 France (Republic of) Aa2 3.75 25/04/2021 149,585 0.55170,000 France (Republic of) Aa2 0.00 25/05/2021 171,734 0.63155,361 France (Republic of) Aa2 3.25 25/10/2021 176,381 0.65211,158 France (Republic of) Aa2 3.00 25/04/2022 240,431 0.89112,000 France (Republic of) Aa2 0.00 25/05/2022 112,710 0.42136,361 France (Republic of) Aa2 2.25 25/10/2022 151,884 0.5630,000 France (Republic of) Aa2 0.00 25/03/2023 30,006 0.1142,722 France (Republic of) Aa2 8.50 25/04/2023 62,117 0.23148,000 France (Republic of) Aa2 1.75 25/05/2023 162,148 0.60186,090 France (Republic of) Aa2 4.25 25/10/2023 231,913 0.86139,000 France (Republic of) Aa2 2.25 25/05/2024 157,863 0.58150,872 France (Republic of) Aa2 1.75 25/11/2024 166,812 0.62140,293 France (Republic of) Aa2 0.50 25/05/2025 142,483 0.53105,872 France (Republic of) Aa2 6.00 25/10/2025 152,815 0.57130,143 France (Republic of) Aa2 1.00 25/11/2025 136,541 0.50150,000 France (Republic of) Aa2 3.50 25/04/2026 188,390 0.70115,331 France (Republic of) Aa2 0.50 25/05/2026 115,806 0.43125,000 France (Republic of) Aa2 0.25 25/11/2026 121,793 0.45
CONCEPT FUND SOLUTIONS PLC
370
db x-trackers iBoxx Eurozone Sovereigns Quality Weighted UCITS ETF (DR)
Portfolio of Investments as at 31 December 2017 cont/d
Government Bonds - 98.71% (31 December 2016 - 98.61%) cont/d
Total Financial Assets at Fair Value through Profit or Loss 26,684,507 98.71Other Net Assets - 1.29% (31 December 2016 - 1.39%) 348,210 1.29
Net Assets Attributable to Redeeming Participating Shareholders 27,032,717 100.00
Analysis of Total Assets % of Total Assets31/12/2017
Transferable securities admitted to an official stock exchange listing and transferable securities dealtin another regulated market 98.69Current Assets 1.31Total Assets 100.00
CONCEPT FUND SOLUTIONS PLC
374
db x-trackers MSCI World Health Care Index UCITS ETF (DR)
Investment Manager’s Report for the financial year ended 31 December 2017
Investment Objective
The investment objective of the Fund is to track the performance before fees and expenses of the UnderlyingAsset, which is the MSCI World Health Care Total Return Net Index (the “Reference Index”). The ReferenceIndex is designed to reflect the performance of the shares of certain companies in various developed markets.The shares are issued by companies in the health care sector.
Fund Performance
The Fund’s performance amounts are calculated net of fees and taxes.
The Fund performed in line with its benchmark and within guided tolerance levels.
Total Net Assets Net Assets per Share31/12/2017 Price (at 31/12/2017)
db x-trackers MSCI World Health Care Index UCITS ETF(DR) $252,426,478 $30.07
Year to Date Year to DateFund Return Index Return
db x-trackers MSCI World Health Care Index UCITS ETF(DR) 19.65% 19.80%
Year to Date Year to DateTracking Error Tracking Difference1
db x-trackers MSCI World Health Care Index UCITS ETF(DR) 0.04% (0.15)%
1The performance difference of the share class arose from various reasons such as inaccuracies in the index replication via optimization,various fee components like management fee, fixed fee and transaction costs, specific taxes respectively tax advantages. The realisedtracking error level is contrasted with the anticipated tracking error level; the level of realised tracking error was within the expected range,due to the effectiveness of replication techniques utilised over the 2017 period.
CONCEPT FUND SOLUTIONS PLC
375
db x-trackers MSCI World Health Care Index UCITS ETF (DR)
Software15,732 Cerner 1,060,179 0.425,734 Veeva Systems 316,976 0.13
1,377,155 0.55Total Equities 250,572,238 99.26
Exchange Traded Funds - 0.39% (31 December 2016 - 0.00%)
30,000 db x-trackers MSCI USA Health Care Index UCITS ETF (DR) 982,167 0.39Total Exchange Traded Funds 982,167 0.39Total Transferable Securities 251,554,405 99.65
Total Financial Assets at Fair Value through Profit or Loss 251,554,405 99.65Other Net Assets - 0.35% (31 December 2016 - 0.05%) 872,073 0.35
Net Assets Attributable to Redeeming Participating Shareholders 252,426,478 100.00
Analysis of Total Assets % of Total Assets31/12/2017
Transferable securities admitted to an official stock exchange listing 99.24Exchange Traded Funds 0.39Current Assets 0.37Total Assets 100.00
CONCEPT FUND SOLUTIONS PLC
378
db x-trackers MSCI World Financials Index UCITS ETF (DR)
Investment Manager’s Report for the financial year ended 31 December 2017
Investment Objective
The investment objective of the Fund is to track the performance before fees and expenses of the UnderlyingAsset, which is the MSCI World Financials Total Return Net Index (the “Reference Index”). The ReferenceIndex is designed to reflect the performance of the shares of certain companies in various developed markets.The shares are issued by companies in the financials sector.
Fund Performance
The Fund’s performance amounts are calculated net of fees and taxes.
The Fund performed in line with its benchmark and within guided tolerance levels.
Total Net Assets Net Assets per Share31/12/2017 Price (at 31/12/2017)
db x-trackers MSCI World Financials Index UCITS ETF(DR) $437,061,336 $19.81
Year to Date Year to DateFund Return Index Return
db x-trackers MSCI World Financials Index UCITS ETF(DR) 22.66% 22.74%
Year to Date Year to DateTracking Error Tracking Difference1
db x-trackers MSCI World Financials Index UCITS ETF(DR) 0.04% (0.08)%
1The performance difference of the share class arose from various reasons such as inaccuracies in the index replication via optimization,various fee components like management fee, fixed fee and transaction costs, specific taxes respectively tax advantages. The realisedtracking error level is contrasted with the anticipated tracking error level; the level of realised tracking error was within the expected range,due to the effectiveness of replication techniques utilised over the 2017 period.
CONCEPT FUND SOLUTIONS PLC
379
db x-trackers MSCI World Financials Index UCITS ETF (DR)
Portfolio of Investments as at 31 December 2017
Transferable Securities
Equities - 99.68% (31 December 2016 - 99.92%)
Number ofShares Security
ValueUSD
% ofFund
Banks25,235 ABN Amro Group 815,129 0.1949,346 AIB Group 325,901 0.077,043 Aozora Bank 274,155 0.06175,244 Australia & New Zealand Banking Group 3,939,309 0.90397,805 Banco Bilbao Vizcaya Argentaria 3,397,291 0.78318,306 Banco de Sabadell 632,959 0.14963,474 Banco Santander 6,338,873 1.4563,536 Bank Hapoalim 468,332 0.1186,346 Bank Leumi Le-Israel 521,561 0.12595,082 Bank of America 17,566,821 4.0273,370 Bank of East Asia 317,702 0.0755,355 Bank of Ireland Group 471,607 0.113,602 Bank of Kyoto 187,694 0.0438,705 Bank of Montreal 3,107,335 0.7161,305 Bank of New York Mellon 3,301,887 0.7671,475 Bank of Nova Scotia 4,627,521 1.0623,315 Bank of Queensland 231,960 0.0559,976 Bankia 287,141 0.0740,126 Bankinter 380,841 0.091,018,426 Barclays 2,798,059 0.6447,951 BB&T 2,384,124 0.5528,414 Bendigo & Adelaide Bank 259,354 0.0667,143 BNP Paribas 5,018,927 1.15220,768 BOC Hong Kong Holdings 1,118,342 0.26214,111 CaixaBank 999,880 0.2326,012 Canadian Imperial Bank of Commerce 2,544,005 0.5828,699 Capital One Financial 2,857,846 0.6541,669 Chiba Bank 346,964 0.088,044 CIT Group 396,006 0.09161,800 Citigroup 12,039,538 2.7529,713 Citizens Financial Group 1,247,352 0.2810,435 Comerica 905,862 0.2163,508 Commerzbank 953,637 0.22103,468 Commonwealth Bank of Australia 6,501,716 1.4972,977 Concordia Financial Group 440,518 0.1067,919 Credit Agricole 1,125,489 0.26144,846 Credit Suisse Group 2,586,270 0.5944,712 Danske Bank 1,742,213 0.40107,018 DBS Group Holdings 1,989,971 0.45123,599 Deutsche Bank 2,356,131 0.5458,306 DNB 1,084,236 0.258,574 East West Bancorp 521,556 0.1217,951 Erste Group Bank 778,264 0.1843,724 Fifth Third Bancorp 1,326,586 0.309,358 First Republic Bank 810,777 0.1946,030 Fukuoka Financial Group 258,651 0.0621,798 Goldman Sachs Group 5,553,258 1.2724,324 Hachijuni Bank 139,704 0.0345,484 Hang Seng Bank 1,128,765 0.261,200,273 HSBC Holdings 12,451,918 2.8564,668 Huntington Bancshares 941,566 0.22231,801 ING Groep 4,265,663 0.98804,263 Intesa Sanpaolo 2,675,153 0.6139,764 Investec 287,780 0.0724,094 Japan Post Bank 313,767 0.07208,923 JPMorgan Chase & Co 22,342,226 5.1114,964 KBC Group 1,277,760 0.2964,535 KeyCorp 1,301,671 0.3020,674 Kyushu Financial Group 125,163 0.03
CONCEPT FUND SOLUTIONS PLC
380
db x-trackers MSCI World Financials Index UCITS ETF (DR)
Portfolio of Investments as at 31 December 2017 cont/d
Equities - 99.68% (31 December 2016 - 99.92%) cont/d
Number ofShares Security
ValueUSD
% ofFund
Banks cont/d4,299,410 Lloyds Banking Group 3,958,387 0.918,113 M&T Bank 1,387,242 0.3219,290 Macquarie Group 1,503,185 0.3434,171 Mediobanca 388,168 0.09711,469 Mitsubishi UFJ Financial Group 5,219,334 1.198,295 Mizrahi Tefahot Bank 153,277 0.031,439,001 Mizuho Financial Group 2,613,578 0.6081,734 Morgan Stanley 4,288,583 0.98160,131 National Australia Bank 3,703,538 0.8520,357 National Bank of Canada 1,019,028 0.2356,153 Natixis 444,759 0.1028,948 New York Community Bancorp 376,903 0.09181,222 Nordea Bank 2,197,905 0.5012,878 Northern Trust 1,286,383 0.29187,790 Oversea-Chinese Banking 1,741,034 0.4020,443 People's United Financial 382,284 0.0928,435 PNC Financial Services Group 4,102,886 0.948,813 Raiffeisen Bank International 319,596 0.0770,914 Regions Financial 1,225,394 0.28131,724 Resona Holdings 787,070 0.1887,091 Royal Bank of Canada 7,135,074 1.63213,072 Royal Bank of Scotland Group 801,288 0.1835,443 Seven Bank 121,447 0.039,820 Shinsei Bank 169,900 0.0430,703 Shizuoka Bank 317,251 0.073,256 Signature Bank 446,919 0.1090,623 Skandinaviska Enskilda Banken 1,065,892 0.2445,777 Societe Generale 2,366,417 0.54196,374 Standard Chartered 2,072,296 0.4722,190 State Street 2,165,966 0.5080,164 Sumitomo Mitsui Financial Group 3,464,166 0.7919,795 Sumitomo Mitsui Trust Holdings 786,001 0.1828,478 SunTrust Banks 1,839,394 0.4210,353 Suruga Bank 222,132 0.053,128 SVB Financial Group 731,233 0.1791,142 Svenska Handelsbanken 1,248,993 0.2954,030 Swedbank 1,305,959 0.30110,133 Toronto-Dominion Bank 6,473,758 1.48218,324 UBS Group 4,019,223 0.92119,499 UniCredit 2,235,643 0.5180,121 United Overseas Bank 1,585,753 0.3699,262 US Bancorp 5,318,458 1.22279,993 Wells Fargo & Co 16,987,175 3.89202,434 Westpac Banking 4,963,764 1.1411,794 Yamaguchi Financial Group 140,188 0.0311,986 Zions Bancorporation 609,248 0.14
261,082,759 59.74
Commercial Services and Supplies23,138 Element Fleet Management 175,435 0.0410,202 Moody's 1,505,917 0.3515,249 S&P Global Futures 2,583,181 0.59
4,264,533 0.98
Computers and Peripherals12,025 SBI Holdings 251,495 0.06
251,495 0.06
Diversified Financials58,038 3i Group 717,197 0.16
CONCEPT FUND SOLUTIONS PLC
381
db x-trackers MSCI World Financials Index UCITS ETF (DR)
Portfolio of Investments as at 31 December 2017 cont/d
Equities - 99.68% (31 December 2016 - 99.92%) cont/d
Number ofShares Security
ValueUSD
% ofFund
Diversified Financials cont/d23,739 Acom 100,098 0.026,709 AEON Financial Service 156,275 0.043,321 Affiliated Managers Group 681,635 0.1626,701 Ally Financial 778,601 0.1844,589 American Express 4,428,134 1.018,900 Ameriprise Financial 1,508,283 0.353,661 Amundi 310,587 0.0711,549 ASX 495,553 0.117,163 BlackRock 3,679,705 0.8450,139 Brookfield Asset Management 2,189,717 0.506,021 Cboe Global Markets 750,156 0.1771,503 Charles Schwab 3,673,109 0.8415,436 CI Financial 366,758 0.0820,169 CME Group 2,945,682 0.679,379 Credit Saison 170,679 0.0496,314 Daiwa Securities Group 604,389 0.1411,516 Deutsche Boerse 1,338,591 0.3122,098 Discover Financial Services 1,699,778 0.3916,300 E*TRADE Financial 807,991 0.186,892 Eaton Vance 388,640 0.092,588 Eurazeo 239,291 0.056,472 EXOR 397,128 0.0915,376 FNF 603,354 0.1419,857 Franklin Resources 860,404 0.204,811 Groupe Bruxelles Lambert 519,877 0.1215,523 Hargreaves Lansdown 378,397 0.0969,763 Hong Kong Exchanges & Clearing 2,140,019 0.495,013 IGM Financial 176,642 0.0434,920 Intercontinental Exchange 2,463,955 0.5624,141 Invesco 882,112 0.2027,174 Investor 1,241,624 0.2831,121 Japan Exchange Group 541,751 0.1213,353 Julius Baer Group 816,664 0.1913,980 Kinnevik 473,484 0.112,264 L E Lundbergforetagen 169,506 0.0418,658 London Stock Exchange Group 957,338 0.2259,616 Mebuki Financial Group 252,435 0.0626,644 Mitsubishi UFJ Lease & Finance 158,705 0.046,924 Nasdaq 531,971 0.12216,652 Nomura Holdings 1,279,141 0.294,854 Onex 357,149 0.0878,998 ORIX 1,335,568 0.312,364 Pargesa Holding 204,985 0.051,033 Partners Group Holding 708,101 0.167,699 Raymond James Financial 687,521 0.167,526 Schroders 357,957 0.087,977 SEI Investments 573,227 0.1348,189 Singapore Exchange 268,278 0.0647,202 Synchrony Financial 1,822,469 0.4214,260 T Rowe Price Group 1,496,302 0.3415,142 TD Ameritrade Holding 774,210 0.18
51,461,123 11.77
Food Products129,200 First Pacific 87,595 0.02
87,595 0.02
Hotels, Restaurants and Leisure248,401 Golden Resorts Group 238,318 0.05
238,318 0.05
CONCEPT FUND SOLUTIONS PLC
382
db x-trackers MSCI World Financials Index UCITS ETF (DR)
Portfolio of Investments as at 31 December 2017 cont/d
Equities - 99.68% (31 December 2016 - 99.92%) cont/d
Total Financial Assets at Fair Value through Profit or Loss 437,006,105 99.99Other Net Assets - 0.01% (31 December 2016 - 0.04%) 55,231 0.01
Net Assets Attributable to Redeeming Participating Shareholders 437,061,336 100.00
Analysis of Total Assets % of Total Assets31/12/2017
Transferable securities admitted to an official stock exchange listing 98.08Exchange Traded Funds 0.26Current Assets 1.66Total Assets 100.00
CONCEPT FUND SOLUTIONS PLC
385
db x-trackers MSCI World Energy Index UCITS ETF (DR)
Investment Manager’s Report for the financial year ended 31 December 2017
Investment Objective
The investment objective of the Fund is to track the performance before fees and expenses of the UnderlyingAsset, which is the MSCI World Energy Total Return Net Index (the “Reference Index”). The Reference Indexis designed to reflect the performance of the shares of certain companies in various developed markets. Theshares are issued by companies in the energy sector.
Fund Performance
The Fund’s performance amounts are calculated net of fees and taxes.
The Fund performed in line with its benchmark and within guided tolerance levels.
Total Net Assets Net Assets per Share31/12/2017 Price (at 31/12/2017)
db x-trackers MSCI World Energy Index UCITS ETF (DR) $350,740,857 $34.14
Year to Date Year to DateFund Return Index Return
db x-trackers MSCI World Energy Index UCITS ETF (DR) 5.11% 4.97%
Year to Date Year to DateTracking Error Tracking Difference1
db x-trackers MSCI World Energy Index UCITS ETF (DR) 0.13% 0.14%
1The performance difference of the share class arose from various reasons such as inaccuracies in the index replication via optimization,various fee components like management fee, fixed fee and transaction costs, specific taxes respectively tax advantages. The realisedtracking error level is contrasted with the anticipated tracking error level; the level of realised tracking error was within the expected range,due to the effectiveness of replication techniques utilised over the 2017 period.
CONCEPT FUND SOLUTIONS PLC
386
db x-trackers MSCI World Energy Index UCITS ETF (DR)
Portfolio of Investments as at 31 December 2017
Transferable Securities
Equities - 99.64% (31 December 2016 - 99.94%)
Number ofShares Security
ValueUSD
% ofFund
Electric Utilities240,598 Origin Energy 1,772,691 0.51
1,772,691 0.51
Gas Utilities31,048 Enagas 889,932 0.25311,863 Snam 1,527,899 0.44
2,417,831 0.69
Metals and Mining54,185 Cameco 502,085 0.1464,645 Tenaris 1,021,555 0.29
1,523,640 0.43
Oil and Gas23,490 AltaGas 536,561 0.1576,367 Anadarko Petroleum 4,096,326 1.1720,314 Andeavor 2,322,703 0.6630,062 Antero Resources 571,178 0.1651,916 Apache 2,191,894 0.6348,411 ARC Resources 569,905 0.1655,416 Baker Hughes 1,753,362 0.502,708,642 BP 19,152,329 5.4663,030 Cabot Oil & Gas 1,802,658 0.5135,706 Caltex Australia 950,930 0.27149,899 Canadian Natural Resources 5,374,088 1.53142,988 Cenovus Energy 1,310,110 0.3727,518 Cheniere Energy 1,481,569 0.42258,355 Chevron 32,343,462 9.2212,968 Cimarex Energy 1,582,226 0.4520,265 Concho Resources 3,044,208 0.87165,969 ConocoPhillips 9,110,038 2.6012,770 Continental Resources 676,427 0.1974,605 Crescent Point Energy 570,427 0.1668,051 Devon Energy 2,817,311 0.8012,024 Diamondback Energy 1,518,030 0.43225,740 Enbridge 8,857,000 2.53133,370 Encana 1,785,079 0.51349,009 Eni 5,783,443 1.6578,755 EOG Resources 8,498,452 2.4234,444 EQT 1,960,552 0.56577,641 Exxon Mobil 48,313,893 13.7868,624 Galp Energia SGPS 1,262,837 0.36118,787 Halliburton 5,805,121 1.6614,780 Helmerich & Payne 955,379 0.2738,985 Hess 1,850,618 0.5322,925 HollyFrontier 1,174,218 0.3448,176 Husky Energy 682,489 0.2018,510 Idemitsu Kosan 743,522 0.2140,456 Imperial Oil 1,266,682 0.36130,125 Inpex 1,627,573 0.4651,275 Inter Pipeline 1,065,237 0.3092,499 John Wood Group 813,332 0.23422,633 JXTG Holdings 2,727,512 0.7827,493 Keyera 777,207 0.22273,921 Kinder Morgan 4,949,752 1.419,625 Koninklijke Vopak 422,665 0.1225,628 Lundin Petroleum 587,840 0.17115,820 Marathon Oil 1,960,833 0.56
CONCEPT FUND SOLUTIONS PLC
387
db x-trackers MSCI World Energy Index UCITS ETF (DR)
Portfolio of Investments as at 31 December 2017 cont/d
Equities - 99.64% (31 December 2016 - 99.94%) cont/d
Number ofShares Security
ValueUSD
% ofFund
Oil and Gas cont/d68,995 Marathon Petroleum 4,552,290 1.3051,794 National Oilwell Varco 1,865,620 0.5317,550 Neste 1,124,300 0.3227,131 Newfield Exploration 855,440 0.2462,993 Noble Energy 1,835,616 0.52104,281 Occidental Petroleum 7,681,338 2.19187,729 Oil Search 1,143,823 0.3320,162 OMV 1,279,043 0.3751,790 ONEOK 2,768,175 0.7930,340 Parsley Energy 893,210 0.2668,870 Pembina Pipeline 2,501,515 0.7159,309 Phillips 66 5,999,105 1.7123,182 Pioneer Natural Resources 4,007,009 1.1419,849 Plains GP Holdings 435,686 0.1229,129 PrairieSky Royalty 745,342 0.2133,776 Range Resources 576,219 0.17167,345 Repsol 2,962,977 0.85618,521 Royal Dutch Shell Class A Shares 20,750,263 5.92513,622 Royal Dutch Shell Class B Shares 17,429,110 4.97256,675 Santos 1,094,133 0.31189,480 Schlumberger 12,769,057 3.6433,964 Seven Generations Energy 481,966 0.1425,796 Showa Shell Sekiyu 350,358 0.10157,738 Statoil 3,378,716 0.96227,614 Suncor Energy 8,383,723 2.3929,350 Targa Resources 1,421,127 0.4160,492 TechnipFMC 1,894,005 0.54325,770 Total 18,012,099 5.1431,392 Tourmaline Oil 570,741 0.16119,494 TransCanada 5,834,744 1.6660,193 Valero Energy 5,532,339 1.5815,728 Vermilion Energy 573,411 0.16112,662 Williams 3,435,064 0.98115,464 Woodside Petroleum 2,987,461 0.85
343,772,003 98.01Total Equities 349,486,165 99.64
Exchange Traded Funds - 0.32% (31 December 2016 - 0.00%)
30,000 db x-trackers MSCI USA Energy Index UCITS ETF (DR) 1,118,160 0.32Total Exchange Traded Funds 1,118,160 0.32
Rights - 0.02% (31 December 2016 - 0.02%)
Oil and Gas172,495 Repsol 78,503 0.02
78,503 0.02Total Rights 78,503 0.02Total Transferable Securities 350,682,828 99.98
CONCEPT FUND SOLUTIONS PLC
388
db x-trackers MSCI World Energy Index UCITS ETF (DR)
Portfolio of Investments as at 31 December 2017 cont/d
Financial Derivative Instruments - 0.00% (31 December 2016 - 0.00%)
05/01/2018 USD 41,867 JPY 4,725,521 (82) 0.00Unrealised loss on open forward foreign currency exchange contracts (82) 0.00Net unrealised loss on open forward foreign currency exchange contracts (82) 0.00Total OTC Financial Derivative Instruments (82) 0.00
Total Financial Derivative Instruments (82) 0.00
ValueUSD
% ofFund
Total Financial Assets at Fair Value through Profit or Loss 350,682,746 99.98Other Net Assets - 0.02% (31 December 2016 - 0.04%) 58,111 0.02
Net Assets Attributable to Redeeming Participating Shareholders 350,740,857 100.00
* The counterparty for the open forward foreign currency exchange contracts is Deutsche Bank AG Frankfurt.
Analysis of Total Assets % of Total Assets31/12/2017
Transferable securities admitted to an official stock exchange listing 98.00Exchange Traded Funds 0.31Current Assets 1.69Total Assets 100.00
CONCEPT FUND SOLUTIONS PLC
389
db x-trackers MSCI World Consumer Staples Index UCITS ETF (DR)
Investment Manager’s Report for the financial year ended 31 December 2017
Investment Objective
The investment objective of the Fund is to track the performance before fees and expenses of the UnderlyingAsset, which is the MSCI World Consumer Staples Total Return Net Index (the “Reference Index”). TheReference Index is designed to reflect the performance of the shares of certain companies in variousdeveloped markets. The shares are issued by companies in the consumer staples sector. The consumerstaples sector covers, for example, food, food retailing, and household and personal products.
Fund Performance
The Fund’s performance amounts are calculated net of fees and taxes.
The Fund performed in line with its benchmark and within guided tolerance levels.
Total Net Assets Net Assets per Share31/12/2017 Price (at 31/12/2017)
db x-trackers MSCI World Consumer Staples Index UCITSETF (DR) $151,119,611 $34.49
Year to Date Year to DateFund Return Index Return
db x-trackers MSCI World Consumer Staples Index UCITSETF (DR) 17.06% 17.04%
Year to Date Year to DateTracking Error Tracking Difference1
db x-trackers MSCI World Consumer Staples Index UCITSETF (DR) 0.06% 0.03%
1The performance difference of the share class arose from various reasons such as inaccuracies in the index replication via optimization,various fee components like management fee, fixed fee and transaction costs, specific taxes respectively tax advantages. The realisedtracking error level is contrasted with the anticipated tracking error level; the level of realised tracking error was within the expected range,due to the effectiveness of replication techniques utilised over the 2017 period.
CONCEPT FUND SOLUTIONS PLC
390
db x-trackers MSCI World Consumer Staples Index UCITS ETF (DR)
Portfolio of Investments as at 31 December 2017
Transferable Securities
Equities - 98.67% (31 December 2016 - 99.35%)
Number ofShares Security
ValueUSD
% ofFund
Agriculture78,316 Altria Group 5,592,546 3.7022,917 Archer-Daniels-Midland 918,513 0.6194,823 British American Tobacco 6,436,679 4.265,727 Bunge 384,167 0.25298,274 Golden Agri-Resources 82,581 0.0639,599 Imperial Tobacco Group 1,695,948 1.1245,532 Japan Tobacco 1,467,614 0.9763,397 Philip Morris International 6,697,893 4.437,502 Swedish Match 296,140 0.20
Total Financial Assets at Fair Value through Profit or Loss 151,099,594 99.99Other Net Assets - 0.01% (31 December 2016 - 0.00%) 20,017 0.01
Net Assets Attributable to Redeeming Participating Shareholders 151,119,611 100.00
Analysis of Total Assets % of Total Assets31/12/2017
Transferable securities admitted to an official stock exchange listing 99.08Exchange Traded Funds 0.67Current Assets 0.25Total Assets 100.00
CONCEPT FUND SOLUTIONS PLC
393
db x-trackers MSCI World Information Technology Index UCITS ETF (DR)
Investment Manager’s Report for the financial year ended 31 December 2017
Investment Objective
The investment objective of the Fund is to track the performance before fees and expenses of the UnderlyingAsset, which is the MSCI World Information Technology Total Return Net Index (the “Reference Index”). TheReference Index is designed to reflect the performance of the shares of certain companies in variousdeveloped markets. The shares are issued by companies in the information technology sector.
Fund Performance
The Fund’s performance amounts are calculated net of fees and taxes.
The Fund performed in line with its benchmark and within guided tolerance levels.
Total Net Assets Net Assets per Share31/12/2017 Price (at 31/12/2017)
db x-trackers MSCI World Information Technology IndexUCITS ETF (DR) $237,633,853 $25.32
Year to Date Year to DateFund Return Index Return
db x-trackers MSCI World Information Technology IndexUCITS ETF (DR) 38.00% 38.23%
Year to Date Year to DateTracking Error Tracking Difference1
db x-trackers MSCI World Information Technology IndexUCITS ETF (DR) 0.03% (0.23)%
1The performance difference of the share class arose from various reasons such as inaccuracies in the index replication via optimization,various fee components like management fee, fixed fee and transaction costs, specific taxes respectively tax advantages. The realisedtracking error level is contrasted with the anticipated tracking error level; the level of realised tracking error was within the expected range,due to the effectiveness of replication techniques utilised over the 2017 period.
CONCEPT FUND SOLUTIONS PLC
394
db x-trackers MSCI World Information Technology Index UCITS ETF (DR)
Portfolio of Investments as at 31 December 2017
Transferable Securities
Equities - 99.40% (31 December 2016 - 100.00%)
Number ofShares Security
ValueUSD
% ofFund
Aerospace and Defense4,156 Harris 588,697 0.25
588,697 0.25
Commercial Services and Supplies15,419 Automatic Data Processing 1,806,953 0.761,241 CoStar Group 368,515 0.163,188 FleetCor Technologies 613,467 0.263,145 Gartner 387,307 0.165,293 Global Payments 530,570 0.2239,636 PayPal Holdings 2,918,002 1.237,251 Sabre 148,645 0.068,740 Square 303,016 0.135,756 Total System Services 455,242 0.195,623 Vantiv 413,572 0.1816,099 Western Union 306,042 0.134,102 Wirecard 458,433 0.19
8,709,764 3.67
Computers and Peripherals21,471 Accenture 3,286,995 1.3810,350 Alphabet Class A Shares 10,902,690 4.5910,867 Alphabet Class C Shares 11,371,229 4.79179,321 Apple 30,346,493 12.773,309 Atos 482,178 0.2033,878 Auto Trader Group 161,683 0.0717,687 BlackBerry 198,193 0.085,616 Capgemini 666,884 0.285,373 CDW 373,370 0.167,334 CGI Group 399,786 0.174,570 Check Point Software Technologies 473,543 0.2020,494 Cognizant Technology Solutions 1,455,484 0.6116,309 Computershare 207,924 0.097,050 Dell Technologies 573,024 0.249,880 DXC Technology 937,612 0.4035,283 eBay 1,331,580 0.562,207 F5 Networks 289,602 0.1282,299 Facebook 14,522,481 6.115,188 Fortinet 226,664 0.1068,701 Fujitsu 489,537 0.2156,362 Hewlett Packard Enterprise 809,358 0.3458,411 HP 1,227,215 0.522,569 IAC/InterActiveCorp 314,137 0.132,068 Ingenico Group 221,034 0.0930,720 International Business Machines 4,713,062 1.984,923 Kakaku.com 83,252 0.044,984 Leidos Holdings 321,817 0.141,545 LINE 63,021 0.031,457 MercadoLibre 458,460 0.199,099 NEC 245,548 0.109,359 NetApp 517,740 0.224,612 Nomura Research Institute 214,531 0.0922,048 NTT Data 262,071 0.112,263 Obic 166,335 0.071,840 Otsuka 141,124 0.063,186 Palo Alto Networks 461,779 0.199,989 Seagate Technology 417,940 0.182,844 Shopify 288,520 0.1221,324 Symantec 598,351 0.254,525 TDK 361,116 0.15
CONCEPT FUND SOLUTIONS PLC
395
db x-trackers MSCI World Information Technology Index UCITS ETF (DR)
Portfolio of Investments as at 31 December 2017 cont/d
Equities - 99.40% (31 December 2016 - 100.00%) cont/d
Number ofShares Security
ValueUSD
% ofFund
Computers and Peripherals cont/d4,164 Trend Micro 236,200 0.1021,756 Twitter 522,362 0.224,297 United Internet 295,865 0.123,120 VeriSign 357,053 0.1510,234 Western Digital 813,910 0.3449,754 Yahoo Japan 228,343 0.103,689 Zillow Group 150,954 0.06
93,188,050 39.22
Diversified Financials1,731 Alliance Data Systems 438,774 0.1832,798 Mastercard 4,964,305 2.0963,529 Visa 7,243,577 3.0569,872 Worldpay Group 402,652 0.17
Software24,883 Activision Blizzard 1,575,592 0.6617,122 Adobe Systems 3,000,459 1.26
CONCEPT FUND SOLUTIONS PLC
397
db x-trackers MSCI World Information Technology Index UCITS ETF (DR)
Portfolio of Investments as at 31 December 2017 cont/d
Equities - 99.40% (31 December 2016 - 100.00%) cont/d
Number ofShares Security
ValueUSD
% ofFund
Software cont/d5,948 Akamai Technologies 386,858 0.1615,331 Amadeus IT Group 1,106,593 0.472,941 ANSYS 434,062 0.186,882 Autodesk 721,440 0.304,042 Broadridge Financial Solutions 366,124 0.1610,945 CA 364,250 0.159,722 Cadence Design Systems 406,574 0.174,375 CDK Global 311,850 0.135,258 Citrix Systems 462,704 0.20701 Constellation Software 426,335 0.184,526 Dassault Systemes 481,471 0.203,681 Dena 75,907 0.0310,713 Electronic Arts 1,125,508 0.4711,535 Fidelity National Information Services 1,085,328 0.4615,332 First Data 256,198 0.117,304 Fiserv 957,773 0.408,447 Intuit 1,332,768 0.562,687 Jack Henry & Associates 314,271 0.133,257 Konami Holdings 179,258 0.0815,197 Micro Focus International 518,672 0.22254,041 Microsoft 21,730,667 9.151,505 Mixi 67,601 0.036,928 Nexon 201,721 0.099,232 Open Text 329,433 0.14107,759 Oracle 5,094,845 2.141,350 Oracle Japan 111,931 0.0511,223 Paychex 764,062 0.326,158 Red Hat 739,576 0.3137,759 Sage Group 407,606 0.1723,692 salesforce.com 2,422,033 1.0234,377 SAP 3,857,607 1.625,895 ServiceNow 768,649 0.324,801 Splunk 397,715 0.176,049 SS&C Technologies Holdings 244,864 0.105,211 Synopsys 444,186 0.193,676 Take-Two Interactive Software 403,551 0.172,203 Ubisoft Entertainment 169,674 0.072,473 Vmware 309,916 0.134,650 Workday 473,091 0.20
54,828,723 23.07Total Equities 236,210,440 99.40
Exchange Traded Funds - 0.58% (31 December 2016 - 0.00%)
48,000 db x-trackers MSCI USA Information Technology Index UCITS ETF (DR) 1,367,448 0.58Total Exchange Traded Funds 1,367,448 0.58Total Transferable Securities 237,577,888 99.98
Total Financial Assets at Fair Value through Profit or Loss 237,577,888 99.98Other Net Assets - 0.02% (31 December 2016 - 0.00%) 55,965 0.02
Net Assets Attributable to Redeeming Participating Shareholders 237,633,853 100.00
CONCEPT FUND SOLUTIONS PLC
398
db x-trackers MSCI World Information Technology Index UCITS ETF (DR)
Portfolio of Investments as at 31 December 2017 cont/d
Analysis of Total Assets % of Total Assets31/12/2017
Transferable securities admitted to an official stock exchange listing 99.19Exchange Traded Funds 0.57Current Assets 0.24Total Assets 100.00
CONCEPT FUND SOLUTIONS PLC
399
db x-trackers MSCI World Industrials Index UCITS ETF (DR)
Investment Manager’s Report for the financial year ended 31 December 2017
Investment Objective
The investment objective of the Fund is to track the performance before fees and expenses of the UnderlyingAsset, which is the MSCI World Industrials Total Return Net Index (the “Reference Index”). The ReferenceIndex is designed to reflect the performance of the shares of certain companies in various developed markets.The shares are issued by companies in the industrials sector.
Fund Performance
The Fund’s performance amounts are calculated net of fees and taxes.
The Fund performed in line with its benchmark and within guided tolerance levels.
Total Net Assets Net Assets per Share31/12/2017 Price (at 31/12/2017)
db x-trackers MSCI World Industrials Index UCITS ETF(DR) $40,103,317 $35.74
Year to Date Year to DateFund Return Index Return
db x-trackers MSCI World Industrials Index UCITS ETF(DR) 25.12% 25.23%
Year to Date Year to DateTracking Error Tracking Difference1
db x-trackers MSCI World Industrials Index UCITS ETF(DR) 0.04% (0.10)%
1The performance difference of the share class arose from various reasons such as inaccuracies in the index replication via optimization,various fee components like management fee, fixed fee and transaction costs, specific taxes respectively tax advantages. The realisedtracking error level is contrasted with the anticipated tracking error level; the level of realised tracking error was within the expected range,due to the effectiveness of replication techniques utilised over the 2017 period.
CONCEPT FUND SOLUTIONS PLC
400
db x-trackers MSCI World Industrials Index UCITS ETF (DR)
Portfolio of Investments as at 31 December 2017
Transferable Securities
Equities - 99.96% (31 December 2016 - 99.94%)
Number ofShares Security
ValueUSD
% ofFund
Aerospace and Defense4,948 Airbus 493,149 1.233,390 Arconic 92,377 0.2327,199 BAE Systems 210,826 0.534,792 Boeing 1,413,209 3.522,314 CAE 43,124 0.1120,418 Cobham 34,885 0.0921 Dassault Aviation 32,729 0.08203 Elbit Systems 27,190 0.072,167 General Dynamics 440,876 1.101,321 IHI 43,975 0.111,284 Kawasaki Heavy Industries 45,080 0.11668 L3 Technologies 132,164 0.333,456 Leonardo 41,168 0.102,210 Lockheed Martin 709,520 1.776,625 Meggitt 43,215 0.11444 MTU Aero Engines 79,653 0.201,408 Northrop Grumman 432,129 1.082,479 Raytheon 465,680 1.161,387 Rockwell Collins 188,105 0.4714,146 Rolls-Royce Holdings 162,082 0.402,838 Safran 292,770 0.731,011 Spirit AeroSystems Holdings 88,210 0.22904 Thales 97,567 0.24443 TransDigm Group 121,657 0.306,470 United Technologies 825,378 2.061,746 Zodiac Aerospace 52,268 0.13
6,608,986 16.48
Airlines1,040 American Airlines Group 54,111 0.13991 ANA Holdings 41,400 0.101,546 Delta Air Lines 86,576 0.222,008 Deutsche Lufthansa 74,072 0.181,357 easyJet 26,874 0.075,315 International Consolidated Airlines Group 46,182 0.121,006 Japan Airlines 39,365 0.101,323 Ryanair Holdings 23,909 0.064,637 Singapore Airlines 37,023 0.091,278 Southwest Airlines 83,645 0.21649 United Continental Holdings 43,743 0.11
Total Financial Assets at Fair Value through Profit or Loss 40,089,040 99.96Other Net Assets - 0.04% (31 December 2016 - 0.06%) 14,277 0.04
Net Assets Attributable to Redeeming Participating Shareholders 40,103,317 100.00
Analysis of Total Assets % of Total Assets31/12/2017
Transferable securities admitted to an official stock exchange listing 99.87Current Assets 0.13Total Assets 100.00
CONCEPT FUND SOLUTIONS PLC
406
db x-trackers MSCI World Consumer Discretionary Index UCITS ETF (DR)
Investment Manager’s Report for the financial year ended 31 December 2017
Investment Objective
The investment objective of the Fund is to track the performance before fees and expenses of the UnderlyingAsset, which is the MSCI World Consumer Discretionary Total Return Net Index (the “Reference Index”). TheReference Index is designed to reflect the performance of the shares of certain companies in variousdeveloped markets. The shares are issued by companies in the consumer discretionary sector. The consumerdiscretionary sector consists of companies which provide non-essential goods or services.
Fund Performance
The Fund’s performance amounts are calculated net of fees and taxes.
The Fund performed in line with its benchmark and within guided tolerance levels.
Total Net Assets Net Assets per Share31/12/2017 Price (at 31/12/2017)
db x-trackers MSCI World Consumer Discretionary IndexUCITS ETF (DR) $180,171,586 $30.76
Year to Date Year to DateFund Return Index Return
db x-trackers MSCI World Consumer Discretionary IndexUCITS ETF (DR) 23.53% 23.69%
Year to Date Year to DateTracking Error Tracking Difference1
db x-trackers MSCI World Consumer Discretionary IndexUCITS ETF (DR) 0.03% (0.16)%
1The performance difference of the share class arose from various reasons such as inaccuracies in the index replication via optimization,various fee components like management fee, fixed fee and transaction costs, specific taxes respectively tax advantages. The realisedtracking error level is contrasted with the anticipated tracking error level; the level of realised tracking error was within the expected range,due to the effectiveness of replication techniques utilised over the 2017 period.
CONCEPT FUND SOLUTIONS PLC
407
db x-trackers MSCI World Consumer Discretionary Index UCITS ETF (DR)
Portfolio of Investments as at 31 December 2017
Transferable Securities
Equities - 98.08% (31 December 2016 - 98.95%)
Number ofShares Security
ValueUSD
% ofFund
Auto Components6,404 Aisin Seiki 359,852 0.209,599 Aptiv 814,283 0.453,114 Autoliv 395,727 0.227,600 BorgWarner 388,284 0.2123,663 Bridgestone 1,100,282 0.616,233 Cie Generale des Etablissements Michelin 894,782 0.504,001 Continental 1,081,231 0.601 Delphi Technologies 52 0.0017,337 Denso 1,040,836 0.582,753 Faurecia 215,307 0.1262,280 GKN 269,092 0.159,021 Goodyear Tire & Rubber 291,469 0.164,082 Koito Manufacturing 286,990 0.162,436 Lear 430,344 0.241,760 Linamar 102,837 0.0612,743 Magna International 724,539 0.4026,868 Minth Group 162,054 0.095,781 NGK Spark Plug 140,561 0.083,539 NOK 82,655 0.054,225 Nokian Renkaat 191,774 0.115,115 Stanley Electric 207,733 0.1127,352 Sumitomo Electric Industries 462,544 0.266,234 Sumitomo Rubber Industries 115,992 0.062,384 Toyoda Gosei 60,674 0.035,908 Toyota Industries 379,706 0.218,691 Valeo 649,859 0.364,304 Yokohama Rubber 105,566 0.06
10,955,025 6.08
Automobiles12,039 Bayerische Motoren Werke 1,255,252 0.7034,977 Daimler 2,973,628 1.654,454 Ferrari 467,714 0.2639,023 Fiat Chrysler Automobiles 698,665 0.39133,057 Ford Motor 1,661,882 0.9247,079 General Motors 1,929,768 1.0762,526 Honda Motor 2,143,590 1.1919,998 Isuzu Motors 334,987 0.1920,627 Mazda Motor 276,766 0.1524,606 Mitsubishi Motors 177,801 0.1084,513 Nissan Motor 842,879 0.4721,328 Peugeot 434,229 0.246,971 Renault 702,392 0.3922,414 Subaru 712,911 0.4012,511 Suzuki Motor 725,671 0.404,795 Tesla 1,492,923 0.8394,863 Toyota Motor 6,074,095 3.371,187 Volkswagen 240,457 0.13
Leisure Equipment and Products7,327 Bandai Namco Holdings 239,680 0.1312,528 Carnival - Non-voting Rights 831,483 0.466,795 Carnival - Voting Rights 449,670 0.252,005 Flight Centre Travel Group 69,378 0.046,112 Harley-Davidson 310,979 0.174,033 Hasbro 366,559 0.2012,279 Mattel 188,851 0.116,540 Norwegian Cruise Line Holdings 348,255 0.192,132 Polaris Industries 264,347 0.156,192 Royal Caribbean Cruises 738,582 0.412,690 Shimano 378,486 0.2115,966 TUI 332,609 0.186,080 Yamaha 224,526 0.13
CONCEPT FUND SOLUTIONS PLC
410
db x-trackers MSCI World Consumer Discretionary Index UCITS ETF (DR)
Portfolio of Investments as at 31 December 2017 cont/d
Equities - 98.08% (31 December 2016 - 98.95%) cont/d
Number ofShares Security
ValueUSD
% ofFund
Leisure Equipment and Products cont/d10,216 Yamaha Motor 335,092 0.19
5,078,497 2.82
Machinery15,177 Husqvarna 144,772 0.08
144,772 0.08
Media19,244 Altice Class A Shares 202,104 0.111,761 Axel Springer 137,724 0.0812,404 CBS 731,836 0.416,942 Charter Communications 2,332,234 1.29168,876 Comcast 6,763,484 3.757,932 Dentsu 336,221 0.195,504 Discovery Communications Class A Shares 123,180 0.077,438 Discovery Communications Class C Shares 157,462 0.098,157 DISH Network 389,497 0.228,459 Hakuhodo DY Holdings 109,858 0.0614,068 Interpublic Group 283,611 0.16131,378 ITV 294,129 0.162,746 JCDecaux 110,809 0.064,280 Lagardere 137,377 0.083,839 Liberty Broadband 326,929 0.187,271 Liberty Global Class A Shares 260,593 0.1420,271 Liberty Global Class C Shares 685,971 0.387,218 Liberty Media-Liberty Formula One 246,567 0.143,310 Liberty Media-Liberty SiriusXM Class A Shares 131,275 0.076,406 Liberty Media-Liberty SiriusXM Class C Shares 254,062 0.1413,693 News Class A Shares 221,964 0.128,268 Omnicom Group 602,158 0.3329,847 Pearson 297,164 0.178,449 ProSiebenSat.1 Media 291,228 0.167,517 Publicis Groupe 511,346 0.281,402 RTL Group 112,914 0.063,554 Schibsted 94,723 0.053,094 Scripps Networks Interactive 264,166 0.1515,348 Shaw Communications 351,438 0.2057,831 Singapore Press Holdings 114,675 0.0657,848 Sirius XM Holdings 310,065 0.1737,403 Sky 512,041 0.281,913 Telenet Group Holding 133,440 0.0727,914 Time Warner 2,553,294 1.4237,812 Twenty-First Century Fox Class A Shares 1,305,648 0.7315,796 Twenty-First Century Fox Class B Shares 538,959 0.3012,638 Viacom 389,377 0.2237,591 Vivendi 1,012,023 0.5655,415 Walt Disney 5,957,667 3.3146,268 WPP 839,319 0.47
30,428,532 16.89
Retail1,203 ABC-Mart 69,094 0.042,647 Advance Auto Parts 263,879 0.152,328 AutoNation 119,496 0.071,009 AutoZone 717,772 0.409,834 Best Buy 673,334 0.372,353 Canadian Tire 307,799 0.176,565 CarMax 421,013 0.23921 Chipotle Mexican Grill 266,197 0.1518,972 Cie Financiere Richemont 1,719,064 0.95
CONCEPT FUND SOLUTIONS PLC
411
db x-trackers MSCI World Consumer Discretionary Index UCITS ETF (DR)
Portfolio of Investments as at 31 December 2017 cont/d
Equities - 98.08% (31 December 2016 - 98.95%) cont/d
Number ofShares Security
ValueUSD
% ofFund
Retail cont/d4,492 Darden Restaurants 431,322 0.249,823 Dollar General 913,637 0.518,516 Dollar Tree 913,852 0.513,875 Dollarama 485,709 0.271,729 Domino's Pizza 326,712 0.182,256 Domino's Pizza Enterprises 82,404 0.054,345 Don Quijote Holdings 227,182 0.131,267 Dufry 188,392 0.101,932 Fast Retailing 770,227 0.438,445 Gap 287,637 0.165,261 Genuine Parts 499,848 0.2820,031 Harvey Norman Holdings 65,332 0.0434,566 Hennes & Mauritz 714,751 0.4042,320 Home Depot 8,020,910 4.452,322 Hugo Boss 197,799 0.1139,654 Industria de Diseno Textil 1,383,022 0.7712,198 Isetan Mitsukoshi Holdings 151,270 0.088,831 J Front Retailing 166,429 0.092,757 Kering 1,301,068 0.7279,135 Kingfisher 361,507 0.206,130 Kohl's 332,430 0.188,736 L Brands 526,082 0.2915,118 Liberty Interactive Group 369,182 0.2130,038 Lowe's 2,791,732 1.553,638 Lululemon Athletica 285,910 0.166,155 Luxottica Group 378,046 0.2110,912 Macquarie Infrastructure 274,873 0.1558,919 Marks & Spencer Group 250,904 0.147,202 Marui Group 131,893 0.0729,079 McDonald's 5,005,078 2.782,411 McDonald's Holdings Japan 106,050 0.065,333 Next 326,443 0.182,905 Nitori Holdings 414,282 0.234,467 Nordstrom 211,646 0.123,154 O'Reilly Automotive 758,663 0.423,876 Pandora 422,269 0.232,774 PVH 380,621 0.218,119 Restaurant Brands International 500,702 0.2813,987 Ross Stores 1,122,457 0.62872 Ryohin Keikaku 271,702 0.15802 Shimamura 88,281 0.0551,810 Starbucks 2,975,448 1.651,118 Swatch Group (Bearer) 455,919 0.252,019 Swatch Group (Registered) 154,351 0.0910,941 Takashimaya 115,189 0.0610,125 Tapestry 447,829 0.2518,647 Target 1,216,717 0.684,461 Tiffany & Co 463,721 0.2622,845 TJX 1,746,729 0.974,539 Tractor Supply 339,290 0.192,111 Ulta Salon Cosmetics & Fragrance 472,146 0.267,925 USS 167,857 0.0923,155 Yamada Denki 127,645 0.0711,774 Yum! Brands 960,876 0.534,076 Zalando 215,919 0.12
46,855,540 26.01
Textiles and Apparel6,845 Adidas 1,373,886 0.765,787 Asics 92,263 0.05
CONCEPT FUND SOLUTIONS PLC
412
db x-trackers MSCI World Consumer Discretionary Index UCITS ETF (DR)
Portfolio of Investments as at 31 December 2017 cont/d
Equities - 98.08% (31 December 2016 - 98.95%) cont/d
Number ofShares Security
ValueUSD
% ofFund
Textiles and Apparel cont/d15,621 Burberry Group 378,673 0.218,140 Gildan Activewear 263,830 0.1513,059 Hanesbrands 273,064 0.151,154 Hermes International 618,379 0.3410,128 LVMH Moet Hennessy Louis Vuitton 2,984,482 1.665,432 Michael Kors Holdings 341,944 0.192,264 Mohawk Industries 624,638 0.3547,086 NIKE 2,945,229 1.641,984 Ralph Lauren 205,721 0.116,627 Under Armour Class A Shares 95,628 0.056,914 Under Armour Class C Shares 92,094 0.0512,037 VF 890,738 0.4926,798 Yue Yuen Industrial Holdings 105,241 0.06
11,285,810 6.26Total Equities 176,705,875 98.08
Exchange Traded Funds - 0.73% (31 December 2016 - 0.00%)
38,000 db x-trackers MSCI USA Consumer Discretionary Index UCITS ETF (DR) 1,322,989 0.73Total Exchange Traded Funds 1,322,989 0.73
Preferred Stocks - 1.17% (31 December 2016 - 0.99%)
Total Financial Assets at Fair Value through Profit or Loss 180,128,014 99.98Other Net Assets - 0.02% (31 December 2016 - 0.06%) 43,572 0.02
Net Assets Attributable to Redeeming Participating Shareholders 180,171,586 100.00
Analysis of Total Assets % of Total Assets31/12/2017
Transferable securities admitted to an official stock exchange listing 99.17Exchange Traded Funds 0.73Current Assets 0.10Total Assets 100.00
CONCEPT FUND SOLUTIONS PLC
413
db x-trackers MSCI World Utilities Index UCITS ETF (DR)
Investment Manager’s Report for the financial year ended 31 December 2017
Investment Objective
The investment objective of the Fund is to track the performance before fees and expenses of the UnderlyingAsset, which is the MSCI World Utilities Total Return Net Index (the “Reference Index”). The Reference Indexis designed to reflect the performance of the shares of certain companies in various developed markets. Theshares are issued by companies in the utilities sector, for example, power, water and gas services.
Fund Performance
The Fund’s performance amounts are calculated net of fees and taxes.
The Fund performed in line with its benchmark and within guided tolerance levels.
Total Net Assets Net Assets per Share31/12/2017 Price (at 31/12/2017)
db x-trackers MSCI World Utilities Index UCITS ETF (DR) $10,435,321 $22.76
Year to Date Year to DateFund Return Index Return
db x-trackers MSCI World Utilities Index UCITS ETF (DR) 13.80% 13.66%
Year to Date Year to DateTracking Error Tracking Difference1
db x-trackers MSCI World Utilities Index UCITS ETF (DR) 0.06% 0.14%
1The performance difference of the share class arose from various reasons such as inaccuracies in the index replication via optimization,various fee components like management fee, fixed fee and transaction costs, specific taxes respectively tax advantages. The realisedtracking error level is contrasted with the anticipated tracking error level; the level of realised tracking error was within the expected range,due to the effectiveness of replication techniques utilised over the 2017 period.
CONCEPT FUND SOLUTIONS PLC
414
db x-trackers MSCI World Utilities Index UCITS ETF (DR)
Portfolio of Investments as at 31 December 2017
Transferable Securities
Equities - 100.00% (31 December 2016 - 99.97%)
Number ofShares Security
ValueUSD
% ofFund
Construction and Engineering5,743 CK Infrastructure Holdings 49,332 0.47
49,332 0.47
Electric Utilities5,722 AES 61,969 0.595,683 AGL Energy 108,279 1.042,002 Alliant Energy 85,305 0.822,103 Ameren 124,056 1.194,268 American Electric Power 313,997 3.01659 Atco 23,668 0.2315,643 AusNet Services 22,085 0.213,548 CenterPoint Energy 100,621 0.965,583 Chubu Electric Power 69,410 0.662,412 Chugoku Electric Power 25,929 0.2514,285 CLP Holdings 146,097 1.402,444 CMS Energy 115,601 1.112,691 Consolidated Edison 228,600 2.195,582 Dominion Energy 452,477 4.341,560 DTE Energy 170,758 1.646,074 Duke Energy 510,884 4.9019,123 E.ON 208,067 1.992,829 Edison International 178,906 1.7120,597 EDP - Energias de Portugal 71,354 0.681,269 Electric Power Development 34,189 0.335,004 Electricite de France 62,612 0.60491 Emera 18,410 0.182,752 Endesa 59,004 0.5670,653 Enel 435,230 4.1715,857 Engie 272,954 2.621,556 Entergy 126,643 1.212,756 Eversource Energy 174,124 1.678,334 Exelon 328,443 3.153,867 FirstEnergy 118,408 1.133,636 Fortis 133,809 1.283,849 Fortum 76,261 0.7322,972 HK Electric Investments & HK Electric Investments 21,011 0.202,580 Hydro One 46,125 0.4449,335 Iberdrola 382,700 3.671,204 Innogy 47,240 0.456,101 Kansai Electric Power 74,739 0.723,698 Kyushu Electric Power 38,769 0.375,969 Mercury 14,306 0.1411,105 Meridian Energy 23,101 0.224,074 NextEra Energy 636,318 6.101,731 OGE Energy 56,967 0.551,639 Orsted 89,531 0.864,454 PG&E 199,673 1.91967 Pinnacle West Capital 82,369 0.7912,022 Power Assets Holdings 101,423 0.975,964 PPL 184,586 1.774,394 Public Service Enterprise Group 226,291 2.173,751 Red Electrica 84,274 0.814,490 RWE 91,657 0.881,177 SCANA 46,821 0.458,683 Southern 417,565 4.008,674 SSE 154,886 1.4812,193 Terna Rete Elettrica Nazionale 70,923 0.683,922 Tohoku Electric Power 50,170 0.4812,534 Tokyo Electric Power Holdings 49,624 0.48
CONCEPT FUND SOLUTIONS PLC
415
db x-trackers MSCI World Utilities Index UCITS ETF (DR)
Portfolio of Investments as at 31 December 2017 cont/d
Equities - 100.00% (31 December 2016 - 99.97%) cont/d
Number ofShares Security
ValueUSD
% ofFund
Electric Utilities cont/d1,744 Uniper 54,449 0.522,223 Vistra Energy 40,725 0.392,744 WEC Energy Group 182,284 1.751,231 Westar Energy 64,997 0.624,410 Xcel Energy 212,165 2.03
8,603,839 82.45
Gas Utilities919 Atmos Energy 78,933 0.761,105 Canadian Utilities 32,993 0.3248,463 Centrica 90,012 0.863,035 Gas Natural 70,155 0.6773,008 Hong Kong & China Gas 143,078 1.3729,671 National Grid 351,243 3.372,824 NiSource 72,492 0.693,250 Osaka Gas 62,605 0.602,071 Sempra Energy 221,431 2.12645 Toho Gas 17,692 0.173,374 Tokyo Gas 77,229 0.741,502 UGI 70,519 0.68
1,288,382 12.35
Oil and Gas9,656 APA Group 62,912 0.60
62,912 0.60
Water1,551 American Water Works 141,901 1.362,047 Severn Trent 59,868 0.573,189 Suez 56,158 0.545,909 United Utilities Group 66,305 0.644,172 Veolia Environnement 106,582 1.02
Total Financial Assets at Fair Value through Profit or Loss 10,435,279 100.00Other Net Assets - 0.00% (31 December 2016 - 0.03%) 42 0.00
Net Assets Attributable to Redeeming Participating Shareholders 10,435,321 100.00
Analysis of Total Assets % of Total Assets31/12/2017
Transferable securities admitted to an official stock exchange listing 99.76Current Assets 0.24Total Assets 100.00
CONCEPT FUND SOLUTIONS PLC
416
db x-trackers MSCI World Telecom Services Index UCITS ETF (DR)
Investment Manager’s Report for the financial year ended 31 December 2017
Investment Objective
The investment objective of the Fund is to track the performance before fees and expenses of the UnderlyingAsset, which is the MSCI World Telecommunication Services Total Return Net Index (the “Reference Index”).The Reference Index is designed to reflect the performance of the shares of certain companies in variousdeveloped markets. The shares are issued by companies in the telecommunication services sector.
Fund Performance
The Fund’s performance amounts are calculated net of fees and taxes.
The Fund performed in line with its benchmark and within guided tolerance levels.
Total Net Assets Net Assets per Share31/12/2017 Price (at 31/12/2017)
db x-trackers MSCI World Telecom Services Index UCITSETF (DR) $62,950,718 $12.67
Year to Date Year to DateFund Return Index Return
db x-trackers MSCI World Telecom Services Index UCITSETF (DR) 5.95% 5.82%
Year to Date Year to DateTracking Error Tracking Difference1
db x-trackers MSCI World Telecom Services Index UCITSETF (DR) 0.16% 0.13%
1The performance difference of the share class arose from various reasons such as inaccuracies in the index replication via optimization,various fee components like management fee, fixed fee and transaction costs, specific taxes respectively tax advantages. The realisedtracking error level is contrasted with the anticipated tracking error level; the level of realised tracking error was within the expected range,due to the effectiveness of replication techniques utilised over the 2017 period.
CONCEPT FUND SOLUTIONS PLC
417
db x-trackers MSCI World Telecom Services Index UCITS ETF (DR)
db x-trackers MSCI World Telecom Services Index UCITS ETF (DR)
Portfolio of Investments as at 31 December 2017 cont/dValueUSD
% ofFund
Total Financial Assets at Fair Value through Profit or Loss 62,945,849 99.99Other Net Assets - 0.01% (31 December 2016 - (0.12)%) 4,869 0.01
Net Assets Attributable to Redeeming Participating Shareholders 62,950,718 100.00
Analysis of Total Assets % of Total Assets31/12/2017
Transferable securities admitted to an official stock exchange listing 99.67Current Assets 0.33Total Assets 100.00
CONCEPT FUND SOLUTIONS PLC
419
db x-trackers MSCI World Materials Index UCITS ETF (DR)
Investment Manager’s Report for the financial year ended 31 December 2017
Investment Objective
The investment objective of the Fund is to track the performance before fees and expenses of the UnderlyingAsset, which is the MSCI World Materials Total Return Net Index (the “Reference Index”). The Reference Indexis designed to reflect the performance of the shares of certain companies in various developed markets. Theshares are issued by companies in the materials sector.
Fund Performance
The Fund’s performance amounts are calculated net of fees and taxes.
The Fund performed in line with its benchmark and within guided tolerance levels.
Total Net Assets Net Assets per Share31/12/2017 Price (at 31/12/2017)
db x-trackers MSCI World Materials Index UCITS ETF(DR) $20,922,671 $40.07
Year to Date Year to DateFund Return Index Return
db x-trackers MSCI World Materials Index UCITS ETF(DR) 28.85% 28.94%
Year to Date Year to DateTracking Error Tracking Difference1
db x-trackers MSCI World Materials Index UCITS ETF(DR) 0.09% (0.09)%
1The performance difference of the share class arose from various reasons such as inaccuracies in the index replication via optimization,various fee components like management fee, fixed fee and transaction costs, specific taxes respectively tax advantages. The realisedtracking error level is contrasted with the anticipated tracking error level; the level of realised tracking error was within the expected range,due to the effectiveness of replication techniques utilised over the 2017 period.
CONCEPT FUND SOLUTIONS PLC
420
db x-trackers MSCI World Materials Index UCITS ETF (DR)
Paper and Related Products3,873 International Paper 224,402 1.073,613 Mondi 94,377 0.458,484 Oji Holdings 56,485 0.275,421 Stora Enso 86,056 0.415,277 UPM-Kymmene 164,182 0.79
625,502 2.99Total Equities 20,884,800 99.82
Preferred Stocks - 0.17% (31 December 2016 - 0.17%)
Investment Manager’s Report for the financial year ended 31 December 2017
Investment Objective
The investment objective of the Fund is to track the performance before fees and expenses of the UnderlyingAsset, which is the Markit iBoxx USD Emerging Markets Sovereigns Quality Weighted Index (the “ReferenceIndex”). The Reference Index is designed to reflect the adjusted performance of USD-denominated sovereignbonds issued by emerging market countries. The Reference Index aims to offer a targeted coverage of theUSD-denominated emerging market sovereign bonds universe with adjusted weights, by allocating higherweights to countries with relatively solid fundamentals and reducing weights of countries with relatively weakfundamentals.
Fund Performance
The Fund’s performance amounts are calculated net of fees and taxes.
The Fund performed in line with its benchmark and within guided tolerance levels.
Total Net Assets Net Assets per Share31/12/2017 Price (at 31/12/2017)
1The performance difference of the share class arose from various reasons such as inaccuracies in the index replication via optimization,various fee components like management fee, fixed fee and transaction costs, specific taxes respectively tax advantages. The realisedtracking error level is contrasted with the anticipated tracking error level; the level of realised tracking error was within the expected range,due to the effectiveness of replication techniques utilised over the 2017 period.
Fund03/01/2018 EUR 335,020 USD 399,900 2,392 0.0003/01/2018 EUR 35,074,688 USD 41,913,200 204,493 0.2403/01/2018 USD 2,385,100 EUR 2,014,513 (33,928) (0.04)03/01/2018 USD 168,400 EUR 140,959 (864) 0.00Unrealised gain on open forward foreign currency exchange contracts 206,885 0.24Unrealised loss on open forward foreign currency exchange contracts (34,792) (0.04)Net unrealised gain on open forward foreign currency exchange contracts 172,093 0.20Total OTC Financial Derivative Instruments 172,093 0.20
Total Financial Derivative Instruments 172,093 0.20
ValueUSD
% ofFund
Total Financial Assets at Fair Value through Profit or Loss 84,148,021 98.33Other Net Assets - 1.67% (31 December 2016 - 2.17%) 1,427,539 1.67
Net Assets Attributable to Redeeming Participating Shareholders 85,575,560 100.00
* The counterparties for the open forward foreign currency exchange contracts are Barlcays Bank Plc, HSBC Bank Plc and Merrill LynchInternational Ltd.
Analysis of Total Assets % of Total Assets31/12/2017
Transferable securities admitted to an official stock exchange listing and transferable securities dealtin another regulated market 98.02OTC Financial Derivative Instruments 0.24Current Assets 1.74Total Assets 100.00
CONCEPT FUND SOLUTIONS PLC
430
db x-trackers iBoxx EUR Corporates Yield Plus UCITS ETF (DR)
Investment Manager’s Report for the financial year ended 31 December 2017
Investment Objective
The investment objective of the Fund is to track the performance before fees and expenses of the UnderlyingAsset, which is the Markit iBoxx EUR Corporates Yield Plus Index (the “Reference Index”). The ReferenceIndex is designed to reflect the performance of the higher-yielding EUR denominated corporate bond marketwith a credit rating between BB- and AAA.
Fund Performance
The Fund’s performance amounts are calculated net of fees and taxes.
The Fund performed in line with its benchmark and within guided tolerance levels.
Total Net Assets Net Assets per Share31/12/2017 Price (at 31/12/2017)
db x-trackers iBoxx EUR Corporates Yield Plus UCITSETF (DR) €234,144,847 €16.18
Year to Date Year to DateFund Return Index Return
db x-trackers iBoxx EUR Corporates Yield Plus UCITSETF (DR) 3.99% 4.25%
Year to Date Year to DateTracking Error Tracking Difference1
db x-trackers iBoxx EUR Corporates Yield Plus UCITSETF (DR) 0.08% (0.26)%
1The performance difference of the share class arose from various reasons such as inaccuracies in the index replication via optimization,various fee components like management fee, fixed fee and transaction costs, specific taxes respectively tax advantages. The realisedtracking error level is contrasted with the anticipated tracking error level; the level of realised tracking error was within the expected range,due to the effectiveness of replication techniques utilised over the 2017 period.
CONCEPT FUND SOLUTIONS PLC
431
db x-trackers iBoxx EUR Corporates Yield Plus UCITS ETF (DR)
Portfolio of Investments as at 31 December 2017
Transferable Securities
Corporate Bonds - 98.27% (31 December 2016 - 98.40%)
Nominal SecurityCreditRating
Coupon% Maturity
ValueEUR
% ofFund
100,000 2i Rete Gas Baa2 3.00 16/07/2024 113,785 0.05500,000 AbbVie Baa2 1.38 17/05/2024 510,162 0.22300,000 Abertis Infraestructuras Baa2 3.75 20/06/2023 347,771 0.15300,000 Abertis Infraestructuras Baa2 2.50 27/02/2025 326,547 0.14100,000 Abertis Infraestructuras Baa2 1.38 20/05/2026 99,590 0.04100,000 Abertis Infraestructuras Baa2 1.00 27/02/2027 95,552 0.04200,000 ABN Amro Bank Baa2 6.38 27/04/2021 238,154 0.10200,000 ABN Amro Bank Baa2 7.13 06/07/2022 255,623 0.11400,000 ABN Amro Bank Baa2 2.88 30/06/2025 423,483 0.18500,000 ABN Amro Bank Baa2 2.88 18/01/2028 544,171 0.23600,000 Accor Baa3 2.63 05/02/2021 641,475 0.27100,000 Accor Baa3 1.25 25/01/2024 100,834 0.04100,000 ACEA Baa2 2.63 15/07/2024 110,190 0.05300,000 ACEA Baa2 1.00 24/10/2026 292,264 0.12250,000 Achmea* Baa3 4.25 272,057 0.12500,000 Achmea Bank A3 2.75 18/02/2021 538,100 0.23400,000 Aegon A3 1.00 08/12/2023 406,704 0.17200,000 Aegon Baa1 4.00 25/04/2044 224,520 0.10200,000 Aeroporti di Roma Baa1 1.63 08/06/2027 204,007 0.09200,000 Akelius Residential Property Baa2 1.13 14/03/2024 197,511 0.08300,000 Akelius Residential Property Baa2 1.75 07/02/2025 303,930 0.13100,000 Akzo Nobel Baa1 1.75 07/11/2024 105,592 0.05100,000 Akzo Nobel Baa1 1.13 08/04/2026 100,264 0.04200,000 Akzo Nobel Sweden Finance Baa1 2.63 27/07/2022 219,603 0.09200,000 Alimentation Couche-Tard Baa2 1.88 06/05/2026 206,239 0.09700,000 Allergan Funding Baa3 0.50 01/06/2021 700,485 0.30100,000 Allergan Funding Baa3 1.25 01/06/2024 99,472 0.04300,000 Allianz* A2 4.75 356,250 0.15200,000 Allianz* A2 3.38 222,062 0.09800,000 Allianz A2 5.63 17/10/2042 973,717 0.41400,000 Allianz A2 2.24 07/07/2045 416,019 0.18400,000 Allianz A2 3.10 06/07/2047 437,583 0.19600,000 Allianz Finance II A2 5.75 08/07/2041 703,025 0.30100,000 America Movil A3 4.75 28/06/2022 118,849 0.05100,000 America Movil A3 3.26 22/07/2023 113,138 0.05800,000 America Movil A3 1.50 10/03/2024 827,158 0.35100,000 America Movil Baa2 6.38 06/09/2073 122,325 0.05100,000 American Honda Finance A2 0.75 17/01/2024 100,129 0.04250,000 American International Group Baa1 1.50 08/06/2023 258,274 0.11200,000 American International Group Baa1 1.88 21/06/2027 204,061 0.09300,000 American Tower Baa3 1.38 04/04/2025 299,641 0.13200,000 Amgen Baa1 2.00 25/02/2026 214,513 0.09400,000 Anglo American Capital Baa3 2.50 29/04/2021 425,729 0.18100,000 Anglo American Capital Baa3 3.50 28/03/2022 111,000 0.05300,000 Anglo American Capital Baa3 3.25 03/04/2023 332,116 0.14400,000 Annington Funding Baa2 1.65 12/07/2024 404,702 0.17100,000 Aon Baa2 2.88 14/05/2026 111,035 0.05200,000 AP Moller - Maersk Baa2 1.50 24/11/2022 207,729 0.09250,000 APT Pipelines Baa2 2.00 22/03/2027 258,199 0.11100,000 Aptiv Baa2 1.50 10/03/2025 102,659 0.04100,000 Aquarius & Investments for Zurich
Total Financial Assets at Fair Value through Profit or Loss 230,099,275 98.27Other Net Assets - 1.73% (31 December 2016 - 1.60%) 4,045,572 1.73
Net Assets Attributable to Redeeming Participating Shareholders 234,144,847 100.00
* These are perpetual bonds which have no maturity date.
Analysis of Total Assets % of Total Assets31/12/2017
Transferable securities admitted to an official stock exchange listing and transferable securities dealtin another regulated market 98.25Current Assets 1.75Total Assets 100.00
CONCEPT FUND SOLUTIONS PLC
444
db x-trackers MSCI USA Minimum Volatility UCITS ETF (DR)
Investment Manager’s Report for the financial year ended 31 December 2017
Investment Objective
The investment objective of the Fund is to track the performance before fees and expenses of the UnderlyingAsset, which is the MSCI USA Minimum Volatility (USD) Index (the “Reference Index”). The Reference Indexconsists of the equities of large and mid-capitalisation US companies that provide the lowest absolute volatilityof returns, measured by the rate of fluctuation in their daily price movements over time, within a certain set ofconstraints.
Fund Performance
The Fund’s performance amounts are calculated net of fees and taxes.
The Fund performed in line with its benchmark and within guided tolerance levels.
Total Net Assets Net Assets per Share31/12/2017 Price (at 31/12/2017)
db x-trackers MSCI USA Minimum Volatility UCITS ETF(DR) $8,604,225 $33.74
Year to Date Year to DateFund Return Index Return
db x-trackers MSCI USA Minimum Volatility UCITS ETF(DR) 18.49% 18.41%
Year to Date Year to DateTracking Error Tracking Difference1
db x-trackers MSCI USA Minimum Volatility UCITS ETF(DR) 0.03% 0.08%
1The performance difference of the share class arose from various reasons such as inaccuracies in the index replication via optimization,various fee components like management fee, fixed fee and transaction costs, specific taxes respectively tax advantages. The realisedtracking error level is contrasted with the anticipated tracking error level; the level of realised tracking error was within the expected range,due to the effectiveness of replication techniques utilised over the 2017 period.
CONCEPT FUND SOLUTIONS PLC
445
db x-trackers MSCI USA Minimum Volatility UCITS ETF (DR)
Portfolio of Investments as at 31 December 2017
Transferable Securities
Equities - 99.39% (31 December 2016 - 99.98%)
Number ofShares Security
ValueUSD
% ofFund
Aerospace and Defense139 General Dynamics 28,280 0.33283 Harris 40,087 0.4758 L3 Technologies 11,475 0.13322 Lockheed Martin 103,378 1.20359 Northrop Grumman 110,181 1.28498 Raytheon 93,549 1.09
386,950 4.50
Agriculture1,353 Altria Group 96,618 1.12424 Philip Morris International 44,795 0.52
141,413 1.64
Banks274 US Bancorp 14,681 0.17
14,681 0.17
Beverages71 Brown-Forman 4,876 0.062,610 Coca-Cola 119,747 1.39168 Constellation Brands 38,400 0.44592 Dr Pepper Snapple Group 57,459 0.671,040 PepsiCo 124,717 1.45
Computers and Peripherals702 Accenture 107,469 1.2544 Alphabet Class A Shares 46,350 0.54147 Apple 24,877 0.29493 Dell Technologies 40,071 0.47676 eBay 25,512 0.30125 F5 Networks 16,403 0.19385 Facebook 67,937 0.79362 International Business Machines 55,538 0.64251 VeriSign 28,724 0.33
412,881 4.80
CONCEPT FUND SOLUTIONS PLC
446
db x-trackers MSCI USA Minimum Volatility UCITS ETF (DR)
Portfolio of Investments as at 31 December 2017 cont/d
Equities - 99.39% (31 December 2016 - 99.98%) cont/d
Number ofShares Security
ValueUSD
% ofFund
Construction and Engineering2 NVR 7,016 0.08
7,016 0.08
Diversified Financials150 Cboe Global Markets 18,689 0.22165 CME Group 24,098 0.28318 FNF 12,478 0.14476 Mastercard 72,047 0.841,147 Visa 130,781 1.52
258,093 3.00
Diversified Telecommunications2,108 AT&T 81,959 0.951,780 Cisco Systems 68,174 0.79329 Motorola Solutions 29,722 0.35181 T-Mobile US 11,495 0.132,061 Verizon Communications 109,089 1.27386 Zayo Group Holdings 14,205 0.17
314,644 3.66
Electric Utilities207 Alliant Energy 8,820 0.10367 American Electric Power 27,000 0.31370 CMS Energy 17,501 0.201,240 Consolidated Edison 105,338 1.23698 Dominion Energy 56,580 0.6646 DTE Energy 5,035 0.061,098 Duke Energy 92,353 1.07155 Edison International 9,802 0.11312 Eversource Energy 19,712 0.23412 NextEra Energy 64,350 0.75121 PG&E 5,425 0.06240 PPL 7,428 0.091,405 Southern 67,567 0.79724 WEC Energy Group 48,095 0.56408 Westar Energy 21,542 0.251,706 Xcel Energy 82,076 0.95
638,624 7.42
Electronics816 Amphenol 71,645 0.83260 FLIR Systems 12,121 0.14195 Honeywell International 29,905 0.3541 Waters 7,921 0.09
db x-trackers MSCI USA Minimum Volatility UCITS ETF (DR)
Portfolio of Investments as at 31 December 2017 cont/d
Equities - 99.39% (31 December 2016 - 99.98%) cont/d
Number ofShares Security
ValueUSD
% ofFund
Food Products cont/d74 Tyson Foods 5,999 0.07
322,452 3.75
Health Care Equipment and Supplies288 Abbott Laboratories 16,436 0.19872 Baxter International 56,366 0.65543 Becton Dickinson & Co 116,235 1.351,243 Boston Scientific 30,814 0.36110 Cooper 23,967 0.28680 Danaher 63,118 0.73363 Henry Schein 25,366 0.29238 Intuitive Surgical 86,856 1.01902 Medtronic 72,836 0.85182 ResMed 15,414 0.18441 Stryker 68,284 0.7978 Teleflex 19,408 0.23157 Thermo Fisher Scientific 29,811 0.35355 Varian Medical Systems 39,458 0.4659 Zimmer Biomet Holdings 7,120 0.08
671,489 7.80
Health Care Providers and Services125 Aetna 22,549 0.26120 Anthem 27,001 0.31180 Cigna 36,556 0.43129 Humana 32,001 0.3776 IQVIA Holdings 7,441 0.09271 Laboratory of America Holdings 43,227 0.50204 Quest Diagnostics 20,092 0.23352 UnitedHealth Group 77,602 0.9081 Universal Health Services 9,181 0.11
275,650 3.20
Hotels, Restaurants and Leisure35 Vail Resorts 7,437 0.09
Media54 Charter Communications 18,142 0.211,550 Comcast 62,078 0.72137 Liberty Broadband 11,667 0.14133 Omnicom Group 9,686 0.11425 Time Warner 38,875 0.45461 Walt Disney 49,562 0.58
190,010 2.21
Metals and Mining3,133 Newmont Mining 117,550 1.37
117,550 1.37
Oil and Gas369 Chevron 46,195 0.541,147 Exxon Mobil 95,935 1.11240 Occidental Petroleum 17,678 0.20353 Schlumberger 23,789 0.28
183,597 2.13
Personal Products415 Colgate-Palmolive 31,312 0.371,153 Procter & Gamble 105,937 1.23
137,249 1.60
Pharmaceuticals24 Allergan 3,926 0.04254 Bristol-Myers Squibb 15,565 0.18854 Eli Lilly & Co 72,129 0.84917 Johnson & Johnson 128,123 1.491,161 Merck & Co 65,329 0.763,157 Pfizer 114,347 1.33253 Zoetis 18,226 0.21
417,645 4.85
Real Estate Investment Trust2,628 AGNC Investment 53,059 0.6292 American Tower 13,126 0.156,262 Annaly Capital Management 74,455 0.87413 AvalonBay Communities 73,683 0.8642 Boston Properties 5,461 0.06394 Camden Property Trust 36,272 0.42655 Crown Castle International 72,712 0.85175 Digital Realty Trust 19,932 0.2344 Equinix 19,942 0.23708 Equity Residential 45,149 0.53121 Essex Property Trust 29,206 0.3452 Extra Space Storage 4,547 0.05210 Federal Realty Investment Trust 27,890 0.32184 Invitation Homes 4,337 0.05
CONCEPT FUND SOLUTIONS PLC
449
db x-trackers MSCI USA Minimum Volatility UCITS ETF (DR)
Portfolio of Investments as at 31 December 2017 cont/d
Equities - 99.39% (31 December 2016 - 99.98%) cont/d
Number ofShares Security
ValueUSD
% ofFund
Real Estate Investment Trust cont/d188 Mid-America Apartment Communities 18,905 0.22396 National Retail Properties 17,079 0.20277 Public Storage 57,893 0.67827 Realty Income 47,156 0.55105 Regency Centers 7,264 0.081,089 UDR 41,948 0.49263 Ventas 15,783 0.18371 Welltower 23,659 0.28
709,458 8.25
Retail49 AutoZone 34,857 0.4182 Costco Wholesale 15,262 0.1893 CVS Health 6,743 0.08235 Darden Restaurants 22,565 0.26116 Dollar General 10,789 0.13104 Genuine Parts 9,881 0.12383 Home Depot 72,590 0.84756 McDonald's 130,123 1.5151 O'Reilly Automotive 12,268 0.14218 Ross Stores 17,494 0.20640 Starbucks 36,755 0.43948 TJX 72,484 0.8420 Ulta Salon Cosmetics & Fragrance 4,473 0.05544 Wal-Mart Stores 53,720 0.62166 Yum! Brands 13,547 0.16
Total Financial Assets at Fair Value through Profit or Loss 8,551,676 99.39Other Net Assets - 0.61% (31 December 2016 - 0.02%) 52,549 0.61
Net Assets Attributable to Redeeming Participating Shareholders 8,604,225 100.00
Analysis of Total Assets % of Total Assets31/12/2017
Transferable securities admitted to an official stock exchange listing 99.31Current Assets 0.69Total Assets 100.00
CONCEPT FUND SOLUTIONS PLC
451
db x-trackers MSCI EMU Minimum Volatility UCITS ETF (DR)
Investment Manager’s Report for the financial year ended 31 December 2017
Investment Objective
The investment objective of the Fund is to track the performance before fees and expenses of the UnderlyingAsset, which is the MSCI EMU Minimum Volatility (EUR) Index (the “Reference Index”). The Reference Indexconsists of equities from the 10 developed countries within the European Economic and Monetary Union(“EMU”) that provide the lowest absolute volatility of returns, measured by the rate of fluctuation in their dailyprice movements over time, within a certain set of constraints.
Fund Performance
The Fund’s performance amounts are calculated net of fees and taxes.
The Fund performed in line with its benchmark and within guided tolerance levels.
Total Net Assets Net Assets per Share31/12/2017 Price (at 31/12/2017)
db x-trackers MSCI EMU Minimum Volatility UCITS ETF(DR) €46,681,117 €26.60
Year to Date Year to DateFund Return Index Return
db x-trackers MSCI EMU Minimum Volatility UCITS ETF(DR) 12.67% 12.39%
Year to Date Year to DateTracking Error Tracking Difference1
db x-trackers MSCI EMU Minimum Volatility UCITS ETF(DR) 0.08% 0.28%
1The performance difference of the share class arose from various reasons such as inaccuracies in the index replication via optimization,various fee components like management fee, fixed fee and transaction costs, specific taxes respectively tax advantages. The realisedtracking error level is contrasted with the anticipated tracking error level; the level of realised tracking error was within the expected range,due to the effectiveness of replication techniques utilised over the 2017 period.
CONCEPT FUND SOLUTIONS PLC
452
db x-trackers MSCI EMU Minimum Volatility UCITS ETF (DR)
Portfolio of Investments as at 31 December 2017
Transferable Securities
Equities - 98.50% (31 December 2016 - 98.46%)
Number ofShares Security
ValueEUR
% ofFund
Aerospace and Defense485 Airbus 40,255 0.09135 Dassault Aviation 175,217 0.374,447 Thales 399,696 0.86
615,168 1.32
Airlines4,483 Deutsche Lufthansa 137,718 0.2933,139 Ryanair Holdings 498,742 1.07
636,460 1.36
Auto Components1,828 Cie Generale des Etablissements Michelin 218,537 0.47630 Nokian Renkaat 23,814 0.05
242,351 0.52
Banks7,859 ABN Amro Group 211,407 0.4533,367 AIB Group 183,519 0.398,728 Bank of Ireland Group 61,925 0.1324,662 Bankinter 194,928 0.42824 BNP Paribas 51,294 0.119,058 Erste Group Bank 327,039 0.7018,405 ING Groep 282,057 0.617,391 KBC Group 525,574 1.13
Net unrealised loss on open futures contracts (170) 0.00Total Exchange Traded Financial Derivative Instruments (170) 0.00
Total Financial Derivative Instruments (170) 0.00
ValueEUR
% ofFund
Total Financial Assets at Fair Value through Profit or Loss 46,649,503 99.93Other Net Assets - 0.07% (31 December 2016 - 0.08%) 31,614 0.07
Net Assets Attributable to Redeeming Participating Shareholders 46,681,117 100.00
* The broker for the open futures contracts is Deutsche Bank AG Frankfurt.
CONCEPT FUND SOLUTIONS PLC
457
db x-trackers MSCI EMU Minimum Volatility UCITS ETF (DR)
Portfolio of Investments as at 31 December 2017 cont/d
Analysis of Total Assets % of Total Assets31/12/2017
Transferable securities admitted to an official stock exchange listing 99.89Current Assets 0.11Total Assets 100.00
CONCEPT FUND SOLUTIONS PLC
458
db x-trackers MSCI Emerging Markets Index UCITS ETF (DR)
Investment Manager’s Report for the financial year ended 31 December 2017
Investment Objective
The investment objective of the Fund is to track the performance before fees and expenses of the MSCI TotalReturn Net Emerging Markets Index (the “Reference Index”). The Reference Index is designed to reflect theequity market performance of shares in large and mid-capitalisation companies in global emerging markets,as determined by MSCI.
Fund Performance
The Fund’s performance amounts are calculated net of fees and taxes.
The Fund performed in line with its benchmark and within guided tolerance levels.
Total Net Assets Net Assets per Share31/12/2017 Price (at 31/12/2017)
db x-trackers MSCI Emerging Markets Index UCITS ETF(DR) $784,925,021 $52.07
Year to Date Year to DateFund Return Index Return
db x-trackers MSCI Emerging Markets Index UCITS ETF(DR) 16.58% 16.74%
Year to Date Year to DateTracking Error Tracking Difference1
db x-trackers MSCI Emerging Markets Index UCITS ETF(DR) 0.12% (0.16)%
1The performance difference of the share class arose from various reasons such as inaccuracies in the index replication via optimization,various fee components like management fee, fixed fee and transaction costs, specific taxes respectively tax advantages. The realisedtracking error level is contrasted with the anticipated tracking error level; the level of realised tracking error was within the expected range,due to the effectiveness of replication techniques utilised over the 2017 period.
CONCEPT FUND SOLUTIONS PLC
459
db x-trackers MSCI Emerging Markets Index UCITS ETF (DR)
Portfolio of Investments as at 31 December 2017
Transferable Securities
Equities - 91.96%
Number ofShares Security
ValueUSD
% ofFund
Aerospace and Defense29,122 Aselsan Elektronik Sanayi Ve Ticaret 244,245 0.03308,869 AviChina Industry & Technology 164,366 0.0294,185 Embraer 567,875 0.075,406 Hanwha Techwin 179,518 0.029,944 Korea Aerospace Industries 440,748 0.06
1,596,752 0.20
Agriculture20,300 British American Tobacco Malaysia 200,642 0.031,075,200 Charoen Pokphand Indonesia 237,745 0.03212,700 Felda Global Ventures Holdings 88,822 0.0134,400 Genting Plantations 89,251 0.0168,900 Gudang Garam 425,563 0.051,311,500 Hanjaya Mandala Sampoerna 457,225 0.0685,000 HAP Seng Consolidated 200,581 0.03316,700 IOI 355,280 0.05262,075 ITC 1,080,901 0.1416,822 KT&G 1,814,900 0.2368,900 Kuala Lumpur Kepong 425,624 0.05342,800 Sime Darby Plantation 508,228 0.06
5,884,762 0.75
Airlines265,815 Air China 322,353 0.04219,300 AirAsia 181,531 0.02353,000 China Airlines 138,194 0.02266,182 China Southern Airlines 274,787 0.04306,560 Eva Airways 163,280 0.026,726 Korean Air Lines 212,671 0.0344,238 Latam Airlines Group 627,114 0.0880,404 Turk Hava Yollari 332,719 0.04
2,252,649 0.29
Auto Components565 Bosch 178,505 0.02278,000 Cheng Shin Rubber Industry 490,448 0.0673,646 Fuyao Glass Industry Group 310,419 0.0410,545 Hankook Tire 537,814 0.0726,141 Hanon Systems 339,414 0.049,822 Hyundai Mobis 2,412,952 0.312,383 Hyundai Wia 144,688 0.0248,636 Motherson Sumi Systems 288,985 0.04127,000 Nexteer Automotive Group 302,501 0.04283,262 Weichai Power 310,174 0.04
5,315,900 0.68
Automobiles88,159 Ashok Leyland 164,502 0.02436,634 Brilliance China Automotive Holdings 1,167,366 0.1591,783 BYD 799,563 0.10395,125 Dongfeng Motor Group 478,155 0.061,028 Eicher Motors 488,667 0.0610,223 Ford Otomotiv Sanayi 162,448 0.02708,527 Geely Automobile Holdings 2,456,229 0.31451,428 Great Wall Motor 516,838 0.07306,234 Guangzhou Automobile Group 725,500 0.0922,220 Hyundai Motor 3,237,887 0.4137,975 Kia Motors 1,188,326 0.15
CONCEPT FUND SOLUTIONS PLC
460
db x-trackers MSCI Emerging Markets Index UCITS ETF (DR)
Portfolio of Investments as at 31 December 2017 cont/d
Equities - 91.96% cont/d
Number ofShares Security
ValueUSD
% ofFund
Automobiles cont/d57,388 Mahindra & Mahindra 675,322 0.098,142 Maruti Suzuki India 1,241,126 0.16122,308 Tata Motors 827,523 0.1129,367 Tata Motors Class A Shares 112,310 0.0218,201 Tofas Turk Otomobil Fabrikasi 158,508 0.0267,700 UMW Holdings 86,988 0.01
14,487,258 1.85
Banks295,670 Abu Dhabi Commercial Bank 547,418 0.073,765,333 Agricultural Bank of China 1,753,267 0.22314,356 Akbank Turk 816,649 0.1013,178 Alior Bank 301,500 0.04140,500 Alliance Bank Malaysia 141,646 0.02201,880 Alpha Bank 433,200 0.06241,500 AMMB Holdings 263,162 0.03129,227 Axis Bank 1,141,789 0.15132,060 Banco Bradesco 1,276,369 0.163,535,411 Banco de Chile 566,834 0.076,298 Banco de Credito e Inversiones 438,109 0.06123,888 Banco do Brasil 1,188,422 0.1559,954 Banco Santander Brasil 576,206 0.079,413,617 Banco Santander Chile 737,654 0.0933,276 Bancolombia 334,265 0.0435,100 Bangkok Bank 235,867 0.031,421,100 Bank Central Asia 2,293,871 0.29488,500 Bank Danamon Indonesia 250,236 0.034,754 Bank Handlowy w Warszawie 112,023 0.012,690,100 Bank Mandiri Persero 1,586,202 0.2088,329 Bank Millennium 227,254 0.031,063,300 Bank Negara Indonesia Persero 775,874 0.1011,448,973 Bank of China 5,623,944 0.721,256,795 Bank of Communications 932,472 0.12114,400 Bank of the Philippine Islands 247,729 0.0322,570 Bank Pekao 841,146 0.117,999,400 Bank Rakyat Indonesia Persero 2,146,145 0.27610,300 Bank Tabungan Negara Persero 160,588 0.024,938 Bank Zachodni WBK 563,107 0.0797,741 Barclays Africa Group 1,436,824 0.18281,420 BDO Unibank 924,537 0.12682,500 Chang Hwa Commercial Bank 379,568 0.051,279,480 China CITIC Bank 801,997 0.1012,127,198 China Construction Bank 11,169,563 1.42400,140 China Everbright Bank 186,831 0.02562,337 China Merchants Bank 2,237,177 0.29794,360 China Minsheng Banking 795,651 0.10366,049 Chongqing Rural Commercial Bank 258,477 0.03646,600 CIMB Group Holdings 1,044,913 0.13838,353 CITIC 1,209,704 0.1528,911 Commercial Bank 230,208 0.03143,621 Commercial International Bank Egypt - England listing 624,033 0.0812,150 Commercial International Bank Egypt - US listing 52,792 0.019,735 Credicorp - US listing 2,019,331 0.2622,147 Doha Bank 172,700 0.02179,941 Dubai Islamic Bank 303,266 0.04270,608 Eurobank Ergasias 276,204 0.04206,334 First Abu Dhabi Bank 575,834 0.07485,062 FirstRand 2,634,929 0.34143,198 Gentera 119,957 0.02359,774 Grupo Financiero Banorte 1,982,798 0.25
CONCEPT FUND SOLUTIONS PLC
461
db x-trackers MSCI Emerging Markets Index UCITS ETF (DR)
Portfolio of Investments as at 31 December 2017 cont/d
Equities - 91.96% cont/d
Number ofShares Security
ValueUSD
% ofFund
Banks cont/d337,724 Grupo Financiero Inbursa 554,430 0.07266,106 Grupo Financiero Santander Mexico 390,750 0.0594,400 Hong Leong Bank 396,541 0.05182,692 ICICI Bank 898,755 0.11104,769 IDFC Bank 89,048 0.0110,632,727 Industrial & Commercial Bank of China 8,555,365 1.0936,692 Industrial Bank of Korea 563,807 0.0722,388,329 Itau CorpBanca 203,722 0.0396,500 Kasikornbank - Non-voting Rights 686,959 0.09171,300 Kasikornbank - Voting Rights 1,256,235 0.1611,067 Komercni Banka As 476,308 0.06508,700 Krung Thai Bank 299,694 0.04609,300 Malayan Banking 1,475,448 0.1952,092 Masraf Al Rayan 530,646 0.072,153 mBank 288,116 0.0492,560 Metropolitan Bank & Trust 188,013 0.0270,701 Moneta Money Bank 274,025 0.04799,323 National Bank of Greece 306,185 0.0431,705 Nedbank Group 655,868 0.0834,127 OTP Bank 1,416,168 0.1841,347 Piraeus Bank 152,424 0.02135,112 Powszechna Kasa Oszczednosci Bank Polski 1,722,923 0.22419,800 Public Bank 2,155,533 0.288,615 Qatar Islamic Bank 231,815 0.0333,019 Qatar National Bank 1,151,313 0.15115,500 RHB Bank 142,698 0.021,554,204 Sberbank of Russia 6,079,540 0.7732,880 Security Bank 165,586 0.02263,800 Siam Commercial Bank 1,214,176 0.16186,570 Standard Bank Group 2,948,650 0.38132,960 State Bank of India 645,557 0.08537,470 Taiwan Business Bank 151,532 0.021,913,700 TMB Bank 177,336 0.02336,433 Turkiye Garanti Bankasi 951,198 0.1291,014 Turkiye Halk Bankasi 258,764 0.03229,381 Turkiye Is Bankasi 421,665 0.05109,223 Turkiye Vakiflar Bankasi Tao 195,020 0.03755,033,851 VTB Bank 620,591 0.0854,071 Woori Bank 795,496 0.10126,615 Yapi ve Kredi Bankasi 144,928 0.02130,262 Yes Bank 643,172 0.08
96,426,242 12.28
Beverages679,564 Ambev 4,359,568 0.5630,183 Anadolu Efes Biracilik Ve Malt Sanayii 192,644 0.0262,176 Arca Continental 431,964 0.06230,250 China Resources Beer Holdings 826,182 0.1121,533 Cia Cervecerias Unidas 323,093 0.0470,549 Coca-Cola Femsa 493,812 0.0611,106 Coca-Cola Icecek 100,234 0.01280,322 Fomento Economico Mexicano 2,649,845 0.3452,471 Tsingtao Brewery 270,500 0.034,481 United Spirits 257,571 0.03
Construction and Engineering611,800 Airports of Thailand 1,276,539 0.16210,978 Beijing Capital International Airport 317,926 0.04632,820 China Communications Construction 718,847 0.09348,289 China Communications Services 233,461 0.03275,771 China Railway Construction 319,610 0.04564,129 China Railway Group 417,109 0.05284,142 China State Construction International Holdings 397,645 0.053,877 Daelim Industrial 298,412 0.0418,154 Daewoo Engineering & Construction 100,389 0.01580,600 DMCI Holdings 167,481 0.02214,482 Dubai Investments 140,738 0.02247,800 Gamuda Bhd 303,703 0.0450,641 Grupo Aeroportuario del Pacifico 523,066 0.0729,459 Grupo Aeroportuario del Sureste 539,132 0.077,247 GS Engineering & Construction 191,574 0.038,782 Hyundai Development Co-Engineering & Construction 316,236 0.0410,933 Hyundai Engineering & Construction 370,714 0.054,433 Hyundai Heavy Industries 416,157 0.05
CONCEPT FUND SOLUTIONS PLC
464
db x-trackers MSCI Emerging Markets Index UCITS ETF (DR)
Portfolio of Investments as at 31 December 2017 cont/d
Equities - 91.96% cont/d
Number ofShares Security
ValueUSD
% ofFund
Construction and Engineering cont/d316,500 Jasa Marga Persero 149,298 0.023,275 KEPCO Plant Service & Engineering 124,202 0.0236,654 Larsen & Toubro 722,571 0.09120,700 Malaysia Airports Holdings 262,158 0.0333,213 Promotora y Operadora de Infraestructura 330,407 0.0436,919 Samsung Heavy Industries 252,782 0.0323,808 TAV Havalimanlari Holding 141,029 0.02690,900 Waskita Karya Persero 112,540 0.01
9,143,726 1.16
Containers and Packaging225,000 Lee & Man Paper Manufacturing 265,949 0.03
265,949 0.03
Distribution and Wholesale261,900 AKR Corporindo 122,577 0.02174,400 Berli Jucker 353,188 0.046,551 Hanwha 253,950 0.0313,681 LG 1,162,927 0.155,398 Posco Daewoo 91,517 0.0119,879 SK Networks 123,484 0.02
2,107,643 0.27
Diversified Financials296,757 B3 - Brasil Bolsa Balcao 2,037,962 0.2612,704 Bajaj Finance 349,647 0.042,938 Bajaj Finserv 240,757 0.0337,982 BNK Financial Group 334,212 0.0453,416 Brait 179,751 0.025,699 Capitec Bank Holdings 505,434 0.06176,000 Chailease Holding 512,176 0.071,247,412 China Cinda Asset Management 456,372 0.061,910,000 China Development Financial Holding 651,461 0.08135,001 China Everbright 301,871 0.04466,812 China Galaxy Securities 343,960 0.041,443,528 China Huarong Asset Management 681,389 0.09325,816 CITIC Securities 671,863 0.0933,112 Coronation Fund Managers 197,656 0.032,530,000 CTBC Financial Holding 1,742,863 0.2224,631 DGB Financial Group 242,732 0.031,323,413 E.Sun Financial Holding 840,516 0.1136,170 Egyptian Financial Group-Hermes Holding 91,691 0.01287,704 Far East Horizon 245,479 0.031,322,260 First Financial Holding 868,666 0.11957,000 Fubon Financial Holding 1,630,455 0.21198,285 GF Securities 398,736 0.0533,093 Grupo de Inversiones Suramericana 446,858 0.0612,085 GT Capital Holdings 312,777 0.04471,743 Haitong Securities 684,324 0.0942,661 Hana Financial Group 1,984,511 0.2533,500 Hong Leong Financial Group 148,006 0.02116,349 Housing Development Finance 3,117,831 0.401,031,200 Hua Nan Financial Holdings 580,426 0.07237,858 Huatai Securities 473,446 0.0624,512 Indiabulls Housing Finance 459,536 0.0639,570 Investec 286,771 0.0457,245 KB Financial Group 3,390,157 0.435,681 Korea Investment Holdings 366,157 0.0522,929 LIC Housing Finance 202,428 0.0321,469 Mahindra & Mahindra Financial Services 159,132 0.02
CONCEPT FUND SOLUTIONS PLC
465
db x-trackers MSCI Emerging Markets Index UCITS ETF (DR)
Portfolio of Investments as at 31 December 2017 cont/d
Electric Utilities214,500 Aboitiz Power 178,535 0.02428,204 AES Gener 141,834 0.0231,663 Centrais Eletricas Brasileiras 184,608 0.0222,889 CEZ 534,543 0.071,494,594 CGN Power 405,324 0.05272,159 China Resources Power Holdings 506,906 0.0711,731 Cia Energetica de Minas Gerais 24,402 0.001,149,302 Colbun 264,348 0.0344,183 EDP - Energias do Brasil 186,477 0.0219,600 Electricity Generating 129,905 0.024,098,659 Enel Americas 913,264 0.122,859,994 Enel Chile 338,606 0.04477,803 Enel Generacion Chile 432,655 0.0623,763 Engie Brasil Energia 254,386 0.0328,246 Equatorial Energia 559,027 0.0774,200 Glow Energy 184,988 0.02616,114 Huaneng Power International 386,189 0.05696,127 Huaneng Renewables 235,981 0.0378,199 Infraestructura Energetica Nova 385,489 0.054,560,741 Inter RAO UES 269,345 0.0356,470 Interconexion Electrica 268,680 0.0337,005 Korea Electric Power 1,318,706 0.1732,520 Manila Electric 214,064 0.03127,018 NTPC 352,234 0.05118,475 PGE Polska Grupa Energetyczna 410,851 0.054,009 Qatar Electricity & Water 199,239 0.0314,628,665 RusHydro 185,211 0.0285,405 Tata Power 125,109 0.02153,157 Tauron Polska Energia 134,433 0.02489,200 Tenaga Nasional 1,844,624 0.2426,885 Transmissora Alianca de Energia Eletrica 172,960 0.02299,882 YTL Power International 95,589 0.01
11,838,512 1.51
Electrical Equipment67,859 Bharat Heavy Electricals 98,342 0.01278,000 Delta Electronics 1,340,558 0.1719,250 Havells India 169,632 0.0215,329 LG Electronics 1,517,794 0.192,074 LG Innotek 278,974 0.045,488 Siemens 106,450 0.02
3,511,750 0.45
Electronics105,749 AAC Technologies Holdings 1,885,742 0.241,235,000 AU Optronics 514,609 0.0797,500 BYD Electronic International 212,279 0.0373,300 Delta Electronics Thailand 164,751 0.022,250,000 Hon Hai Precision Industry 7,197,943 0.9239,000 KCE Electronics 99,026 0.0133,867 LG Display 945,891 0.1294,000 Micro-Star International 241,961 0.03277,000 Pegatron 670,195 0.098,159 Samsung Electro-Mechanics 762,132 0.10203,000 Synnex Technology International 276,615 0.03
CONCEPT FUND SOLUTIONS PLC
467
db x-trackers MSCI Emerging Markets Index UCITS ETF (DR)
Portfolio of Investments as at 31 December 2017 cont/d
Energy Equipment and Services349,082 China Everbright International 498,351 0.07462,129 China Longyuan Power Group 328,686 0.04162,100 Energy Absolute 261,131 0.031,005,681 Fullshare Holdings 463,133 0.061,894,988 GCL-Poly Energy Holdings 339,373 0.042,424 OCI 307,939 0.04
2,198,613 0.28
Food Products1,207 BGF Retail 236,766 0.0348,163 Bid 1,170,968 0.1547,835 Bidvest Group 842,677 0.1130,216 BIM Birlesik Magazalar 622,394 0.0863,962 BRF 705,740 0.092,207 Britannia Industries 162,834 0.02203,062 Cencosud 599,927 0.08437,000 Charoen Pokphand Foods 321,817 0.04396,165 China Mengniu Dairy 1,178,263 0.151,147 CJ CheilJedang 392,137 0.057,067 Dino Polska 160,262 0.025,083 Dongsuh 138,168 0.0230,437 Gruma 387,823 0.05233,866 Grupo Bimbo 520,074 0.0790,139 Grupo Lala 127,200 0.02339,700 Indofood CBP Sukses Makmur 222,836 0.03616,500 Indofood Sukses Makmur 346,476 0.04119,232 JBS 352,617 0.04407,570 JG Summit Holdings 588,658 0.074,069 Lotte 247,435 0.0314,804 M Dias Branco 232,519 0.0350,948 Magnit 1,393,428 0.181,778 Nestle India 219,254 0.038,300 Nestle Malaysia 211,653 0.033,192 Orion 311,582 0.04186 Ottogi 140,036 0.0218,655 Pioneer Foods Group 206,561 0.0368,300 PPB Group 290,954 0.0465,462 Shoprite Holdings 1,169,591 0.1528,046 SPAR Group 460,630 0.0677,600 Standard Foods 192,967 0.02278,500 Thai Union Group 170,057 0.0223,771 Tiger Brands 883,252 0.11285,691 Tingyi Cayman Islands Holding 555,499 0.0722,416 Ulker Biskuvi Sanayi 116,289 0.01693,000 Uni-President Enterprises 1,536,973 0.19128,430 Universal Robina 388,480 0.05729,044 Want Want China Holdings 610,855 0.08
18,415,652 2.35
Forest Products63,747 Suzano Papel e Celulose 359,179 0.05
359,179 0.05
CONCEPT FUND SOLUTIONS PLC
468
db x-trackers MSCI Emerging Markets Index UCITS ETF (DR)
Portfolio of Investments as at 31 December 2017 cont/d
Equities - 91.96% cont/d
Number ofShares Security
ValueUSD
% ofFund
Gas Utilities71,027 Beijing Enterprises Holdings 421,585 0.05249,739 China Gas Holdings 690,054 0.09125,560 China Resources Gas Group 455,352 0.06110,318 ENN Energy Holdings 786,746 0.1039,068 GAIL India 305,829 0.044,031 Korea Gas 160,216 0.021,589,100 Perusahaan Gas Negara Persero 204,970 0.02
3,024,752 0.38
Health Care Equipment and Supplies55,914 Aspen Pharmacare Holdings 1,253,322 0.16197,007 China Medical System Holdings 459,170 0.06104,289 Hengan International Group 1,157,314 0.15274,343 Shandong Weigao Group Medical Polymer 199,687 0.02
3,069,493 0.39
Health Care Providers and Services563,300 Bangkok Dusit Medical Services 361,245 0.0552,500 Bumrungrad Hospital 304,464 0.04299,300 IHH Healthcare 433,382 0.05182,772 Life Healthcare Group Holdings 409,687 0.05149,108 Netcare 302,913 0.047,667 SillaJen 669,623 0.09
2,481,314 0.32
Hotels, Restaurants and Leisure1,837,599 Alibaba Pictures Group 246,821 0.03466,039 DXB Entertainments 80,575 0.01328,600 Genting 747,003 0.10422,000 Genting Malaysia 587,067 0.0717,138 Kangwon Land 557,099 0.0731,372 OPAP 395,551 0.05
2,614,116 0.33
Household Durables114,682 Turkiye Sise ve Cam Fabrikalari 142,158 0.02
Insurance100,301 BB Seguridade Participacoes 861,468 0.111,180,000 Cathay Financial Holding 2,121,411 0.271,072,752 China Life Insurance 3,368,946 0.43352,985 China Life Insurance - Taiwan 355,256 0.05379,992 China Pacific Insurance Group 1,825,272 0.23232,143 China Taiping Insurance Holdings 870,095 0.116,994 DB Insurance 465,156 0.0650,624 Discovery 760,587 0.10375,114 Fosun International 831,102 0.1137,906 Hanwha Life Insurance 244,669 0.038,762 Hyundai Marine & Fire Insurance 384,675 0.054,729 ING Life Insurance Korea 235,887 0.0318,755 Liberty Holdings 188,504 0.02137,621 MMI Holdings 233,444 0.03112,955 New China Life Insurance 771,596 0.1038,687 Odontoprev 185,557 0.021,016,720 People's Insurance Group of China 500,732 0.06661,888 PICC Property & Casualty 1,271,738 0.16751,278 Ping An Insurance Group of China 7,818,104 1.0016,475 Porto Seguro 180,440 0.0287,113 Powszechny Zaklad Ubezpieczen 1,056,948 0.1419,812 Qatar Insurance 292,121 0.044,435 Samsung Fire & Marine Insurance 1,106,109 0.1410,089 Samsung Life Insurance 1,173,304 0.15202,948 Sanlam 1,426,210 0.181,197,000 Shin Kong Financial Holding 422,350 0.0527,635 Sul America 155,458 0.02
29,107,139 3.71
Leisure Equipment and Products6,469 Bajaj Auto 337,865 0.0446,000 Giant Manufacturing 252,735 0.033,852 Hero MotoCorp 228,434 0.03
819,034 0.10
Machinery5,106 Doosan Bobcat 170,749 0.027,755 Doosan Heavy Industries & Construction 111,194 0.0292,980 Haitian International Holdings 279,512 0.041,414 Hyundai Robotics 503,231 0.06411,330 Shanghai Electric Group 169,430 0.02272,000 Teco Electric and Machinery 260,497 0.03245,100 United Tractors 639,509 0.08
CONCEPT FUND SOLUTIONS PLC
470
db x-trackers MSCI Emerging Markets Index UCITS ETF (DR)
Portfolio of Investments as at 31 December 2017 cont/d
Equities - 91.96% cont/d
Number ofShares Security
ValueUSD
% ofFund
Machinery cont/d82,295 WEG 598,153 0.08
2,732,275 0.35
Media227,800 Astro Malaysia Holdings 149,165 0.0210,049 Cheil Worldwide 198,999 0.032,757 CJ E&M 251,608 0.0332,595 Cyfrowy Polsat 233,197 0.03352,403 Grupo Televisa 1,325,282 0.1763,168 Naspers 17,608,463 2.24851,400 Surya Citra Media 155,627 0.0240,685 Zee Entertainment Enterprises 370,852 0.05
20,293,193 2.59
Metals and Mining2,095,800 Adaro Energy 287,318 0.04375,275 Alrosa 489,274 0.06554,416 Aluminum of China 396,452 0.057,846 Anglo American Platinum 224,010 0.0358,182 AngloGold Ashanti 604,472 0.08291,500 Banpu 174,417 0.0216,136 Bharat Forge 184,928 0.0294,032 Catcher Technology 1,036,426 0.13546,000 China Molybdenum 350,622 0.04489,987 China Shenhua Energy 1,269,267 0.161,824,000 China Steel 1,517,012 0.1927,498 Cia de Minas Buenaventura 387,172 0.0590,933 Cia Siderurgica Nacional 229,724 0.0352,581 Coal India 216,618 0.03197,965 Eregli Demir ve Celik Fabrikalari 523,159 0.0733,960 Exxaro Resources 445,759 0.06116,353 Gold Fields 508,457 0.06549,762 Grupo Mexico 1,823,876 0.2389,843 Hindalco Industries 385,046 0.052,956 Hyosung 385,187 0.0511,658 Hyundai Steel 638,138 0.0820,264 Industrias Penoles 424,275 0.057,693 Jastrzebska Spolka Weglowa 213,136 0.03181,872 Jiangxi Copper 288,490 0.0465,165 JSW Steel 275,454 0.0419,958 KGHM Polska Miedz 638,693 0.081,225 Korea Zinc 564,126 0.079,285 Kumba Iron Ore 284,348 0.04310,464 Magnitogorsk Iron & Steel Works 225,738 0.039,160 MMC Norilsk Nickel 1,726,313 0.22174,584 Novolipetsk Steel 446,443 0.063,761 Polyus 300,181 0.0410,683 POSCO 3,318,012 0.42188,600 Press Metal Aluminium Holdings 251,187 0.0329,637 Severstal 456,823 0.06249,463 Sibanye Gold 318,781 0.0412,365 Southern Copper 586,719 0.0723,179 Tata Steel 265,972 0.03456,952 Vale 5,546,076 0.71114,506 Vedanta 591,838 0.08270,072 Yanzhou Coal Mining 315,769 0.04835,535 Zijin Mining Group 315,304 0.04
29,431,012 3.75
CONCEPT FUND SOLUTIONS PLC
471
db x-trackers MSCI Emerging Markets Index UCITS ETF (DR)
Portfolio of Investments as at 31 December 2017 cont/d
Equities - 91.96% cont/d
Number ofShares Security
ValueUSD
% ofFund
Oil and Gas58,478 Bharat Petroleum 474,311 0.06263,775 China Oilfield Services 256,780 0.033,677,829 China Petroleum & Chemical 2,695,811 0.342,574,024 CNOOC 3,694,440 0.4723,761 Cosan Industria e Comercio 297,272 0.04440,000 Dialog Group 272,894 0.03695,387 Ecopetrol 514,929 0.07193,000 Formosa Petrochemical 749,080 0.101,533,420 Gazprom 3,475,890 0.4413,456 Grupa Lotos 223,441 0.037,191 GS Holdings 417,804 0.0546,945 Hindustan Petroleum 307,879 0.0444,868 Indian Oil 273,134 0.04470,265 Kunlun Energy 489,678 0.0661,224 Lukoil 3,546,066 0.4553,702 MOL Hungarian Oil & Gas 624,679 0.0813,077 Novatek - England listing 1,571,855 0.2098,830 Oil & Natural Gas 302,246 0.043,040,890 PetroChina 2,120,022 0.27429,038 Petroleo Brasileiro 2,187,161 0.2835,100 Petronas Dagangan 210,409 0.03100,800 Petronas Gas 435,380 0.0634,481 Petronet LNG 137,622 0.0243,148 Polski Koncern Naftowy Orlen 1,316,245 0.17247,264 Polskie Gornictwo Naftowe i Gazownictwo 447,591 0.06152,000 PTT 2,052,163 0.26202,000 PTT Exploration & Production 619,822 0.08198,926 Reliance Industries 2,870,562 0.37169,811 Rosneft Oil 859,803 0.11567,300 Sapura Energy 99,526 0.0179,806 Sasol 2,760,205 0.359,332 SK Innovation 1,782,630 0.236,559 S-Oil 716,831 0.091,040,597 Surgutneftegas 504,110 0.06218,791 Tatneft 1,819,608 0.23158,100 Thai Oil 502,097 0.0618,241 Tupras Turkiye Petrol Rafinerileri 584,524 0.0752,127 Ultrapar Participacoes 1,178,597 0.15
43,393,097 5.53
Paper and Related Products182,053 Empresas CMPC 619,060 0.0835,413 Fibria Celulose 510,841 0.0785,830 Klabin 455,400 0.0616,643 Mondi 429,209 0.05238,197 Nine Dragons Paper Holdings 381,491 0.0581,035 Sappi 585,835 0.07
2,981,836 0.38
Personal Products4,632 Amorepacific 1,317,495 0.174,105 Amorepacific Group 540,661 0.0740,697 Dabur India 222,972 0.031,356 LG Household & Health Care 1,506,033 0.1925,120 Natura Cosmeticos 250,360 0.03
Software477,384 Alibaba Health Information Technology 241,217 0.039,697 CD Projekt 270,694 0.0342,183 HCL Technologies 588,523 0.08114,278 Kingsoft 380,084 0.0515,715 Momo 384,703 0.0511,424 NetEase 3,942,080 0.502,475 Netmarble Games 435,792 0.0636,028 Tech Mahindra 284,515 0.04135,819 TravelSky Technology 407,424 0.0516,223 Vakrangee 106,815 0.0116,223 Vakrangee 106,815 0.01
7,148,662 0.91
Textiles and Apparel23,260 Eclat Textile 232,534 0.03470,000 Far Eastern New Century 423,274 0.0550,000 Feng TAY Enterprise 227,666 0.03120,000 Formosa Taffeta 126,216 0.02188 LPP 482,065 0.06327,000 Pou Chen 423,605 0.05106,456 Shenzhou International Group Holdings 1,013,179 0.13
2,928,539 0.37
Transportation1,090,200 Bangkok Expressway & Metro 257,580 0.03851,400 BTS Group Holdings 216,834 0.031,154 CJ Logistics 150,913 0.023,185 Container of India 68,830 0.01280,499 Evergreen Marine Taiwan 154,112 0.022,624 Hyundai Glovis 333,346 0.04194,800 MISC 357,157 0.0431,130 Pan Ocean 153,244 0.0239,573 Qatar Gas Transport 174,830 0.02158,777 Rumo 620,825 0.08256,000 Taiwan High Speed Rail 202,161 0.03
2,689,832 0.34
Water380,845 Aguas Andinas 252,295 0.03682,718 Beijing Enterprises Water Group 528,372 0.0748,454 Cia de Saneamento Basico do Estado de Sao Paulo 501,470 0.06419,132 Guangdong Investment 560,823 0.07
CONCEPT FUND SOLUTIONS PLC
475
db x-trackers MSCI Emerging Markets Index UCITS ETF (DR)
Portfolio of Investments as at 31 December 2017 cont/d
Equities - 91.96% cont/d
Number ofShares Security
ValueUSD
% ofFund
Water cont/d2,065,400 Metro Pacific Investments 283,413 0.04
2,126,373 0.27Total Equities 721,825,654 91.96
Exchange Traded Funds - 4.18%
2,537,202 db x-trackers MSCI India TRN Index UCITS ETF 32,111,001 4.09374,496 db x-trackers MSCI Pakistan IM TRN Index UCITS ETF 669,170 0.09Total Exchange Traded Funds 32,780,171 4.18
Preferred Stocks - 3.52%
Automobiles3,321 Hyundai Motor 290,671 0.045,341 Hyundai Motor - 2nd Pref - 508,880 0.06
799,551 0.10
Banks440,208 Banco Bradesco 4,492,189 0.5764,427 Bancolombia 645,889 0.08511,607 Grupo Aval Acciones y Valores 221,134 0.03465,581 Itau Unibanco Holding 5,976,437 0.76
11,335,649 1.44
Beverages37,917 Embotelladora Andina 189,326 0.02
189,326 0.02
Chemicals24,163 Braskem 312,281 0.041,129 LG Chem 262,595 0.0314,031 Sociedad Quimica y Minera de Chile 833,856 0.11
1,408,732 0.18
Diversified Financials16,538 Grupo de Inversiones Suramericana 216,111 0.03
216,111 0.03
Diversified Telecommunications64,529 Telefonica Brasil 945,826 0.12
945,826 0.12
Electric Utilities32,853 Centrais Eletricas Brasileiras 224,824 0.03115,578 Cia Energetica de Minas Gerais 239,372 0.03
464,196 0.06
Food Products22,426 Cia Brasileira de Distribuicao 533,624 0.07
Net unrealised gain on open futures contracts 80,075 0.01Total Exchange Traded Financial Derivative Instruments 80,075 0.01
OTC Financial Derivative Instruments - 0.00%
Open Forward Foreign Currency Exchange Contracts**
- 0.00%
SettlementDate Amount Bought Amount Sold
UnrealisedlossUSD
% ofFund
08/03/2018 USD 772,136 KRW 828,000,000 (2,131) 0.00Unrealised loss on open forward foreign currency exchange contracts (2,131) 0.00Net unrealised loss on open forward foreign currency exchange contracts (2,131) 0.00Total OTC Financial Derivative Instruments (2,131) 0.00
Total Financial Derivative Instruments 77,944 0.01
CONCEPT FUND SOLUTIONS PLC
477
db x-trackers MSCI Emerging Markets Index UCITS ETF (DR)
Portfolio of Investments as at 31 December 2017 cont/dValueUSD
% ofFund
Total Financial Assets at Fair Value through Profit or Loss 782,306,728 99.67Other Net Assets - 0.33% 2,618,293 0.33
Net Assets Attributable to Redeeming Participating Shareholders 784,925,021 100.00
* The broker for the open futures contracts is Deutsche Bank AG Frankfurt.** The counterparty for the open forward foreign currency exchange contracts is Goldman Sachs International.
Analysis of Total Assets % of Total Assets31/12/2017
Transferable securities admitted to an official stock exchange listing 95.33Exchange Traded Funds 4.17Exchange Traded Financial Derivatives Instruments 0.01Current Assets 0.49Total Assets 100.00
CONCEPT FUND SOLUTIONS PLC
478
db x-trackers MSCI USA Consumer Discretionary Index UCITS ETF (DR)
Investment Manager’s Report for the financial year ended 31 December 2017
Investment Objective
The investment objective of the Fund is to track the performance before fees and expenses of the UnderlyingAsset, which is the MSCI USA Consumer Discretionary Index (the “Reference Index”). The Reference Indexis based on the MSCI USA Index (its “Parent Index”), and comprises those companies included in the ParentIndex that are classified as members of the GICS® consumer discretionary sector.
Fund Performance
Total Net Assets Net Assets per Share31/12/2017 Price (at 31/12/2017)
db x-trackers MSCI USA Consumer Discretionary IndexUCITS ETF (DR) $6,614,949 $34.82
Year to Date Year to DateFund Return Index Return
db x-trackers MSCI USA Consumer Discretionary IndexUCITS ETF (DR) 9.51% 9.49%
Year to Date Year to DateTracking Error Tracking Difference1
db x-trackers MSCI USA Consumer Discretionary IndexUCITS ETF (DR) 0.04% 0.03%
1The performance difference of the share class arose from various reasons such as inaccuracies in the index replication via optimization,various fee components like management fee, fixed fee and transaction costs, specific taxes respectively tax advantages. The realisedtracking error level is contrasted with the anticipated tracking error level; the level of realised tracking error was within the expected range,due to the effectiveness of replication techniques utilised over the 2017 period.
CONCEPT FUND SOLUTIONS PLC
479
db x-trackers MSCI USA Consumer Discretionary Index UCITS ETF (DR)
Media758 CBS 44,722 0.68422 Charter Communications 141,775 2.1410,256 Comcast 410,753 6.21346 Discovery Communications Class A Shares 7,744 0.12451 Discovery Communications Class C Shares 9,548 0.14495 DISH Network 23,636 0.36866 Interpublic Group 17,459 0.26233 Liberty Broadband 19,842 0.30441 Liberty Global Class A Shares 15,805 0.241,229 Liberty Global Class C Shares 41,589 0.63438 Liberty Media-Liberty Formula One 14,962 0.23201 Liberty Media-Liberty SiriusXM Class A Shares 7,972 0.12389 Liberty Media-Liberty SiriusXM Class C Shares 15,428 0.23830 News Class A Shares 13,454 0.20504 Omnicom Group 36,706 0.55188 Scripps Networks Interactive 16,051 0.243,514 Sirius XM Holdings 18,835 0.281,697 Time Warner 155,225 2.352,297 Twenty-First Century Fox Class A Shares 79,315 1.20964 Twenty-First Century Fox Class B Shares 32,892 0.50766 Viacom 23,601 0.363,363 Walt Disney 361,556 5.47
1,508,870 22.81
Retail160 Advance Auto Parts 15,950 0.24142 AutoNation 7,289 0.1161 AutoZone 43,394 0.66601 Best Buy 41,150 0.62398 CarMax 25,524 0.3956 Chipotle Mexican Grill 16,186 0.25272 Darden Restaurants 26,117 0.40598 Dollar General 55,620 0.84515 Dollar Tree 55,265 0.84105 Domino's Pizza 19,841 0.30512 Gap 17,439 0.26321 Genuine Parts 30,498 0.462,570 Home Depot 487,092 7.36370 Kohl's 20,065 0.30530 L Brands 31,917 0.48917 Liberty Interactive Group 22,393 0.34
CONCEPT FUND SOLUTIONS PLC
481
db x-trackers MSCI USA Consumer Discretionary Index UCITS ETF (DR)
Portfolio of Investments as at 31 December 2017 cont/d
Textiles and Apparel792 Hanesbrands 16,561 0.25329 Michael Kors Holdings 20,711 0.31138 Mohawk Industries 38,074 0.582,861 NIKE 178,955 2.70120 Ralph Lauren 12,443 0.19398 Under Armour Class A Shares 5,743 0.09404 Under Armour Class C Shares 5,381 0.08732 VF 54,168 0.82
Total Financial Assets at Fair Value through Profit or Loss 6,612,210 99.96Other Net Assets - 0.04% 2,739 0.04
Net Assets Attributable to Redeeming Participating Shareholders 6,614,949 100.00
Analysis of Total Assets % of Total Assets31/12/2017
Transferable securities admitted to an official stock exchange listing 99.93Current Assets 0.07Total Assets 100.00
CONCEPT FUND SOLUTIONS PLC
482
db x-trackers MSCI USA Consumer Staples Index UCITS ETF (DR)
Investment Manager’s Report for the financial year ended 31 December 2017
Investment Objective
The investment objective of the Fund is to track the performance before fees and expenses of the UnderlyingAsset, which is the MSCI USA Consumer Staples Index (the “Reference Index”). The Reference Index isbased on the MSCI USA Index (its “Parent Index”), and comprises those companies included in the ParentIndex that are classified as members of the GICS® consumer staples sector.
Fund Performance
Total Net Assets Net Assets per Share31/12/2017 Price (at 31/12/2017)
db x-trackers MSCI USA Consumer Staples Index UCITSETF (DR) $5,045,988 $31.54
Year to Date Year to DateFund Return Index Return
db x-trackers MSCI USA Consumer Staples Index UCITSETF (DR) 4.03% 3.91%
Year to Date Year to DateTracking Error Tracking Difference1
db x-trackers MSCI USA Consumer Staples Index UCITSETF (DR) 0.09% 0.12%
1The performance difference of the share class arose from various reasons such as inaccuracies in the index replication via optimization,various fee components like management fee, fixed fee and transaction costs, specific taxes respectively tax advantages. The realisedtracking error level is contrasted with the anticipated tracking error level; the level of realised tracking error was within the expected range,due to the effectiveness of replication techniques utilised over the 2017 period.
CONCEPT FUND SOLUTIONS PLC
483
db x-trackers MSCI USA Consumer Staples Index UCITS ETF (DR)
Portfolio of Investments as at 31 December 2017
Transferable Securities
Equities - 99.93%
Number ofShares Security
ValueUSD
% ofFund
Agriculture5,057 Altria Group 361,120 7.161,485 Archer-Daniels-Midland 59,519 1.18370 Bunge 24,820 0.494,093 Philip Morris International 432,425 8.57
db x-trackers MSCI USA Consumer Staples Index UCITS ETF (DR)
Portfolio of Investments as at 31 December 2017 cont/dValueUSD
% ofFund
Total Financial Assets at Fair Value through Profit or Loss 5,042,238 99.93Other Net Assets - 0.07% 3,750 0.07
Net Assets Attributable to Redeeming Participating Shareholders 5,045,988 100.00
Analysis of Total Assets % of Total Assets31/12/2017
Transferable securities admitted to an official stock exchange listing 99.75Current Assets 0.25Total Assets 100.00
CONCEPT FUND SOLUTIONS PLC
485
db x-trackers MSCI USA Energy Index UCITS ETF (DR)
Investment Manager’s Report for the financial year ended 31 December 2017
Investment Objective
The investment objective of the Fund is to track the performance before fees and expenses of the UnderlyingAsset, which is the MSCI USA Energy Index (the “Reference Index”). The Reference Index is based on theMSCI USA Index (its “Parent Index”), and comprises those companies included in the Parent Index that areclassified as members of the GICS® energy sector.
Fund Performance
Total Net Assets Net Assets per Share31/12/2017 Price (at 31/12/2017)
db x-trackers MSCI USA Energy Index UCITS ETF (DR) $5,590,803 $37.27
Year to Date Year to DateFund Return Index Return
db x-trackers MSCI USA Energy Index UCITS ETF (DR) 12.49% 12.42%
Year to Date Year to DateTracking Error Tracking Difference1
db x-trackers MSCI USA Energy Index UCITS ETF (DR) 0.08% 0.07%
1The performance difference of the share class arose from various reasons such as inaccuracies in the index replication via optimization,various fee components like management fee, fixed fee and transaction costs, specific taxes respectively tax advantages. The realisedtracking error level is contrasted with the anticipated tracking error level; the level of realised tracking error was within the expected range,due to the effectiveness of replication techniques utilised over the 2017 period.
CONCEPT FUND SOLUTIONS PLC
486
db x-trackers MSCI USA Energy Index UCITS ETF (DR)
Portfolio of Investments as at 31 December 2017
Transferable Securities
Equities - 99.95%
Number ofShares Security
ValueUSD
% ofFund
Oil and Gas2,167 Anadarko Petroleum 116,238 2.08575 Andeavor 65,746 1.18852 Antero Resources 16,188 0.291,469 Apache 62,021 1.111,568 Baker Hughes 49,612 0.891,784 Cabot Oil & Gas 51,022 0.91780 Cheniere Energy 41,995 0.757,316 Chevron 915,890 16.38367 Cimarex Energy 44,778 0.80574 Concho Resources 86,226 1.544,699 ConocoPhillips 257,928 4.61362 Continental Resources 19,175 0.341,926 Devon Energy 79,736 1.43341 Diamondback Energy 43,051 0.772,230 EOG Resources 240,639 4.30975 EQT 55,497 0.9916,359 Exxon Mobil 1,368,267 24.473,368 Halliburton 164,594 2.94419 Helmerich & Payne 27,084 0.491,103 Hess 52,359 0.94650 HollyFrontier 33,293 0.607,767 Kinder Morgan 140,350 2.513,278 Marathon Oil 55,497 0.991,953 Marathon Petroleum 128,859 2.311,466 National Oilwell Varco 52,805 0.95769 Newfield Exploration 24,247 0.431,790 Noble Energy 52,161 0.932,953 Occidental Petroleum 217,518 3.891,466 ONEOK 78,358 1.40860 Parsley Energy 25,318 0.451,680 Phillips 66 169,932 3.04656 Pioneer Natural Resources 113,390 2.03562 Plains GP Holdings 12,336 0.22957 Range Resources 16,326 0.295,364 Schlumberger 361,480 6.47832 Targa Resources 40,285 0.721,712 TechnipFMC 53,603 0.961,706 Valero Energy 156,798 2.813,197 Williams 97,477 1.74
Total Financial Assets at Fair Value through Profit or Loss 5,588,079 99.95Other Net Assets - 0.05% 2,724 0.05
Net Assets Attributable to Redeeming Participating Shareholders 5,590,803 100.00
Analysis of Total Assets % of Total Assets31/12/2017
Transferable securities admitted to an official stock exchange listing 99.92Current Assets 0.08Total Assets 100.00
CONCEPT FUND SOLUTIONS PLC
487
db x-trackers MSCI USA Financials Index UCITS ETF (DR)
Investment Manager’s Report for the financial year ended 31 December 2017
Investment Objective
The investment objective of the Fund is to track the performance before fees and expenses of the UnderlyingAsset, which is the MSCI USA Financials Index (the “Reference Index”). The Reference Index is based on theMSCI USA Index (its “Parent Index”), and comprises those companies included in the Parent Index that areclassified as members of the GICS® financials sector.
Fund Performance
Total Net Assets Net Assets per Share31/12/2017 Price (at 31/12/2017)
db x-trackers MSCI USA Financials Index UCITS ETF (DR) $144,777,153 $20.68
Year to Date Year to DateFund Return Index Return
db x-trackers MSCI USA Financials Index UCITS ETF (DR) 13.29% 13.25%
Year to Date Year to DateTracking Error Tracking Difference1
db x-trackers MSCI USA Financials Index UCITS ETF (DR) 0.05% 0.04%
1The performance difference of the share class arose from various reasons such as inaccuracies in the index replication via optimization,various fee components like management fee, fixed fee and transaction costs, specific taxes respectively tax advantages. The realisedtracking error level is contrasted with the anticipated tracking error level; the level of realised tracking error was within the expected range,due to the effectiveness of replication techniques utilised over the 2017 period.
CONCEPT FUND SOLUTIONS PLC
488
db x-trackers MSCI USA Financials Index UCITS ETF (DR)
Portfolio of Investments as at 31 December 2017
Transferable Securities
Equities - 99.98%
Number ofShares Security
ValueUSD
% ofFund
Banks412,148 Bank of America 12,166,609 8.4042,474 Bank of New York Mellon 2,287,650 1.5833,198 BB&T 1,650,604 1.1419,892 Capital One Financial 1,980,845 1.375,560 CIT Group 273,719 0.19112,048 Citigroup 8,337,492 5.7620,558 Citizens Financial Group 863,025 0.607,225 Comerica 627,202 0.435,934 East West Bancorp 360,965 0.2530,251 Fifth Third Bancorp 917,815 0.636,479 First Republic Bank 561,341 0.3915,118 Goldman Sachs Group 3,851,462 2.6644,760 Huntington Bancshares 651,706 0.45144,702 JPMorgan Chase & Co 15,474,432 10.6944,656 KeyCorp 900,711 0.625,614 M&T Bank 959,938 0.6656,617 Morgan Stanley 2,970,694 2.0520,083 New York Community Bancorp 261,481 0.188,912 Northern Trust 890,220 0.6114,149 People's United Financial 264,586 0.1819,715 PNC Financial Services Group 2,844,677 1.9649,074 Regions Financial 847,999 0.592,269 Signature Bank 311,443 0.2215,394 State Street 1,502,608 1.0419,759 SunTrust Banks 1,276,234 0.882,163 SVB Financial Group 505,644 0.3568,808 US Bancorp 3,686,733 2.55193,923 Wells Fargo & Co 11,765,308 8.138,301 Zions Bancorporation 421,940 0.29
79,415,083 54.85
Commercial Services and Supplies7,058 Moody's 1,041,831 0.7210,577 S&P Global Futures 1,791,744 1.24
2,833,575 1.96
Diversified Financials2,298 Affiliated Managers Group 471,664 0.3318,473 Ally Financial 538,673 0.3730,880 American Express 3,066,693 2.126,157 Ameriprise Financial 1,043,427 0.724,964 BlackRock 2,550,056 1.764,167 Cboe Global Markets 519,166 0.3649,586 Charles Schwab 2,547,233 1.7613,976 CME Group 2,041,195 1.4115,290 Discover Financial Services 1,176,107 0.8111,281 E*TRADE Financial 559,199 0.394,769 Eaton Vance 268,924 0.1910,643 FNF 417,631 0.2913,758 Franklin Resources 596,134 0.4124,204 Intercontinental Exchange 1,707,834 1.1816,707 Invesco 610,474 0.424,795 Nasdaq 368,400 0.255,330 Raymond James Financial 475,969 0.335,517 SEI Investments 396,452 0.2732,741 Synchrony Financial 1,264,130 0.879,868 T Rowe Price Group 1,035,449 0.72
CONCEPT FUND SOLUTIONS PLC
489
db x-trackers MSCI USA Financials Index UCITS ETF (DR)
Portfolio of Investments as at 31 December 2017 cont/d
db x-trackers MSCI USA Financials Index UCITS ETF (DR)
Portfolio of Investments as at 31 December 2017 cont/dValueUSD
% ofFund
Total Financial Assets at Fair Value through Profit or Loss 144,742,759 99.98Other Net Assets - 0.02% 34,394 0.02
Net Assets Attributable to Redeeming Participating Shareholders 144,777,153 100.00
Analysis of Total Assets % of Total Assets31/12/2017
Transferable securities admitted to an official stock exchange listing 99.91Current Assets 0.09Total Assets 100.00
CONCEPT FUND SOLUTIONS PLC
491
db x-trackers MSCI USA Health Care Index UCITS ETF (DR)
Investment Manager’s Report for the financial year ended 31 December 2017
Investment Objective
The investment objective of the Fund is to track the performance before fees and expenses of the UnderlyingAsset, which is the MSCI USA Health Care Index (the “Reference Index”). The Reference Index is based onthe MSCI USA Index (its “Parent Index”), and comprises those companies included in the Parent Index that areclassified as members of the GICS® health care sector.
Fund Performance
Total Net Assets Net Assets per Share31/12/2017 Price (at 31/12/2017)
db x-trackers MSCI USA Health Care Index UCITS ETF(DR) $4,910,829 $32.74
Year to Date Year to DateFund Return Index Return
db x-trackers MSCI USA Health Care Index UCITS ETF(DR) (0.31)% (0.35)%
Year to Date Year to DateTracking Error Tracking Difference1
db x-trackers MSCI USA Health Care Index UCITS ETF(DR) 0.05% 0.04%
1The performance difference of the share class arose from various reasons such as inaccuracies in the index replication via optimization,various fee components like management fee, fixed fee and transaction costs, specific taxes respectively tax advantages. The realisedtracking error level is contrasted with the anticipated tracking error level; the level of realised tracking error was within the expected range,due to the effectiveness of replication techniques utilised over the 2017 period.
CONCEPT FUND SOLUTIONS PLC
492
db x-trackers MSCI USA Health Care Index UCITS ETF (DR)
Total Financial Assets at Fair Value through Profit or Loss 4,882,845 99.43Other Net Assets - 0.57% 27,984 0.57
Net Assets Attributable to Redeeming Participating Shareholders 4,910,829 100.00
Analysis of Total Assets % of Total Assets31/12/2017
Transferable securities admitted to an official stock exchange listing 99.42Current Assets 0.58Total Assets 100.00
CONCEPT FUND SOLUTIONS PLC
494
db x-trackers MSCI USA Information Technology Index UCITS ETF (DR)
Investment Manager’s Report for the financial year ended 31 December 2017
Investment Objective
The investment objective of the Fund is to track the performance before fees and expenses of the UnderlyingAsset, which is the MSCI USA Information Technology Index (the “Reference Index”). The Reference Index isbased on the MSCI USA Index (its “Parent Index”), and comprises those companies included in the ParentIndex that are classified as members of the GICS® information technology sector.
Fund Performance
Total Net Assets Net Assets per Share31/12/2017 Price (at 31/12/2017)
db x-trackers MSCI USA Information Technology IndexUCITS ETF (DR) $6,837,242 $28.49
Year to Date Year to DateFund Return Index Return
db x-trackers MSCI USA Information Technology IndexUCITS ETF (DR) 9.06% 9.04%
Year to Date Year to DateTracking Error Tracking Difference1
db x-trackers MSCI USA Information Technology IndexUCITS ETF (DR) 0.04% 0.01%
1The performance difference of the share class arose from various reasons such as inaccuracies in the index replication via optimization,various fee components like management fee, fixed fee and transaction costs, specific taxes respectively tax advantages. The realisedtracking error level is contrasted with the anticipated tracking error level; the level of realised tracking error was within the expected range,due to the effectiveness of replication techniques utilised over the 2017 period.
CONCEPT FUND SOLUTIONS PLC
495
db x-trackers MSCI USA Information Technology Index UCITS ETF (DR)
Portfolio of Investments as at 31 December 2017
Transferable Securities
Equities - 99.93%
Number ofShares Security
ValueUSD
% ofFund
Aerospace and Defense142 Harris 20,114 0.29
20,114 0.29
Commercial Services and Supplies525 Automatic Data Processing 61,525 0.9042 CoStar Group 12,472 0.18109 FleetCor Technologies 20,975 0.31107 Gartner 13,177 0.19180 Global Payments 18,043 0.261,350 PayPal Holdings 99,387 1.45248 Sabre 5,084 0.08298 Square 10,332 0.15196 Total System Services 15,502 0.23192 Vantiv 14,121 0.21549 Western Union 10,436 0.15
281,054 4.11
Computers and Peripherals731 Accenture 111,909 1.64352 Alphabet Class A Shares 370,797 5.42370 Alphabet Class C Shares 387,168 5.666,106 Apple 1,033,318 15.11183 CDW 12,717 0.19698 Cognizant Technology Solutions 49,572 0.72240 Dell Technologies 19,507 0.29336 DXC Technology 31,886 0.471,202 eBay 45,363 0.6675 F5 Networks 9,842 0.142,802 Facebook 494,441 7.23178 Fortinet 7,777 0.111,920 Hewlett Packard Enterprise 27,571 0.401,990 HP 41,810 0.6187 IAC/InterActiveCorp 10,638 0.161,047 International Business Machines 160,631 2.35170 Leidos Holdings 10,977 0.1650 MercadoLibre 15,733 0.23319 NetApp 17,647 0.26109 Palo Alto Networks 15,798 0.23340 Seagate Technology 14,226 0.21726 Symantec 20,372 0.30738 Twitter 17,719 0.26106 VeriSign 12,131 0.18349 Western Digital 27,756 0.41124 Zillow Group 5,074 0.07
2,972,380 43.47
Diversified Financials59 Alliance Data Systems 14,955 0.221,116 Mastercard 168,918 2.472,163 Visa 246,625 3.61
Total Financial Assets at Fair Value through Profit or Loss 6,832,697 99.93Other Net Assets - 0.07% 4,545 0.07
Net Assets Attributable to Redeeming Participating Shareholders 6,837,242 100.00
Analysis of Total Assets % of Total Assets31/12/2017
Transferable securities admitted to an official stock exchange listing 99.92Current Assets 0.08Total Assets 100.00
CONCEPT FUND SOLUTIONS PLC
498
Statement of Financial Position as at 31 December 2017
NotePIANO
400 Fund1
db x-trackersEUR Liquid
Corporate 12.5UCITS ETF
db x-trackersPortfolio
IncomeUCITS ETF
db x-trackersMSCI NordicIndex UCITS
ETF (DR)EUR EUR EUR EUR
Current AssetsFinancial assets at fair value through profit or loss:Transferable securities held for trading 3(a)(iii) - 292,860,934 29,513,420 283,454,922Futures contracts 3(a)(vii) - - - -Forward foreign currency exchange contracts 3(a)(viii) - - - -Portfolio swap transactions at positive fair value 3(a)(iv) - 291,243,598 - -
- 584,104,532 29,513,420 283,454,922
Cash and cash equivalents 3(a)(v) - 49,533 16,059 54,281Cash held with brokers for derivative contracts 3(a)(vi) - - - 65,097
ReceivablesAmounts receivable for investments sold - - - -Amounts receivable for fund shares sold - - - -Securites lending receivable - - - 1,493Accrued income - - - 211,711Other receivables - - - -
Total Current Assets - 584,154,065 29,529,479 283,787,504
Current LiabilitiesFinancial liabilities at fair value through profit or loss:Futures contracts 3(a)(vii) - - - (4,520)Forward foreign currency exchange contracts 3(a)(viii) - - - -Portfolio swap transactions at negative fair value 3(a)(iv) - (292,860,841) - -
- (292,860,841) - (4,520)
PayablesBank overdraft - - - (17,128)Cash due to brokers for derivative contracts 3(a)(vi) - - - -Amounts payable for investments purchased - - - -Amounts payable for repurchase of shares - - - -Securities lending income payable - - - -Accrued expenses 4 - (87,591) (11,108) (57,765)
Total Current Liabilities - (292,948,432) (11,108) (79,413)
Net assets attributable to holders of redeemable participating shares - 291,205,633 29,518,371 283,708,091
1 PIANO 400 Fund terminated on 18 August 2017.
CONCEPT FUND SOLUTIONS PLC
The accompanying notes on pages 557 to 665 form an integral part of these financial statements. 499
Statement of Financial Position as at 31 December 2017 cont/d
Note
db x-trackersMittelstand &
MidCapGermany
UCITSETF (DR)
db x-trackersMSCI North
America HighDividend Yield
Index UCITSETF (DR)
db x-trackersMSCI AC World
Index UCITSETF (DR)
db x-trackersMSCI AC Far
East ex JapanIndex UCITS
ETF (DR)
db x-trackersMSCI USA
Index UCITSETF (DR)
EUR USD EUR EUR USD
Current AssetsFinancial assets at fair value through profit or loss:Transferable securities held for trading 3(a)(iii) 94,819,739 157,289,402 188,018,801 23,514,933 4,159,920,205Futures contracts 3(a)(vii) - 3,385 4,075 - 102,570Forward foreign currency exchange contracts 3(a)(viii) - - - - -Portfolio swap transactions at positive fair value 3(a)(iv) - - - - -
Cash and cash equivalents 3(a)(v) 996 2,410,328 - - -Cash held with brokers for derivative contracts 3(a)(vi) - 38,564 - - -
ReceivablesAmounts receivable for investments sold - - - - -Amounts receivable for fund shares sold - - - - -Securites lending receivable - - - - -Accrued income 51,642 1,439,795 4,666 12,883 4,612Other receivables - - - - -
Total Current Assets 46,702,311 786,197,546 6,616,876 5,055,121 5,592,691
Current LiabilitiesFinancial liabilities at fair value through profit or loss:Futures contracts 3(a)(vii) (170) - - - -Forward foreign currency exchange contracts 3(a)(viii) - (2,131) - - -Portfolio swap transactions at negative fair value 3(a)(iv) - - - - -
(170) (2,131) - - -
PayablesBank overdraft (11,024) (1,165,418) (1,257) (8,622) (1,335)Cash due to brokers for derivative contracts 3(a)(vi) (1) - - - -Amounts payable for investments purchased - - - - -Amounts payable for repurchase of shares - - - - -Securities lending income payable - - - - -Accrued expenses 4 (9,999) (104,976) (670) (511) (553)
Total Current Liabilities (21,194) (1,272,525) (1,927) (9,133) (1,888)
Net assets attributable to holders of redeemable participating shares 46,681,117 784,925,021 6,614,949 5,045,988 5,590,803
1 db x-trackers MSCI Emerging Markets Index UCITS ETF (DR) launched on 21 June 2017.2 db x-trackers MSCI USA Consumer Discretionary Index UCITS ETF (DR), db x-trackers MSCI USA Consumer Staples Index UCITS ETF (DR) and db x-trackers MSCI USA Energy Index UCITS ETF (DR)
launched on 12 September 2017.
CONCEPT FUND SOLUTIONS PLC
The accompanying notes on pages 557 to 665 form an integral part of these financial statements. 507
Statement of Financial Position as at 31 December 2017 cont/d
Note
db x-trackersMSCI USA
Financials IndexUCITS ETF (DR)1
db x-trackersMSCI USA
Health CareIndex UCITS
ETF (DR)1
db x-trackersMSCI USA
InformationTechnology
IndexUCITS ETF (DR)1
USD USD USD
Current AssetsFinancial assets at fair value through profit or loss:Transferable securities held for trading 3(a)(iii) 144,742,759 4,882,845 6,832,697Futures contracts 3(a)(vii) - - -Forward foreign currency exchange contracts 3(a)(viii) - - -Portfolio swap transactions at positive fair value 3(a)(iv) - - -
144,742,759 4,882,845 6,832,697
Cash and cash equivalents 3(a)(v) - 24,843 3,812Cash held with brokers for derivative contracts 3(a)(vi) - - -
ReceivablesAmounts receivable for investments sold - - -Amounts receivable for fund shares sold - - -Securites lending receivable - - -Accrued income 127,752 3,644 1,431Other receivables - - -
Total Current Assets 144,870,511 4,911,332 6,837,940
Current LiabilitiesFinancial liabilities at fair value through profit or loss:Futures contracts 3(a)(vii) - - -Forward foreign currency exchange contracts 3(a)(viii) - - -Portfolio swap transactions at negative fair value 3(a)(iv) - - -
- - -
PayablesBank overdraft (78,780) - -Cash due to brokers for derivative contracts 3(a)(vi) - - -Amounts payable for investments purchased - - -Amounts payable for repurchase of shares - - -Securities lending income payable - - -Accrued expenses 4 (14,578) (503) (698)
Total Current Liabilities (93,358) (503) (698)
Net assets attributable to holders of redeemable participating shares 144,777,153 4,910,829 6,837,242
1 db x-trackers MSCI USA Financials Index UCITS ETF (DR), db x-trackers MSCI USA Health Care Index UCITS ETF (DR) and db x-trackers MSCI USA Information Technology Index UCITS ETF (DR) launchedon 12 September 2017.
CONCEPT FUND SOLUTIONS PLC
The accompanying notes on pages 557 to 665 form an integral part of these financial statements. 508
Statement of Financial Position as at 31 December 2016
NotePIANO
400 Fund
db x-trackersEUR Liquid
Corporate 12.5UCITS ETF
db x-trackersPortfolio
IncomeUCITS ETF
db x-trackersStiftungs-Stabilität
UCITS ETF1
db x-trackersMSCI NordicIndex UCITS
ETF (DR)EUR EUR EUR EUR EUR
Current AssetsFinancial assets at fair value through profit or loss:Transferable securities held for trading 3(a)(iii) - 357,440,917 23,314,940 - 85,591,366Futures contracts 3(a)(vii) - - - - -Forward foreign currency exchange contracts 3(a)(viii) - - - - -Portfolio swap transactions at positive fair value 3(a)(iv) - 4,904,531 - - -Funded swaps at positive fair value 3(a)(v) 488,336,276 - - - -
488,336,276 362,345,448 23,314,940 - 85,591,366
Cash and cash equivalents 3(a)(v) 44 25,101 1,105 967 134,161Cash held with brokers for derivative contracts 3(a)(vi) - - - - 49,376
ReceivablesAmounts receivable for investments sold - - - - -Amounts receivable for fund shares sold - - - - -Securites lending receivable - - - - 660Accrued income - 1,594,942 - - 125,814Other receivables - - - - -
Total Current Assets 488,336,320 363,965,491 23,316,045 967 85,901,377
Current LiabilitiesFinancial liabilities at fair value through profit or loss:Futures contracts 3(a)(vii) - - - - (1,777)Forward foreign currency exchange contracts 3(a)(viii) - - - - -Portfolio swap transactions at negative fair value 3(a)(iv) - - - - -
- - - - (1,777)
PayablesBank overdraft - - - - (149,325)Cash due to brokers for derivative contracts 3(a)(vi) - - - - -Amounts payable for investments purchased - - - - -Amounts payable for repurchase of shares - - - - -Securities lending income payable - - - - -Accrued expenses 4 (1,505,975) (105,847) (8,368) (967) (20,868)
Total Current Liabilities (1,505,975) (105,847) (8,368) (967) (171,970)
Net assets attributable to holders of redeemable participating shares 486,830,345 363,859,644 23,307,677 - 85,729,407
1 db x-trackers Stiftungs-Stabilität UCITS ETF terminated on 27 June 2016, but is not revoked.
CONCEPT FUND SOLUTIONS PLC
The accompanying notes on pages 557 to 665 form an integral part of these financial statements. 510
Statement of Financial Position as at 31 December 2016 cont/d
Note
db x-trackersMSCI TurkeyIndex UCITS
ETF (DR)1
db x-trackersMittelstand &
MidCapGermany
UCITSETF (DR)
db x-trackersMSCI North
America HighDividend Yield
Index UCITSETF (DR)
db x-trackersMSCI AC World
Index UCITSETF (DR)
db x-trackersMSCI AC Far
East ex JapanIndex UCITS
ETF (DR)USD EUR USD EUR EUR
Current AssetsFinancial assets at fair value through profit or loss:Transferable securities held for trading 3(a)(iii) - 50,108,387 117,595,873 137,115,662 18,935,069Futures contracts 3(a)(vii) - 2,535 - 2,636 -Forward foreign currency exchange contracts 3(a)(viii) - - - - -Portfolio swap transactions at positive fair value 3(a)(iv) - - - - -Funded swaps at positive fair value 3(a)(v) - - - - -
- 50,110,922 117,595,873 137,118,298 18,935,069
Cash and cash equivalents 3(a)(v) 179 39,804 57,668 202,716 69,773Cash held with brokers for derivative contracts 3(a)(vi) - 21,114 48,645 244,625 3,143
ReceivablesAmounts receivable for investments sold - - - 55,042 9,250Amounts receivable for fund shares sold - - - - -Securites lending receivable - 5,378 - 572 -Accrued income - 81,725 209,154 211,974 46,818Other receivables - 2,414 - - -
Total Current Assets 179 50,261,357 117,911,340 137,833,227 19,064,053
Current LiabilitiesFinancial liabilities at fair value through profit or loss:Futures contracts 3(a)(vii) - - (610) (2,588) -Forward foreign currency exchange contracts 3(a)(viii) - - - - -Portfolio swap transactions at negative fair value 3(a)(iv) - - - - -
- - (610) (2,588) -
PayablesBank overdraft - - - (4,543) (81,151)Cash due to brokers for derivative contracts 3(a)(vi) - - - (14) -Amounts payable for investments purchased - - - (54,554) (24,088)Amounts payable for repurchase of shares - - - - -Securities lending income payable (64) - - - -Accrued expenses 4 (115) (16,557) (38,864) (58,811) (11,337)
Total Current Liabilities (179) (16,557) (39,474) (120,510) (116,576)
Net assets attributable to holders of redeemable participating shares - 50,244,800 117,871,866 137,712,717 18,947,477
1 db x-trackers MSCI Turkey Index UCITS ETF (DR) terminated on 27 June 2016, but not revoked.
CONCEPT FUND SOLUTIONS PLC
The accompanying notes on pages 557 to 665 form an integral part of these financial statements. 511
Statement of Financial Position as at 31 December 2016 cont/d
Note
db x-trackersMSCI USA
Index UCITSETF (DR)
db x-trackersS&P 500®
Equal WeightUCITS
ETF (DR)
db x-trackersMSCI World
IndexUCITS
ETF (DR)
db x-trackersFTSE
DevelopedEurope ex UK
PropertyUCITS
ETF (DR)
db x-trackersMSCI World
MinimumVolatility UCITS
ETF (DR)USD USD USD EUR USD
Current AssetsFinancial assets at fair value through profit or loss:Transferable securities held for trading 3(a)(iii) 1,943,749,182 429,016,054 1,824,774,320 92,053,299 65,686,905Futures contracts 3(a)(vii) - - 18,716 - -Forward foreign currency exchange contracts 3(a)(viii) - - - - -Portfolio swap transactions at positive fair value 3(a)(iv) - - - - -Funded swaps at positive fair value 3(a)(v) - - - - -
Cash and cash equivalents 3(a)(v) 7,506 49,955 6,210 280,645 90,853Cash held with brokers for derivative contracts 3(a)(vi) - - - - -
ReceivablesAmounts receivable for investments sold - 2,546 - - -Amounts receivable for fund shares sold - 8,624,967 - - -Securites lending receivable - - - - -Accrued income 18,530 22,366 10,205 502,111 306,475Other receivables - - - - -
Total Current Assets 7,193,651 31,558,540 11,274,957 35,350,599 24,712,124
Current LiabilitiesFinancial liabilities at fair value through profit or loss:Futures contracts 3(a)(vii) - - - - -Forward foreign currency exchange contracts 3(a)(viii) - - - - -Portfolio swap transactions at negative fair value 3(a)(iv) - - - - -
- - - - -
PayablesBank overdraft (17,784) (41,293) (8,223) - -Cash due to brokers for derivative contracts 3(a)(vi) - - - - -Amounts payable for investments purchased (3,418) (8,680,998) - - -Amounts payable for repurchase of shares (39) - - - -Securities lending income payable (-) - - - -Accrued expenses 4 (2,688) (3,755) (4,089) (14,303) (1,952)
Total Current Liabilities (23,929) (8,726,046) (12,312) (14,303) (1,952)
Net assets attributable to holders of redeemable participating shares 7,169,722 22,832,494 11,262,645 35,336,296 24,710,172
CONCEPT FUND SOLUTIONS PLC
The accompanying notes on pages 557 to 665 form an integral part of these financial statements. 517
Statement of Financial Position as at 31 December 2016 cont/d
Note
db x-trackersMSCI USAMinimumVolatility
UCITS ETF(DR)
db x-trackersMSCI EMU
MinimumVolatility
UCITS ETF(DR) Total
USD EUR EUR
Current AssetsFinancial assets at fair value through profit or loss:Transferable securities held for trading 3(a)(iii) 5,267,038 5,307,358 8,330,058,683Futures contracts 3(a)(vii) - - 39,181Forward foreign currency exchange contracts 3(a)(viii) - - 2,304,149Portfolio swap transactions at positive fair value 3(a)(iv) - - 49,317,223Funded swaps at positive fair value 3(a)(v) - - 488,336,276
5,267,038 5,307,358 8,870,055,512
Cash and cash equivalents 3(a)(v) - - 19,785,873Cash held with brokers for derivative contracts 3(a)(vi) - - 5,195,434
ReceivablesAmounts receivable for investments sold - - 98,749,255Amounts receivable for fund shares sold - - 25,485,122Securites lending receivable - - 49,875Accrued income 8,414 5,749 17,607,134Other receivables - - 222,259
Total Current Assets 5,275,452 5,313,107 9,037,150,464
Current LiabilitiesFinancial liabilities at fair value through profit or loss:Futures contracts 3(a)(vii) - - (113,935)Forward foreign currency exchange contracts 3(a)(viii) - - (6,597,722)Portfolio swap transactions at negative fair value 3(a)(iv) - - (46,004,142)
- - (52,715,799)
PayablesBank overdraft (3,262) (481) (1,523,392)Cash due to brokers for derivative contracts 3(a)(vi) - - (15)Amounts payable for investments purchased (2,991) - (30,686,573)Amounts payable for repurchase of shares - - (90,561,473)Securities lending income payable - - (61)Accrued expenses 4 (888) (1,099) (6,675,875)
Total Current Liabilities (7,141) (1,580) (182,163,188)
Net assets attributable to holders of redeemable participating shares 5,268,311 5,311,527 8,854,987,276
CONCEPT FUND SOLUTIONS PLC
The accompanying notes on pages 557 to 665 form an integral part of these financial statements. 518
Statement of Comprehensive Income for financial year ended 31 December 2017
NotePIANO
400 Fund1
db x-trackersEUR Liquid
Corporate 12.5UCITS ETF
db x-trackersPortfolio
IncomeUCITS ETF
db x-trackersMSCI NordicIndex UCITS
ETF (DR)
db x-trackersMittelstand &
MidCapGermany
UCITSETF (DR)
EUR EUR EUR EUR EUR
Investment incomeNet (losses)/gains on investments at fair value through profit or loss during thefinancial year 6 (2,078,133) 13,698,314 541,882 6,646,527 16,789,052Income from investments at fair value through profit or loss 3(b),3(h) - 719,478 227,360 3,808,469 1,182,282Securities lending income 3(i),14 - - - 16,690 103,293Bank interest 3(b) 4,016,844 5,645 18 - -
Total investment income 1,938,711 14,423,437 769,260 10,471,686 18,074,627
Total operating expenses (3,228,048) (1,078,775) (114,907) (464,803) (270,396)
(Loss)/profit for the financial year before tax 3(e),5 (1,289,337) 13,344,662 654,353 10,006,883 17,804,231Withholding tax (56,078) - - (119,595) (157,176)Capital gain tax - - - - -
(Loss)/profit for the financial year after tax (1,345,415) 13,344,662 654,353 9,887,288 17,647,055
Net (decrease)/increase in net assets attributable to holders ofredeemable participating shares resulting from operations (1,345,415) 13,344,662 654,353 9,887,288 17,647,055
1 PIANO 400 Fund terminated on 18 August 2017.
There are no recognised gains and losses other than those dealt with in the Statement of Comprehensive Income.
All amounts arose from continuing operations, with the exception of PIANO 400 Fund.
CONCEPT FUND SOLUTIONS PLC
The accompanying notes on pages 557 to 665 form an integral part of these financial statements. 519
Statement of Comprehensive Income for financial year ended 31 December 2017 cont/d
Note
db x-trackersMSCI North
America HighDividend Yield
Index UCITSETF (DR)
db x-trackersMSCI AC World
Index UCITSETF (DR)
db x-trackersMSCI AC Far
East ex JapanIndex UCITS
ETF (DR)
db x-trackersMSCI USA
Index UCITSETF (DR)
db x-trackersS&P 500®
Equal WeightUCITS
ETF (DR)USD EUR EUR USD USD
Investment incomeNet gains on investments at fair value through profit or loss during the financialyear 6 20,945,902 8,168,480 4,210,968 534,360,161 78,103,368Income from investments at fair value through profit or loss 3(b),3(h) 4,295,738 4,113,606 575,932 61,708,824 9,889,296Securities lending income 3(i),14 - 11,221 - 197,327 39,682Bank interest 3(b) 59 569 36 11,770 608
Total investment income 25,241,699 12,293,876 4,786,936 596,278,082 88,032,954
Total operating expenses (523,192) (706,062) (133,240) (2,155,689) (1,255,088)
Profit for the financial year before tax 3(e),5 24,718,507 11,587,814 4,653,696 594,122,393 86,777,866Withholding tax (648,774) (502,221) (63,768) (9,129,357) (1,514,195)Capital gain tax - (11,120) - - -
Profit for the financial year after tax 24,069,733 11,074,473 4,589,928 584,993,036 85,263,671
Net increase in net assets attributable to holders of redeemableparticipating shares resulting from operations 24,069,733 11,074,473 4,589,928 584,993,036 85,263,671
There are no recognised gains and losses other than those dealt with in the Statement of Comprehensive Income.
All amounts arose from continuing operations.
CONCEPT FUND SOLUTIONS PLC
The accompanying notes on pages 557 to 665 form an integral part of these financial statements. 520
Statement of Comprehensive Income for financial year ended 31 December 2017 cont/d
Note
db x-trackersMSCI World
IndexUCITS
ETF (DR)
db x-trackersFTSE
DevelopedEurope ex UK
PropertyUCITS
ETF (DR)
db x-trackersMSCI World
MinimumVolatility UCITS
ETF (DR)
db-x trackersMSCI WorldMomentum
Factor UCITSETF (DR)
db x-trackersMSCI World
Quality FactorUCITS ETF
(DR)USD EUR USD USD USD
Investment incomeNet gains on investments at fair value through profit or loss during the financialyear 6 434,429,803 7,848,728 8,413,294 14,231,864 11,830,193Income from investments at fair value through profit or loss 3(b),3(h) 58,301,178 2,798,888 1,610,236 1,016,680 1,547,221Securities lending income 3(i),14 222,956 5,570 3,347 1,971 2,199Bank interest 3(b) 5,025 - - - 19
Total investment income 492,958,962 10,653,186 10,026,877 15,250,515 13,379,632
Total operating expenses (4,600,908) (259,819) (153,113) (143,883) (158,168)
Profit for the financial year before tax 3(e),5 488,358,054 10,393,367 9,873,764 15,106,632 13,221,464Withholding tax (6,961,613) (246,258) (249,481) (107,318) (175,916)Capital gain tax - - - - -
Profit for the financial year after tax 481,396,441 10,147,109 9,624,283 14,999,314 13,045,548
Net increase in net assets attributable to holders of redeemableparticipating shares resulting from operations 481,396,441 10,147,109 9,624,283 14,999,314 13,045,548
There are no recognised gains and losses other than those dealt with in the Statement of Comprehensive Income.
All amounts arose from continuing operations.
CONCEPT FUND SOLUTIONS PLC
The accompanying notes on pages 557 to 665 form an integral part of these financial statements. 521
Statement of Comprehensive Income for financial year ended 31 December 2017 cont/d
Note
db x-trackersMSCI World
Value FactorUCITS ETF
(DR)
DeutscheMSCI WorldIndex Fund
db x-trackersMSCI GCC
Select IndexUCITS ETF
db x-trackersFTSE All-
World ex UKUCITS ETF
(DR)
db x-trackersS&P 500
UCITSETF (DR)
USD EUR USD GBP USD
Investment incomeNet gains on investments at fair value through profit or loss during the financialyear 6 28,527,933 1,721,091 818,910 3,324,349 252,818,668Income from investments at fair value through profit or loss 3(b),3(h) 4,398,373 960,484 47 813,531 19,317,350Securities lending income 3(i),14 9,205 1,594 - 344 33,303Bank interest 3(b) - 12 17 13 -
Total investment income 32,935,511 2,683,181 818,974 4,138,237 272,169,321
Total operating expenses (400,849) (35,133) (165,616) (139,394) (2,063,505)
Profit for the financial year before tax 3(e),5 32,534,662 2,648,048 653,358 3,998,843 270,105,816Withholding tax (467,560) (169,461) - (111,478) (2,839,516)Capital gain tax - - - (3,396) -
Profit for the financial year after tax 32,067,102 2,478,587 653,358 3,883,969 267,266,300
Net increase in net assets attributable to holders of redeemableparticipating shares resulting from operations 32,067,102 2,478,587 653,358 3,883,969 267,266,300
There are no recognised gains and losses other than those dealt with in the Statement of Comprehensive Income.
All amounts arose from continuing operations.
CONCEPT FUND SOLUTIONS PLC
The accompanying notes on pages 557 to 665 form an integral part of these financial statements. 522
Statement of Comprehensive Income for financial year ended 31 December 2017 cont/d
Note
db x-trackersRussell 2000
UCITSETF (DR)
db x-trackersRussellMidcapUCITS
ETF (DR)
db x-trackersJPX-Nikkei 400
UCITSETF (DR)
db x-trackersFTSE 100
Equal WeightUCITS
ETF (DR)
db x-trackersUSD Corporate
Bond UCITSETF (DR)
USD USD JPY GBP USD
Investment incomeNet gains on investments at fair value through profit or loss during the financialyear 6 55,940,978 20,454,153 6,043,855,159 1,621,595 45,527,570Income from investments at fair value through profit or loss 3(b),3(h) 6,860,917 2,548,062 636,728,716 649,589 24,221,418Securities lending income 3(i),14 141,733 5,152 2,240,137 - -Bank interest 3(b) 1,703 381 835,000 - -
Total investment income 62,945,331 23,007,748 6,683,659,012 2,271,184 69,748,988
Total operating expenses (1,593,872) (476,592) (80,691,560) (49,269) (1,309,562)
Profit for the financial year before tax 3(e),5 61,351,459 22,531,156 6,602,967,452 2,221,915 68,439,426Withholding tax (1,229,295) (428,298) (95,116,837) (8,485) (3,700)Capital gain tax - - - - -
Profit for the financial year after tax 60,122,164 22,102,858 6,507,850,615 2,213,430 68,435,726
Net increase in net assets attributable to holders of redeemableparticipating shares resulting from operations 60,122,164 22,102,858 6,507,850,615 2,213,430 68,435,726
There are no recognised gains and losses other than those dealt with in the Statement of Comprehensive Income.
All amounts arose from continuing operations.
CONCEPT FUND SOLUTIONS PLC
The accompanying notes on pages 557 to 665 form an integral part of these financial statements. 523
Statement of Comprehensive Income for financial year ended 31 December 2017 cont/d
Note
db x-trackersiBoxx Eurozone
SovereignsQuality
WeightedUCITS
ETF (DR)
db x-trackersMSCI WorldHealth Care
Index UCITSETF (DR)
db x-trackersMSCI World
FinancialsIndex UCITS
ETF (DR)
db x-trackersMSCI World
Energy IndexUCITS
ETF (DR)
db x-trackersMSCI World
ConsumerStaples Index
UCITSETF (DR)
EUR USD USD USD USD
Investment incomeNet gains on investments at fair value through profit or loss during the financialyear 6 3,172 38,726,599 57,162,208 19,130,060 11,131,803Income from investments at fair value through profit or loss 3(b),3(h) 103,567 4,664,354 8,309,651 8,368,327 2,445,128Securities lending income 3(i),14 - 10,428 41,251 89,836 958Bank interest 3(b) - 163 587 684 322
Total investment income 106,739 43,401,544 65,513,697 27,588,907 13,578,211
Total operating expenses (53,941) (811,948) (990,945) (682,100) (300,900)
Profit for the financial year before tax 3(e),5 52,798 42,589,596 64,522,752 26,906,807 13,277,311Withholding tax - (678,379) (866,708) (969,714) (276,498)Capital gain tax - - - - -
Profit for the financial year after tax 52,798 41,911,217 63,656,044 25,937,093 13,000,813
Net increase in net assets attributable to holders of redeemableparticipating shares resulting from operations 52,798 41,911,217 63,656,044 25,937,093 13,000,813
There are no recognised gains and losses other than those dealt with in the Statement of Comprehensive Income.
All amounts arose from continuing operations.
CONCEPT FUND SOLUTIONS PLC
The accompanying notes on pages 557 to 665 form an integral part of these financial statements. 524
Statement of Comprehensive Income for financial year ended 31 December 2017 cont/d
Note
db x-trackersMSCI WorldInformationTechnology
Index UCITSETF (DR)
db x-trackersMSCI WorldIndustrials
Index UCITSETF (DR)
db x-trackersMSCI World
ConsumerDiscretionaryIndex UCITS
ETF (DR)
db x-trackersMSCI World
UtilitiesIndex UCITS
ETF (DR)
db x-trackersMSCI World
TelecomServices
Index UCITSETF (DR)
USD USD USD USD USD
Investment incomeNet gains on investments at fair value through profit or loss during the financialyear 6 67,554,985 6,370,053 29,011,467 879,996 1,735,348Income from investments at fair value through profit or loss 3(b),3(h) 2,967,845 633,083 2,721,182 326,523 2,763,558Securities lending income 3(i),14 497 486 5,062 125 3,017Bank interest 3(b) 377 66 370 14 169
Total investment income 70,523,704 7,003,688 31,738,081 1,206,658 4,502,092
Total operating expenses (736,039) (102,839) (487,002) (26,897) (224,564)
Profit for the financial year before tax 3(e),5 69,787,665 6,900,849 31,251,079 1,179,761 4,277,528Withholding tax (397,239) (80,397) (312,187) (31,459) (269,118)Capital gain tax - - - - -
Profit for the financial year after tax 69,390,426 6,820,452 30,938,892 1,148,302 4,008,410
Net increase in net assets attributable to holders of redeemableparticipating shares resulting from operations 69,390,426 6,820,452 30,938,892 1,148,302 4,008,410
There are no recognised gains and losses other than those dealt with in the Statement of Comprehensive Income.
All amounts arose from continuing operations.
CONCEPT FUND SOLUTIONS PLC
The accompanying notes on pages 557 to 665 form an integral part of these financial statements. 525
Statement of Comprehensive Income for financial year ended 31 December 2017 cont/d
Note
db x-trackersMSCI World
MaterialsIndex UCITS
ETF (DR)
db x-trackersiBoxx USDEmerging
SovereignsQuality
Weighted UCITSETF (DR)
db x-trackersiBoxx
EUR CorporatesYield Plus
UCITSETF (DR)
db x-trackersMSCI USAMinimumVolatility
UCITS ETF(DR)
db x-trackersMSCI EMU
MinimumVolatility
UCITS ETF(DR)
USD USD EUR USD EUR
Investment incomeNet gains on investments at fair value through profit or loss during the financialyear 6 3,105,281 1,033,586 2,863,503 1,066,024 1,487,019Income from investments at fair value through profit or loss 3(b),3(h) 242,041 2,133,774 2,015,514 156,974 389,673Securities lending income 3(i),14 60 - 330 - 167Bank interest 3(b) 23 5,766 - - -
Total investment income 3,347,405 3,173,126 4,879,347 1,222,998 1,876,859
Total operating expenses (37,596) (276,688) (340,134) (14,002) (48,416)
Profit for the financial year before tax 3(e),5 3,309,809 2,896,438 4,539,213 1,208,996 1,828,443Withholding tax (26,301) (914) (873) (26,585) (28,777)Capital gain tax - - - - -
Profit for the financial year after tax 3,283,508 2,895,524 4,538,340 1,182,411 1,799,666
Net increase in net assets attributable to holders of redeemableparticipating shares resulting from operations 3,283,508 2,895,524 4,538,340 1,182,411 1,799,666
There are no recognised gains and losses other than those dealt with in the Statement of Comprehensive Income.
All amounts arose from continuing operations.
CONCEPT FUND SOLUTIONS PLC
The accompanying notes on pages 557 to 665 form an integral part of these financial statements. 526
Statement of Comprehensive Income for financial year ended 31 December 2017 cont/d
Note
db x-trackersMSCI Emerging
Markets IndexUCITS ETF
(DR)1
db x-trackersMSCI USAConsumer
DiscretionaryIndex
UCITS ETF (DR)2
db x-trackersMSCI USAConsumer
StaplesIndex UCITS
ETF (DR)2
db x-trackersMSCI USA
Energy IndexUCITS ETF (DR)2
db x-trackersMSCI USA
Financials IndexUCITS ETF (DR)2
USD USD USD USD USD
Investment incomeNet gains on investments at fair value through profit or loss during the financialyear 6 60,582,136 555,032 156,864 590,003 10,107,941Income from investments at fair value through profit or loss 3(b),3(h) 6,712,908 25,194 46,384 37,784 653,987Securities lending income 3(i),14 964 - - - -Bank interest 3(b) 3,692 - - - 9
Total investment income 67,299,700 580,226 203,248 627,787 10,761,937
Total operating expenses (371,058) (2,288) (1,766) (1,925) (39,395)
Profit for the financial year before tax 3(e),5 66,928,642 577,938 201,482 625,862 10,722,542Withholding tax (977,789) (3,581) (6,296) (5,257) (96,667)Capital gain tax (9,351) - - - -
Profit for the financial year after tax 65,941,502 574,357 195,186 620,605 10,625,875
Net increase in net assets attributable to holders of redeemableparticipating shares resulting from operations 65,941,502 574,357 195,186 620,605 10,625,875
1 db x-trackers MSCI Emerging Markets Index UCITS ETF (DR) launched on 21 June 2017.2 db x-trackers MSCI USA Consumer Discretionary Index UCITS ETF (DR) and db x-trackers MSCI USA Consumer Staples Index UCITS ETF (DR), db x-trackers MSCI USA Energy Index UCITS ETF (DR) and
db x-trackers MSCI USA Financials Index UCITS ETF (DR) launched on 12 September 2017.
There are no recognised gains and losses other than those dealt with in the Statement of Comprehensive Income.
All amounts arose from continuing operations.
CONCEPT FUND SOLUTIONS PLC
The accompanying notes on pages 557 to 665 form an integral part of these financial statements. 527
Statement of Comprehensive Income for financial year ended 31 December 2017 cont/d
Note
db x-trackersMSCI USA
Health CareIndex UCITS
ETF (DR)1
db x-trackersMSCI USA
InformationTechnology
IndexUCITS ETF (DR)1 Total
USD USD EUR
Investment incomeNet (losses)/gains on investments at fair value through profit or loss during the financial year 6 (34,760) 549,835 1,708,371,498Income from investments at fair value through profit or loss 3(b),3(h) 24,273 23,000 233,262,255Securities lending income 3(i),14 - - 867,230Bank interest 3(b) - - 4,057,618
Total investment (expense)/income (10,487) 572,835 1,946,558,601
Total operating expenses (1,782) (2,421) (25,231,056)
(Loss)/profit for the financial year before tax 3(e),5 (12,269) 570,414 1,921,327,545Withholding tax (3,298) (3,005) (27,487,956)Capital gain tax - - (23,206)
(Loss)/profit for the financial year after tax (15,567) 567,409 1,893,816,383
Net (decrease)/increase in net assets attributable to holders of redeemable participating shares resultingfrom operations (15,567) 567,409 1,893,816,383
1 db x-trackers MSCI USA Health Care Index UCITS ETF (DR) and db x-trackers MSCI USA Information Technology Index UCITS ETF (DR) launched on 12 September 2017.
There are no recognised gains and losses other than those dealt with in the Statement of Comprehensive Income.
All amounts arose from continuing operations.
CONCEPT FUND SOLUTIONS PLC
The accompanying notes on pages 557 to 665 form an integral part of these financial statements. 528
Statement of Comprehensive Income for financial year ended 31 December 2016
NotePIANO
400 Fund
db x-trackersEUR Liquid
Corporate 12.5UCITS ETF
db x-trackersPortfolio
IncomeUCITS ETF
db x-trackersStiftungs-Stabilität
UCITS ETF1
db x-trackersMSCI NordicIndex UCITS
ETF (DR)EUR EUR EUR EUR EUR
Investment incomeNet (losses)/gains on investments at fair value through profit or loss during thefinancial year 6 (13,598,525) 26,182,205 1,233,544 (15,744) (1,024,317)Income from investments at fair value through profit or loss 3(b),3(h) - 623,987 66,255 6,736 2,726,258Securities lending income 3(i),14 - - - - 6,379Bank interest 3(b) 6,794,724 - 8 - -
Total investment (expense)/income (6,803,801) 26,806,192 1,299,807 (9,008) 1,708,320
Total operating expenses (6,417,749) (1,226,761) (102,804) (15,190) (213,701)
(Loss)/profit for the financial year before tax 3(e),5 (13,221,550) 25,579,431 1,197,003 (24,198) 1,494,619Withholding tax - - - - (77,160)Capital gain tax - - - - -
(Loss)/profit for the financial year after tax (13,221,550) 25,579,431 1,197,003 (24,198) 1,417,459
Net (decrease)/increase in net assets attributable to holders ofredeemable participating shares resulting from operations (13,221,550) 25,579,431 1,197,003 (24,198) 1,417,459
1 db x-trackers Stiftungs-Stabilität UCITS ETF terminated on 27 June 2016, but is not revoked.
There are no recognised gains and losses other than those dealt with in the Statement of Comprehensive Income.
All amounts arose from continuing operations, with the exception of db x-trackers Stiftungs-UCITS ETF Stabilität.
CONCEPT FUND SOLUTIONS PLC
The accompanying notes on pages 557 to 665 form an integral part of these financial statements. 529
Statement of Comprehensive Income for financial year ended 31 December 2016 cont/d
Note
db x-trackersMSCI TurkeyIndex UCITS
ETF (DR)1
db x-trackersMittelstand &
MidCapGermany
UCITSETF (DR)
db x-trackersMSCI North
America HighDividend Yield
Index UCITSETF (DR)
db x-trackersMSCI AC World
Index UCITSETF (DR)
db x-trackersMSCI AC Far
East ex JapanIndex UCITS
ETF (DR)USD EUR USD EUR EUR
Investment incomeNet gains on investments at fair value through profit or loss during the financialyear 6 692,170 1,555,566 13,262,648 10,855,754 1,436,910Income from investments at fair value through profit or loss 3(b),3(h) 99,386 1,055,629 3,732,083 3,522,632 508,817Securities lending income 3(i),14 2,483 132,466 - 10,775 276Bank interest 3(b) 9 - - 6 799
Total investment income 794,048 2,743,661 16,994,731 14,389,167 1,946,802
Total operating expenses (16,986) (182,342) (424,452) (679,103) (125,240)
Profit for the financial year before tax 3(e),5 777,062 2,561,319 16,570,279 13,710,064 1,821,562Withholding tax (14,088) (134,408) (561,324) (436,599) (59,133)Capital gain tax - - - (262) 2,042
Profit for the financial year after tax 762,974 2,426,911 16,008,955 13,273,203 1,764,471
Net increase in net assets attributable to holders of redeemableparticipating shares resulting from operations 762,974 2,426,911 16,008,955 13,273,203 1,764,471
1 db x-trackers MSCI Turkey Index UCITS ETF (DR) terminated on 27 June 2016, but not revoked.
There are no recognised gains and losses other than those dealt with in the Statement of Comprehensive Income.
All amounts arose from continuing operations, with the exception of db x-trackers MSCI Turkey Index UCITS ETF (DR).
CONCEPT FUND SOLUTIONS PLC
The accompanying notes on pages 557 to 665 form an integral part of these financial statements. 530
Statement of Comprehensive Income for financial year ended 31 December 2016 cont/d
Note
db x-trackersMSCI USA
Index UCITSETF (DR)
db x-trackersS&P 500®
Equal WeightUCITS
ETF (DR)
db x-trackersMSCI World
IndexUCITS
ETF (DR)
db x-trackersFTSE
DevelopedEurope ex UK
PropertyUCITS
ETF (DR)
db x-trackersMSCI World
MinimumVolatility UCITS
ETF (DR)USD USD USD EUR USD
Investment incomeNet gains on investments at fair value through profit or loss during the financialyear 6 170,395,905 36,994,327 104,873,180 12,083,429 1,929,206Income from investments at fair value through profit or loss 3(b),3(h) 39,739,191 7,308,474 39,665,895 6,166,683 1,477,153Securities lending income 3(i),14 115,081 41,420 157,815 - 5,234Bank interest 3(b) 401 151 401 - -
Total investment income 210,250,578 44,344,372 144,697,291 18,250,112 3,411,593
Total operating expenses (1,269,774) (866,388) (2,879,816) (726,022) (131,664)
Profit for the financial year before tax 3(e),5 208,980,804 43,477,984 141,817,475 17,524,090 3,279,929Withholding tax (6,040,201) (1,138,654) (4,866,920) (491,837) (184,098)Capital gain tax - - - - -
Profit for the financial year after tax 202,940,603 42,339,330 136,950,555 17,032,253 3,095,831
Net increase in net assets attributable to holders of redeemableparticipating shares resulting from operations 202,940,603 42,339,330 136,950,555 17,032,253 3,095,831
There are no recognised gains and losses other than those dealt with in the Statement of Comprehensive Income.
All amounts arose from continuing operations.
CONCEPT FUND SOLUTIONS PLC
The accompanying notes on pages 557 to 665 form an integral part of these financial statements. 531
Statement of Comprehensive Income for financial year ended 31 December 2016 cont/d
Note
db-x trackersMSCI WorldMomentum
Factor UCITSETF (DR)
db x-trackersMSCI World
Quality FactorUCITS ETF
(DR)
db x-trackersMSCI World
Value FactorUCITS ETF
(DR)
DeutscheMSCI WorldIndex Fund
db x-trackersMSCI GCC
Select IndexUCITS ETF
USD USD USD EUR USD
Investment incomeNet gains on investments at fair value through profit or loss during the financialyear 6 861,537 3,348,563 10,084,627 9,166,155 2,635,218Income from investments at fair value through profit or loss 3(b),3(h) 1,006,472 1,068,488 3,013,105 2,537,813 6Securities lending income 3(i),14 3,494 1,183 15,964 8,246 -Bank interest 3(b) - - - 9 128
Total investment income 1,871,503 4,418,234 13,113,696 11,712,223 2,635,352
Total operating expenses (100,726) (103,889) (246,007) (75,718) (353,583)
Profit for the financial year before tax 3(e),5 1,770,777 4,314,345 12,867,689 11,636,505 2,281,769Withholding tax (130,253) (128,642) (317,133) (483,748) -Capital gain tax - - - - -
Profit for the financial year after tax 1,640,524 4,185,703 12,550,556 11,152,757 2,281,769
Net increase in net assets attributable to holders of redeemableparticipating shares resulting from operations 1,640,524 4,185,703 12,550,556 11,152,757 2,281,769
There are no recognised gains and losses other than those dealt with in the Statement of Comprehensive Income.
All amounts arose from continuing operations.
CONCEPT FUND SOLUTIONS PLC
The accompanying notes on pages 557 to 665 form an integral part of these financial statements. 532
Statement of Comprehensive Income for financial year ended 31 December 2016 cont/d
Note
db x-trackersFTSE All-
World ex UKUCITS ETF
(DR)
db x-trackersS&P 500
UCITSETF (DR)
db x-trackersRussell 2000
UCITSETF (DR)
db x-trackersRussellMidcapUCITS
ETF (DR)
db x-trackersJPX-Nikkei 400
UCITSETF (DR)
GBP USD USD USD JPY
Investment incomeNet gains on investments at fair value through profit or loss during the financialyear 6 6,772,000 12,000,629 45,889,571 11,145,270 73,910,828Income from investments at fair value through profit or loss 3(b),3(h) 730,425 11,240,727 4,825,397 2,224,441 456,354,142Securities lending income 3(i),14 1,041 12,144 91,057 5,754 1,761,229Bank interest 3(b) 2 93 200 54 -
Total investment income 7,503,468 23,253,593 50,806,225 13,375,519 532,026,199
Total operating expenses (118,784) (1,516,032) (1,357,839) (399,254) (53,712,602)
Profit for the financial year before tax 3(e),5 7,384,684 21,737,561 49,448,386 12,976,265 478,313,597Withholding tax (99,156) (1,697,287) (911,809) (402,352) (68,450,200)Capital gain tax 532 - - - -
Profit for the financial year after tax 7,286,060 20,040,274 48,536,577 12,573,913 409,863,397
Net increase in net assets attributable to holders of redeemableparticipating shares resulting from operations 7,286,060 20,040,274 48,536,577 12,573,913 409,863,397
There are no recognised gains and losses other than those dealt with in the Statement of Comprehensive Income.
All amounts arose from continuing operations.
CONCEPT FUND SOLUTIONS PLC
The accompanying notes on pages 557 to 665 form an integral part of these financial statements. 533
Statement of Comprehensive Income for financial year ended 31 December 2016 cont/d
Note
db x-trackersFTSE 100
Equal WeightUCITS
ETF (DR)
db x-trackersUSD Corporate
Bond UCITSETF (DR)
db x-trackersiBoxx Eurozone
SovereignsQuality
WeightedUCITS
ETF (DR)
db x-trackersMSCI WorldHealth Care
Index UCITSETF (DR)
db x-trackersMSCI World
FinancialsIndex UCITS
ETF (DR)GBP USD EUR USD USD
Investment incomeNet gains/(losses) on investments at fair value through profit or loss during thefinancial year 6 1,677,321 (35,649,397) 205,480 (9,728,973) 16,098,251Income from investments at fair value through profit or loss 3(b),3(h) 649,139 12,190,105 60,161 2,351,999 3,695,426Securities lending income 3(i),14 - - - 2,616 13,076Bank interest 3(b) - 329 - 26 15
Total investment income/(expense) 2,326,460 (23,458,963) 265,641 (7,374,332) 19,806,768
Total operating expenses (46,609) (813,282) (27,888) (621,473) (496,812)
Profit/(loss) for the financial year before tax 3(e),5 2,279,851 (24,272,245) 237,753 (7,995,805) 19,309,956Withholding tax (6,036) (3,323) - (274,691) (415,015)Capital gain tax - - - - -
Profit/(loss) for the financial year after tax 2,273,815 (24,275,568) 237,753 (8,270,496) 18,894,941
Net increase/(decrease) in net assets attributable to holders ofredeemable participating shares resulting from operations 2,273,815 (24,275,568) 237,753 (8,270,496) 18,894,941
There are no recognised gains and losses other than those dealt with in the Statement of Comprehensive Income.
All amounts arose from continuing operations.
CONCEPT FUND SOLUTIONS PLC
The accompanying notes on pages 557 to 665 form an integral part of these financial statements. 534
Statement of Comprehensive Income for financial year ended 31 December 2016 cont/d
Note
db x-trackersMSCI World
Energy IndexUCITS
ETF (DR)
db x-trackersMSCI World
ConsumerStaples Index
UCITSETF (DR)
db x-trackersMSCI WorldInformationTechnology
Index UCITSETF (DR)
db x-trackersMSCI WorldIndustrials
Index UCITSETF (DR)
db x-trackersMSCI World
ConsumerDiscretionaryIndex UCITS
ETF (DR)USD USD USD USD USD
Investment incomeNet gains/(losses) on investments at fair value through profit or loss during thefinancial year 6 7,580,474 (2,207,586) 11,283,981 949,161 3,089,750Income from investments at fair value through profit or loss 3(b),3(h) 2,028,429 990,211 1,310,657 347,202 1,712,866Securities lending income 3(i),14 22,033 257 56 611 3,215Bank interest 3(b) 43 20 42 20 56
Total investment income/(expense) 9,630,979 (1,217,098) 12,594,736 1,296,994 4,805,887
Total operating expenses (238,003) (182,731) (361,845) (65,860) (384,699)
Profit/(loss) for the financial year before tax 3(e),5 9,392,976 (1,399,829) 12,232,891 1,231,134 4,421,188Withholding tax (225,895) (109,254) (176,160) (41,376) (200,876)Capital gain tax - - - - -
Profit/(loss) for the financial year after tax 9,167,081 (1,509,083) 12,056,731 1,189,758 4,220,312
Net increase/(decrease) in net assets attributable to holders ofredeemable participating shares resulting from operations 9,167,081 (1,509,083) 12,056,731 1,189,758 4,220,312
There are no recognised gains and losses other than those dealt with in the Statement of Comprehensive Income.
All amounts arose from continuing operations.
CONCEPT FUND SOLUTIONS PLC
The accompanying notes on pages 557 to 665 form an integral part of these financial statements. 535
Statement of Comprehensive Income for financial year ended 31 December 2016 cont/d
Note
db x-trackersMSCI World
UtilitiesIndex UCITS
ETF (DR)
db x-trackersMSCI World
TelecomServices
Index UCITSETF (DR)
db x-trackersMSCI World
MaterialsIndex UCITS
ETF (DR)
db x-trackersiBoxx USDEmerging
SovereignsQuality
Weighted UCITSETF (DR)
db x-trackersiBoxx
EUR CorporatesYield Plus
UCITSETF (DR)
USD USD USD USD EUR
Investment incomeNet (losses)/gains on investments at fair value through profit or loss during thefinancial year 6 (115,524) 139,690 1,162,819 (849,176) 91,164Income from investments at fair value through profit or loss 3(b),3(h) 178,702 155,800 111,772 1,300,758 171,925Securities lending income 3(i),14 - 135 150 - -Bank interest 3(b) 2 - 5 34 -
Total investment income 63,180 295,625 1,274,746 451,616 263,089
Total operating expenses (18,205) (16,475) (26,455) (165,098) (10,721)
Profit for the financial year before tax 3(e),5 44,975 279,150 1,248,291 286,518 252,368Withholding tax (19,672) (11,871) (13,408) - -Capital gain tax - - - - -
Profit for the financial year after tax 25,303 267,279 1,234,883 286,518 252,368
Net increase in net assets attributable to holders of redeemableparticipating shares resulting from operations 25,303 267,279 1,234,883 286,518 252,368
There are no recognised gains and losses other than those dealt with in the Statement of Comprehensive Income.
All amounts arose from continuing operations.
CONCEPT FUND SOLUTIONS PLC
The accompanying notes on pages 557 to 665 form an integral part of these financial statements. 536
Statement of Comprehensive Income for financial year ended 31 December 2016 cont/d
Note
db x-trackersMSCI USAMinimumVolatility
UCITS ETF(DR)
db x-trackersMSCI EMU
MinimumVolatility
UCITS ETF(DR) Total
USD EUR EUR
Investment incomeNet gains on investments at fair value through profit or loss during the financial year 6 94,992 222,111 427,064,469Income from investments at fair value through profit or loss 3(b),3(h) 22,553 16,193 151,394,386Securities lending income 3(i),14 - - 621,383Bank interest 3(b) - - 6,797,386
Total investment income 117,545 238,304 585,877,624
Total operating expenses (1,534) (1,889) (22,283,272)
Profit for the financial year before tax 3(e),5 116,011 236,415 563,594,352Withholding tax (4,001) (620) (18,586,172)Capital gain tax - - 2,427
Profit for the financial year after tax 112,010 235,795 545,010,607
Net increase in net assets attributable to holders of redeemable participating shares resulting fromoperations 112,010 235,795 545,010,607
There are no recognised gains and losses other than those dealt with in the Statement of Comprehensive Income.
All amounts arose from continuing operations.
CONCEPT FUND SOLUTIONS PLC
The accompanying notes on pages 557 to 665 form an integral part of these financial statements. 537
Statement of Changes in Net Assets Attributable to Holders of Redeemable Participating Shares for the financial year ended 31 December 2017
NotePIANO
400 Fund1
db x-trackersEUR Liquid
Corporate 12.5UCITS ETF
db x-trackersPortfolio
IncomeUCITS ETF
db x-trackersMSCI NordicIndex UCITS
ETF (DR)
db x-trackersMittelstand &
MidCapGermany
UCITSETF (DR)
EUR EUR EUR EUR EUR
Net Assets at start of financial year 486,830,345 363,859,644 23,307,677 85,729,407 50,244,800
Share TransactionsAmounts received on sale of Shares 9 - 20,378,797 5,889,914 219,260,815 51,238,096Less amounts paid on repurchase of Shares 9 (485,484,930) (106,377,470) - (29,069,378) (23,450,345)
(Decrease)/increase in net assets attributable to holders of redeemableparticipating shares resulting from operations (1,345,415) 13,344,662 654,353 9,887,288 17,647,055
Foreign currency translation - - - - -
Net assets attributable to holders of redeemable participating shares atthe end of financial year - 291,205,633 29,518,371 283,708,091 94,952,106
1 PIANO 400 Fund terminated on 18 August 2017.
CONCEPT FUND SOLUTIONS PLC
The accompanying notes on pages 557 to 665 form an integral part of these financial statements. 538
Statement of Changes in Net Assets Attributable to Holders of Redeemable Participating Shares for the financial year ended 31 December 2017 cont/d
Note
db x-trackersMSCI North
America HighDividend Yield
Index UCITSETF (DR)
db x-trackersMSCI AC World
Index UCITSETF (DR)
db x-trackersMSCI AC Far
East ex JapanIndex UCITS
ETF (DR)
db x-trackersMSCI USA
Index UCITSETF (DR)
db x-trackersS&P 500®
Equal WeightUCITS
ETF (DR)USD EUR EUR USD USD
Net Assets at start of financial year 117,871,866 137,712,717 18,947,477 1,951,345,829 430,318,889
Share TransactionsAmounts received on sale of Shares 9 28,180,828 103,660,608 - 2,183,529,068 179,942,104Less amounts paid on repurchase of Shares 9 (12,476,646) (63,797,274) - (546,588,552) (116,497,943)
15,704,182 39,863,334 - 1,636,940,516 63,444,161
Distributions 12 - - - - -
Increase in net assets attributable to holders of redeemableparticipating shares resulting from operations 24,069,733 11,074,473 4,589,928 584,993,036 85,263,671
Foreign currency translation - - - - -
Net assets attributable to holders of redeemable participating shares atthe end of financial year 157,645,781 188,650,524 23,537,405 4,173,279,381 579,026,721
CONCEPT FUND SOLUTIONS PLC
The accompanying notes on pages 557 to 665 form an integral part of these financial statements. 539
Statement of Changes in Net Assets Attributable to Holders of Redeemable Participating Shares for the financial year ended 31 December 2017 cont/d
Note
db x-trackersMSCI World
IndexUCITS
ETF (DR)
db x-trackersFTSE
DevelopedEurope ex UK
PropertyUCITS
ETF (DR)
db x-trackersMSCI World
MinimumVolatility UCITS
ETF (DR)
db-x trackersMSCI WorldMomentum
Factor UCITSETF (DR)
db x-trackersMSCI World
Quality FactorUCITS ETF
(DR)USD EUR USD USD USD
Net Assets at start of financial year 1,831,782,261 92,024,711 65,810,400 32,911,164 43,424,013
Share TransactionsAmounts received on sale of Shares 9 1,441,588,946 16,113,130 6,885,616 57,562,790 51,525,911Less amounts paid on repurchase of Shares 9 (440,978,291) (80,238,962) (30,624,474) - (7,081,200)
Increase in net assets attributable to holders of redeemableparticipating shares resulting from operations 481,396,441 10,147,109 9,624,283 14,999,314 13,045,548
Foreign currency translation - - - - -
Net assets attributable to holders of redeemable participating shares atthe end of financial year 3,305,500,771 38,045,988 51,695,825 105,473,268 100,914,272
CONCEPT FUND SOLUTIONS PLC
The accompanying notes on pages 557 to 665 form an integral part of these financial statements. 540
Statement of Changes in Net Assets Attributable to Holders of Redeemable Participating Shares for the financial year ended 31 December 2017 cont/d
Note
db x-trackersMSCI World
Value FactorUCITS ETF
(DR)
DeutscheMSCI WorldIndex Fund
db x-trackersMSCI GCC
Select IndexUCITS ETF
db x-trackersFTSE All-
World ex UKUCITS ETF
(DR)
db x-trackersS&P 500
UCITSETF (DR)
USD EUR USD GBP USD
Net Assets at start of financial year 169,687,984 110,698,676 47,005,833 33,692,897 576,920,943
Share TransactionsAmounts received on sale of Shares 9 79,202,261 54,944 1,471,524 8,993,571 615,232,029Less amounts paid on repurchase of Shares 9 (77,690,868) (78,847,805) (25,243,006) (17,903,833) (59,317,715)
Increase in net assets attributable to holders of redeemableparticipating shares resulting from operations 32,067,102 2,478,587 653,358 3,883,969 267,266,300
Foreign currency translation - - - - -
Net assets attributable to holders of redeemable participating shares atthe end of financial year 203,266,479 33,771,368 23,887,709 28,666,604 1,400,101,557
CONCEPT FUND SOLUTIONS PLC
The accompanying notes on pages 557 to 665 form an integral part of these financial statements. 541
Statement of Changes in Net Assets Attributable to Holders of Redeemable Participating Shares for the financial year ended 31 December 2017 cont/d
Note
db x-trackersRussell 2000
UCITSETF (DR)
db x-trackersRussellMidcapUCITS
ETF (DR)
db x-trackersJPX-Nikkei 400
UCITSETF (DR)
db x-trackersFTSE 100
Equal WeightUCITS
ETF (DR)
db x-trackersUSD Corporate
Bond UCITSETF (DR)
USD USD JPY GBP USD
Net Assets at start of financial year 462,865,221 126,324,449 27,458,225,502 16,436,790 658,255,964
Share TransactionsAmounts received on sale of Shares 9 265,429,033 16,848,643 15,070,693,395 5,521,105 782,936,926Less amounts paid on repurchase of Shares 9 (165,633,973) (22,803,340) (5,064,374,510) - (601,015,109)
Increase in net assets attributable to holders of redeemableparticipating shares resulting from operations 60,122,164 22,102,858 6,507,850,615 2,213,430 68,435,726
Foreign currency translation - - - - -
Net assets attributable to holders of redeemable participating shares atthe end of financial year 622,782,445 142,472,610 43,643,027,898 23,551,049 892,829,336
CONCEPT FUND SOLUTIONS PLC
The accompanying notes on pages 557 to 665 form an integral part of these financial statements. 542
Statement of Changes in Net Assets Attributable to Holders of Redeemable Participating Shares for the financial year ended 31 December 2017 cont/d
Note
db x-trackersiBoxx Eurozone
SovereignsQuality
WeightedUCITS
ETF (DR)
db x-trackersMSCI WorldHealth Care
Index UCITSETF (DR)
db x-trackersMSCI World
FinancialsIndex UCITS
ETF (DR)
db x-trackersMSCI World
Energy IndexUCITS
ETF (DR)
db x-trackersMSCI World
ConsumerStaples Index
UCITSETF (DR)
EUR USD USD USD USD
Net Assets at start of financial year 15,625,358 249,165,909 215,031,286 112,849,467 58,379,422
Share TransactionsAmounts received on sale of Shares 9 18,598,922 41,570,688 274,201,105 267,713,270 95,071,307Less amounts paid on repurchase of Shares 9 (7,099,617) (80,221,336) (115,827,099) (55,758,973) (15,331,931)
Increase in net assets attributable to holders of redeemableparticipating shares resulting from operations 52,798 41,911,217 63,656,044 25,937,093 13,000,813
Foreign currency translation - - - - -
Net assets attributable to holders of redeemable participating shares atthe end of financial year 27,032,717 252,426,478 437,061,336 350,740,857 151,119,611
CONCEPT FUND SOLUTIONS PLC
The accompanying notes on pages 557 to 665 form an integral part of these financial statements. 543
Statement of Changes in Net Assets Attributable to Holders of Redeemable Participating Shares for the financial year ended 31 December 2017 cont/d
Note
db x-trackersMSCI WorldInformationTechnology
Index UCITSETF (DR)
db x-trackersMSCI WorldIndustrials
Index UCITSETF (DR)
db x-trackersMSCI World
ConsumerDiscretionaryIndex UCITS
ETF (DR)
db x-trackersMSCI World
UtilitiesIndex UCITS
ETF (DR)
db x-trackersMSCI World
TelecomServices
Index UCITSETF (DR)
USD USD USD USD USD
Net Assets at start of financial year 172,196,943 26,623,662 118,962,303 7,169,722 22,832,494
Share TransactionsAmounts received on sale of Shares 9 113,308,170 18,413,593 86,230,307 6,694,110 67,275,552Less amounts paid on repurchase of Shares 9 (117,261,686) (11,754,390) (55,959,916) (4,576,813) (31,165,738)
Increase in net assets attributable to holders of redeemableparticipating shares resulting from operations 69,390,426 6,820,452 30,938,892 1,148,302 4,008,410
Foreign currency translation - - - - -
Net assets attributable to holders of redeemable participating shares atthe end of financial year 237,633,853 40,103,317 180,171,586 10,435,321 62,950,718
CONCEPT FUND SOLUTIONS PLC
The accompanying notes on pages 557 to 665 form an integral part of these financial statements. 544
Statement of Changes in Net Assets Attributable to Holders of Redeemable Participating Shares for the financial year ended 31 December 2017 cont/d
Note
db x-trackersMSCI World
MaterialsIndex UCITS
ETF (DR)
db x-trackersiBoxx USDEmerging
SovereignsQuality
Weighted UCITSETF (DR)
db x-trackersiBoxx
EUR CorporatesYield Plus UCITS
ETF (DR)
db x-trackersMSCI USAMinimumVolatility
UCITS ETF(DR)
db x-trackersMSCI EMU
MinimumVolatility
UCITS ETF(DR)
USD USD EUR USD EUR
Net Assets at start of financial year 11,262,645 35,336,296 24,710,172 5,268,311 5,311,527
Share TransactionsAmounts received on sale of Shares 9 11,608,266 232,999,749 208,995,113 4,496,860 41,808,603Less amounts paid on repurchase of Shares 9 (5,231,748) (184,182,087) (4,098,778) (2,343,357) (2,238,679)
Increase in net assets attributable to holders of redeemableparticipating shares resulting from operations 3,283,508 2,895,524 4,538,340 1,182,411 1,799,666
Foreign currency translation - - - - -
Net assets attributable to holders of redeemable participating shares atthe end of financial year 20,922,671 85,575,560 234,144,847 8,604,225 46,681,117
CONCEPT FUND SOLUTIONS PLC
The accompanying notes on pages 557 to 665 form an integral part of these financial statements. 545
Statement of Changes in Net Assets Attributable to Holders of Redeemable Participating Shares for the financial year ended 31 December 2017 cont/d
Note
db x-trackersMSCI Emerging
Markets IndexUCITS ETF
(DR)1
db x-trackersMSCI USAConsumer
DiscretionaryIndex
UCITS ETF (DR)2
db x-trackersMSCI USAConsumer
StaplesIndex UCITS
ETF (DR)2
db x-trackersMSCI USA
Energy IndexUCITS ETF (DR)2
db x-trackersMSCI USA
Financials IndexUCITS ETF (DR)2
USD USD USD USD USD
Net Assets at start of financial year - - - - -
Share TransactionsAmounts received on sale of Shares 9 740,389,711 6,040,592 4,850,802 4,970,198 134,151,278Less amounts paid on repurchase of Shares 9 (21,406,192) - - - -
Increase in net assets attributable to holders of redeemableparticipating shares resulting from operations 65,941,502 574,357 195,186 620,605 10,625,875
Foreign currency translation - - - - -
Net assets attributable to holders of redeemable participating shares atthe end of financial year 784,925,021 6,614,949 5,045,988 5,590,803 144,777,153
1 db x-trackers MSCI Emerging Markets Index UCITS ETF (DR) launched on 21 June 2017.2 db x-trackers MSCI USA Consumer Discretionary Index UCITS ETF (DR) and db x-trackers MSCI USA Consumer Staples Index UCITS ETF (DR), db x-trackers MSCI USA Energy Index UCITS ETF (DR) and
db x-trackers MSCI USA Financials Index UCITS ETF (DR) launched on 12 September 2017.
CONCEPT FUND SOLUTIONS PLC
The accompanying notes on pages 557 to 665 form an integral part of these financial statements. 546
Statement of Changes in Net Assets Attributable to Holders of Redeemable Participating Shares for the financial year ended 31 December 2017 cont/d
Note
db x-trackersMSCI USA
Health CareIndex UCITS
ETF (DR)1
db x-trackersMSCI USA
InformationTechnology
IndexUCITS ETF (DR)1 Total
USD USD EUR
Net Assets at start of financial year - - 8,854,996,007
Share TransactionsAmounts received on sale of Shares 9 4,926,396 6,269,833 7,693,037,633Less amounts paid on repurchase of Shares 9 - - (3,404,031,435)
4,926,396 6,269,833 4,289,006,198
Distributions 12 - - (29,630,056)
(Decrease)/increase in net assets attributable to holders of redeemable participating shares resulting fromoperations (15,567) 567,409 1,893,816,383
Foreign currency translation - - (1,214,110,570)*
Net assets attributable to holders of redeemable participating shares at the end of financial year 4,910,829 6,837,242 13,794,077,962
1 db x-trackers MSCI USA Health Care Index UCITS ETF (DR) and db x-trackers MSCI USA Information Technology Index UCITS ETF (DR) launched on 12 September 2017.* The foreign currency translation amount arises from the retranslation of the net assets at the beginning of the financial year using the exchange rate as at 31 December 2016. The average rate for the financial
year is applied to income statement items and share transactions.
CONCEPT FUND SOLUTIONS PLC
The accompanying notes on pages 557 to 665 form an integral part of these financial statements. 547
Statement of Changes in Net Assets Attributable to Holders of Redeemable Participating Shares for the financial year ended 31 December 2016
NotePIANO
400 Fund
db x-trackersEUR Liquid
Corporate 12.5UCITS ETF
db x-trackersPortfolio
IncomeUCITS ETF
db x-trackersStiftungs-Stabilität
UCITS ETF1
db x-trackersMSCI NordicIndex UCITS
ETF (DR)EUR EUR EUR EUR EUR
Net Assets at start of year 500,051,895 254,685,070 28,196,789 5,301,086 58,382,453
Share TransactionsAmounts received on sale of Shares 9 - 195,709,532 5,546,084 - 57,484,233Less amounts paid on repurchase of Shares 9 - (112,114,389) (11,223,270) (5,218,063) (30,356,934)
(Decrease)/increase in net assets attributable to holders of redeemableparticipating shares resulting from operations (13,221,550) 25,579,431 1,197,003 (24,198) 1,417,459
Foreign currency translation - - - - -
Net assets attributable at the end of financial year 486,830,345 363,859,644 23,307,677 - 85,729,407
1 db x-trackers Stiftungs-Stabilität UCITS ETF terminated on 27 June 2016, but is not revoked.
CONCEPT FUND SOLUTIONS PLC
The accompanying notes on pages 557 to 665 form an integral part of these financial statements. 548
Statement of Changes in Net Assets Attributable to Holders of Redeemable Participating Shares for the financial year ended 31 December 2016 cont/d
Note
db x-trackersMSCI TurkeyIndex UCITS
ETF (DR)1
db x-trackersMittelstand &
MidCapGermany
UCITSETF (DR)
db x-trackersMSCI North
America HighDividend Yield
Index UCITSETF (DR)
db x-trackersMSCI AC World
Index UCITSETF (DR)
db x-trackersMSCI AC Far
East ex JapanIndex UCITS
ETF (DR)USD EUR USD EUR EUR
Net Assets at start of year 6,655,567 45,562,948 98,312,836 141,572,674 17,183,006
Share TransactionsAmounts received on sale of Shares 9 - 2,706,141 13,196,914 102,570,664 -Less amounts paid on repurchase of Shares 9 (7,324,894) - (9,646,839) (119,703,824) -
(7,324,894) 2,706,141 3,550,075 (17,133,160) -
Distributions 12 (93,647) (451,200) - - -
Increase in net assets attributable to holders of redeemableparticipating shares resulting from operations 762,974 2,426,911 16,008,955 13,273,203 1,764,471
Foreign currency translation - - - - -
Net assets attributable at the end of financial year - 50,244,800 117,871,866 137,712,717 18,947,477
1 db x-trackers MSCI Turkey Index UCITS ETF (DR) terminated on 27 June 2016, but not revoked.
CONCEPT FUND SOLUTIONS PLC
The accompanying notes on pages 557 to 665 form an integral part of these financial statements. 549
Statement of Changes in Net Assets Attributable to Holders of Redeemable Participating Shares for the financial year ended 31 December 2016 cont/d
Note
db x-trackersMSCI USA
Index UCITSETF (DR)
db x-trackersS&P 500®
Equal WeightUCITS
ETF (DR)
db x-trackersMSCI World
IndexUCITS
ETF (DR)
db x-trackersFTSE
DevelopedEurope ex UK
PropertyUCITS
ETF (DR)
db x-trackersMSCI World
MinimumVolatility UCITS
ETF (DR)USD USD USD EUR USD
Net Assets at start of year 1,749,590,271 358,322,080 1,022,906,554 200,916,486 32,473,679
Share TransactionsAmounts received on sale of Shares 9 430,175,219 207,738,157 879,337,840 87,458,618 36,233,532Less amounts paid on repurchase of Shares 9 (431,360,264) (178,080,678) (199,122,279) (213,382,646) (5,992,642)
Increase in net assets attributable to holders of redeemableparticipating shares resulting from operations 202,940,603 42,339,330 136,950,555 17,032,253 3,095,831
Foreign currency translation - - - - -
Net assets attributable at the end of financial year 1,951,345,829 430,318,889 1,831,782,261 92,024,711 65,810,400
CONCEPT FUND SOLUTIONS PLC
The accompanying notes on pages 557 to 665 form an integral part of these financial statements. 550
Statement of Changes in Net Assets Attributable to Holders of Redeemable Participating Shares for the financial year ended 31 December 2016 cont/d
Note
db-x trackersMSCI WorldMomentum
Factor UCITSETF (DR)
db x-trackersMSCI World
Quality FactorUCITS ETF
(DR)
db x-trackersMSCI World
Value FactorUCITS ETF
(DR)
DeutscheMSCI WorldIndex Fund
db x-trackersMSCI GCC
Select IndexUCITS ETF
USD USD USD EUR USD
Net Assets at start of year 53,514,008 27,032,993 73,308,838 88,290,647 42,178,783
Share TransactionsAmounts received on sale of Shares 9 10,839,719 19,004,305 115,819,115 13,742,665 31,735,035Less amounts paid on repurchase of Shares 9 (33,083,087) (6,798,988) (31,990,525) (569,391) (29,189,754)
Increase in net assets attributable to holders of redeemableparticipating shares resulting from operations 1,640,524 4,185,703 12,550,556 11,152,757 2,281,769
Foreign currency translation - - - - -
Net assets attributable at the end of financial year 32,911,164 43,424,013 169,687,984 110,698,676 47,005,833
CONCEPT FUND SOLUTIONS PLC
The accompanying notes on pages 557 to 665 form an integral part of these financial statements. 551
Statement of Changes in Net Assets Attributable to Holders of Redeemable Participating Shares for the financial year ended 31 December 2016 cont/d
Note
db x-trackersFTSE All-
World ex UKUCITS ETF
(DR)
db x-trackersS&P 500
UCITSETF (DR)
db x-trackersRussell 2000
UCITSETF (DR)
db x-trackersRussellMidcapUCITS
ETF (DR)
db x-trackersJPX-Nikkei 400
UCITSETF (DR)
GBP USD USD USD JPY
Net Assets at start of year 32,552,238 258,195,644 403,431,733 135,412,532 20,445,691,817
Share TransactionsAmounts received on sale of Shares 9 - 481,544,600 219,556,363 25,133,948 19,234,455,941Less amounts paid on repurchase of Shares 9 (6,145,401) (182,859,575) (208,659,452) (46,795,944) (12,518,835,004)
Increase in net assets attributable to holders of redeemableparticipating shares resulting from operations 7,286,060 20,040,274 48,536,577 12,573,913 409,863,397
Foreign currency translation - - - - -
Net assets attributable at the end of financial year 33,692,897 576,920,943 462,865,221 126,324,449 27,458,225,502
CONCEPT FUND SOLUTIONS PLC
The accompanying notes on pages 557 to 665 form an integral part of these financial statements. 552
Statement of Changes in Net Assets Attributable to Holders of Redeemable Participating Shares for the financial year ended 31 December 2016 cont/d
Note
db x-trackersFTSE 100
Equal WeightUCITS
ETF (DR)
db x-trackersUSD Corporate
Bond UCITSETF (DR)
db x-trackersiBoxx Eurozone
SovereignsQuality
WeightedUCITS
ETF (DR)
db x-trackersMSCI WorldHealth Care
Index UCITSETF (DR)
db x-trackersMSCI World
FinancialsIndex UCITS
ETF (DR)GBP USD EUR USD USD
Net Assets at start of year 18,692,478 29,793,812 7,985,438 - -
Share TransactionsAmounts received on sale of Shares 9 2,474,575 951,545,609 13,855,444 90,238,333 132,269,496Amounts received from mergers - - - 184,152,038 179,447,096Less amounts paid on repurchase of Shares 9 (6,786,809) (298,590,703) (6,448,377) (16,953,966) (115,580,247)
Increase/(decrease) in net assets attributable to holders of redeemableparticipating shares resulting from operations 2,273,815 (24,275,568) 237,753 (8,270,496) 18,894,941
Foreign currency translation - - - - -
Net assets attributable at the end of financial year 16,436,790 658,255,964 15,625,358 249,165,909 215,031,286
CONCEPT FUND SOLUTIONS PLC
The accompanying notes on pages 557 to 665 form an integral part of these financial statements. 553
Statement of Changes in Net Assets Attributable to Holders of Redeemable Participating Shares for the financial year ended 31 December 2016 cont/d
Note
db x-trackersMSCI World
Energy IndexUCITS
ETF (DR)
db x-trackersMSCI World
ConsumerStaples Index
UCITSETF (DR)
db x-trackersMSCI WorldInformationTechnology
Index UCITSETF (DR)
db x-trackersMSCI WorldIndustrials
Index UCITSETF (DR)
db x-trackersMSCI World
ConsumerDiscretionaryIndex UCITS
ETF (DR)USD USD USD USD USD
Net Assets at start of year - - - - -
Share TransactionsAmounts received on sale of Shares 9 58,386,956 14,207,702 88,756,521 7,745,509 32,971,510Amounts received from mergers 66,535,252 59,806,732 126,267,767 22,718,667 112,846,730Less amounts paid on repurchase of Shares 9 (21,239,822) (14,125,929) (54,884,076) (5,030,272) (31,076,249)
Increase/(decrease) in net assets attributable to holders of redeemableparticipating shares resulting from operations 9,167,081 (1,509,083) 12,056,731 1,189,758 4,220,312
Foreign currency translation - - - - -
Net assets attributable at the end of financial year 112,849,467 58,379,422 172,196,943 26,623,662 118,962,303
CONCEPT FUND SOLUTIONS PLC
The accompanying notes on pages 557 to 665 form an integral part of these financial statements. 554
Statement of Changes in Net Assets Attributable to Holders of Redeemable Participating Shares for the financial year ended 31 December 2016 cont/d
Note
db x-trackersMSCI World
UtilitiesIndex UCITS
ETF (DR)
db x-trackersMSCI World
TelecomServices
Index UCITSETF (DR)
db x-trackersMSCI World
MaterialsIndex UCITS
ETF (DR)
db x-trackersiBoxx USDEmerging
SovereignsQuality
Weighted UCITSETF (DR)
db x-trackersiBoxx
EUR CorporatesYield Plus UCITS
ETF (DR)USD USD USD USD EUR
Net Assets at start of year - - - - -
Share TransactionsAmounts received on sale of Shares 9 3,622,867 20,942,979 4,876,786 57,740,714 24,457,804Amounts received from mergers 5,554,030 3,879,383 7,352,709 - -Less amounts paid on repurchase of Shares 9 (2,032,478) (2,257,147) (2,201,733) (22,690,936) -
Increase in net assets attributable to holders of redeemableparticipating shares resulting from operations 25,303 267,279 1,234,883 286,518 252,368
Foreign currency translation - - - - -
Net assets attributable at the end of financial year 7,169,722 22,832,494 11,262,645 35,336,296 24,710,172
CONCEPT FUND SOLUTIONS PLC
The accompanying notes on pages 557 to 665 form an integral part of these financial statements. 555
Statement of Changes in Net Assets Attributable to Holders of Redeemable Participating Shares for the financial year ended 31 December 2016 cont/d
Note
db x-trackersMSCI USAMinimumVolatility
UCITS ETF(DR)
db x-trackersMSCI EMU
MinimumVolatility
UCITS ETF(DR) Total
USD EUR EUR
Net Assets at start of year - - 5,526,430,323
Share TransactionsAmounts received on sale of Shares 9 5,156,301 5,075,732 4,239,792,324Amounts received from mergers - - 696,285,925Less amounts paid on repurchase of Shares 9 - - (2,392,224,972)
5,156,301 5,075,732 2,543,853,277
Distributions 12 - - (13,034,565)
Increase in net assets attributable to holders of redeemable participating shares resulting from operations 112,010 235,795 545,010,607
Foreign currency translation - - 252,727,634*
Net assets attributable at the end of financial year 5,268,311 5,311,527 8,854,987,276
* The foreign currency translation amount arises from the retranslation of the net assets at the beginning of the financial year using the exchange rate as at 31 December 2016. The average rate for the financialyear is applied to income statement items and share transactions.
CONCEPT FUND SOLUTIONS PLC
The accompanying notes on pages 557 to 665 form an integral part of these financial statements. 556
1. General Information
The Company is an investment company with variable capital incorporated on 17 November 2004, authorisedand regulated by the Central Bank under the European Communities (Undertakings for Collective Investmentsin Transferable Securities) Regulations 2011, as amended, and under the Central Bank (Supervision andEnforcement) Act 2013 (Section 48(1) (Undertakings for Collective Investments in Transferable Securities)Regulations 2015) (together the "UCITS Regulations"). The Company had no employees during the financialyear (financial year ended 31 December 2016 – Nil). The Company has listed the following Funds on the IrishStock Exchange; db x-trackers MSCI World Index UCITS ETF (DR), db x-trackers JPX-Nikkei 400 UCITS ETF(DR), db x-trackers FTSE All-World ex UK UCITS ETF (DR), db x-trackers S&P 500 UCITS ETF (DR),dbxtrackers FTSE 100 Equal Weight UCITS ETF (DR), db x-trackers MSCI USA Minimum Volatility UCITS ETFand db x-trackers iBoxx USD Emerging Sovereigns Quality Weighted UCITS ETF (DR).
2. Basis of Preparation
The Financial Statements have been prepared for the financial year ended 31 December 2017.
Statement of complianceThese Financial Statements have been prepared in accordance with accounting standards generally acceptedin Ireland including Financial Reporting Standard ("FRS") 102; the Financial Reporting Standard applicable inthe UK and Republic of Ireland for the first time, the provisions of the UCITS Regulations and Irish Statutecomprising the Irish Companies Act. Accounting standards generally accepted in Ireland in preparing FinancialStatements giving a true and fair view are those published by the Institute of Chartered Accountants in Irelandand issued by the Financial Reporting Council ("FRC"). Prior to the mandatory application of FRS 102 from1 January 2015 the Financial Statements were prepared in accordance with previous Irish GAAP.
The Company has availed of the exemption available to open ended investment funds that hold a substantialproportion of highly liquid and fair valued investments under Section 7 of FRS 102 and is not presenting cashflow statements.
The format and wording of certain line items on the primary statements contains departures from theGuidelines of the Irish Companies Act to reflect this Company’s structure as an Investment Fund.
All references to net assets throughout the documents refers to Net Assets Attributable to Holders ofRedeemable Participating Shares unless otherwise stated.
Functional and presentation currencyThe Financial Statements of the individual Funds are prepared in the functional currency of the respectiveFund. The functional currency of each Fund is that as disclosed on the primary statements of the respectiveFund. The Company Financial Statements of the Company are measured using Euro. The Company has alsoadopted Euro as the presentation currency.
Transactions in foreign currencies are translated at the foreign currency exchange rate ruling at the date of thetransaction. Monetary assets and liabilities denominated in foreign currencies are translated at the foreigncurrency closing exchange rate ruling at the Statement of Financial Position date. Foreign currency exchangedifferences arising on translation and realised gains and losses on disposals or settlement of monetary assetsand liabilities are recognised in the Statement of Changes in Net Assets Attributable to Holders of RedeemableParticipating Shares. Non-monetary assets and liabilities denominated in foreign currencies that aremeasured at fair value are translated at the foreign currency exchange rates ruling at the dates that the valueswere determined. Foreign currency exchange differences relating to investments at fair value through profit orloss and derivative financial instruments are included in gains and losses on investments. All other foreigncurrency exchange differences relating to monetary items, including cash are presented in the Statement ofComprehensive Income.
Foreign exchange gain and losses on financial assets and financial liabilities at fair value through profit or lossare recognised together with other changes in fair value. Included in the Statement of Comprehensive Incomeline item “Net gains/(losses) on investments at fair value through profit or loss during the financial year” are netforeign exchange gains and losses on monetary financial assets and financial liabilities other than thoseclassified at fair value through profit or loss.
CONCEPT FUND SOLUTIONS PLC
Notes to the Financial Statements for the financial year ended 31 December 2017
557
2. Basis of Preparation cont/d
Critical accounting estimates and judgementsThe preparation of Financial Statements in conformity with FRS 102 requires the use of certain criticalaccounting estimates. It also requires the Board of Directors, based on the advice of the Investment Managerto exercise its judgement in the process of applying the Company's accounting policies. The estimates andassociated judgements are based on historical experience and various other factors that are believed to bereasonable under the circumstances, the results of which form the basis of making the judgements aboutcarrying values of assets and liabilities that are not readily apparent from other sources. Actual results maydiffer from these estimates.
Management makes estimates and assumptions concerning the future. The resulting accounting estimateswill, by definition, seldom equal the actual results.
3. Significant accounting policies
The accounting policies set out below have been applied consistently to all year and periods presented inthese financial statements.
(a) Financial instruments
(i) Fair Value Measurement, Recognition and DerecognitionThe Company has elected to apply the recognition and measurement provisions of IAS 39 and the disclosurerequirements of sections 11 and 12 of FRS 102.
Financial instruments are measured initially at fair value (transaction price), last traded price used for equitiesand mid price used for bonds. Transaction costs on financial assets and financial liabilities at fair value throughprofit or loss are expensed immediately.
Subsequent to initial recognition, all instruments classified at fair value through profit or loss are measured atfair value with changes in their fair value recognised in the Statement of Comprehensive Income.
Financial assets classified as loans and receivables are carried at amortised cost using the effective interestrate method, less impairment losses, if any.
Financial liabilities, other than those at fair value through profit or loss, are measured at amortised cost usingthe effective interest rate method. Financial liabilities arising from the redeemable shares issued by theCompany are carried at the redemption amount representing the Investors’ right to a residual interest in theCompany’s assets.
The Company recognises financial assets and financial liabilities when all significant rights and access to thebenefits from the assets and the exposure to the risks inherent in those benefits are transferred to theCompany. The Company derecognises financial assets and financial liabilities when all such benefits and risksare transferred from the Company.
(ii) CategorisationIn accordance with IAS 39 Financial Instruments: Recognition and Measurement the Company has classifiedits investments as financial assets at fair value through profit or loss category, held for trading.
The category of financial assets and financial liabilities at fair value through profit or loss comprises:
• Financial instruments held-for-trading. These include total return swaps, interest rate swaps, exchangetraded funds, futures contracts, equities and bonds included as financial assets at fair value through profit orloss on the Statement of Financial Position. All derivatives in a net receivable position (positive fair value), arereported as financial assets. All derivatives in a net payable position (negative fair value), are reported asfinancial liabilities.
• Financial instruments designated at fair value through profit or loss upon initial recognition. These includefinancial assets that are not held for trading purposes and which may be sold.
Financial assets that are classified as loans and receivables include deposits and accounts receivables.
CONCEPT FUND SOLUTIONS PLC
Notes to the Financial Statements for the financial year ended 31 December 2017 cont/d
558
3. Significant accounting policies cont/d
(a) Financial instruments cont/d
(ii) Categorisation cont/dFinancial liabilities that are not at fair value through profit or loss include accounts payable and financialliabilities arising on redeemable shares.
(iii) Fair value measurement principlesIf a quoted market price is not available on a recognised stock exchange or from a broker / dealer fornon-exchange- traded financial instruments, the fair value of the instrument is estimated using valuationtechniques, including use of recent arm’s length market transactions, reference to the current fair value ofanother instrument that is substantially the same, discounted cash flow techniques, option pricing models orany other valuation technique that provides a reliable estimate of prices obtained in actual markettransactions.
The fair value of derivatives that are not exchange-traded is estimated at the amount that the Company wouldreceive or pay to terminate the contract at the Statement of Financial Position date taking into account currentmarket conditions (volatility, appropriate yield curve) and the current creditworthiness of the counterparties.
The Company classifies its financial instruments using a fair value measurement that reflects the significanceof inputs used in making measurements, as set out in note 10.
(iv) Total Return Swaps“Total Return Swap” is the generic name for any non traditional swap where one party agrees to pay the otherthe “total return” of a defined underlying reference obligation, usually in return for receiving a stream of LIBORbased cashflows. The total return swap may be applied to any underlying reference obligation but is mostcommonly used with equity indices, single stocks, bonds and defined portfolios of loans and mortgages.
The total return swaps held by the Company are exposed to fluctuations on the underlying referenceobligations. However, in contrast to the typical total return swap there are no periodic payments to the swapcounterparty. The total return swaps are recorded as financial assets at fair value in the Statement of FinancialPosition.
The fair value of these total return swaps is determined by the Directors based on the mark to market valuationprovided by the counterparty. In determining the mark to market valuation, the counterparty makesassumptions that are based on market conditions existing on each Statement of Financial Position date anduses valuation techniques which include the use of comparable recent arm's length transactions, discountedcash flow techniques, option pricing models and other valuation techniques commonly used by marketparticipants.
(v) Cash, cash equivalents and bank overdraftsCash comprises current deposits and overdrafts with banks. Cash equivalents are short-term highly liquidinvestments that are readily convertible to known amounts of cash, are subject to an insignificant risk ofchanges in value, and are held for the purpose of meeting short-term cash commitments rather than forinvestment or other purposes.
Cash and cash equivalents are carried at amortised cost. Bank overdrafts are presented separately on theStatement of Financial Position.
(vi) Cash held with brokers for derivative contractsCash is deposited by or on behalf of the Fund for initial margin requirements for futures contracts.
(vii) Futures ContractsInitial margin deposits are made upon entering into futures contracts and are generally made in cash or cashequivalents. The fair value of futures contracts is based upon their current quoted daily settlement prices onthe relevant exchange as of the Statement of Financial Position date. Changes in the value of open futurescontracts are recognised as unrealised gains or losses on futures contracts until the contracts are terminated,at which time realised gains and losses are recognised. For each relevant Fund, gains or losses on openfutures contracts are shown in the Portfolio of Investments of each relevant Fund and as appropriate, on theStatement of Financial Position as financial assets or liabilities at fair value through profit or loss.
CONCEPT FUND SOLUTIONS PLC
Notes to the Financial Statements for the financial year ended 31 December 2017 cont/d
559
3. Significant accounting policies cont/d
(a) Financial instruments cont/d
(viii) Forward Foreign Currency ContractsForward Foreign Currency Exchange Contracts - The fair value of open forward foreign currency exchangecontracts is calculated as the difference between the contracted rate and the current forward rate that wouldclose out the contract on the Statement of Financial Position date. For each relevant Fund, gains or losses onopen foreign currency exchange contracts are included in the financial assets (or liabilities) at fair valuethrough profit or loss, as appropriate, on the Statement of Financial Position and are shown in the Portfolio ofInvestments of each relevant Fund.
(b) Interest incomeAll interest income and expense is recognised in the Statement of Comprehensive Income as it accrues, usingthe original effective interest rate of the instrument calculated at the acquisition or origination date.
Interest income includes the amortisation of any discount or premium, transaction costs or other differencesbetween the initial carrying amount of an interest-bearing instrument and its amount at maturity calculated onan effective interest rate basis. Interest income on debt instruments at fair value through profit or loss isaccrued using the original effective interest rate and classified to the “Income from investments at fair valuethrough profit or loss” line item within the Statement of Comprehensive Income. Bank interest is recognised ona gross basis and is classified to “Bank interest” on the Statement of Comprehensive Income. Interest incomeis recognised on a gross basis, including withholding tax, if any. Interest expense is recognised in theStatement of Comprehensive Income for all debt instruments using the effective interest method and isclassified on the following line item “Bank interest and charges”.
(c) ExpensesAll expenses, including management fees are recognised in the Statement of Comprehensive Income on anaccrual basis.
(d) Gains and Losses on InvestmentsRealised gains and losses on sales of investments are calculated on the average book cost. Realised andunrealised gains and losses on investments arising during the financial year are taken to the Statement ofComprehensive Income.
(e) TaxationInterest income received by the Company may be subject to withholding tax imposed in the country of origin.Investment income is recorded gross of such taxes. Please refer to note 5 for details.
(f) Participating Redeemable SharesThe Company classifies financial instruments issued as financial liabilities or equity instruments in accordancewith the substance of the contractual terms of the instruments. The redeemable shares provide investors withthe right to require redemption for cash at a value proportionate to the investor’s share in the Company’s netassets at each redemption date and also in the event of the Company’s liquidation.
The redeemable shares are classified as financial liabilities and are measured at a value proportionate to theinvestor’s share in the Company’s net assets at each redemption date. In accordance with the Company’sProspectus, the redemption amounts of the individual redeemable shares are calculated using the last-tradedprices of the Company’s underlying investments.
(g) Participating Dividends payableDividends payable on redeemable shares are recognised in the Statement of Changes in Net AssetsAttributable to Holders of Redeemable Participating Shares on the day of payment.
(h) Dividend incomeDividend income is recognised when the right to receive income is established. Usually this is the ex-dividenddate for equity securities. Dividend income from equity securities designated at fair value through profit or lossis recognised in the “Income from investments at fair value through profit or loss” line in the Statement ofComprehensive Income.
CONCEPT FUND SOLUTIONS PLC
Notes to the Financial Statements for the financial year ended 31 December 2017 cont/d
560
3. Significant accounting policies cont/d
(i) Securities lending incomeThe Company has appointed Deutsche Bank AG, London Branch as its securities lending agent. CertainFunds may lend securities through the security lending agent to brokers, dealers and other financialorganisations to earn additional income. Income earned from securities lending activities is accounted for onan accruals basis. See the Statement of Comprehensive Income and note 14 for details.
4. Significant agreements
Investment ManagerThe Company has appointed Deutsche Asset Management S.A. (the “Investment Manager”) effective from thedate 15 December 2017 (previously Deutsche International Corporate Services (Ireland) Limited) to providecertain investment related services to the Company. The Investment Manager has been established under thelaws of the Grand Duchy of Luxembourg in the form of a ―Société Anonyme" on 15 April 1987 having itsregistered office at 2, boulevard Konrad Adenauer, L-1115 Luxembourg, Grand Duchy of Luxembourg. TheInvestment Manager's principal business is the formation of collective investment undertakings and theprovision of investment management, advisory, distribution and administration services to collectiveinvestment undertakings and other clients. The Investment Manger may delegate its investment managementfunctions in respect of a Fund to a sub-investment manager and/or sub-portfolio manager.
For Funds that had Fee Rate changes during the year ended 31 December 2017, these changes have beendetailed in Note 18.
The Percentages included in the table below are the maximum investment management fee percentages thatcan be charged as at the 31 December 2017.
Fund name Share Class Fee RatePIANO 400 Fund (terminated on 18 August 2017) Class A 1.12%db x-trackers EUR Liquid Corporate 12.5 UCITS ETF Class 1C 0.25%db x-trackers Portfolio Income UCITS ETF Class 1D 0.21%db x-trackers MSCI Nordic Index UCITS ETF (DR) Class 1D 0.10%db x-trackers Mittelstand & MidCap Germany UCITS ETF (DR) Class 1D 0.20%db x-trackers MSCI North America High Dividend Yield Index UCITS ETF (DR) Class 1C 0.29%db x-trackers MSCI AC World Index UCITS ETF (DR) Class 1C 0.20%db x-trackers MSCI AC Far East ex Japan Index UCITS ETF (DR) Class 2C 0.50%db x-trackers MSCI USA Index UCITS ETF (DR) Class 1C 0.01%db x-trackers S&P 500® Equal Weight UCITS ETF (DR) Class 1C 0.15%db x-trackers MSCI World Index UCITS ETF (DR) Class 1C 0.09%db x-trackers MSCI World Index UCITS ETF (DR) Class 1D 0.09%db x-trackers MSCI World Index UCITS ETF (DR) Class 2D - GBP Hedged 0.19%db x-trackers FTSE Developed Europe ex UK Property UCITS ETF (DR) Class 1C 0.13%db x-trackers MSCI World Minimum Volatility UCITS ETF (DR) Class 1C 0.15%db-x trackers MSCI World Momentum Factor UCITS ETF (DR) Class 1C 0.15%db x-trackers MSCI World Quality Factor UCITS ETF (DR) Class 1C 0.15%db x-trackers MSCI World Value Factor UCITS ETF (DR) Class 1C 0.15%Deutsche MSCI World Index Fund Class 1D 0.01%db x-trackers MSCI GCC Select Index UCITS ETF Class 1C 0.45%db x-trackers FTSE All-World ex UK UCITS ETF (DR) Class 1C 0.20%db x-trackers S&P 500 UCITS ETF (DR) Class 1C - EUR Hedged 0.10%db x-trackers S&P 500 UCITS ETF (DR) Class 2C - GBP Hedged 0.10%db x-trackers S&P 500 UCITS ETF (DR) Class 3C - CHF Hedged 0.10%db x-trackers Russell 2000 UCITS ETF (DR) Class 1C 0.15%db x-trackers Russell Midcap UCITS ETF (DR) Class 1C 0.15%db x-trackers JPX-Nikkei 400 UCITS ETF (DR) Class 1D 0.10%db x-trackers JPX-Nikkei 400 UCITS ETF (DR) Class 2D - GBP Hedged 0.20%db x-trackers JPX-Nikkei 400 UCITS ETF (DR) Class 3C - EUR Hedged 0.20%db x-trackers JPX-Nikkei 400 UCITS ETF (DR) Class 4C - USD Hedged 0.20%db x-trackers FTSE 100 Equal Weight UCITS ETF (DR) Class 1D 0.15%db x-trackers USD Corporate Bond UCITS ETF (DR) Class 1D 0.06%
CONCEPT FUND SOLUTIONS PLC
Notes to the Financial Statements for the financial year ended 31 December 2017 cont/d
561
4. Significant agreements cont/d
Investment Manager cont/dFund name Share Class Fee Ratedb x-trackers USD Corporate Bond UCITS ETF (DR) Class 2D - EUR Hedged 0.11%db x-trackers iBoxx Eurozone Sovereigns Quality Weighted UCITS ETF (DR) Class 1D 0.10%db x-trackers MSCI World Health Care Index UCITS ETF (DR) Class 1C 0.15%db x-trackers MSCI World Financials Index UCITS ETF (DR) Class 1C 0.15%db x-trackers MSCI World Energy Index UCITS ETF (DR) Class 1C 0.15%db x-trackers MSCI World Consumer Staples Index UCITS ETF (DR) Class 1C 0.15%db x-trackers MSCI World Information Technology Index UCITS ETF (DR) Class 1C 0.15%db x-trackers MSCI World Industrials Index UCITS ETF (DR) Class 1C 0.15%db x-trackers MSCI World Consumer Discretionary Index UCITS ETF (DR) Class 1C 0.15%db x-trackers MSCI World Utilities Index UCITS ETF (DR) Class 1C 0.15%db x-trackers MSCI World Telecom Services Index UCITS ETF (DR) Class 1C 0.15%db x-trackers MSCI World Materials Index UCITS ETF (DR) Class 1C 0.15%db x-trackers iBoxx USD Emerging Sovereigns Quality Weighted UCITS ETF (DR) Class 1D 0.40%db x-trackers iBoxx USD Emerging Sovereigns Quality Weighted UCITS ETF (DR) Class 2D - EUR Hedged 0.45%db x-trackers iBoxx EUR Corporates Yield Plus UCITS ETF (DR) Class 1D 0.15%db x-trackers MSCI USA Minimum Volatility UCITS ETF (DR) Class 1D 0.10%db x-trackers MSCI EMU Minimum Volatility UCITS ETF (DR) Class 1D 0.15%db x-trackers MSCI Emerging Markets Index UCITS ETF (DR) Class 1C 0.10%db x-trackers MSCI USA Consumer Discretionary Index UCITS ETF (DR) Class 1D 0.02%db x-trackers MSCI USA Consumer Staples Index UCITS ETF (DR) Class 1D 0.02%db x-trackers MSCI USA Energy Index UCITS ETF (DR) Class 1D 0.02%db x-trackers MSCI USA Financials Index UCITS ETF (DR) Class 1D 0.02%db x-trackers MSCI USA Health Care Index UCITS ETF (DR) Class 1D 0.02%db x-trackers MSCI USA Information Technology Index UCITS ETF (DR) Class 1D 0.02%
The fees due under this investment management agreement will accrue daily and be calculated on eachDealing Day and paid each month in arrears with the exception of PIANO 400 Fund, which was paid quarterly(fund terminated on 18 August 2017). The Investment Manager will pay out of its fees (and not out of the assetsof the Fund) the fees of any sub-investment manager. Neither the Investment Manager nor anysub-investment manager will be entitled to be reimbursed out of the assets of the Fund for their respectiveout-of-pocket expenses. The Investment Manager was paid fees during the financial year of EUR 13,481,856(31 December 2016: EUR 14,232,605). The Investment Manager fees accrued at the financial year end wereEUR 1,081,120 (31 December 2016: EUR 2,332,886).
Sub-Investment ManagersDeutsche Asset Management Investment GmbH (the "DeAM GmbH") has been appointed as theSub-Investment Manager to the Funds which utilise a direct replication strategy (the DR Funds). DeAM GmbHhas appointed Deutsche Asset Management (UK) Limited (the "DeAM UK") as Sub-Portfolio Manager to theDR Funds. DeAM GmbH has been appointed as Sub-Investment Manager to Deutsche MSCI World IndexFund. Index Capital GmbH has been appointed as Allocation Agent to db x-trackers Portfolio Income UCITSETF. DeAM UK has been appointed as Sub-Investment Manager to db x-trackers EUR Liquid Corporate 12.5UCITS ETF and db x-trackers MSCI GCC Select Index UCITS ETF.
DeAM GmbH is a financial services institution, registered as HRB 23891 with the Commercial Register of theMunicipal Court of Frankfurt am Main. The registered office address is Mainzer Landstraße 178-190, 60327Frankfurt am Main, Germany. DeAM GmbH is authorised and regulated by the Bundesanstalt fürFinanzdienstleistungsaufsicht (“BaFin”) to provide individual portfolio management, investment advice,contract broking and investment broking.
Index Capital GmbH is registered in Munich, Germany with registered number WA 35-K 5000-126538-2011/0001. The registered office address is Heilmaierstraße 5, 81477 München, Germany. Index CapitalGmbH is authorised and regulated by the BaFin to provide investment advice and reception and transmissionof orders in relation to one or more financial instruments.
CONCEPT FUND SOLUTIONS PLC
Notes to the Financial Statements for the financial year ended 31 December 2017 cont/d
562
4. Significant agreements cont/d
Platform Fee ArrangementThe Company may in respect of each Fund (as specified in the relevant Supplement) enter into anarrangement with DeAM UK (the - Platform Fee Arranger), where the Platform Fee Arranger will, in exchangefor a Platform Fee (as defined in the relevant Supplement), pay the Platform Costs (as more fully describedbelow) from time to time of the Fund. Where applicable, the Platform Fee is calculated on the average daily NetAsset Value per Fund or per Class of Shares or the Initial Issue Price (as will be indicated in the Supplement)and is accrued daily and payable monthly. The Platform Fees paid during the financial year were EUR10,537,075 (31 December 2016: EUR 7,618,248). The Platform Fees accrued at the financial year end wereEUR 1,129,657 (31 December 2016: EUR 884,950). The Platform Fees are included in the Fixed feearrangement line in the Statement of Comprehensive Income.
Performance FeeThe initial Incentive Period will commence on, but exclude, the Initial Issue Date and, thereafter, immediatelyfollowing the close of the preceding Incentive Period, and shall end on, and include, (i) each Fee ValuationDate and any Dividend Valuation Date, (ii) the effective date that the Investment Manager ceases to be theFund’s investment manager or the Strategy Agent ceases to serve as Strategy Agent in respect of theUnderlying Asset, (iii) the date when the Fund dissolves or terminates and (iv) on the date the Fund no longerholds a Derivative Contract linked to the Underlying Asset.
No Incentive Fee shall be paid to the Investment Manager (or accrued by the Fund) unless and until the NetAsset Value per Share exceeds the previous highest Net Asset Value per Share (adjusted as described in theSupplement) on which the Incentive Fee was paid or accrued. The amount of net profits, upon which theIncentive Fee will be based, will be based upon both realised and unrealised income, gains and losses. TheIncentive Fee shall be calculated by the Administrator (and verified by the Depositary) on each DeterminationDate and paid on the relevant Fee Deduction Date. During each period, the Net Asset Value of Shares willreflect an estimated Incentive Fee amount which may be reconciled with final calculations on the relevant FeeDeduction Date. Performance fees during the financial year amounted to EUR Nil (31 December 2016: EUR304,630), of which EUR Nil was payable at the financial year end (31 December 2016: EUR Nil).
DepositaryThe Company has appointed State Street Custodial Services (Ireland) Limited to act as depositary of its assetspursuant to the Depositary Agreement and to provide trustee services to each Fund in accordance with theUCITS regulations. Under the terms of the Depositary Agreement, the Depositary may, however, appoint anyperson or persons to be the sub-custodian of the assets of the Company. The depositary fees are paid from thePlatform Fee Arrangement.
AdministratorThe Company has appointed State Street Fund Services (Ireland) Limited to act as Administrator of theCompany pursuant to the Administration Agreement. The Administrator is responsible for performing the dayto day administration of the Funds including the registrar and transfer agency function and for providing fundaccounting for the Fund, including the calculation of the Net Asset Value of the Fund and the Net Asset Valueper Share. The Administrator fees are paid out of the Platform Fee Arrangement.
Transaction costsTransaction costs are incremental costs that are directly attributable to the acquisition, issue or disposal of afinancial asset or financial liability. An incremental cost is one that would not have been incurred if the entityhad not acquired, issued or disposed of the financial instrument. When a financial asset or financial liability isrecognised initially, an entity shall measure it at its fair value through profit or loss plus transaction costs thatare directly attributable to the acquisition or issue of the financial asset or financial liability.
Transaction costs on the purchase and sale of bonds and swaps, are included in the purchase and sale priceof the investment. They cannot be practically or reliably gathered as they are embedded in the cost of theinvestment and cannot be separately verified or disclosed. Similarly custody transaction costs form part of theTotal Expense Ratio of the Fund but are not distinguishable from the other expenses captured within the TER.
CONCEPT FUND SOLUTIONS PLC
Notes to the Financial Statements for the financial year ended 31 December 2017 cont/d
563
4. Significant agreements cont/d
Transaction costs cont/dTransaction costs on purchases and sales of equities and futures are included in net gains/(losses) oninvestments in the statement of operations for each fund. Custody transaction costs are included incustodian/sub-custodian fees in the statement of operations for each Fund. These costs are separatelyidentifiable transaction costs.
For the financial year ended 31 December 2017, the Company incurred custody and transaction costs on otherpurchases and sales as follows:
Fund
Transaction costson purchase and
sale of investmentsCustody
transaction costsPIANO 400 Fund (terminated on 18 August 2017) EUR - EUR -db x-trackers EUR Liquid Corporate 12.5 UCITS ETF EUR - EUR 13,460db x-trackers Portfolio Income UCITS ETF EUR 2,707 EUR 15,040db x-trackers MSCI Nordic Index UCITS ETF (DR) EUR 9,866 EUR 15,702db x-trackers Mittelstand & MidCap Germany UCITS ETF (DR) EUR 3,692 EUR 17,093db x-trackers MSCI North America High Dividend Yield Index UCITS ETF (DR) USD 3,763 USD 3,617db x-trackers MSCI AC World Index UCITS ETF (DR) EUR 87,561 EUR 28,302db x-trackers MSCI AC Far East ex Japan Index UCITS ETF (DR) EUR 2,144 EUR 23,900db x-trackers MSCI USA Index UCITS ETF (DR) USD 142,919 USD 23,215db x-trackers S&P 500® Equal Weight UCITS ETF (DR) USD 29,641 USD 15,096db x-trackers MSCI World Index UCITS ETF (DR) USD 804,150 USD 42,310db x-trackers FTSE Developed Europe ex UK Property UCITS ETF (DR) EUR 28,787 EUR 25,838db x-trackers MSCI World Minimum Volatility UCITS ETF (DR) USD 7,518 USD 21,862db x-trackers MSCI World Momentum Factor UCITS ETF (DR) USD 37,171 USD 27,616db x-trackers MSCI World Quality Factor UCITS ETF (DR) USD 64,425 USD 20,809db x-trackers MSCI World Value Factor UCITS ETF (DR) USD 91,268 USD 22,747Deutsche MSCI World Index Fund EUR 19,203 EUR 21,996db x-trackers MSCI GCC Select Index UCITS ETF USD 80,731 USD 21,953db x-trackers FTSE All-World ex UK UCITS ETF (DR) GBP 13,180 GBP 26,836db x-trackers S&P 500 UCITS ETF (DR) USD 64,006 USD 29,297db x-trackers Russell 2000 UCITS ETF (DR) USD 41,144 USD 43,298db x-trackers Russell Midcap UCITS ETF (DR) USD 6,677 USD 13,651db x-trackers JPX-Nikkei 400 UCITS ETF (DR) JPY 2,774,064 JPY 3,859,582db x-trackers FTSE 100 Equal Weight UCITS ETF (DR) GBP 34,989 GBP 18,076db x-trackers USD Corporate Bond UCITS ETF (DR) USD - USD 5,652db x-trackers iBoxx Eurozone Sovereigns Quality Weighted UCITS ETF (DR) EUR - EUR 16,255db x-trackers MSCI World Health Care Index UCITS ETF (DR) USD 31,196 USD 6,565db x-trackers MSCI World Financials Index UCITS ETF (DR) USD 204,694 USD 20,356db x-trackers MSCI World Energy Index UCITS ETF (DR) USD 300,440 USD 8,052db x-trackers MSCI World Consumer Staples Index UCITS ETF (DR) USD 88,681 USD 14,329db x-trackers MSCI World Information Technology Index UCITS ETF (DR) USD 39,060 USD 7,148db x-trackers MSCI World Industrials Index UCITS ETF (DR) USD 11,458 USD 23,366db x-trackers MSCI World Consumer Discretionary Index UCITS ETF (DR) USD 51,102 USD 11,694db x-trackers MSCI World Utilities Index UCITS ETF (DR) USD 5,541 USD 22,590db x-trackers MSCI World Telecom Services Index UCITS ETF (DR) USD 55,115 USD 14,295db x-trackers MSCI World Materials Index UCITS ETF (DR) USD 9,239 USD 23,685db x-trackers iBoxx USD Emerging Sovereigns Quality Weighted UCITS ETF (DR) USD - USD 11,592db x-trackers iBoxx EUR Corporates Yield Plus UCITS ETF (DR) EUR - EUR 16,008db x-trackers MSCI USA Minimum Volatility UCITS ETF (DR) USD 615 USD 18,835db x-trackers MSCI EMU Minimum Volatility UCITS ETF (DR) EUR 61,489 EUR 26,638db x-trackers MSCI Emerging Markets Index UCITS ETF (DR) USD 737,647 USD 135,762db x-trackers MSCI USA Consumer Discretionary Index UCITS ETF (DR) USD 310 USD 4,036db x-trackers MSCI USA Consumer Staples Index UCITS ETF (DR) USD 248 USD 4,188db x-trackers MSCI USA Energy Index UCITS ETF (DR) USD 259 USD 4,141db x-trackers MSCI USA Financials Index UCITS ETF (DR) USD 13,018 USD 1,147db x-trackers MSCI USA Health Care Index UCITS ETF (DR) USD 250 USD 186db x-trackers MSCI USA Information Technology Index UCITS ETF (DR) USD 317 USD 4,030
CONCEPT FUND SOLUTIONS PLC
Notes to the Financial Statements for the financial year ended 31 December 2017 cont/d
564
4. Significant agreements cont/d
Transaction costs cont/dFor the financial year ended 31 December 2016, the Company incurred custody and transaction costs on otherpurchases and sales as follows:
Fund
Transaction costson purchase and
sale of investments
Custodytransaction
costsPIANO 400 Fund EUR - EUR -db x-trackers EUR Liquid Corporate 12.5 UCITS ETF EUR - EUR 5,634db x-trackers Portfolio Income UCITS ETF EUR 2,853 EUR 13,895db x-trackers Stiftungs-Stabilität UCITS ETF EUR 86 EUR 10,496db x-trackers MSCI Nordic Index UCITS ETF (DR) EUR 7,115 EUR 17,270db x-trackers MSCI Turkey Index UCITS ETF (DR) USD 1,704 USD 13,699db x-trackers Mittelstand & MidCap Germany UCITS ETF (DR) EUR 2,125 EUR 15,501db x-trackers MSCI North America High Dividend Yield Index UCITS ETF (DR) USD 2,805 USD 4,901db x-trackers MSCI AC World Index UCITS ETF (DR) EUR 116,271 EUR 47,674db x-trackers MSCI AC Far East ex Japan Index UCITS ETF (DR) EUR 3,631 EUR 25,812db x-trackers MSCI USA Index UCITS ETF (DR) USD 77,981 USD 36,306db x-trackers S&P 500® Equal Weight UCITS ETF (DR) USD 47,198 USD 16,154db x-trackers MSCI World Index UCITS ETF (DR) USD 483,492 USD 86,186db x-trackers FTSE Developed Europe ex UK Property UCITS ETF (DR) EUR 100,834 EUR 19,387db x-trackers MSCI World Minimum Volatility UCITS ETF (DR) USD 41,759 USD 35,472db-x trackers MSCI World Momentum Factor UCITS ETF (DR) USD 77,339 USD 33,682db x-trackers MSCI World Quality Factor UCITS ETF (DR) USD 48,943 USD 30,614db x-trackers MSCI World Value Factor UCITS ETF (DR) USD 174,522 USD 28,237Deutsche MSCI World Index Fund EUR 15,806 EUR 3,344db x-trackers MSCI GCC Select Index UCITS ETF USD 119,803 USD 11,730db x-trackers FTSE All-World ex UK UCITS ETF (DR) GBP 2,852 GBP 16,412db x-trackers S&P 500 UCITS ETF (DR) USD 63,966 USD 27,253db x-trackers Russell 2000 UCITS ETF (DR) USD 36,519 USD 56,360db x-trackers Russell Midcap UCITS ETF (DR) USD 9,901 USD 13,657db x-trackers JPX-Nikkei 400 UCITS ETF (DR) JPY 4,011,333 JPY 5,252,276db x-trackers FTSE 100 Equal Weight UCITS ETF (DR) GBP 38,164 GBP 14,691db x-trackers USD Corporate Bond UCITS ETF (DR) USD - USD 7,811db x-trackers iBoxx Eurozone Sovereigns Quality Weighted UCITS ETF (DR) EUR - EUR 18,027db x-trackers MSCI World Health Care Index UCITS ETF (DR) USD 98,344 USD 5,414db x-trackers MSCI World Financials Index UCITS ETF (DR) USD 223,481 USD 28,319db x-trackers MSCI World Energy Index UCITS ETF (DR) USD 116,999 USD 9,935db x-trackers MSCI World Consumer Staples Index UCITS ETF (DR) USD 63,456 USD 9,520db x-trackers MSCI World Information Technology Index UCITS ETF (DR) USD 27,778 USD 5,108db x-trackers MSCI World Industrials Index UCITS ETF (DR) USD 13,450 USD 16,801db x-trackers MSCI World Consumer Discretionary Index UCITS ETF (DR) USD 70,092 USD 10,255db x-trackers MSCI World Utilities Index UCITS ETF (DR) USD 7,213 USD 15,513db x-trackers MSCI World Telecom Services Index UCITS ETF (DR) USD 18,265 USD 13,609db x-trackers MSCI World Materials Index UCITS ETF (DR) USD 6,882 USD 14,975db x-trackers iBoxx USD Emerging Sovereigns Quality Weighted UCITS ETF (DR) USD - USD 5,843db x-trackers iBoxx EUR Corporates Yield Plus UCITS ETF (DR) EUR - EUR 7,050db x-trackers MSCI USA Minimum Volatility UCITS ETF (DR) USD 531 USD 1,040db x-trackers MSCI EMU Minimum Volatility UCITS ETF (DR) EUR 5,877 EUR 1,062
5. Taxation
The Company is an investment undertaking as defined in Section 739B of the Taxes Consolidation Act, 1997.Therefore, the Company will not be liable to Irish tax in respect of its income and gains, other than on theoccurrence of a chargeable event. A chargeable event includes any distribution payments to shareholders orany encashment, redemption or transfer of shares or the ending period for which the investment was held.
Generally a chargeable event arises on any distribution, redemption, repurchase, cancellation, transfer ofshares or the ending of a ‘Relevant Period’. A ‘Relevant Period’ is an eight year period beginning with theacquisition of the shares by the shareholder and each subsequent period of eight years beginning immediatelyafter the preceding Relevant Period.
CONCEPT FUND SOLUTIONS PLC
Notes to the Financial Statements for the financial year ended 31 December 2017 cont/d
565
5. Taxation cont/d
A gain on a chargeable event does not arise in respect of:
a) a shareholder who is not an Irish resident and not ordinarily resident in Ireland at the time of thechargeable event, provided the necessary signed statutory declarations are held by the Company;
b) certain exempted Irish tax resident Investors who have provided the Company with the necessary signedstatutory declarations;
c) an exchange of shares arising on a qualifying amalgamation or reconstruction of the Company withanother fund;
d) any transactions in relation to shares held in a recognised clearing system as designated by order of theRevenue Commissioners of Ireland;
e) certain exchanges of shares between spouses and former spouses on the occasion of judicial separationand/or divorce;
f) an exchange by a shareholder, effected by way of an arm’s length bargain where no payment is made tothe shareholder of shares in the Company for other shares in the Company.
Capital gains, dividends and interest (if any) received on investment made by the Company may be subject towithholding taxes imposed by the country from which the investment income/gains are received and suchtaxes may not be recoverable by the Company or its shareholders.
In the absence of an appropriate declaration, the Company will be liable for Irish tax on the occurrence of achargeable event, and the Company reserves its right to withhold such taxes from the relevant shareholders.
6. Net gains/(losses) on investments at fair value through profit or loss during the financial year
Financial year ended 31 December 2017PIANO
400 Fund1
db x-trackersEUR Liquid
Corporate12.5
UCITS ETF
db x-trackersPortfolio
IncomeUCITS ETF
db x-trackersMSCI NordicIndex UCITS
ETF (DR)
db x-trackersMittelstand &
MidCapGermany
UCITSETF (DR)
EUR EUR EUR EUR EURNet gains/(losses) on transferable securities heldfor trading 10,989,811 (22,779,703) 544,621 6,999,368 16,769,106Net losses on foreign currencies - - (2,739) (367,580) -Net gains on derivatives - - - 14,739 19,946Net (losses)/gains on swaps (13,067,944) 36,478,017 - - -Swap payments - - - - -Net (losses)/gains on investments at fair valuethrough profit or loss (2,078,133) 13,698,314 541,882 6,646,527 16,789,052
1PIANO 400 Fund terminated on 18 August 2017.
Financial year ended 31 December 2017
db x-trackersMSCI North
America HighDividend
YieldIndex UCITS
ETF (DR)
db x-trackersMSCI AC
WorldIndex UCITS
ETF (DR)
db x-trackersMSCI AC Far
East ex JapanIndex UCITS
ETF (DR)
db x-trackersMSCI USA
Index UCITSETF (DR)
db x-trackersS&P 500®
Equal WeightUCITS
ETF (DR)USD EUR EUR USD USD
Net gains on transferable securities held fortrading 21,050,862 10,685,338 4,184,554 532,484,699 77,770,448Net losses on foreign currencies (168,261) (2,598,780) (1,514) - -Net gains on derivatives 63,301 81,922 27,928 1,875,462 332,920Net gains on swaps - - - - -Swap payments - - - - -Net gains on investments at fair value throughprofit or loss 20,945,902 8,168,480 4,210,968 534,360,161 78,103,368
CONCEPT FUND SOLUTIONS PLC
Notes to the Financial Statements for the financial year ended 31 December 2017 cont/d
566
6. Net gains/(losses) on investments at fair value through profit or loss during the financialyear cont/d
Financial year ended 31 December 2017
db x-trackersMSCI World
IndexUCITS
ETF (DR)
db x-trackersFTSE
DevelopedEurope ex UK
PropertyUCITS
ETF (DR)
db x-trackersMSCI World
MinimumVolatility
UCITSETF (DR)
db-x trackersMSCI WorldMomentum
Factor UCITSETF (DR)
db x-trackersMSCI World
Quality FactorUCITS ETF
(DR)USD EUR USD USD USD
Net gains on transferable securities held fortrading 435,208,121 8,074,403 8,640,790 13,433,436 11,805,240Net (losses)/gains on foreign currencies (2,065,251) (225,675) (227,495) 798,650 24,953Net gains/(losses) on derivatives 1,286,933 - (1) (222) -Net gains on swaps - - - - -Swap payments - - - - -Net gains on investments at fair value throughprofit or loss 434,429,803 7,848,728 8,413,294 14,231,864 11,830,193
Financial year ended 31 December 2017
db x-trackersMSCI World
Value FactorUCITS ETF
(DR)
DeutscheMSCI WorldIndex Fund
db x-trackersMSCI GCC
Select IndexUCITS ETF
db x-trackersFTSE All-
World ex UKUCITS ETF
(DR)
db x-trackersS&P 500
UCITSETF (DR)
USD EUR USD GBP USDNet gains/(losses) on transferable securities heldfor trading 28,575,344 (3,784,930) 3,143,032 681,746 167,339,528Net (losses)/gains on foreign currencies (49,178) 5,506,020 (1,498,848) 2,635,880 84,851,917Net gains on derivatives 1,767 1 - 6,723 627,223Net losses on swaps - - (770,525) - -Swap payments - - (54,749) - -Net gains on investments at fair value throughprofit or loss 28,527,933 1,721,091 818,910 3,324,349 252,818,668
Financial year ended 31 December 2017
db x-trackersRussell 2000
UCITSETF (DR)
db x-trackersRussellMidcapUCITS
ETF (DR)
db x-trackersJPX-Nikkei
400UCITS
ETF (DR)
db x-trackersFTSE 100
Equal WeightUCITS
ETF (DR)
db x-trackersUSD
CorporateBond UCITS
ETF (DR)USD USD JPY GBP USD
Net gains on transferable securities held fortrading 55,649,048 20,362,042 4,997,003,224 1,613,613 25,083,576Net gains/(losses) on foreign currencies 359 - 1,016,429,189 (127) 20,509,239Net gains/(losses) on derivatives 291,571 92,145 30,422,746 8,109 (65,245)Net gains on swaps - - - - -Swap payments - (34) - - -Net gains on investments at fair value throughprofit or loss 55,940,978 20,454,153 6,043,855,159 1,621,595 45,527,570
Financial year ended 31 December 2017
db x-trackersiBoxx
EurozoneSovereigns
QualityWeighted
UCITSETF (DR)
db x-trackersMSCI WorldHealth Care
Index UCITSETF (DR)
db x-trackersMSCI World
FinancialsIndex UCITS
ETF (DR)
db x-trackersMSCI World
Energy IndexUCITS
ETF (DR)
db x-trackersMSCI World
ConsumerStaples Index
UCITSETF (DR)
EUR USD USD USD USDNet gains on transferable securities held fortrading 3,171 39,557,859 54,746,013 18,664,817 11,354,424Net gains/(losses) on foreign currencies - (831,261) 2,416,195 465,243 (222,621)Net gains on derivatives 1 1 - - -Net gains on swaps - - - - -Swap payments - - - - -Net gains on investments at fair value throughprofit or loss 3,172 38,726,599 57,162,208 19,130,060 11,131,803
CONCEPT FUND SOLUTIONS PLC
Notes to the Financial Statements for the financial year ended 31 December 2017 cont/d
567
6. Net gains/(losses) on investments at fair value through profit or loss during the financialyear cont/d
Financial year ended 31 December 2017
db x-trackersMSCI WorldInformationTechnology
Index UCITSETF (DR)
db x-trackersMSCI WorldIndustrials
Index UCITSETF (DR)
db x-trackersMSCI World
ConsumerDiscretionaryIndex UCITS
ETF (DR)
db x-trackersMSCI World
UtilitiesIndex UCITS
ETF (DR)
db x-trackersMSCI World
TelecomServices
Index UCITSETF (DR)
USD USD USD USD USDNet gains on transferable securities held fortrading 67,067,905 6,457,986 28,654,185 902,771 813,857Net gains/(losses) on foreign currencies 487,078 (87,933) 357,282 (22,775) 921,492Net gains/(losses) on derivatives 2 - - - (1)Net gains on swaps - - - - -Swap payments - - - - -Net gains on investments at fair value throughprofit or loss 67,554,985 6,370,053 29,011,467 879,996 1,735,348
Financial year ended 31 December 2017
db x-trackersMSCI World
MaterialsIndex UCITS
ETF (DR)
db x-trackersiBoxx USDEmerging
SovereignsQuality
WeightedUCITS
ETF (DR)
db x-trackersiBoxx
EURCorporates
Yield PlusUCITS
ETF (DR)
db x-trackersMSCI USAMinimumVolatility
UCITS ETF(DR)
db x-trackersMSCI EMU
MinimumVolatility
UCITS ETF(DR)
USD USD EUR USD EURNet gains on transferable securities held fortrading 3,207,792 1,065,846 2,863,503 1,066,024 1,487,140Net (losses)/gains on foreign currencies (102,511) (32,260) - - 50Net losses on derivatives - - - - (171)Net gains on swaps - - - - -Swap payments - - - - -Net gains on investments at fair value throughprofit or loss 3,105,281 1,033,586 2,863,503 1,066,024 1,487,019
Financial year ended 31 December 2017
db x-trackersMSCI
EmergingMarkets Index
UCITS ETF(DR)1
db x-trackersMSCI USAConsumer
DiscretionaryIndex
UCITS ETF(DR)1
db x-trackersMSCI USAConsumer
StaplesIndex UCITS
ETF (DR)1
db x-trackersMSCI USA
Energy IndexUCITS ETF
(DR)1
db x-trackersMSCI USAFinancials
IndexUCITS ETF
(DR)1
USD USD USD USD USDNet gains on transferable securities held fortrading 60,307,780 555,032 156,864 590,003 10,107,941Net gains on foreign currencies 227,684 - - - -Net gains on derivatives 46,672 - - - -Net gains on swaps - - - - -Swap payments - - - - -Net gains on investments at fair value throughprofit or loss 60,582,136 555,032 156,864 590,003 10,107,941
1db x-trackers MSCI Emerging Markets Index UCITS ETF (DR) launched on 21 June 2017.
1db x-trackers MSCI USA Consumer Discretionary Index UCITS ETF (DR), db x-trackers MSCI USA Consumer Staples Index UCITS ETF(DR), db x-trackers MSCI USA Energy Index UCITS ETF (DR) and db x-trackers MSCI USA Financials Index UCITS ETF (DR) launched on12 September 2017.
CONCEPT FUND SOLUTIONS PLC
Notes to the Financial Statements for the financial year ended 31 December 2017 cont/d
568
6. Net gains/(losses) on investments at fair value through profit or loss during the financialyear cont/d
Financial year ended 31 December 2017
db x-trackersMSCI USA
Health CareIndex UCITS
ETF (DR)2
db x-trackersMSCI USA
InformationTechnology
IndexUCITS ETF
(DR)2 TotalUSD USD EUR
Net (losses)/gains on transferable securities held for trading (34,760) 549,835 1,575,194,128Net gains on foreign currencies - - 106,096,556Net gains on derivatives - - 4,394,949Net gains on swaps - - 22,733,937Swap payments - - (48,072)
Net (losses)/gains on investments at fair value through profit or loss (34,760) 549,835 1,708,371,498
2db x-trackers MSCI USA Information Technology Index UCITS ETF (DR) and db x-trackers MSCI USA Health Care Index UCITS ETF (DR)launched on 12 September 2017.
Financial year ended 31 December 2016PIANO
400 Fund
db x-trackersEUR Liquid
Corporate12.5
UCITS ETF
db x-trackersPortfolio
IncomeUCITS ETF
db x-trackersStiftungs-Stabilität
UCITS ETF1
db x-trackersMSCI NordicIndex UCITS
ETF (DR)EUR EUR EUR EUR EUR
Net (losses)/gains on transferable securities heldfor trading (13,598,745) (74,988,630) 1,067,894 (15,744) (694,123)Net gains/(losses) on foreign currencies - - 165,650 - (362,010)Net gains on derivatives - - - - 31,816Net gains on swaps 220 101,170,835 - - -Swap payments - - - - -Net (losses)/gains on investments at fair valuethrough profit or loss (13,598,525) 26,182,205 1,233,544 (15,744) (1,024,317)
1db x-trackers Stiftungs-UCITS ETF Stabilität terminated on 27 June 2016.
Financial year ended 31 December 2016
db x-trackersMSCI TurkeyIndex UCITS
ETF (DR)1
db x-trackersMittelstand &
MidCapGermany
UCITSETF (DR)
db x-trackersMSCI North
America HighDividend
YieldIndex UCITS
ETF (DR)
db x-trackersMSCI AC
WorldIndex UCITS
ETF (DR)
db x-trackersMSCI AC Far
East ex JapanIndex UCITS
ETF (DR)USD EUR USD EUR EUR
Net gains on transferable securities held fortrading 3,010,088 1,544,918 13,448,629 10,313,392 1,098,209Net (losses)/gains on foreign currencies (2,318,000) - (197,355) 475,325 341,273Net gains/(losses) on derivatives 82 10,648 11,374 67,037 (2,572)Net gains on swaps - - - - -Swap payments - - - - -Net gains on investments at fair value throughprofit or loss 692,170 1,555,566 13,262,648 10,855,754 1,436,910
1db x-trackers MSCI Turkey Index UCITS ETF (DR) terminated on 27 June 2016.
CONCEPT FUND SOLUTIONS PLC
Notes to the Financial Statements for the financial year ended 31 December 2017 cont/d
569
6. Net gains/(losses) on investments at fair value through profit or loss during the financialyear cont/d
Financial year ended 31 December 2016
db x-trackersMSCI USA
Index UCITSETF (DR)
db x-trackersS&P 500®
Equal WeightUCITS
ETF (DR)
db x-trackersMSCI World
IndexUCITS
ETF (DR)
db x-trackersFTSE
DevelopedEurope ex UK
PropertyUCITS
ETF (DR)
db x-trackersMSCI World
MinimumVolatility
UCITSETF (DR)
USD USD USD EUR USDNet gains on transferable securities held fortrading 169,594,693 36,780,372 106,106,749 12,169,102 2,288,729Net gains/(losses) on foreign currencies 156 - (1,969,011) (85,673) (366,449)Net gains on derivatives 801,056 213,955 735,442 - 6,926Net gains on swaps - - - - -Swap payments - - - - -Net gains on investments at fair value throughprofit or loss 170,395,905 36,994,327 104,873,180 12,083,429 1,929,206
Financial year ended 31 December 2016
db-x trackersMSCI WorldMomentum
Factor UCITSETF (DR)
db x-trackersMSCI World
Quality FactorUCITS ETF
(DR)
db x-trackersMSCI World
Value FactorUCITS ETF
(DR)
DeutscheMSCI WorldIndex Fund
db x-trackersMSCI GCC
Select IndexUCITS ETF
USD USD USD EUR USDNet gains on transferable securities held fortrading 247,501 3,734,460 11,009,512 8,740,777 8,337,148Net gains/(losses) on foreign currencies 608,744 (391,303) (914,594) 425,378 3,267,321Net gains/(losses) on derivatives 5,292 5,406 (10,291) - -Net losses on swaps - - - - (8,969,251)Swap payments - - - - -Net gains on investments at fair value throughprofit or loss 861,537 3,348,563 10,084,627 9,166,155 2,635,218
Financial year ended 31 December 2016
db x-trackersFTSE All-
World ex UKUCITS ETF
(DR)
db x-trackersS&P 500
UCITSETF (DR)
db x-trackersRussell 2000
UCITSETF (DR)
db x-trackersRussellMidcapUCITS
ETF (DR)
db x-trackersJPX-Nikkei
400UCITS
ETF (DR)GBP USD USD USD JPY
Net gains on transferable securities held fortrading 6,131,765 53,841,900 45,397,102 11,123,492 352,759,583Net gains/(losses) on foreign currencies 624,784 (42,012,036) - - (288,632,261)Net gains on derivatives 15,451 170,765 492,469 21,778 9,783,506Net gains on swaps - - - - -Swap payments - - - - -Net gains on investments at fair value throughprofit or loss 6,772,000 12,000,629 45,889,571 11,145,270 73,910,828
Financial year ended 31 December 2016
db x-trackersFTSE 100
Equal WeightUCITS
ETF (DR)
db x-trackersUSD
CorporateBond UCITS
ETF (DR)
db x-trackersiBoxx
EurozoneSovereigns
QualityWeighted
UCITSETF (DR)
db x-trackersMSCI WorldHealth Care
Index UCITSETF (DR)
db x-trackersMSCI World
FinancialsIndex UCITS
ETF (DR)GBP USD EUR USD USD
Net gains/(losses) on transferable securities heldfor trading 1,654,858 (23,068,588) 205,480 (9,530,877) 16,644,438Net gains/(losses) on foreign currencies 1,184 (12,570,993) - (198,096) (546,187)Net gains/(losses) on derivatives 21,279 (9,816) - - -Net gains on swaps - - - - -Swap payments - - - - -Net gains/(losses) on investments at fair valuethrough profit or loss 1,677,321 (35,649,397) 205,480 (9,728,973) 16,098,251
CONCEPT FUND SOLUTIONS PLC
Notes to the Financial Statements for the financial year ended 31 December 2017 cont/d
570
6. Net gains/(losses) on investments at fair value through profit or loss during the financialyear cont/d
Financial year ended 31 December 2016
db x-trackersMSCI World
Energy IndexUCITS
ETF (DR)
db x-trackersMSCI World
ConsumerStaples Index
UCITSETF (DR)
db x-trackersMSCI WorldInformationTechnology
Index UCITSETF (DR)
db x-trackersMSCI WorldIndustrials
Index UCITSETF (DR)
db x-trackersMSCI World
ConsumerDiscretionaryIndex UCITS
ETF (DR)USD USD USD USD USD
Net gains/(losses) on transferable securities heldfor trading 7,923,821 (1,902,343) 11,256,248 977,395 3,768,595Net (losses)/gains on foreign currencies (407,825) (305,243) 27,733 (28,234) (678,845)Net gains on derivatives 64,478 - - - -Net gains on swaps - - - - -Swap payments - - - - -Net gains/(losses) on investments at fair valuethrough profit or loss 7,580,474 (2,207,586) 11,283,981 949,161 3,089,750
Financial year ended 31 December 2016
db x-trackersMSCI World
UtilitiesIndex UCITS
ETF (DR)
db x-trackersMSCI World
TelecomServices
Index UCITSETF (DR)
db x-trackersMSCI World
MaterialsIndex UCITS
ETF (DR)1
db x-trackersiBoxx USDEmerging
SovereignsQuality
WeightedUCITS
ETF (DR)2
db x-trackersiBoxx
EURCorporates
Yield PlusUCITS
ETF (DR)3
USD USD USD USD EURNet (losses)/gains on transferable securities heldfor trading (106,346) 154,270 1,158,365 (849,176) 91,164Net (losses)/gains on foreign currencies (9,178) (14,580) 4,454 - -Net gains on derivatives - - - - -Net gains on swaps - - - - -Swap payments - - - - -Net (losses)/gains on investments at fair valuethrough profit or loss (115,524) 139,690 1,162,819 (849,176) 91,164
1db x-trackers MSCI World Materials Index UCITS ETF (DR) launched on 16 March 2016.
2db x-trackers iBoxx USD Emerging Sovereigns Quality Weighted UCITS ETF (DR) launched on 4 April 2016.
3db x-trackers iBoxx EUR Corporates Yield Plus UCITS ETF (DR) launched on 7 June 2016.
Financial year ended 31 December 2016
db x-trackersMSCI USAMinimumVolatility
UCITS ETF(DR)1
db x-trackersMSCI EMU
MinimumVolatility
UCITS ETF(DR)1 Total
USD EUR EURNet gains on transferable securities held for trading 94,992 222,111 385,659,799Net losses on foreign currencies - - (54,146,433)Net gains on derivatives - - 2,505,842Net gains on swaps - - 93,045,261Swap payments - - -
Net gains on investments at fair value through profit or loss 94,992 222,111 427,064,469
1db x-trackers MSCI USA Minimum Volatility UCITS ETF (DR) and db x-trackers MSCI EMU Minimum Volatility UCITS ETF (DR)launched on 8 November 2016.
7. Directors' remuneration
The Directors who are not associated with Deutsche Bank AG will be entitled to remuneration for their servicesas Directors, as described below. All of the Directors will be entitled to be reimbursed out of the assets of eachFund for their reasonable out of pocket expenses incurred in discharging their duties as Directors. With effectfrom 1 October 2014, the Directors have been paid before deduction by the Company of all amounts requiredto be deducted by law under the Pay As You Earn (PAYE) system, deductions of income tax (and potentiallysocial security contributions) at source under that system and the deduction of the universal social charge(USC) at source by the Company under the USC system:
CONCEPT FUND SOLUTIONS PLC
Notes to the Financial Statements for the financial year ended 31 December 2017 cont/d
571
7. Directors' remuneration cont/d
• a base fee of €25,000 per annum in respect of the first five launched sub-funds of the Company since15 December 2004, as adjusted to reflect the subsequent termination of the sub-funds, as at the date thatsuch base fee is to be paid (the Base Fee Funds). For the avoidance of doubt, a sub-fund will be deemed"launched" for the purposes of this Clause 6 once the Company has issued, and continues to issue,shares in that sub-fund in exchange for subscription proceeds;
• an additional fee of €1,250 per annum, in respect of each complex, systematic fund launched in additionto the Base Fee Funds, as determined by Deutsche Bank AG (the Promoter); and
• an additional fee of €750 per annum in respect of each non-complex, ETF index tracking sub-fund,launched in addition to the Base Fee Funds, as determined by Deutsche Bank AG.
Fees are subject to a maximum fee of €75,000 per Director per annum.
The Directors’ Fees are paid from the Fixed Fee Arrangement; the amount of Directors’ Fees paid during thefinancial year ended 31 December 2017 was EUR 201,495 (31 December 2016: EUR 149,188).
8. Auditor’s fee
The remuneration for all work carried out by the statutory audit firm, in respect of the financial year is includedin the Fixed Fee Payment. Fees paid to PricewaterhouseCoopers in Ireland in respect of the financial yearended 31 December 2017 amounted to EUR 244,400 (exclusive of VAT) (for the financial year ended31 December 2016: EUR 232,000 (exclusive of VAT)) for statutory audit work. Other assurance service feespaid to PricewaterhouseCoopers in Ireland for the financial year ended 31 December 2017 were EUR 21,500(for the financial year ended 31 December 2016: EUR 21,500). Other non-audit service fees paid toPricewaterhouseCoopers in Ireland for the financial year ended 31 December 2017 were EUR Nil (for thefinancial year ended 31 December 2016: EUR 30,000). There were no other tax advisory service fees paid toPricewaterhouseCoopers in Ireland.
9. Shares in issue
Authorised Share Capital and Subscriber SharesThe authorised subscriber share capital at 1 March 2006 was EUR 300,002 represented by 300,002 shares(the “Subscriber Shares”) issued for the purposes of the incorporation of the Company at an issue price of EUR1 per Share. EUR 300,000 of these shares were repurchased during the first year, resulting in 2 shares in issueat the financial year end. These shares do not form part of the Net Asset Value of the Company. They are thusdisclosed in the financial statements by way of this note only.
Subscriber Shares do not entitle the holders to any dividend and on winding up entitle the holder to receive theamount paid up thereon but not otherwise to participate in the assets of the Company.
The redeemable participating Shares are classified as liabilities in accordance with Financial ReportingStandard No. 25 “Financial instruments disclosure and presentation” as they are redeemable at the request ofthe holders. The authorised share capital of the Company is 2 subscriber shares of EUR 1 each and1,000,000,000,000 shares of no par value initially designated as unclassified shares. The unclassified sharesare available for issue as shares. The issue price is payable in full on acceptance. There are no rights ofpreemption attaching to the shares in the Company.
The redeemable participating shares issued by the Company are freely transferable and are entitled toparticipate equally in the profits and dividends of the relevant Fund and its assets upon liquidations. Theseshares, which are of no par value and which must be fully paid up on issue, carry no preferential or preemptiverights and are entitled to one vote each at all meetings of the relevant class of shareholders. All shares of eachFund will rank pari-passu. They may be redeemed by the Company at the request of the shareholder.
The number of Participating Shares issued and redeemed during the financial year is set out on the followingpages.
CONCEPT FUND SOLUTIONS PLC
Notes to the Financial Statements for the financial year ended 31 December 2017 cont/d
USD USD USD USD USDSubscriptions Value 132,269,496 58,386,956 14,207,702 88,756,521 7,745,509Mergers Value 179,447,096 66,535,252 59,806,732 126,267,767 22,718,667Redemptions Value (115,580,247) (21,239,822) (14,125,929) (54,884,076) (5,030,272)
1db x-trackers MSCI World Financials Index UCITS ETF (DR) launched on 4 March 2016.
2db x-trackers MSCI World Energy Index UCITS ETF (DR) launched on 9 March 2016.
3db x-trackers MSCI World Consumer Staples Index UCITS ETF (DR) and db x-trackers MSCI World Information Technology Index UCITSETF (DR) launched on 9 March 2016.
EUR USD EURSubscriptions Value 24,457,804 5,156,301 5,075,732Redemptions Value - - -
1db x-trackers iBoxx EUR Corporates Yield Plus UCITS ETF (DR) launched on 7 June 2016.
2db x-trackers MSCI USA Minimum Volatility UCITS ETF (DR) and db x-trackers MSCI EMU Minimum Volatility UCITS ETF (DR) launchedon 8 November 2016.
CONCEPT FUND SOLUTIONS PLC
Notes to the Financial Statements for the financial year ended 31 December 2017 cont/d
579
10. Financial Instruments and Associated Risks
General Risk Management ProcessIn accordance with paragraph 34.23 of FRS 102, this note details the way in which the Company managesrisks associated with the use of financial instruments.
In pursuing their respective objectives, as set out in the Investment Managers' reports, the Funds hold anumber of financial instruments:
1. Fixed interest and equity securities. These are held in accordance with each Fund’s objectives.2. Cash, liquid resources and short term debtors and creditors that arise directly from the Funds’ operations.3. Derivative transactions.
Market RiskMarket risk is the risk that the fair value or future cash flows of a financial instrument will fluctuate because ofchanges in market price. It includes currency risk, interest rate risk and price risk. Market risk arises mainlyfrom uncertainty about future prices of the financial instruments held. It represents the potential loss the Fundsmight suffer through holding market positions in the face of price movements.
Although the Funds' exposure to market price volatility on bond holdings is hedged by the swaps entered into,the Funds are still exposed to price fluctuations in the underlying basket of indices on which the swap returnsare based. The makeup of the underlying holdings for each Fund is shown at the end of that Fund's Portfolioof Investments.
The sensitivity of the Funds to movements in market prices is incorporated in the VaR measurement for thePIANO 400 Fund (terminated on 18 August 2017) and db x-trackers EUR Liquid Corporate 12.5 UCITS ETF,the remainder of the Funds use the commitment approach.
In respect of the Funds using the commitment approach, based on the relative performance of the Funds ascompared to their benchmarks over the period from launch to 31 December 2017 and 31 December 2016,assuming that relative performance remained unchanged and with all other variables remaining constant, theimpact of a 10% increase in market prices at the period end on the Net Asset Values of the Funds would havebeen as follows:
CONCEPT FUND SOLUTIONS PLC
Notes to the Financial Statements for the financial year ended 31 December 2017 cont/d
580
10. Financial Instruments and Associated Risks cont/d
Market Risk cont/d
31 December 2017
FundMarket Price
IncreaseEstimated NAV
Increasedb x-trackers EUR Liquid Corporate 12.5 UCITS ETF 10.00% EUR 31,193,854db x-trackers Portfolio Income UCITS ETF1 10.00% EUR -db x-trackers MSCI Nordic Index UCITS ETF (DR) 10.00% EUR 26,844,344db x-trackers Mittelstand & MidCap Germany UCITS ETF (DR) 10.00% EUR 9,500,898db x-trackers MSCI North America High Dividend Yield Index UCITS ETF (DR) 10.00% USD 15,698,169db x-trackers MSCI AC World Index UCITS ETF (DR) 10.00% EUR 19,142,169db x-trackers MSCI AC Far East ex Japan Index UCITS ETF 10.00% EUR 2,416,349db x-trackers MSCI USA Index UCITS ETF (DR) 10.00% USD 411,901,973db x-trackers S&P 500® Equal Weight UCITS ETF (DR) 10.00% USD 57,861,276db x-trackers MSCI World Index UCITS ETF (DR) 10.00% USD 328,772,602db x-trackers FTSE Developed Europe ex UK Property UCITS ETF (DR) 10.00% EUR 3,700,239db x-trackers MSCI World Minimum Volatility UCITS ETF (DR) 10.00% USD 5,183,206db x-trackers MSCI World Momentum Factor UCITS ETF (DR) 10.00% USD 10,588,638db x-trackers MSCI World Quality Factor UCITS ETF (DR) 10.00% USD 10,117,518db x-trackers MSCI World Value Factor UCITS ETF (DR) 10.00% USD 20,270,066Deutsche MSCI World Index Fund 10.00% EUR 3,499,101db x-trackers MSCI GCC Select Index UCITS ETF 10.00% USD 3,120,974db x-trackers FTSE All-World ex UK UCITS ETF (DR) 10.00% GBP 2,883,295db x-trackers S&P 500 UCITS ETF (DR) 10.00% USD 138,988,781db x-trackers Russell 2000 UCITS ETF (DR) 10.00% USD 63,206,900db x-trackers Russell Midcap UCITS ETF (DR) 10.00% USD 14,390,990db x-trackers JPX-Nikkei 400 UCITS ETF (DR) 10.00% JPY 4,451,764,441db x-trackers FTSE 100 Equal Weight UCITS ETF (DR) 10.00% GBP 2,426,050db x-trackers USD Corporate Bond UCITS ETF (DR) 10.00% USD 92,057,594db x-trackers iBoxx Eurozone Sovereigns Quality Weighted UCITS ETF (DR) 10.00% EUR 1,470,442db x-trackers MSCI World Health Care Index UCITS ETF (DR) 10.00% USD 25,434,971db x-trackers MSCI World Financials Index UCITS ETF (DR) 10.00% USD 43,860,375db x-trackers MSCI World Energy Index UCITS ETF (DR) 10.00% USD 34,099,146db x-trackers MSCI World Consumer Staples Index UCITS ETF (DR) 10.00% USD 15,087,390db x-trackers MSCI World Information Technology Index UCITS ETF (DR) 10.00% USD 23,907,067db x-trackers MSCI World Industrials Index UCITS ETF (DR) 10.00% USD 4,026,835db x-trackers MSCI World Consumer Discretionary Index UCITS ETF (DR) 10.00% USD 18,143,227db x-trackers MSCI World Utilities Index UCITS ETF (DR) 10.00% USD 1,033,050db x-trackers MSCI World Telecom Services Index UCITS ETF (DR) 10.00% USD 6,156,013db x-trackers MSCI World Materials Index UCITS ETF (DR) 10.00% USD 2,098,919db x-trackers iBoxx USD Emerging Sovereigns Quality Weighted UCITS ETF (DR) 10.00% USD 9,283,588db x-trackers iBoxx EUR Corporates Yield Plus UCITS ETF (DR) 10.00% EUR 24,959,053db x-trackers MSCI USA Minimum Volatility UCITS ETF (DR) 10.00% USD 856,664db x-trackers MSCI EMU Minimum Volatility UCITS ETF (DR) 10.00% EUR 4,564,905db x-trackers MSCI Emerging Markets Index UCITS ETF (DR) 10.00% USD 79,241,816db x-trackers MSCI USA Consumer Discretionary Index UCITS ETF (DR) 10.00% USD 659,636db x-trackers MSCI USA Consumer Staples Index UCITS ETF (DR) 10.00% USD 489,561db x-trackers MSCI USA Energy Index UCITS ETF (DR) 10.00% USD 555,974db x-trackers MSCI USA Financials Index UCITS ETF (DR) 10.00% USD 14,432,967db x-trackers MSCI USA Health Care Index UCITS ETF (DR) 10.00% USD 557,939db x-trackers MSCI USA Information Technology Index UCITS ETF (DR) 10.00% USD 682,7131 The Fund does not track an Index.
CONCEPT FUND SOLUTIONS PLC
Notes to the Financial Statements for the financial year ended 31 December 2017 cont/d
581
10. Financial Instruments and Associated Risks cont/d
Market Risk cont/d
31 December 2016
FundMarket Price
IncreaseEstimated NAV
Increasedb x-trackers Portfolio Income UCITS ETF1 10% -db x-trackers Stiftungs-Stabilität UCITS ETF2 10% -db x-trackers MSCI Nordic Index UCITS ETF (DR) 10% EUR 19,141,555db x-trackers MSCI Turkey Index UCITS ETF (DR)2 10% -db x-trackers Mittelstand & MidCap Germany UCITS ETF (DR) 10% EUR 4,833,069db x-trackers MSCI North America High Dividend Yield Index UCITS ETF (DR) 10% USD 11,711,003db x-trackers MSCI AC World Index UCITS ETF (DR) 10% EUR 14,118,867db x-trackers MSCI AC Far East ex Japan Index UCITS ETF (DR) 10% EUR 2,066,056db x-trackers MSCI USA Index UCITS ETF (DR) 10% USD 190,503,821db x-trackers S&P 500® Equal Weight UCITS ETF (DR) 10% USD 42,938,376db x-trackers MSCI World Index UCITS ETF (DR) 10% USD 180,661,233db x-trackers FTSE Developed Europe ex UK Property UCITS ETF (DR) 10% EUR 8,579,894db x-trackers MSCI World Minimum Volatility UCITS ETF (DR) 10% USD 6,461,163db-x trackers MSCI World Momentum Factor UCITS ETF (DR) 10% USD 3,413,249db x-trackers MSCI World Quality Factor UCITS ETF (DR) 10% USD 4,328,841db x-trackers MSCI World Value Factor UCITS ETF (DR) 10% USD 16,791,915Deutsche MSCI World Index Fund 10% EUR 10,533,879db x-trackers MSCI GCC Select Index UCITS ETF 10% USD 5,015,559db x-trackers FTSE All-World ex UK UCITS ETF (DR) 10% GBP 3,402,461db x-trackers S&P 500 UCITS ETF (DR) 10% USD 57,520,423db x-trackers Russell 2000 UCITS ETF (DR) 10% USD 47,045,268db x-trackers Russell Midcap UCITS ETF (DR) 10% USD 12,856,719db x-trackers JPX-Nikkei 400 UCITS ETF (DR) 10% JPY 2,274,800,477db x-trackers FTSE 100 Equal Weight UCITS ETF (DR) 10% GBP 1,694,509db x-trackers USD Corporate Bond UCITS ETF (DR) 10% USD 71,868,756db x-trackers iBoxx Eurozone Sovereigns Quality Weighted UCITS ETF (DR) 10% EUR 1,677,715db x-trackers MSCI World Health Care Index UCITS ETF (DR) 10% USD 34,306,822db x-trackers MSCI World Financials Index UCITS ETF (DR) 10% USD 21,697,409db x-trackers MSCI World Energy Index UCITS ETF (DR) 10% USD 11,297,850db x-trackers MSCI World Consumer Staples Index UCITS ETF (DR) 10% USD 3,676,877db x-trackers MSCI World Information Technology Index UCITS ETF (DR) 10% USD 17,469,908db x-trackers MSCI World Industrials Index UCITS ETF (DR) 10% USD 2,708,035db x-trackers MSCI World Consumer Discretionary Index UCITS ETF (DR) 10% USD 12,278,811db x-trackers MSCI World Utilities Index UCITS ETF (DR) 10% USD 756,283db x-trackers MSCI World Telecom Services Index UCITS ETF (DR) 10% USD 2,774,761db x-trackers MSCI World Materials Index UCITS ETF (DR) 10% USD 1,140,356db x-trackers iBoxx USD Emerging Sovereigns Quality Weighted UCITS ETF (DR) 10% USD 5,239,318db x-trackers iBoxx EUR Corporates Yield Plus UCITS ETF (DR) 10% EUR 2,602,945db x-trackers MSCI USA Minimum Volatility UCITS ETF (DR) 10% EUR 522,946db x-trackers MSCI EMU Minimum Volatility UCITS ETF (DR) 10% EUR 530,1681 The Fund does not track an Index.2 db x-trackers Stiftungs-UCITS ETF Stabilität and db x-trackers MSCI Turkey Index UCITS ETF (DR) terminated on 27 June 2016.
A 10% decrease in market prices would have had a similar negative effect. The estimated sensitivities aboveare for illustrative purposes only and are not intended to be predictive. Actual fluctuations in response tomarket price changes may differ substantially from the above.
An analysis of price risk sensitivity for the PIANO 400 Fund and the db x-trackers EUR Liquid Corporate 12.5UCITS ETF are contained in the VaR Table further on in this note. The PIANO 400 Fund is not exposed to pricerisk as it had nil holdings at 31 December 2017.
(i) Currency RiskCurrency risk is the risk that the fair value or future cash flows of a financial instrument will fluctuate becauseof changes in foreign exchange rates. The Fund may invest in financial instruments and enter into transactionsin currencies other than its functional currency. Consequently, the Fund is exposed to risks that the exchangerate of its currency relative to other foreign currencies may change in a manner that has an adverse effect onthe value of that portion of the Fund’s assets or liabilities denominated in currencies other than the functionalcurrency.
CONCEPT FUND SOLUTIONS PLC
Notes to the Financial Statements for the financial year ended 31 December 2017 cont/d
582
10. Financial Instruments and Associated Risks cont/d
Market Risk cont/d
(i) Currency Risk cont/dThe Funds disclosed in the following tables had exposure to currencies other than their functional currency asat 31 December 2017. None of the other Funds had exposure to currencies other than their functional currencyas at 31 December 2017.
As at 31 December 2017
db x-trackers Portfolio Income UCITS ETFEquities
EUR
MonetaryAssets
EUR
MonetaryLiabilities
EUR
NetExposure
EURCurrencyUS Dollar 7,100,262 3,556 - 7,103,818Total 7,100,262 3,556 - 7,103,818
db x-trackers MSCI Nordic Index UCITS ETF (DR)Equities
As at 31 December 2017 and 31 December 2016, except for the above, no Funds had exposure to currenciesother than their functional currency. The following tables disclose the NAV impact on each Fund of a fluctuationin the exchange rates of +/-5% at 31 December 2017 and 31 December 2016.
(ii) Interest Rate RiskInterest rate risk is the risk that the present, fair value or future cash flows of a financial instrument will fluctuateas a result of a change in market interest rates.
As at 31 December 2017 and 31 December 2016 the db x-trackers EUR Liquid Corporate 12.5 UCITS ETF anddb x-trackers MSCI GCC Select Index UCITS ETF held total return swap positions which have no direct,material interest rate risk exposure. As at 31 December 2016 the PIANO 400 Fund (terminated on 18 August2017) held a fully funded swap position which has no direct, material interest rate risk exposure.
The following tables outline the interest rates of the Funds which hold bonds as at 31 December 2017 and31 December 2016:
31 December 2017
CouponFund Bond type Number of items Min Max
db x-trackers EUR Liquid Corporate 12.5 UCITS ETF Government 51 0.00% 0.00%
db x-trackers Barclays USD Corporate Bond UCITS ETF (DR) Corporate 1495 1.55% 9.46%
db x-trackers iBoxx Eurozone Sovereigns Quality Weighted UCITS ETF (DR) Government 296 0.00% 9.00%
db x-trackers iBoxx EUR Corporates Yield Plus UCITS ETF (DR) Corporate 796 0.25% 10.13%
For further information regarding the range and value of the Funds’ investments in interest bearing securities,refer to the respective Portfolios of Investment for each Fund. As at 31 December 2017 and 31 December2016, other than the Funds mentioned above, none of the other Funds held interest bearing securities. Cashholdings of the Funds are not subject to significant interest rate risk.
Liquidity RiskLiquidity risk is the risk that an entity will encounter difficulty in meeting obligations associated with financialliabilities. Liquidity risks arise when a particular security is difficult to dispose of. In principle, acquisitions forthe Fund must only consist of securities that can be sold again at any time.
Nevertheless, it may be difficult to sell particular securities at the required time during certain phases or inparticular exchange segments. There is also the risk that securities traded in a rather tight market segmentmay be subject to significant price volatility. Liquidity for the securities held in the db x-trackers EUR LiquidCorporate 12.5 UCITS ETF Fund and the db x-trackers MSCI GCC Select Index UCITS ETF is provided byDeutsche Bank AG and by HSBC Bank Plc respectively, who are the counterparty to these Funds.
As at 31 December 2017 all liabilities of the Funds as per the Statement of Financial Position are payablewithin one month with the exception of the below:db x-trackers EUR Liquid Corporate 12.5UCITS ETF
EUR <1 Month 1 - 3 Months3 Monthsto 1 Year
1 Year orgreater Total
Financial liabilities at fair value through profitor loss - - - (292,860,841) (292,860,841)Accrued and other payables (87,591) - - - (87,591)Redeemable Participating Shares (291,205,633) - - - (291,205,633)
(291,293,224) - - (292,860,841) (584,154,065)
db x-trackers MSCI Nordic Index UCITSETF (DR)
EUR <1 Month 1 - 3 Months3 Monthsto 1 Year
1 Year orgreater Total
Financial liabilities at fair value through profitor loss (4,520) - - - (4,520)Accrued and other payables (74,893) - - - (74,893)Redeemable Participating Shares (283,708,091) - - - (283,708,091)
(283,787,504) - - - (283,787,504)
db x-trackers Mittelstand & MidCapGermany UCITS ETF (DR)
EUR <1 Month 1 - 3 Months3 Monthsto 1 Year
1 Year orgreater Total
Financial liabilities at fair value through profitor loss - (180) - - (180)Accrued and other payables (31,731) - - - (31,731)Redeemable Participating Shares (94,952,106) - - - (94,952,106)
(94,983,837) (180) - - (94,984,017)
CONCEPT FUND SOLUTIONS PLC
Notes to the Financial Statements for the financial year ended 31 December 2017 cont/d
604
10. Financial Instruments and Associated Risks cont/d
Liquidity Risk cont/ddb x-trackers MSCI World Index UCITSETF (DR)
USD <1 Month 1 - 3 Months3 Monthsto 1 Year
1 Year orgreater Total
Financial liabilities at fair value through profitor loss (81,939) - - - (81,939)Accrued and other payables (674,709) - - - (674,709)Redeemable Participating Shares (3,305,500,771) - - - (3,305,500,771)
(3,306,257,419) - - - (3,306,257,419)
db x-trackers MSCI GCC Select IndexUCITS ETF
USD <1 Month 1 - 3 Months3 Monthsto 1 Year
1 Year orgreater Total
Financial liabilities at fair value through profitor loss - - - (24,276,906) (24,276,906)Accrued and other payables (21,075) - - - (21,075)Redeemable Participating Shares (23,887,709) - - - (23,887,709)
(23,908,784) - - (24,276,906) (48,185,690)
db x-trackers S&P 500 UCITS ETF (DR)
USD <1 Month 1 - 3 Months3 Monthsto 1 Year
1 Year orgreater Total
Financial liabilities at fair value through profitor loss (1,354,643) - - - (1,354,643)Accrued and other payables (1,187,344) - - - (1,187,344)Redeemable Participating Shares (1,400,101,557) - - - (1,400,101,557)
(1,402,643,544) - - - (1,402,643,544)
db x-trackers Russell 2000 UCITS ETF(DR)
USD <1 Month 1 - 3 Months3 Monthsto 1 Year
1 Year orgreater Total
Financial liabilities at fair value through profitor loss - (1,665) - - (1,665)Accrued and other payables (2,141,446) - - - (2,141,446)Redeemable Participating Shares (622,782,445) - - - (622,782,445)
(624,923,891) (1,665) - - (624,925,556)
db x-trackers USD Corporate Bond UCITSETF (DR)
USD <1 Month 1 - 3 Months3 Monthsto 1 Year
1 Year orgreater Total
Financial liabilities at fair value through profitor loss (378,147) - - - (378,147)Accrued and other payables (77,361,055) - - - (77,361,055)Redeemable Participating Shares (892,829,336) - - - (892,829,336)
(970,568,538) - - - (970,568,538)
db x-trackers MSCI World Energy IndexUCITS ETF (DR)
USD <1 Month 1 - 3 Months3 Monthsto 1 Year
1 Year orgreater Total
Financial liabilities at fair value through profitor loss (82) - - - (82)Accrued and other payables (5,972,099) - - - (5,972,099)Redeemable Participating Shares (350,740,857) - - - (350,740,857)
(356,713,038) - - - (356,713,038)
db x-trackers iBoxx USD EmergingSovereigns Quality Weighted UCITS ETF(DR)
USD <1 Month 1 - 3 Months3 Monthsto 1 Year
1 Year orgreater Total
Financial liabilities at fair value through profitor loss (34,792) - - - (34,792)Accrued and other payables (62,348) - - - (62,348)Redeemable Participating Shares (85,575,560) - - - (85,575,560)
(85,672,700) - - - (85,672,700)
CONCEPT FUND SOLUTIONS PLC
Notes to the Financial Statements for the financial year ended 31 December 2017 cont/d
605
10. Financial Instruments and Associated Risks cont/d
Financial liabilities at fair value through profitor loss - (170) - - (170)Accrued and other payables (21,024) - - - (21,024)Redeemable Participating Shares (46,681,117) - - - (46,681,117)
(46,702,141) (170) - - (46,702,311)
db x-trackers MSCI Emerging MarketsIndex UCITS ETF (DR)
USD <1 Month 1 - 3 Months3 Monthsto 1 Year
1 Year orgreater Total
Financial liabilities at fair value through profitor loss - (2,131) - - (2,131)Accrued and other payables (1,270,394) - - - (1,270,394)Redeemable Participating Shares (784,925,021) - - - (784,925,021)
(786,195,415) (2,131) - - (786,197,546)
As at 31 December 2016, all liabilities of the Funds, as per the Statement of Financial Position were payablewithin one month.db x-trackers MSCI Nordic Index UCITSETF (DR)
EUR <1 Month 1 - 3 Months3 Monthsto 1 Year
1 Year orgreater Total
Financial liabilities at fair value through profitor loss (1,777) - - - (1,777)Accrued and other payables (170,193) - - - (170,193)Redeemable Participating Shares (85,729,407) - - - (85,729,407)
(85,901,377) - - - (85,901,377)
db x-trackers MSCI North America HighDividend Yield Index UCITS ETF (DR)
USD <1 Month 1 - 3 Months3 Monthsto 1 Year
1 Year orgreater Total
Financial liabilities at fair value through profitor loss - (610) - - (610)Accrued and other payables (38,864) - - - (38,864)Redeemable Participating Shares (117,871,866) - - - (117,871,866)
(117,910,730) (610) - - (117,911,340)
db x-trackers MSCI AC World Index UCITSETF (DR)
EUR <1 Month 1 - 3 Months3 Monthsto 1 Year
1 Year orgreater Total
Financial liabilities at fair value through profitor loss - (2,588) - - (2,588)Accrued and other payables (117,922) - - - (117,922)Redeemable Participating Shares (137,712,717) - - - (137,712,717)
(137,830,639) (2,588) - - (137,833,227)
db x-trackers MSCI USA Index UCITS ETF(DR)
USD <1 Month 1 - 3 Months3 Monthsto 1 Year
1 Year orgreater Total
Financial liabilities at fair value through profitor loss - (33,393) - - (33,393)Accrued and other payables (60,014,190) - - - (60,014,190)Redeemable Participating Shares (1,951,345,829) - - - (1,951,345,829)
(2,011,360,019) (33,393) - - (2,011,393,412)
db x-trackers S&P 500® Equal WeightUCITS ETF (DR)
USD <1 Month 1 - 3 Months3 Monthsto 1 Year
1 Year orgreater Total
Financial liabilities at fair value through profitor loss - (4,970) - - (4,970)Accrued and other payables (89,118) - - - (89,118)Redeemable Participating Shares (430,318,889) - - - (430,318,889)
(430,408,007) (4,970) - - (430,412,977)
CONCEPT FUND SOLUTIONS PLC
Notes to the Financial Statements for the financial year ended 31 December 2017 cont/d
606
10. Financial Instruments and Associated Risks cont/d
Liquidity Risk cont/ddb x-trackers MSCI World Index UCITSETF (DR)
USD <1 Month 1 - 3 Months3 Monthsto 1 Year
1 Year orgreater Total
Financial liabilities at fair value through profitor loss - (31,793) - - (31,793)Accrued and other payables (444,588) - - - (444,588)Redeemable Participating Shares (1,831,782,261) - - - (1,831,782,261)
(1,832,226,849) (31,793) - - (1,832,258,642)
db x-trackers MSCI GCC Select IndexUCITS ETF
USD <1 Month 1 - 3 Months3 Monthsto 1 Year
1 Year orgreater Total
Financial liabilities at fair value through profitor loss - - - (48,520,569) (48,520,569)Accrued and other payables (25,916) - - - (25,916)Redeemable Participating Shares (47,005,833) - - - (47,005,833)
(47,031,749) - - (48,520,569) (95,552,318)
db x-trackers S&P 500 UCITS ETF (DR)
USD <1 Month 1 - 3 Months3 Monthsto 1 Year
1 Year orgreater Total
Financial liabilities at fair value through profitor loss (5,522,389) (11,388) - - (5,533,777)Accrued and other payables (4,236,787) - - - (4,236,787)Redeemable Participating Shares (576,920,943) - - - (576,920,943)
(586,680,119) (11,388) - - (586,691,507)
db x-trackers Russell 2000 UCITS ETF(DR)
USD <1 Month 1 - 3 Months3 Monthsto 1 Year
1 Year orgreater Total
Financial liabilities at fair value through profitor loss - (12,925) - - (12,925)Accrued and other payables (11,397,571) - - - (11,397,571)Redeemable Participating Shares (462,865,221) - - - (462,865,221)
(474,262,792) (12,925) - - (474,275,717)
db x-trackers Russell Midcap UCITS ETF(DR)
USD <1 Month 1 - 3 Months3 Monthsto 1 Year
1 Year orgreater Total
Financial liabilities at fair value through profitor loss - (3,798) - - (3,798)Accrued and other payables (37,372) - - - (37,372)Redeemable Participating Shares (126,324,449) - - - (126,324,449)
(126,361,821) (3,798) - - (126,365,619)
db x-trackers JPX-Nikkei 400 UCITS ETF(DR)
JPY <1 Month 1 - 3 Months3 Monthsto 1 Year
1 Year orgreater Total
Financial liabilities at fair value through profitor loss (4,767,402) - - - (4,767,402)Accrued and other payables (17,229,367) - - - (17,229,367)Redeemable Participating Shares (27,458,225,502) - - - (27,458,225,502)
(27,480,222,271) - - - (27,480,222,271)
db x-trackers USD Corporate Bond UCITSETF (DR)
USD <1 Month 1 - 3 Months3 Monthsto 1 Year
1 Year orgreater Total
Financial liabilities at fair value through profitor loss (1,395,356) (16,687) - - (1,412,043)Accrued and other payables (31,574,836) - - - (31,574,836)Redeemable Participating Shares (658,255,964) - - - (658,255,964)
(691,226,156) (16,687) - - (691,242,843)
Credit RiskCredit risk is the risk that a counterparty to a financial instrument will fail to discharge an obligation orcommitment that it has entered into with the Fund. The discretionary investment manager only buys and sellsinvestments through brokers which have been approved. These approved brokers are monitored to determine
CONCEPT FUND SOLUTIONS PLC
Notes to the Financial Statements for the financial year ended 31 December 2017 cont/d
607
10. Financial Instruments and Associated Risks cont/d
Credit Risk cont/dthat they remain acceptable counterparties. State Street is rated AA- (31 December 2016: AA-) and DeutscheBank AG is rated A- (31 December 2016: BBB+) by S&P. The brokers or counterparties to the derivativeinstruments held as at 31 December 2017 are noted on the individual Portfolio of Investments of the relevantfunds. The credit ratings associated with the bond holdings are disclosed on the individual Portfolio ofInvestments.
An amount of EUR Nil (31 December 2016: EUR Nil) has been deposited at State Street Bank and TrustCompany by Deutsche Bank AG as collateral against their counterparty exposure on the Funds as shownbelow. This collateral is held in the name of the Depositary and does not form part of the assets of the Funds.None of the other Funds had exposure to collateral against their counterparty as at 31 December 2017 and31 December 2016.
Certain Funds may lend securities through the security lending agent to brokers, dealers and other financialorganisations to earn additional income for further details in relation to credit risk associated with suchinvestments please refer to Note 14 Efficient Portfolio Management.
The total fair value of assets exposed to credit risk on each of the individual funds is as follows:
As at 31 December 2017
PIANO400 Fund1
db x-trackersEUR Liquid
Corporate12.5
UCITS ETF
db x-trackersPortfolio
IncomeUCITS ETF
db x-trackersMSCI NordicIndex UCITS
ETF (DR)EUR EUR EUR EUR
Broker/CounterpartyDeutsche Bank AG Frankfurt - - - 65,097Deutsche Bank AG London - 291,243,598 - -State Street Bank London - 49,533 16,059 54,281
- 291,293,131 16,059 119,378
1 PIANO 400 Fund terminated on 18 August 2017.
db x-trackersMittelstand &
MidCapGermany
UCITSETF (DR)
db x-trackersMSCI North
America HighDividend
YieldIndex UCITS
ETF (DR)
db x-trackersMSCI AC
WorldIndex UCITS
ETF (DR)
db x-trackersMSCI AC Far
East ex JapanIndex UCITS
ETF (DR)EUR USD EUR EUR
Broker/CounterpartyDeutsche Bank AG Frankfurt 43,775 111,529 305,351 25,795State Street Bank London 10,374 65,733 154,228 7,926
54,149 177,262 459,579 33,721
db x-trackersMSCI USA
Index UCITSETF (DR)
db x-trackersS&P 500®
Equal WeightUCITS
ETF (DR)
db x-trackersMSCI World
IndexUCITS
ETF (DR)
db x-trackersFTSE
DevelopedEurope ex UK
PropertyUCITS
ETF (DR)
db x-trackersMSCI World
MinimumVolatility
UCITSETF (DR)
USD USD USD EUR USDBroker/CounterpartyDeutsche Bank AG Frankfurt 3,402,484 632,516 2,826,294 - -HSBC Bank Plc - - 10,866 - -State Street Bank London 6,725,277 2,474,813 4,600,481 6,806 116,857
10,127,761 3,107,329 7,437,641 6,806 116,857
CONCEPT FUND SOLUTIONS PLC
Notes to the Financial Statements for the financial year ended 31 December 2017 cont/d
608
10. Financial Instruments and Associated Risks cont/d
Credit Risk cont/d
As at 31 December 2017 cont/d
db-x trackersMSCI WorldMomentum
Factor UCITSETF (DR)
db x-trackersMSCI World
Quality FactorUCITS ETF
(DR)
db x-trackersMSCI World
Value FactorUCITS ETF
(DR)
DeutscheMSCI WorldIndex Fund
db x-trackersMSCI GCC
Select IndexUCITS ETF
USD USD USD EUR USDBroker/CounterpartyDeutsche Bank AG Frankfurt - - 11,795 - -HSBC Bank Plc - - - - 23,908,783State Street Bank London 168,621 38,224 4,542 133,577 -
168,621 38,224 16,337 133,577 23,908,783
db x-trackersFTSE All-
World ex UKUCITS ETF
(DR)
db x-trackersS&P 500
UCITSETF (DR)
db x-trackersRussell 2000
UCITSETF (DR)
db x-trackersRussellMidcapUCITS
ETF (DR)
db x-trackersJPX-Nikkei
400UCITS
ETF (DR)GBP USD USD USD JPY
Broker/CounterpartyBarclays Bank Plc - 865,057 - - 12,774,181Deutsche Bank AG Frankfurt 33,367 937,165 1,032,730 197,330 66,562,853HSBC Bank Plc - - - - 268,992,528Merrill Lynch International - 2,889,170 - - -State Street Bank London 21,310 2,775,774 2,561,030 484,552 63,461,730
54,677 7,467,166 3,593,760 681,882 411,791,292
db x-trackersFTSE 100
Equal WeightUCITS
ETF (DR)
db x-trackersUSD
CorporateBond UCITS
ETF (DR)
db x-trackersiBoxx
EurozoneSovereigns
QualityWeighted
UCITSETF (DR)
db x-trackersMSCI WorldHealth Care
Index UCITSETF (DR)
db x-trackersMSCI World
FinancialsIndex UCITS
ETF (DR)GBP USD EUR USD USD
Broker/CounterpartyBarclays Bank Plc - 417,775 - - -Deutsche Bank AG Frankfurt 43,519 38,593 - - -HSBC Bank Plc - 1,174,250 - - -Merrill Lynch International - 715,178 - - -Morgan Stanley & Co International Plc - 9,486 - - -State Street Bank London - 3,532,925 57,434 686,658 64,564
43,519 5,888,207 57,434 686,658 64,564
db x-trackersMSCI World
Energy IndexUCITS
ETF (DR)
db x-trackersMSCI World
ConsumerStaples Index
UCITSETF (DR)
db x-trackersMSCI WorldInformationTechnology
Index UCITSETF (DR)
db x-trackersMSCI WorldIndustrials
Index UCITSETF (DR)
db x-trackersMSCI World
ConsumerDiscretionaryIndex UCITS
ETF (DR)USD USD USD USD USD
Broker/CounterpartyDeutsche Bank AG Frankfurt 32 - - - -State Street Bank London 3,240 45,463 487,014 4,368 6,153
3,272 45,463 487,014 4,368 6,153
CONCEPT FUND SOLUTIONS PLC
Notes to the Financial Statements for the financial year ended 31 December 2017 cont/d
609
10. Financial Instruments and Associated Risks cont/d
Credit Risk cont/d
As at 31 December 2017 cont/d
db x-trackersMSCI World
UtilitiesIndex UCITS
ETF (DR)
db x-trackersMSCI World
TelecomServices
Index UCITSETF (DR)
db x-trackersMSCI World
MaterialsIndex UCITS
ETF (DR)
db x-trackersiBoxx USDEmerging
SovereignsQuality
WeightedUCITS
ETF (DR)
db x-trackersiBoxx
EURCorporates
Yield PlusUCITS
ETF (DR)USD USD USD USD EUR
Broker/CounterpartyHSBC Bank Plc - - - 204,493 -Merrill Lynch International - - - 2,392 -State Street Bank London 2,828 20,105 4,742 279,133 1,429,594
2,828 20,105 4,742 486,018 1,429,594
db x-trackersMSCI USAMinimumVolatility
UCITS ETF(DR)
db x-trackersMSCI EMU
MinimumVolatility
UCITS ETF(DR)
db x-trackersMSCI
EmergingMarkets Index
UCITS ETF(DR)
db x-trackersMSCI USAConsumer
DiscretionaryIndex
UCITS ETF(DR)
db x-trackersMSCI USAConsumer
StaplesIndex UCITS
ETF (DR)USD EUR USD USD USD
Broker/CounterpartyDeutsche Bank AG Frankfurt - - 118,639 - -State Street Bank London 47,203 996 2,410,328 - -
47,203 996 2,528,967 - -
db x-trackersMSCI USA
Energy IndexUCITS ETF
(DR)
db x-trackersMSCI USAFinancials
IndexUCITS ETF
(DR)
db x-trackersMSCI USA
Health CareIndex UCITS
ETF (DR)
db x-trackersMSCI USA
InformationTechnology
IndexUCITS ETF
(DR)USD USD USD USD
Broker/CounterpartyDeutsche Bank AG Frankfurt - - - -State Street Bank London - - 24,843 3,812
- - 24,843 3,812
As at 31 December 2016
PIANO400 Fund
db x-trackersEUR Liquid
Corporate12.5
UCITS ETF
db x-trackersPortfolio
IncomeUCITS ETF
db x-trackersStiftungs-Stabilität
UCITS ETF1
db x-trackersMSCI NordicIndex UCITS
ETF (DR)EUR EUR EUR EUR EUR
Broker/CounterpartyDeutsche Bank AG Frankfurt 488,336,276 4,904,531 - - 49,376State Street Bank London 44 25,101 1,105 967 134,161
488,336,320 4,929,632 1,105 967 183,537
1db x-trackers Stiftungs-Stabilität UCITS ETF terminated on 27 June 2016.
CONCEPT FUND SOLUTIONS PLC
Notes to the Financial Statements for the financial year ended 31 December 2017 cont/d
610
10. Financial Instruments and Associated Risks cont/d
Credit Risk cont/d
As at 31 December 2016 cont/d
db x-trackersMSCI TurkeyIndex UCITS
ETF (DR)1
db x-trackersMittelstand &
MidCapGermany
UCITSETF (DR)
db x-trackersMSCI North
America HighDividend
YieldIndex UCITS
ETF (DR)
db x-trackersMSCI AC
WorldIndex UCITS
ETF (DR)
db x-trackersMSCI AC Far
East ex JapanIndex UCITS
ETF (DR)USD EUR USD EUR EUR
Broker/CounterpartyDeutsche Bank AG Frankfurt - 23,649 48,645 247,261 3,143State Street Bank London 179 39,804 57,668 202,716 69,773
179 63,453 106,313 449,977 72,916
1db x-trackers MSCI Turkey Index UCITS ETF (DR) terminated on 27 June 2016.
db x-trackersMSCI USA
Index UCITSETF (DR)
db x-trackersS&P 500®
Equal WeightUCITS
ETF (DR)
db x-trackersMSCI World
IndexUCITS
ETF (DR)
db x-trackersFTSE
DevelopedEurope ex UK
PropertyUCITS
ETF (DR)
db x-trackersMSCI World
MinimumVolatility
UCITSETF (DR)
USD USD USD EUR USDBroker/CounterpartyDeutsche Bank AG Frankfurt 1,554,847 303,446 1,466,319 - -State Street Bank London 3,994,703 587,160 3,533,338 9,878 1,921
5,549,550 890,606 4,999,657 9,878 1,921
db-x trackersMSCI WorldMomentum
Factor UCITSETF (DR)
db x-trackersMSCI World
Quality FactorUCITS ETF
(DR)
db x-trackersMSCI World
Value FactorUCITS ETF
(DR)
DeutscheMSCI WorldIndex Fund
db x-trackersMSCI GCC
Select IndexUCITS ETF
USD USD USD EUR USDBroker/CounterpartyHSBC - - - - 46,842,066State Street Bank London 13,494 7,943 4,756 393,587 189,683
13,494 7,943 4,756 393,587 47,031,749
db x-trackersFTSE All-
World ex UKUCITS ETF
(DR)
db x-trackersS&P 500
UCITSETF (DR)
db x-trackersRussell 2000
UCITSETF (DR)
db x-trackersRussellMidcapUCITS
ETF (DR)
db x-trackersJPX-Nikkei
400UCITS
ETF (DR)GBP USD USD USD JPY
Broker/Counterparty
Barclays Bank - 53,624 - - 275,005,045Deutsche Bank AG Frankfurt 34,049 315,691 750,330 108,603 36,085,039State Street Bank London 28,999 5,609,274 317,233 450,991 29,115,268
63,048 5,978,589 1,067,563 559,594 340,205,352
CONCEPT FUND SOLUTIONS PLC
Notes to the Financial Statements for the financial year ended 31 December 2017 cont/d
611
10. Financial Instruments and Associated Risks cont/d
Credit Risk cont/d
As at 31 December 2016 cont/d
db x-trackersFTSE 100
Equal WeightUCITS
ETF (DR)
db x-trackersUSD
CorporateBond UCITS
ETF (DR)
db x-trackersiBoxx
EurozoneSovereigns
QualityWeighted
UCITSETF (DR)
db x-trackersMSCI WorldHealth Care
Index UCITSETF (DR)1
db x-trackersMSCI World
FinancialsIndex UCITS
ETF (DR)1
GBP USD EUR USD USDBroker/Counterparty
Barclays Bank - 18,849 - - -Deutsche Bank AG Frankfurt 34,145 122,839 - - -State Street Bank London - 3,973,361 31,726 244,666 79,533
34,145 4,115,049 31,726 244,666 79,533
1db x-trackers MSCI World Health Care Index UCITS ETF (DR) and db x-trackers MSCI World Financials Index UCITS ETF (DR) launchedon 4 March 2016.
db x-trackersMSCI World
Energy IndexUCITS
ETF (DR)1
db x-trackersMSCI World
ConsumerStaples Index
UCITSETF (DR)
db x-trackersMSCI WorldInformationTechnology
Index UCITSETF (DR)1
db x-trackersMSCI WorldIndustrials
Index UCITSETF (DR)2
db x-trackersMSCI World
ConsumerDiscretionaryIndex UCITS
ETF (DR)2
USD USD USD USD USDBroker/CounterpartyDeutsche Bank AG Frankfurt 115,478 - - - -State Street Bank London - 46,641 10,770 13,242 38,016
115,478 46,641 10,770 13,242 38,016
1db x-trackers MSCI World Energy Index UCITS ETF (DR), db x-trackers MSCI World Information Technology Index UCITS ETF (DR) and dbx-trackers MSCI World Consumer Staples Index UCITS ETF (DR) launched on 9 March 2016.
2db x-trackers MSCI World Industrials Index UCITS ETF (DR) and db x-trackers MSCI World Consumer Discretionary Index UCITS ETF (DR)launched on 14 March 2016.
db x-trackersMSCI World
UtilitiesIndex UCITS
ETF (DR)1
db x-trackersMSCI World
TelecomServices
Index UCITSETF (DR)1
db x-trackersMSCI World
MaterialsIndex UCITS
ETF (DR)1
db x-trackersiBoxx USDEmerging
SovereignsQuality
WeightedUCITS
ETF (DR)2
db x-trackersiBoxx
EURCorporates
Yield PlusUCITS
ETF (DR)3
USD USD USD USD EURBroker/CounterpartyState Street Bank London 7,506 49,955 6,210 280,645 90,853
7,506 49,955 6,210 280,645 90,853
1db x-trackers MSCI World Materials Index UCITS ETF (DR), db x-trackers MSCI World Utilities Index UCITS ETF (DR) and db x-trackersMSCI World Telecom Services UCITS ETF (DR) launched on 16 March 2016.
2db x-trackers iBoxx USD Emerging Sovereigns Quality Weighted UCITS ETF (DR) launched on 4 April 2016.
3db x-trackers iBoxx EUR Corporates Yield Plus UCITS ETF (DR) launched on 7 June 2016.
The Funds’ Depositary is State Street Custodial Services (Ireland) Limited (the “Depositary”). The majority ofthe investments are held by the Depositary at the financial year ended 31 December 2017 and 31 December2016. Investments are segregated from the assets of the Depositary, with ownership rights remaining with theFunds. Bankruptcy or insolvency of the Depositary may cause the Funds' rights with respect to its investmentsheld by the Depositary to be delayed or limited. The maximum exposure to this risk is the amount of longinvestments (excluding derivatives) disclosed on the individual Portfolio of Investments of the relevant Funds.
CONCEPT FUND SOLUTIONS PLC
Notes to the Financial Statements for the financial year ended 31 December 2017 cont/d
612
10. Financial Instruments and Associated Risks cont/d
Structuring RiskStructuring risk relates to the Synthetic ETF funds only. The Funds track the performance of underlying assets(through the use of total return or funded swaps, as described in the portfolio of investments). The Funds arenot expected to track the relevant Underlying Asset with the same degree of accuracy as would an investmentvehicle that is entirely invested in every underlying security. However, it is intended that the difference betweenthe performance of the Shares of the Fund (before the Fund's fees and expenses) and the performance of theUnderlying Asset will not be substantial. It should be noted that exceptional circumstances may arise whichcause a Fund's tracking accuracy to be substantially different from the performance of the Underlying Asset;while the Directors and Investment Manager have made every effort to ensure the swaps are structured toachieve their tracking objectives there is a risk that these objectives will not be fully achieved.
Value at Risk (VaR)
Specific InstrumentsThe following Funds have invested in Portfolio Swap Transactions: db x-trackers MSCI GCC Select IndexUCITS ETF and db x-trackers EUR Liquid Corporate 12.5 UCITS ETF.
State Street Global Advisors Limited (“SSGA”), as the Sub-Investment Manager for the PIANO 400 Fund(terminated on 18 August 2017) and Deutsche International Corporate Services (Ireland) Limited, as theInvestment Manager for the remaining Funds, monitor, measure and manage the investment in and use offinancial derivative instruments (“FDIs”) by the Funds.
The controls and systems in place to manage derivative and associated risks are appropriate to theircomplexity and intended use. A Value at Risk methodology is used for the db x-trackers EUR Liquid Corporate12.5 UCITS ETF to measure global exposure in the portfolios and to measure the additional risk associatedwith the use of financial derivative instruments. The process for calculating and monitoring Value at Risk isundertaken by the Investment Manager for db x-trackers EUR Liquid Corporate 12.5 UCITS ETF. The followingFunds also held FDIs at 31 December 2017; db x-trackers JPX-Nikkei 400 UCITS ETF (DR), db x-trackersS&P 500 UCITS ETF (DR), db x-trackers MSCI Emerging Markets Index UCITS ETF (DR) and db x-trackersMSCI World Index UCITS ETF (DR) which all held forward foreign currency contracts and futures contracts;db x-trackers MSCI North America High Dividend Yield Index UCITS ETF (DR), db x-trackers MSCI USA IndexUCITS ETF (DR), db xtrackers S&P 500® Equal Weight UCITS ETF (DR), db x-trackers MSCI AC World IndexUCITS ETF (DR), db x-trackers Russell 2000 UCITS ETF (DR), db x-trackers MSCI Nordic Index UCITS ETF(DR), db x-trackers Mittelstand & MidCap Germany UCITS ETF (DR), db x-trackers FTSE All-World ex UKUCITS ETF (DR), db x-trackers FTSE 100 Equal Weight UCITS ETF (DR), db x-trackers MSCI World EnergyIndex UCITS ETF (DR), db x-trackers MSCI EMU Minimum Volatility UCITS ETF (DR) and db x-trackersRussell Midcap UCITS ETF (DR) which all held futures contracts; db x-trackers MSCI World Energy IndexUCITS ETF (DR), db x-trackers iBoxx USD Emerging Sovereigns Quality Weighted UCITS ETF (DR) and dbx-trackers USD Corporate Bond UCITS ETF (DR) which all held forward foreign currency contracts. The Fundsuse the commitment approach to measure global exposure on the portfolios. The process for calculating andmonitoring the commitment approach for these Funds is undertaken by the Sub-Investment Manager. Theremaining Funds did not hold FDIs at 31 December 2017.
The systems used to monitor and measure derivative exposure are analytical tools such as Citigroup YieldBook and proprietary databases as well as spreadsheet applications used in conjunction with industrystandard information and pricing sources such as Bloomberg and Reuters to value and monitor Derivativepositions and ensure compliance with pre-defined hedging and investment parameters.
The Investment Manager uses systems and analytical tools to monitor and measure derivative exposure suchas Bloomberg Professional, Paladyne and proprietary databases as well as spreadsheet applications used inconjunction with industry standard information and pricing sources such as Bloomberg and Reuters to valueand monitor derivative positions and ensure compliance with pre-defined hedging and investment parameters.In respect of the Funds for which the Sub-Investment Manager is the risk monitor, it uses systems such asCharles River and software by RiskMetrics to calculate reports on market risk, position feeds from Risk DataMart or ("RDM") as well as spreadsheet applications used in conjunction with industry standard informationand pricing sources such as Bloomberg and Reuters to value and monitor derivative positions and ensurecompliance with pre-defined hedging and investment parameters. SSGA will use systems and analytical toolsto monitor and measure derivative exposure, such as Citigroup Yield Book and proprietary databases, as well
CONCEPT FUND SOLUTIONS PLC
Notes to the Financial Statements for the financial year ended 31 December 2017 cont/d
613
10. Financial Instruments and Associated Risks cont/d
Specific Instruments cont/das spreadsheet applications used in conjunction with industry standard information and pricing sources suchas Bloomberg and Reuters to value and monitor derivative positions and ensure compliance with pre-definedhedging and investment parameters. The criteria used for assessing these systems are that they should allowrisk monitoring of FDIs on a standalone basis but more significantly allow integration of derivative positionswithin the overall Funds’ investment portfolios to provide a comprehensive monitoring of any breaches of theinvestment guidelines by combining direct and indirect holdings through derivatives.
The relevant risk monitor endeavours to ensure that appropriate controls are implemented and evidenced asbeing operative at all stages of the investment process, execution controls in the form of investment guidelinesdocumenting Fund mandate(s), investment restrictions laid down by the UCITS Regulations, compliance andaudit will, by undertaking periodic reviews, provide additional comfort independent of the fund managementfunction that adequate controls are in place, daily reports generated by operations teams that highlight allfinancial derivative exposures and cover within given portfolios and portfolio analysts checking designatedaccounts to ensure that derivative prices, data sets, interest rates and foreign exchange rates feed into theapproved derivative exposure and measurement and assessment models are accurate.
OTC derivatives such as swaps and forward foreign currency contracts are governed by internationallyrecognised master agreements, such as the International Swaps and Derivatives Association (“ISDA”) MasterAgreement. Swap confirmations are tracked and checked to confirm the terms of the trades are fully andcorrectly documented. The Investment Manager or any delegate investment managers use attorneys whohave significant expertise in derivatives use and documentation.
Fund RisksRisk can be separated into the following components: market risk, credit risk and liquidity risk. Each type of riskis discussed in turn and qualitative and quantitative analyses are provided where relevant to give the readeran understanding of the risk management methods used by the Investment Manager and the Board ofDirectors.
Swap AgreementsSome of the Funds aim to achieve their investment objectives by gaining exposure to the relevant UnderlyingAssets through the use of swaps. The return of the Fund (after fees and expenses) will reflect the performanceof the derivative contracts. A swap involves the exchange by the Fund with another party of their respectivecommitments to pay or receive cash flows, e.g. an exchange of coupon payments for the return on a particularindex or basket of indices.
An analysis of the swap agreements held at financial year end is contained in each Fund’s Schedule ofInvestments. Investments held at financial year end are representative of the type of investments held duringthe financial year.
The risk exposure of the PIANO 400 Fund (terminated on 18 August 2017) and the db x-trackers EUR LiquidCorporate 12.5 UCITS ETF are measured using the Value at Risk (“VaR”) methodology. None of the otherFunds use VaR. In order to measure the leverage effect, a VaR calculation using either the Relative or AbsoluteVaR measures will be undertaken, dependant on whether the Fund in question is managed against a specificbenchmark. In calculating the VaR the following parameters were used:
• A confidence level of 99%;• A holding period of 1 month;• An historical observation period of 3 years for the PIANO 400 Fund (terminated on 18 August 2017) and 186
days for the db x-trackers EUR Liquid Corporate 12.5 UCITS ETF; and• The absolute VaR will not be greater than 20% of the Net Asset Value (10% in respect of the PIANO 400 Fund).• At the financial year end the leverage for the db x-trackers EUR Liquid Corporate 12.5 UCITS ETF 339.67%
(31 December 2016: 322.97%), the average leverage was 344.88% (31 December 2016: 352.51%) with thehighest level during the financial year being 358.68% (31 December 2016: 571.56%). PIANO 400 Fundterminated on 18 August 2017 (at the financial year ended 31 December 2016 the leverage for the PIANO 400Fund was 102.57%, the average leverage was 101.10% with the highest level during the financial year being102.57%).
CONCEPT FUND SOLUTIONS PLC
Notes to the Financial Statements for the financial year ended 31 December 2017 cont/d
614
10. Financial Instruments and Associated Risks cont/d
Swap Agreements cont/dThe risk model is based on a historical simulation approach. The risk metrics will be highly dependent on thehistorical period used in the estimation and how representative this is of potential future risk.
Stress TestingIndependent of the VaR calculation, appropriate stress scenarios are applied to measure any potential majordepreciation of the UCITS value as a result of unexpected changes in the risk factors. At a minimum, stresstests are completed quarterly.
Back TestingActual periodic changes in the value of the portfolio are used to test the VaR model. Frequency of excessesover VaR will be measured against the confidence level. If the frequency of excesses is larger than that impliedby the confidence level, subject to some tolerance, then appropriate action will be taken.
The table below indicates the relative VaR for the Funds as at 31 December 2017:
Holding
Period Mean Maximum Minimum Std. Dev. Confidence Fund VaR Index VaRdb x-trackers EUR LiquidCorporate 12.5 UCITS ETF 1 month 30.02% 31.72% 27.42% 1.16% 99.00% 5.51% n/a
The table below indicates the relative VaR for the Funds as at 31 December 2016:
Holding
Period Mean Maximum Minimum Std. Dev. Confidence Fund VaR Index VaRPIANO 400 Fund 1 month (2.22)% (1.32)% (3.37)% 0.55% (2.67)% (2.67)% (2.67)%db x-trackers EUR LiquidCorporate 12.5 UCITS ETF 1 month 37.84% 48.47% 28.31% 7.51% 99.00% 6.01% n/a
Fair valuation hierarchyFRS 102 Section 11.27 on "Fair Value: Disclosure" requires disclosure relating to the fair value hierarchy inwhich fair value measurements are categorised for assets and liabilities. The disclosures are based on athree-level fair value hierarchy for the inputs used in valuation techniques to measure fair value.
The Company classifies fair value measurements using a fair value hierarchy that reflects the significance ofthe inputs used in making the measurements, using a quantitative and qualitative analysis of thoseinstruments recognised at fair value based on a three-level measurement hierarchy.
The fair value hierarchy has the following levels as defined under FRS 102 Section 34.22:
Level 1: The unadjusted quoted price in an active market for identical assets or liabilities that the entity canaccess at the measurement date.Level 2: Inputs other than quoted prices included within Level 1 that are observable (i.e. developed usingmarket data) for the asset or liability, either directly or indirectly.Level 3: Inputs are unobservable (i.e. for which market data is unavailable) for the asset or liability.
Furthermore, for those instruments which have significant unobservable inputs (Level 3), the Companydiscloses the transfers into and out of Level 3, a reconciliation of the opening and closing balances, total gainsand losses for the period/year split between those recognised in the Statement of Comprehensive Income andrecognised through the statement of total recognised gains and losses, purchases, sales issues andsettlements, and a sensitivity analysis of assumptions used in determining the fair value of Level 3 positions.
The level in the fair value hierarchy within which the fair value measurement was categorised in its entirety wasdetermined on the basis of the lowest level input that was significant to the fair value measurement in itsentirety. For this purpose, the significance of an input was assessed against the fair value measurement in itsentirety. If a fair value measurement used observable inputs that required significant adjustment based onunobservable inputs, that measurement was a Level 3 measurement. Assessing the significance of aparticular input to the fair value measurement in its entirety required judgement, considering factors specificto the asset or liability. The determination of what constituted “observable” required significant judgement bythe Investment Manager.
CONCEPT FUND SOLUTIONS PLC
Notes to the Financial Statements for the financial year ended 31 December 2017 cont/d
615
10. Financial Instruments and Associated Risks cont/d
Fair valuation hierarchy cont/dThe Investment Manager considered observable data to be that market data that was readily available,regularly distributed or updated, reliable and verifiable, not proprietary, and provided by independent sourcesthat are actively involved in the relevant market.
The following tables are a summary of the fair value hierarchy applied under FRS 102 in valuing theCompany’s financial assets and financial liabilities measured at fair value through profit or loss as at31 December 2017:
Level 1 Level 2 Level 3 Total
db x-trackers EUR Liquid Corporate 12.5 UCITS ETF31 December
201731 December
201731 December
201731 December
2017EUR EUR EUR EUR
Financial assets at fair value through profit or lossGovernment Bonds - 292,860,934 - 292,860,934Total Return Swaps - 291,243,598 - 291,243,598
Total financial assets - 584,104,532 - 584,104,532
Financial liabilities at fair value through profit or lossTotal Return Swaps - (292,860,841) - (292,860,841)
Total financial liabilities - (292,860,841) - (292,860,841)
Level 1 Level 2 Level 3 Total
db x-trackers Portfolio Income UCITS ETF31 December
201731 December
201731 December
201731 December
2017EUR EUR EUR EUR
Financial assets at fair value through profit or lossExchange Traded Funds 29,513,420 - - 29,513,420
Total financial assets 29,513,420 - - 29,513,420
Level 1 Level 2 Level 3 Total
db x-trackers MSCI Nordic Index UCITS ETF (DR)31 December
201731 December
201731 December
201731 December
2017EUR EUR EUR EUR
Financial assets at fair value through profit or lossEquities 283,454,922 - - 283,454,922
Total financial assets 283,454,922 - - 283,454,922
Financial liabilities at fair value through profit or lossFutures (4,520) - - (4,520)
Total financial liabilities (4,520) - - (4,520)
Level 1 Level 2 Level 3 Total
db x-trackers Mittelstand & MidCap Germany UCITS ETF (DR)31 December
201731 December
201731 December
201731 December
2017EUR EUR EUR EUR
Financial assets at fair value through profit or lossEquities 87,970,005 - - 87,970,005Preferred Stocks 6,849,734 - - 6,849,734
Total financial assets 94,819,739 - - 94,819,739
Financial liabilities at fair value through profit or lossFutures (180) - - (180)
Total financial liabilities (180) - - (180)
Level 1 Level 2 Level 3 Totaldb x-trackers MSCI North America High Dividend Yield IndexUCITS ETF (DR)
31 December2017
31 December2017
31 December2017
31 December2017
USD USD USD USDFinancial assets at fair value through profit or lossEquities 157,289,402 - - 157,289,402Futures 3,385 - - 3,385
Total financial assets 157,292,787 - - 157,292,787
CONCEPT FUND SOLUTIONS PLC
Notes to the Financial Statements for the financial year ended 31 December 2017 cont/d
616
10. Financial Instruments and Associated Risks cont/d
Fair valuation hierarchy cont/d
Level 1 Level 2 Level 3 Total
db x-trackers MSCI AC World Index UCITS ETF (DR)31 December
201731 December
201731 December
201731 December
2017EUR EUR EUR EUR
Financial assets at fair value through profit or lossEquities 186,987,058 - - 186,987,058Preferred Stocks 991,384 - - 991,384Rights 2,766 - - 2,766Futures 4,075 - - 4,075
Total financial assets 187,985,283 - - 187,985,283
Financial liabilities at fair value through profit or lossEquities 36,793 - 800 37,593
Total financial liabilities 36,793 - 800 37,593
Level 1 Level 2 Level 3 Totaldb x-trackers MSCI AC Far East ex Japan Index UCITS ETF(DR)
31 December2017
31 December2017
31 December2017
31 December2017
EUR EUR EUR EURFinancial assets at fair value through profit or lossEquities 23,266,806 - - 23,266,806Preferred Stocks 248,127 - - 248,127
Total financial assets 23,514,933 - - 23,514,933
Level 1 Level 2 Level 3 Total
db x-trackers MSCI USA Index UCITS ETF (DR)31 December
201731 December
201731 December
201731 December
2017USD USD USD USD
Financial assets at fair value through profit or lossEquities 4,152,962,024 - - 4,152,962,024Exchange Traded Funds 6,958,181 - - 6,958,181Futures 102,570 - - 102,570
Total financial assets 4,160,022,775 - - 4,160,022,775
Level 1 Level 2 Level 3 Total
db x-trackers S&P 500® Equal Weight UCITS ETF (DR)31 December
201731 December
201731 December
201731 December
2017USD USD USD USD
Financial assets at fair value through profit or lossEquities 575,429,675 - - 575,429,675Futures 29,630 - - 29,630
Total financial assets 575,459,305 - - 575,459,305
Level 1 Level 2 Level 3 Total
db x-trackers MSCI World Index UCITS ETF (DR)31 December
201731 December
201731 December
201731 December
2017USD USD USD USD
Financial assets at fair value through profit or lossEquities 3,280,050,989 - - 3,280,050,989Exchange Traded Funds 6,958,181 - - 6,958,181Preferred Stocks 7,863,467 - - 7,863,467Rights 50,149 - - 50,149Futures 87,873 - - 87,873Forward Currency Contracts - 10,866 - 10,866
Total financial assets 3,295,010,659 10,866 - 3,295,021,525
Financial liabilities at fair value through profit or lossEquities - - 6,172 6,172
Total financial liabilities - - 6,172 6,172
Financial liabilities at fair value through profit or lossForward Currency Contracts - (81,939) - (81,939)
Total financial liabilities - (81,939) - (81,939)
CONCEPT FUND SOLUTIONS PLC
Notes to the Financial Statements for the financial year ended 31 December 2017 cont/d
617
10. Financial Instruments and Associated Risks cont/d
Fair valuation hierarchy cont/d
Level 1 Level 2 Level 3 Totaldb x-trackers FTSE Developed Europe ex UK Property UCITSETF (DR)
31 December2017
31 December2017
31 December2017
31 December2017
EUR EUR EUR EURFinancial assets at fair value through profit or lossEquities 38,036,242 - - 38,036,242
Total financial assets 38,036,242 - - 38,036,242
Level 1 Level 2 Level 3 Total
db x-trackers MSCI World Minimum Volatility UCITS ETF (DR)31 December
201731 December
201731 December
201731 December
2017USD USD USD USD
Financial assets at fair value through profit or lossEquities 51,494,092 - - 51,494,092
Total financial assets 51,494,092 - - 51,494,092
Level 1 Level 2 Level 3 Total
db-x trackers MSCI World Momentum Factor UCITS ETF (DR)31 December
201731 December
201731 December
201731 December
2017USD USD USD USD
Financial assets at fair value through profit or lossEquities 105,258,034 - - 105,258,034
Total financial assets 105,258,034 - - 105,258,034
Financial liabilities at fair value through profit or lossEquities - - 255 255
Total financial liabilities - - 255 255
Level 1 Level 2 Level 3 Total
db x-trackers MSCI World Quality Factor UCITS ETF (DR)31 December
201731 December
201731 December
201731 December
2017USD USD USD USD
Financial assets at fair value through profit or lossEquities 100,845,066 - - 100,845,066Preferred Stocks 44,793 - - 44,793
Total financial assets 100,889,859 - - 100,889,859
Level 1 Level 2 Level 3 Total
db x-trackers MSCI World Value Factor UCITS ETF (DR)31 December
201731 December
201731 December
201731 December
2017USD USD USD USD
Financial assets at fair value through profit or lossEquities 200,977,172 - - 200,977,172Preferred Stocks 2,166,071 - - 2,166,071Rights 14,097 - - 14,097
Total financial assets 203,157,340 - - 203,157,340
Financial liabilities at fair value through profit or lossEquities - - 1,995 1,995
Total financial liabilities - - 1,995 1,995
CONCEPT FUND SOLUTIONS PLC
Notes to the Financial Statements for the financial year ended 31 December 2017 cont/d
618
10. Financial Instruments and Associated Risks cont/d
Fair valuation hierarchy cont/d
Level 1 Level 2 Level 3 Total
Deutsche MSCI World Index Fund31 December
201731 December
201731 December
201731 December
2017EUR EUR EUR EUR
Financial assets at fair value through profit or lossEquities 33,521,904 - - 33,521,904Preferred Stocks 70,028 - - 70,028Rights 162 - - 162
Total financial assets 33,592,094 - - 33,592,094
Financial liabilities at fair value through profit or lossEquities - - 770 770
Total financial liabilities - - 770 770
Level 1 Level 2 Level 3 Total
db x-trackers MSCI GCC Select Index UCITS ETF31 December
201731 December
201731 December
201731 December
2017USD USD USD USD
Financial assets at fair value through profit or lossEquities 22,263,501 - - 22,263,501Preferred Stocks 2,013,406 - - 2,013,406Total Return Swaps - 23,908,783 - 23,908,783
Total financial assets 24,276,907 23,908,783 - 48,185,690
Financial liabilities at fair value through profit or lossTotal Return Swaps - (24,276,906) - (24,276,906)
Total financial liabilities - (24,276,906) - (24,276,906)
Level 1 Level 2 Level 3 Total
db x-trackers FTSE All-World ex UK UCITS ETF (DR)31 December
201731 December
201731 December
201731 December
2017GBP GBP GBP GBP
Financial assets at fair value through profit or lossEquities 28,416,398 - - 28,416,398Preferred Stocks 175,519 - - 175,519Rights 382 - - 382Futures 425 - - 425
Total financial assets 28,592,724 - - 28,592,724
Financial liabilities at fair value through profit or lossEquities 10,760 - - 10,760
Total financial liabilities 10,760 - - 10,760
Level 1 Level 2 Level 3 Total
db x-trackers S&P 500 UCITS ETF (DR)31 December
201731 December
201731 December
201731 December
2017USD USD USD USD
Financial assets at fair value through profit or lossEquities 1,393,257,226 - - 1,393,257,226Futures 28,980 - - 28,980Forward Currency Contracts - 3,754,227 - 3,754,227
Total financial assets 1,393,286,206 3,754,227 - 1,397,040,433
Financial liabilities at fair value through profit or lossForward Currency Contracts - (1,354,643) - (1,354,643)
Total financial liabilities - (1,354,643) - (1,354,643)
CONCEPT FUND SOLUTIONS PLC
Notes to the Financial Statements for the financial year ended 31 December 2017 cont/d
619
10. Financial Instruments and Associated Risks cont/d
Fair valuation hierarchy cont/d
Level 1 Level 2 Level 3 Total
db x-trackers Russell 2000 UCITS ETF (DR)31 December
201731 December
201731 December
201731 December
2017USD USD USD USD
Financial assets at fair value through profit or lossEquities 620,477,311 - 213,430 620,690,741
Total financial assets 620,477,311 - 213,430 620,690,741
Financial liabilities at fair value through profit or lossFutures (1,665) - - (1,665)
Total financial liabilities (1,665) - - (1,665)
Level 1 Level 2 Level 3 Total
db x-trackers Russell Midcap UCITS ETF (DR)31 December
201731 December
201731 December
201731 December
2017USD USD USD USD
Financial assets at fair value through profit or lossEquities 141,670,779 - - 141,670,779Futures 5,078 - - 5,078
Total financial assets 141,675,857 - - 141,675,857
Level 1 Level 2 Level 3 Total
db x-trackers JPX-Nikkei 400 UCITS ETF (DR)31 December
201731 December
201731 December
201731 December
2017JPY JPY JPY JPY
Financial assets at fair value through profit or lossEquities 43,161,290,742 - - 43,161,290,742Futures 1,962,000 - - 1,962,000Forward Currency Contracts - 281,766,709 - 281,766,709
Total financial assets 43,163,252,742 281,766,709 - 43,445,019,451
Level 1 Level 2 Level 3 Total
db x-trackers FTSE 100 Equal Weight UCITS ETF (DR)31 December
201731 December
201731 December
201731 December
2017GBP GBP GBP GBP
Financial assets at fair value through profit or lossEquities 23,246,102 - - 23,246,102Exchange Traded Funds 224,347 - - 224,347Futures 3,470 - - 3,470
Total financial assets 23,473,919 - - 23,473,919
Level 1 Level 2 Level 3 Total
db x-trackers USD Corporate Bond UCITS ETF (DR)31 December
201731 December
201731 December
201731 December
2017USD USD USD USD
Financial assets at fair value through profit or lossCorporate Bonds - 879,327,240 - 879,327,240Forward Currency Contracts - 2,316,689 - 2,316,689
Total financial assets - 881,643,929 - 881,643,929
Financial liabilities at fair value through profit or lossForward Currency Contracts - (378,147) - (378,147)
Total financial liabilities - (378,147) - (378,147)
USD USD USD USDFinancial assets at fair value through profit or lossCorporate Bonds - 4,589,485 - 4,589,485Government Bonds - 79,386,443 - 79,386,443Forward Currency Contracts - 206,885 - 206,885
Total financial assets - 84,182,813 - 84,182,813
Financial liabilities at fair value through profit or lossForward Currency Contracts - (34,792) - (34,792)
Total financial liabilities - (34,792) - (34,792)
Level 1 Level 2 Level 3 Total
db x-trackers iBoxx EUR Corporates Yield Plus UCITS ETF (DR)31 December
201731 December
201731 December
201731 December
2017EUR EUR EUR EUR
Financial assets at fair value through profit or lossCorporate Bonds - 230,099,275 - 230,099,275
Total financial assets - 230,099,275 - 230,099,275
CONCEPT FUND SOLUTIONS PLC
Notes to the Financial Statements for the financial year ended 31 December 2017 cont/d
622
10. Financial Instruments and Associated Risks cont/d
Fair valuation hierarchy cont/d
Level 1 Level 2 Level 3 Total
db x-trackers MSCI USA Minimum Volatility UCITS ETF (DR)31 December
201731 December
201731 December
201731 December
2017USD USD USD USD
Financial assets at fair value through profit or lossEquities 8,551,676 - - 8,551,676
Total financial assets 8,551,676 - - 8,551,676
Level 1 Level 2 Level 3 Total
db x-trackers MSCI EMU Minimum Volatility UCITS ETF (DR)31 December
201731 December
201731 December
201731 December
2017EUR EUR EUR EUR
Financial assets at fair value through profit or lossEquities 45,981,800 - - 45,981,800Preferred Stocks 667,873 - - 667,873
Total financial assets 46,649,673 - - 46,649,673
Financial liabilities at fair value through profit or lossFutures (170) - - (170)
Total financial liabilities (170) - - (170)
Level 1 Level 2 Level 3 Total
db x-trackers MSCI Emerging Markets Index UCITS ETF (DR)31 December
201731 December
201731 December
201731 December
2017USD USD USD USD
Financial assets at fair value through profit or lossEquities 720,610,657 - - 720,610,657Exchange Traded Funds 32,780,171 - - 32,780,171Preferred Stocks 27,622,959 - - 27,622,959Futures 80,075 - - 80,075
Total financial assets 781,093,862 - - 781,093,862
Financial liabilities at fair value through profit or lossEquities 1,214,997 - - 1,214,997
Total financial liabilities 1,214,997 - - 1,214,997
Financial liabilities at fair value through profit or lossForward Currency Contracts - (2,131) - (2,131)
Total financial liabilities - (2,131) - (2,131)
Level 1 Level 2 Level 3 Totaldb x-trackers MSCI USA Consumer Discretionary Index UCITSETF (DR)
31 December2017
31 December2017
31 December2017
31 December2017
USD USD USD USDFinancial assets at fair value through profit or lossEquities 6,612,210 - - 6,612,210
Total financial assets 6,612,210 - - 6,612,210
Level 1 Level 2 Level 3 Totaldb x-trackers MSCI USA Consumer Staples Index UCITS ETF(DR)
31 December2017
31 December2017
31 December2017
31 December2017
USD USD USD USDFinancial assets at fair value through profit or lossEquities 5,042,238 - - 5,042,238
Total financial assets 5,042,238 - - 5,042,238
CONCEPT FUND SOLUTIONS PLC
Notes to the Financial Statements for the financial year ended 31 December 2017 cont/d
623
10. Financial Instruments and Associated Risks cont/d
Fair valuation hierarchy cont/d
Level 1 Level 2 Level 3 Total
db x-trackers MSCI USA Energy Index UCITS ETF (DR)31 December
201731 December
201731 December
201731 December
2017USD USD USD USD
Financial assets at fair value through profit or lossEquities 5,588,079 - - 5,588,079
Total financial assets 5,588,079 - - 5,588,079
Level 1 Level 2 Level 3 Total
db x-trackers MSCI USA Financials Index UCITS ETF (DR)31 December
201731 December
201731 December
201731 December
2017USD USD USD USD
Financial assets at fair value through profit or lossEquities 144,742,759 - - 144,742,759
Total financial assets 144,742,759 - - 144,742,759
Level 1 Level 2 Level 3 Total
db x-trackers MSCI USA Health Care Index UCITS ETF (DR)31 December
201731 December
201731 December
201731 December
2017USD USD USD USD
Financial assets at fair value through profit or lossEquities 4,882,845 - - 4,882,845
Total financial assets 4,882,845 - - 4,882,845
Level 1 Level 2 Level 3 Totaldb x-trackers MSCI USA Information Technology Index UCITSETF (DR)
31 December2017
31 December2017
31 December2017
31 December2017
USD USD USD USDFinancial assets at fair value through profit or lossEquities 6,832,697 - - 6,832,697
Total financial assets 6,832,697 - - 6,832,697
The following tables are summary of the fair value hierarchy applied under FRS 102 in valuing the Company’sfinancial assets and liabilities measured as at 31 December 2016:
Level 1 Level 2 Level 3 Total
PIANO 400 Fund31 December
201631 December
201631 December
201631 December
2016EUR EUR EUR EUR
Financial assets at fair value through profit or lossFunded Swaps - 488,336,276 - 488,336,276
Total financial assets - 488,336,276 - 488,336,276
Level 1 Level 2 Level 3 Total
db x-trackers EUR Liquid Corporate 12.5 UCITS ETF31 December
201631 December
201631 December
201631 December
2016EUR EUR EUR EUR
Financial assets at fair value through profit or lossGovernment Bonds - 357,440,917 - 357,440,917Total Return Swaps - 4,904,531 - 4,904,531
Total financial assets - 362,345,448 - 362,345,448
Level 1 Level 2 Level 3 Total
db x-trackers Portfolio Income UCITS ETF31 December
201631 December
201631 December
201631 December
2016EUR EUR EUR EUR
Financial assets at fair value through profit or lossExchange Traded Funds 23,314,940 - - 23,314,940
Total financial assets 23,314,940 - - 23,314,940
CONCEPT FUND SOLUTIONS PLC
Notes to the Financial Statements for the financial year ended 31 December 2017 cont/d
624
10. Financial Instruments and Associated Risks cont/d
Fair valuation hierarchy cont/d
Level 1 Level 2 Level 3 Total
db x-trackers MSCI Nordic Index UCITS ETF (DR)31 December
201631 December
201631 December
201631 December
2016EUR EUR EUR EUR
Financial assets at fair value through profit or lossEquities 85,591,366 - - 85,591,366
Total financial assets 85,591,366 - - 85,591,366
Financial liabilities at fair value through profit or lossFutures (1,777) - - (1,777)
Total financial liabilities (1,777) - - (1,777)
Level 1 Level 2 Level 3 Total
db x-trackers Mittelstand & MidCap Germany UCITS ETF (DR)31 December
201631 December
201631 December
201631 December
2016EUR EUR EUR EUR
Financial assets at fair value through profit or lossEquities 46,148,689 - - 46,148,689Preferred Stocks 3,959,698 - - 3,959,698Futures 2,535 - - 2,535
Total financial assets 50,110,922 - - 50,110,922
Level 1 Level 2 Level 3 Totaldb x-trackers MSCI North America High Dividend Yield IndexUCITS ETF (DR)
31 December2016
31 December2016
31 December2016
31 December2016
USD USD USD USDFinancial assets at fair value through profit or lossEquities 117,595,873 - - 117,595,873
Total financial assets 117,595,873 - - 117,595,873
Financial liabilities at fair value through profit or lossFutures (610) - - (610)
Total financial liabilities (610) - - (610)
Level 1 Level 2 Level 3 Total
db x-trackers MSCI AC World Index UCITS ETF (DR)31 December
201631 December
201631 December
201631 December
2016EUR EUR EUR EUR
Financial assets at fair value through profit or lossEquities 136,448,073 - - 136,448,073Preferred Stocks 665,567 - - 665,567Rights 2,022 - - 2,022Futures 2,636 - - 2,636
Total financial assets 137,118,298 - - 137,118,298
Financial liabilities at fair value through profit or lossFutures (2,588) - - (2,588)
Total financial liabilities (2,588) - - (2,588)
Level 1 Level 2 Level 3 Totaldb x-trackers MSCI AC Far East ex Japan Index UCITS ETF(DR)
31 December2016
31 December2016
31 December2016
31 December2016
EUR EUR EUR EURFinancial assets at fair value through profit or lossEquities 18,748,044 - - 18,748,044Preferred Stocks 187,025 - - 187,025
Total financial assets 18,935,069 - - 18,935,069
CONCEPT FUND SOLUTIONS PLC
Notes to the Financial Statements for the financial year ended 31 December 2017 cont/d
625
10. Financial Instruments and Associated Risks cont/d
Fair valuation hierarchy cont/d
Level 1 Level 2 Level 3 Total
db x-trackers MSCI USA Index UCITS ETF (DR)31 December
201631 December
201631 December
201631 December
2016USD USD USD USD
Financial assets at fair value through profit or lossEquities 1,943,749,182 - - 1,943,749,182
Total financial assets 1,943,749,182 - - 1,943,749,182
Financial liabilities at fair value through profit or lossFutures (33,393) - - (33,393)
Total financial liabilities (33,393) - - (33,393)
Level 1 Level 2 Level 3 Total
db x-trackers S&P 500® Equal Weight UCITS ETF (DR)31 December
201631 December
201631 December
201631 December
2016USD USD USD USD
Financial assets at fair value through profit or lossEquities 429,016,054 - - 429,016,054
Total financial assets 429,016,054 - - 429,016,054
Financial liabilities at fair value through profit or lossFutures (4,970) - - (4,970)
Total financial liabilities (4,970) - - (4,970)
Level 1 Level 2 Level 3 Total
db x-trackers MSCI World Index UCITS ETF (DR)31 December
201631 December
201631 December
201631 December
2016USD USD USD USD
Financial assets at fair value through profit or lossEquities 1,820,576,677 - - 1,820,576,677Preferred Stocks 4,175,356 - - 4,175,356Rights 22,287 - - 22,287Futures 18,716 - - 18,716
Total financial assets 1,824,793,036 - - 1,824,793,036
Financial liabilities at fair value through profit or lossFutures (31,793) - - (31,793)
Total financial liabilities (31,793) - - (31,793)
Level 1 Level 2 Level 3 Totaldb x-trackers FTSE Developed Europe ex UK Property UCITSETF (DR)
31 December2016
31 December2016
31 December2016
31 December2016
EUR EUR EUR EURFinancial assets at fair value through profit or lossEquities 92,053,299 - - 92,053,299
Total financial assets 92,053,299 - - 92,053,299
Level 1 Level 2 Level 3 Total
db x-trackers MSCI World Minimum Volatility UCITS ETF (DR)31 December
201631 December
201631 December
201631 December
2016USD USD USD USD
Financial assets at fair value through profit or lossEquities 65,686,724 - - 65,686,724Preferred Stocks 181 - - 181
Total financial assets 65,686,905 - - 65,686,905
CONCEPT FUND SOLUTIONS PLC
Notes to the Financial Statements for the financial year ended 31 December 2017 cont/d
626
10. Financial Instruments and Associated Risks cont/d
Fair valuation hierarchy cont/d
Level 1 Level 2 Level 3 Total
db-x trackers MSCI World Momentum Factor UCITS ETF (DR)31 December
201631 December
201631 December
201631 December
2016USD USD USD USD
Financial assets at fair value through profit or lossEquities 32,808,678 - - 32,808,678Preferred Stocks 93,521 - - 93,521
Total financial assets 32,902,199 - - 32,902,199
Level 1 Level 2 Level 3 Total
db x-trackers MSCI World Quality Factor UCITS ETF (DR)31 December
201631 December
201631 December
201631 December
2016USD USD USD USD
Financial assets at fair value through profit or lossEquities 43,345,414 - - 43,345,414Preferred Stocks 21,663 - - 21,663
Total financial assets 43,367,077 - - 43,367,077
Level 1 Level 2 Level 3 Total
db x-trackers MSCI World Value Factor UCITS ETF (DR)31 December
201631 December
201631 December
201631 December
2016USD USD USD USD
Financial assets at fair value through profit or lossEquities 167,987,504 - - 167,987,504Preferred Stocks 1,571,623 - - 1,571,623Rights 11,167 - - 11,167
Total financial assets 169,570,294 - - 169,570,294
Level 1 Level 2 Level 3 Total
Deutsche MSCI World Index Fund31 December
201631 December
201631 December
201631 December
2016EUR EUR EUR EUR
Financial assets at fair value through profit or lossEquities 107,634,605 - - 107,634,605Preferred Stocks 203,358 - - 203,358
Total financial assets 107,837,963 - - 107,837,963
Level 1 Level 2 Level 3 Total
db x-trackers MSCI GCC Select Index UCITS ETF31 December
201631 December
201631 December
201631 December
2016USD USD USD USD
Financial assets at fair value through profit or lossEquities 44,623,284 - - 44,623,284Preferred Stocks 3,897,285 - - 3,897,285Total Return Swaps - 46,842,066 - 46,842,066
Total financial assets 48,520,569 46,842,066 - 95,362,635
Financial liabilities at fair value through profit or lossTotal Return Swaps - (48,520,569) - (48,520,569)
Total financial liabilities - (48,520,569) - (48,520,569)
Level 1 Level 2 Level 3 Total
db x-trackers FTSE All-World ex UK UCITS ETF (DR)31 December
201631 December
201631 December
201631 December
2016GBP GBP GBP GBP
Financial assets at fair value through profit or lossEquities 33,432,510 - - 33,432,510Preferred Stocks 192,224 - - 192,224Rights 426 - - 426Futures 16 - - 16
Total financial assets 33,625,176 - - 33,625,176
CONCEPT FUND SOLUTIONS PLC
Notes to the Financial Statements for the financial year ended 31 December 2017 cont/d
627
10. Financial Instruments and Associated Risks cont/d
Fair valuation hierarchy cont/d
Level 1 Level 2 Level 3 Total
db x-trackers S&P 500 UCITS ETF (DR)31 December
201631 December
201631 December
201631 December
2016USD USD USD USD
Financial assets at fair value through profit or lossEquities 580,062,551 - - 580,062,551Forward Currency Contracts - 53,624 - 53,624
Total financial assets 580,062,551 53,624 - 580,116,175
Financial liabilities at fair value through profit or lossFutures (11,388) - - (11,388)Forward Currency Contracts - (5,522,389) - (5,522,389)
Total financial liabilities (11,388) (5,522,389) - (5,533,777)
Level 1 Level 2 Level 3 Total
db x-trackers Russell 2000 UCITS ETF (DR)31 December
201631 December
201631 December
201631 December
2016USD USD USD USD
Financial assets at fair value through profit or lossEquities 461,001,803 - - 461,001,803
Total financial assets 461,001,803 - - 461,001,803
Financial liabilities at fair value through profit or lossFutures (12,925) - - (12,925)
Total financial liabilities (12,925) - - (12,925)
Level 1 Level 2 Level 3 Total
db x-trackers Russell Midcap UCITS ETF (DR)31 December
201631 December
201631 December
201631 December
2016USD USD USD USD
Financial assets at fair value through profit or lossEquities 125,653,814 - - 125,653,814
Total financial assets 125,653,814 - - 125,653,814
Financial liabilities at fair value through profit or lossFutures (3,798) - - (3,798)
Total financial liabilities (3,798) - - (3,798)
Level 1 Level 2 Level 3 Total
db x-trackers JPX-Nikkei 400 UCITS ETF (DR)31 December
201631 December
201631 December
201631 December
2016JPY JPY JPY JPY
Financial assets at fair value through profit or lossEquities 27,084,888,762 - - 27,084,888,762Futures 1,829,300 - - 1,829,300Forward Currency Contracts - 275,005,045 - 275,005,045
Total financial assets 27,086,718,062 275,005,045 - 27,361,723,107
Financial liabilities at fair value through profit or lossForward Currency Contracts - (4,767,402) - (4,767,402)
Total financial liabilities - (4,767,402) - (4,767,402)
Level 1 Level 2 Level 3 Total
db x-trackers FTSE 100 Equal Weight UCITS ETF (DR)31 December
201631 December
201631 December
201631 December
2016GBP GBP GBP GBP
Financial assets at fair value through profit or lossEquities 16,367,388 - - 16,367,388Preferred Stocks 2,280 - - 2,280Futures 1,175 - - 1,175
Total financial assets 16,370,843 - - 16,370,843
CONCEPT FUND SOLUTIONS PLC
Notes to the Financial Statements for the financial year ended 31 December 2017 cont/d
628
10. Financial Instruments and Associated Risks cont/d
Fair valuation hierarchy cont/d
Level 1 Level 2 Level 3 Total
db x-trackers USD Corporate Bond UCITS ETF (DR)31 December
201631 December
201631 December
201631 December
2016USD USD USD USD
Financial assets at fair value through profit or lossCorporate Bonds - 648,233,509 - 648,233,509Forward Currency Contracts - 18,849 - 18,849
Total financial assets - 648,252,358 - 648,252,358
Financial liabilities at fair value through profit or lossFutures (16,687) - - (16,687)Forward Currency Contracts - (1,395,356) - (1,395,356)
Total financial liabilities (16,687) (1,395,356) - (1,412,043)
USD USD USD USDFinancial assets at fair value through profit or lossCorporate Bonds - 2,248,055 - 2,248,055Government Bonds - 32,319,788 - 32,319,788
Total financial assets - 34,567,843 - 34,567,843
CONCEPT FUND SOLUTIONS PLC
Notes to the Financial Statements for the financial year ended 31 December 2017 cont/d
630
10. Financial Instruments and Associated Risks cont/d
Fair valuation hierarchy cont/d
Level 1 Level 2 Level 3 Total
db x-trackers iBoxx EUR Corporates Yield Plus UCITS ETF (DR)31 December
201631 December
201631 December
201631 December
2016EUR EUR EUR EUR
Financial assets at fair value through profit or lossCorporate Bonds - 24,314,796 - 24,314,796
Total financial assets - 24,314,796 - 24,314,796
Level 1 Level 2 Level 3 Total
db x-trackers MSCI USA Minimum Volatility UCITS ETF (DR)31 December
201631 December
201631 December
201631 December
2016USD USD USD USD
Financial assets at fair value through profit or lossEquities 5,267,038 - - 5,267,038
Total financial assets 5,267,038 - - 5,267,038
Level 1 Level 2 Level 3 Total
db x-trackers MSCI EMU Minimum Volatility UCITS ETF (DR)31 December
201631 December
201631 December
201631 December
2016EUR EUR EUR EUR
Financial assets at fair value through profit or lossEquities 5,229,555 - - 5,229,555Preferred Stocks 77,803 - - 77,803
Total financial assets 5,307,358 - - 5,307,358
11. Stock Lending Activities
During the financial years ended 31 December 2017 and 31 December 2016 the Company entered into stocklending activities in several of its Funds. For further details of the Funds in which the Company had stocklending agreements in place, and the fair value of the securities on loan at the financial years then ended, seenote 14 of the financial statements (“Efficient Portfolio Management”).
12. Distributions
The following distributions were paid during the financial year ended 31 December 2017.
Fund Class Ex-Date Rate per unit Total Amountdb x-trackers Portfolio Income UCITS ETF Class 1D 10 April 2017 EUR 0.1332 EUR 333,573db x-trackers MSCI Nordic Index UCITS ETF (DR) Class 1D 10 April 2017 EUR 0.8436 EUR 2,100,041db x-trackers Mittelstand & MidCap Germany UCITS ETF(DR)
Class 1D 10 April 2017 EUR 0.2425 EUR 727,500
db x-trackers MSCI World Index UCITS ETF (DR) Class 1D 10 April 2017 USD 0.9835 USD 8,288,586Deutsche MSCI World Index Fund Class 1D 10 April 2017 EUR 0.7911 EUR 613,034db x-trackers JPX-Nikkei 400 UCITS ETF (DR) Class 1D 10 April 2017 JPY 30.2521 JPY 289,473,360db x-trackers JPX-Nikkei 400 UCITS ETF (DR) Class 2D - GBP Hedge 10 April 2017 GBP 0.2690 GBP 288,860db x-trackers FTSE 100 Equal Weight UCITS ETF (DR) Class 1D 10 April 2017 GBP 0.4216 GBP 620,276db x-trackers USD Corporate Bond UCITS ETF (DR) Class 1D 10 April 2017 USD 0.4670 USD 13,303,586db x-trackers USD Corporate Bond UCITS ETF (DR) Class 2D 10 April 2017 EUR 0.2508 EUR 2,340,395db x-trackers iBoxx Eurozone Sovereigns Quality WeightedUCITS ETF (DR)
Class 1D 10 April 2017 EUR 0.1209 EUR 144,744
db x-trackers iBoxx USD Emerging Sovereigns QualityWeighted UCITS ETF (DR)
Class 1D 10 April 2017 USD 0.4480 USD 1,473,922
The following distributions were paid during the financial year ended 31 December 2016.
Fund Class Ex- Date Rate per unit Total Amountdb x-trackers Portfolio Income UCITS ETF Class 1D 4 April 2016 EUR 0.1633 EUR 408,929db x-trackers Stiftungs-Stabilität UCITS ETF Class 1D 4 April 2016 EUR 0.1174 EUR 58,825db x-trackers MSCI Nordic Index UCITS ETF (DR) Class 1D 4 April 2016 EUR 0.5232 EUR 1,197,804db x-trackers MSCI Turkey Index UCITS ETF (DR) Class 1D 4 April 2016 USD 0.5382 USD 93,647db x-trackers Mittelstand & MidCap Germany UCITS ETF (DR) Class 1D 4 April 2016 EUR 0.1880 EUR 451,200db x-trackers MSCI World Index UCITS ETF (DR) Class 1D 4 April 2016 USD 0.9429 USD 8,290,409Deutsche MSCI World Index Fund Class 1D 4 April 2016 EUR 0.8906 EUR 1,918,002db x-trackers JPX-Nikkei 400 UCITS ETF (DR) Class 1D 4 April 2016 JPY 10.0674 JPY 98,528,617db x-trackers JPX-Nikkei 400 UCITS ETF (DR) (GBP) Class 2D - GBP Hedge 4 April 2016 GBP 0.0668 GBP 93,776
CONCEPT FUND SOLUTIONS PLC
Notes to the Financial Statements for the financial year ended 31 December 2017 cont/d
631
12. Distributions cont/d
Fund Class Ex- Date Rate per unit Total Amountdb x-trackers FTSE 100 Equal Weight UCITS ETF (DR) Class 1C 4 April 2016 GBP 0.1193 GBP 217,269db x-trackers USD Corporate Bond UCITS ETF (DR) Class 1D 4 April 2016 USD 0.0417 USD 217,186db x-trackers iBoxx Eurozone Sovereigns Quality WeightedUCITS ETF
Class 1D 4 April 2016 EUR 0.0100 EUR 4,900
13. Related party transactions
The counterparty to the swaps held by the Funds is Deutsche Bank AG, who is also the Fixed Fee Arranger (asdetailed in note 4) and is therefore a related party. The Funds also include seed capital from Deutsche BankAG.
Deutsche Bank AG, London Branch, acts as securities lending agent for securities lending transactionsentered into on behalf of the Funds please refer to note 14 Efficient Portfolio Management.
The below table discloses the Funds where Deutsche Bank AG is a significant shareholder at 31 December2017 and 31 December 2016. The Funds listed below are Funds where Deutsche Bank AG is an authorisedparticipant ("AP") and the majority of the shares are re-sold on the secondary market.
Fund
Numberof Units
31 December2017
% ofShareholding
of the Fund31 December
2017
Numberof Units
31 December2016
% ofShareholding
of the Fund31 December
2016db x-trackers EUR Liquid Corporate 12.5 UCITS ETF 1,081,892 100.00% 1,421,719 100.00%db x-trackers Portfolio Income UCITS ETF 2,504,305 100.00% 2,003,444 100.00%db x-trackers MSCI Nordic Index UCITS ETF (DR) 760,000 9.24% 860,000 31.98%db x-trackers Mittelstand & MidCap Germany UCITS ETF (DR) 900,000 24.19% 900,000 35.29%db x-trackers MSCI North America High Dividend Yield Index UCITSETF (DR) 4,668,000 100.00% 4,018,000 96.87%db x-trackers MSCI AC World Index UCITS ETF (DR) 2,100,000 21.11% 2,100,000 87.50%db x-trackers MSCI AC Far East ex Japan Index UCITS ETF (DR) 1,480,000 100.00% 1,480,000 100.00%db x-trackers MSCI USA Index UCITS ETF (DR) 13,588,000 23.03% 17,728,000 52.89%db x-trackers S&P 500® Equal Weight UCITS ETF (DR) 10,425,226 89.77% 9,105,226 89.22%db x-trackers MSCI World Index UCITS ETF (DR) 14,882,054 26.16% 14,162,054 37.24%db x-trackers FTSE Developed Europe ex UK Property UCITS ETF(DR) 685,000 100.00% 880,000 45.83%db x-trackers MSCI World Minimum Volatility UCITS ETF (DR) 900,000 50.70% 900,000 33.96%db x-trackers MSCI World Momentum Factor UCITS ETF (DR) 1,650,000 48.53% 1,650,000 100.00%db x-trackers MSCI World Quality Factor UCITS ETF (DR) 300,000 10.26% 550,000 35.48%db x-trackers MSCI World Value Factor UCITS ETF (DR) 4,175,000 67.61% 3,050,000 48.41%db x-trackers MSCI GCC Select Index UCITS ETF 56,117 3.37% 1,627,756 48.09%db x-trackers FTSE All-World ex UK UCITS ETF (DR) 543,392 100.00% 723,392 100.00%db x-trackers S&P 500 UCITS ETF (DR) 7,298,447 28.46% 7,068,447 49.23%db x-trackers Russell 2000 UCITS ETF (DR) 2,946,157 100.00% 2,496,157 100.00%db x-trackers Russell Midcap UCITS ETF (DR) 6,240,808 100.00% 6,515,808 100.00%db x-trackers JPX-Nikkei 400 UCITS ETF (DR) 6,228,829 27.57% 6,228,829 35.49%db x-trackers USD Corporate Bond UCITS ETF (DR) 17,903,949 31.70% 19,823,949 44.14%db x-trackers iBoxx Eurozone Sovereigns Quality Weighted UCITSETF (DR) 1,240,000 95.88% 740,000 100.00%db x-trackers MSCI World Health Care Index UCITS ETF (DR) 6,888,338 82.05% 7,048,338 71.08%db x-trackers MSCI World Financials Index UCITS ETF (DR) 13,049,587 59.14% 13,049,587 98.00%db x-trackers MSCI World Energy Index UCITS ETF (DR) 3,727,277 36.28% 2,287,277 65.82%db x-trackers MSCI World Consumer Staples Index UCITS ETF (DR) 1,747,109 39.88% 1,987,109 100.29%db x-trackers MSCI World Information Technology Index UCITSETF (DR) 7,678,195 81.82% 7,678,195 81.82%db x-trackers MSCI World Industrials Index UCITS ETF (DR) 841,509 75.00% 841,509 90.28%db x-trackers MSCI World Consumer Discretionary Index UCITS ETF(DR) 4,678,789 79.87% 4,678,789 97.93%db x-trackers MSCI World Utilities Index UCITS ETF (DR) 272,632 59.47% 272,632 76.06%db x-trackers MSCI World Telecom Services Index UCITS ETF (DR) 324,476 6.53% 324,477 16.99%db x-trackers MSCI World Materials Index UCITS ETF (DR) 270,721 51.85% 270,721 74.75%
CONCEPT FUND SOLUTIONS PLC
Notes to the Financial Statements for the financial year ended 31 December 2017 cont/d
1 Fund launched during the financial year ended 31 December 2017.
Deutsche Bank AG did not have a significant shareholding in db x-trackers FTSE 100 Equal Weight UCITSETF (DR), Deutsche MSCI World Index Fund, db x-trackers MSCI USA Consumer Discretionary Index UCITSETF (DR), db x-trackers MSCI USA Consumer Staples Index UCITS ETF (DR), db x-trackers MSCI USAEnergy Index UCITS ETF (DR), db x-trackers MSCI USA Health Care Index UCITS ETF (DR) and dbx-trackers MSCI USA Information Technology Index UCITS ETF (DR) as at 31 December 2017.
Although Deutsche Bank AG is the sole direct investor in these Funds, some or all of the holdings in each Fundare re-sold on secondary markets.
As at 31 December 2017, db x-trackers MSCI USA Index UCITS ETF (DR), db x-trackers MSCI World IndexUCITS ETF (DR), db x-trackers MSCI World Health Care Index UCITS ETF (DR), db x-trackers MSCI WorldFinancials Index UCITS ETF (DR), db x-trackers MSCI World Energy Index UCITS ETF (DR), db x-trackersMSCI World Consumer Staples Index UCITS ETF (DR), db x-trackers MSCI World Information TechnologyIndex UCITS ETF (DR), db x-trackers MSCI World Consumer Discretionary Index UCITS ETF (DR) and dbx-trackers MSCI Emerging Markets Index UCITS ETF (DR) held investments in related db x-trackers and/or dbx-trackers II Exchange Traded Funds (ETFs).
The portfolio of investments of db x-trackers Portfolio Income UCITS ETF is fully invested in a range of dbx-trackers and db x-trackers II Exchange Traded Funds (ETFs).
Please see the Schedule of Investments of these Funds for more details.
These are related parties by virtue of having either a common investment manager or an Investment Managerwho is part of the same ultimate parent group as Deutsche Bank AG. Gains or losses on these investments andany associated investment income, earned by the Funds during the financial year are shown in the Statementof Comprehensive Income
For details of fees paid to the Investment Manager and Sub-Investment Manager please refer to Note 4Significant agreements. For details of Directors' Fees paid during the financial year please refer to Note 7Directors' remuneration.
Broker commissions and fees on purchases and sales of securities for which Deutsche Bank AG or anassociated entity acted as broker amounted to EUR 81,033 (financial year ended 31 December 2016: EUR181,586) for the financial year.
14. Efficient Portfolio Management
The Company may, on behalf of each Fund and subject to the conditions and within the limits laid down by theCentral Bank, employ techniques and instruments relating to transferable securities for efficient portfoliomanagement purposes. Transactions for the purposes of efficient portfolio management may be undertakenwith a view to achieving a reduction in risk, a reduction in costs or an increase in capital or income returns toa Fund and may not be speculative in nature. Such techniques and instruments will be utilised in accordancewith the requirements of the Central Bank. New techniques and instruments may be developed which may besuitable for use by the Company and the Company (subject as aforesaid) may employ such techniques.
CONCEPT FUND SOLUTIONS PLC
Notes to the Financial Statements for the financial year ended 31 December 2017 cont/d
633
14. Efficient Portfolio Management cont/d
During the financial year ended and as at 31 December 2017 and 31 December 2016, the Company employedtechniques or instruments for Efficient Portfolio Management purposes, see detail below.
Stock lending agreements may be used by the Funds for efficient portfolio management purposes. DeutscheBank AG, London Branch, acts as securities lending agent for securities lending transactions entered into onbehalf of the Funds.
During the financial year ended 31 December 2017, the Funds as disclosed in the below tables had stocklending agreements in place. The tables detail the fair value of securities on loan at 31 December 2017.
db x-trackers MSCI Nordic Index UCITS ETF (DR) recorded the following income during the financial year asa result of securities lending activities: EUR 16,690. Securities lending income is split between the Fund, thesecurities lending agent and the Investment Manager in a ratio of 70:15:15 respectively, with all operationalcosts borne out of the securities lending agent's and Investment Manager's share.
db x-trackers Mittelstand & MidCap Germany UCITS (DR) recorded the following income during the financialyear as a result of securities lending activities: EUR 103,293. Securities lending income is split between theFund, the securities lending agent and the Investment Manager in a ratio of 70:15:15 respectively, with alloperational costs borne out of the securities lending agent's and Investment Manager's share.
CONCEPT FUND SOLUTIONS PLC
Notes to the Financial Statements for the financial year ended 31 December 2017 cont/d
634
14. Efficient Portfolio Management cont/d
Fund CurrencyQuantity on loan at31 December 2017
Fair Value as at31 December 2017
db x-trackers MSCI AC World Index UCITS ETF (DR)Anglo American EUR 6,000 103,846Asahi Glass EUR 1,200 43,450Asics EUR 1,200 15,991Bank of Nova Scotia EUR 6,000 327,118Canon EUR 3,000 93,488EDP - Energias de Portugal EUR 24,100 69,408J Sainsbury EUR 11,500 31,315Kuehne + Nagel International EUR 340 50,373Terna Rete Elettrica Nazionale EUR 14,000 69,048TransCanada EUR 4,400 179,094UnipolSai Assicurazioni EUR 17,000 33,388Vifor Pharma EUR 100 10,682Yamaha Motor EUR 1,500 41,124Total EUR 90,340 1,068,325
db x-trackers MSCI AC World Index UCITS ETF (DR) recorded the following income during the financial yearas a result of securities lending activities: EUR 11,221. Securities lending income is split between the Fund, thesecurities lending agent and the Investment Manager in a ratio of 70:15:15 respectively, with all operationalcosts borne out of the securities lending agent's and Investment Manager's share.
db x-trackers MSCI USA Index UCITS ETF (DR) recorded the following income during the financial year as aresult of securities lending activities: USD 197,327. Securities lending income is split between the Fund, thesecurities lending agent and the Investment Manager in a ratio of 70:15:15 respectively, with all operationalcosts borne out of the securities lending agent's and Investment Manager's share.
Notes to the Financial Statements for the financial year ended 31 December 2017 cont/d
636
14. Efficient Portfolio Management cont/d
Fund CurrencyQuantity on loan at31 December 2017
Fair Value as at31 December 2017
db x-trackers S&P 500® Equal Weight UCITS ETF (DR)cont/dNordstrom USD 19,000 911,629PPG Industries USD 8,500 1,001,594PulteGroup USD 15,000 508,668Qorvo USD 10,300 697,742ResMed USD 10,000 867,492Sealed Air USD 15,000 745,956T Rowe Price Group USD 3,800 402,562TransDigm Group USD 936 259,584UDR USD 16,900 656,379Under Armour USD 17,000 241,743WEC Energy Group USD 10,000 668,066WW Grainger USD 2,200 526,480XL Group USD 17,000 604,699Total USD 770,143 29,644,743
db x-trackers S&P 500® Equal Weight UCITS ETF (DR) recorded the following income during the financialyear as a result of securities lending activities: USD 39,682. Securities lending income is split between theFund, the securities lending agent and the Investment Manager in a ratio of 70:15:15 respectively, with alloperational costs borne out of the securities lending agent's and Investment Manager's share.
Fund CurrencyQuantity on loan at31 December 2017
Fair Value as at31 December 2017
db x-trackers MSCI World Index UCITS ETF (DR)AltaGas USD 10,000 228,895Altice USD 31,560 328,532Bank of Nova Scotia USD 86,000 5,630,184Bridgestone USD 35,000 1,633,393Calbee USD 3,900 127,348Canadian Imperial Bank of Commerce USD 33,000 3,231,914Canon USD 60,000 2,245,213Carrefour USD 25,000 540,510Cenovus Energy USD 39,333 364,533Edenred USD 12,000 348,280EDP - Energias de Portugal USD 172,000 594,828Hennes & Mauritz USD 60,000 1,249,046ICA Gruppen USD 3,400 123,107Industrivarden USD 3,000 74,416J Sainsbury USD 110,500 361,320Japan Tobacco USD 62,900 2,034,858Kone USD 15,000 805,497Koninklijke Vopak USD 811 35,862Kubota USD 71,100 1,399,654Kuehne + Nagel International USD 3,000 533,718Mattel USD 20,000 308,540Mediclinic International USD 10,954 95,282Micro Focus International USD 11,000 367,714Otsuka Holdings USD 22,900 1,009,537Potash of Saskatchewan USD 77,500 1,602,127Schroders USD 9,000 428,232Sharp USD 7,000 241,361Sumitomo Rubber Industries USD 7,500 140,059Tenaris USD 25,000 398,966Terna Rete Elettrica Nazionale USD 95,000 562,623Tesla USD 8,500 2,695,755TransCanada USD 65,100 3,181,850UnipolSai Assicurazioni USD 85,000 200,462Vifor Pharma USD 2,500 320,663Worldpay Group USD 85,373 487,920Yahoo Japan USD 8,000 36,850Yamada Denki USD 30,000 165,985Total USD 1,407,831 34,135,034
CONCEPT FUND SOLUTIONS PLC
Notes to the Financial Statements for the financial year ended 31 December 2017 cont/d
637
14. Efficient Portfolio Management cont/d
db x-trackers MSCI World Index UCITS ETF (DR) recorded the following income during the financial year asa result of securities lending activities: USD 222,956. Securities lending income is split between the Fund, thesecurities lending agent and the Investment Manager in a ratio of 70:15:15 respectively, with all operationalcosts borne out of the securities lending agent's and Investment Manager's share.
Fund CurrencyQuantity on loan at31 December 2017
Fair Value as at31 December 2017
db x-trackers MSCI World Minimum Volatility UCITS ETF(DR)Canon USD 9,200 344,265Kuehne + Nagel International USD 1,300 231,278Total USD 10,500 575,543
db x-trackers MSCI World Minimum Volatility UCITS ETF (DR) recorded the following income during thefinancial year as a result of securities lending activities: USD 3,347. Securities lending income is split betweenthe Fund, the securities lending agent and the Investment Manager in a ratio of 70:15:15 respectively, with alloperational costs borne out of the securities lending agent's and Investment Manager's share.
db-x trackers MSCI World Momentum Factor UCITS ETF (DR) recorded the following income during thefinancial year as a result of securities lending activities: USD 1,971. Securities lending income is split betweenthe Fund, the securities lending agent and the Investment Manager in a ratio of 70:15:15 respectively, with alloperational costs borne out of the securities lending agent's and Investment Manager's share.
Fund CurrencyQuantity on loan at31 December 2017
Fair Value as at31 December 2017
db x-trackers MSCI World Quality Factor UCITS ETF (DR)Canadian Imperial Bank of Commerce USD 7,700 754,114Kone USD 3,000 161,099Total USD 10,700 915,213
db x-trackers MSCI World Quality Factor UCITS ETF (DR) recorded the following income during the financialyear as a result of securities lending activities: USD 2,199. Securities lending income is split between theFund, the securities lending agent and the Investment Manager in a ratio of 70:15:15 respectively, with alloperational costs borne out of the securities lending agent's and Investment Manager's share.
Fund CurrencyQuantity on loan at31 December 2017
Fair Value as at31 December 2017
db x-trackers MSCI World Value Factor UCITS ETF (DR)Boskalis Westminster USD 1,500 56,684Bridgestone USD 5,000 233,342Canon USD 25,000 935,506Carrefour USD 20,000 432,408EDP - Energias de Portugal USD 43,000 148,707Sumitomo Rubber Industries USD 3,000 56,023Yamada Denki USD 10,000 55,328Total USD 107,500 1,917,998
db x-trackers MSCI World Value Factor UCITS ETF (DR) recorded the following income during the financialyear as a result of securities lending activities: USD 9,205. Securities lending income is split between theFund, the securities lending agent and the Investment Manager in a ratio of 70:15:15 respectively, with alloperational costs borne out of the securities lending agent's and Investment Manager's share.
CONCEPT FUND SOLUTIONS PLC
Notes to the Financial Statements for the financial year ended 31 December 2017 cont/d
638
14. Efficient Portfolio Management cont/d
Fund CurrencyQuantity on loan at31 December 2017
Fair Value as at31 December 2017
Deutsche MSCI World Index FundAsahi Glass EUR 100 3,621Canon EUR 1,000 31,163EDP - Energias de Portugal EUR 2,000 5,760Total EUR 3,100 40,544
Deutsche MSCI World Index Fund recorded the following income during the financial year as a result ofsecurities lending activities: EUR 1,594. Securities lending income is split between the Fund, the securitieslending agent and the Investment Manager in a ratio of 70:15:15 respectively, with all operational costs borneout of the securities lending agent's and Investment Manager's share.
Fund CurrencyQuantity on loan at31 December 2017
Fair Value as at31 December 2017
db x-trackers FTSE All-World ex UK UCITS ETF (DR)Asics GBP 400 4,731Canon GBP 800 22,131Yamaha Motor GBP 600 14,602Total GBP 1,800 41,464
db x-trackers FTSE All-World ex UK UCITS ETF (DR) recorded the following income during the financial yearas a result of securities lending activities: GBP 344. Securities lending income is split between the Fund, thesecurities lending agent and the Investment Manager in a ratio of 70:15:15 respectively, with all operationalcosts borne out of the securities lending agent's and Investment Manager's share.
Notes to the Financial Statements for the financial year ended 31 December 2017 cont/d
639
14. Efficient Portfolio Management cont/d
Fund CurrencyQuantity on loan at31 December 2017
Fair Value as at31 December 2017
db x-trackers S&P 500 UCITS ETF (DR) cont/dSherwin-Williams USD 3,000 1,246,234T Rowe Price Group USD 8,200 868,685Under Armour Class C Shares USD 7,600 108,073WEC Energy Group USD 10,000 668,066WW Grainger USD 2,500 598,273XL Group USD 10,000 355,706Total USD 416,036 24,566,450
db x-trackers S&P 500 UCITS ETF (DR) recorded the following income during the financial year as a result ofsecurities lending activities: USD 33,303. Securities lending income is split between the Fund, the securitieslending agent and the Investment Manager in a ratio of 70:15:15 respectively, with all operational costs borneout of the securities lending agent's and Investment Manager's share.
db x-trackers Russell 2000 UCITS ETF (DR) recorded the following income during the financial year as a resultof securities lending activities: USD 141,733. Securities lending income is split between the Fund, thesecurities lending agent and the Investment Manager in a ratio of 70:15:15 respectively, with all operationalcosts borne out of the securities lending agent's and Investment Manager's share.
db x-trackers Russell Midcap UCITS ETF (DR) recorded the following income during the financial year as aresult of securities lending activities: USD 5,152. Securities lending income is split between the Fund, thesecurities lending agent and the Investment Manager in a ratio of 70:15:15 respectively, with all operationalcosts borne out of the securities lending agent's and Investment Manager's share.
db x-trackers JPX-Nikkei 400 UCITS ETF (DR) recorded the following income during the financial year as aresult of securities lending activities: JPY 2,240,137. Securities lending income is split between the Fund, thesecurities lending agent and the Investment Manager in a ratio of 70:15:15 respectively, with all operationalcosts borne out of the securities lending agent’s and Investment Manager's share.
Fund CurrencyQuantity on loan at31 December 2017
Fair Value as at31 December 2017
db x-trackers MSCI World Health Care Index UCITS ETF(DR)Cyberdyne USD 4,000 69,174Mediclinic International USD 9,046 78,686TESARO USD 1,500 126,655Vifor Pharma USD 200 25,653Total USD 14,746 300,168
db x-trackers MSCI World Health Care Index UCITS ETF (DR) recorded the following income during thefinancial year as a result of securities lending activities: USD 10,428. Securities lending income is splitbetween the Fund, the securities lending agent and the Investment Manager in a ratio of 70:15:15 respectively,with all operational costs borne out of the securities lending agent’s and Investment Manager's share.
Fund CurrencyQuantity on loan at31 December 2017
Fair Value as at31 December 2017
db x-trackers MSCI World Financials Index UCITS ETF (DR)Canadian Imperial Bank of Commerce USD 23,800 2,330,896Poste Italiane USD 14,843 112,822UnipolSai Assicurazioni USD 40,000 94,335Total USD 78,643 2,538,053
db x-trackers MSCI World Financials Index UCITS ETF (DR) recorded the following income during thefinancial year as a result of securities lending activities: USD 41,251. Securities lending income is splitbetween the Fund, the securities lending agent and the Investment Manager in a ratio of 70:15:15 respectively,with all operational costs borne out of the securities lending agent’s and Investment Manager's share.
Fund CurrencyQuantity on loan at31 December 2017
Fair Value as at31 December 2017
db x-trackers MSCI World Energy Index UCITS ETF (DR)AltaGas USD 22,000 503,570Cenovus Energy USD 125,000 1,158,482Koninklijke Vopak USD 9,600 424,507Total USD 156,600 2,086,559
CONCEPT FUND SOLUTIONS PLC
Notes to the Financial Statements for the financial year ended 31 December 2017 cont/d
643
14. Efficient Portfolio Management cont/d
db x-trackers MSCI World Energy Index UCITS ETF (DR) recorded the following income during the financialyear as a result of securities lending activities: USD 89,836. Securities lending income is split between theFund, the securities lending agent and the Investment Manager in a ratio of 70:15:15 respectively, with alloperational costs borne out of the securities lending agent’s and Investment Manager's share.
Fund CurrencyQuantity on loan at31 December 2017
Fair Value as at31 December 2017
db x-trackers MSCI World Consumer Staples Index UCITSETF (DR)Carrefour USD 20,000 432,408General Mills USD 2,665 159,601ICA Gruppen USD 3,200 115,865J Sainsbury USD 67,000 219,081Japan Tobacco USD 41,500 1,342,552Total USD 134,365 2,269,507
db x-trackers MSCI World Consumer Staples Index UCITS ETF (DR) recorded the following income during thefinancial year as a result of securities lending activities: USD 958. Securities lending income is split betweenthe Fund, the securities lending agent and the Investment Manager in a ratio of 70:15:15 respectively, with alloperational costs borne out of the securities lending agent’s and Investment Manager's share.
Fund CurrencyQuantity on loan at31 December 2017
Fair Value as at31 December 2017
db x-trackers MSCI World Information Technology IndexUCITS ETF (DR)Canon USD 25,000 935,505Worldpay Group USD 46,688 266,830Yahoo Japan USD 26,500 122,066Total USD 98,188 1,324,401
db x-trackers MSCI World Information Technology Index UCITS ETF (DR) recorded the following incomeduring the financial year as a result of securities lending activities: USD 497. Securities lending income is splitbetween the Fund, the securities lending agent and the Investment Manager in a ratio of 70:15:15 respectively,with all operational costs borne out of the securities lending agent’s and Investment Manager's share.
db x-trackers MSCI World Consumer Discretionary Index UCITS ETF (DR) recorded the following incomeduring the financial year as a result of securities lending activities: USD 5,062. Securities lending income issplit between the Fund, the securities lending agent and the Investment Manager in a ratio of 70:15:15respectively, with all operational costs borne out of the securities lending agent’s and Investment Manager'sshare.
Fund CurrencyQuantity on loan at31 December 2017
Fair Value as at31 December 2017
db x-trackers MSCI World Utilities Index UCITS ETF (DR)EDP - Energias de Portugal USD 20,500 70,895Total USD 20,500 70,895
CONCEPT FUND SOLUTIONS PLC
Notes to the Financial Statements for the financial year ended 31 December 2017 cont/d
644
14. Efficient Portfolio Management cont/d
db x-trackers MSCI World Utilities Index UCITS ETF (DR) recorded the following income during the financialyear as a result of securities lending activities: USD 125. Securities lending income is split between the Fund,the securities lending agent and the Investment Manager in a ratio of 70:15:15 respectively, with all operationalcosts borne out of the securities lending agent’s and Investment Manager's share.
Fund CurrencyQuantity on loan at31 December 2017
Fair Value as at31 December 2017
db x-trackers iBoxx EUR Corporates Yield Plus UCITS ETF(DR)Credit Agricole EUR 200,000 224,233Total EUR 200,000 224,233
db x-trackers MSCI World Consumer Discretionary Index UCITS ETF (DR) recorded the following incomeduring the financial year as a result of securities lending activities: EUR 330. Securities lending income is splitbetween the Fund, the securities lending agent and the Investment Manager in a ratio of 70:15:15 respectively,with all operational costs borne out of the securities lending agent’s and Investment Manager's share.
Fund CurrencyQuantity on loan at31 December 2017
Fair Value as at31 December 2017
db x-trackers MSCI EMU Minimum Volatility UCITS ETF(DR)EDP - Energias de Portugal EUR 49,883 143,663Total EUR 49,883 143,663
db x-trackers MSCI World Consumer Discretionary Index UCITS ETF (DR) recorded the following incomeduring the financial year as a result of securities lending activities: EUR 167. Securities lending income is splitbetween the Fund, the securities lending agent and the Investment Manager in a ratio of 70:15:15 respectively,with all operational costs borne out of the securities lending agent’s and Investment Manager's share.
Fund CurrencyQuantity on loan at31 December 2017
Fair Value as at31 December 2017
db x-trackers MSCI Emerging Markets Index UCITS ETF(DR)Airports of Thailand USD 410,000 858,048Charoen Pokphand Foods USD 285,000 210,511Coca-Cola Icecek USD 6,500 59,329Glow Energy USD 45,000 112,527Minor International USD 200,000 269,295Richter Gedeon Nyrt USD 11,000 289,120Robinson USD 45,000 101,101True USD 975,000 186,044Total USD 1,977,500 2,085,975
db x-trackers MSCI Emerging Markets Index UCITS ETF (DR) recorded the following income during thefinancial year as a result of securities lending activities: USD 964. Securities lending income is split betweenthe Fund, the securities lending agent and the Investment Manager in a ratio of 70:15:15 respectively, with alloperational costs borne out of the securities lending agent’s and Investment Manager's share.
During the financial year ended 31 December 2016, the Funds as disclosed in the below tables had stocklending agreements in place. The tables detail the fair value of securities on loan at 31 December 2016.
Fund CurrencyQuantity on loan at31 December 2016
Fair Value as at31 December 2016
db x-trackers MSCI Nordic Index UCITS ETF (DR)Alfa Laval EUR 30,000 476,611DONG Energy EUR 7,000 251,945Fortum EUR 34,521 506,423Hennes & Mauritz EUR 23,781 632,086ICA Gruppen EUR 9,300 268,962Kone EUR 35,977 1,526,144Metso EUR 8,175 222,687Tele2 EUR 40,000 305,407
CONCEPT FUND SOLUTIONS PLC
Notes to the Financial Statements for the financial year ended 31 December 2017 cont/d
645
14. Efficient Portfolio Management cont/d
Fund CurrencyQuantity on loan at31 December 2016
Fair Value as at31 December 2016
db x-trackers MSCI Nordic Index UCITS ETF (DR)Total EUR 188,754 4,190,265
db x-trackers MSCI Nordic Index UCITS ETF (DR) recorded the following income during the financial year asa result of securities lending activities: EUR 6,379. Securities lending income is split between the Fund, thesecurities lending agent and the Investment Manager in a ratio of 70:15:15 respectively, with all operationalcosts borne out of the securities lending agent's and Investment Manager's share.
db x-trackers Mittelstand & MidCap Germany UCITS (DR) recorded the following income during the financialyear as a result of securities lending activities: EUR 132,466. Securities lending income is split between theFund, the securities lending agent and the Investment Manager in a ratio of 70:15:15 respectively, with alloperational costs borne out of the securities lending agent's and Investment Manager's share.
Fund CurrencyQuantity on loan at31 December 2016
Fair Value as at31 December 2016
db x-trackers MSCI AC World Index UCITS ETF (DR)Banco de Sabadell EUR 30,000 39,600Canadian Imperial Bank of Commerce EUR 1,700 132,545Electricite de France EUR 1,472 14,320IGM Financial EUR 2,100 56,643J Sainsbury EUR 2,000 5,846Mediclinic International EUR 1,100 9,942Metso EUR 500 13,620Nagoya Railroad EUR 6,000 27,719Shaw Communications EUR 3,600 68,785TransCanada EUR 3,500 150,950Total EUR 51,972 519,970
CONCEPT FUND SOLUTIONS PLC
Notes to the Financial Statements for the financial year ended 31 December 2017 cont/d
646
14. Efficient Portfolio Management cont/d
db x-trackers MSCI AC World Index UCITS ETF (DR) recorded the following income during the financial yearas a result of securities lending activities: EUR 10,775. Securities lending income is split between the Fund,the securities lending agent and the Investment Manager in a ratio of 70:15:15 respectively, with all operationalcosts borne out of the securities lending agent's and Investment Manager's share.
Fund CurrencyQuantity on loan at31 December 2016
Fair Value as at31 December 2016
db x-trackers MSCI USA Index UCITS ETF (DR)3M USD 4,800 860,941Bed Bath & Beyond USD 3,000 123,265Boeing USD 54,000 8,452,154CarMax USD 15,600 1,002,163Caterpillar USD 45,000 4,220,467Cerner USD 20,000 963,518CH Robinson Worldwide USD 12,600 933,959Chipotle Mexican Grill USD 2,200 832,966Consolidated Edison USD 2,800 208,504Digital Realty Trust USD 11,400 1,127,865Discovery Communications USD 11,900 331,271Duke Energy USD 50,449 3,957,050EI du Pont de Nemours & Co USD 28,275 2,098,122Electronic Arts USD 27,300 2,200,054Expeditors International of Washington USD 5,667 302,411Fastenal USD 3,837 182,112Gap USD 20,000 457,028General Electric USD 181,840 5,796,938Host Hotels & Resorts USD 66,000 1,244,108International Business Machines USD 45,395 7,603,192Kohl's USD 12,000 603,928Mallinckrodt USD 8,800 438,015MGM Resorts International USD 36,200 1,037,209Microchip Technology USD 4,697 305,802Murphy Oil USD 10,200 322,708National Oilwell Varco USD 33,000 1,255,056Omnicom Group USD 14,500 1,248,995Packaging of America USD 7,200 615,702Palo Alto Networks USD 1,500 188,697Paychex USD 28,200 1,740,726People's United Financial USD 20,000 389,469Public Storage USD 1,000 221,577ResMed USD 8,100 508,465Sabre USD 10,000 251,335Schlumberger USD 87,000 7,364,518Sirius XM Holdings USD 160,000 719,823T Rowe Price Group USD 20,300 1,541,651Tesla USD 10,000 2,158,264Tiffany & Co USD 11,100 863,728Under Armour USD 15,100 443,730Varian Medical Systems USD 6,000 544,332Ventas USD 21,500 1,334,282VF USD 28,400 1,531,225Wabtec USD 5,500 461,924Western Union USD 19,600 430,153Whirlpool USD 5,500 1,012,925Whole Foods Market USD 25,800 804,330WW Grainger USD 3,800 892,191Total USD 1,227,060 72,128,848
db x-trackers MSCI USA Index UCITS ETF (DR) recorded the following income during the financial year as aresult of securities lending activities: USD 115,081. Securities lending income is split between the Fund, thesecurities lending agent and the Investment Manager in a ratio of 70:15:15 respectively, with all operationalcosts borne out of the securities lending agent's and Investment Manager's share.
CONCEPT FUND SOLUTIONS PLC
Notes to the Financial Statements for the financial year ended 31 December 2017 cont/d
db x-trackers S&P 500® Equal Weight UCITS ETF (DR) recorded the following income during the financialyear as a result of securities lending activities: USD 41,420. Securities lending income is split between theFund, the securities lending agent and the Investment Manager in a ratio of 70:15:15 respectively, with alloperational costs borne out of the securities lending agent's and Investment Manager's share.
Fund CurrencyQuantity on loan at31 December 2016
Fair Value as at31 December 2016
db x-trackers MSCI World Index UCITS ETF (DR)Alfa Laval USD 9,000 150,804Altice USD 2,500 49,518Antofagasta USD 11,000 91,765Banco Popular Espanol USD 140,000 135,107Canadian Imperial Bank of Commerce USD 21,100 1,735,104Canon USD 47,000 1,335,551Deutsche Lufthansa USD 10,000 130,909Distribuidora Internacional de Alimentacion USD 16,000 78,453Electricite de France USD 5,600 57,457EMS-Chemie Holding USD 350 178,310Fondiaria-Sai USD 91,640 196,978Fraport Frankfurt Airport Services Worldwide USD 1,200 70,787ICA Gruppen USD 1,900 57,955IGM Financial USD 6,100 173,535Ingenico Group USD 2,000 161,580Intu Properties USD 49,726 170,040J Sainsbury USD 72,000 221,968JCDecaux USD 3,300 97,002LINE USD 2,000 69,164Mediclinic International USD 17,000 162,049Metso USD 7,000 201,110Nippon Building Fund USD 60 334,782
CONCEPT FUND SOLUTIONS PLC
Notes to the Financial Statements for the financial year ended 31 December 2017 cont/d
648
14. Efficient Portfolio Management cont/d
Fund CurrencyQuantity on loan at31 December 2016
Fair Value as at31 December 2016
db x-trackers MSCI World Index UCITS ETF (DR) cont/dShaw Communications USD 22,500 453,425Swiss Re USD 25 2,370Technip USD 3,600 257,735Telefonica Deutschland Holding USD 40,000 171,958Tenaris USD 19,000 340,067TransCanada USD 43,600 1,983,264Wm Morrison Supermarkets USD 33,000 93,596Total USD 678,201 9,162,343
db x-trackers MSCI World Index UCITS ETF (DR) recorded the following income during the financial year asa result of securities lending activities: USD 8,246. Securities lending income is split between the Fund, thesecurities lending agent and the Investment Manager in a ratio of 70:15:15 respectively, with all operationalcosts borne out of the securities lending agent's and Investment Manager's share.
Fund CurrencyQuantity on loan at31 December 2016
Fair Value as at31 December 2016
db x-trackers MSCI World Minimum Volatility UCITS ETF(DR)Canadian Imperial Bank of Commerce USD 700 57,562Canon USD 17,000 483,072Shaw Communications USD 10,500 211,598Total USD 28,200 752,232
db x-trackers MSCI World Minimum Volatility UCITS ETF (DR) recorded the following income during thefinancial year as a result of securities lending activities: USD 5,234. Securities lending income is split betweenthe Fund, the securities lending agent and the Investment Manager in a ratio of 70:15:15 respectively, with alloperational costs borne out of the securities lending agent's and Investment Manager's share.
db-x trackers MSCI World Momentum Factor UCITS ETF (DR) recorded the following income during thefinancial year as a result of securities lending activities: USD 3,494. Securities lending income is split betweenthe Fund, the securities lending agent and the Investment Manager in a ratio of 70:15:15 respectively, with alloperational costs borne out of the securities lending agent's and Investment Manager's share.
Fund CurrencyQuantity on loan at31 December 2016
Fair Value as at31 December 2016
db x-trackers MSCI World Quality Factor UCITS ETF (DR)Canadian Imperial Bank of Commerce USD 3,000 246,697Total USD 3,000 246,697
db x-trackers MSCI World Quality Factor UCITS ETF (DR) recorded the following income during the financialyear as a result of securities lending activities: USD 1,183. Securities lending income is split between theFund, the securities lending agent and the Investment Manager in a ratio of 70:15:15 respectively, with alloperational costs borne out of the securities lending agent's and Investment Manager's share.
Fund CurrencyQuantity on loan at31 December 2016
Fair Value as at31 December 2016
db x-trackers MSCI World Value Factor UCITS ETF (DR)Canon USD 23,000 653,567Wm Morrison Supermarkets USD 101,728 288,527Total USD 124,728 942,094
CONCEPT FUND SOLUTIONS PLC
Notes to the Financial Statements for the financial year ended 31 December 2017 cont/d
649
14. Efficient Portfolio Management cont/d
db x-trackers MSCI World Value Factor UCITS ETF (DR) recorded the following income during the financialyear as a result of securities lending activities: USD 15,964. Securities lending income is split between theFund, the securities lending agent and the Investment Manager in a ratio of 70:15:15 respectively, with alloperational costs borne out of the securities lending agent's and Investment Manager's share.
Fund CurrencyQuantity on loan at31 December 2016
Fair Value as at31 December 2016
Deutsche MSCI World Index FundAltice EUR 1,400 26,292Canadian Imperial Bank of Commerce EUR 1,500 116,951IGM Financial EUR 1,000 26,973J Sainsbury EUR 10,000 29,230Shaw Communications EUR 2,500 47,768TransCanada EUR 2,500 107,821Wm Morrison Supermarkets EUR 16,000 43,027Total EUR 34,900 398,062
Deutsche MSCI World Index Fund recorded the following income during the financial year as a result ofsecurities lending activities: EUR 8,246. Securities lending income is split between the Fund, the securitieslending agent and the Investment Manager in a ratio of 70:15:15 respectively, with all operational costs borneout of the securities lending agent's and Investment Manager's share.
Fund CurrencyQuantity on loan at31 December 2016
Fair Value as at31 December 2016
db x-trackers FTSE All-World ex UK UCITS ETF (DR)Canadian Imperial Bank of Commerce GBP 500 33,278TransCanada GBP 900 33,133Wirecard GBP 100 3,478Total GBP 1,500 69,889
db x-trackers FTSE All-World ex UK UCITS ETF (DR) recorded the following income during the financial yearas a result of securities lending activities: GBP 1,041. Securities lending income is split between the Fund, thesecurities lending agent and the Investment Manager in a ratio of 70:15:15 respectively, with all operationalcosts borne out of the securities lending agent's and Investment Manager's share.
Notes to the Financial Statements for the financial year ended 31 December 2017 cont/d
650
14. Efficient Portfolio Management cont/d
db x-trackers S&P 500 UCITS ETF (DR) recorded the following income during the financial year as a result ofsecurities lending activities: USD 41,420. Securities lending income is split between the Fund, the securitieslending agent and the Investment Manager in a ratio of 70:15:15 respectively, with all operational costs borneout of the securities lending agent's and Investment Manager's share.
db x-trackers Russell 2000 UCITS ETF (DR) recorded the following income during the financial year as a resultof securities lending activities: USD 91,057. Securities lending income is split between the Fund, the securitieslending agent and the Investment Manager in a ratio of 70:15:15 respectively, with all operational costs borneout of the securities lending agent's and Investment Manager's share.
Notes to the Financial Statements for the financial year ended 31 December 2017 cont/d
651
14. Efficient Portfolio Management cont/d
db x-trackers Russell Midcap UCITS ETF (DR) recorded the following income during the financial year as aresult of securities lending activities: USD 5,754. Securities lending income is split between the Fund, thesecurities lending agent and the Investment Manager in a ratio of 70:15:15 respectively, with all operationalcosts borne out of the securities lending agent's and Investment Manager's share.
db x-trackers JPX-Nikkei 400 UCITS ETF (DR) recorded the following income during the financial year as aresult of securities lending activities: JPY 1,761,229. Securities lending income is split between the Fund, thesecurities lending agent and the Investment Manager in a ratio of 70:15:15 respectively, with all operationalcosts borne out of the securities lending agent’s and Investment Manager's share.
Fund CurrencyQuantity on loan at31 December 2016
Fair Value as at31 December 2016
db x-trackers MSCI World Health Care Index UCITS ETF(DR)CYBERDYNE USD 4,000 56,988Mediclinic International USD 21,000 200,177Total USD 25,000 257,165
db x-trackers MSCI World Health Care Index UCITS ETF (DR) recorded the following income during thefinancial year as a result of securities lending activities: USD 2,616. Securities lending income is split betweenthe Fund, the securities lending agent and the Investment Manager in a ratio of 70:15:15 respectively, with alloperational costs borne out of the securities lending agent’s and Investment Manager's share.
Fund CurrencyQuantity on loan at31 December 2016
Fair Value as at31 December 2016
db x-trackers MSCI World Financials Index UCITS ETF (DR)Banco de Sabadell USD 85,000 118,337Canadian Imperial Bank of Commerce USD 11,500 945,673IGM Financial USD 2,300 65,431Total USD 98,800 1,129,441
db x-trackers MSCI World Financials Index UCITS ETF (DR) recorded the following income during thefinancial year as a result of securities lending activities: USD 13,076. Securities lending income is splitbetween the Fund, the securities lending agent and the Investment Manager in a ratio of 70:15:15 respectively,with all operational costs borne out of the securities lending agent’s and Investment Manager's share.
Fund CurrencyQuantity on loan at31 December 2016
Fair Value as at31 December 2016
db x-trackers MSCI World Energy Index UCITS ETF (DR)Technip USD 3,400 243,416Tenaris USD 15,408 275,777TransCanada USD 32,500 1,478,351Total USD 51,308 1,997,544
CONCEPT FUND SOLUTIONS PLC
Notes to the Financial Statements for the financial year ended 31 December 2017 cont/d
652
14. Efficient Portfolio Management cont/d
db x-trackers MSCI World Energy Index UCITS ETF (DR) recorded the following income during the financialyear as a result of securities lending activities: USD 22,033. Securities lending income is split between theFund, the securities lending agent and the Investment Manager in a ratio of 70:15:15 respectively, with alloperational costs borne out of the securities lending agent’s and Investment Manager's share.
Fund CurrencyQuantity on loan at31 December 2016
Fair Value as at31 December 2016
db x-trackers MSCI World Consumer Staples Index UCITSETF (DR)ICA Gruppen USD 1,300 39,654Wm Morrison Supermarkets USD 35,000 99,269Total USD 36,300 138,923
db x-trackers MSCI World Consumer Staples Index UCITS ETF (DR) recorded the following income during thefinancial year as a result of securities lending activities: USD 257. Securities lending income is split betweenthe Fund, the securities lending agent and the Investment Manager in a ratio of 70:15:15 respectively, with alloperational costs borne out of the securities lending agent’s and Investment Manager's share.
Fund CurrencyQuantity on loan at31 December 2016
Fair Value as at31 December 2016
db x-trackers MSCI World Information Technology IndexUCITS ETF (DR)Canon USD 23,000 653,567Total USD 23,000 653,567
db x-trackers MSCI World Information Technology Index UCITS ETF (DR) recorded the following incomeduring the financial year as a result of securities lending activities: USD 56. Securities lending income is splitbetween the Fund, the securities lending agent and the Investment Manager in a ratio of 70:15:15 respectively,with all operational costs borne out of the securities lending agent’s and Investment Manager's share.
Fund CurrencyQuantity on loan at31 December 2016
Fair Value as at31 December 2016
db x-trackers MSCI World Consumer Discretionary IndexUCITS ETF (DR)Shaw Communications USD 10,900 219,659Total USD 10,900 219,659
db x-trackers MSCI World Consumer Discretionary Index UCITS ETF (DR) recorded the following incomeduring the financial year as a result of securities lending activities: USD 3,215. Securities lending income issplit between the Fund, the securities lending agent and the Investment Manager in a ratio of 70:15:15respectively, with all operational costs borne out of the securities lending agent’s and Investment Manager'sshare.
CONCEPT FUND SOLUTIONS PLC
Notes to the Financial Statements for the financial year ended 31 December 2017 cont/d
653
14. Efficient Portfolio Management cont/d
The table below details the collateral amounts held at 31 December 2017 and 31 December 2016 in respectof securities held on loan.
Collateral held at31 December 2017
Collateral held at31 December 2016
Fund EUR EURdb x-trackers MSCI Nordic Index UCITS ETF (DR) 14,554,431 5,708,544db x-trackers Mittelstand & MidCap Germany UCITS (DR) 12,252,356 13,248,476db x-trackers MSCI AC World Index UCITS ETF (DR) 1,144,520 567,453db x-trackers MSCI USA Index UCITS ETF (DR) 139,131,521 71,877,472db x-trackers S&P 500® Equal Weight UCITS (DR) 26,021,765 14,183,901db x-trackers MSCI World Index UCITS ETF (DR) 30,307,752 9,594,135db x-trackers MSCI World Minimum Volatility UCITS ETF (DR) 526,463 784,969db-x trackers MSCI World Momentum Factor UCITS ETF (DR) 212,214 190,232db x-trackers MSCI World Quality Factor UCITS ETF (DR) 823,908 254,259db x-trackers MSCI World Value Factor UCITS ETF (DR) 1,684,122 979,583Deutsche MSCI World Index Fund 61,428 425,922db x-trackers FTSE All-World ex UK UCITS ETF (DR) 54,330 103,169db x-trackers S&P 500 UCITS ETF (DR) 21,641,034 10,193,964db x-trackers Russell 2000 UCITS ETF (DR) 37,142,400 6,346,938db x-trackers Russell Midcap UCITS ETF (DR) 3,547,061 1,635,170db x-trackers JPX-Nikkei 400 UCITS ETF (DR) 17,571,302 9,255,520db x-trackers MSCI World Health Care Index UCITS ETF (DR) 268,852 271,391db x-trackers MSCI World Financials Index UCITS ETF (DR) 2,240,601 1,146,094db x-trackers MSCI World Information Technology Index UCITS ETF (DR) 1,254,772 672,617db x-trackers MSCI World Utilities Index UCITS ETF (DR) 73,243 -db x-trackers MSCI World Energy Index UCITS ETF (DR) 1,837,656 2,008,790db x-trackers MSCI World Consumer Staples Index UCITS ETF (DR) 2,003,177 141,242db x-trackers MSCI World Consumer Discretionary Index UCITS ETF (DR) 2,756,804 319,354db x-trackers iBoxx EUR Corporates Yield Plus UCITS ETF (DR) 274,559 -db x-trackers MSCI EMU Minimum Volatility UCITS ETF (DR) 165,807 -db x-trackers MSCI Emerging Markets Index UCITS ETF (DR) 1,837,181 -Total 319,389,259 149,909,195
15. Exchange rates
The following exchange rates at the financial year end have been used in this report.
There were no soft commission arrangements in existence during the financial year under review.
17. Net Asset Value per Unit
The NAV at which unitholders may subscribe or redeem (i.e. the "dealing NAV") may differ from the NAVdisclosed in the financial statements due to a difference in the Valuation Date as per the prospectus and thefinancial year end date. In line with the Prospectus, the final 2017 Valuation Date for the Funds was28 December 2017. As these Financial Statements were prepared to 31 December 2017, all transactionswhich occurred on these Sub-Funds between their respective final 2017 Valuation Date and 31 December2017 have been accounted for in these Financial Statements and the Sub-Funds’ investments have been fairvalued using the last traded market prices available as of 31 December 2017. All assets and liabilities notdenominated in the relevant base currency of a Fund were converted to the relevant base currency using therelevant exchange rate as of 31 December 2017. The NAV and NAV per unit as disclosed in this note is thatof the financial year end date for the Funds.
PIANO 400 Fund1
31/12/2017 31/12/2016 31/12/2015Net Asset Value per financial statements - EUR 486,830,345 EUR 500,051,895Number of redeemable participating shares in issue Class A - 4,993,209 4,993,209Net Asset Value per redeemable participating shares Class A - EUR 97.50 EUR 100.15
1PIANO 400 Fund terminated on 18 August 2017.
db x-trackers EUR Liquid Corporate 12.5 UCITS ETF1
31/12/2017 31/12/2016 31/12/2015Net Asset Value per financial statements EUR 291,205,633 EUR 363,859,644 EUR 253,588,478Number of redeemable participating shares in issue Class 1C 1,081,892 1,421,719 1,082,928Net Asset Value per redeemable participating shares Class 1C EUR 269.16 EUR 255.93 EUR 234.17
Net Asset Value per financial statements - - EUR 1,096,592Number of redeemable participating shares in issue Class 2C -Interest Rate Hedged - - 10,000Net Asset Value per redeemable participating shares Class 2C -Interest Rate Hedged - - EUR 109.66
1db x-trackers EUR Liquid Corporate 12.5 UCITS ETF Class 2C - Interest Rate Hedged closed on 31 May 2016.
db x-trackers Portfolio Income UCITS ETF31/12/2017 31/12/2016 31/12/2015
Net Asset Value per financial statements EUR 29,518,371 EUR 23,307,677 EUR 28,196,789Number of redeemable participating shares in issue Class 1D 2,504,305 2,003,444 2,504,305Net Asset Value per redeemable participating shares Class 1D EUR 11.79 EUR 11.63 EUR 11.26
db x-trackers Stiftungs-Stabilität UCITS ETF1
31/12/2017 31/12/2016 31/12/2015Net Asset Value per financial statements - - EUR 5,301,086Number of redeemable participating shares in issue Class 1D - - 500,905Net Asset Value per redeemable participating shares Class 1D - - EUR 10.58
1db x-trackers Stiftungs-Stabilität UCITS ETF terminated on 27 June 2016.
db x-trackers MSCI Nordic Index UCITS ETF (DR)31/12/2017 31/12/2016 31/12/2015
Net Asset Value per financial statements EUR 283,708,091 EUR 85,729,407 EUR 58,382,453Number of redeemable participating shares in issue Class 1D 8,229,380 2,689,380 1,790,000Net Asset Value per redeemable participating shares Class 1D EUR 34.48 EUR 31.88 EUR 32.62
CONCEPT FUND SOLUTIONS PLC
Notes to the Financial Statements for the financial year ended 31 December 2017 cont/d
655
17. Net Asset Value per Unit cont/d
db x-trackers MSCI Turkey Index UCITS ETF (DR)1
31/12/2017 31/12/2016 31/12/2015Net Asset Value per financial statements - - USD 6,655,567Number of redeemable participating shares in issue Class 1D - - 350,000Net Asset Value per redeemable participating shares Class 1D - - USD 19.02
1db x-trackers MSCI Turkey Index UCITS ETF (DR) terminated on 27 June 2016.
Net Asset Value per financial statements EUR 94,952,106 EUR 50,244,800 EUR 45,562,948Number of redeemable participating shares in issue Class 1D 3,720,000 2,550,000 2,400,000Net Asset Value per redeemable participating shares Class 1D EUR 25.52 EUR 19.70 EUR 18.98
db x-trackers MSCI North America High Dividend Yield Index UCITS ETF (DR)31/12/2017 31/12/2016 31/12/2015
Net Asset Value per financial statements USD 157,645,781 USD 117,871,866 USD 98,312,836Number of redeemable participating shares in issue Class 1C 4,668,000 4,148,000 4,018,000Net Asset Value per redeemable participating shares Class 1C USD 33.77 USD 28.42 USD 24.47
db x-trackers MSCI AC World Index UCITS ETF (DR)31/12/2017 31/12/2016 31/12/2015
Net Asset Value per financial statements EUR 188,650,524 EUR 137,712,717 EUR 141,572,674Number of redeemable participating shares in issue Class 1C 9,950,000 7,900,000 9,000,000Net Asset Value per redeemable participating shares Class 1C EUR 18.96 EUR 17.43 EUR 15.73
db x-trackers MSCI AC Far East ex Japan Index UCITS ETF (DR)31/12/2017 31/12/2016 31/12/2015
Net Asset Value per financial statements EUR 23,537,405 EUR 18,947,477 EUR 17,183,006Number of redeemable participating shares in issue Class 2C -Currency Hedged 1,480,000 1,480,000 1,480,000Net Asset Value per redeemable participating shares Class 2C -Currency Hedged EUR 15.90 EUR 12.80 EUR 11.61
db x-trackers MSCI USA Index UCITS ETF (DR)31/12/2017 31/12/2016 31/12/2015
Net Asset Value per financial statements USD 4,173,279,381 USD 1,951,345,829 USD 1,749,590,271Number of redeemable participating shares in issue Class 1C 59,012,000 33,516,000 33,404,000Net Asset Value per redeemable participating shares Class 1C USD 70.72 USD 58.22 USD 52.38
Net Asset Value per financial statements USD 579,026,721 USD 430,318,889 USD 358,322,080Number of redeemable participating shares in issue Class 1C 11,613,226 10,205,226 9,699,226Net Asset Value per redeemable participating shares Class 1C USD 49.86 USD 42.17 USD 36.94
db x-trackers MSCI World Index UCITS ETF (DR)1
31/12/2017 31/12/2016 31/12/2015Net Asset Value per financial statements USD 2,694,667,445 USD 1,493,625,306 USD 836,479,202Number of redeemable participating shares in issue Class 1C 45,495,943 30,897,387 18,621,146Net Asset Value per redeemable participating shares Class 1C USD 59.23 USD 48.34 USD 44.92
Net Asset Value per financial statements USD 591,883,867 USD 338,156,955 USD 186,427,352Number of redeemable participating shares in issue Class 1D 10,385,349 7,127,465 4,139,406Net Asset Value per redeemable participating shares Class 1D USD 56.99 USD 47.44 USD 45.04
Net Asset Value per financial statements GBP 14,008,103 - -Number of redeemable participating shares in issue Class 2D -GBP Hedged 1,000,000 - -Net Asset Value per redeemable participating shares Class 2D -GBP Hedged GBP 14.01 - -
1db x-trackers MSCI World Index UCITS ETF (DR) Class 2D - GBP Hedged launched on 31 July 2017.
db x-trackers FTSE Developed Europe ex UK Property UCITS ETF (DR)31/12/2017 31/12/2016 31/12/2015
Net Asset Value per financial statements EUR 38,045,988 EUR 92,024,711 EUR 200,916,486Number of redeemable participating shares in issue Class 1C 685,000 1,920,000 4,390,000Net Asset Value per redeemable participating shares Class 1C EUR 55.54 EUR 47.93 EUR 45.77
CONCEPT FUND SOLUTIONS PLC
Notes to the Financial Statements for the financial year ended 31 December 2017 cont/d
656
17. Net Asset Value per Unit cont/d
db x-trackers MSCI World Minimum Volatility UCITS ETF (DR)31/12/2017 31/12/2016 31/12/2015
Net Asset Value per financial statements USD 51,695,825 USD 65,810,400 USD 32,473,679Number of redeemable participating shares in issue Class 1C 1,775,000 2,650,000 1,400,000Net Asset Value per redeemable participating shares Class 1C USD 29.12 USD 24.83 USD 23.20
Net Asset Value per financial statements USD 105,473,268 USD 32,911,164 USD 53,514,008Number of redeemable participating shares in issue Class 1C 3,400,000 1,400,000 2,400,000Net Asset Value per redeemable participating shares Class 1C USD 31.02 USD 23.51 USD 22.30
db x-trackers MSCI World Quality Factor UCITS ETF (DR)31/12/2017 31/12/2016 31/12/2015
Net Asset Value per financial statements USD 100,914,272 USD 43,424,013 USD 27,032,993Number of redeemable participating shares in issue Class 1C 2,925,000 1,550,000 1,050,000Net Asset Value per redeemable participating shares Class 1C USD 34.50 USD 28.02 USD 25.75
db x-trackers MSCI World Value Factor UCITS ETF (DR)31/12/2017 31/12/2016 31/12/2015
Net Asset Value per financial statements USD 203,266,479 USD 169,687,984 USD 73,308,838Number of redeemable participating shares in issue Class 1C 6,175,000 6,300,000 3,050,000Net Asset Value per redeemable participating shares Class 1C USD 32.92 USD 26.93 USD 24.04
Deutsche MSCI World Index Fund31/12/2017 31/12/2016 31/12/2015
Net Asset Value per financial statements EUR 33,771,368 EUR 110,698,676 EUR 88,290,647Number of redeemable participating shares in issue Class 1D 723,181 2,498,911 2,166,861Net Asset Value per redeemable participating shares Class 1D EUR 46.70 EUR 44.30 EUR 40.75
db x-trackers MSCI GCC Select Index UCITS ETF31/12/2017 31/12/2016 31/12/2015
Net Asset Value per financial statements USD 23,887,709 USD 47,005,833 USD 42,178,783Number of redeemable participating shares in issue Class 1C 1,663,476 3,385,115 3,280,137Net Asset Value per redeemable participating shares Class 1C USD 14.36 USD 13.89 USD 12.86
db x-trackers FTSE All-World ex UK UCITS ETF (DR)31/12/2017 31/12/2016 31/12/2015
Net Asset Value per financial statements GBP 28,666,604 GBP 33,692,897 GBP 32,552,238Number of redeemable participating shares in issue Class 1C 543,392 723,392 903,392Net Asset Value per redeemable participating shares Class 1C GBP 52.75 GBP 46.58 GBP 36.03
db x-trackers S&P 500 UCITS ETF (DR)31/12/2017 31/12/2016 31/12/2015
Net Asset Value per financial statements EUR 545,968,987 EUR 314,558,336 EUR 220,774,601Number of redeemable participating shares in issue Class 1C -EUR Hedged 13,243,501 9,063,501 6,973,501Net Asset Value per redeemable participating shares Class 1C -EUR Hedged EUR 41.23 EUR 34.71 EUR 31.66
Net Asset Value per financial statements GBP 542,193,691 GBP 197,337,227 GBP 11,638,917Number of redeemable participating shares in issue Class 2C -GBP Hedged 12,030,496 5,240,496 340,496Net Asset Value per redeemable participating shares Class 2C -GBP Hedged GBP 45.07 GBP 37.66 GBP 34.18
Net Asset Value per financial statements CHF 10,767,711 CHF 1,322,179 CHF 1,214,804Number of redeemable participating shares in issue Class 3C - CHFHedged 374,450 54,450 54,450Net Asset Value per redeemable participating shares Class 3C -CHF Hedged CHF 28.76 CHF 24.28 CHF 22.31
CONCEPT FUND SOLUTIONS PLC
Notes to the Financial Statements for the financial year ended 31 December 2017 cont/d
657
17. Net Asset Value per Unit cont/d
db x-trackers Russell 2000 UCITS ETF (DR)1
31/12/2017 31/12/2016 31/12/2015Net Asset Value per financial statements USD 622,782,445 USD 462,865,221 USD 399,195,022Number of redeemable participating shares in issue Class 1C 2,946,157 2,496,157 2,592,843Net Asset Value per redeemable participating shares Class 1C USD 211.39 USD 185.43 USD 153.96
Net Asset Value per financial statements - - USD 4,236,711Number of redeemable participating shares in issue Class 2C - - 275Net Asset Value per redeemable participating shares Class 2C - - USD 15,406.22
1db x-trackers Russell 2000 UCITS ETF (DR) Class 2C closed on 16 December 2016.
db x-trackers Russell Midcap UCITS ETF (DR)31/12/2017 31/12/2016 31/12/2015
Net Asset Value per financial statements USD 142,472,610 USD 126,324,449 USD 135,412,532Number of redeemable participating shares in issue Class 1C 6,240,808 6,515,808 7,890,808Net Asset Value per redeemable participating shares Class 1C USD 22.83 USD 19.39 USD 17.16
db x-trackers JPX-Nikkei 400 UCITS ETF (DR)31/12/2017 31/12/2016 31/12/2015
Net Asset Value per financial statements JPY 17,464,244,810 JPY 13,647,450,356 JPY 13,322,737,658Number of redeemable participating shares in issue Class 1D 10,428,703 9,568,703 9,186,898Net Asset Value per redeemable participating shares Class 1D JPY 1,674.63 JPY 1,426.26 JPY 1,450.19
Net Asset Value per financial statements GBP 17,404,029 GBP 14,791,708 GBP 24,813,626Number of redeemable participating shares in issue Class 2D -GBP Hedged 1,073,829 1,073,829 1,733,829Net Asset Value per redeemable participating shares Class 2D -GBP Hedged GBP 16.21 GBP 13.77 GBP 14.31
Net Asset Value per financial statements EUR 107,212,666 EUR 55,176,929 EUR 18,128,091Number of redeemable participating shares in issue Class 3C -EUR Hedged 6,445,355 3,955,355 1,265,400Net Asset Value per redeemable participating shares Class 3C -EUR Hedged EUR 16.63 EUR 13.95 EUR 14.33
Net Asset Value per financial statements USD 80,106,151 USD 41,934,983 USD 2,947,034Number of redeemable participating shares in issue Class 4C -USD Hedged 4,645,000 2,955,000 205,000Net Asset Value per redeemable participating shares Class 4C -USD Hedged USD 17.25 USD 14.19 USD 14.38
Net Asset Value per financial statements GBP 23,551,049 GBP 16,436,790 GBP 18,692,478Number of redeemable participating shares in issue Class 1D 1,871,243 1,421,200 1,800,000Net Asset Value per redeemable participating shares Class 1D GBP 12.59 GBP 11.57 GBP 10.38
db x-trackers USD Corporate Bond UCITS ETF (DR)1
31/12/2017 31/12/2016 31/12/2015Net Asset Value per financial statements USD 615,858,165 USD 510,478,644 USD 29,793,812Number of redeemable participating shares in issue Class 1D 40,797,219 35,081,772 2,175,000Net Asset Value per redeemable participating shares Class 1D USD 15.10 USD 14.55 USD 13.70
Net Asset Value per financial statements EUR 230,655,498 EUR 140,106,495 -Number of redeemable participating shares in issue Class 2D -EUR Hedged 15,675,740 9,826,804 -Net Asset Value per redeemable participating shares Class 2D -EUR Hedged EUR 14.71 EUR 14.26 -
1db x-trackers USD Corporate Bond UCITS ETF (DR) Class 2D - EUR Hedged launched on 29 February 2016.
Net Asset Value per financial statements EUR 27,032,717 EUR 15,625,358 EUR 7,985,438Number of redeemable participating shares in issue Class 1D 1,293,223 740,000 390,000Net Asset Value per redeemable participating shares Class 1D EUR 20.90 EUR 21.12 EUR 20.48
CONCEPT FUND SOLUTIONS PLC
Notes to the Financial Statements for the financial year ended 31 December 2017 cont/d
658
17. Net Asset Value per Unit cont/d
db x-trackers MSCI World Health Care Index UCITS ETF (DR)1
31/12/2017 31/12/2016Net Asset Value per financial statements USD 252,426,478 USD 249,165,909Number of redeemable participating shares in issue Class 1C 8,395,527 9,915,527Net Asset Value per redeemable participating shares Class 1C USD 30.07 USD 25.13
1db x-trackers MSCI World Health Care Index UCITS ETF (DR) launched on 4 March 2016.
db x-trackers MSCI World Financials Index UCITS ETF (DR)1
31/12/2017 31/12/2016Net Asset Value per financial statements USD 437,061,336 USD 215,031,286Number of redeemable participating shares in issue Class 1C 22,065,753 13,315,753Net Asset Value per redeemable participating shares Class 1C USD 19.81 USD 16.15
1db x-trackers MSCI World Financials Index UCITS ETF (DR) launched on 4 March 2016.
db x-trackers MSCI World Energy Index UCITS ETF (DR)1
31/12/2017 31/12/2016Net Asset Value per financial statements USD 350,740,857 USD 112,849,467Number of redeemable participating shares in issue Class 1C 10,274,918 3,474,918Net Asset Value per redeemable participating shares Class 1C USD 34.14 USD 32.48
1db x-trackers MSCI World Energy Index UCITS ETF (DR) launched on 9 March 2016.
db x-trackers MSCI World Consumer Staples Index UCITS ETF (DR)1
31/12/2017 31/12/2016Net Asset Value per financial statements USD 151,119,611 USD 58,379,422Number of redeemable participating shares in issue Class 1C 4,381,417 1,981,417Net Asset Value per redeemable participating shares Class 1C USD 34.49 USD 29.46
1db x-trackers MSCI World Consumer Staples Index UCITS ETF (DR) launched on 9 March 2016.
db x-trackers MSCI World Information Technology Index UCITS ETF (DR)1
31/12/2017 31/12/2016Net Asset Value per financial statements USD 237,633,853 USD 172,196,943Number of redeemable participating shares in issue Class 1C 9,383,748 9,383,748Net Asset Value per redeemable participating shares Class 1C USD 25.32 USD 18.35
1db x-trackers MSCI World Information Technology Index UCITS ETF (DR) launched on 9 March 2016.
db x-trackers MSCI World Industrials Index UCITS ETF (DR)1
31/12/2017 31/12/2016Net Asset Value per financial statements USD 40,103,317 USD 26,623,662Number of redeemable participating shares in issue Class 1C 1,122,073 932,073Net Asset Value per redeemable participating shares Class 1C USD 35.74 USD 28.56
1db x-trackers MSCI World Industrials Index UCITS ETF (DR) launched on 14 March 2016.
db x-trackers MSCI World Consumer Discretionary Index UCITS ETF (DR)1
31/12/2017 31/12/2016Net Asset Value per financial statements USD 180,171,586 USD 118,962,303Number of redeemable participating shares in issue Class 1C 5,857,672 4,777,672Net Asset Value per redeemable participating shares Class 1C USD 30.76 USD 24.90
1db x-trackers MSCI World Consumer Discretionary Index UCITS ETF (DR) launched on 14 March 2016.
db x-trackers MSCI World Utilities Index UCITS ETF (DR)1
31/12/2017 31/12/2016Net Asset Value per financial statements USD 10,435,321 USD 7,169,722Number of redeemable participating shares in issue Class 1C 458,433 358,433Net Asset Value per redeemable participating shares Class 1C USD 22.76 USD 20.00
1db x-trackers MSCI World Utilities Index UCITS ETF (DR) launched on 16 March 2016.
db x-trackers MSCI World Telecom Services Index UCITS ETF (DR)1
31/12/2017 31/12/2016Net Asset Value per financial statements USD 62,950,718 USD 22,832,494Number of redeemable participating shares in issue Class 1C 4,969,807 1,909,808Net Asset Value per redeemable participating shares Class 1C USD 12.67 USD 11.96
1db x-trackers MSCI World Telecom Services Index UCITS ETF (DR) launched on 16 March 2016.
CONCEPT FUND SOLUTIONS PLC
Notes to the Financial Statements for the financial year ended 31 December 2017 cont/d
659
17. Net Asset Value per Unit cont/d
db x-trackers MSCI World Materials Index UCITS ETF (DR)1
31/12/2017 31/12/2016Net Asset Value per financial statements USD 20,922,671 USD 11,262,645Number of redeemable participating shares in issue Class 1C 522,173 362,173Net Asset Value per redeemable participating shares Class 1C USD 40.07 USD 31.10
1db x-trackers MSCI World Materials Index UCITS ETF (DR) launched on 16 March 2016.
31/12/2017 31/12/2016Net Asset Value per financial statements USD 45,398,802 USD 35,336,296Number of redeemable participating shares in issue Class 1D 3,359,979 2,730,000Net Asset Value per redeemable participating shares Class 1D USD 13.51 USD 12.94
Net Asset Value per financial statements EUR 33,458,320 -Number of redeemable participating shares in issue Class 2D - EUR Hedged 2,501,173 -Net Asset Value per redeemable participating shares Class 2D - EUR Hedged EUR 13.38 -
1db x-trackers iBoxx USD Emerging Sovereigns Quality Weighted UCITS ETF (DR) Class 2D - EUR Hedged launched on 31 July 2017.
2db x-trackers iBoxx USD Emerging Sovereigns Quality Weighted UCITS ETF (DR) launched on 4 April 2016.
db x-trackers iBoxx EUR Corporates Yield Plus UCITS ETF (DR)1
31/12/2017 31/12/2016Net Asset Value per financial statements EUR 234,144,847 EUR 24,710,172Number of redeemable participating shares in issue Class 1D 14,470,000 1,588,000Net Asset Value per redeemable participating shares Class 1D EUR 16.18 EUR 15.56
1db x-trackers iBoxx EUR Corporates Yield Plus UCITS ETF (DR) launched on 7 June 2016.
db x-trackers MSCI USA Minimum Volatility UCITS ETF (DR)1
31/12/2017 31/12/2016Net Asset Value per financial statements USD 8,604,225 USD 5,268,311Number of redeemable participating shares in issue Class 1D 255,000 185,000Net Asset Value per redeemable participating shares Class 1D USD 33.74 USD 28.48
1db x-trackers MSCI USA Minimum Volatility UCITS ETF (DR) launched on 8 November 2016.
db x-trackers MSCI EMU Minimum Volatility UCITS ETF (DR)1
31/12/2017 31/12/2016Net Asset Value per financial statements EUR 46,681,117 EUR 5,311,527Number of redeemable participating shares in issue Class 1D 1,755,000 225,000Net Asset Value per redeemable participating shares Class 1D EUR 26.60 EUR 23.61
1db x-trackers MSCI EMU Minimum Volatility UCITS ETF (DR) launched on 8 November 2016.
db x-trackers MSCI Emerging Markets Index UCITS ETF (DR)1
31/12/2017Net Asset Value per financial statements USD 784,925,021Number of redeemable participating shares in issue Class 1C 15,073,000Net Asset Value per redeemable participating shares Class 1C USD 52.07
1db x-trackers MSCI Emerging Markets Index UCITS ETF (DR) launched on 21 June 2017.
db x-trackers MSCI USA Consumer Discretionary Index UCITS ETF (DR)1
31/12/2017Net Asset Value per financial statements USD 6,614,949Number of redeemable participating shares in issue Class 1D 190,000Net Asset Value per redeemable participating shares Class 1D USD 34.82
1db x-trackers MSCI USA Consumer Discretionary Index UCITS ETF (DR) launched on 12 September 2017.
db x-trackers MSCI USA Consumer Staples Index UCITS ETF (DR)1
31/12/2017Net Asset Value per financial statements USD 5,045,988Number of redeemable participating shares in issue Class 1D 160,000Net Asset Value per redeemable participating shares Class 1D USD 31.54
1db x-trackers MSCI USA Consumer Staples Index UCITS ETF (DR) launched on 12 September 2017.
CONCEPT FUND SOLUTIONS PLC
Notes to the Financial Statements for the financial year ended 31 December 2017 cont/d
660
17. Net Asset Value per Unit cont/d
db x-trackers MSCI USA Energy Index UCITS ETF (DR)1
31/12/2017Net Asset Value per financial statements USD 5,590,803Number of redeemable participating shares in issue Class 1D 150,000Net Asset Value per redeemable participating shares Class 1D USD 37.27
1db x-trackers MSCI USA Energy Index UCITS ETF (DR) launched on 12 September 2017.
db x-trackers MSCI USA Financials Index UCITS ETF (DR)1
31/12/2017Net Asset Value per financial statements USD 144,777,153Number of redeemable participating shares in issue Class 1D 7,000,000Net Asset Value per redeemable participating shares Class 1D USD 20.68
1db x-trackers MSCI USA Financials Index UCITS ETF (DR) launched on 12 September 2017.
db x-trackers MSCI USA Health Care Index UCITS ETF (DR)1
31/12/2017Net Asset Value per financial statements USD 4,910,829Number of redeemable participating shares in issue Class 1D 150,000Net Asset Value per redeemable participating shares Class 1D USD 32.74
1db x-trackers MSCI USA Health Care Index UCITS ETF (DR) launched on 12 September 2017.
db x-trackers MSCI USA Information Technology Index UCITS ETF (DR)1
31/12/2017Net Asset Value per financial statements USD 6,837,242Number of redeemable participating shares in issue Class 1D 240,000Net Asset Value per redeemable participating shares Class 1D USD 28.49
1db x-trackers MSCI USA Information Technology Index UCITS ETF (DR) launched on 12 September 2017.
18. Significant events during the financial year
The Company launched Class 2D GBP Hedged for db x-trackers MSCI World Index Fund UCITS ETF (DR)and Class 2D - EUR Hedged for db x-trackers iBoxx USD Emerging Sovereigns Quality Weighted UCITS ETF(DR) on 31 July 2017.
db x-trackers MSCI Emerging Markets Index UCITS ETF (DR) changed its investment objective and added anew "4C - USD Hedged" share class on 24 February 2017.
The following sub-funds launched during the financial year as follows:
db x-trackers MSCI Emerging Markets Index UCITS ETF (DR) - 21 June 2017;
db x-trackers MSCI USA Consumer Discretionary Index UCITS ETF (DR), db x-trackers MSCI USA ConsumerStaples Index UCITS ETF (DR), db x-trackers MSCI USA Energy Index UCITS ETF (DR), db x-trackers MSCIUSA Financials Index UCITS ETF (DR), db x-trackers MSCI USA Health Care Index UCITS ETF (DR) and dbx-trackers MSCI USA Information Technology Index UCITS ETF (DR) - 12 September 2017.
db x-trackers Barclays USD Corporate Bond UCITS ETF (DR) changed its name into db x-trackers USDCorporate Bond UCITS ETF (DR) on 9 June 2017.
PIANO 400 Fund terminated on 18 August 2017.
Deutsche Beta Plus European Equity Fund was revoked on 13 September 2017.
On 23 February 2017 there was a shareholder notice issued for the Portfolio Income UCITS ETF Fund notinga change in sub-investment manager in 2017. The Board of Directors has resolved that Deutsche InternationalCorporate Services (Ireland) Limited (the “Investment Manager”) will appoint DeAM GmbH as thesub-investment manager (the “Sub-Investment Manager”) of the Fund.
During the financial year ended 31 December 2017 the following funds have changed its Management Feeand Fixed Fee rates and Total Expense Ratio:
CONCEPT FUND SOLUTIONS PLC
Notes to the Financial Statements for the financial year ended 31 December 2017 cont/d
661
18. Significant events during the financial year cont/d
FundManagement
Fee
PreviousManagement
FeeFixed
Fee
PreviousFixed
Fee TERPrevious
TERdb x-trackers MSCI AC World Index UCITS ETF (DR) 0.20% 0.30% 0.20% 0.20% 0.40% 0.50%db x-trackers FTSE Developed Europe ex UK Property UCITS ETF(DR)
0.13% 0.20% 0.20% 0.20% 0.33% 0.40%
db x-trackers S&P 500 UCITS ETF (DR) (CHF) 0.10% 0.15% 0.10% 0.15% 0.20% 0.30%db x-trackers S&P 500 UCITS ETF (DR) (EUR) 0.10% 0.15% 0.10% 0.15% 0.20% 0.30%db x-trackers S&P 500 UCITS ETF (DR) (GBP) 0.10% 0.15% 0.10% 0.15% 0.20% 0.30%db x-trackers Russell 2000 UCITS ETF (DR) 0.15% 0.30% 0.15% 0.15% 0.30% 0.45%db x-trackers USD Corporate Bond UCITS ETF (DR) (USD) 0.06% 0.10% 0.10% 0.10% 0.16% 0.20%db x-trackers USD Corporate Bond UCITS ETF (DR) (EUR) 0.11% 0.15% 0.10% 0.10% 0.21% 0.25%db x-trackers MSCI World Health Care Index UCITS ETF (DR) 0.15% 0.30% 0.15% 0.15% 0.30% 0.45%db x-trackers MSCI World Financials Index UCITS ETF (DR) 0.15% 0.30% 0.15% 0.15% 0.30% 0.45%db x-trackers MSCI World Energy Index UCITS ETF (DR) 0.15% 0.30% 0.15% 0.15% 0.30% 0.45%db x-trackers MSCI World Consumer Staples Index UCITS ETF(DR)
0.15% 0.30% 0.15% 0.15% 0.30% 0.45%
db x-trackers MSCI World Information Technology Index UCITSETF (DR)
0.15% 0.30% 0.15% 0.15% 0.30% 0.45%
db x-trackers MSCI World Industrials Index UCITS ETF (DR) 0.15% 0.30% 0.15% 0.15% 0.30% 0.45%db x-trackers MSCI World Consumer Discretionary Index UCITSETF (DR)
0.15% 0.30% 0.15% 0.15% 0.30% 0.45%
db x-trackers MSCI World Utilities Index UCITS ETF (DR) 0.15% 0.30% 0.15% 0.15% 0.30% 0.45%db x-trackers MSCI World Telecom Services Index UCITS ETF(DR)
0.15% 0.30% 0.15% 0.15% 0.30% 0.45%
db x-trackers MSCI World Materials Index UCITS ETF (DR) 0.15% 0.30% 0.15% 0.15% 0.30% 0.45%db x-trackers MSCI Emerging Markets Index UCITS ETF (DR) 0.10% - 0.10% - 0.20% -db x-trackers MSCI USA Consumer Discretionary Index UCITS ETF(DR)
0.02% - 0.10% - 0.12% -
db x-trackers MSCI USA Consumer Staples Index UCITS ETF (DR) 0.02% - 0.10% - 0.12% -db x-trackers MSCI USA Energy Index UCITS ETF (DR) 0.02% - 0.10% - 0.12% -db x-trackers MSCI USA Financials Index UCITS ETF (DR) 0.02% - 0.10% - 0.12% -db x-trackers MSCI USA Health Care Index UCITS ETF (DR) 0.02% - 0.10% - 0.12% -db x-trackers MSCI USA Information Technology Index UCITS ETF(DR)
0.02% - 0.10% - 0.12% -
The following distribution were paid during the financial year ended 31 December 2017:
Fund Class Ex- Date Rate per unit Total Amountdb x-trackers Portfolio Income UCITS ETF Class 1D 10 April 2017 EUR 0.1332 EUR 333,573db x-trackers MSCI Nordic Index UCITS ETF (DR) Class 1D 10 April 2017 EUR 0.8436 EUR 2,100,041db x-trackers Mittelstand & MidCap Germany UCITS ETF(DR)
Class 1D 10 April 2017 EUR 0.2425 EUR 727,500
db x-trackers MSCI World Index UCITS ETF (DR) Class 1D 10 April 2017 USD 0.9835 USD 8,288,586Deutsche MSCI World Index Fund Class 1D 10 April 2017 EUR 0.7911 EUR 613,034db x-trackers JPX-Nikkei 400 UCITS ETF (DR) Class 1D 10 April 2017 JPY 30.2521 JPY 289,473,360db x-trackers JPX-Nikkei 400 UCITS ETF (DR) Class 2D - GBP Hedge 10 April 2017 GBP 0.2690 GBP 288,860db x-trackers FTSE 100 Equal Weight UCITS ETF (DR) Class 1D 10 April 2017 GBP 0.4216 GBP 620,276db x-trackers USD Corporate Bond UCITS ETF (DR) Class 1D 10 April 2017 USD 0.4670 USD 13,303,586db x-trackers USD Corporate Bond UCITS ETF (DR) Class 2D 10 April 2017 EUR 0.2508 EUR 2,340,395db x-trackers iBoxx Eurozone Sovereigns Quality WeightedUCITS ETF (DR)
Class 1D 10 April 2017 EUR 0.1209 EUR 144,744
db x-trackers iBoxx USD Emerging Sovereigns QualityWeighted UCITS ETF (DR)
Class 1D 10 April 2017 USD 0.4480 USD 1,473,922
Investment manager changed from Deutsche International Corporate Services (Ireland) Limited to DeutscheAsset Management S.A. effective 15 December 2017.
The Company updated its Prospectus and Supplements on 15 December 2017.
There were no other significant events during the financial year.
19. Significant events after the financial year end
The following distributions have been paid since the financial year end:
Fund Class Ex-Date Rate per UnitXtrackers JPX-Nikkei 400 UCITS ETF Class 1D 9 April 2018 JPY 17.8919Xtrackers JPX-Nikkei 400 UCITS ETF 2D - GBP Hedged 9 April 2018 GBP 0.2107Xtrackers FTSE 100 Equal Weight UCITS ETF Class 1D 9 April 2018 GBP 0.3163Xtrackers Germany Mittelstand & MidCap UCITS ETF Class 1D 9 April 2018 EUR 0.1558Xtrackers MSCI Nordic UCITS ETF Class 1D 9 April 2018 EUR 0.3427
CONCEPT FUND SOLUTIONS PLC
Notes to the Financial Statements for the financial year ended 31 December 2017 cont/d
662
19. Significant events after the financial year end cont/d
Fund Class Ex-Date Rate per UnitXtrackers MSCI World Index Fund Class 1D - Core 9 April 2018 EUR 0.9330Xtrackers Portfolio Income UCITS ETF Class 1D 9 April 2018 EUR 0.0717Xtrackers USD Corporate Bond UCITS ETF Class 2D - EUR Hedged 9 April 2018 EUR 0.3419Xtrackers USD Corporate Bond UCITS ETF Class 1D 9 April 2018 USD 0.4186Xtrackers USD Emerging Markets Bond Quality Weighted UCITS ETF Class 1D 9 April 2018 USD 0.4198Xtrackers USD Emerging Markets Bond Quality Weighted UCITS ETF Class 2D - EUR Hedged 9 April 2018 EUR 0.1568Xtrackers Eurozone Government Bond Quality Weighted UCITS ETF Class 1D 9 April 2018 EUR 0.1270Xtrackers iBoxx EUR Corporate Bond Yield Plus UCITS ETF Class 1D 9 April 2018 EUR 0.1136Xtrackers MSCI EMU Minimum Volatility UCITS ETF Class 1D 9 April 2018 EUR 0.1693Xtrackers MSCI USA Consumer Discretionary UCITS ETF Class 1D 9 April 2018 USD 0.2152Xtrackers MSCI USA Consumer Staples UCITS ETF Class 1D 9 April 2018 USD 0.2395Xtrackers MSCI USA Energy UCITS ETF Class 1D 9 April 2018 USD 0.2310Xtrackers MSCI USA Financials UCITS ETF Class 1D 9 April 2018 USD 0.1259Xtrackers MSCI USA Health Care UCITS ETF Class 1D 9 April 2018 USD 0.2019Xtrackers MSCI USA Information Technology UCITS ETF Class 1D 9 April 2018 USD 0.1759Xtrackers MSCI USA Minimum Volatility UCITS ETF Class 1D 9 April 2018 USD 0.4559Xtrackers MSCI World UCITS ETF Class 1D 9 April 2018 USD 0.7722Xtrackers MSCI World UCITS ETF Class 1D 9 April 2018 GBP 0.1224
On 16 February 2018 Concept Fund Solutions Public Limited Company having, by a Special Resolution of theCompany, and with the approval of the Registrar of Companies, changed its name, is now incorporated as alimited company under the name Xtrackers (IE) Public Limited Company.
The changes of name referenced are approved by the Central Bank.
The Company updated its Prospectus and Supplements on 16 February 2018.
On 2 January 2018, the Board of Directors of the Company convened its Shareholders to an extraordinarygeneral meeting of shareholders of the Company (the “EGM”), which was held on 26 January 2018 at theregistered office of the Company. The agenda of the EGM was a full restatement of the Company’s Articles ofIncorporation (the “Articles”) mainly to change the name of the Company from “Concept Fund Solutions plc”to “Xtrackers IE - plc” so that the relevant changes took effect from 16 February 2018. Subject to the passingof the relevant resolutions by the Shareholders, the Board of Directors resolved to amend the names of eachof the Sub-Funds of the Company, as detailed in the relevant notice which was published onwww.xtrackers.com on 2 January 2018. In particular, the removal of the reference to “(DR)” in the name of allDirect Replication Funds, which designated the Direct Investment Policy of the relevant Sub-Funds and,where appropriate, the addition of a reference to ”Swap” in the name of all Indirect Replication Funds todesignate the Indirect Investment Policy of those Sub-Funds. There were no changes in the applicableinvestment policies of the Sub-Funds, but rather the changes simply reflected a change in the namingconvention applicable to the Direct Replication Funds and the Indirect Replication Funds.
Previous Fund/Share class name New Fund/Share class namedb x-trackers EUR Liquid Corporate 12.5 UCITS ETF 1C Xtrackers EUR Credit 12.5 Swap UCITS ETF 1Cdb x-trackers FTSE 100 Equal Weight UCITS ETF (DR)1D
Xtrackers FTSE 100 Equal Weight UCITS ETF 1D
db x-trackers FTSE All-World ex UK UCITS ETF (DR) 1C Xtrackers FTSE All-World ex UK UCITS ETF 1Cdb x-trackers FTSE Developed Europe Ex UK PropertyUCITS ETF (DR) 1C
Xtrackers FTSE Developed Europe ex UK RealEstate UCITS ETF 1C
db x-trackers iBoxx EUR Corporates Yield Plus UCITSETF (DR) 1D
Xtrackers iBoxx EUR Corporate Bond Yield PlusUCITS ETF 1D
db x-trackers iBoxx Eurozone Sovereigns QualityWeighted UCITS ETF (DR) 1D
Xtrackers Eurozone Government Bond QualityWeighted UCITS ETF 1D
db x-trackers MSCI AC Far East ex Japan Index UCITSETF (DR) 2C
Xtrackers MSCI AC Far East ex Japan UCITSETF 2C
db x-trackers MSCI AC World Index UCITS ETF (DR) 1C Xtrackers MSCI AC World UCITS ETF 1Cdb x-trackers MSCI Emerging Markets Index UCITS ETF(DR) 1C
Xtrackers MSCI Emerging Markets UCITS ETF1C
db x-trackers MSCI EMU Minimum Volatility UCITS ETF(DR) 1D
Xtrackers MSCI EMU Minimum Volatility UCITSETF 1D
db x-trackers MSCI GCC Select Index UCITS ETF 1C Xtrackers MSCI GCC Select Swap UCITS ETF1C
db x-trackers MSCI Nordic Index UCITS ETF (DR) 1D Xtrackers MSCI Nordic UCITS ETF 1Ddb x-trackers MSCI North America High Dividend YieldIndex UCITS ETF (DR) 1C
Xtrackers MSCI North America High DividendYield UCITS ETF 1C
db x-trackers MSCI USA Consumer Discretionary IndexUCITS ETF (DR) 1D
Xtrackers MSCI USA Consumer DiscretionaryUCITS ETF 1D
db x-trackers MSCI USA Consumer Staples Index UCITSETF (DR) 1D
Xtrackers MSCI USA Consumer Staples UCITSETF 1D
db x-trackers MSCI USA Energy Index UCITS ETF (DR)1D
Xtrackers MSCI USA Energy UCITS ETF 1D
db x-trackers MSCI USA Financials Index UCITS ETF(DR) 1D
Xtrackers MSCI USA Financials UCITS ETF 1D
db x-trackers MSCI USA Health Care Index UCITS ETF(DR) 1D
Xtrackers MSCI USA Health Care UCITS ETF 1D
db x-trackers MSCI USA Index UCITS ETF (DR) 1C Xtrackers MSCI USA UCITS ETF 1Cdb x-trackers MSCI USA Information Technology IndexUCITS ETF (DR) 1D
Xtrackers MSCI USA Information TechnologyUCITS ETF 1D
db x-trackers MSCI USA Minimum Volatility UCITS ETF(DR) 1D
Xtrackers MSCI USA Minimum Volatility UCITSETF 1D
db x-trackers MSCI World Consumer Discretionary IndexUCITS ETF (DR) 1C
Xtrackers MSCI World Consumer DiscretionaryUCITS ETF 1C
db x-trackers MSCI World Consumer Staples IndexUCITS ETF (DR) 1C
Xtrackers MSCI World Consumer Staples UCITSETF 1C
db x-trackers MSCI World Energy Index UCITS ETF (DR)1C
Xtrackers MSCI World Energy UCITS ETF 1C
db x-trackers MSCI World Financials Index UCITS ETF(DR) 1C
Xtrackers MSCI World Financials UCITS ETF 1C
db x-trackers MSCI World Health Care Index UCITS ETF(DR) 1C
Xtrackers MSCI World Health Care UCITS ETF1C
db x-trackers MSCI World Index UCITS ETF (DR) 1C Xtrackers MSCI World UCITS ETF 1Cdb x-trackers MSCI World Index UCITS ETF (DR) 1D Xtrackers MSCI World UCITS ETF 1Ddb x-trackers MSCI World Index UCITS ETF (DR) 2D Xtrackers MSCI World UCITS ETF 2D - GBP
Hedgeddb x-trackers MSCI World Industrials Index UCITS ETF(DR) 1C
Xtrackers MSCI World Industrials UCITS ETF 1C
db x-trackers MSCI World Information Technology IndexUCITS ETF (DR) 1C
Xtrackers MSCI World Information TechnologyUCITS ETF 1C
db x-trackers MSCI World Materials Index UCITS ETF(DR) 1C
Xtrackers MSCI World Materials UCITS ETF 1C
db x-trackers MSCI World Minimum Volatility UCITS ETF(DR) 1C
Xtrackers MSCI World Minimum Volatility UCITSETF 1C
db x-trackers MSCI World Momentum Factor UCITS ETF(DR) 1C
Xtrackers MSCI World Momentum UCITS ETF 1C
CONCEPT FUND SOLUTIONS PLC
Notes to the Financial Statements for the financial year ended 31 December 2017 cont/d
664
19. Significant events after the financial year end cont/d
Previous Fund/Share class name New Fund/Share class namedb x-trackers MSCI World Quality Factor UCITS ETF (DR)1C
Xtrackers MSCI World Quality UCITS ETF 1C
db x-trackers MSCI World Telecom Services Index UCITSETF (DR) 1C
Xtrackers MSCI World Telecom Services UCITSETF 1C
db x-trackers MSCI World Utilities Index UCITS ETF (DR)1C
Xtrackers MSCI World Utilities UCITS ETF 1C
db x-trackers MSCI World Value Factor UCITS ETF (DR)1C
db x-trackers USD Corporate Bond UCITS ETF (DR) 1D Xtrackers USD Corporate Bond UCITS ETF 1Ddb x-trackers USD Corporate Bond UCITS ETF (DR) 2D Xtrackers USD Corporate Bond UCITS ETF 2D -
EUR Hedgeddb x-trackers USD High Yield Corporate Bond UCITS ETF(DR) 1D
Xtrackers USD High Yield Corporate Bond UCITSETF 1D
Deutsche MSCI World Index Fund 1D - Core Xtrackers MSCI World Index Fund 1D - Core
The db Lifecycle 2016, db x-trackers Global Fund Supporters UCITS ETF (DR), db x-trackers STOXX®Europe Christian UCITS ETF (DR), db x-trackers Stiftungs-Stabilität UCITS ETF, db x-trackers MSCI TurkeyIndex UCITS ETF (DR) and PIANO 400 Fund are also in existence but are closed to further subscriptions. TheDirectors have formally applied, or intend to apply once annual audited accounts disclosing a zero net assetvalue are available, to the Central Bank to withdraw the approval of the above mentioned sub-funds.
The Company appointed Deutsche Asset Management S.A. ("DeAM SA") as a UCITS management companyto the Company. This appointment was approved by the Central Bank on 16 February 2018 and reflected in theupdated Prospectus and Supplements of the Company.
DeAM SA appointed Deutsche Asset Management Investment GmbH and Deutsche Asset Management(UK) Limited as the investment managers of the Company. This change was effective from 16 February 2018also.
On 14 February 2018, the Company notified Shareholders of Xtrackers USD Emerging Markets Bond QualityWeighted UCITS ETF, Xtrackers USD Corporate Bond UCITS ETF, Xtrackers JPX-Nikkei 400 UCITS ETF,Xtrackers MSCI World UCITS ETF and Xtrackers S&P 500 UCITS ETF of changes proposed to the currencyhedging model utilised by these funds following the adoption by the Central Bank of the ESMA opinion inrelation to UCITS share classes (ESMA34-43-296). The new currency hedging model will be implemented vianotification on the Company’s website no earlier than 16 March 2018 and no later than 30 July 2018, andSupplements for the relevant funds shall be updated accordingly.
There were no other significant events after the financial year end.
20. Approval of the financial statements
The financial statements were approved by the Directors on 17 April 2018.
CONCEPT FUND SOLUTIONS PLC
Notes to the Financial Statements for the financial year ended 31 December 2017 cont/d
665
A. Portfolio changes for the financial year ended 31 December 2017
db x-trackers EUR Liquid Corporate 12.5 UCITS ETF
Cumulative Purchases in excess of 1 percent of total value ofpurchases for the financial year
A. Portfolio changes for the financial year ended 31 December 2017 cont/d
db x-trackers Portfolio Income UCITS ETF
Total Purchases for the financial year* Cost EURdb x-trackers iBoxx EUR Corporates Yield Plus UCITS ETF (DR) 1,996,962db x-trackers Stoxx Europe 600 UCITS ETF (DR) 1,427,791db x-trackers II EUR Corporate Bond UCITS ETF (DR) 1,103,473db x-trackers II iBoxx Germany Covered UCITS ETF 1,007,361db x-trackers USD Corporate Bond UCITS ETF (DR) 912,227db x-trackers II Eurozone Inflation-Linked Bond UCITS ETF (DR) 839,139db x-trackers iBoxx USD Emerging Sovereigns Quality Weighted UCITS ETF (DR) 743,101db x-trackers MSCI Europe Small Cap Index UCITS ETF (DR) 655,719db x-trackers Stoxx Global Select Dividend 100 UCITS ETF 597,825db x-trackers MSCI Emerging Markets Index UCITS ETF (DR) 257,838db x-trackers Russell 2000 UCITS ETF (DR) 169,545db x-trackers Stoxx Global Select Dividend 100 UCITS ETF 168,396db x-trackers MSCI World Value Factor UCITS ETF (DR) 145,301db x-trackers MSCI World Quality Factor UCITS ETF (DR) 133,018
Total Sales for the financial year* Proceeds EURdb x-trackers II iBoxx Germany Covered UCITS ETF 2,070,943db x-trackers Stoxx Europe 600 UCITS ETF (DR) 1,027,116db x-trackers MSCI World Value Factor UCITS ETF (DR) 334,530db x-trackers Stoxx Global Select Dividend 100 UCITS ETF 295,325db x-trackers MSCI Emerging Markets Index UCITS ETF (DR) 147,024db x-trackers II EUR Corporate Bond UCITS ETF (DR) 139,269db x-trackers Russell 2000 UCITS ETF (DR) 134,379db x-trackers II iBoxx Sovereigns Eurozone Yield Plus UCITS ETF 79,043db x-trackers iBoxx EUR Corporates Yield Plus UCITS ETF (DR) 75,918db x-trackers MSCI World Quality Factor UCITS ETF (DR) 70,962db x-trackers MSCI Europe Small Cap Index UCITS ETF (DR) 67,839db x-trackers II Eurozone Inflation-Linked Bond UCITS ETF (DR) 41,957db x-trackers USD Corporate Bond UCITS ETF (DR) 9,096db x-trackers iBoxx USD Emerging Sovereigns Quality Weighted UCITS ETF (DR) 7,331
* There were no other purchases or sales during the financial year.
CONCEPT FUND SOLUTIONS PLC
Supplemental Data (Unaudited) cont/d
667
A. Portfolio changes for the financial year ended 31 December 2017 cont/d
db x-trackers MSCI Nordic Index UCITS ETF (DR)
Cumulative Purchases in excess of 1 percent of total value of purchases for the financial year Cost EURNovo Nordisk 22,488,220Nordea Bank 9,452,469Nokia 7,940,974Danske Bank 7,338,562Volvo 6,900,102Atlas Copco Class A Shares 6,781,038Sampo 5,961,412Swedbank 5,555,448Hennes & Mauritz 5,552,614Statoil 5,533,764Svenska Handelsbanken 5,402,320Assa Abloy 5,359,934Investor 5,322,104Telefonaktiebolaget LM Ericsson 5,254,657Sandvik 4,804,588Skandinaviska Enskilda Banken 4,560,507DNB 4,392,838Vestas Wind Systems 4,391,105Kone 4,339,498UPM-Kymmene 3,923,125Telenor 3,642,875Atlas Copco Class B Shares 3,518,617DSV 3,262,900Hexagon 3,056,782Carlsberg 3,002,331AP Moller - Maersk Class B Shares 2,936,635Telia 2,919,058Novozymes 2,852,353Orsted 2,819,031Pandora 2,791,837Genmab 2,761,308Essity 2,659,478Coloplast 2,456,123Wartsila 2,307,840
CONCEPT FUND SOLUTIONS PLC
Supplemental Data (Unaudited) cont/d
668
A. Portfolio changes for the financial year ended 31 December 2017 cont/d
db x-trackers MSCI Nordic Index UCITS ETF (DR) cont/d
Cumulative Sales in excess of 1 percent of total value of sales for the financial year Proceeds EURNovo Nordisk 3,796,393Nordea Bank 1,380,467Nokia 1,168,076Svenska Cellulosa 1,131,733Danske Bank 961,118Statoil 958,536Atlas Copco Class A Shares 944,427Volvo 942,782Hennes & Mauritz 897,525Sampo 855,471Swedbank 851,355Svenska Handelsbanken 818,236Assa Abloy 767,152Investor 755,724Vestas Wind Systems 750,057Telefonaktiebolaget LM Ericsson 710,501Skandinaviska Enskilda Banken 681,815DNB 656,681Sandvik 646,451Kone 628,061Pandora 550,139UPM-Kymmene 546,686Telenor 538,800Atlas Copco Class B Shares 495,766Schibsted 469,376DSV 460,421Novozymes 442,211Hexagon 441,408AP Moller - Maersk Class B Shares 437,831Telia 432,966Carlsberg 424,370Genmab 416,185Essity 405,214SKF 376,677Coloplast 351,368
CONCEPT FUND SOLUTIONS PLC
Supplemental Data (Unaudited) cont/d
669
A. Portfolio changes for the financial year ended 31 December 2017 cont/d
db x-trackers Mittelstand & MidCap Germany UCITS ETF (DR)
Cumulative Purchases in excess of 1 percent of total value of purchases for the financial year Cost EURProSiebenSat.1 Media 3,081,938Covestro 2,421,710United Internet 2,329,775Innogy 2,309,064MTU Aero Engines 2,061,689Uniper 2,028,298LANXESS 1,922,101Hella & Co 1,593,826OSRAM Licht 1,570,193CECONOMY 1,559,969Evonik Industries 1,413,164Fuchs Petrolub 1,377,875KION Group 1,359,781Zalando 1,359,393K+S 1,330,423Wirecard 1,285,853Hugo Boss 1,283,751Schaeffler 1,254,414Freenet 1,162,298Rheinmetall 1,150,399Scout24 1,147,529Telefonica Deutschland Holding 1,110,195Metro 1,096,367Axel Springer 1,081,224MAN 1,009,246Siltronic 998,843Hapag-Lloyd 970,723Wacker Chemie 962,056Duerr 896,454Sartorius 881,573Fraport Frankfurt Airport Services Worldwide 861,711Fielmann 860,508STADA Arzneimittel 831,476Hochtief 829,430Rational 814,043Jungheinrich 764,155Software 747,091CTS Eventim & Co 746,188Aurubis 706,681Krones 670,378Gerresheimer 659,463
CONCEPT FUND SOLUTIONS PLC
Supplemental Data (Unaudited) cont/d
670
A. Portfolio changes for the financial year ended 31 December 2017 cont/d
db x-trackers Mittelstand & MidCap Germany UCITS ETF (DR) cont/d
Cumulative Sales in excess of 1 percent of total value of sales for the financial year Proceeds EURWirecard 4,411,529STADA Arzneimittel 2,109,232United Internet 1,423,885Drillisch 1,338,961MTU Aero Engines 1,232,698LANXESS 1,176,314OSRAM Licht 1,008,913Fuchs Petrolub 870,930Evonik Industries 858,382CECONOMY 853,214Hugo Boss 822,914K+S 816,876KION Group 801,348Covestro 783,299Rheinmetall 727,684Sartorius 711,329Freenet 706,589MAN 627,625Zalando 613,156Wacker Chemie 608,915Hochtief 549,843Fraport Frankfurt Airport Services Worldwide 542,998Fielmann 537,909Duerr 536,598Suedzucker 475,946Aurubis 443,865Axel Springer 435,506Krones 426,576Telefonica Deutschland Holding 425,287Gerresheimer 379,471CTS Eventim & Co 377,386
CONCEPT FUND SOLUTIONS PLC
Supplemental Data (Unaudited) cont/d
671
A. Portfolio changes for the financial year ended 31 December 2017 cont/d
db x-trackers MSCI North America High Dividend Yield Index UCITS ETF (DR)
Cumulative Purchases in excess of 1 percent of total value of purchases for the financial year Cost USDChevron 4,785,488Amgen 2,801,110Exxon Mobil 2,375,129Bristol-Myers Squibb 2,194,465Gilead Sciences 2,120,415Microsoft 1,656,226CVS Health 1,650,424Johnson & Johnson 1,599,312Dow Chemical 1,400,098Procter & Gamble 1,145,106AT&T 1,100,950Pfizer 996,299CME Group 961,767Coca-Cola 893,757Philip Morris International 869,957Manulife Financial 836,967Merck & Co 832,764BB&T 823,341Intel 808,706PepsiCo 780,668Cisco Systems 763,717Dowdupont 674,072Boeing 637,509SunTrust Banks 626,900International Business Machines 616,276McDonald's 603,123Altria Group 594,302Wal-Mart Stores 581,263AbbVie 568,963
Cumulative Sales in excess of 1 percent of total value of sales for the financial year Proceeds USDMicrosoft 1,998,953Southern 1,274,184Reynolds American 1,173,143Procter & Gamble 993,781AT&T 988,171Pfizer 977,484Johnson & Johnson 892,343Coca-Cola 842,898Intel 835,303Analog Devices 800,486Merck & Co 754,411Cisco Systems 748,599Philip Morris International 744,606PepsiCo 735,318Boeing 702,814McDonald's 676,609Wal-Mart Stores 663,022International Business Machines 653,617Altria Group 644,172Exxon Mobil 595,058AbbVie 587,199Enbridge 553,802Royal Bank of Canada 504,744ONEOK 460,139Xilinx 439,258Potash of Saskatchewan 417,164QUALCOMM 393,266Lockheed Martin 358,462Amgen 356,574Eli Lilly & Co 354,530
CONCEPT FUND SOLUTIONS PLC
Supplemental Data (Unaudited) cont/d
672
A. Portfolio changes for the financial year ended 31 December 2017 cont/d
db x-trackers MSCI AC World Index UCITS ETF (DR)
Largest Twenty Purchases for the financial year Cost EURApple 1,930,376Microsoft 1,320,756Amazon.com 977,568Facebook 939,397Johnson & Johnson 869,358Exxon Mobil 849,907JPMorgan Chase & Co 836,333Alphabet Class C Shares 733,542Alphabet Class A Shares 715,021Wells Fargo & Co 653,633Nestle 650,999Bank of America 629,001Berkshire Hathaway 575,743General Electric 569,127AT&T 568,291Procter & Gamble 557,282Tencent Holdings 534,101Samsung Electronics 530,208Pfizer 515,488Chevron 511,358
Largest Twenty Sales for the financial year Proceeds EURApple 1,330,413Microsoft 815,533Facebook 584,090Amazon.com 581,677Johnson & Johnson 554,842JPMorgan Chase & Co 513,374Exxon Mobil 464,684Alphabet Class C Shares 432,648Nestle 412,922Alphabet Class A Shares 405,660Wells Fargo & Co 376,249Bank of America 366,895Procter & Gamble 355,056Tencent Holdings 353,393AT&T 340,780General Electric 340,014Samsung Electronics 334,108Berkshire Hathaway 316,384Home Depot 315,082Pfizer 305,237
CONCEPT FUND SOLUTIONS PLC
Supplemental Data (Unaudited) cont/d
673
A. Portfolio changes for the financial year ended 31 December 2017 cont/d
db x-trackers MSCI AC Far East ex Japan Index UCITS ETF (DR)
Cumulative Purchases in excess of 1 percent of total value of purchases for the financial year Cost EURJardine Strategic Holdings 51,875SillaJen 30,822Alibaba Group Holding 29,119Golden Resorts Group 28,067Momo 24,389Tencent Holdings 21,039Kingboard Chemical Holdings 20,521Samsung Electronics 18,368Win Semiconductors 17,970Minth Group 16,648Macronix International 15,908Celltrion Healthcare 15,325Winbond Electronics 14,964CITIC 14,520Airtac International Group 14,291Netmarble Games 14,130China Resources Pharmaceutical Group 13,921Globalwafers 13,885Autohome 13,308China Huarong Asset Management 12,600China Molybdenum 12,564Taiwan Semiconductor Manufacturing 12,471Agile Group Holdings 12,104Medy-Tox 11,613Alliance Global Group 11,426CIMB Group Holdings 11,340
Largest Twenty Sales for the financial year Proceeds EURSamsung Electronics 41,421SK Holdings 21,003Bank Central Asia 20,283Tencent Holdings 20,063Taiwan Semiconductor Manufacturing 16,196China Evergrande Group 15,234LG Uplus 14,627Jardine Matheson Holdings 14,090Globalwafers 11,246Cathay Pacific Airways 10,790IHH Healthcare 10,471Yum China Holdings 9,293BDO Unibank 9,179AIA Group 8,233Industrial & Commercial Bank of China 8,117China Construction Bank 7,906China Mobile 7,873Wharf Holdings 7,550Lippo Karawaci 6,460Bank of China 6,186
CONCEPT FUND SOLUTIONS PLC
Supplemental Data (Unaudited) cont/d
674
A. Portfolio changes for the financial year ended 31 December 2017 cont/d
db x-trackers MSCI USA Index UCITS ETF (DR)
Largest Twenty Purchases for the financial year Cost USDApple 81,446,424Microsoft 53,892,130Amazon.com 40,997,037Facebook 38,122,327Exxon Mobil 36,455,962Johnson & Johnson 36,269,559JPMorgan Chase & Co 33,549,123Alphabet Class C Shares 29,806,885Alphabet Class A Shares 28,944,779Wells Fargo & Co 27,237,762Bank of America 25,730,486AT&T 24,789,975General Electric 23,770,973Procter & Gamble 23,631,674Berkshire Hathaway 23,467,029Chevron 21,730,490Pfizer 21,243,380Verizon Communications 20,474,607Home Depot 19,502,326Comcast 18,613,684
Largest Twenty Sales for the financial year Proceeds USDApple 24,296,916Microsoft 14,036,819Johnson & Johnson 9,692,865Amazon.com 9,532,310JPMorgan Chase & Co 9,420,898Facebook 9,302,156Reynolds American 9,189,006Exxon Mobil 8,889,208Yahoo 7,257,517Wells Fargo & Co 7,207,112Alphabet Class C Shares 7,138,562General Electric 6,849,401Alphabet Class A Shares 6,843,101Bank of America 6,809,639Procter & Gamble 6,160,842Citigroup 6,112,202AT&T 6,094,450Home Depot 5,922,221Pfizer 5,842,605Chevron 5,612,287
CONCEPT FUND SOLUTIONS PLC
Supplemental Data (Unaudited) cont/d
675
A. Portfolio changes for the financial year ended 31 December 2017 cont/d
db x-trackers S&P 500® Equal Weight UCITS ETF (DR)
Largest Twenty Purchases for the financial year Cost USDIncyte 1,797,910Advanced Micro Devices 1,636,376DISH Network 1,592,640Regency Centers 1,394,490Everest Re Group 1,366,335IDEXX Laboratories 1,361,307Gartner 1,338,891IQVIA Holdings 1,321,206Raymond James Financial 1,307,714IHS Markit 1,297,756ResMed 1,278,253Alexandria Real Estate Equities 1,261,968Cboe Global Markets 1,250,503Synopsys 1,233,672Norwegian Cruise Line Holdings 1,233,614Duke Realty 1,227,341Range Resources 1,225,415Envision Healthcare 1,214,593MGM Resorts International 1,201,709Packaging of America 1,167,317
Largest Twenty Sales for the financial year Proceeds USDLevel 3 Communications 1,399,113Yahoo 1,303,738Mallinckrodt 1,253,964Reynolds American 1,244,593EI du Pont de Nemours & Co 1,189,310NRG Energy 1,158,662Murphy Oil 1,130,180Southwestern Energy 1,126,204AutoNation 1,104,931Transocean 1,080,194Linear Technology 1,061,235Teradata 1,058,628Dun & Bradstreet 1,048,793Vertex Pharmaceuticals 1,035,493NVIDIA 986,713Micron Technology 970,278First Solar 967,475Ryder System 965,845Enbridge 924,345Bed Bath & Beyond 911,860
CONCEPT FUND SOLUTIONS PLC
Supplemental Data (Unaudited) cont/d
676
A. Portfolio changes for the financial year ended 31 December 2017 cont/d
db x-trackers MSCI World Index UCITS ETF (DR)
Largest Twenty Purchases for the financial year Cost USDApple 28,650,162Microsoft 19,162,241Amazon.com 14,997,958Facebook 13,902,358Exxon Mobil 12,635,548Johnson & Johnson 12,567,608JPMorgan Chase & Co 11,944,506Alphabet Class C Shares 10,739,149Alphabet Class A Shares 10,319,069Wells Fargo & Co 9,463,444Bank of America 9,047,260Nestle 8,832,132Berkshire Hathaway 8,587,438AT&T 8,487,132Procter & Gamble 7,998,925Chevron 7,691,651General Electric 7,271,465Pfizer 7,192,910Verizon Communications 6,996,667UnitedHealth Group 6,724,153
Largest Twenty Sales for the financial year Proceeds USDApple 8,192,939Microsoft 4,442,325Amazon.com 3,345,560Yahoo 3,321,317Johnson & Johnson 3,306,407Syngenta 3,220,092Exxon Mobil 3,198,258JPMorgan Chase & Co 3,168,596Facebook 3,043,602Alphabet Class C Shares 2,484,372Alphabet Class A Shares 2,401,161Wells Fargo & Co 2,307,727Nestle 2,167,101Bank of America 2,159,746General Electric 2,128,840Actelion 2,063,229AT&T 2,045,612Procter & Gamble 2,022,434Chevron 1,983,577Berkshire Hathaway 1,810,298
CONCEPT FUND SOLUTIONS PLC
Supplemental Data (Unaudited) cont/d
677
A. Portfolio changes for the financial year ended 31 December 2017 cont/d
db x-trackers FTSE Developed Europe ex UK Property UCITS ETF (DR)
Cumulative Purchases in excess of 1 percent of total value of purchases for the financial year Cost EURUnibail-Rodamco 2,601,189Vonovia 2,098,034Deutsche Wohnen 1,966,764Klepierre 1,168,647Swiss Prime Site 1,038,733Unibail-Rodamco 1,014,957Gecina 893,772LEG Immobilien 800,677Allreal Holding 683,300Fonciere Des Regions 680,866Castellum 632,170BUWOG 604,475Merlin Properties Socimi 581,643PSP Swiss Property 535,352Hemfosa Fastigheter 451,495ICADE 396,590TLG Immobilien 379,786Retail Estates 370,113Cofinimmo 366,202Inmobiliaria Colonial Socimi 361,596Fastighets Balder 348,813Fabege 345,008Eurocommercial Properties 329,497Deutsche EuroShop 328,887Grand City Properties 315,763TAG Immobilien 305,857Kungsleden 295,469Wereldhave 271,602Pandox 265,126Hufvudstaden 262,495Wallenstam 260,411
CONCEPT FUND SOLUTIONS PLC
Supplemental Data (Unaudited) cont/d
678
A. Portfolio changes for the financial year ended 31 December 2017 cont/d
db x-trackers FTSE Developed Europe ex UK Property UCITS ETF (DR) cont/d
Cumulative Sales in excess of 1 percent of total value of sales for the financial year Proceeds EURVonovia 9,330,252Unibail-Rodamco 7,970,941Deutsche Wohnen 7,102,985Klepierre 4,630,570Gecina 3,587,137Swiss Prime Site 3,296,785LEG Immobilien 3,226,508Merlin Properties Socimi 2,284,418Castellum 2,245,023Fonciere Des Regions 2,119,879PSP Swiss Property 2,025,781ICADE 1,603,843BUWOG 1,577,888Cofinimmo 1,450,420Fabege 1,389,891Fastighets Balder 1,281,787TAG Immobilien 1,215,641Inmobiliaria Colonial Socimi 1,182,156Allreal Holding 1,165,849Grand City Properties 1,133,379Wereldhave 1,065,409Wallenstam 1,058,859Deutsche EuroShop 1,055,693Eurocommercial Properties 1,047,060Hufvudstaden 1,038,524Alstria Office 1,032,861Sponda 1,028,338Unibail-Rodamco 1,025,658Warehouses De Pauw 1,012,050CA Immobilien Anlagen 966,523Mobimo Holding 960,248Conwert Immobilien Invest 908,976
CONCEPT FUND SOLUTIONS PLC
Supplemental Data (Unaudited) cont/d
679
A. Portfolio changes for the financial year ended 31 December 2017 cont/d
db x-trackers MSCI World Minimum Volatility UCITS ETF (DR)
Largest Twenty Purchases for the financial year Cost USDNorthrop Grumman 642,081Lockheed Martin 537,579Dell Technologies 481,352Reynolds American 396,280Raytheon 382,771CR Bard 296,229Fiserv 294,512Partners Group Holding 279,166Jack Henry & Associates 266,346Charter Communications 263,030Stryker 240,363Monsanto 238,405Comcast 218,044Altria Group 214,609Coca-Cola 188,814Keyence 188,278Amphenol 185,438Harris 179,325Time Warner 174,735Athene Holding 169,169
Largest Twenty Sales for the financial year Proceeds USDAutomatic Data Processing 816,480AT&T 711,083Recruit Holdings 698,826CR Bard 565,650Paychex 510,757General Mills 506,555Verizon Communications 504,397Johnson & Johnson 504,067Reynolds American 463,529McDonald's 430,534Southern 428,706AutoZone 415,939Becton Dickinson & Co 411,236PG&E 390,069Roche Holding 385,348Nestle 374,092Consolidated Edison 372,697Procter & Gamble 371,973Dell Technologies 361,588Stryker 358,621
CONCEPT FUND SOLUTIONS PLC
Supplemental Data (Unaudited) cont/d
680
A. Portfolio changes for the financial year ended 31 December 2017 cont/d
db-x trackers MSCI World Momentum Factor UCITS ETF (DR)
Largest Twenty Purchases for the financial year Cost USDApple 4,815,300JPMorgan Chase & Co 3,307,380Bank of America 2,991,394Microsoft 2,896,367Facebook 2,270,805Berkshire Hathaway 2,122,228Visa 2,103,815Boeing 1,888,302Home Depot 1,850,224Citigroup 1,830,918Comcast 1,823,112Amazon.com 1,816,141Mastercard 1,701,874Intel 1,666,401AbbVie 1,614,936McDonald's 1,551,738UnitedHealth Group 1,387,5093M 1,370,308PayPal Holdings 1,197,668NVIDIA 1,081,004
Largest Twenty Sales for the financial year Proceeds USDHSBC Holdings 1,848,102Comcast 1,687,497Johnson & Johnson 1,423,814Bank of America 1,134,999British American Tobacco 1,101,037Procter & Gamble 1,086,214Siemens 1,005,725SAP 891,178Charter Communications 888,902JPMorgan Chase & Co 815,760Union Pacific 763,916Unilever 719,187Goldman Sachs Group 716,158BP 703,669Banco Santander 689,731Amazon.com 653,242Costco Wholesale 620,408Home Depot 618,027Unilever 567,519Royal Dutch Shell 540,260
CONCEPT FUND SOLUTIONS PLC
Supplemental Data (Unaudited) cont/d
681
A. Portfolio changes for the financial year ended 31 December 2017 cont/d
db x-trackers MSCI World Quality Factor UCITS ETF (DR)
Largest Twenty Purchases for the financial year Cost USDMicrosoft 1,982,481Johnson & Johnson 1,951,174Altria Group 1,871,543Apple 1,836,554Exxon Mobil 1,782,492Roche Holding 1,264,306AIA Group 1,228,118British American Tobacco 1,202,575Chevron 1,052,532Total 1,034,171International Business Machines 975,6693M 969,458Bristol-Myers Squibb 921,863NVIDIA 905,555Starbucks 842,352Diageo 825,029Kimberly-Clark 796,605Priceline Group 788,269Unilever - Netherlands listing 730,377NIKE 711,295
Largest Twenty Sales for the financial year Proceeds USDExxon Mobil 1,419,812Berkshire Hathaway 1,363,961British American Tobacco 1,115,721AXA 1,044,203PepsiCo 835,849Apple 801,675Microsoft 786,576EI du Pont de Nemours & Co 631,391Johnson & Johnson 598,976Boeing 543,000Swiss Re 528,573Kimberly-Clark 497,635Total 449,587Japan Tobacco 403,859Schlumberger 388,733Public Service Enterprise Group 384,808Roche Holding 373,721Prudential 359,732McKesson 298,428Sysco 271,440
CONCEPT FUND SOLUTIONS PLC
Supplemental Data (Unaudited) cont/d
682
A. Portfolio changes for the financial year ended 31 December 2017 cont/d
db x-trackers MSCI World Value Factor UCITS ETF (DR)
Largest Twenty Purchases for the financial year Cost USDIntel 2,403,696CVS Health 2,354,296Cisco Systems 2,207,740Pfizer 2,158,421Wal-Mart Stores 2,038,342Toyota Motor 1,841,930International Business Machines 1,825,734Gilead Sciences 1,593,900Allergan 1,425,881Citigroup 1,413,713Sanofi 1,332,885Micron Technology 1,245,116Bank of America 1,243,280HSBC Holdings 1,216,374AT&T 1,204,773Shire 1,172,856Mitsubishi UFJ Financial Group 1,052,229Walgreens Boots Alliance 1,045,522Total 1,014,221Royal Dutch Shell Class A Shares 1,011,933
Largest Twenty Sales for the financial year Proceeds USDBank of America 4,937,474Wal-Mart Stores 2,543,065Toyota Motor 2,043,098Cisco Systems 2,011,603Intel 1,943,529Pfizer 1,904,540Archer-Daniels-Midland 1,772,638Royal Dutch Shell Class A Shares 1,594,256Allianz 1,520,353Gilead Sciences 1,432,205International Business Machines 1,295,399BP 1,290,390Goldman Sachs Group 1,275,905Citigroup 1,242,260Total 1,185,721Sanofi 1,183,067Koninklijke Ahold Delhaize 1,142,239Royal Dutch Shell Class B Shares 1,142,149AT&T 1,092,070General Motors 1,087,477
CONCEPT FUND SOLUTIONS PLC
Supplemental Data (Unaudited) cont/d
683
A. Portfolio changes for the financial year ended 31 December 2017 cont/d
Deutsche MSCI World Index Fund
Largest Twenty Purchases for the financial year Cost EURExxon Mobil 70,567Citizens Financial Group 46,550ServiceNow 45,939British American Tobacco 45,140Red Hat 44,730Berkshire Hathaway 43,404Southern 42,812Procter & Gamble 41,353Oracle 36,895Microsoft 35,891NVIDIA 35,800Pfizer 35,243Liberty Global 34,655Regeneron Pharmaceuticals 33,324Johnson & Johnson 33,257Apple 33,099Amazon.com 32,045Royal Dutch Shell Class A Shares 31,122Costco Wholesale 30,851Beiersdorf 29,843
Largest Twenty Sales for the financial year Proceeds EURApple 1,633,902Microsoft 1,081,507Exxon Mobil 819,676Amazon.com 811,711Johnson & Johnson 721,737Facebook 699,831JPMorgan Chase & Co 692,512General Electric 624,658Wells Fargo & Co 602,447AT&T 597,011Alphabet Class C Shares 563,070Alphabet Class A Shares 539,790Procter & Gamble 532,481Nestle 528,742Bank of America 523,800Berkshire Hathaway 474,280Chevron 471,966Pfizer 449,915Verizon Communications 440,285Comcast 423,226
CONCEPT FUND SOLUTIONS PLC
Supplemental Data (Unaudited) cont/d
684
A. Portfolio changes for the financial year ended 31 December 2017 cont/d
db x-trackers MSCI GCC Select Index UCITS ETF
Cumulative Purchases in excess of 1 percent of total value of purchases for the financial year Cost USDABN Amro Group 1,322,056Seven & I Holdings 1,320,105ING Groep 1,318,625Wolters Kluwer 1,299,136Umicore 1,299,119Porsche Automobil Holding 854,481Coloplast 752,270Bayerische Motoren Werke 723,482Siemens 712,110Rakuten 709,078Koninklijke Philips 687,609UBS Group 686,766Volkswagen 684,707Koninklijke Ahold Delhaize 681,737Anheuser-Busch InBev 676,613Allianz 676,581SAP 676,519Bayer 670,438Nokia 670,386Deutsche Telekom 670,267Sumitomo Mitsui Financial Group 668,920Mizuho Financial Group 668,857Cie Financiere Richemont 668,854Roche Holding 668,493Deutsche Post 667,937NTT DOCOMO 665,460Kao 664,350Canon 664,345Otsuka Holdings 664,342Japan Tobacco 664,341Bridgestone 664,337ThyssenKrupp 664,335Dentsu 664,329Asahi Group Holdings 664,324Fast Retailing 664,186ABB 661,810SoftBank Group 661,795Hochtief 660,223Mitsubishi UFJ Financial Group 658,358Vonovia 657,715Koninklijke 657,699Adidas 655,951Dai-ichi Life Holdings 655,791Keyence 655,781Nitori Holdings 655,711Nintendo 655,710Fresenius & Co 652,911Sony 648,719Daimler 646,941E.ON 645,992Deutsche Bank 645,987KDDI 642,478Swedbank 642,337Julius Baer Group 642,324Boliden 642,321Zurich Insurance Group 642,295Muenchener Rueckversicherungs-Gesellschaft 641,965STADA Arzneimittel 641,345ASML Holding 641,338Henkel & Co 641,336Astellas Pharma 638,147Chr Hansen Holding 638,000UPM-Kymmene 634,112Henkel & Co - Preferred Stock 631,578Takeda Pharmaceutical 630,511Beiersdorf 625,083BASF 620,980Toyota Motor 616,225Nippon Telegraph & Telephone 614,092Nestle 600,753HeidelbergCement 595,363Deutsche Wohnen 590,782
CONCEPT FUND SOLUTIONS PLC
Supplemental Data (Unaudited) cont/d
685
A. Portfolio changes for the financial year ended 31 December 2017 cont/d
db x-trackers MSCI GCC Select Index UCITS ETF cont/d
Cumulative Sales in excess of 1 percent of total value of sales for the financial year Proceeds USDING Groep 2,020,866Mitsubishi UFJ Financial Group 1,905,162Swedbank 1,819,867Porsche Automobil Holding 1,776,361UBS Group 1,775,804Allianz 1,743,923Toyota Motor 1,733,762Volkswagen 1,693,942Bayerische Motoren Werke 1,634,735Bayer 1,584,833Deutsche Post 1,559,424Deutsche Telekom 1,545,097Adidas 1,543,105BASF 1,532,034Siemens 1,523,698Umicore 1,523,615SAP 1,490,717ASML Holding 1,485,046Daimler 1,476,826Muenchener Rueckversicherungs-Gesellschaft 1,456,361E.ON 1,398,468Dai-ichi Life Holdings 1,388,899Continental 1,383,911QIAGEN 1,357,632Koninklijke Philips 1,351,355Nokia 1,350,102Fresenius & Co 1,331,493Henkel & Co 1,303,135Zurich Insurance Group 1,249,795Linde 1,241,622Telefonaktiebolaget LM Ericsson 1,237,535ABB 1,218,305Nordea Bank 1,182,664Swiss Re 1,105,425Sampo 1,105,200Assa Abloy 1,101,463Svenska Handelsbanken 1,059,833NEC Corp 1,035,576Novo Nordisk 1,031,802Kintetsu Group Holdings 1,011,107Hennes & Mauritz 942,439Chr Hansen Holding 838,367
CONCEPT FUND SOLUTIONS PLC
Supplemental Data (Unaudited) cont/d
686
A. Portfolio changes for the financial year ended 31 December 2017 cont/d
db x-trackers FTSE All-World ex UK UCITS ETF (DR)
Largest Twenty Purchases for the financial year Cost GBPBerkshire Hathaway 187,113Apple 178,339Microsoft 117,676Amazon.com 116,255Johnson & Johnson 105,224Facebook 95,034Exxon Mobil 84,088Alphabet Class A Shares 82,897Alphabet Class C Shares 81,212JPMorgan Chase & Co 76,316Wells Fargo & Co 68,643General Electric 63,658Alibaba Group Holding 63,483Bank of America 60,541AT&T 59,943Procter & Gamble 54,306Nestle 54,134Chevron 49,681Pfizer 47,938Samsung Electronics 46,149
Largest Twenty Sales for the financial year Proceeds GBPApple 356,066Microsoft 250,861Berkshire Hathaway 192,511Amazon.com 184,327Johnson & Johnson 162,481Exxon Mobil 155,463Facebook 155,452JPMorgan Chase & Co 144,928Alphabet Class A Shares 136,076Alphabet Class C Shares 129,101Wells Fargo & Co 124,977Berkshire Hathaway 123,069Bank of America 112,649Samsung Electronics 112,273Procter & Gamble 110,732Nestle 109,388AT&T 103,443General Electric 100,604Chevron 94,741Tencent Holdings 92,759
CONCEPT FUND SOLUTIONS PLC
Supplemental Data (Unaudited) cont/d
687
A. Portfolio changes for the financial year ended 31 December 2017 cont/d
db x-trackers S&P 500 UCITS ETF (DR)
Largest Twenty Purchases for the financial year Cost USDApple 27,706,567Microsoft 19,894,220Amazon.com 14,318,451Facebook 13,676,218Exxon Mobil 12,648,984Johnson & Johnson 12,491,659Berkshire Hathaway 12,248,980JPMorgan Chase & Co 11,558,542Alphabet Class C Shares 10,147,726Alphabet Class A Shares 10,144,071Wells Fargo & Co 8,744,641Bank of America 8,677,672AT&T 8,538,669Procter & Gamble 8,182,008General Electric 7,965,980Chevron 7,596,413Pfizer 7,287,177Verizon Communications 7,064,438Home Depot 6,664,754UnitedHealth Group 6,631,750
Largest Twenty Sales for the financial year Proceeds USDApple 4,614,917Microsoft 2,683,990Reynolds American 2,681,382Yahoo 2,123,440JPMorgan Chase & Co 1,947,300Amazon.com 1,831,277Facebook 1,765,052Johnson & Johnson 1,744,202Exxon Mobil 1,672,609Berkshire Hathaway 1,626,174Bank of America 1,531,476Procter & Gamble 1,452,729Citigroup 1,426,899Alphabet Class A Shares 1,367,870Alphabet Class C Shares 1,327,092Wells Fargo & Co 1,321,338General Electric 1,230,449Home Depot 1,223,504AT&T 1,172,412Pfizer 1,105,780
CONCEPT FUND SOLUTIONS PLC
Supplemental Data (Unaudited) cont/d
688
A. Portfolio changes for the financial year ended 31 December 2017 cont/d
db x-trackers Russell 2000 UCITS ETF (DR)
Largest Twenty Purchases for the financial year Cost USDBluebird Bio 1,112,072LivaNova 1,062,152LogMeIn 1,002,404Nutanix 950,887Catalent 921,736PRA Health Sciences 878,267Yelp 878,128Cree 873,393Exact Sciences 782,173Starwood Waypoint Homes 778,583Allscripts Healthcare Solutions 775,799MGIC Investment 761,517Encompass Health Corporation 758,622KBR 748,740JELD-WEN Holding 747,977Curtiss-Wright 739,036Gramercy Property Trust 736,232Aspen Technology 727,630GrubHub 725,389Compass Minerals International 723,430
Largest Twenty Sales for the financial year Proceeds USDAdvanced Micro Devices 3,137,720Chemours 2,027,752Take-Two Interactive Software 2,025,725XPO Logistics 1,766,983LogMeIn 1,710,855Coherent 1,708,081Microsemi 1,704,550Exelixis 1,610,895New Residential Investment 1,470,657Olin 1,447,574Webster Financial 1,408,623Dupont Fabros Technology 1,404,657Universal Display 1,397,834Starwood Waypoint Homes 1,395,853Cavium 1,325,848Teledyne Technologies 1,313,854TESARO 1,303,487Prosperity Bancshares 1,300,405FNB 1,275,033Bank of the Ozarks 1,253,792
CONCEPT FUND SOLUTIONS PLC
Supplemental Data (Unaudited) cont/d
689
A. Portfolio changes for the financial year ended 31 December 2017 cont/d
db x-trackers Russell Midcap UCITS ETF (DR)
Largest Twenty Purchases for the financial year Cost USDCardinal Health 525,458Discover Financial Services 468,134DXC Technology 463,029Mylan 432,302Fortive 412,574VF Corp 386,593Willis Towers Watson 383,120IHS Markit 375,525Apache 363,843Yum China Holdings 305,859Dell Technologies 272,384Advanced Micro Devices 245,792ONEOK 236,000CenturyLink 227,241NVIDIA 199,144Take-Two Interactive Software 178,017XPO Logistics 153,563Williams 149,846Sensata Technologies Holding 144,993STERIS 143,719
Largest Twenty Sales for the financial year Proceeds USDNVIDIA 1,796,213Johnson Controls International 906,205Intuitive Surgical 832,886Marriott International 784,246Micron Technology 764,866Equinix 762,106Electronic Arts 750,438St Jude Medical 457,363Level 3 Communications 388,994DXC Technology 223,504Whitewave Foods 216,423American Airlines Group 191,877Marathon Petroleum 165,302FMC Technologies 164,129United Continental Holdings 160,623SunTrust Banks 154,199Synchrony Financial 147,265O'Reilly Automotive 146,667Sprint 141,346Fiserv 135,883
CONCEPT FUND SOLUTIONS PLC
Supplemental Data (Unaudited) cont/d
690
A. Portfolio changes for the financial year ended 31 December 2017 cont/d
db x-trackers JPX-Nikkei 400 UCITS ETF (DR)
Largest Twenty Purchases for the financial year Cost JPYSony 614,358,039Toyota Motor 324,795,885KDDI 324,173,173Keyence 317,749,934Honda Motor 309,396,482Japan Tobacco 292,797,665Nippon Telegraph & Telephone 267,093,133SoftBank Group 265,339,345Mizuho Financial Group 257,134,389Sumitomo Mitsui Financial Group 251,559,321Mitsubishi UFJ Financial Group 251,556,756FANUC 230,184,209Takeda Pharmaceutical 224,096,677Canon 213,507,478NTT DOCOMO 192,590,438Central Japan Railway 192,483,630Shin-Etsu Chemical 190,057,623Hitachi 189,633,324East Japan Railway 188,730,056Seven & I Holdings 181,711,610
Largest Twenty Sales for the financial year Proceeds JPYMitsubishi UFJ Financial Group 215,846,102Sumitomo Mitsui Financial Group 190,414,737FUJIFILM Holdings 170,562,747Nippon Telegraph & Telephone 124,696,573Mizuho Financial Group 112,909,431Takeda Pharmaceutical 112,485,341Dentsu 104,056,841KDDI 100,609,974FANUC 100,472,731Keyence 94,453,467East Japan Railway 91,796,967Shin-Etsu Chemical 87,561,818Mitsubishi 86,220,464Toyota Motor 86,028,228Honda Motor 85,813,300SoftBank Group 85,517,121Kao 84,042,661Mitsubishi Electric 83,622,247Tokio Marine Holdings 83,451,563NTT DOCOMO 77,087,197
CONCEPT FUND SOLUTIONS PLC
Supplemental Data (Unaudited) cont/d
691
A. Portfolio changes for the financial year ended 31 December 2017 cont/d
db x-trackers FTSE 100 Equal Weight UCITS ETF (DR)
Cumulative Purchases in excess of 1 percent of total value of purchases of the financial year Cost GBPG4S 275,557Rentokil Initial 249,335Berkeley Group Holdings 246,727Segro 238,544NMC Health 220,830Halma 220,435Just Eat 220,279Scottish Mortgage Investment Trust 240,265DS Smith 210,626Barratt Developments 195,694Royal Dutch Shell Class B Shares 164,565Royal Dutch Shell Class A Shares 153,499Centrica 142,690BT Group 133,862Mediclinic International 131,945WPP 121,682BAE Systems 120,832Shire 111,656Anglo American 107,083BHP Billiton 102,207GlaxoSmithKline 101,576
Cumulative Sales in excess of 1 percent of total value of sales of the financial year Proceeds GBPRoyal Mail 235,144Capita 196,425ConvaTec Group 183,831Merlin Entertainments 171,138Babcock International Group 170,895Royal Dutch Shell B Shares 164,311Intu Properties 159,014Barratt Developments 156,647Hikma Pharmaceuticals 154,195Dixons Carphone 148,057Royal Dutch Shell A Shares 147,731Worldpay Group 94,781Anglo American 86,496Intertek Group 82,843Persimmon 65,580Provident Financial 62,930Ashtead Group 59,724Royal Bank of Scotland Group 56,970Glencore 56,693Coca-Cola HBC 53,001Rentokil Initial 52,705easyJet 52,321London Stock Exchange Group 51,460Hargreaves Lansdown 51,381International Consolidated Airlines Group 49,722Antofagasta 46,333BHP Billiton 43,740
CONCEPT FUND SOLUTIONS PLC
Supplemental Data (Unaudited) cont/d
692
A. Portfolio changes for the financial year ended 31 December 2017 cont/d
db x-trackers USD Corporate Bond UCITS ETF (DR)
Largest Twenty Purchases for the financial year Coupon % Maturity Cost USDAnheuser-Busch InBev Finance 3.65 01/02/2026 3,644,703GE Capital International Funding 4.42 15/11/2035 3,349,583Anheuser-Busch InBev Finance 3.30 01/02/2023 3,029,524Verizon Communications 5.15 15/09/2023 2,738,092AT&T 5.25 01/03/2037 2,570,153AT&T 3.80 01/03/2024 2,562,725AT&T 5.15 14/02/2050 2,209,485Bank of America 2.88 24/04/2023 2,200,030Sabine Pass Liquefaction 5.63 01/02/2021 2,160,000Bank of America 4.10 24/07/2023 2,130,720US Bancorp 2.63 24/01/2022 2,012,220Berkshire Hathaway Energy 6.13 01/04/2036 1,926,383Sumitomo Mitsui Financial 2.63 14/07/2026 1,885,148Verizon Communications 5.50 16/03/2047 1,846,581Dell International 6.02 15/06/2026 1,813,753American Express Credit 2.25 05/05/2021 1,813,201Broadcom 3.88 15/01/2027 1,793,733Anheuser-Busch InBev Finance 4.90 01/02/2046 1,779,574AT&T 3.90 14/08/2027 1,730,697Oracle 3.25 15/11/2027 1,620,453
Largest Twenty Sales for the financial year Coupon % Maturity Proceeds EURGE Capital International Funding Unlimited 2.34 15/11/2020 4,697,443JPMorgan Chase & Co 3.30 01/04/2026 3,063,644Verizon Communications 1.75 15/08/2021 2,980,874Bank of America 2.25 21/04/2020 2,963,396Anheuser-Busch InBev Finance 2.65 01/02/2021 2,926,282Anheuser-Busch InBev Finance 4.90 01/02/2046 2,393,675Berkshire Hathaway Energy 6.13 01/04/2036 2,305,678Goldman Sachs Group 2.75 15/09/2020 2,290,513Microsoft 1.55 08/08/2021 2,247,415Goldman Sachs Group 6.25 01/02/2041 2,182,933Enterprise Products Operating 3.35 15/03/2023 2,147,777Bank of America 2.63 19/10/2020 2,115,874AT&T 2.45 30/06/2020 2,024,502Anheuser-Busch InBev Finance 3.65 01/02/2026 2,024,315Verizon Communications 4.13 15/08/2046 2,012,702Morgan Stanley 4.10 22/05/2023 1,973,052Bank of America 2.88 24/04/2023 1,911,552JPMorgan Chase & Co 2.75 23/06/2020 1,875,052JPMorgan Chase & Co 3.25 23/09/2022 1,857,096Barclays 2.88 08/06/2020 1,844,091
CONCEPT FUND SOLUTIONS PLC
Supplemental Data (Unaudited) cont/d
693
A. Portfolio changes for the financial year ended 31 December 2017 cont/d
db x-trackers iBoxx Eurozone Sovereigns Quality Weighted UCITS ETF (DR)
A. Portfolio changes for the financial year ended 31 December 2017 cont/d
db x-trackers MSCI World Health Care Index UCITS ETF (DR)
Cumulative Purchases in excess of 1 percent of total value of purchases for the financial year Cost USDJohnson & Johnson 3,687,166Pfizer 2,120,355Koninklijke Philips 2,034,769UnitedHealth Group 2,009,255Novartis 1,925,638Roche Holding 1,863,296Merck & Co 1,809,625Abbott Laboratories 1,474,396Amgen 1,300,482Medtronic 1,241,921AbbVie 1,226,475Sanofi 1,177,018Bayer 1,098,037GlaxoSmithKline 1,094,070Celgene 1,089,503Bristol-Myers Squibb 995,381db x-trackers MSCI USA Health Care Index UCITS ETF (DR) 982,886Gilead Sciences 965,768Novo Nordisk 925,708AstraZeneca 869,544Eli Lilly & Co 860,126Allergan 833,169Thermo Fisher Scientific 825,465Alnylam Pharmaceuticals 645,792Biogen 615,806Becton Dickinson & Co 590,954
Cumulative Sales in excess of 1 percent of total value of sales for the financial year Proceeds USDJohnson & Johnson 6,742,653Pfizer 4,133,774Merck & Co 3,338,076Novartis 3,311,553Roche Holding 3,212,656UnitedHealth Group 3,211,211Amgen 2,445,550AbbVie 2,314,062Allergan 2,253,144Medtronic 2,172,768Sanofi 2,048,021Bristol-Myers Squibb 1,999,631Gilead Sciences 1,922,036Bayer 1,825,106GlaxoSmithKline 1,782,677Celgene 1,761,348Actelion 1,647,557Novo Nordisk 1,629,181Eli Lilly & Co 1,520,269Abbott Laboratories 1,425,937AstraZeneca 1,412,727St Jude Medical 1,407,643Biogen 1,345,845Thermo Fisher Scientific 1,258,201Aetna 1,081,165Express Scripts Holding 989,281Danaher 988,081Shire 966,232
CONCEPT FUND SOLUTIONS PLC
Supplemental Data (Unaudited) cont/d
695
A. Portfolio changes for the financial year ended 31 December 2017 cont/d
db x-trackers MSCI World Financials Index UCITS ETF (DR)
Largest Twenty Purchases for the financial year Cost USDJPMorgan Chase & Co 13,916,922Wells Fargo & Co 10,876,745Bank of America 10,750,177Berkshire Hathaway 9,635,963HSBC Holdings 7,825,270Citigroup 7,760,281Royal Bank of Canada 4,601,062Commonwealth Bank of Australia 4,544,683Banco Santander 4,227,830Toronto-Dominion Bank 4,091,111Allianz 4,007,840AIA Group 3,788,423US Bancorp 3,708,853Goldman Sachs Group 3,647,155BNP Paribas 3,635,799Westpac Banking 3,528,391Mitsubishi UFJ Financial Group 3,373,534Bank of Nova Scotia 3,051,524Lloyds Banking Group 2,875,266ING Groep 2,816,028
Largest Twenty Sales for the financial year Proceeds USDJPMorgan Chase & Co 6,127,539Wells Fargo & Co 4,606,266Bank of America 4,516,132Berkshire Hathaway 3,884,175Citigroup 3,847,794HSBC Holdings 3,454,387Royal Bank of Canada 2,008,911Commonwealth Bank of Australia 1,972,848Banco Santander 1,883,736Allianz 1,796,573Toronto-Dominion Bank 1,705,240US Bancorp 1,657,698AIA Group 1,640,769Mitsubishi UFJ Financial Group 1,582,051American International Group 1,536,843BNP Paribas 1,528,978Goldman Sachs Group 1,489,641Westpac Banking 1,456,073Bank of Nova Scotia 1,310,496American Express 1,272,771
CONCEPT FUND SOLUTIONS PLC
Supplemental Data (Unaudited) cont/d
696
A. Portfolio changes for the financial year ended 31 December 2017 cont/d
db x-trackers MSCI World Energy Index UCITS ETF (DR)
Cumulative Purchases in excess of 1 percent of total value of purchases for the financial year Cost USDExxon Mobil 40,770,847Chevron 24,592,105Royal Dutch Shell Class A Shares 15,386,317Total 15,044,987BP 14,560,325Royal Dutch Shell Class B Shares 12,938,503Schlumberger 11,292,330Enbridge 7,580,095ConocoPhillips 7,031,742EOG Resources 6,503,438Suncor Energy 6,371,675Occidental Petroleum 5,668,908Eni 4,891,753TransCanada 4,873,294Halliburton 4,630,080Kinder Morgan 4,550,276Phillips 66 4,444,300Canadian Natural Resources 4,206,294Valero Energy 3,688,755Anadarko Petroleum 3,419,902Marathon Petroleum 3,322,610Pioneer Natural Resources 3,268,504Williams 2,986,756
Cumulative Sales in excess of 1 percent of total value of sales for the financial year Proceeds USDExxon Mobil 9,020,519Chevron 5,721,279Royal Dutch Shell Class A Shares 3,436,032Total 3,134,596BP 3,039,962Royal Dutch Shell Class B Shares 2,931,304Schlumberger 2,499,341ConocoPhillips 1,728,128Enbridge 1,555,847EOG Resources 1,495,811Suncor Energy 1,420,703Occidental Petroleum 1,335,844Phillips 66 1,305,122TransCanada 1,074,484Eni 1,064,092Valero Energy 999,664Halliburton 996,512Canadian Natural Resources 972,810Kinder Morgan 962,763Marathon Petroleum 908,868Anadarko Petroleum 744,281Murphy Oil 723,196Core Laboratories 708,629Pioneer Natural Resources 695,944
CONCEPT FUND SOLUTIONS PLC
Supplemental Data (Unaudited) cont/d
697
A. Portfolio changes for the financial year ended 31 December 2017 cont/d
db x-trackers MSCI World Consumer Staples Index UCITS ETF (DR)
Cumulative Purchases in excess of 1 percent of total value of purchases for the financial year Cost USDNestle 7,389,826Procter & Gamble 6,397,677Coca-Cola 5,151,245Philip Morris International 4,985,979PepsiCo 4,586,763British American Tobacco 4,068,996Altria Group 3,682,811Wal-Mart Stores 3,418,700Unilever - Netherlands listing 2,627,109Anheuser-Busch InBev 2,510,354Diageo 2,251,572CVS Health 2,216,363Unilever - England listing 2,018,851Walgreens Boots Alliance 2,013,471Costco Wholesale 1,960,081Reckitt Benckiser Group 1,866,242Mondelez International 1,833,071Colgate-Palmolive 1,685,050L'Oreal 1,478,010Kraft Heinz 1,455,393Danone 1,305,449Kimberly-Clark 1,198,608Imperial Brands 1,168,362Japan Tobacco 1,069,011Wesfarmers 1,027,006
Cumulative Sales in excess of 1 percent of total value of sales for the financial year Proceeds USDProcter & Gamble 1,146,633Nestle 1,072,480Coca-Cola 901,021Philip Morris International 843,049PepsiCo 802,691Wal-Mart Stores 697,124Altria Group 695,562British American Tobacco 573,681CVS Health 475,992Walgreens Boots Alliance 409,250Coca-Cola European Partners 384,751Anheuser-Busch InBev 383,743Unilever - Netherlands listing 380,824Costco Wholesale 371,462Mondelez International 364,852Diageo 337,071Unilever - England listing 329,076Colgate-Palmolive 302,779Mead Johnson Nutrition 299,289Kraft Heinz 269,244Reckitt Benckiser Group 261,314Kimberly-Clark 235,022L'Oreal 220,102Imperial Brands 194,531Tate & Lyle 193,886General Mills 192,618Danone 185,948
CONCEPT FUND SOLUTIONS PLC
Supplemental Data (Unaudited) cont/d
698
A. Portfolio changes for the financial year ended 31 December 2017 cont/d
db x-trackers MSCI World Information Technology Index UCITS ETF (DR)
Largest Twenty Purchases for the financial year Cost USDApple 15,647,348Microsoft 10,533,754Facebook 7,307,418Alphabet Class C Shares 5,735,427Alphabet Class A Shares 5,579,151Intel 3,613,193Visa 3,594,133Cisco Systems 3,342,458International Business Machines 2,890,104Oracle 2,882,794Mastercard 2,378,427SAP 2,025,960Broadcom 1,933,383NVIDIA 1,917,188QUALCOMM 1,738,543Texas Instruments 1,659,698Accenture 1,585,246Adobe Systems 1,411,275Paypal Holdings 1,329,416salesforce.com 1,270,273
Largest Twenty Sales for the financial year Proceeds USDApple 17,765,123Microsoft 11,128,795Facebook 7,779,902Alphabet Class C Shares 5,846,192Alphabet Class A Shares 5,696,199Visa 4,014,945Intel 3,609,856Cisco Systems 3,313,547Oracle 3,075,719International Business Machines 2,875,846Mastercard 2,653,090SAP 2,121,142Yahoo 2,066,516Broadcom 1,979,387NVIDIA 1,811,418Texas Instruments 1,724,684Accenture 1,650,421QUALCOMM 1,642,181Adobe Systems 1,539,049Paypal Holdings 1,373,696
CONCEPT FUND SOLUTIONS PLC
Supplemental Data (Unaudited) cont/d
699
A. Portfolio changes for the financial year ended 31 December 2017 cont/d
db x-trackers MSCI World Industrials Index UCITS ETF (DR)
Largest Twenty Purchases for the financial year Cost USDGeneral Electric 1,036,2603M 566,300Boeing 523,277Siemens 478,454Honeywell International 441,505United Technologies 418,605Union Pacific 395,429United Parcel Service 343,616Lockheed Martin 332,982Caterpillar 289,129Canadian National Railway 279,095FedEx 250,074ABB 232,505General Dynamics 230,543CSX 226,063Airbus 221,716Raytheon 214,997Illinois Tool Works 202,604Schneider Electric 196,389Northrop Grumman 195,572
Largest Twenty Sales for the financial year Proceeds USDGeneral Electric 824,878Koninklijke Philips 395,091Boeing 376,8713M 366,425Siemens 326,619United Technologies 297,922Union Pacific 297,897Honeywell International 287,823United Parcel Service 226,022Lockheed Martin 224,980Canadian National Railway 180,562Caterpillar 177,725ABB 170,973General Dynamics 155,486CSX 149,945FedEx 146,585Airbus 141,853Raytheon 140,138Illinois Tool Works 136,074Northrop Grumman 131,912
CONCEPT FUND SOLUTIONS PLC
Supplemental Data (Unaudited) cont/d
700
A. Portfolio changes for the financial year ended 31 December 2017 cont/d
db x-trackers MSCI World Consumer Discretionary Index UCITS ETF (DR)
Largest Twenty Purchases for the financial year Cost USDAmazon.com 7,921,270Home Depot 3,701,897Comcast 3,537,213Walt Disney 3,385,724Toyota Motor 3,032,795McDonald's 2,441,523Priceline Group 1,814,281Starbucks 1,563,817Time Warner 1,555,699Netflix 1,544,674Charter Communications 1,526,114Daimler 1,489,766LVMH Moet Hennessy Louis Vuitton 1,422,852NIKE 1,395,357Lowe's 1,332,301db x-trackers MSCI USA Consumer Discretionary Index UCITS ETF (DR) 1,211,776Honda Motor 1,096,689General Motors 1,088,236Sony 925,505TJX 917,347
Largest Twenty Sales for the financial year Proceeds USDAmazon.com 5,019,850Home Depot 2,537,443Comcast 2,484,472Walt Disney 2,251,261Toyota Motor 1,874,877McDonald's 1,763,189Charter Communications 1,314,496Priceline Group 1,235,064Starbucks 1,029,632Time Warner 997,926NIKE 994,798Netflix 969,312Lowe's 935,408LVMH Moet Hennessy Louis Vuitton 869,488Daimler 854,094General Motors 710,705TJX 614,249Sony Corp 607,882Honda Motor 592,348Cie Financiere Richemont 546,390
CONCEPT FUND SOLUTIONS PLC
Supplemental Data (Unaudited) cont/d
701
A. Portfolio changes for the financial year ended 31 December 2017 cont/d
db x-trackers MSCI World Utilities Index UCITS ETF (DR)
Cumulative Purchases in excess of 1 percent of total value of purchases for the financial year Cost USDNextEra Energy 402,747Duke Energy 354,198Dominion Energy 291,001Southern 288,744Enel 288,114Iberdrola 280,338National Grid 244,623Exelon 211,407American Electric Power 207,277PG&E 203,450Engie 198,912Sempra Energy 158,551PPL 154,006Edison International 150,764Consolidated Edison 148,033E.ON 141,809Xcel Energy 139,854Public Service Enterprise Group 131,603WEC Energy Group 116,552SSE 114,305Eversource Energy 114,217DTE Energy 113,881CLP Holdings 103,418Hong Kong & China Gas 93,885Fortis 88,983American Water Works 85,450Centrica 84,239FirstEnergy 83,045Entergy 82,991Ameren 79,985Orsted 79,074CMS Energy 76,542Power Assets Holdings 73,627
Cumulative Sales in excess of 1 percent of total value of sales for the financial year Proceeds USDNextEra Energy 261,278Duke Energy 236,544Iberdrola 196,959Dominion Energy 196,275Southern 195,425National Grid 181,648Enel 172,017American Electric Power 143,617PG&E 135,729Exelon 131,510Sempra Energy 109,890Edison International 106,746PPL 105,009Engie 101,629Consolidated Edison 97,921Xcel Energy 96,452Public Service Enterprise Group 89,204SSE 85,059E.ON 79,978WEC Energy Group 79,208DTE Energy 78,736Eversource Energy 78,526CLP Holdings 71,618Hong Kong & China Gas 64,196Centrica 57,808Entergy 57,738American Water Works 56,206Ameren 54,130AGL Energy 52,902CMS Energy 51,962FirstEnergy 51,388Fortis 51,240Power Assets Holdings 50,850
CONCEPT FUND SOLUTIONS PLC
Supplemental Data (Unaudited) cont/d
702
A. Portfolio changes for the financial year ended 31 December 2017 cont/d
db x-trackers MSCI World Telecom Services Index UCITS ETF (DR)
Largest Twenty Purchases for the financial year Cost USDAT&T 15,905,159Verizon Communications 13,037,893Vodafone Group 4,421,679SoftBank Group 4,339,629Deutsche Telekom 3,693,244KDDI 3,077,791Telefonica 2,884,682BT Group 2,276,537NTT DOCOMO 2,092,624Orange 2,007,180Nippon Telegraph & Telephone 1,951,207Singapore Telecommunications (Board Lot 10) 1,431,181CenturyLink 1,339,640T-Mobile 1,120,553Level 3 Communications 1,097,549Telstra 970,235Rogers Communications 961,662Telenor 785,947Swisscom 755,132Telia 692,380
Largest Twenty Sales for the financial year Proceeds USDAT&T 6,629,522Verizon Communications 5,465,727SoftBank Group 2,394,615Vodafone Group 2,092,733Deutsche Telekom 1,648,642Telefonica 1,426,588KDDI 1,408,701Level 3 Communications 1,408,356BT Group 955,142NTT DOCOMO 935,281Nippon Telegraph & Telephone 934,100SBA Communications 926,140Orange 916,163Singapore Telecommunications 632,508T-Mobile 514,910Rogers Communications 507,341Telenor 401,254Telstra 378,759CenturyLink 375,895Swisscom 351,218
CONCEPT FUND SOLUTIONS PLC
Supplemental Data (Unaudited) cont/d
703
A. Portfolio changes for the financial year ended 31 December 2017 cont/d
db x-trackers MSCI World Materials Index UCITS ETF (DR)
Cumulative Purchases in excess of 1 percent of total value of purchases for the financial year Cost USDBASF 574,371Dowdupont 509,179BHP Billiton - Australia listing 400,021Rio Tinto - England listing 354,649Glencore 332,080Monsanto 326,631Air Liquide 315,447Dow Chemical 270,233Praxair 249,284Shin-Etsu Chemical 234,093Linde 231,309BHP Billiton - England listing 228,385EI du Pont de Nemours & Co 222,137Ecolab 216,297Air Products & Chemicals 212,153Sherwin-Williams 199,638LyondellBasell Industries 196,969CRH 188,662PPG Industries 179,164LafargeHolcim 163,504Akzo Nobel 142,678Rio Tinto - Australia listing 138,899International Paper 138,078Anglo American 136,566
Cumulative Sales in excess of 1 percent of total value of sales for the financial year Proceeds USDSyngenta 271,936BASF 265,111Dow Chemical 202,702EI du Pont de Nemours & Co 198,555BHP Billiton - Australia listing 190,640Rio Tinto - England listing 158,743Glencore 147,060Monsanto 146,777Air Liquide 133,400BHP Billiton - England listing 109,185LyondellBasell Industries 106,306Shin-Etsu Chemical 104,519Praxair 104,341Ecolab 98,590Air Products & Chemicals 90,116Linde 89,173CRH 85,603PPG Industries 83,334LafargeHolcim 75,003Sherwin-Williams 70,694Anglo American 69,863Barrick Gold 63,852International Paper 63,245Nippon Steel & Sumitomo Metal 63,090Rio Tinto - Australia listing 62,415Nucor 58,737Newmont Mining 58,045
CONCEPT FUND SOLUTIONS PLC
Supplemental Data (Unaudited) cont/d
704
A. Portfolio changes for the financial year ended 31 December 2017 cont/d
A. Portfolio changes for the financial year ended 31 December 2017 cont/d
db x-trackers iBoxx EUR Corporates Yield Plus UCITS ETF (DR)
Largest Twenty Purchases for the financial year Coupon % Maturity Cost EURVolkswagen International Finance 1.13 02/10/2023 1,211,721Cooperatieve Rabobank 2.50 26/05/2026 1,165,855Bank of America 1.63 14/09/2022 1,156,850Goldman Sachs Group 1.38 15/05/2024 1,121,405Nationwide Building Society 6.75 22/07/2020 1,066,204Deutsche Bank 1.25 08/09/2021 1,023,323BNP Paribas 1.50 17/11/2025 1,012,294JPMorgan Chase & Co 0.63 25/01/2024 983,229Volkswagen International Finance 1.88 30/03/2027 908,316Assicurazioni Generali 5.13 16/09/2024 896,678AT&T 1.45 01/06/2022 880,213UBS Group Funding Switzerland 1.50 30/11/2024 830,858Bank of America 0.74 07/02/2022 814,080BAT Capital 1.13 16/11/2023 813,200FedEx 1.00 11/01/2023 811,807Morgan Stanley 1.88 27/04/2027 807,740Banco Bilbao Vizcaya Argentaria 0.63 27/04/2027 802,397Allergan Funding 0.50 01/06/2021 801,933Enel Finance International 1.00 16/09/2024 800,219Criteria Caixa 1.50 27/04/2027 796,390
Largest Twenty Sales for the financial year Coupon % Maturity Proceeds EURBank of America 1.63 27/04/2034 1,164,592Assicurazioni Generali 5.13 27/04/2035 904,259Intesa Sanpaolo 1.13 27/04/2036 768,075UBS Group Funding Switzerland 1.75 27/04/2037 745,318Credit Suisse 1.38 27/04/2038 733,285BP Capital Markets 1.12 27/04/2039 723,807JPMorgan Chase & Co 1.50 27/04/2040 686,082Santander International Debt 1.38 27/04/2041 624,900ING Bank 3.50 27/04/2042 624,708Royal Bank of Scotland 5.38 27/04/2043 618,150McDonald's 1.00 27/04/2044 612,438Whirlpool 0.63 27/04/2045 608,280Telefonica Emisiones 0.32 27/04/2046 604,656Verizon Communications 2.38 27/04/2047 598,307Nationwide Building Society 6.75 27/04/2048 587,705HSBC Holdings 3.38 27/04/2049 569,916Electricite de France 4.63 27/04/2050 563,544America Movil 5.13 27/04/2051 522,000Bank of America 1.38 27/04/2052 521,160Bharti Airtel International Netherlands 4.00 27/04/2053 521,038
CONCEPT FUND SOLUTIONS PLC
Supplemental Data (Unaudited) cont/d
706
A. Portfolio changes for the financial year ended 31 December 2017 cont/d
db x-trackers MSCI USA Minimum Volatility UCITS ETF (DR)
Cumulative Purchases in excess of 1 percent of total value of purchases for the financial year Cost USDDell Technologies 144,783Northrop Grumman 109,963Newmont Mining 100,211Lockheed Martin 99,817CR Bard 90,509Coca-Cola 86,834Amphenol 83,454Becton Dickinson & Co 79,594Jack Henry & Associates 78,201Raytheon 74,165McDonald's 72,575Johnson & Johnson 71,754Visa 71,183Stryker 70,936Pfizer 70,653AT&T 69,719PepsiCo 67,679Intuitive Surgical 67,325UnitedHealth Group 66,044Automatic Data Processing 65,812Altria Group 65,239Waste Management 64,337
Largest Twenty Sales for the financial year Proceeds USDDell Technologies 120,213Automatic Data Processing 104,285Stryker 92,927CR Bard 88,789UnitedHealth Group 88,041Becton Dickinson & Co 86,304Adobe Systems 78,212Intuitive Surgical 77,805AT&T 67,973Aetna 62,410Abbott Laboratories 56,628Cintas 55,416United Parcel Service 53,163Charter Communications 52,465Reynolds American 50,872McDonald's 49,671Paychex 46,340PG&E 45,250Synopsys 40,777Visa 40,607
CONCEPT FUND SOLUTIONS PLC
Supplemental Data (Unaudited) cont/d
707
A. Portfolio changes for the financial year ended 31 December 2017 cont/d
db x-trackers MSCI EMU Minimum Volatility UCITS ETF (DR)
Cumulative Purchases in excess of 1 percent of total value of purchases for the financial year Cost EURInnogy 784,780Unilever 708,219Sanofi 705,085Allianz 702,078Deutsche Telekom 690,057Muenchener Rueckversicherungs-Gesellschaft 684,042Iberdrola 679,383Kerry Group 672,719Elisa 671,620Danone 660,823MAN 656,119Total 654,375Sampo 649,698Heineken 643,788Groupe Bruxelles Lambert 641,625Pernod Ricard 637,231SAP 627,792L'Oreal 626,525Beiersdorf 622,138Abertis Infraestructuras 620,213Ageas 613,917Endesa 609,724Fresenius Medical Care & Co 608,464Henkel & Co 602,928Hermes International 598,885Proximus 596,274Fresenius & Co 582,520Merck 572,546Ryanair Holdings 566,231Snam 554,752Industria de Diseno Textil 541,383Colruyt 540,989KBC Group 534,313Red Electrica 534,084Essilor International Cie Generale d'Optique 523,585Aena SME 522,855RELX 511,971NN Group 508,170Deutsche Post 483,821Gecina 483,820Enagas 483,804
CONCEPT FUND SOLUTIONS PLC
Supplemental Data (Unaudited) cont/d
708
A. Portfolio changes for the financial year ended 31 December 2017 cont/d
db x-trackers MSCI EMU Minimum Volatility UCITS ETF (DR) cont/d
Cumulative Sales in excess of 1 percent of total value of sales for the financial year Proceeds EURNeste 571,161Koninklijke Ahold Delhaize 319,313SCOR 281,667Paddy Power Betfair 277,193Orion 253,187Telefonica 246,809Nokia 217,539Aena 209,057BNP Paribas 200,732Wolters Kluwer 190,501Axel Springer 166,369Endesa 158,174Capgemini 155,923Allianz 148,830Atos 148,427Covestro 142,396Innogy 137,854EDP - Energias de Portugal 122,962AXA 120,925Kerry Group 120,696Snam 117,376Coca-Cola European Partners 109,767Muenchener Rueckversicherungs-Gesellschaft 109,331Unilever 105,722Bank of Ireland Group 89,914Veolia Environnement 84,793Abertis Infraestructuras 83,889HeidelbergCement 83,834Ryanair Holdings 82,824Pernod Ricard 81,609
CONCEPT FUND SOLUTIONS PLC
Supplemental Data (Unaudited) cont/d
709
A. Portfolio changes for the financial year ended 31 December 2017 cont/d
db x-trackers MSCI Emerging Markets Index UCITS ETF (DR)*
Largest Twenty Purchases for the financial period Cost USDdb x-trackers MSCI India TRN Index UCITS ETF - England listing 43,338,948Tencent Holdings 35,664,952Samsung Electronics 32,864,596Alibaba Group Holding 27,711,082Taiwan Semiconductor Manufacturing 27,333,158Naspers 14,735,968China Construction Bank 10,507,851China Mobile 9,606,380Baidu 8,663,241Hon Hai Precision Industry 8,512,352Industrial & Commercial Bank of China 7,974,808Ping An Insurance Group of China 6,248,898Bank of China 5,875,699Itau Unibanco Holding 5,826,351SK Hynix 5,681,607Sberbank of Russia 4,872,146Samsung Electronics - Preferred Stock 4,784,486Banco Bradesco 4,301,312America Movil 4,232,136Ambev 4,221,940
Largest Twenty Sales for the financial period Proceeds USDdb x-trackers MSCI India TRN Index UCITS ETF - Singapore listing 16,100,434db x-trackers MSCI India TRN Index UCITS ETF - England listing 15,315,659Samsung Electronics 1,412,202Tencent Holdings 1,317,471Taiwan Semiconductor Manufacturing 1,065,219Alibaba Group Holding 762,031Naspers 578,056Minth Group 509,492China Construction Bank 415,681China Mobile 382,385Baidu 344,883Hon Hai Precision Industry 340,146Vale 330,779Industrial & Commercial Bank of China 311,387China Evergrande Group 253,048Samsung Electronics - Preferred Stock 251,449Ping An Insurance Group of China 246,802Impala Platinum Holdings 240,298Itau Unibanco Holding 229,884Bank of China 228,751
* The Fund launched on 21 June 2017.
CONCEPT FUND SOLUTIONS PLC
Supplemental Data (Unaudited) cont/d
710
A. Portfolio changes for the financial year ended 31 December 2017 cont/d
db x-trackers MSCI USA Consumer Discretionary Index UCITS ETF (DR)*
Largest Twenty Purchases for the financial period Cost USDAmazon.com 876,199Home Depot 413,951Comcast 388,722Walt Disney 331,265McDonald's 276,069Priceline Group 199,825Charter Communications 178,042Netflix 174,466Time Warner 171,137Starbucks 168,736NIKE 152,891Lowe's 145,344General Motors 111,314Tesla 105,114TJX 102,010Ford Motor 93,688Marriott International 73,311Target 65,610Twenty-First Century Fox Class A Shares 59,706Aptiv 57,067
Largest Twenty Sales for the financial period Proceeds USDCharter Communications 14,679Foot Locker 12,081Delphi Technology 10,657Bed Bath & Beyond 6,941Signet Jewelers 6,902Dick's Sporting Goods 5,538General Motors 3,490Home Depot 3,057CBS 2,610Walt Disney 2,096Lowe's 1,751O'Reilly Automotive 1,181Marriott International 762PulteGroup 751Liberty Global Class A Shares 603Liberty Global Class C Shares 524Wyndham Worldwide 450Michael Kors Holdings 409Lennar 400VF 365
* The Fund launched on 12 September 2017.
CONCEPT FUND SOLUTIONS PLC
Supplemental Data (Unaudited) cont/d
711
A. Portfolio changes for the financial year ended 31 December 2017 cont/d
db x-trackers MSCI USA Consumer Staples Index UCITS ETF (DR)*
Cumulative Purchases in excess of 1 percent of total value of purchases for the financial period Cost USDProcter & Gamble 628,276Coca-Cola 498,816Philip Morris International 478,598PepsiCo 432,080Altria Group 317,004Wal-Mart Stores 316,867CVS Health 220,606Walgreens Boots Alliance 199,108Costco Wholesale 185,059Mondelez International 163,297Colgate-Palmolive 158,755Kraft Heinz 131,785Kimberly-Clark 112,376Constellation Brands 92,977General Mills 84,726Sysco 70,545Archer-Daniels-Midland 64,500Estee Lauder 64,321Monster Beverage 59,059Kroger 51,799Tyson Foods 50,379
Total Sales for the financial period** Proceeds USDWal-Mart Stores 4,084Conagra Brands 821Altria Group 814Walgreens Boots Alliance 800Kroger 776JM Smucker 700Sysco 693Kellogg 529Mondelez International 429Archer-Daniels-Midland 319Ingredion 249Monster Beverage 225General Mills 207Dr Pepper Snapple Group 180Kimberly-Clark 120Spectrum Brands Holdings 115
* The Fund launched on 12 September 2017.** There were no other sales during the financial period.
CONCEPT FUND SOLUTIONS PLC
Supplemental Data (Unaudited) cont/d
712
A. Portfolio changes for the financial year ended 31 December 2017 cont/d
db x-trackers MSCI USA Energy Index UCITS ETF (DR)*
Cumulative Purchases in excess of 1 percent of total value of purchases for the financial period Cost USDExxon Mobil 1,305,513Chevron 825,808Schlumberger 357,178ConocoPhillips 213,432EOG Resources 198,617Occidental Petroleum 180,513Kinder Morgan 150,561Phillips 66 144,865Halliburton 139,687Valero Energy 120,452Marathon Petroleum 106,981Williams 96,795Anadarko Petroleum 90,976Pioneer Natural Resources 86,039ONEOK 82,157Concho Resources 66,843Devon Energy 62,369EQT 61,740Andeavor 59,992Apache 59,792Baker Hughes 56,464
Largest Twenty Sales for the financial period Proceeds USDMurphy Oil 17,440Core Laboratories 16,926Weatherford International 11,781Exxon Mobil 4,282ConocoPhillips 2,441Chevron 2,227Marathon Petroleum 2,185Schlumberger 1,137EOG Resources 943Phillips 66 755Halliburton 720Occidental Petroleum 687Valero Energy 659Pioneer Natural Resources 644Andeavor 527Kinder Morgan 430Cimarex Energy 377Diamondback Energy 333Anadarko Petroleum 308Concho Resources 289
* The Fund launched on 12 September 2017.
CONCEPT FUND SOLUTIONS PLC
Supplemental Data (Unaudited) cont/d
713
A. Portfolio changes for the financial year ended 31 December 2017 cont/d
db x-trackers MSCI USA Financials Index UCITS ETF (DR)*
Cumulative Purchases in excess of 1 percent of total value of purchases for the financial period Cost USDJPMorgan Chase & Co 13,972,830Wells Fargo & Co 10,686,274Bank of America 10,577,497Berkshire Hathaway 9,594,082Citigroup 8,205,209US Bancorp 3,701,712Goldman Sachs Group 3,595,387American Express 2,823,888Morgan Stanley 2,747,669Chubb 2,746,993PNC Financial Services Group 2,678,710American International Group 2,312,980Bank of New York Mellon 2,254,065BlackRock 2,242,666Charles Schwab 2,193,097MetLife 1,937,945CME Group 1,915,610Prudential Financial 1,879,605Marsh & McLennan 1,769,831Capital One Financial 1,696,109Intercontinental Exchange 1,663,781S&P Global 1,660,153Aon 1,569,392BB&T 1,563,634State Street 1,473,763Travelers 1,416,712Allstate 1,384,480
Cumulative Sales in excess of 1 percent of total value of sales for the financial period Proceeds USDNavient 137,521Black Knight 122,532JPMorgan Chase & Co 73,789Citigroup 48,017American International Group 32,018Wells Fargo & Co 22,813American Express 19,639CIT Group 18,141Synchrony Financial 17,514Ameriprise Financial 16,851Fifth Third Bancorp 15,043MetLife 14,118Discover Financial Services 14,049PNC Financial Services Group 13,775TD Ameritrade Holding 13,253Travelers 12,743US Bancorp 11,195Alleghany 10,586Voya Financial 9,105Allstate 8,007Citizens Financial Group 7,570
* The Fund launched on 12 September 2017.
CONCEPT FUND SOLUTIONS PLC
Supplemental Data (Unaudited) cont/d
714
A. Portfolio changes for the financial year ended 31 December 2017 cont/d
db x-trackers MSCI USA Health Care Index UCITS ETF (DR)*
Cumulative Purchases in excess of 1 percent of total value of purchases for the financial period Cost USDJohnson & Johnson 541,609Pfizer 320,131UnitedHealth Group 290,614Merck & Co 271,406AbbVie 212,773Amgen 212,737Medtronic 170,515Celgene 168,669Gilead Sciences 167,671Bristol-Myers Squibb 157,115Abbott Laboratories 138,011Eli Lilly & Co 123,763Thermo Fisher Scientific 117,959Allergan 117,630Biogen 107,118Danaher 82,955Aetna 82,107Anthem 75,887Stryker 73,529Cigna 71,811Becton Dickinson & Co 69,969Boston Scientific 60,464Vertex Pharmaceuticals 59,985Intuitive Surgical 59,322Express Scripts Holding 56,318Humana 56,136Regeneron Pharmaceuticals 52,886McKesson 50,026
Largest Twenty Sales for the financial period Proceeds USDDexCom 7,596MEDNAX 6,970Patterson 4,532Mallinckrodt 3,273Express Scripts Holding 1,369Biogen 966Amgen 878Cigna 847Medtronic 575Anthem 470HCA Healthcare 340Johnson & Johnson 279United Therapeutics 260Waters 197Pfizer 181Perrigo 174Allergan 174Laboratory of America Holdings 158IDEXX Laboratories 156Zoetis 145
* The Fund launched on 12 September 2017.
CONCEPT FUND SOLUTIONS PLC
Supplemental Data (Unaudited) cont/d
715
A. Portfolio changes for the financial year ended 31 December 2017 cont/d
db x-trackers MSCI USA Information Technology Index UCITS ETF (DR)*
Largest Twenty Purchases for the financial period Cost USDApple 997,411Microsoft 651,560Facebook 486,412Alphabet Class C Shares 345,854Alphabet Class A Shares 336,120Visa 233,160Intel 202,144Oracle 193,704Cisco Systems 192,801Mastercard 160,672International Business Machines 154,808NVIDIA 120,371Broadcom 119,021Accenture 100,551Texas Instruments 98,147Adobe Systems 91,915QUALCOMM 89,611PayPal Holdings 84,836salesforce.com 78,184Applied Materials 58,252
Largest Twenty Sales for the financial period Proceeds USDApple 16,127Microsoft 6,108Nuance Communications 5,315Visa 3,603Alphabet Class A Shares 3,002International Business Machines 2,309Intel 1,973Mastercard 1,806Facebook 1,772Cisco Systems 1,380Texas Instruments 1,362Accenture 1,036Alphabet Class C Shares 1,021QUALCOMM 929Adobe Systems 907Automatic Data Processing 801Applied Materials 792Corning 777eBay 693Harris 578
* The Fund launched on 12 September 2017.
CONCEPT FUND SOLUTIONS PLC
Supplemental Data (Unaudited) cont/d
716
B. Prospectus changes
An updated prospectus for the Company was filed with the Central Bank of Ireland dated 15 December 2017.
C. Total expense ratio
The total expense ratio (“TER”) shown below expresses the sum of all costs and commissions, with the exceptionof portfolio rebalancing costs, charged to the Fund’s assets as a percentage of the average Fund assets, asapplicable as of year-end.
Fund
TER %(including
Performancefee)
TER %(excluding
Performancefee)
db x-trackers EUR Liquid Corporate 12.5 UCITS ETFClass 1C 0.35 0.35db x-trackers Portfolio Income UCITS ETF 0.41 0.41db x-trackers MSCI Nordic Index UCITS ETF (DR) 0.30 0.30db x-trackers Mittelstand & MidCap Germany UCITS ETF (DR) 0.40 0.40db x-trackers MSCI North America High Dividend Yield Index UCITS ETF (DR) 0.39 0.39db x-trackers MSCI AC World Index UCITS ETF (DR)1 0.40 0.40db x-trackers MSCI AC Far East ex Japan Index UCITS ETF 0.60 0.60db x-trackers MSCI USA Index UCITS ETF (DR) 0.07 0.07db x-trackers S&P 500® Equal Weight UCITS ETF (DR) 0.25 0.25db x-trackers MSCI World Index UCITS ETF (DR)Class 1C 0.19 0.19Class 1D 0.19 0.19Class 2D - GBP Hedged 0.12 0.12db x-trackers FTSE Developed Europe ex UK Property UCITS ETF (DR)2 0.33 0.33db x-trackers MSCI World Minimum Volatility UCITS ETF (DR) 0.25 0.25db x-trackers MSCI World Momentum Factor UCITS ETF (DR) 0.25 0.25db x-trackers MSCI World Quality Factor UCITS ETF (DR) 0.25 0.25db x-trackers MSCI World Value Factor UCITS ETF (DR) 0.25 0.25Deutsche MSCI World Index Fund 0.08 0.08db x-trackers MSCI GCC Select Index UCITS ETF 0.65 0.65db x-trackers FTSE All-World ex UK UCITS ETF (DR) 0.40 0.40db x-trackers S&P 500 UCITS ETF (DR)Class 1C - EUR Hedged3 0.20 0.20Class 2C - GBP Hedged3 0.20 0.20Class 3C - CHF Hedged3 0.20 0.20db x-trackers Russell 2000 UCITS ETF (DR)Class 1C4 0.30 0.30db x-trackers Russell Midcap UCITS ETF (DR) 0.35 0.35db x-trackers JPX-Nikkei 400 UCITS ETF (DR)Class 1D 0.20 0.20Class 2D - GBP Hedged 0.30 0.30Class 3C - EUR Hedged 0.30 0.30Class 4C - USD Hedged 0.30 0.30db x-trackers FTSE 100 Equal Weight UCITS ETF (DR) 0.25 0.25db x-trackers USD Corporate Bond UCITS ETF (DR)Class 1D5 0.16 0.16Class 2D - EUR Hedged6 0.21 0.21db x-trackers iBoxx Eurozone Sovereigns Quality Weighted UCITS ETF (DR) 0.20 0.20db x-trackers MSCI World Health Care Index UCITS ETF (DR)4 0.30 0.30db x-trackers MSCI World Financials Index UCITS ETF (DR)4 0.30 0.30db x-trackers MSCI World Energy Index UCITS ETF (DR)4 0.30 0.30db x-trackers MSCI World Consumer Staples Index UCITS ETF (DR)4 0.30 0.30db x-trackers MSCI World Information Technology Index UCITS ETF (DR)4 0.30 0.30db x-trackers MSCI World Industrials Index UCITS ETF (DR)4 0.30 0.30db x-trackers MSCI World Consumer Discretionary Index UCITS ETF (DR)4 0.30 0.30db x-trackers MSCI World Utilities Index UCITS ETF (DR)4 0.30 0.30db x-trackers MSCI World Telecom Services Index UCITS ETF (DR)4 0.30 0.30db x-trackers MSCI World Materials Index UCITS ETF (DR)4 0.30 0.30
CONCEPT FUND SOLUTIONS PLC
Supplemental Data (Unaudited) cont/d
717
C. Total expense ratio cont/d
Fund
TER %(including
Performancefee)
TER %(excluding
Performancefee)
db x-trackers iBoxx USD Emerging Sovereigns Quality Weighted UCITS ETF (DR)Class 1D 0.50 0.50Class 2D - EUR Hedged 0.23 0.23db x-trackers iBoxx EUR Corporates Yield Plus UCITS ETF (DR) 0.25 0.25db x-trackers MSCI USA Minimum Volatility UCITS ETF (DR) 0.20 0.20db x-trackers MSCI EMU Minimum Volatility UCITS ETF (DR) 0.25 0.25db x-trackers MSCI Emerging Markets Index UCITS ETF (DR)7 0.08 0.20db x-trackers MSCI USA Consumer Discretionary Index UCITS ETF (DR)8 0.04 0.12db x-trackers MSCI USA Consumer Staples Index UCITS ETF (DR)8 0.04 0.12db x-trackers MSCI USA Energy Index UCITS ETF (DR)8 0.04 0.12db x-trackers MSCI USA Financials Index UCITS ETF (DR)8 0.04 0.12db x-trackers MSCI USA Health Care Index UCITS ETF (DR)8 0.04 0.12db x-trackers MSCI USA Information Technology Index UCITS ETF (DR)8 0.04 0.12
1 The TER was changed effective from 23/06/2017 from 0.50%.2 The TER was changed effective from 23/06/2017 from 0.40%.3 The TER was changed effective from 23/06/2017 from 0.30%.4 The TER was changed effective from 23/06/2017 from 0.45%.5 The TER was changed effective from 23/06/2017 from 0.20%.6 The TER was changed effective from 23/06/2017 from 0.25%.7 db x-trackers MSCI Emerging Markets Index UCITS ETF (DR) launched on 21/06/2017, the TER shown is for the full financial year.8 As db x-trackers MSCI USA Financials Index UCITS ETF (DR), db x-trackers MSCI USA Information Technology Index UCITS ETF (DR),db x-trackers MSCI USA Consumer Discretionary Index UCITS ETF (DR), db x-trackers MSCI USA Consumer Staples Index UCITS ETF(DR), db x-trackers MSCI USA Health Care Index UCITS ETF (DR), db x-trackers MSCI USA Energy Index UCITS ETF (DR) launched on12/09/2017, the TER shown is for the full financial year.
CONCEPT FUND SOLUTIONS PLC
Supplemental Data (Unaudited) cont/d
718
D. Annual Report Disclosures (Unaudited)
Securities Financing Transactions Regulation (Regulation (EU) 2015/2365) (“SFTR”) came into force on 12 Janu-ary 2016 and, amongst other requirements, introduces new disclosure requirements in the Fund's annual andhalf-yearly reports published after 13 January 2017 detailing the Fund's use of securities financing transactionsand total return swaps. As a result, additional disclosures have been included in the appendix to the annual report.
Securities Financing Transactions
Article 13 of Regulation (EU) 2015/2365 on transparency of securities financing transactions (SFTs) and of reuse and amending Regulation (EU) No648/2012, requires UCITS investment companies to provide the following information on the use made of SFTs and total return swaps (TRSs)
Sub-Fund Name: db x-trackers EUR Liquid Corporate 12.5 UCITS ETF
Securities commodities lending transactions
1. Below is the market value of assets engaged in securities financing transactions at 31 December 2017
EUR 292,860,934
% of Net Assets 100.57%
2. Market value of securities on loan as % of Total Lendable Assets*
EUR N/A
% Total Lendable Assets N/A
3. Listed below are the top 10 Counterparties used for each type of SFT & TRS at 31 December 2017
1. Counterparty Name Deutsche Bank
Value of outstandingtransactions EUR
292,860,934
Country of Establishment Frankfurt
4. Settlement/clearing for each type of SFT & TRS:
Euroclear
5. Maturity tenor of the SFTs & TRSs (EUR)/(GBP)/(USD)
Greater than 1 year x
6. Type and Quality of Collateral
Collateral Type
Bonds
Collateral Quality/Rating:
Cash N/A
Bonds Investment Grade
Equities N/A
Other N/A
7. Currency of Collateral
EUR
8. Maturity tenor of the Collateral (EUR)
Greater than 1 year 292,860,934
9. Ten largest Collateral Issuers
1. Collateral Issuer France
Volume of collateral receivedEUR
148,391,760
2. Collateral Issuer Germany
Volume of collateral receivedEUR
144,469,174
10. Re-investment of Collateral received
Stock Collateral re-invested N/A
Permitted re-investment of StockCollateral
N/A
Returns on Cash Collateralreinvested
N/A
11. Safe-keeping of Collateral received
Detailed in the table below are the number and names of the depositaries who are responsible for the safe-keepingof the collateral received in relation to each of the SFTs/TRSs held on the Sub-Fund.
Number of Depositaries 1
CONCEPT FUND SOLUTIONS PLC
Supplemental Data (Unaudited) cont/d
719
D. Annual Report Disclosures (Unaudited) cont/d
Securities commodities lending transactions
Depositary Euroclear
Fixed Income Collateral EUR 292,860,934
Cash Collateral EUR/GBP/USD N/A
12. Safe-keeping of Collateral pledged
Included in the table below are details of the safe-keeping of the collateral pledged from the Sub-Fund to therelevant counterparties in relation to each of the SFTs held on the Sub-Funds.
Total Value of Collateral pledgedEUR/GBP/USD
N/A
Counterparty N/A
% held in segregated accounts N/A
% held in pooled accounts N/A
% held in other accounts N/A
Total N/A
13. Returns and costs of the SFTs & TRSs (EUR)/(GBP)/(USD)
Sub-Fund
Income received N/A
Gains/Losses N/A
Costs incurred N/A
Net returns N/A
% of Overall SFT/TRS Return N/A
Manager of the Sub-Fund
Income received N/A
Gains/Losses N/A
Costs incurred N/A
Net returns N/A
% of Overall SFT/TRS Return N/A
Third parties to the agreement (e.g. Lending Agent)
Income received N/A
Gains/Losses N/A
Costs incurred N/A
Net returns N/A
% of Overall SFT/TRS Return N/A
CONCEPT FUND SOLUTIONS PLC
Supplemental Data (Unaudited) cont/d
720
D. Annual Report Disclosures (Unaudited) cont/d
Securities Financing Transactions
Article 13 of Regulation (EU) 2015/2365 on transparency of securities financing transactions (SFTs) and of reuse and amending Regulation (EU) No648/2012, requires UCITS investment companies to provide the following information on the use made of SFTs and total return swaps (TRSs)
Sub-Fund Name: db x-trackers MSCI Nordic Index UCITS ETF (DR)
Securities commodities lending transactions
1. Below is the market value of assets engaged in securities financing transactions at 31 December 2017
EUR 13,663,807
% of Net Assets 4.82%
2. Market value of securities on loan as % of Total Lendable Assets*
EUR 284,622,728
% Total Lendable Assets 4.80%
3. Listed below are the top 10 Counterparties used for each type of SFT & TRS at 31 December 2017
1. Counterparty Name Union Bank of Switzerland Master
Value of outstandingtransactions EUR
4,180,939
Country of Establishment Switzerland
2. Counterparty Name Natixis
Value of outstandingtransactions EUR
3,443,440
Country of Establishment France
3. Counterparty Name Barclays Bank
Value of outstandingtransactions EUR
2,922,784
Country of Establishment United Kingdom
4. Counterparty Name Credit Suisse Master
Value of outstandingtransactions EUR
1,823,950
Country of Establishment Switzerland
5. Counterparty Name Morgan Stanley Master
Value of outstandingtransactions EUR
1,021,316
Country of Establishment United States
6. Counterparty Name Socgen Master
Value of outstandingtransactions EUR
271,378
Country of Establishment France
4. Settlement/clearing for each type of SFT & TRS:
Collateral - Euroclear; Loan securities - domestic country
5. Maturity tenor of the SFTs & TRSs (EUR)
Open Maturity x
6. Type and Quality of Collateral
Collateral Type
Bonds
Collateral Quality/Rating:
Cash N/A
Bonds Investment Grade
Equities N/A
Other N/A
7. Currency of Collateral
EUR
8. Maturity tenor of the Collateral (EUR)
1 to 3 months 300,429
3 months to 1 year 21,556
Greater than 1 year 14,232,446
CONCEPT FUND SOLUTIONS PLC
Supplemental Data (Unaudited) cont/d
721
D. Annual Report Disclosures (Unaudited) cont/d
Securities commodities lending transactions
9. Ten largest Collateral Issuers
1. Collateral Issuer France
Volume of collateral receivedEUR
10,310,177
2. Collateral Issuer Germany
Volume of collateral receivedEUR
2,294,215
3. Collateral Issuer Austria
Volume of collateral receivedEUR
1,630,105
4. Collateral Issuer Netherlands
Volume of collateral receivedEUR
319,934
10. Re-investment of Collateral received
Stock Collateral re-invested N/A
Permitted re-investment of StockCollateral
N/A
Returns on Cash Collateralreinvested
N/A
11. Safe-keeping of Collateral received
Detailed in the table below are the number and names of the depositaries who are responsible for the safe-keepingof the collateral received in relation to each of the SFTs/TRSs held on the Sub-Fund.
Number of Depositaries 1
Depositary Euroclear
Fixed Income Collateral EUR 14,554,431
Cash Collateral EUR/GBP/USD N/A
12. Safe-keeping of Collateral pledged
Included in the table below are details of the safe-keeping of the collateral pledged from the Sub-Fund to therelevant counterparties in relation to each of the SFTs held on the Sub-Funds
Total Value of Collateral pledgedEUR/GBP/USD
N/A
Counterparty N/A
% held in segregated accounts N/A
% held in pooled accounts N/A
% held in other accounts N/A
Total N/A
13. Returns and costs of the SFTs & TRSs (EUR)
Sub-Fund
Income received 16,690
Gains/Losses N/A
Costs incurred N/A
Net returns 16,690
% of Overall SFT/TRS Return 0.70%
Manager of the Sub-Fund
Income received 3,576
Gains/Losses N/A
Costs incurred N/A
Net returns 3,576
% of Overall SFT/TRS Return 0.15%
Third parties to the agreement (e.g. Lending Agent)
Income received 3,576
Gains/Losses N/A
Costs incurred All costs related to settlement of collateral and loan securities are borne by the Securities Lending Agent.
Net returns 3,576
% of Overall SFT/TRS Return 0.15%
CONCEPT FUND SOLUTIONS PLC
Supplemental Data (Unaudited) cont/d
722
D. Annual Report Disclosures (Unaudited) cont/d
Securities Financing Transactions
Article 13 of Regulation (EU) 2015/2365 on transparency of securities financing transactions (SFTs) and of reuse and amending Regulation (EU) No648/2012, requires UCITS investment companies to provide the following information on the use made of SFTs and total return swaps (TRSs)
1. Below is the market value of assets engaged in securities financing transactions at 31 December 2017
EUR 11,577,931
% of Net Assets 12.19%
2. Market value of securities on loan as % of Total Lendable Assets*
EUR 94,819,739
% Total Lendable Assets 12.21%
3. Listed below are the top 10 Counterparties used for each type of SFT & TRS at 31 December 2017
1. Counterparty Name Merrill Lynch International
Value of outstandingtransactions EUR
5,501,226
Country of Establishment United Kingdom
2. Counterparty Name UBS
Value of outstandingtransactions EUR
3,561,719
Country of Establishment Switzerland
3. Counterparty Name JP Morgan Securities
Value of outstandingtransactions EUR
1,477,409
Country of Establishment United Kingdom
4. Counterparty Name Barclays Bank
Value of outstandingtransactions EUR
487,291
Country of Establishment United Kingdom
5. Counterparty Name Morgan Stanley
Value of outstandingtransactions EUR
428,429
Country of Establishment United Kingdom
6. Counterparty Name BNP Paribas
Value of outstandingtransactions EUR
121,857
Country of Establishment France
4. Settlement/clearing for each type of SFT & TRS:
Collateral - Euroclear; Loan securities - domestic country
5. Maturity tenor of the SFTs & TRSs (EUR)
Open Maturity x
6. Type and Quality of Collateral
Collateral Type
Bonds
Collateral Quality/Rating:
Cash N/A
Bonds Investment Grade
Equities N/A
Other N/A
7. Currency of Collateral
EUR
8. Maturity tenor of the Collateral (EUR)
3 months to 1 year 387,987
Greater than 1 year 11,864,369
9. Ten largest Collateral Issuers
CONCEPT FUND SOLUTIONS PLC
Supplemental Data (Unaudited) cont/d
723
D. Annual Report Disclosures (Unaudited) cont/d
Securities commodities lending transactions
1. Collateral Issuer France
Volume of collateral receivedEUR
7,210,453
2. Collateral Issuer Austria
Volume of collateral receivedEUR
2,658,061
3. Collateral Issuer Netherlands
Volume of collateral receivedEUR
1,457,966
4. Collateral Issuer Germany
Volume of collateral receivedEUR
925,876
10. Re-investment of Collateral received
Stock Collateral re-invested N/A
Permitted re-investment of StockCollateral
N/A
Returns on Cash Collateralreinvested
N/A
11. Safe-keeping of Collateral received
Detailed in the table below are the number and names of the depositaries who are responsible for the safe-keepingof the collateral received in relation to each of the SFTs/TRSs held on the Sub-Fund.
Number of Depositaries 1
Depositary Euroclear
Fixed Income Collateral EUR 12,252,356
Cash Collateral EUR/GBP/USD N/A
12. Safe-keeping of Collateral pledged
Included in the table below are details of the safe-keeping of the collateral pledged from the Sub-Fund to therelevant counterparties in relation to each of the SFTs held on the Sub-Funds.
Total Value of Collateral pledgedEUR/GBP/USD
N/A
Counterparty N/A
% held in segregated accounts N/A
% held in pooled accounts N/A
% held in other accounts N/A
Total N/A
13. Returns and costs of the SFTs & TRSs (EUR)
Sub-Fund
Income received 103,293
Gains/Losses N/A
Costs incurred N/A
Net returns 103,293
% of Overall SFT/TRS Return 0.70%
Manager of the Sub-Fund
Income received 22,134
Gains/Losses N/A
Costs incurred N/A
Net returns 22,134
% of Overall SFT/TRS Return 0.15%
Third parties to the agreement (e.g. Lending Agent)
Income received 22,134
Gains/Losses N/A
Costs incurred All costs related to settlement of collateral and loan securities are borne by the Securities Lending Agent.
Net returns 22,134
% of Overall SFT/TRS Return 0.15%
CONCEPT FUND SOLUTIONS PLC
Supplemental Data (Unaudited) cont/d
724
D. Annual Report Disclosures (Unaudited) cont/d
Securities Financing Transactions
Article 13 of Regulation (EU) 2015/2365 on transparency of securities financing transactions (SFTs) and of reuse and amending Regulation (EU) No648/2012, requires UCITS investment companies to provide the following information on the use made of SFTs and total return swaps (TRSs)
Sub-Fund Name: db x-trackers MSCI AC World Index UCITS ETF (DR)
Securities commodities lending transactions
1. Below is the market value of assets engaged in securities financing transactions at 31 December 2017
EUR 1,068,325
% of Net Assets 0.57%
2. Market value of securities on loan as % of Total Lendable Assets*
EUR 189,945,111
% Total Lendable Assets 0.56%
3. Listed below are the top 10 Counterparties used for each type of SFT & TRS at 31 December 2017
1. Counterparty Name ABN Amro
Value of outstandingtransactions EUR
506,212
Country of Establishment Netherlands
2. Counterparty Name ABN Amro
Value of outstandingtransactions EUR
194,053
Country of Establishment Netherlands
3. Counterparty Name UBS
Value of outstandingtransactions EUR
182,526
Country of Establishment Switzerland
4. Counterparty Name BNP Paribas
Value of outstandingtransactions EUR
103,846
Country of Establishment France
5. Counterparty Name Natixis
Value of outstandingtransactions EUR
50,373
Country of Establishment France
6. Counterparty Name HSBC Bank
Value of outstandingtransactions EUR
31,315
Country of Establishment United Kingdom
4. Settlement/clearing for each type of SFT & TRS:
Collateral - Euroclear; Loan securities - domestic country
5. Maturity tenor of the SFTs & TRSs (EUR)
Open Maturity x
6. Type and Quality of Collateral
Collateral Type
Bonds
Collateral Quality/Rating:
Cash N/A
Bonds Investment Grade
Equities N/A
Other N/A
7. Currency of Collateral
EUR
8. Maturity tenor of the Collateral (EUR)
1 to 3 months 10,019
Greater than 1 year 1,134,501
9. Ten largest Collateral Issuers
CONCEPT FUND SOLUTIONS PLC
Supplemental Data (Unaudited) cont/d
725
D. Annual Report Disclosures (Unaudited) cont/d
Securities commodities lending transactions
1. Collateral Issuer France
Volume of collateral receivedEUR
512,224
2. Collateral Issuer Austria
Volume of collateral receivedEUR
368,759
3. Collateral Issuer Netherlands
Volume of collateral receivedEUR
240,736
4. Collateral Issuer Germany
Volume of collateral receivedEUR
22,801
10. Re-investment of Collateral received
Stock Collateral re-invested N/A
Permitted re-investment of StockCollateral
N/A
Returns on Cash Collateralreinvested
N/A
11. Safe-keeping of Collateral received
Detailed in the table below are the number and names of the depositaries who are responsible for the safe-keepingof the collateral received in relation to each of the SFTs/TRSs held on the Sub-Fund.
Number of Depositaries 1
Depositary Euroclear
Fixed Income Collateral EUR 1,144,520
Cash Collateral EUR/GBP/USD N/A
12. Safe-keeping of Collateral pledged
Included in the table below are details of the safe-keeping of the collateral pledged from the Sub-Fund to therelevant counterparties in relation to each of the SFTs held on the Sub-Funds.
Total Value of Collateral pledgedEUR/GBP/USD
N/A
Counterparty N/A
% held in segregated accounts N/A
% held in pooled accounts N/A
% held in other accounts N/A
Total N/A
13. Returns and costs of the SFTs & TRSs (USD)
Sub-Fund
Income received 11,221
Gains/Losses N/A
Costs incurred N/A
Net returns 11,221
% of Overall SFT/TRS Return 0.70%
Manager of the Sub-Fund
Income received 2,404
Gains/Losses N/A
Costs incurred N/A
Net returns 2,404
% of Overall SFT/TRS Return 0.15%
Third parties to the agreement (e.g. Lending Agent)
Income received 2,404
Gains/Losses N/A
Costs incurred All costs related to settlement of collateral and loan securities are borne by the Securities Lending Agent.
Net returns 2,404
% of Overall SFT/TRS Return 0.15%
CONCEPT FUND SOLUTIONS PLC
Supplemental Data (Unaudited) cont/d
726
D. Annual Report Disclosures (Unaudited) cont/d
Securities Financing Transactions
Article 13 of Regulation (EU) 2015/2365 on transparency of securities financing transactions (SFTs) and of reuse and amending Regulation (EU) No648/2012, requires UCITS investment companies to provide the following information on the use made of SFTs and total return swaps (TRSs)
Sub-Fund Name: db x-trackers MSCI USA Index UCITS ETF (DR)
Securities commodities lending transactions
1. Below is the market value of assets engaged in securities financing transactions at 31 December 2017
USD 159,108,235
% of Net Assets 3.81%
2. Market value of securities on loan as % of Total Lendable Assets*
USD 4,218,900,970
% Total Lendable Assets 3.77%
3. Listed below are the top 10 Counterparties used for each type of SFT & TRS at 31 December 2017
1. Counterparty Name UBS
Value of outstandingtransactions USD
159,108,235
Country of Establishment Switzerland
4. Settlement/clearing for each type of SFT & TRS:
Collateral - Euroclear; Loan securities - domestic country
5. Maturity tenor of the SFTs & TRSs (USD)
Open Maturity x
6. Type and Quality of Collateral
Collateral Type
Bonds
Collateral Quality/Rating:
Cash N/A
Bonds Investment Grade
Equities N/A
Other N/A
7. Currency of Collateral
USD
8. Maturity tenor of the Collateral (USD)
1 week to 1 month 407,400
1 to 3 months 1,342,685
3 months to 1 year 5,573,357
Greater than 1 year 159,745,688
9. Ten largest Collateral Issuers
1. Collateral Issuer Netherlands
Volume of collateral receivedUSD
131,034,145
2. Collateral Issuer France
Volume of collateral receivedUSD
18,018,674
3. Collateral Issuer Austria
Volume of collateral receivedUSD
11,386,480
4. Collateral Issuer Germany
Volume of collateral receivedUSD
6,629,831
10. Re-investment of Collateral received
Stock Collateral re-invested N/A
Permitted re-investment of StockCollateral
N/A
Returns on Cash Collateralreinvested
N/A
11. Safe-keeping of Collateral received
CONCEPT FUND SOLUTIONS PLC
Supplemental Data (Unaudited) cont/d
727
D. Annual Report Disclosures (Unaudited) cont/d
Securities commodities lending transactions
Detailed in the table below are the number and names of the depositaries who are responsible for the safe-keepingof the collateral received in relation to each of the SFTs/TRSs held on the Sub-Fund.
Number of Depositaries 1
Depositary Euroclear
Fixed Income Collateral USD 167,069,130
Cash Collateral EUR/GBP/USD N/A
12. Safe-keeping of Collateral pledged
Included in the table below are details of the safe-keeping of the collateral pledged from the Sub-Fund to therelevant counterparties in relation to each of the SFTs held on the Sub-Funds.
Total Value of Collateral pledgedEUR/GBP/USD
N/A
Counterparty N/A
% held in segregated accounts N/A
% held in pooled accounts N/A
% held in other accounts N/A
Total N/A
13. Returns and costs of the SFTs & TRSs (USD)
Sub-Fund
Income received 197,327
Gains/Losses N/A
Costs incurred N/A
Net returns 197,327
% of Overall SFT/TRS Return 0.70%
Manager of the Sub-Fund
Income received 42,284
Gains/Losses N/A
Costs incurred N/A
Net returns 42,284
% of Overall SFT/TRS Return 0.15%
Third parties to the agreement (e.g. Lending Agent)
Income received 42,284
Gains/Losses N/A
Costs incurred All costs related to settlement of collateral and loan securities are borne by the Securities Lending Agent.
Net returns 42,284
% of Overall SFT/TRS Return 0.15%
CONCEPT FUND SOLUTIONS PLC
Supplemental Data (Unaudited) cont/d
728
D. Annual Report Disclosures (Unaudited) cont/d
Securities Financing Transactions
Article 13 of Regulation (EU) 2015/2365 on transparency of securities financing transactions (SFTs) and of reuse and amending Regulation (EU) No648/2012, requires UCITS investment companies to provide the following information on the use made of SFTs and total return swaps (TRSs)
1. Below is the market value of assets engaged in securities financing transactions at 31 December 2017
USD 29,644,743
% of Net Assets 5.12%
2. Market value of securities on loan as % of Total Lendable Assets*
USD 585,264,062
% Total Lendable Assets 5.07%
3. Listed below are the top 10 Counterparties used for each type of SFT & TRS at 31 December 2017
1. Counterparty Name UBS
Value of outstandingtransactions USD
29,644,743
Country of Establishment Switzerland
4. Settlement/clearing for each type of SFT & TRS:
Collateral - Euroclear; Loan securities - domestic country
5. Maturity tenor of the SFTs & TRSs (EUR)/(GBP)/(USD)
Open Maturity x
6. Type and Quality of Collateral
Collateral Type
Bonds
Collateral Quality/Rating:
Cash N/A
Bonds Investment Grade
Equities N/A
Other N/A
7. Currency of Collateral
USD
8. Maturity tenor of the Collateral (USD)
1 to 3 months 292,359
3 months to 1 year 3,866,333
Greater than 1 year 27,088,243
9. Ten largest Collateral Issuers
1. Collateral Issuer Netherlands
Volume of collateral receivedUSD
19,167,309
2. Collateral Issuer Austria
Volume of collateral receivedUSD
8,578,444
3. Collateral Issuer Germany
Volume of collateral receivedUSD
3,501,182
10. Re-investment of Collateral received
Stock Collateral re-invested N/A
Permitted re-investment of StockCollateral
N/A
Returns on Cash Collateralreinvested
N/A
11. Safe-keeping of Collateral received
Detailed in the table below are the number and names of the depositaries who are responsible for the safe-keepingof the collateral received in relation to each of the SFTs/TRSs held on the Sub-Fund.
Number of Depositaries 1
Depositary Euroclear
CONCEPT FUND SOLUTIONS PLC
Supplemental Data (Unaudited) cont/d
729
D. Annual Report Disclosures (Unaudited) cont/d
Securities commodities lending transactions
Fixed Income Collateral USD 31,246,935
Cash Collateral EUR/GBP/USD N/A
12. Safe-keeping of Collateral pledged
Included in the table below are details of the safe-keeping of the collateral pledged from the Sub-Fund to therelevant counterparties in relation to each of the SFTs held on the Sub-Funds.
Total Value of Collateral pledgedEUR/GBP/USD
N/A
Counterparty N/A
% held in segregated accounts N/A
% held in pooled accounts N/A
% held in other accounts N/A
Total N/A
13. Returns and costs of the SFTs & TRSs (USD)
Sub-Fund
Income received 39,683
Gains/Losses N/A
Costs incurred N/A
Net returns 39,683
% of Overall SFT/TRS Return 0.70%
Manager of the Sub-Fund
Income received 8,503
Gains/Losses N/A
Costs incurred N/A
Net returns 8,503
% of Overall SFT/TRS Return 0.15%
Third parties to the agreement (e.g. Lending Agent)
Income received 8,503
Gains/Losses N/A
Costs incurred All costs related to settlement of collateral and loan securities are borne by the Securities Lending Agent.
Net returns 8,503
% of Overall SFT/TRS Return 0.15%
CONCEPT FUND SOLUTIONS PLC
Supplemental Data (Unaudited) cont/d
730
D. Annual Report Disclosures (Unaudited) cont/d
Securities Financing Transactions
Article 13 of Regulation (EU) 2015/2365 on transparency of securities financing transactions (SFTs) and of reuse and amending Regulation (EU) No648/2012, requires UCITS investment companies to provide the following information on the use made of SFTs and total return swaps (TRSs)
Sub-Fund Name: db x-trackers MSCI World Index UCITS ETF (DR)
Securities commodities lending transactions
1. Below is the market value of assets engaged in securities financing transactions at 31 December 2017
USD 34,135,034
% of Net Assets 1.03%
2. Market value of securities on loan as % of Total Lendable Assets*
USD 2,714,337,548
% Total Lendable Assets 1.26%
3. Listed below are the top 10 Counterparties used for each type of SFT & TRS at 31 December 2017
1. Counterparty Name Citigroup Global Markets Limited
Value of outstandingtransactions USD
11,936,376
Country of Establishment United Kingdom
2. Counterparty Name ABN Amro
Value of outstandingtransactions USD
9,240,265
Country of Establishment Netherlands
3. Counterparty Name UBS
Value of outstandingtransactions USD
5,809,105
Country of Establishment Switzerland
4. Counterparty Name Natixis
Value of outstandingtransactions USD
3,469,224
Country of Establishment France
5. Counterparty Name HSBC Bank
Value of outstandingtransactions USD
1,457,643
Country of Establishment United Kingdom
6. Counterparty Name Societe Generale
Value of outstandingtransactions USD
1,293,417
Country of Establishment France
7. Counterparty Name Bank of Nova Scotia
Value of outstandingtransactions USD
449,580
Country of Establishment Canada
8. Counterparty Name Merrill Lynch International
Value of outstandingtransactions USD
384,142
Country of Establishment United Kingdom
9. Counterparty Name JP Morgan Securities
Value of outstandingtransactions USD
95,282
Country of Establishment United Kingdom
4. Settlement/clearing for each type of SFT & TRS:
Collateral - Euroclear; Loan securities - domestic country
5. Maturity tenor of the SFTs & TRSs (USD)
Open Maturity x
6. Type and Quality of Collateral
Collateral Type
Bonds
CONCEPT FUND SOLUTIONS PLC
Supplemental Data (Unaudited) cont/d
731
D. Annual Report Disclosures (Unaudited) cont/d
Securities commodities lending transactions
Collateral Quality/Rating:
Cash N/A
Bonds Investment Grade
Equities N/A
Other N/A
7. Currency of Collateral
EUR
8. Maturity tenor of the Collateral (USD)
1 to 3 months 1,403,182
3 months to 1 year 7,219
Greater than 1 year 34,983,148
9. Ten largest Collateral Issuers
1. Collateral Issuer France
Volume of collateral receivedUSD
21,300,133
2. Collateral Issuer Netherlands
Volume of collateral receivedUSD
9,962,035
3. Collateral Issuer Germany
Volume of collateral receivedUSD
4,057,668
4. Collateral Issuer Austira
Volume of collateral receivedUSD
1,037,011
5. Collateral Issuer Finland
Volume of collateral receivedUSD
36,702
10. Re-investment of Collateral received
Stock Collateral re-invested N/A
Permitted re-investment of StockCollateral
N/A
Returns on Cash Collateralreinvested
N/A
11. Safe-keeping of Collateral received
Detailed in the table below are the number and names of the depositaries who are responsible for the safe-keepingof the collateral received in relation to each of the SFTs/TRSs held on the Sub-Fund.
Number of Depositaries 1
Depositary Euroclear
Fixed Income Collateral USD 36,393,549
Cash Collateral EUR/GBP/USD N/A
12. Safe-keeping of Collateral pledged
Included in the table below are details of the safe-keeping of the collateral pledged from the Sub-Fund to therelevant counterparties in relation to each of the SFTs held on the Sub-Funds.
Total Value of Collateral pledgedEUR/GBP/USD
N/A
Counterparty N/A
% held in segregated accounts N/A
% held in pooled accounts N/A
% held in other accounts N/A
Total N/A
13. Returns and costs of the SFTs & TRSs (EUR)
Sub-Fund
Income received 222,956
Gains/Losses N/A
Costs incurred N/A
CONCEPT FUND SOLUTIONS PLC
Supplemental Data (Unaudited) cont/d
732
D. Annual Report Disclosures (Unaudited) cont/d
Securities commodities lending transactions
Net returns 222,956
% of Overall SFT/TRS Return 0.70%
Manager of the Sub-Fund
Income received 47,776
Gains/Losses N/A
Costs incurred N/A
Net returns 47,776
% of Overall SFT/TRS Return 0.15%
Third parties to the agreement (e.g. Lending Agent)
Income received 47,776
Gains/Losses N/A
Costs incurred All costs related to settlement of collateral and loan securities are borne by the Securities Lending Agent.
% of Overall SFT/TRS Return 0.15%
CONCEPT FUND SOLUTIONS PLC
Supplemental Data (Unaudited) cont/d
733
D. Annual Report Disclosures (Unaudited) cont/d
Securities Financing Transactions
Article 13 of Regulation (EU) 2015/2365 on transparency of securities financing transactions (SFTs) and of reuse and amending Regulation (EU) No648/2012, requires UCITS investment companies to provide the following information on the use made of SFTs and total return swaps (TRSs)
Sub-Fund Name: db x-trackers MSCI World Minimum Volatility UCITS ETF (DR)
Securities commodities lending transactions
1. Below is the market value of assets engaged in securities financing transactions at 31 December 2017
USD 575,543
% of Net Assets 1.11%
2. Market value of securities on loan as % of Total Lendable Assets*
USD 65,254,932
% Total Lendable Assets 0.88%
3. Listed below are the top 10 Counterparties used for each type of SFT & TRS at 31 December 2017
1. Counterparty Name Barclays Capital Securities
Value of outstandingtransactions USD
344,265
Country of Establishment United Kingdom
2. Counterparty Name Natixis
Value of outstandingtransactions USD
231,278
Country of Establishment France
4. Settlement/clearing for each type of SFT & TRS:
Collateral - Euroclear; Loan securities - domestic country
5. Maturity tenor of the SFTs & TRSs (EUR)/(GBP)/(USD)
Open Maturity x
6. Type and Quality of Collateral
Collateral Type
Bonds
Collateral Quality/Rating:
Cash N/A
Bonds Investment Grade
Equities N/A
Other N/A
7. Currency of Collateral
EUR
8. Maturity tenor of the Collateral (USD)
3 months to 1 year 4,863
Greater than 1 year 627,314
9. Ten largest Collateral Issuers
1. Collateral Issuer Germany
Volume of collateral receivedUSD
269,024
2. Collateral Issuer France
Volume of collateral receivedUSD
209,543
3. Collateral Issuer Netherlands
Volume of collateral receivedUSD
146,982
4. Collateral Issuer Austria
Volume of collateral receivedUSD
6,628
10. Re-investment of Collateral received
Stock Collateral re-invested N/A
Permitted re-investment of StockCollateral
N/A
CONCEPT FUND SOLUTIONS PLC
Supplemental Data (Unaudited) cont/d
734
D. Annual Report Disclosures (Unaudited) cont/d
Securities commodities lending transactions
Returns on Cash Collateralreinvested
N/A
11. Safe-keeping of Collateral received
Detailed in the table below are the number and names of the depositaries who are responsible for the safe-keepingof the collateral received in relation to each of the SFTs/TRSs held on the Sub-Fund.
Number of Depositaries 1
Depositary Euroclear
Fixed Income Collateral USD 632,177
Cash Collateral EUR/GBP/USD N/A
12. Safe-keeping of Collateral pledged
Included in the table below are details of the safe-keeping of the collateral pledged from the Sub-Fund to therelevant counterparties in relation to each of the SFTs held on the Sub-Funds.
Total Value of Collateral pledgedEUR/GBP/USD
N/A
Counterparty N/A
% held in segregated accounts N/A
% held in pooled accounts N/A
% held in other accounts N/A
Total N/A
13. Returns and costs of the SFTs & TRSs (USD)
Sub-Fund
Income received 3,347
Gains/Losses N/A
Costs incurred N/A
Net returns 3,347
% of Overall SFT/TRS Return 0.70%
Manager of the Sub-Fund
Income received 717
Gains/Losses N/A
Costs incurred N/A
Net returns 717
% of Overall SFT/TRS Return 0.15%
Third parties to the agreement (e.g. Lending Agent)
Income received 717
Gains/Losses N/A
Costs incurred All costs related to settlement of collateral and loan securities are borne by the Securities Lending Agent.
Net returns 717
% of Overall SFT/TRS Return 0.15%
CONCEPT FUND SOLUTIONS PLC
Supplemental Data (Unaudited) cont/d
735
D. Annual Report Disclosures (Unaudited) cont/d
Securities Financing Transactions
Article 13 of Regulation (EU) 2015/2365 on transparency of securities financing transactions (SFTs) and of reuse and amending Regulation (EU) No648/2012, requires UCITS investment companies to provide the following information on the use made of SFTs and total return swaps (TRSs)
1. Below is the market value of assets engaged in securities financing transactions at 31 December 2017
USD 224,521
% of Net Assets 0.21%
2. Market value of securities on loan as % of Total Lendable Assets*
USD 38,009,797
% Total Lendable Assets 0.59%
3. Listed below are the top 10 Counterparties used for each type of SFT & TRS at 31 December 2017
1. Counterparty Name Barclays Capital Securities
Value of outstandingtransactions USD
224,521
Country of Establishment United Kingdom
4. Settlement/clearing for each type of SFT & TRS:
Collateral - Euroclear; Loan securities - domestic country
5. Maturity tenor of the SFTs & TRSs (USD)
Open Maturity x
6. Type and Quality of Collateral
Collateral Type
Bonds
Collateral Quality/Rating:
Cash N/A
Bonds Investment Grade
Equities N/A
Other N/A
7. Currency of Collateral
EUR
8. Maturity tenor of the Collateral (USD)
Greater than 1 year 254,827
Open Maturity
9. Ten largest Collateral Issuers
1. Collateral Issuer France
Volume of collateral receivedUSD
254,827
10. Re-investment of Collateral received
Stock Collateral re-invested N/A
Permitted re-investment of StockCollateral
N/A
Returns on Cash Collateralreinvested
N/A
11. Safe-keeping of Collateral received
Detailed in the table below are the number and names of the depositaries who are responsible for the safe-keepingof the collateral received in relation to each of the SFTs/TRSs held on the Sub-Fund.
Number of Depositaries 1
Depositary Euroclear
Fixed Income Collateral USD 254,827
Cash Collateral EUR/GBP/USD N/A
12. Safe-keeping of Collateral pledged
Included in the table below are details of the safe-keeping of the collateral pledged from the Sub-Fund to therelevant counterparties in relation to each of the SFTs held on the Sub-Funds.
Total Value of Collateral pledgedEUR/GBP/USD
N/A
CONCEPT FUND SOLUTIONS PLC
Supplemental Data (Unaudited) cont/d
736
D. Annual Report Disclosures (Unaudited) cont/d
Securities commodities lending transactions
Counterparty N/A
% held in segregated accounts N/A
% held in pooled accounts N/A
% held in other accounts N/A
Total N/A
13. Returns and costs of the SFTs & TRSs (USD)
Sub-Fund
Income received 1,971
Gains/Losses N/A
Costs incurred N/A
Net returns 1,971
% of Overall SFT/TRS Return 0.70%
Manager of the Sub-Fund
Income received 422
Gains/Losses N/A
Costs incurred N/A
Net returns 422
% of Overall SFT/TRS Return 0.15%
Third parties to the agreement (e.g. Lending Agent)
Income received 422
Gains/Losses N/A
Costs incurred All costs related to settlement of collateral and loan securities are borne by the Securities Lending Agent.
% of Overall SFT/TRS Return 0.15%
CONCEPT FUND SOLUTIONS PLC
Supplemental Data (Unaudited) cont/d
737
D. Annual Report Disclosures (Unaudited) cont/d
Securities Financing Transactions
Article 13 of Regulation (EU) 2015/2365 on transparency of securities financing transactions (SFTs) and of reuse and amending Regulation (EU) No648/2012, requires UCITS investment companies to provide the following information on the use made of SFTs and total return swaps (TRSs)
Sub-Fund Name: db x-trackers MSCI World Quality Factor UCITS ETF (DR)
Securities commodities lending transactions
1. Below is the market value of assets engaged in securities financing transactions at 31 December 2017
USD 915,213
% of Net Assets 0.91%
2. Market value of securities on loan as % of Total Lendable Assets*
USD 49,745,949
% Total Lendable Assets 1.84%
3. Listed below are the top 10 Counterparties used for each type of SFT & TRS at 31 December 2017
1. Counterparty Name Citigroup Global Markets Limited
Value of outstandingtransactions USD
754,113
Country of Establishment United Kingdom
2. Counterparty Name UBS
Value of outstandingtransactions USD
161,099
Country of Establishment Switzerland
4. Settlement/clearing for each type of SFT & TRS:
Collateral - Euroclear; Loan securities - domestic country
5. Maturity tenor of the SFTs & TRSs (USD)
Open Maturity x
6. Type and Quality of Collateral
Collateral Type
Bonds
Collateral Quality/Rating:
Cash N/A
Bonds Investment Grade
Equities N/A
Other N/A
7. Currency of Collateral
USD
8. Maturity tenor of the Collateral (USD)
3 months to 1 year 516,868
Greater than 1 year 472,481
9. Ten largest Collateral Issuers
1. Collateral Issuer France
Volume of collateral receivedUSD
986,890
2. Collateral Issuer Austria
Volume of collateral receivedUSD
1,231
3. Collateral Issuer Germany
Volume of collateral receivedUSD
1,228
10. Re-investment of Collateral received
Stock Collateral re-invested N/A
Permitted re-investment of StockCollateral
N/A
Returns on Cash Collateralreinvested
N/A
11. Safe-keeping of Collateral received
CONCEPT FUND SOLUTIONS PLC
Supplemental Data (Unaudited) cont/d
738
D. Annual Report Disclosures (Unaudited) cont/d
Securities commodities lending transactions
Detailed in the table below are the number and names of the depositaries who are responsible for the safe-keepingof the collateral received in relation to each of the SFTs/TRSs held on the Sub-Fund.
Number of Depositaries 1
Depositary Euroclear
Fixed Income Collateral USD 989,349
Cash Collateral EUR/GBP/USD N/A
12. Safe-keeping of Collateral pledged
Included in the table below are details of the safe-keeping of the collateral pledged from the Sub-Fund to therelevant counterparties in relation to each of the SFTs held on the Sub-Funds.
Total Value of Collateral pledgedEUR/GBP/USD
N/A
Counterparty N/A
% held in segregated accounts N/A
% held in pooled accounts N/A
% held in other accounts N/A
Total N/A
13. Returns and costs of the SFTs & TRSs (USD)
Sub-Fund
Income received 2,199
Gains/Losses N/A
Costs incurred N/A
Net returns 2,199
% of Overall SFT/TRS Return 0.70%
Manager of the Sub-Fund
Income received 471
Gains/Losses N/A
Costs incurred N/A
Net returns 471
% of Overall SFT/TRS Return 0.15%
Third parties to the agreement (e.g. Lending Agent)
Income received 471
Gains/Losses N/A
Costs incurred All costs related to settlement of collateral and loan securities are borne by the Securities Lending Agent.
Net returns 471
% of Overall SFT/TRS Return 0.15%
CONCEPT FUND SOLUTIONS PLC
Supplemental Data (Unaudited) cont/d
739
D. Annual Report Disclosures (Unaudited) cont/d
Securities Financing Transactions
Article 13 of Regulation (EU) 2015/2365 on transparency of securities financing transactions (SFTs) and of reuse and amending Regulation (EU) No648/2012, requires UCITS investment companies to provide the following information on the use made of SFTs and total return swaps (TRSs)
Sub-Fund Name: db x-trackers MSCI World Value Factor UCITS ETF (DR)
Securities commodities lending transactions
1. Below is the market value of assets engaged in securities financing transactions at 31 December 2017
USD 1,917,998
% of Net Assets 0.94%
2. Market value of securities on loan as % of Total Lendable Assets*
USD 118,795,191
% Total Lendable Assets 1.61%
3. Listed below are the top 10 Counterparties used for each type of SFT & TRS at 31 December 2017
1. Counterparty Name Citigroup Global Markets Limited
Value of outstandingtransactions USD
1,224,871
Country of Establishment United Kingdom
2. Counterparty Name UBS
Value of outstandingtransactions USD
693,127
Country of Establishment Switzerland
4. Settlement/clearing for each type of SFT & TRS:
Collateral - Euroclear; Loan securities - domestic country
5. Maturity tenor of the SFTs & TRSs (USD)
Open Maturity x
6. Type and Quality of Collateral
Collateral Type
Bonds
Collateral Quality/Rating:
Cash N/A
Bonds Investment Grade
Equities N/A
Other N/A
7. Currency of Collateral
USD
8. Maturity tenor of the Collateral (USD)
3 months to 1 year 1,292,170
Greater than 1 year 730,124
9. Ten largest Collateral Issuers
1. Collateral Issuer France
Volume of collateral receivedUSD
1,342,928
2. Collateral Issuer Austria
Volume of collateral receivedUSD
424,250
3. Collateral Issuer Germany
Volume of collateral receivedUSD
204,052
4. Collateral Issuer Netherland
Volume of collateral receivedUSD
51,064
10. Re-investment of Collateral received
Stock Collateral re-invested N/A
Permitted re-investment of StockCollateral
N/A
CONCEPT FUND SOLUTIONS PLC
Supplemental Data (Unaudited) cont/d
740
D. Annual Report Disclosures (Unaudited) cont/d
Securities commodities lending transactions
Returns on Cash Collateralreinvested
N/A
11. Safe-keeping of Collateral received
Detailed in the table below are the number and names of the depositaries who are responsible for the safe-keepingof the collateral received in relation to each of the SFTs/TRSs held on the Sub-Fund.
Number of Depositaries 1
Depositary Euroclear
Fixed Income Collateral USD 2,022,294
Cash Collateral EUR/GBP/USD N/A
12. Safe-keeping of Collateral pledged
Included in the table below are details of the safe-keeping of the collateral pledged from the Sub-Fund to therelevant counterparties in relation to each of the SFTs held on the Sub-Funds.
Total Value of Collateral pledgedEUR/GBP/USD
N/A
Counterparty N/A
% held in segregated accounts N/A
% held in pooled accounts N/A
% held in other accounts N/A
Total N/A
13. Returns and costs of the SFTs & TRSs (USD)
Sub-Fund
Income received 9,205
Gains/Losses N/A
Costs incurred N/A
Net returns 9,205
% of Overall SFT/TRS Return 0.70%
Manager of the Sub-Fund
Income received 1,972
Gains/Losses N/A
Costs incurred N/A
Net returns 1,972
% of Overall SFT/TRS Return 0.15%
Third parties to the agreement (e.g. Lending Agent)
Income received 1,972
Gains/Losses N/A
Costs incurred All costs related to settlement of collateral and loan securities are borne by the Securities Lending Agent.
Net returns 1,972
% of Overall SFT/TRS Return 0.15%
CONCEPT FUND SOLUTIONS PLC
Supplemental Data (Unaudited) cont/d
741
D. Annual Report Disclosures (Unaudited) cont/d
Securities Financing Transactions
Article 13 of Regulation (EU) 2015/2365 on transparency of securities financing transactions (SFTs) and of reuse and amending Regulation (EU) No648/2012, requires UCITS investment companies to provide the following information on the use made of SFTs and total return swaps (TRSs)
Sub-Fund Name: Deutsche MSCI World Index Fund
Securities commodities lending transactions
1. Below is the market value of assets engaged in securities financing transactions at 31 December 2017
EUR 40,544
% of Net Assets 0.12%
2. Market value of securities on loan as % of Total Lendable Assets*
EUR 34,019,413
% Total Lendable Assets 0.12%
3. Listed below are the top 10 Counterparties used for each type of SFT & TRS at 31 December 2017
1. Counterparty Name Barclays Capital Securities
Value of outstandingtransactions USD
34,784
Country of Establishment United Kingdom
2. Counterparty Name UBS
Value of outstandingtransactions EUR
5,760
Country of Establishment Switzlerland
4. Settlement/clearing for each type of SFT & TRS:
Collateral - Euroclear; Loan securities - domestic country
5. Maturity tenor of the SFTs & TRSs (EUR)
Open Maturity x
6. Type and Quality of Collateral
Collateral Type
Bonds
Collateral Quality/Rating:
Cash N/A
Bonds Investment Grade
Equities N/A
Other N/A
7. Currency of Collateral
EUR
8. Maturity tenor of the Collateral (EUR)
Greater than 1 year 61,428
9. Ten largest Collateral Issuers
1. Collateral Issuer France
Volume of collateral receivedEUR
61,428
10. Re-investment of Collateral received
Stock Collateral re-invested N/A
Permitted re-investment of StockCollateral
N/A
Returns on Cash Collateralreinvested
N/A
11. Safe-keeping of Collateral received
Detailed in the table below are the number and names of the depositaries who are responsible for the safe-keepingof the collateral received in relation to each of the SFTs/TRSs held on the Sub-Fund.
Number of Depositaries 1
Depositary Euroclear
Fixed Income Collateral EUR 61,428
Cash Collateral EUR/GBP/USD N/A
12. Safe-keeping of Collateral pledged
CONCEPT FUND SOLUTIONS PLC
Supplemental Data (Unaudited) cont/d
742
D. Annual Report Disclosures (Unaudited) cont/d
Securities commodities lending transactions
Included in the table below are details of the safe-keeping of the collateral pledged from the Sub-Fund to therelevant counterparties in relation to each of the SFTs held on the Sub-Funds.
Total Value of Collateral pledgedEUR/GBP/USD
N/A
Counterparty N/A
% held in segregated accounts N/A
% held in pooled accounts N/A
% held in other accounts N/A
Total N/A
13. Returns and costs of the SFTs & TRSs (EUR)
Sub-Fund
Income received 1,594
Gains/Losses N/A
Costs incurred N/A
Net returns 1,594
% of Overall SFT/TRS Return 0.70%
Manager of the Sub-Fund
Income received 342
Gains/Losses N/A
Costs incurred N/A
Net returns 342
% of Overall SFT/TRS Return 0.15%
Third parties to the agreement (e.g. Lending Agent)
Income received 342
Gains/Losses N/A
Costs incurred All costs related to settlement of collateral and loan securities are borne by the Securities Lending Agent.
Net returns 342
% of Overall SFT/TRS Return 0.15%
CONCEPT FUND SOLUTIONS PLC
Supplemental Data (Unaudited) cont/d
743
D. Annual Report Disclosures (Unaudited) cont/d
Securities Financing Transactions
Article 13 of Regulation (EU) 2015/2365 on transparency of securities financing transactions (SFTs) and of reuse and amending Regulation (EU) No648/2012, requires UCITS investment companies to provide the following information on the use made of SFTs and total return swaps (TRSs)
Sub-Fund Name: db x-trackers MSCI GCC Select Index UCITS ETF
Securities commodities lending transactions
1. Below is the market value of assets engaged in securities financing transactions at 31 December 2017
USD 24,276,906
% of Net Assets 101.63%
2. Market value of securities on loan as % of Total Lendable Assets*
USD N/A
% Total Lendable Assets N/A
3. Listed below are the top 10 Counterparties used for each type of SFT & TRS at 31 December 2017
1. Counterparty Name HSBC Bank
Value of outstandingtransactions USD
24,276,906
Country of Establishment United Kingdom
4. Settlement/clearing for each type of SFT & TRS:
Detailed in the table below are the number and names of the depositaries who are responsible for the safe-keepingof the collateral received in relation to each of the SFTs/TRSs held on the Sub-Fund.
Number of Depositaries 6
Depositary Local sub-custodian
Stock Collateral USD 24,276,906
Cash Collateral EUR/GBP/USD N/A
12. Safe-keeping of Collateral pledged
Included in the table below are details of the safe-keeping of the collateral pledged from the Sub-Fund to therelevant counterparties in relation to each of the SFTs held on the Sub-Funds.
Total Value of Collateral pledgedEUR/GBP/USD
N/A
Counterparty N/A
% held in segregated accounts N/A
% held in pooled accounts N/A
% held in other accounts N/A
Total N/A
13. Returns and costs of the SFTs & TRSs (USD)
Sub-Fund
Income received N/A
Gains/Losses N/A
Costs incurred N/A
Net returns N/A
% of Overall SFT/TRS Return N/A
Manager of the Sub-Fund
Income received N/A
Gains/Losses N/A
Costs incurred N/A
Net returns N/A
% of Overall SFT/TRS Return N/A
Third parties to the agreement (e.g. Lending Agent)
Income received N/A
Gains/Losses N/A
Costs incurred N/A
Net returns N/A
% of Overall SFT/TRS Return N/A
CONCEPT FUND SOLUTIONS PLC
Supplemental Data (Unaudited) cont/d
745
D. Annual Report Disclosures (Unaudited) cont/d
Securities Financing Transactions
Article 13 of Regulation (EU) 2015/2365 on transparency of securities financing transactions (SFTs) and of reuse and amending Regulation (EU) No648/2012, requires UCITS investment companies to provide the following information on the use made of SFTs and total return swaps (TRSs)
Sub-Fund Name: db x-trackers FTSE All-World ex UK UCITS ETF (DR)
Securities commodities lending transactions
1. Below is the market value of assets engaged in securities financing transactions at 31 December 2017
GBP 41,464
% of Net Assets 0.14%
2. Market value of securities on loan as % of Total Lendable Assets*
GBP 28,892,691
% Total Lendable Assets 0.11%
3. Listed below are the top 10 Counterparties used for each type of SFT & TRS at 31 December 2017
1. Counterparty Name Barclays Capital Securities
Value of outstandingtransactions GBP
41,464
Country of Establishment United Kingdom
4. Settlement/clearing for each type of SFT & TRS:
Collateral - Euroclear; Loan securities - domestic country
5. Maturity tenor of the SFTs & TRSs (EUR)/(GBP)/(USD)
Open Maturity x
6. Type and Quality of Collateral
Collateral Type
Bonds
Collateral Quality/Rating:
Cash N/A
Bonds Investment Grade
Equities N/A
Other N/A
7. Currency of Collateral
GBP
8. Maturity tenor of the Collateral (GBP)
Greater than 1 year 48,229
9. Ten largest Collateral Issuers
1. Collateral Issuer France
Volume of collateral receivedGBP
31,614
2. Collateral Issuer Germany
Volume of collateral receivedGBP
16,615
10. Re-investment of Collateral received
Stock Collateral re-invested N/A
Permitted re-investment of StockCollateral
N/A
Returns on Cash Collateralreinvested
N/A
11. Safe-keeping of Collateral received
Detailed in the table below are the number and names of the depositaries who are responsible for the safe-keepingof the collateral received in relation to each of the SFTs/TRSs held on the Sub-Fund.
Number of Depositaries 1
Depositary Euroclear
Fixed Income Collateral GBP 48,229
Cash Collateral EUR/GBP/USD N/A
12. Safe-keeping of Collateral pledged
Included in the table below are details of the safe-keeping of the collateral pledged from the Sub-Fund to therelevant counterparties in relation to each of the SFTs held on the Sub-Funds.
CONCEPT FUND SOLUTIONS PLC
Supplemental Data (Unaudited) cont/d
746
D. Annual Report Disclosures (Unaudited) cont/d
Securities commodities lending transactions
Total Value of Collateral pledgedEUR/GBP/USD
N/A
Counterparty N/A
% held in segregated accounts N/A
% held in pooled accounts N/A
% held in other accounts N/A
Total N/A
13. Returns and costs of the SFTs & TRSs (GBP)
Sub-Fund
Income received 344
Gains/Losses N/A
Costs incurred N/A
Net returns 344
% of Overall SFT/TRS Return 0.70%
Manager of the Sub-Fund
Income received 74
Gains/Losses N/A
Costs incurred N/A
Net returns 74
% of Overall SFT/TRS Return 0.15%
Third parties to the agreement (e.g. Lending Agent)
Income received 74
Gains/Losses N/A
Costs incurred All costs related to settlement of collateral and loan securities are borne by the Securities Lending Agent.
Net returns 74
% of Overall SFT/TRS Return 0.15%
CONCEPT FUND SOLUTIONS PLC
Supplemental Data (Unaudited) cont/d
747
D. Annual Report Disclosures (Unaudited) cont/d
Securities Financing Transactions
Article 13 of Regulation (EU) 2015/2365 on transparency of securities financing transactions (SFTs) and of reuse and amending Regulation (EU) No648/2012, requires UCITS investment companies to provide the following information on the use made of SFTs and total return swaps (TRSs)
Sub-Fund Name: db x-trackers S&P 500 UCITS ETF (DR)
Securities commodities lending transactions
1. Below is the market value of assets engaged in securities financing transactions at 31 December 2017
USD 24,566,450
% of Net Assets 1.75%
2. Market value of securities on loan as % of Total Lendable Assets*
USD 1,406,853,004
% Total Lendable Assets 1.75%
3. Listed below are the top 10 Counterparties used for each type of SFT & TRS at 31 December 2017
1. Counterparty Name UBS
Value of outstandingtransactions USD
24,566,450
Country of Establishment Switzerland
4. Settlement/clearing for each type of SFT & TRS:
Collateral - Euroclear; Loan securities - domestic country
5. Maturity tenor of the SFTs & TRSs (USD)
Open Maturity x
6. Type and Quality of Collateral
Collateral Type
Bonds
Collateral Quality/Rating:
Cash N/A
Bonds Investment Grade
Equities N/A
Other N/A
7. Currency of Collateral
USD
8. Maturity tenor of the Collateral (USD)
1 to 3 months 28,874
3 months to 1 year 37,604
Greater than 1 year 25,920,077
9. Ten largest Collateral Issuers
1. Collateral Issuer France
Volume of collateral receivedUSD
12,756,662
2. Collateral Issuer Germany
Volume of collateral receivedUSD
11,580,228
3. Collateral Issuer Netherlands
Volume of collateral receivedUSD
1,462,081
4. Collateral Issuer Austria
Volume of collateral receivedUSD
187,584
10. Re-investment of Collateral received
Stock Collateral re-invested N/A
Permitted re-investment of StockCollateral
N/A
Returns on Cash Collateralreinvested
N/A
11. Safe-keeping of Collateral received
CONCEPT FUND SOLUTIONS PLC
Supplemental Data (Unaudited) cont/d
748
D. Annual Report Disclosures (Unaudited) cont/d
Securities commodities lending transactions
Detailed in the table below are the number and names of the depositaries who are responsible for the safe-keepingof the collateral received in relation to each of the SFTs/TRSs held on the Sub-Fund.
Number of Depositaries 1
Depositary Euroclear
Fixed Income Collateral USD 25,986,555
Cash Collateral EUR/GBP/USD N/A
12. Safe-keeping of Collateral pledged
Included in the table below are details of the safe-keeping of the collateral pledged from the Sub-Fund to therelevant counterparties in relation to each of the SFTs held on the Sub-Funds.
Total Value of Collateral pledgedEUR/GBP/USD
N/A
Counterparty N/A
% held in segregated accounts N/A
% held in pooled accounts N/A
% held in other accounts N/A
Total N/A
13. Returns and costs of the SFTs & TRSs (USD)
Sub-Fund
Income received 33,303
Gains/Losses N/A
Costs incurred N/A
Net returns 33,303
% of Overall SFT/TRS Return 0.70%
Manager of the Sub-Fund
Income received 7,136
Gains/Losses N/A
Costs incurred N/A
Net returns 7,136
% of Overall SFT/TRS Return 0.15%
Third parties to the agreement (e.g. Lending Agent)
Income received 7,136
Gains/Losses N/A
Costs incurred All costs related to settlement of collateral and loan securities are borne by the Securities Lending Agent.
Net returns 7,136
% of Overall SFT/TRS Return 0.15%
CONCEPT FUND SOLUTIONS PLC
Supplemental Data (Unaudited) cont/d
749
D. Annual Report Disclosures (Unaudited) cont/d
Securities Financing Transactions
Article 13 of Regulation (EU) 2015/2365 on transparency of securities financing transactions (SFTs) and of reuse and amending Regulation (EU) No648/2012, requires UCITS investment companies to provide the following information on the use made of SFTs and total return swaps (TRSs)
Sub-Fund Name: db x-trackers Russell 2000 UCITS ETF (DR)
Securities commodities lending transactions
1. Below is the market value of assets engaged in securities financing transactions at 31 December 2017
USD 41,755,388
% of Net Assets 6.70%
2. Market value of securities on loan as % of Total Lendable Assets*
USD 631,758,537
% Total Lendable Assets 6.61%
3. Listed below are the top 10 Counterparties used for each type of SFT & TRS at 31 December 2017
1. Counterparty Name UBS
Value of outstandingtransactions USD
41,209,249
Country of Establishment Switzerland
2. Counterparty Name Citigroup Global Markets Limited
Value of outstandingtransactions USD
546,139
Country of Establishment United Kingdom
4. Settlement/clearing for each type of SFT & TRS:
Collateral - Euroclear; Loan securities - domestic country
5. Maturity tenor of the SFTs & TRSs (USD)
Open Maturity x
6. Type and Quality of Collateral
Collateral Type
Bonds
Collateral Quality/Rating:
Cash N/A
Bonds Investment Grade
Equities N/A
Other N/A
7. Currency of Collateral
USD
8. Maturity tenor of the Collateral (USD)
1 week to 1 month 3,650,328
1 to 3 months 73,390
3 months to 1 year 5,060,606
Greater than 1 year 35,816,269
9. Ten largest Collateral Issuers
1. Collateral Issuer Netherlands
Volume of collateral receivedUSD
17,053,061
2. Collateral Issuer Germany
Volume of collateral receivedUSD
11,602,023
3. Collateral Issuer France
Volume of collateral receivedUSD
8,394,993
4. Collateral Issuer Austria
Volume of collateral receivedUSD
7,550,516
10. Re-investment of Collateral received
Stock Collateral re-invested N/A
CONCEPT FUND SOLUTIONS PLC
Supplemental Data (Unaudited) cont/d
750
D. Annual Report Disclosures (Unaudited) cont/d
Securities commodities lending transactions
Permitted re-investment of StockCollateral
N/A
Returns on Cash Collateralreinvested
N/A
11. Safe-keeping of Collateral received
Detailed in the table below are the number and names of the depositaries who are responsible for thesafe-keeping of the collateral received in relation to each of the SFTs/TRSs held on the Sub-Fund.
Number of Depositaries 1
Depositary Euroclear
Fixed Income Collateral USD 44,600,593
Cash Collateral EUR/GBP/USD N/A
12. Safe-keeping of Collateral pledged
Included in the table below are details of the safe-keeping of the collateral pledged from the Sub-Fund to therelevant counterparties in relation to each of the SFTs held on the Sub-Funds.
Total Value of Collateral pledgedEUR/GBP/USD
N/A
Counterparty N/A
% held in segregated accounts N/A
% held in pooled accounts N/A
% held in other accounts N/A
Total N/A
13. Returns and costs of the SFTs & TRSs (USD)
Sub-Fund
Income received 141,733
Gains/Losses N/A
Costs incurred N/A
Net returns 141,733
% of Overall SFT/TRS Return 0.70%
Manager of the Sub-Fund
Income received 30,371
Gains/Losses N/A
Costs incurred N/A
Net returns 30,371
% of Overall SFT/TRS Return 0.15%
Third parties to the agreement (e.g. Lending Agent)
Income received 30,371
Gains/Losses N/A
Costs incurred All costs related to settlement of collateral and loan securities are borne by the Securities Lending Agent.
Net returns 30,371
% of Overall SFT/TRS Return 0.15%
CONCEPT FUND SOLUTIONS PLC
Supplemental Data (Unaudited) cont/d
751
D. Annual Report Disclosures (Unaudited) cont/d
Securities Financing Transactions
Article 13 of Regulation (EU) 2015/2365 on transparency of securities financing transactions (SFTs) and of reuse and amending Regulation (EU) No648/2012, requires UCITS investment companies to provide the following information on the use made of SFTs and total return swaps (TRSs)
Sub-Fund Name: db x-trackers Russell Midcap UCITS ETF (DR)
Securities commodities lending transactions
1. Below is the market value of assets engaged in securities financing transactions at 31 December 2017
USD 4,045,134
% of Net Assets 2.84%
2. Market value of securities on loan as % of Total Lendable Assets*
USD 144,013,875
% Total Lendable Assets 2.81%
3. Listed below are the top 10 Counterparties used for each type of SFT & TRS at 31 December 2017
1. Counterparty Name UBS
Value of outstandingtransactions USD
4,045,134
Country of Establishment Switzerland
4. Settlement/clearing for each type of SFT & TRS:
Collateral - Euroclear; Loan securities - domestic country
5. Maturity tenor of the SFTs & TRSs (USD)
Open Maturity x
6. Type and Quality of Collateral
Collateral Type
Bonds
Collateral Quality/Rating:
Cash N/A
Bonds Investment Grade
Equities N/A
Other N/A
7. Currency of Collateral
USD
8. Maturity tenor of the Collateral (USD)
1 to 3 months 20,674
3 months to 1 year 89,031
Greater than 1 year 4,149,605
9. Ten largest Collateral Issuers
1. Collateral Issuer Netherlands
Volume of collateral receivedUSD
1,851,203
2. Collateral Issuer France
Volume of collateral receivedUSD
1,243,546
3. Collateral Issuer Germany
Volume of collateral receivedUSD
1,076,721
4. Collateral Issuer Austria
Volume of collateral receivedUSD
87,840
10. Re-investment of Collateral received
Stock Collateral re-invested N/A
Permitted re-investment of StockCollateral
N/A
Returns on Cash Collateralreinvested
N/A
11. Safe-keeping of Collateral received
CONCEPT FUND SOLUTIONS PLC
Supplemental Data (Unaudited) cont/d
752
D. Annual Report Disclosures (Unaudited) cont/d
Securities commodities lending transactions
Detailed in the table below are the number and names of the depositaries who are responsible for the safe-keepingof the collateral received in relation to each of the SFTs/TRSs held on the Sub-Fund.
Number of Depositaries 1
Depositary Euroclear
Fixed Income Collateral USD 4,259,310
Cash Collateral EUR/GBP/USD N/A
12. Safe-keeping of Collateral pledged
Included in the table below are details of the safe-keeping of the collateral pledged from the Sub-Fund to therelevant counterparties in relation to each of the SFTs held on the Sub-Funds.
Total Value of Collateral pledgedEUR/GBP/USD
N/A
Counterparty N/A
% held in segregated accounts N/A
% held in pooled accounts N/A
% held in other accounts N/A
Total N/A
13. Returns and costs of the SFTs & TRSs (USD)
Sub-Fund
Income received 5,152
Gains/Losses N/A
Costs incurred N/A
Net returns 5,152
% of Overall SFT/TRS Return 0.70%
Manager of the Sub-Fund
Income received 1,104
Gains/Losses N/A
Costs incurred N/A
Net returns 1,104
% of Overall SFT/TRS Return 0.15%
Third parties to the agreement (e.g. Lending Agent)
Income received 1,104
Gains/Losses N/A
Costs incurred All costs related to settlement of collateral and loan securities are borne by the Securities Lending Agent.
Net returns 1,104
% of Overall SFT/TRS Return 0.15%
CONCEPT FUND SOLUTIONS PLC
Supplemental Data (Unaudited) cont/d
753
D. Annual Report Disclosures (Unaudited) cont/d
Securities Financing Transactions
Article 13 of Regulation (EU) 2015/2365 on transparency of securities financing transactions (SFTs) and of reuse and amending Regulation (EU) No648/2012, requires UCITS investment companies to provide the following information on the use made of SFTs and total return swaps (TRSs)
Sub-Fund Name: db x-trackers JPX-Nikkei 400 UCITS ETF (DR)
Securities commodities lending transactions
1. Below is the market value of assets engaged in securities financing transactions at 31 December 2017
JPY 2,254,589,096
% of Net Assets 5.17%
2. Market value of securities on loan as % of Total Lendable Assets*
JPY 17,553,234,166
% Total Lendable Assets 12.84%
3. Listed below are the top 10 Counterparties used for each type of SFT & TRS at 31 December 2017
1. Counterparty Name Barclays Bank
Value of outstandingtransactions JPY
1,162,674,375
Country of Establishment United Kingdom
2. Counterparty Name Citigroup Global Markets Limited
Value of outstandingtransactions JPY
555,723,659
Country of Establishment United Kingdom
3. Counterparty Name Naxitis
Value of outstandingtransactions JPY
455,534,642
Country of Establishment United Kingdom
4. Counterparty Name UBS
Value of outstandingtransactions JPY
80,656,420
Country of Establishment Switzerland
4. Settlement/clearing for each type of SFT & TRS:
Collateral - Euroclear; Loan securities - domestic country
5. Maturity tenor of the SFTs & TRSs (JPY)
Open Maturity x
6. Type and Quality of Collateral
Collateral Type
Bonds
Collateral Quality/Rating:
Cash N/A
Bonds Investment Grade
Equities N/A
Other N/A
7. Currency of Collateral
EUR
8. Maturity tenor of the Collateral (JPY)
1 to 3 months 256,601,698
3 months to 1 year 24,383,382
Greater than 1 year 2,095,886,699
9. Ten largest Collateral Issuers
1. Collateral Issuer France
Volume of collateral receivedJPY
1,846,670,612
2. Collateral Issuer Austria
Volume of collateral receivedJPY
382,859,969
3. Collateral Issuer Germany
CONCEPT FUND SOLUTIONS PLC
Supplemental Data (Unaudited) cont/d
754
D. Annual Report Disclosures (Unaudited) cont/d
Securities commodities lending transactions
Volume of collateral receivedJPY
108,359,331
4. Collateral Issuer Netherlands
Volume of collateral receivedJPY
38,981,867
10. Re-investment of Collateral received
Stock Collateral re-invested N/A
Permitted re-investment of StockCollateral
N/A
Returns on Cash Collateralreinvested
N/A
11. Safe-keeping of Collateral received
Detailed in the table below are the number and names of the depositaries who are responsible for the safe-keepingof the collateral received in relation to each of the SFTs/TRSs held on the Sub-Fund.
Number of Depositaries 1
Depositary Euroclear
Fixed Income Collateral JPY 2,376,871,779
Cash Collateral EUR/GBP/USD N/A
12. Safe-keeping of Collateral pledged
Included in the table below are details of the safe-keeping of the collateral pledged from the Sub-Fund to therelevant counterparties in relation to each of the SFTs held on the Sub-Funds.
Total Value of Collateral pledgedEUR/GBP/USD
N/A
Counterparty N/A
% held in segregated accounts N/A
% held in pooled accounts N/A
% held in other accounts N/A
Total N/A
13. Returns and costs of the SFTs & TRSs (JPY)
Sub-Fund
Income received 2,240,137
Gains/Losses N/A
Costs incurred N/A
Net returns 2,240,137
% of Overall SFT/TRS Return 0.70%
Manager of the Sub-Fund
Income received 480,029
Gains/Losses N/A
Costs incurred N/A
Net returns 480,029
% of Overall SFT/TRS Return 0.15%
Third parties to the agreement (e.g. Lending Agent)
Income received 480,029
Gains/Losses N/A
Costs incurred All costs related to settlement of collateral and loan securities are borne by the Securities Lending Agent.
Net returns 480,029
% of Overall SFT/TRS Return 0.15%
CONCEPT FUND SOLUTIONS PLC
Supplemental Data (Unaudited) cont/d
755
D. Annual Report Disclosures (Unaudited) cont/d
Securities Financing Transactions
Article 13 of Regulation (EU) 2015/2365 on transparency of securities financing transactions (SFTs) and of reuse and amending Regulation (EU) No648/2012, requires UCITS investment companies to provide the following information on the use made of SFTs and total return swaps (TRSs)
Sub-Fund Name: db x-trackers MSCI World Health Care Index UCITS ETF (DR)
Securities commodities lending transactions
1. Below is the market value of assets engaged in securities financing transactions at 31 December 2017
USD 300,168
% of Net Assets 6.11%
2. Market value of securities on loan as % of Total Lendable Assets*
USD 254,744,246
% Total Lendable Assets 0.12%
3. Listed below are the top 10 Counterparties used for each type of SFT & TRS at 31 December 2017
1. Counterparty Name JP Morgan Securities
Value of outstandingtransactions USD
221,482
Country of Establishment London
2. Counterparty Name UBS AG
Value of outstandingtransactions USD
78,686
Country of Establishment Switzerland
4. Settlement/clearing for each type of SFT & TRS:
Collateral - Euroclear; Loan securities - domestic country
5. Maturity tenor of the SFTs & TRSs (USD)
Open Maturity x
6. Type and Quality of Collateral
Collateral Type
Bonds
Collateral Quality/Rating:
Cash N/A
Bonds Investment Grade
Equities N/A
Other N/A
7. Currency of Collateral
USD
8. Maturity tenor of the Collateral (USD)
3 months to 1 year 75,617
Greater than 1 year 247,220
9. Ten largest Collateral Issuers
1. Collateral Issuer France
Volume of collateral receivedUSD
317,527
2. Collateral Issuer Germany
Volume of collateral receivedUSD
5,310
10. Re-investment of Collateral received
Stock Collateral re-invested N/A
Permitted re-investment of StockCollateral
N/A
Returns on Cash Collateralreinvested
N/A
11. Safe-keeping of Collateral received
Detailed in the table below are the number and names of the depositaries who are responsible for the safe-keepingof the collateral received in relation to each of the SFTs/TRSs held on the Sub-Fund.
Number of Depositaries 1
Depositary Euroclear
CONCEPT FUND SOLUTIONS PLC
Supplemental Data (Unaudited) cont/d
756
D. Annual Report Disclosures (Unaudited) cont/d
Securities commodities lending transactions
Fixed Income Collateral USD 322,837
Cash Collateral EUR/GBP/USD N/A
12. Safe-keeping of Collateral pledged
Included in the table below are details of the safe-keeping of the collateral pledged from the Sub-Fund to therelevant counterparties in relation to each of the SFTs held on the Sub-Funds.
Total Value of Collateral pledgedEUR/GBP/USD
N/A
Counterparty N/A
% held in segregated accounts N/A
% held in pooled accounts N/A
% held in other accounts N/A
Total N/A
13. Returns and costs of the SFTs & TRSs (USD)
Sub-Fund
Income received 10,428
Gains/Losses N/A
Costs incurred N/A
Net returns 10,428
% of Overall SFT/TRS Return 0.70%
Manager of the Sub-Fund
Income received 2,235
Gains/Losses N/A
Costs incurred N/A
Net returns 2,235
% of Overall SFT/TRS Return 0.15%
Third parties to the agreement (e.g. Lending Agent)
Income received 2,235
Gains/Losses N/A
Costs incurred All costs related to settlement of collateral and loan securities are borne by the Securities Lending Agent.
Net returns 2,235
% of Overall SFT/TRS Return 0.15%
CONCEPT FUND SOLUTIONS PLC
Supplemental Data (Unaudited) cont/d
757
D. Annual Report Disclosures (Unaudited) cont/d
Securities Financing Transactions
Article 13 of Regulation (EU) 2015/2365 on transparency of securities financing transactions (SFTs) and of reuse and amending Regulation (EU) No648/2012, requires UCITS investment companies to provide the following information on the use made of SFTs and total return swaps (TRSs)
Sub-Fund Name: db x-trackers MSCI World Financials Index UCITS ETF (DR)
Securities commodities lending transactions
1. Below is the market value of assets engaged in securities financing transactions at 31 December 2017
USD 2,538,053
% of Net Assets 1.75%
2. Market value of securities on loan as % of Total Lendable Assets*
USD 432,899,695
% Total Lendable Assets 0.59%
3. Listed below are the top 10 Counterparties used for each type of SFT & TRS at 31 December 2017
1. Counterparty Name Citigroup Global Markets Limited
Value of outstandingtransactions USD
2,330,896
Country of Establishment United Kingdom
2. Counterparty Name UBS
Value of outstandingtransactions USD
207,157
Country of Establishment Switzerland
4. Settlement/clearing for each type of SFT & TRS:
Collateral - Euroclear; Loan securities - domestic country
5. Maturity tenor of the SFTs & TRSs (USD)
Open Maturity x
6. Type and Quality of Collateral
Collateral Type
Bonds
Collateral Quality/Rating:
Cash N/A
Bonds Investment Grade
Equities N/A
Other N/A
7. Currency of Collateral
USD
8. Maturity tenor of the Collateral (USD)
3 months to 1 year 969,127
Greater than 1 year 1,721,388
9. Ten largest Collateral Issuers
1. Collateral Issuer France
Volume of collateral receivedUSD
2,469,307
2. Collateral Issuer Germany
Volume of collateral receivedUSD
78,549
3. Collateral Issuer Austria
Volume of collateral receivedUSD
74,583
4. Collateral Issuer Netherlands
Volume of collateral receivedUSD
68,076
10. Re-investment of Collateral received
Stock Collateral re-invested N/A
Permitted re-investment of StockCollateral
N/A
CONCEPT FUND SOLUTIONS PLC
Supplemental Data (Unaudited) cont/d
758
D. Annual Report Disclosures (Unaudited) cont/d
Securities commodities lending transactions
Returns on Cash Collateralreinvested
N/A
11. Safe-keeping of Collateral received
Detailed in the table below are the number and names of the depositaries who are responsible for the safe-keepingof the collateral received in relation to each of the SFTs/TRSs held on the Sub-Fund.
Number of Depositaries 1
Depositary Euroclear
Fixed Income Collateral USD 2,690,515
Cash Collateral EUR/GBP/USD N/A
12. Safe-keeping of Collateral pledged
Included in the table below are details of the safe-keeping of the collateral pledged from the Sub-Fund to therelevant counterparties in relation to each of the SFTs held on the Sub-Funds.
Total Value of Collateral pledgedEUR/GBP/USD
N/A
Counterparty N/A
% held in segregated accounts N/A
% held in pooled accounts N/A
% held in other accounts N/A
Total N/A
13. Returns and costs of the SFTs & TRSs (USD)
Sub-Fund
Income received 41,251
Gains/Losses N/A
Costs incurred N/A
Net returns 41,251
% of Overall SFT/TRS Return 0.70%
Manager of the Sub-Fund
Income received 8,840
Gains/Losses N/A
Costs incurred N/A
Net returns 8,840
% of Overall SFT/TRS Return 0.15%
Third parties to the agreement (e.g. Lending Agent)
Income received 8,840
Gains/Losses N/A
Costs incurred All costs related to settlement of collateral and loan securities are borne by the Securities Lending Agent.
Net returns 8,840
% of Overall SFT/TRS Return 0.15%
CONCEPT FUND SOLUTIONS PLC
Supplemental Data (Unaudited) cont/d
759
D. Annual Report Disclosures (Unaudited) cont/d
Securities Financing Transactions
Article 13 of Regulation (EU) 2015/2365 on transparency of securities financing transactions (SFTs) and of reuse and amending Regulation (EU) No648/2012, requires UCITS investment companies to provide the following information on the use made of SFTs and total return swaps (TRSs)
Sub-Fund Name: db x-trackers MSCI World Energy Index UCITS ETF (DR)
Securities commodities lending transactions
1. Below is the market value of assets engaged in securities financing transactions at 31 December 2017
USD 2,086,559
% of Net Assets 0.59%
2. Market value of securities on loan as % of Total Lendable Assets*
USD 358,147,744
% Total Lendable Assets 0.58%
3. Listed below are the top 10 Counterparties used for each type of SFT & TRS at 31 December 2017
1. Counterparty Name Citigroup Global Markets Limited
Value of outstandingtransactions USD
1,662,052
Country of Establishment United Kingdom
2. Counterparty Name Merrill Lynch International
Value of outstandingtransactions USD
424,507
Country of Establishment United Kingdom
4. Settlement/clearing for each type of SFT & TRS:
Collateral - Euroclear; Loan securities - domestic country
5. Maturity tenor of the SFTs & TRSs (USD)
Open Maturity x
6. Type and Quality of Collateral
Collateral Type
Bonds
Collateral Quality/Rating:
Cash N/A
Bonds Investment Grade
Equities N/A
Other N/A
7. Currency of Collateral
USD
8. Maturity tenor of the Collateral (USD)
3 months to 1 year 147,307
Greater than 1 year 2,059,350
9. Ten largest Collateral Issuers
1. Collateral Issuer France
Volume of collateral receivedUSD
2,167,529
2. Collateral Issuer Netherlands
Volume of collateral receivedUSD
22,138
3. Collateral Issuer Austria
Volume of collateral receivedUSD
9,430
4. Collateral Issuer Germany
Volume of collateral receivedUSD
7,560
10. Re-investment of Collateral received
Stock Collateral re-invested N/A
Permitted re-investment of StockCollateral
N/A
CONCEPT FUND SOLUTIONS PLC
Supplemental Data (Unaudited) cont/d
760
D. Annual Report Disclosures (Unaudited) cont/d
Securities commodities lending transactions
Returns on Cash Collateralreinvested
N/A
11. Safe-keeping of Collateral received
Detailed in the table below are the number and names of the depositaries who are responsible for the safe-keepingof the collateral received in relation to each of the SFTs/TRSs held on the Sub-Fund.
Number of Depositaries 1
Depositary Euroclear
Fixed Income Collateral USD 2,206,657
Cash Collateral EUR/GBP/USD N/A
12. Safe-keeping of Collateral pledged
Included in the table below are details of the safe-keeping of the collateral pledged from the Sub-Fund to therelevant counterparties in relation to each of the SFTs held on the Sub-Funds.
Total Value of Collateral pledgedEUR/GBP/USD
N/A
Counterparty N/A
% held in segregated accounts N/A
% held in pooled accounts N/A
% held in other accounts N/A
Total N/A
13. Returns and costs of the SFTs & TRSs (USD)
Sub-Fund
Income received 89,836
Gains/Losses N/A
Costs incurred N/A
Net returns 89,836
% of Overall SFT/TRS Return 0.70%
Manager of the Sub-Fund
Income received 19,250
Gains/Losses N/A
Costs incurred N/A
Net returns 19,250
% of Overall SFT/TRS Return 0.15%
Third parties to the agreement (e.g. Lending Agent)
Income received 19,250
Gains/Losses N/A
Costs incurred All costs related to settlement of collateral and loan securities are borne by the Securities Lending Agent.
Net returns 19,250
% of Overall SFT/TRS Return 0.15%
CONCEPT FUND SOLUTIONS PLC
Supplemental Data (Unaudited) cont/d
761
D. Annual Report Disclosures (Unaudited) cont/d
Securities Financing Transactions
Article 13 of Regulation (EU) 2015/2365 on transparency of securities financing transactions (SFTs) and of reuse and amending Regulation (EU) No648/2012, requires UCITS investment companies to provide the following information on the use made of SFTs and total return swaps (TRSs)
Sub-Fund Name: db x-trackers MSCI World Consumer Staples Index UCITS ETF (DR)
Securities commodities lending transactions
1. Below is the market value of assets engaged in securities financing transactions at 31 December 2017
USD 2,269,507
% of Net Assets 1.50%
2. Market value of securities on loan as % of Total Lendable Assets*
USD 151,625,169
% Total Lendable Assets 1.50%
3. Listed below are the top 10 Counterparties used for each type of SFT & TRS at 31 December 2017
1. Counterparty Name Citigroup Global Markets Limited
Value of outstandingtransactions USD
1,342,552
Country of Establishment Switzerland
2. Counterparty Name UBS
Value of outstandingtransactions USD
707,874
Country of Establishment Switzerland
3. Counterparty Name HSBC Bank
Value of outstandingtransactions USD
219,081
Country of Establishment United Kingdom
4. Settlement/clearing for each type of SFT & TRS:
Collateral - Euroclear; Loan securities - domestic country
5. Maturity tenor of the SFTs & TRSs (USD)
Open Maturity x
6. Type and Quality of Collateral
Collateral Type
Bonds
Collateral Quality/Rating:
Cash N/A
Bonds Investment Grade
Equities N/A
Other N/A
7. Currency of Collateral
USD
8. Maturity tenor of the Collateral (USD)
3 months to 1 year 1,412,341
Greater than 1 year 993,074
9. Ten largest Collateral Issuers
1. Collateral Issuer France
Volume of collateral receivedUSD
1,442,228
2. Collateral Issuer Netherlands
Volume of collateral receivedUSD
950,205
3. Collateral Issuer Germany
Volume of collateral receivedUSD
12,982
10. Re-investment of Collateral received
Stock Collateral re-invested N/A
Permitted re-investment of StockCollateral
N/A
CONCEPT FUND SOLUTIONS PLC
Supplemental Data (Unaudited) cont/d
762
D. Annual Report Disclosures (Unaudited) cont/d
Securities commodities lending transactions
Returns on Cash Collateralreinvested
N/A
11. Safe-keeping of Collateral received
Detailed in the table below are the number and names of the depositaries who are responsible for the safe-keepingof the collateral received in relation to each of the SFTs/TRSs held on the Sub-Fund.
Number of Depositaries 1
Depositary Euroclear
Fixed Income Collateral USD 2,405,415
Cash Collateral EUR/GBP/USD N/A
12. Safe-keeping of Collateral pledged
Included in the table below are details of the safe-keeping of the collateral pledged from the Sub-Fund to therelevant counterparties in relation to each of the SFTs held on the Sub-Funds.
Total Value of Collateral pledgedEUR/GBP/USD
N/A
Counterparty N/A
% held in segregated accounts N/A
% held in pooled accounts N/A
% held in other accounts N/A
Total N/A
13. Returns and costs of the SFTs & TRSs (USD)
Sub-Fund
Income received 959
Gains/Losses N/A
Costs incurred N/A
Net returns 959
% of Overall SFT/TRS Return 0.70%
Manager of the Sub-Fund
Income received 205
Gains/Losses N/A
Costs incurred N/A
Net returns 205
% of Overall SFT/TRS Return 0.15%
Third parties to the agreement (e.g. Lending Agent)
Income received 205
Gains/Losses N/A
Costs incurred All costs related to settlement of collateral and loan securities are borne by the Securities Lending Agent.
Net returns 205
% of Overall SFT/TRS Return 0.15%
CONCEPT FUND SOLUTIONS PLC
Supplemental Data (Unaudited) cont/d
763
D. Annual Report Disclosures (Unaudited) cont/d
Securities Financing Transactions
Article 13 of Regulation (EU) 2015/2365 on transparency of securities financing transactions (SFTs) and of reuse and amending Regulation (EU) No648/2012, requires UCITS investment companies to provide the following information on the use made of SFTs and total return swaps (TRSs)
Sub-Fund Name: db x-trackers MSCI World Information Technology Index UCITS ETF (DR)
Securities commodities lending transactions
1. Below is the market value of assets engaged in securities financing transactions at 31 December 2017
USD 1,324,401
% of Net Assets 0.56%
2. Market value of securities on loan as % of Total Lendable Assets*
USD 240,224,340
% Total Lendable Assets 0.55%
3. Listed below are the top 10 Counterparties used for each type of SFT & TRS at 31 December 2017
1. Counterparty Name Citigroup Global Markets Limited
Value of outstandingtransactions USD
935,505
Country of Establishment United Kingdom
2. Counterparty Name Societe Generale
Value of outstandingtransactions USD
266,830
Country of Establishment France
2. Counterparty Name UBS
Value of outstandingtransactions USD
122,066
Country of Establishment Switzerland
4. Settlement/clearing for each type of SFT & TRS:
Collateral - Euroclear; Loan securities - domestic country
5. Maturity tenor of the SFTs & TRSs (USD)
Open Maturity x
6. Type and Quality of Collateral
Collateral Type
Bonds
Collateral Quality/Rating:
Cash N/A
Bonds Investment Grade
Equities N/A
Other N/A
7. Currency of Collateral
USD
8. Maturity tenor of the Collateral (USD)
3 months to 1 year 93,037
Greater than 1 year 1,413,693
9. Ten largest Collateral Issuers
1. Collateral Issuer Drance
Volume of collateral receivedUSD
1,231,678
2. Collateral Issuer Germany
Volume of collateral receivedUSD
135,078
3. Collateral Issuer Austria
Volume of collateral receivedUSD
129,927
4. Collateral Issuer Netherlands
Volume of collateral receivedUSD
10,047
10. Re-investment of Collateral received
CONCEPT FUND SOLUTIONS PLC
Supplemental Data (Unaudited) cont/d
764
D. Annual Report Disclosures (Unaudited) cont/d
Securities commodities lending transactions
Stock Collateral re-invested N/A
Permitted re-investment of StockCollateral
N/A
Returns on Cash Collateralreinvested
N/A
11. Safe-keeping of Collateral received
Detailed in the table below are the number and names of the depositaries who are responsible for thesafe-keeping of the collateral received in relation to each of the SFTs/TRSs held on the Sub-Fund.
Number of Depositaries 1
Depositary Euroclear
Fixed Income Collateral USD 1,506,730
Cash Collateral EUR/GBP/USD N/A
12. Safe-keeping of Collateral pledged
Included in the table below are details of the safe-keeping of the collateral pledged from the Sub-Fund to therelevant counterparties in relation to each of the SFTs held on the Sub-Funds.
Total Value of Collateral pledgedEUR/GBP/USD
N/A
Counterparty N/A
% held in segregated accounts N/A
% held in pooled accounts N/A
% held in other accounts N/A
Total N/A
13. Returns and costs of the SFTs & TRSs (USD)
Sub-Fund
Income received 497
Gains/Losses N/A
Costs incurred N/A
Net returns 497
% of Overall SFT/TRS Return 0.70%
Manager of the Sub-Fund
Income received 107
Gains/Losses N/A
Costs incurred N/A
Net returns 107
% of Overall SFT/TRS Return 0.15%
Third parties to the agreement (e.g. Lending Agent)
Income received 107
Gains/Losses N/A
Costs incurred All costs related to settlement of collateral and loan securities are borne by the Securities Lending Agent.
Net returns 107
% of Overall SFT/TRS Return 0.15%
CONCEPT FUND SOLUTIONS PLC
Supplemental Data (Unaudited) cont/d
765
D. Annual Report Disclosures (Unaudited) cont/d
Securities Financing Transactions
Article 13 of Regulation (EU) 2015/2365 on transparency of securities financing transactions (SFTs) and of reuse and amending Regulation (EU) No648/2012, requires UCITS investment companies to provide the following information on the use made of SFTs and total return swaps (TRSs)
Sub-Fund Name: db x-trackers MSCI World Consumer Discretionary Index UCITS ETF (DR)
Securities commodities lending transactions
1. Below is the market value of assets engaged in securities financing transactions at 31 December 2017
USD 3,030,423
% of Net Assets 1.68%
2. Market value of securities on loan as % of Total Lendable Assets*
USD 181,827,203
% Total Lendable Assets 1.67%
3. Listed below are the top 10 Counterparties used for each type of SFT & TRS at 31 December 2017
1. Counterparty Name UBS
Value of outstandingtransactions USD
1,614,370
Country of Establishment Switzerland
2. Counterparty Name Citigroup Global Markets Limited
Value of outstandingtransactions USD
791,530
Country of Establishment United Kingdom
2. Counterparty Name HSBC Bank
Value of outstandingtransactions USD
624,523
Country of Establishment United Kingdom
4. Settlement/clearing for each type of SFT & TRS:
Collateral - Euroclear; Loan securities - domestic country
5. Maturity tenor of the SFTs & TRSs (USD)
Open Maturity x
6. Type and Quality of Collateral
Collateral Type
Bonds
Collateral Quality/Rating:
Cash N/A
Bonds Investment Grade
Equities N/A
Other N/A
7. Currency of Collateral
USD
8. Maturity tenor of the Collateral (USD)
3 months to 1 year 2,466,469
Greater than 1 year 843,901
9. Ten largest Collateral Issuers
1. Collateral Issuer Germany
Volume of collateral receivedUSD
1,633,020
2. Collateral Issuer Austria
Volume of collateral receivedUSD
836,380
3. Collateral Issuer France
Volume of collateral receivedUSD
833,449
4. Collateral Issuer Netherlands
Volume of collateral receivedUSD
7,521
10. Re-investment of Collateral received
CONCEPT FUND SOLUTIONS PLC
Supplemental Data (Unaudited) cont/d
766
D. Annual Report Disclosures (Unaudited) cont/d
Securities commodities lending transactions
Stock Collateral re-invested N/A
Permitted re-investment of StockCollateral
N/A
Returns on Cash Collateralreinvested
N/A
11. Safe-keeping of Collateral received
Detailed in the table below are the number and names of the depositaries who are responsible for thesafe-keeping of the collateral received in relation to each of the SFTs/TRSs held on the Sub-Fund.
Number of Depositaries 1
Depositary Euroclear
Fixed Income Collateral USD 3,310,370
Cash Collateral EUR/GBP/USD N/A
12. Safe-keeping of Collateral pledged
Included in the table below are details of the safe-keeping of the collateral pledged from the Sub-Fund to therelevant counterparties in relation to each of the SFTs held on the Sub-Funds.
Total Value of Collateral pledgedEUR/GBP/USD
N/A
Counterparty N/A
% held in segregated accounts N/A
% held in pooled accounts N/A
% held in other accounts N/A
Total N/A
13. Returns and costs of the SFTs & TRSs (USD)
Sub-Fund
Income received 5,062
Gains/Losses N/A
Costs incurred N/A
Net returns 5,062
% of Overall SFT/TRS Return 0.70%
Manager of the Sub-Fund
Income received 1,085
Gains/Losses N/A
Costs incurred N/A
Net returns 1,085
% of Overall SFT/TRS Return 0.15%
Third parties to the agreement (e.g. Lending Agent)
Income received 1,085
Gains/Losses N/A
Costs incurred All costs related to settlement of collateral and loan securities are borne by the Securities Lending Agent.
Net returns 1,085
% of Overall SFT/TRS Return 0.15%
CONCEPT FUND SOLUTIONS PLC
Supplemental Data (Unaudited) cont/d
767
D. Annual Report Disclosures (Unaudited) cont/d
Securities Financing Transactions
Article 13 of Regulation (EU) 2015/2365 on transparency of securities financing transactions (SFTs) and of reuse and amending Regulation (EU) No648/2012, requires UCITS investment companies to provide the following information on the use made of SFTs and total return swaps (TRSs)
Sub-Fund Name: db x-trackers MSCI World Utilities Index UCITS ETF (DR)
Securities commodities lending transactions
1. Below is the market value of assets engaged in securities financing transactions at 31 December 2017
USD 70,895
% of Net Assets 0.68%
2. Market value of securities on loan as % of Total Lendable Assets*
USD 10,475,767
% Total Lendable Assets 0.68%
3. Listed below are the top 10 Counterparties used for each type of SFT & TRS at 31 December 2017
1. Counterparty Name UBS
Value of outstandingtransactions EUR
70,895
Country of Establishment Switzerland
4. Settlement/clearing for each type of SFT & TRS:
Collateral - Euroclear; Loan securities - domestic country
5. Maturity tenor of the SFTs & TRSs (USD)
Open Maturity x
6. Type and Quality of Collateral
Collateral Type
Bonds
Collateral Quality/Rating:
Cash N/A
Bonds Investment Grade
Equities N/A
Other N/A
7. Currency of Collateral
USD
8. Maturity tenor of the Collateral (USD)
1 week to 1 month 87,950
9. Ten largest Collateral Issuers
1. Collateral Issuer Austria
Volume of collateral receivedUSD
87,950
10. Re-investment of Collateral received
Stock Collateral re-invested N/A
Permitted re-investment of StockCollateral
N/A
Returns on Cash Collateralreinvested
N/A
11. Safe-keeping of Collateral received
Detailed in the table below are the number and names of the depositaries who are responsible for the safe-keepingof the collateral received in relation to each of the SFTs/TRSs held on the Sub-Fund.
Number of Depositaries 1
Depositary Euroclear
Fixed Income Collateral USD 87,950
Cash Collateral EUR/GBP/USD N/A
12. Safe-keeping of Collateral pledged
Included in the table below are details of the safe-keeping of the collateral pledged from the Sub-Fund to therelevant counterparties in relation to each of the SFTs held on the Sub-Funds.
Total Value of Collateral pledgedEUR/GBP/USD
N/A
Counterparty N/A
CONCEPT FUND SOLUTIONS PLC
Supplemental Data (Unaudited) cont/d
768
D. Annual Report Disclosures (Unaudited) cont/d
Securities commodities lending transactions
% held in segregated accounts N/A
% held in pooled accounts N/A
% held in other accounts N/A
Total N/A
13. Returns and costs of the SFTs & TRSs (USD)
Sub-Fund
Income received 124
Gains/Losses N/A
Costs incurred N/A
Net returns 124
% of Overall SFT/TRS Return 0.70%
Manager of the Sub-Fund
Income received 27
Gains/Losses N/A
Costs incurred N/A
Net returns 27
% of Overall SFT/TRS Return 0.15%
Third parties to the agreement (e.g. Lending Agent)
Income received 27
Gains/Losses N/A
Costs incurred All costs related to settlement of collateral and loan securities are borne by the Securities Lending Agent.
Net returns 27
% of Overall SFT/TRS Return 0.15%
CONCEPT FUND SOLUTIONS PLC
Supplemental Data (Unaudited) cont/d
769
D. Annual Report Disclosures (Unaudited) cont/d
Securities Financing Transactions
Article 13 of Regulation (EU) 2015/2365 on transparency of securities financing transactions (SFTs) and of reuse and amending Regulation (EU) No648/2012, requires UCITS investment companies to provide the following information on the use made of SFTs and total return swaps (TRSs)
Sub-Fund Name: db x-trackers iBoxx EUR Corporates Yield Plus UCITS ETF (DR)
Securities commodities lending transactions
1. Below is the market value of assets engaged in securities financing transactions at 31 December 2017
EUR 224,233
% of Net Assets 0.10%
2. Market value of securities on loan as % of Total Lendable Assets*
EUR 234,187,887
% Total Lendable Assets 0.10%
3. Listed below are the top 10 Counterparties used for each type of SFT & TRS at 31 December 2017
1. Counterparty Name JP Morgan Securitie
Value of outstandingtransactions EUR
224,233
Country of Establishment United Kingdom
4. Settlement/clearing for each type of SFT & TRS:
Collateral - Euroclear; Loan securities - domestic country
5. Maturity tenor of the SFTs & TRSs (EUR)
Open Maturity x
6. Type and Quality of Collateral
Collateral Type
Bonds
Collateral Quality/Rating:
Cash N/A
Bonds Investment Grade
Equities N/A
Other N/A
7. Currency of Collateral
EUR
8. Maturity tenor of the Collateral (EUR)
3 months to 1 year 174,790
Greater than 1 year 99,769
9. Ten largest Collateral Issuers
1. Collateral Issuer France
Volume of collateral receivedEUR
274,559
10. Re-investment of Collateral received
Stock Collateral re-invested N/A
Permitted re-investment of StockCollateral
N/A
Returns on Cash Collateralreinvested
N/A
11. Safe-keeping of Collateral received
Detailed in the table below are the number and names of the depositaries who are responsible for the safe-keepingof the collateral received in relation to each of the SFTs/TRSs held on the Sub-Fund.
Number of Depositaries 1
Depositary Euroclear
Fixed Income Collateral EUR 274,559
Cash Collateral EUR/GBP/USD N/A
12. Safe-keeping of Collateral pledged
Included in the table below are details of the safe-keeping of the collateral pledged from the Sub-Fund to therelevant counterparties in relation to each of the SFTs held on the Sub-Funds.
Total Value of Collateral pledgedEUR/GBP/USD
N/A
CONCEPT FUND SOLUTIONS PLC
Supplemental Data (Unaudited) cont/d
770
D. Annual Report Disclosures (Unaudited) cont/d
Securities commodities lending transactions
Counterparty N/A
% held in segregated accounts N/A
% held in pooled accounts N/A
% held in other accounts N/A
Total N/A
13. Returns and costs of the SFTs & TRSs (EUR)
Sub-Fund
Income received 329
Gains/Losses N/A
Costs incurred N/A
Net returns 329
% of Overall SFT/TRS Return 0.70%
Manager of the Sub-Fund
Income received 71
Gains/Losses N/A
Costs incurred N/A
Net returns 71
% of Overall SFT/TRS Return 0.15%
Third parties to the agreement (e.g. Lending Agent)
Income received 71
Gains/Losses N/A
Costs incurred All costs related to settlement of collateral and loan securities are borne by the Securities Lending Agent.
Net returns 71
% of Overall SFT/TRS Return 0.15%
CONCEPT FUND SOLUTIONS PLC
Supplemental Data (Unaudited) cont/d
771
D. Annual Report Disclosures (Unaudited) cont/d
Securities Financing Transactions
Article 13 of Regulation (EU) 2015/2365 on transparency of securities financing transactions (SFTs) and of reuse and amending Regulation (EU) No648/2012, requires UCITS investment companies to provide the following information on the use made of SFTs and total return swaps (TRSs)
1. Below is the market value of assets engaged in securities financing transactions at 31 December 2017
EUR 143,663
% of Net Assets 0.31%
2. Market value of securities on loan as % of Total Lendable Assets*
EUR 46,831,943
% Total Lendable Assets 0.31%
3. Listed below are the top 10 Counterparties used for each type of SFT & TRS at 31 December 2017
1. Counterparty Name JP Morgan Securities
Value of outstandingtransactions EUR
72,000
Country of Establishment United Kingdom
2. Counterparty Name Bank of Nova Scotia
Value of outstandingtransactions EUR
71,663
Country of Establishment United Kingdom
4. Settlement/clearing for each type of SFT & TRS:
Collateral - Euroclear; Loan securities - domestic country
5. Maturity tenor of the SFTs & TRSs (EUR)
Open Maturity x
6. Type and Quality of Collateral
Collateral Type
Bonds
Collateral Quality/Rating:
Cash N/A
Bonds Investment Grade
Equities N/A
Other N/A
7. Currency of Collateral
EUR
8. Maturity tenor of the Collateral (EUR)
3 months to 1 year 77,975
Greater than 1 year 87,832
9. Ten largest Collateral Issuers
1. Collateral Issuer France
Volume of collateral receivedEUR
165,807
10. Re-investment of Collateral received
Stock Collateral re-invested N/A
Permitted re-investment of StockCollateral
N/A
Returns on Cash Collateralreinvested
N/A
11. Safe-keeping of Collateral received
Detailed in the table below are the number and names of the depositaries who are responsible for the safe-keepingof the collateral received in relation to each of the SFTs/TRSs held on the Sub-Fund.
Number of Depositaries 1
Depositary Euroclear
Fixed Income Collateral EUR 165,807
Cash Collateral EUR/GBP/USD N/A
CONCEPT FUND SOLUTIONS PLC
Supplemental Data (Unaudited) cont/d
772
D. Annual Report Disclosures (Unaudited) cont/d
Securities commodities lending transactions
12. Safe-keeping of Collateral pledged
Included in the table below are details of the safe-keeping of the collateral pledged from the Sub-Fund to therelevant counterparties in relation to each of the SFTs held on the Sub-Funds
Total Value of Collateral pledgedEUR/GBP/USD
N/A
Counterparty N/A
% held in segregated accounts N/A
% held in pooled accounts N/A
% held in other accounts N/A
Total N/A
13. Returns and costs of the SFTs & TRSs (EUR)
Sub-Fund
Income received 168
Gains/Losses N/A
Costs incurred N/A
Net returns 168
% of Overall SFT/TRS Return 0.70%
Manager of the Sub-Fund
Income received 36
Gains/Losses N/A
Costs incurred N/A
Net returns 36
% of Overall SFT/TRS Return 0.15%
Third parties to the agreement (e.g. Lending Agent)
Income received 36
Gains/Losses N/A
Costs incurred All costs related to settlement of collateral and loan securities are borne by the Securities Lending Agent.
Net returns 36
% of Overall SFT/TRS Return 0.15%
CONCEPT FUND SOLUTIONS PLC
Supplemental Data (Unaudited) cont/d
773
D. Annual Report Disclosures (Unaudited) cont/d
Securities Financing Transactions
Article 13 of Regulation (EU) 2015/2365 on transparency of securities financing transactions (SFTs) and of reuse and amending Regulation (EU) No648/2012, requires UCITS investment companies to provide the following information on the use made of SFTs and total return swaps (TRSs)
Sub-Fund Name: db x-trackers MSCI Emerging Markets Index UCITS ETF (DR)
Securities commodities lending transactions
1. Below is the market value of assets engaged in securities financing transactions at 31 December 2017
USD 2,085,975
% of Net Assets 0.27%
2. Market value of securities on loan as % of Total Lendable Assets*
USD 938,560,527
% Total Lendable Assets 0.22%
3. Listed below are the top 10 Counterparties used for each type of SFT & TRS at 31 December 2017
1. Counterparty Name Morgan Stanley
Value of outstandingtransactions USD
1,737,527
Country of Establishment United Kingdom
2. Counterparty Name Barclays Bank
Value of outstandingtransactions USD
348,448
Country of Establishment United Kingdom
4. Settlement/clearing for each type of SFT & TRS:
Collateral - Euroclear; Loan securities - domestic country
5. Maturity tenor of the SFTs & TRSs (USD)
Open Maturity x
6. Type and Quality of Collateral
Collateral Type
Bonds
Collateral Quality/Rating:
Cash N/A
Bonds Investment Grade
Equities N/A
Other N/A
7. Currency of Collateral
EUR
8. Maturity tenor of the Collateral (USD)
Greater than 1 year 2,206,087
9. Ten largest Collateral Issuers
1. Collateral Issuer France
Volume of collateral receivedUSD
1,839,955
2. Collateral Issuer Austria
Volume of collateral receivedUSD
366,132
10. Re-investment of Collateral received
Stock Collateral re-invested N/A
Permitted re-investment of StockCollateral
N/A
Returns on Cash Collateralreinvested
N/A
11. Safe-keeping of Collateral received
Detailed in the table below are the number and names of the depositaries who are responsible for the safe-keepingof the collateral received in relation to each of the SFTs/TRSs held on the Sub-Fund.
Number of Depositaries 1
Depositary Euroclear
Fixed Income Collateral USD 2,206,087
CONCEPT FUND SOLUTIONS PLC
Supplemental Data (Unaudited) cont/d
774
D. Annual Report Disclosures (Unaudited) cont/d
Securities commodities lending transactions
Cash Collateral EUR/GBP/USD N/A
12. Safe-keeping of Collateral pledged
Included in the table below are details of the safe-keeping of the collateral pledged from the Sub-Fund to therelevant counterparties in relation to each of the SFTs held on the Sub-Funds.
Total Value of Collateral pledgedEUR/GBP/USD
N/A
Counterparty N/A
% held in segregated accounts N/A
% held in pooled accounts N/A
% held in other accounts N/A
Total N/A
13. Returns and costs of the SFTs & TRSs (EUR)/(GBP)/(USD)
Sub-Fund
Income received 964
Gains/Losses N/A
Costs incurred N/A
Net returns 964
% of Overall SFT/TRS Return 0.70%
Manager of the Sub-Fund
Income received 207
Gains/Losses N/A
Costs incurred N/A
Net returns 207
% of Overall SFT/TRS Return 0.15%
Third parties to the agreement (e.g. Lending Agent)
Income received 207
Gains/Losses N/A
Costs incurred All costs related to settlement of collateral and loan securities are borne by the Securities Lending Agent.
Net returns 207
% of Overall SFT/TRS Return 0.15%
CONCEPT FUND SOLUTIONS PLC
Supplemental Data (Unaudited) cont/d
775
Appendix 1 – Remuneration Disclosures (unaudited) Regulation 89(3A) of the UCITS Regulations (as introducedpursuant to the UCITS Regulations on 21 March 2016) requires that the annual report of the Company containscertain disclosures on remuneration paid by the Company to its staff during the financial year and details of anymaterial changes to the Company's remuneration policy made during the period. In this regard, the followingpoints are to be noted:
• The Company has prepared a remuneration policy outlining how it adheres to the remuneration requirements setout in the UCITS Regulations. This policy was adopted with effect from 27 May 2016 and no material changeswere subsequently made to it during the financial year.• The first annual performance period in which the Company has to comply with the remuneration requirementsset out in the UCITS Regulations was the year ending 31 December 2016, i.e. the Company's current financialyear.• The Company has no employees or staff that it employs and pays directly. The Company has a Board ofDirectors, two of whom are employees of the Deutsche Bank group and receive no remuneration from theCompany. The remaining three directors receive fixed fees only (for the year ended 31 December 2017: €201,495in aggregate and for the year ended 31 December 2016: €149,188 in aggregate) and do not receive variableremuneration. These fees are set at a level that reflects the qualifications and contribution required taking intoaccount the Company's size, internal organisation and the nature, scope and complexity of its activities.
Remuneration Policy was only adopted with effect from 27 May 2016, an annual reviews has been undertaken andno material changes have been made to the Remuneration Policy since 27 May 2016.