Concepts for CO2 EOR in the Bakken
Formation
19th Annual CO2 Flooding Conference
Midland, Texas
December 13, 2013
James Sorensen, John Harju, Steve Hawthorne,
Jason Braunberger, Gavin Liu, Steve Smith, and Ed Steadman
© 2013 University of North Dakota Energy & Environmental Research Center.
The International Center for Applied Energy Technology®
Program Partners
The International Center for Applied Energy Technology®
Bakken Extent and Stratigraphy
Pronghorn
The International Center for Applied Energy Technology®
The Bakken is a Tight Oil Formation
• While oil may be produced directly from its shales, a vast
majority of Bakken oil production is from low-permeability
siltstones, sandstones, and carbonates in the “Middle Member”
which lies between two oil-rich shale layers.
Middle Bakken Core
The International Center for Applied Energy Technology®
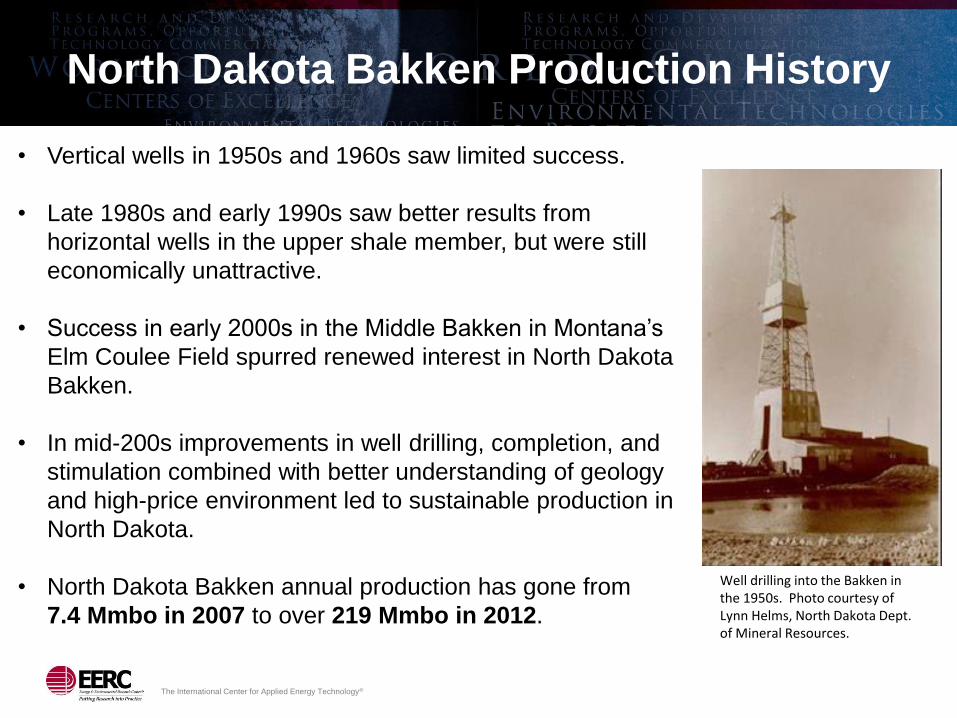
North Dakota Bakken Production History
• Vertical wells in 1950s and 1960s saw limited success.
• Late 1980s and early 1990s saw better results from
horizontal wells in the upper shale member, but were still
economically unattractive.
• Success in early 2000s in the Middle Bakken in Montana’s
Elm Coulee Field spurred renewed interest in North Dakota
Bakken.
• In mid-200s improvements in well drilling, completion, and
stimulation combined with better understanding of geology
and high-price environment led to sustainable production in
North Dakota.
• North Dakota Bakken annual production has gone from
7.4 Mmbo in 2007 to over 219 Mmbo in 2012.
Well drilling into the Bakken in the 1950s. Photo courtesy of Lynn Helms, North Dakota Dept. of Mineral Resources.
The International Center for Applied Energy Technology®
Bakken Production History
1960 – Early verticals ♦ IPs around 150 to 450 bpd
♦ Typical cumulative production = 85,000 bbl/well
1990 – Early horizontals ♦ IPs around 230 to 500 bpd
♦ Typical cumulative production = 145,000 bbl/well
2005 – Recent multistage ♦ IPs over 1500 bpd not uncommon
♦ Typical cumulative production unknown, too early to tell
♦ 500,000 bbl/well?
The International Center for Applied Energy Technology®
Current Trend in Bakken & Three Forks
Well Configuration
1320’
Middle Bakken and
Three Forks wells on
320 acre spacing.
The International Center for Applied Energy Technology®
How Do We Get More Oil Out of the Bakken?
• The more we understand
about the Bakken
Petroleum System, the
more oil we recognize in it.
• Currently, only a 3%–10%
recovery factor.
• Small improvements in
recovery could yield over a
billion barrels of oil.
• Can CO2 be a game
changer in the Bakken?
The International Center for Applied Energy Technology®
CO₂
How Does CO2 Interact with a Bakken
Reservoir?
We need to understand:
• Rock matrix
• Nature of fractures (macro and micro)
• Effects of CO2 on Bakken oil
The International Center for Applied Energy Technology®
Reservoir Characterization & Modeling
Simulations to provide guidance on:
• Can we get incremental oil?
• Which schemes might work best?
• How much CO2 will it take?
The International Center for Applied Energy Technology®
Project Study Fields
• Compare thermally
mature to immature
– Characterize core from
Bailey and Murphy
Creek (mature) vs.
Rival and Grenora
(immature).
– Static and dynamic
modeling of Bailey and
Grenora.
• Evaluate 2009 CO2
huff ‘n’ puff in Elm
Coulee area.
– Apply lessons learned
in that test to potential
future injection tests.
The International Center for Applied Energy Technology®
Reservoir Evaluation Methodology
Geologic description of the core from three wells
Analyze a suite of core plugs for matrix properties and fractures
Correlate lab data with logs and perform multimineral petrophysical analysis (MMPA)
Construct geological model of the reservoir system to support dynamic simulations of potential EOR schemes
Analyzing production rate as related to completion techniques for several key wells
Detailed study completed for Corrine Olson, Burbank, and Rogne wells
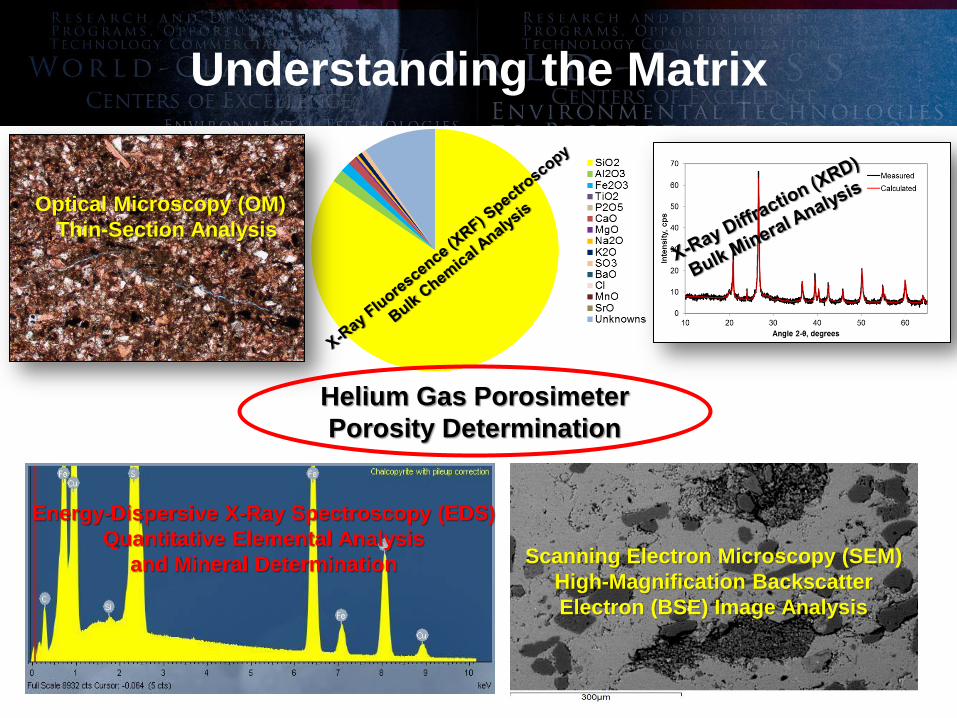
Understanding the Matrix
Optical Microscopy (OM)
Thin-Section Analysis
Scanning Electron Microscopy (SEM)
High-Magnification Backscatter
Electron (BSE) Image Analysis
Energy-Dispersive X-Ray Spectroscopy (EDS)
Quantitative Elemental Analysis
and Mineral Determination
Helium Gas Porosimeter
Porosity Determination
The International Center for Applied Energy Technology®
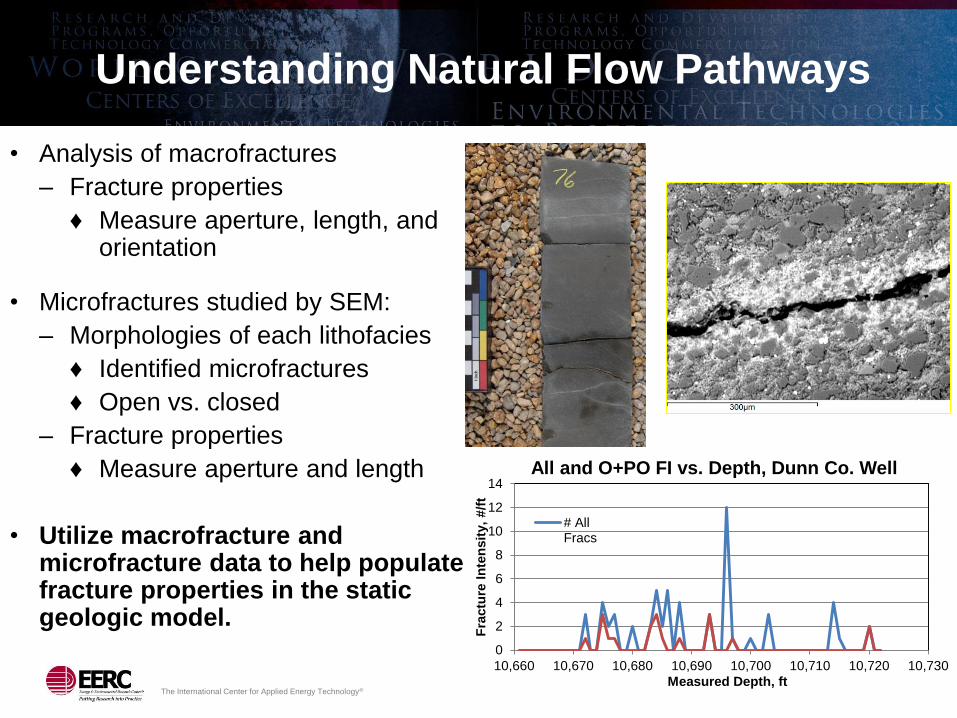
Understanding Natural Flow Pathways
• Analysis of macrofractures
– Fracture properties
♦ Measure aperture, length, and orientation
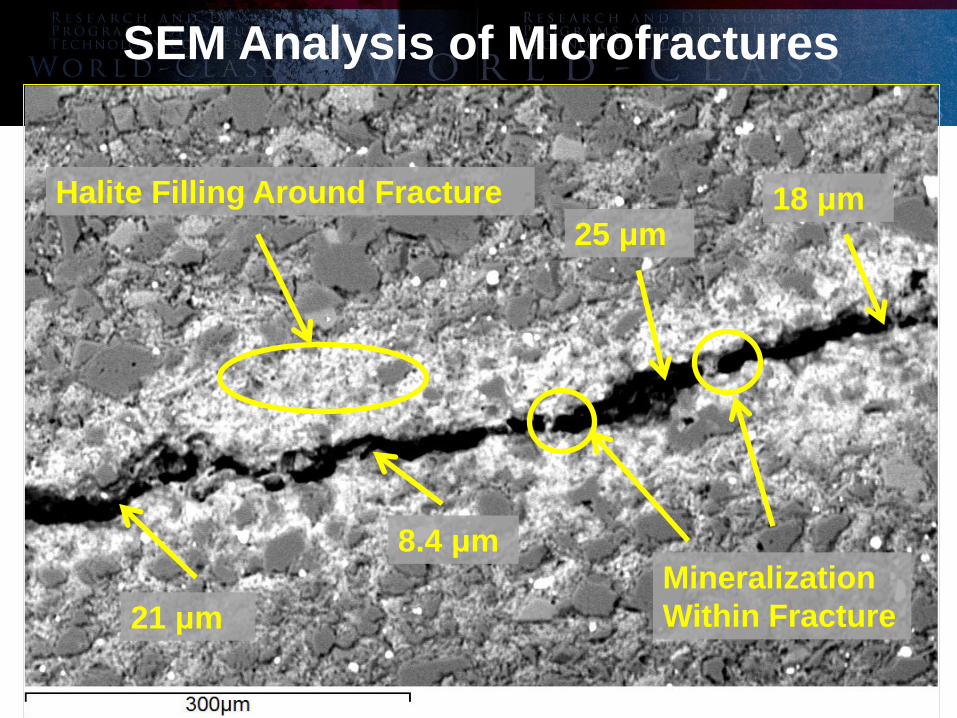
• Microfractures studied by SEM:
– Morphologies of each lithofacies
♦ Identified microfractures
♦ Open vs. closed
– Fracture properties
♦ Measure aperture and length
• Utilize macrofracture and microfracture data to help populate fracture properties in the static geologic model.
0
2
4
6
8
10
12
14
10,660 10,670 10,680 10,690 10,700 10,710 10,720 10,730
Fra
ctu
re I
nte
nsit
y,
#/f
t
Measured Depth, ft
All and O+PO FI vs. Depth, Dunn Co. Well
# AllFracs
The International Center for Applied Energy Technology®
Ultraviolet Fluorescence (UVF)
Analysis of Microfractures
Middle Bakken thin section in plane-polarized light compared to UVF.
The International Center for Applied Energy Technology®
Halite Filling Around Fracture
Mineralization
Within Fracture
25 μm 18 μm
21 μm
8.4 μm
SEM Analysis of Microfractures
The International Center for Applied Energy Technology®
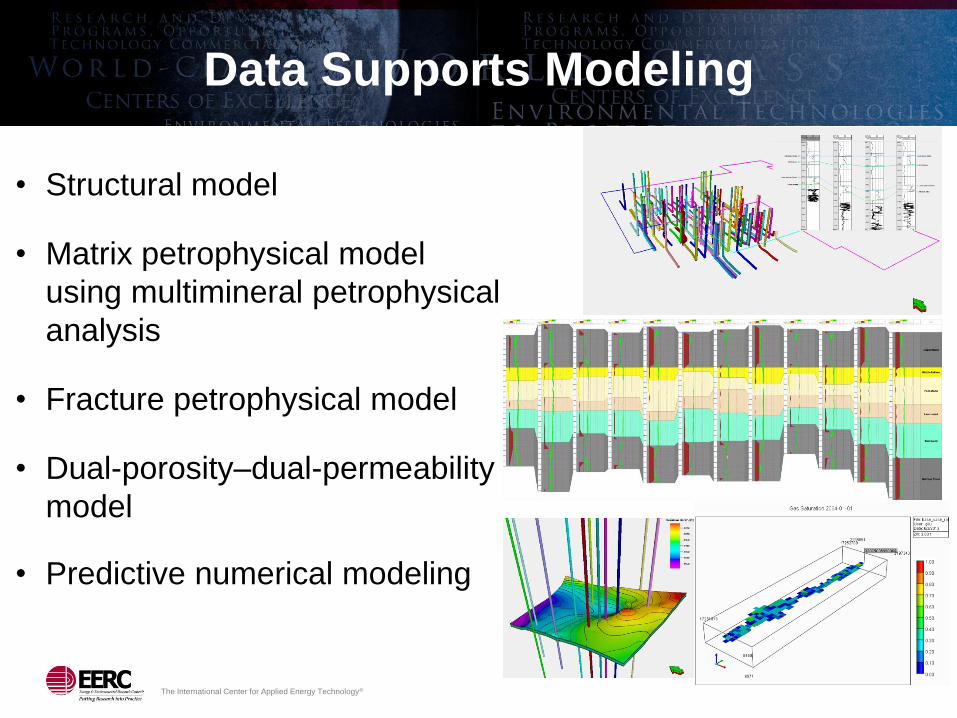
Data Supports Modeling
• Structural model
• Matrix petrophysical model
using multimineral petrophysical
analysis
• Fracture petrophysical model
• Dual-porosity–dual-permeability
model
• Predictive numerical modeling
The International Center for Applied Energy Technology®
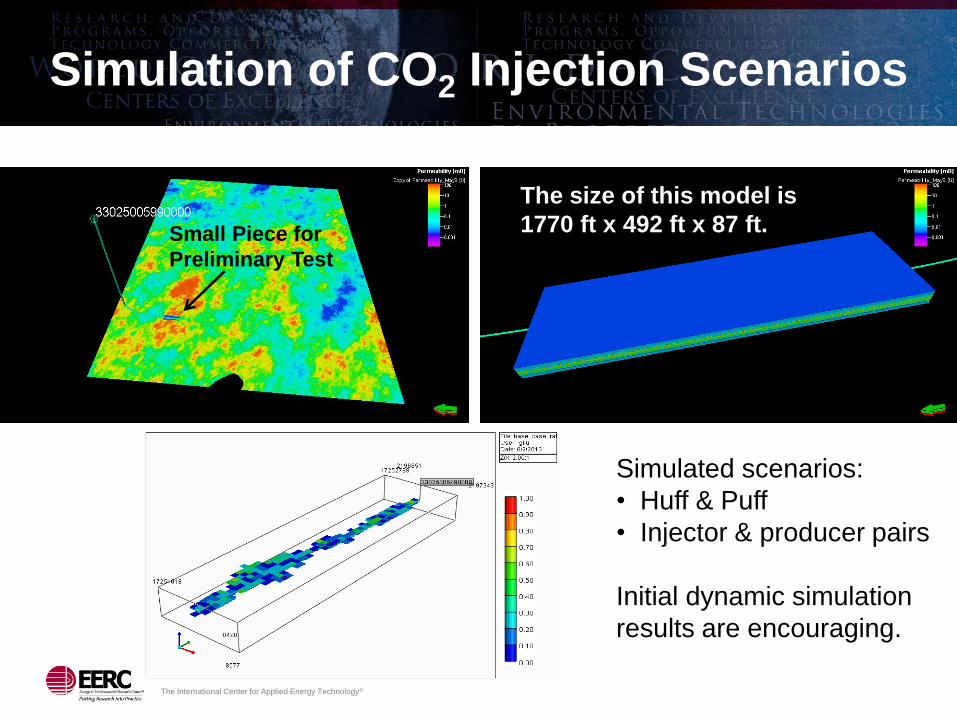
Simulation of CO2 Injection Scenarios
19
DFN From NW McGregor (Mission Canyon)
From NW McGregor (Mission Canyon)
From NW McGregor (Mission Canyon)
The size of this model is
1770 ft x 492 ft x 87 ft. Small Piece for
Preliminary Test
Simulated scenarios:
• Huff & Puff
• Injector & producer pairs
Initial dynamic simulation
results are encouraging.
The International Center for Applied Energy Technology®
Simulation Observations
• CO2 injection may play a significant role in enhancing oil
recovery in Bakken oil reservoirs.
• The nature of the operation (Injection rate, HnP, recycle,
etc.) has a great effect on the ability of CO2 to enhance
oil production. In particular, H&P appears to be not
nearly as effective as a continuous CO2 recycle process.
• Of the scenarios run thus far, an injector-producer pair
with continuous CO2 recycle option appears to hold the
most promise for enhanced oil recovery.
The International Center for Applied Energy Technology®
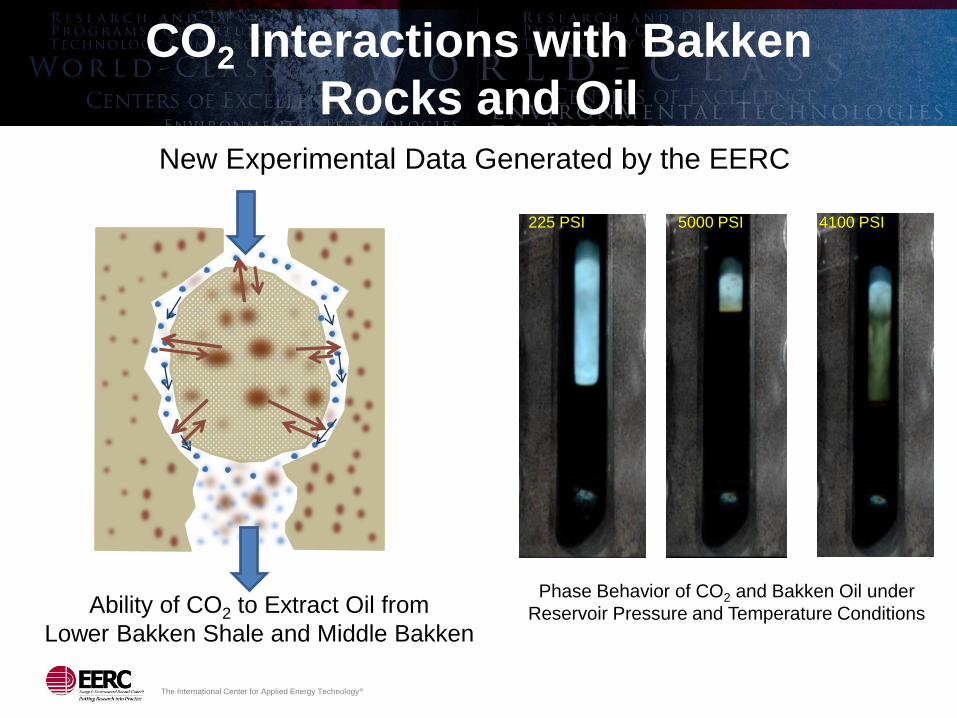
CO2 Interactions with Bakken
Rocks and Oil New Experimental Data Generated by the EERC
5000 PSI 4100 PSI 225 PSI
Ability of CO2 to Extract Oil from
Lower Bakken Shale and Middle Bakken
Phase Behavior of CO2 and Bakken Oil under
Reservoir Pressure and Temperature Conditions
The International Center for Applied Energy Technology®
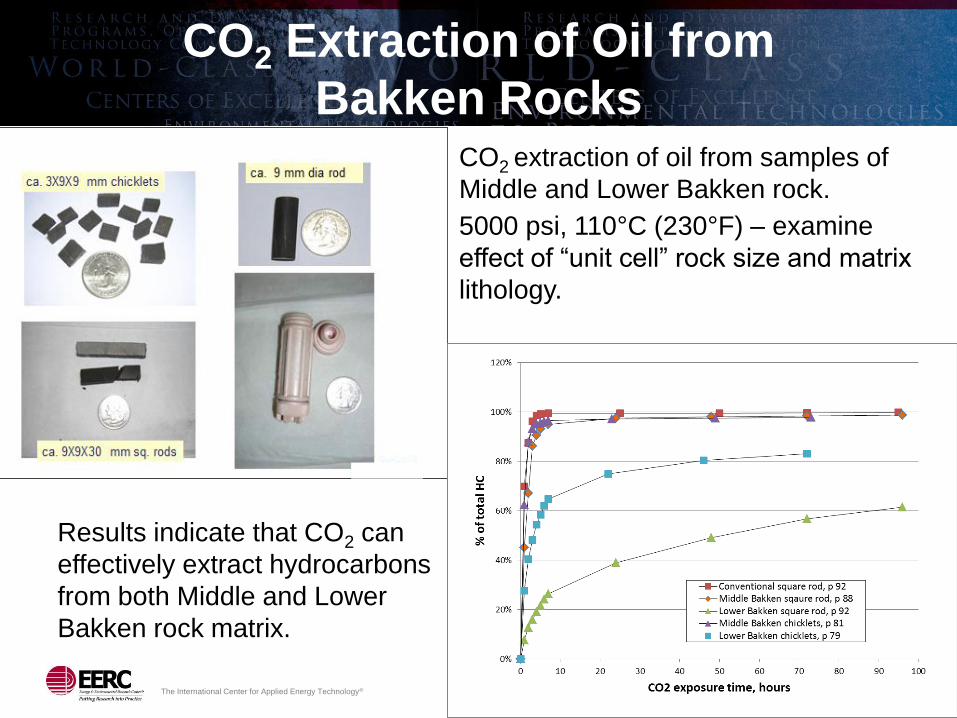
CO2 Extraction of Oil from
Bakken Rocks
The International Center for Applied Energy Technology®
CO2 Extraction of Oil from
Bakken Rocks
Results indicate that CO2 can
effectively extract hydrocarbons
from both Middle and Lower
Bakken rock matrix.
CO2 extraction of oil from samples of
Middle and Lower Bakken rock.
5000 psi, 110°C (230°F) – examine
effect of “unit cell” rock size and matrix
lithology.
The International Center for Applied Energy Technology®
Elm Coulee Huff ‘n’ Puff
DFN From NW McGregor (Mission Canyon)
From NW McGregor (Mission Canyon)
• In 2013 Continental Resources
joined the Bakken Enhanced
Recovery Program.
• Contribution includes data from the
2009 CO2 huff ‘n’ puff test
conducted in the Burning Tree
State 36-2 well in the Elm Coulee
area of Montana.
• These data enable us to: – Compare and contrast key
reservoir properties between the
various study fields.
– Apply lessons learned from
Burning Tree well to future pilot-
scale CO2 EOR tests.
Well location in Elm Coulee field, Montana. Photo courtesy of Montana Board of Oil and Gas Conservation.
The International Center for Applied Energy Technology®
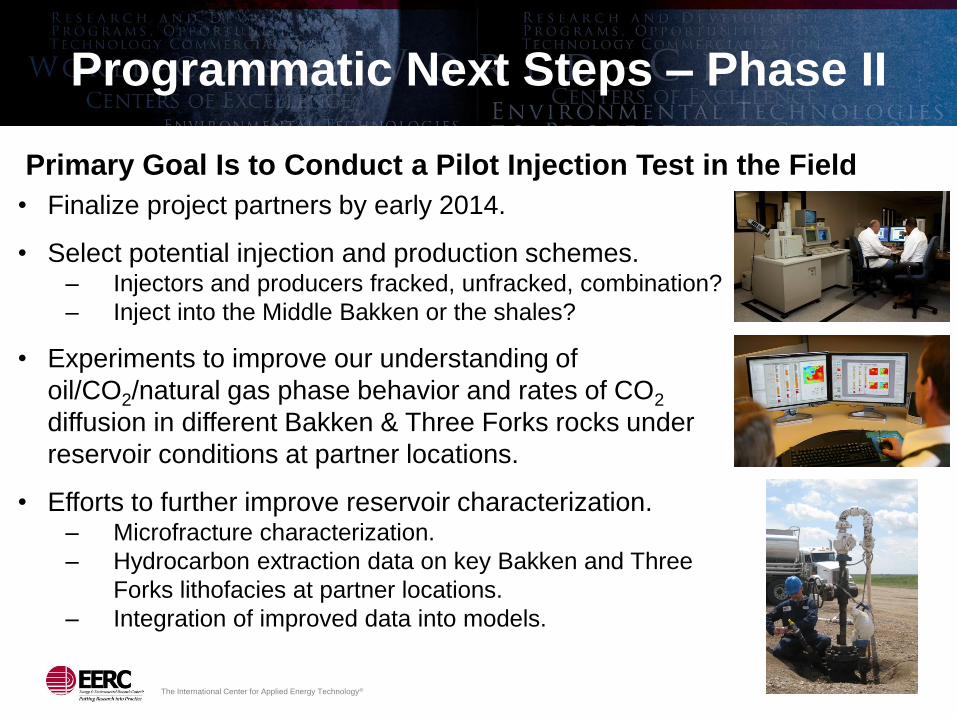
Programmatic Next Steps – Phase II
• Finalize project partners by early 2014.
• Select potential injection and production schemes. – Injectors and producers fracked, unfracked, combination?
– Inject into the Middle Bakken or the shales?
• Experiments to improve our understanding of
oil/CO2/natural gas phase behavior and rates of CO2
diffusion in different Bakken & Three Forks rocks under
reservoir conditions at partner locations.
• Efforts to further improve reservoir characterization. – Microfracture characterization.
– Hydrocarbon extraction data on key Bakken and Three
Forks lithofacies at partner locations.
– Integration of improved data into models.
Primary Goal Is to Conduct a Pilot Injection Test in the Field
The International Center for Applied Energy Technology®
CO₂
Upper Bakken Shale
Lower Bakken Shale
Mid
dle
Bak
ken
L1
L2
L5
L4
L3
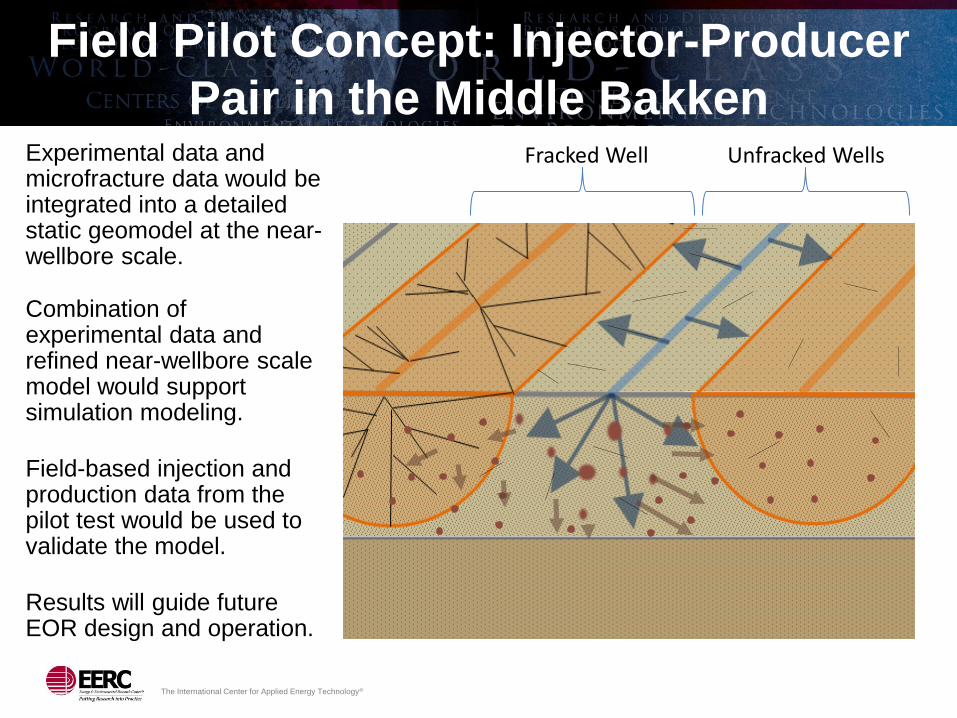
Field Pilot Concept: Injector-Producer
Pair in the Middle Bakken
The International Center for Applied Energy Technology®
Field Pilot Concept: Injector-Producer
Pair in the Middle Bakken Fracked Well Unfracked Wells Experimental data and
microfracture data would be integrated into a detailed static geomodel at the near-wellbore scale.
Combination of experimental data and refined near-wellbore scale model would support simulation modeling.
Field-based injection and production data from the pilot test would be used to validate the model.
Results will guide future EOR design and operation.
The International Center for Applied Energy Technology®
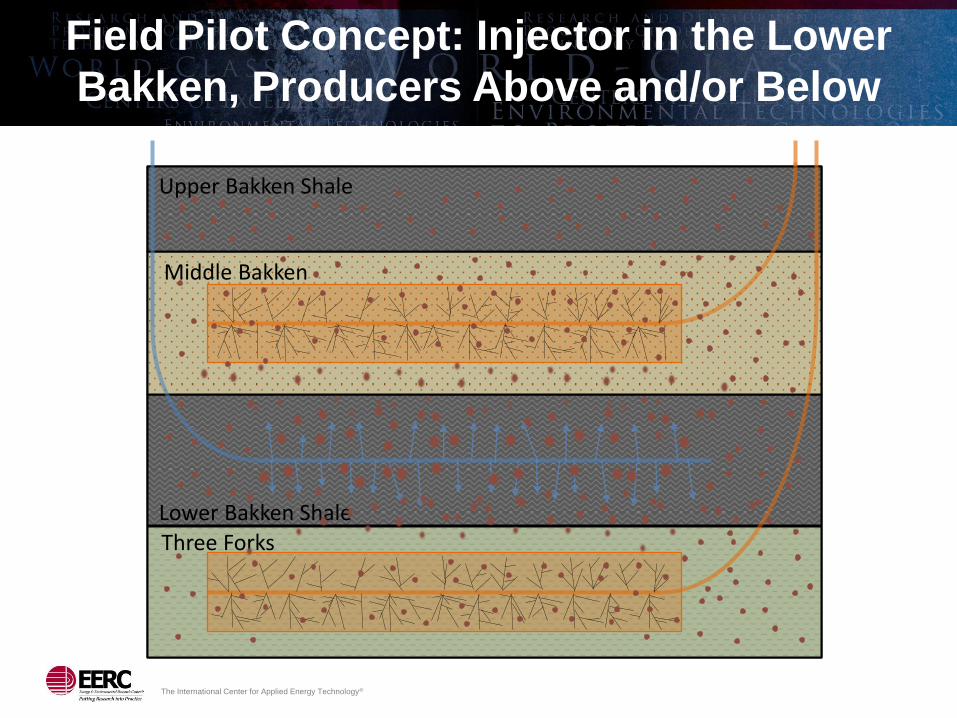
Three Forks Lower Bakken Shale
Middle Bakken
Upper Bakken Shale
Field Pilot Concept: Injector in the Lower
Bakken, Producers Above and/or Below
The International Center for Applied Energy Technology®
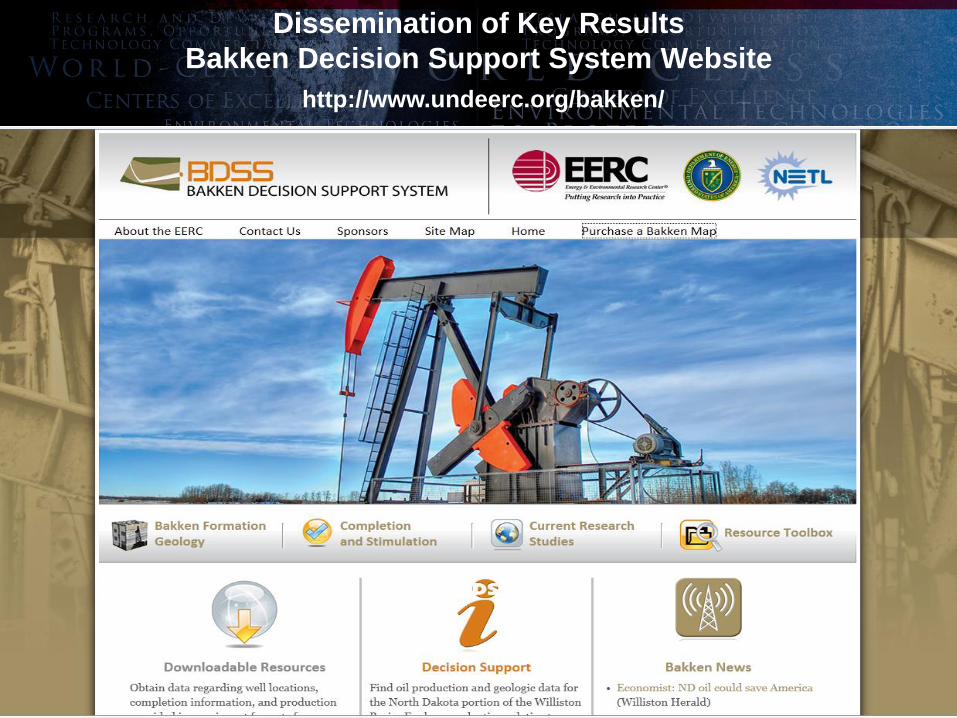
Dissemination of Key Results
Bakken Decision Support System Website
http://www.undeerc.org/bakken/
The International Center for Applied Energy Technology®
Contact Information
Energy & Environmental Research Center
University of North Dakota
15 North 23rd Street, Stop 9018
Grand Forks, ND 58202-9018
World Wide Web: www.undeerc.org
Telephone No. (701) 777-5287
Fax No. (701) 777-5181
Jim Sorensen, Senior Research Manager
[email protected]
The International Center for Applied Energy Technology®
Acknowledgment This material is based upon work supported by the U.S. Department of Energy
National Energy Technology Laboratory under Award No. DE-FC26-08NT43291.
Disclaimer
This presentation was prepared as an account of work sponsored by an agency of the
United States Government. Neither the United States Government, nor any agency
thereof, nor any of their employees, makes any warranty, express or implied, or assumes
any legal liability or responsibility for the accuracy, completeness, or usefulness of any
information, apparatus, product, or process disclosed or represents that its use would not
infringe privately owned rights. Reference herein to any specific commercial product,
process, or service by trade name, trademark, manufacturer, or otherwise does not
necessarily constitute or imply its endorsement, recommendation, or favoring by the
United States Government or any agency thereof. The views and opinions of authors
expressed herein do not necessarily state or reflect those of the United States
Government or any agency thereof.