Page 1
Conceptual Framework of Sales Promotion Schemes, Consumer Preference and Brand Perception
33
CHAPTER-2
CONCEPTUAL FRAMEWORK OF SALES PROMOTION SCHEMES, CONSUMER PREFERENCE AND BRAND
PERCEPTION
2.1 Sales Promotions in India:
The FMCG sector which had kept the highest advertisement
expenses as the proportion of sales, has kept the ad expenses almost
proportionate to growth in net sales. The elasticity of advertisement of
the sector stood at 0.80 per cent to their net sales during the analyzed
period. Income and expenditure statement of the major companies in
the segment analyzed for the FMCG companies, which used to be
fervent advertisers in the past, have marginally hiked their ad budget in
2008-09 in comparison with 2007-08.
According to the analysis of FMCG sector, Hindustan Unilever Limited
increased its advertising costs in 2008-09 by 48 per cent to 2,130.92
crore which was at 440.22 crore in 2007-08. Another FMCG major,
ITC Limited, spent nearly 33 per cent more in 2008-09 than the
previous year, as the company earned 8.37 per cent growth in net
sales during the same period whereas Britannia which spent about
17.47 per cent more on advertisements in 2008-09 as compared to
the previous year recorded a growth of 20.44 per cent in the same
period.
Dabur spent nearly 14.85 per cent more on advertisements in 2008-09
as against the corresponding period of previous year while the
company„s net sales increased by 15 per cent in 2008-09. Marico
Limited which cut its advertising expenses in 2008-09 by 6.05 per cent
saw a growth rate of 22.52 per cent in the net sales figure in 2008-09
as compared to 2007-08.
Page 2
Conceptual Framework of Sales Promotion Schemes, Consumer Preference and Brand Perception
34
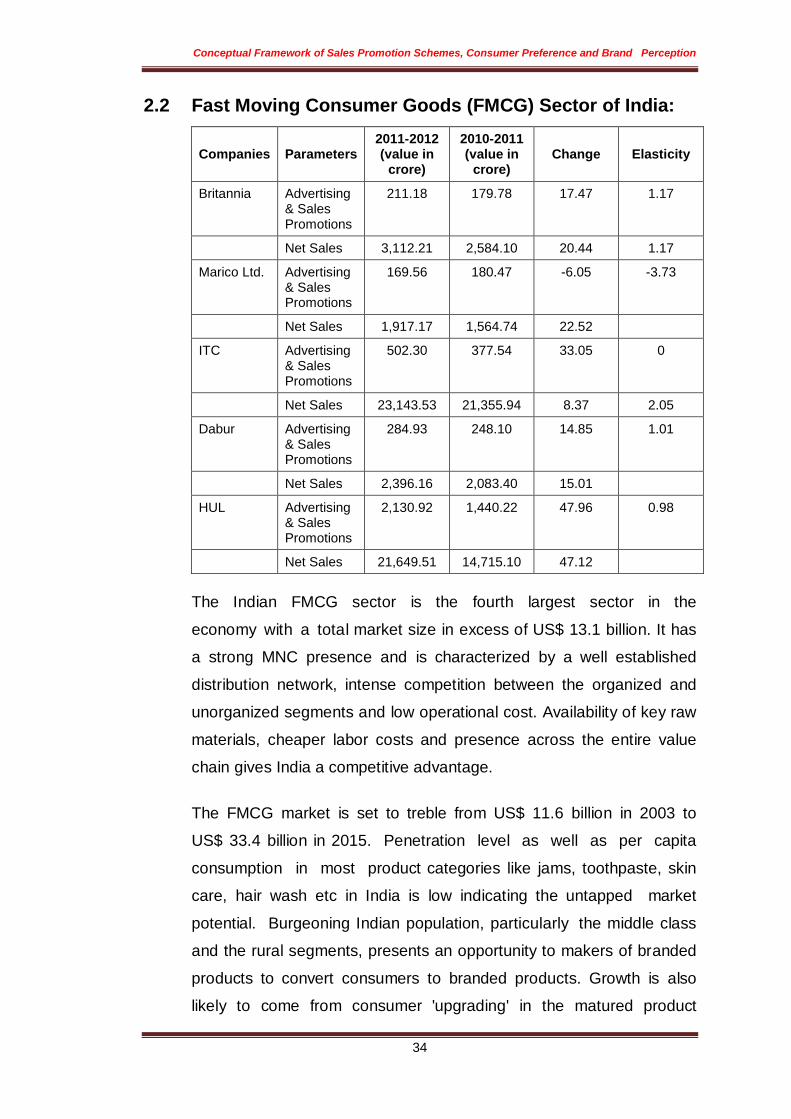
2.2 Fast Moving Consumer Goods (FMCG) Sector of India:
Companies Parameters 2011-2012 (value in
crore)
2010-2011 (value in
crore) Change Elasticity
Britannia Advertising & Sales Promotions
211.18 179.78 17.47 1.17
Net Sales 3,112.21 2,584.10 20.44 1.17
Marico Ltd. Advertising & Sales Promotions
169.56 180.47 -6.05 -3.73
Net Sales 1,917.17 1,564.74 22.52
ITC Advertising & Sales Promotions
502.30 377.54 33.05 0
Net Sales 23,143.53 21,355.94 8.37 2.05
Dabur Advertising & Sales Promotions
284.93 248.10 14.85 1.01
Net Sales 2,396.16 2,083.40 15.01
HUL Advertising & Sales Promotions
2,130.92 1,440.22 47.96 0.98
Net Sales 21,649.51 14,715.10 47.12
The Indian FMCG sector is the fourth largest sector in the
economy with a total market size in excess of US$ 13.1 billion. It has
a strong MNC presence and is characterized by a well established
distribution network, intense competition between the organized and
unorganized segments and low operational cost. Availability of key raw
materials, cheaper labor costs and presence across the entire value
chain gives India a competitive advantage.
The FMCG market is set to treble from US$ 11.6 billion in 2003 to
US$ 33.4 billion in 2015. Penetration level as well as per capita
consumption in most product categories like jams, toothpaste, skin
care, hair wash etc in India is low indicating the untapped market
potential. Burgeoning Indian population, particularly the middle class
and the rural segments, presents an opportunity to makers of branded
products to convert consumers to branded products. Growth is also
likely to come from consumer 'upgrading' in the matured product
Page 3
Conceptual Framework of Sales Promotion Schemes, Consumer Preference and Brand Perception
35
categories. With 200 million people expected to shift to processed and
packaged food by 2010, India needs around US$ 28 billion of
investment in the food-processing industry.
India - A large consumer goods spender:
An average Indian spends around 40 per cent of his income on grocery and 8
per cent on personal care products. The large share of fast moving consumer
goods (FMCG) in total individual spending along with the large population
base is another factor that makes India one of the largest FMCG markets.
Even on an international scale, total consumer expenditure on food in India
at US$ 120 billion is amongst the largest in the emerging markets, next only
to China.
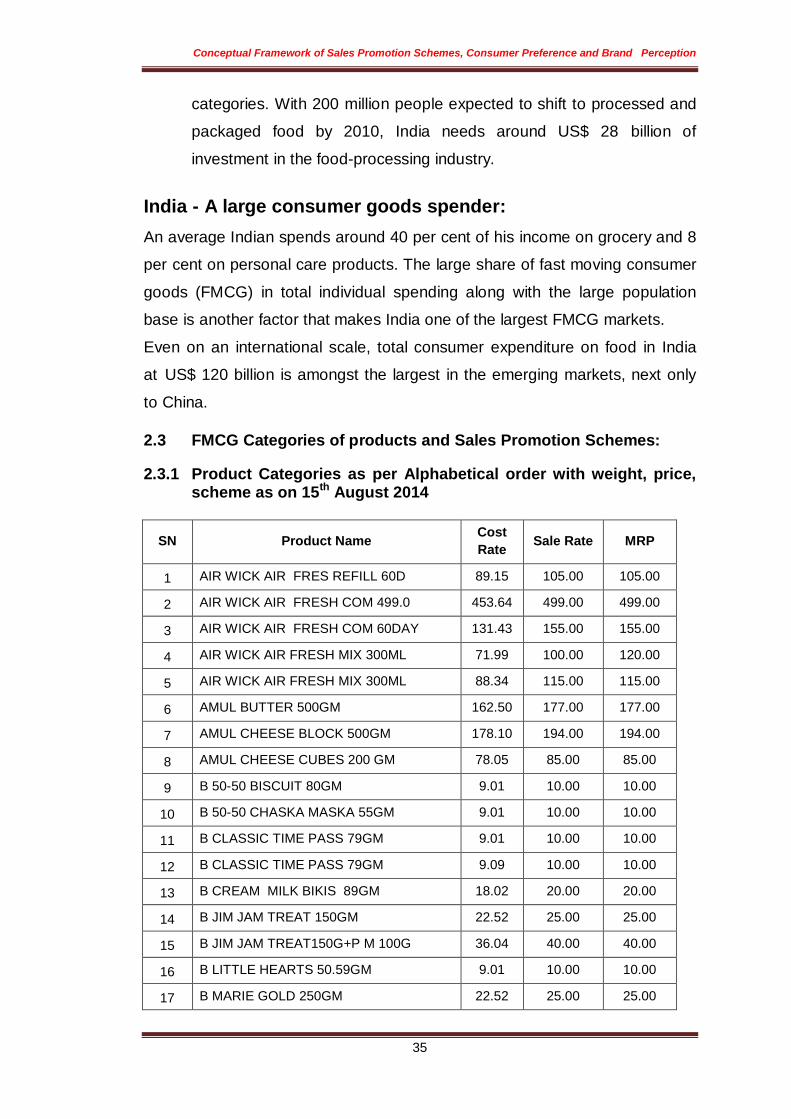
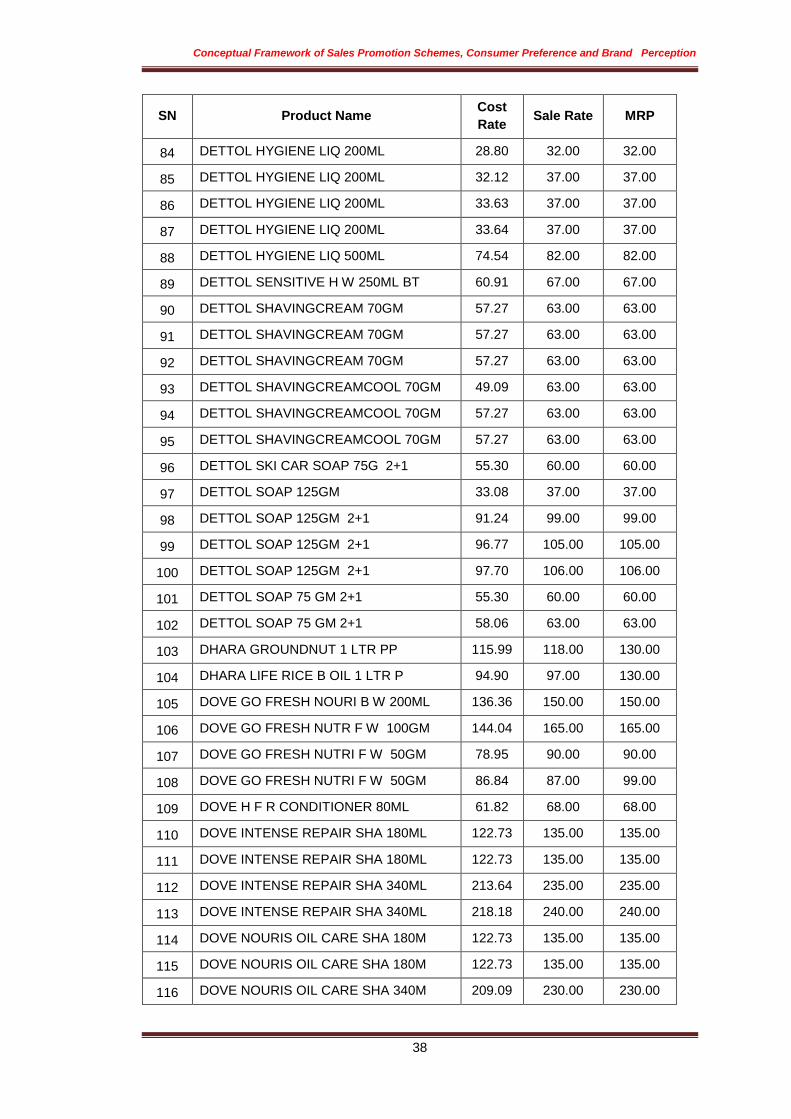
2.3 FMCG Categories of products and Sales Promotion Schemes:
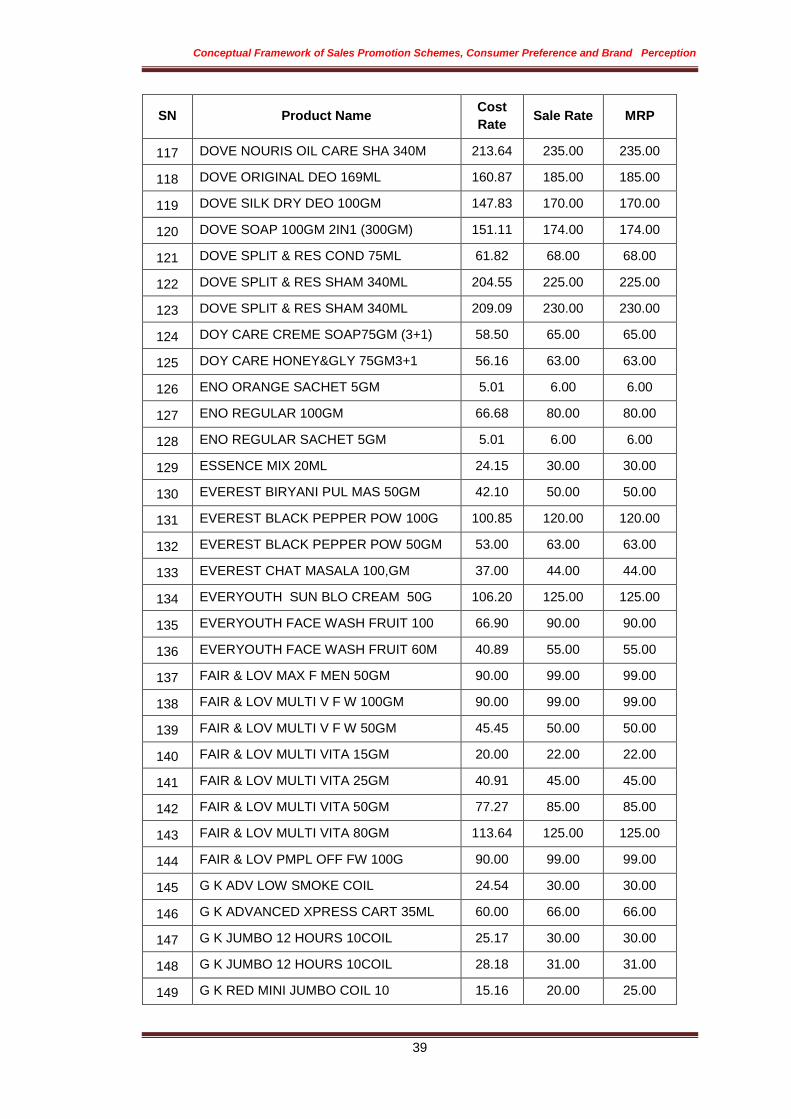
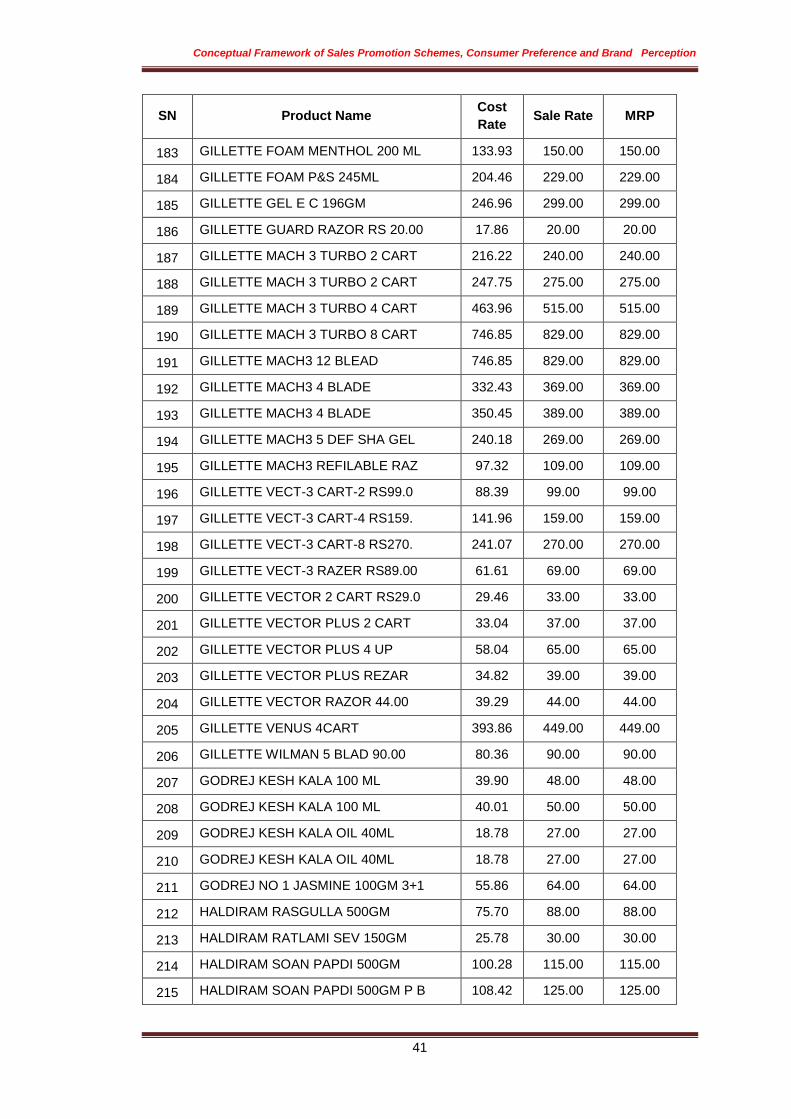
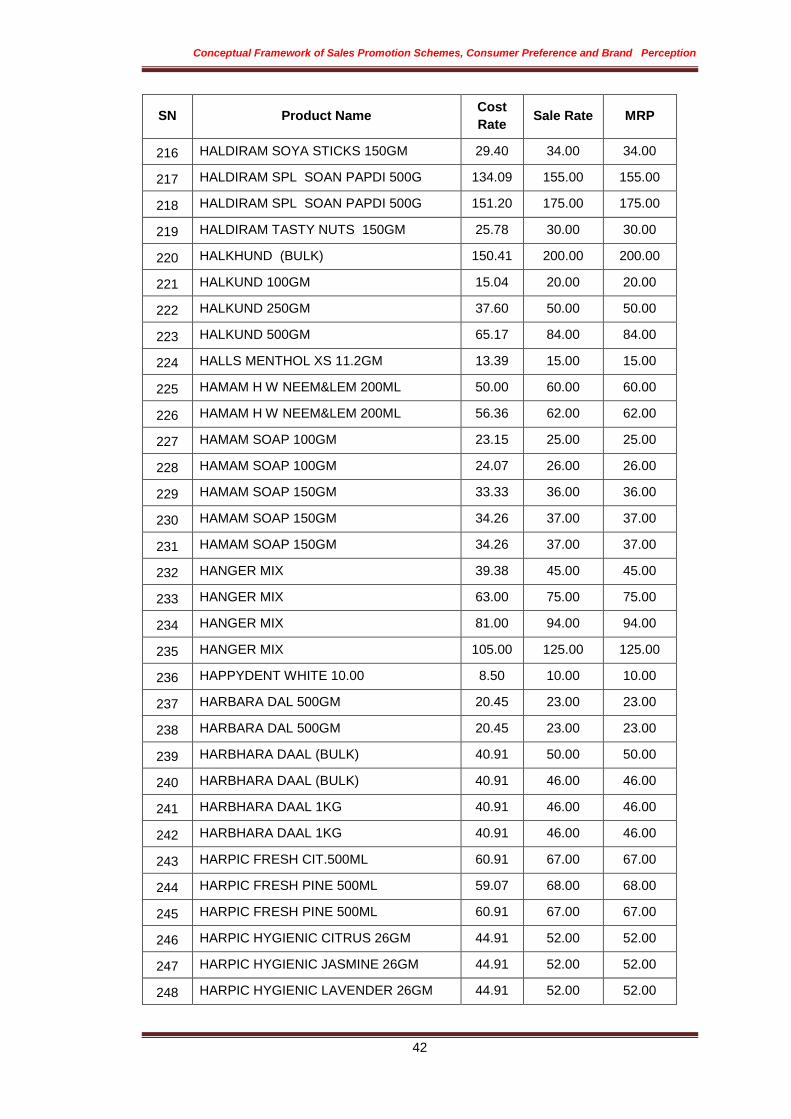
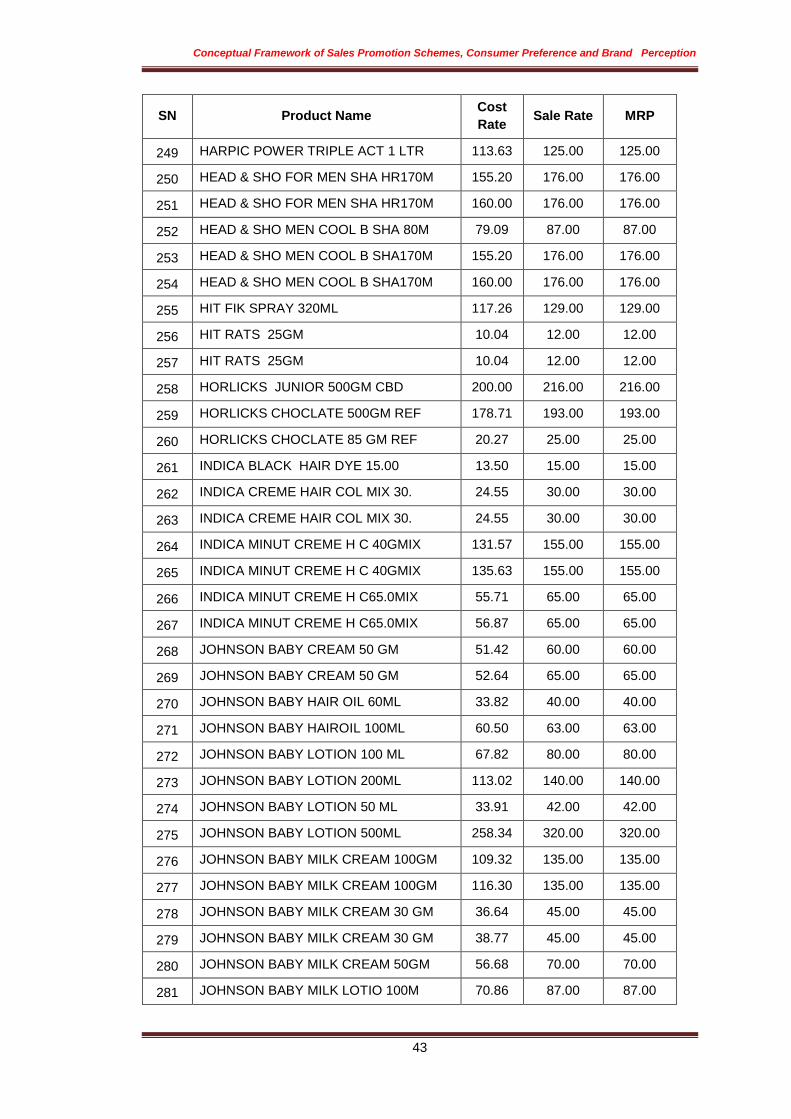
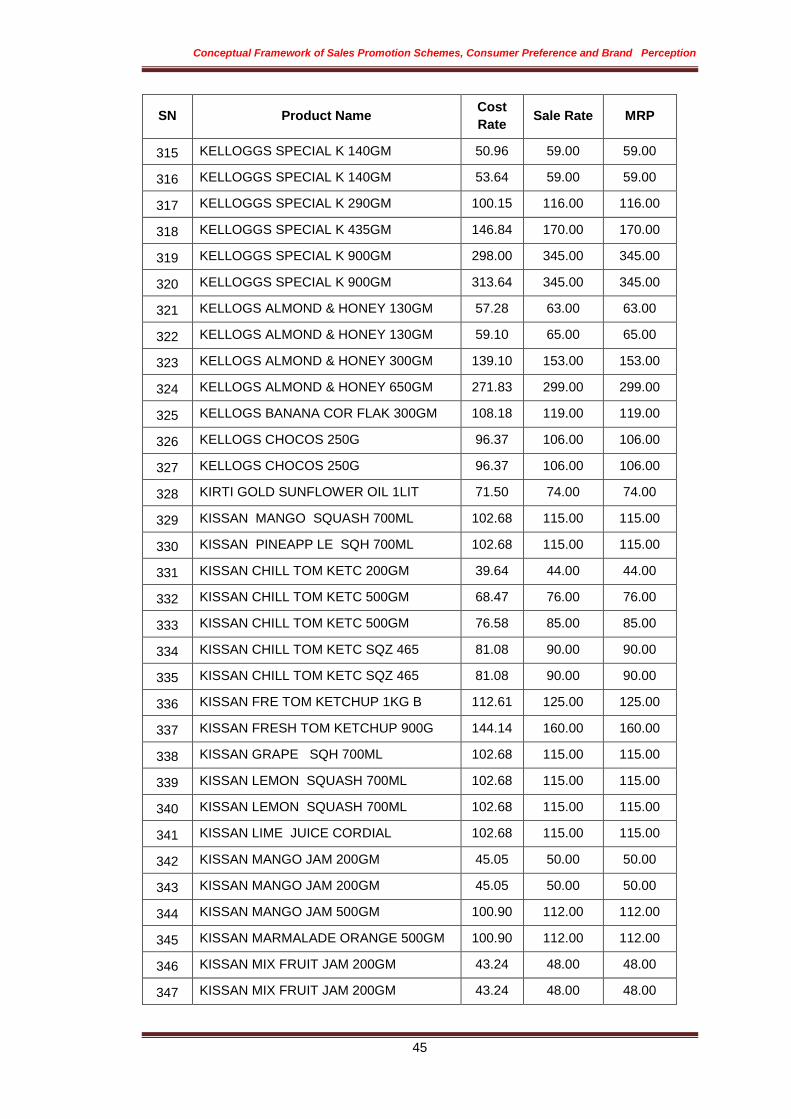
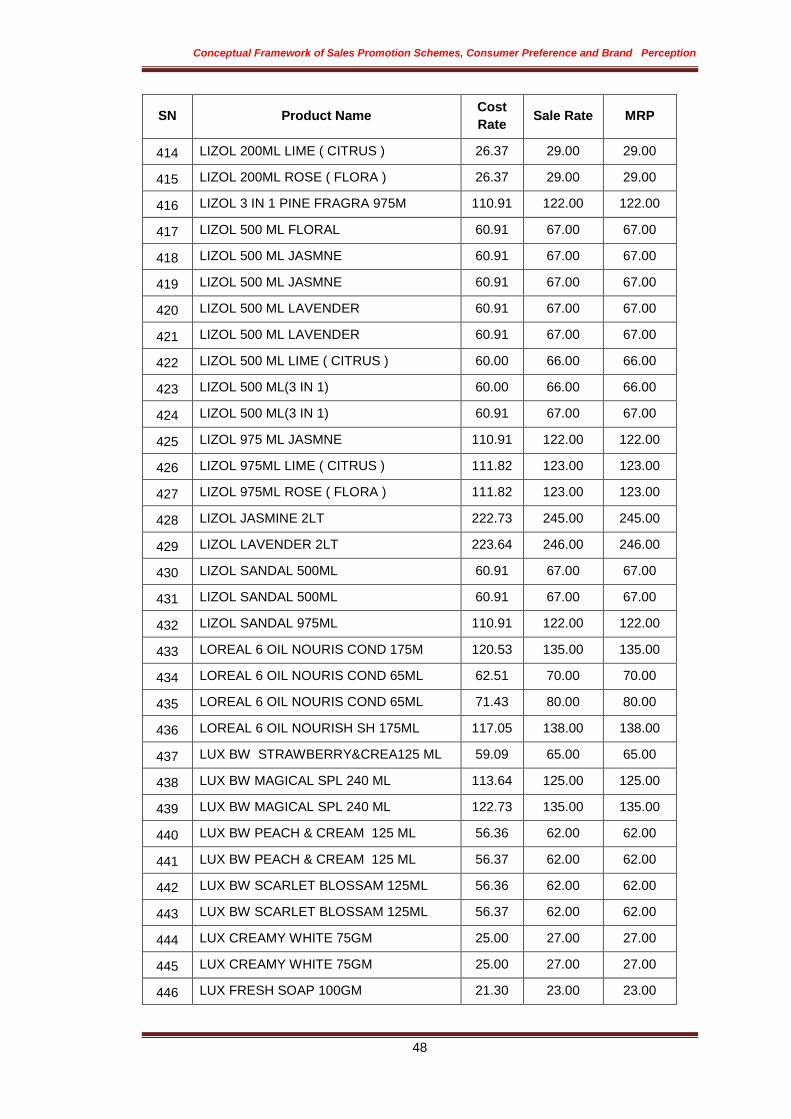
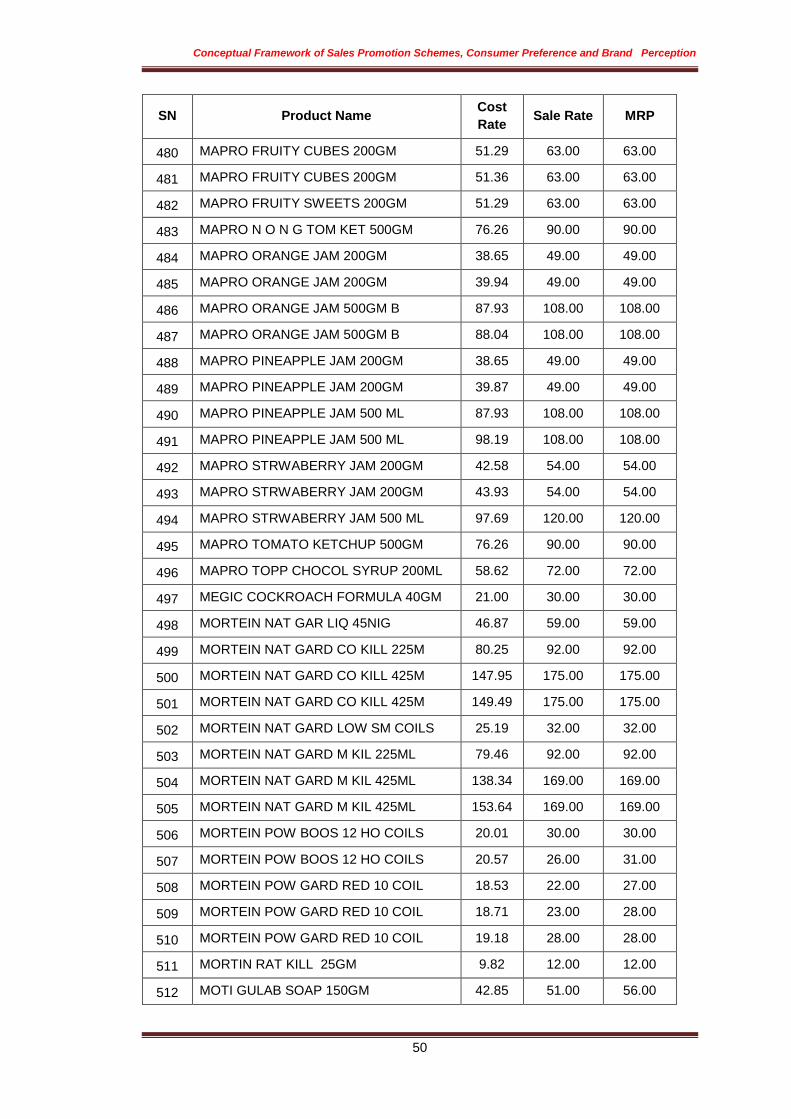
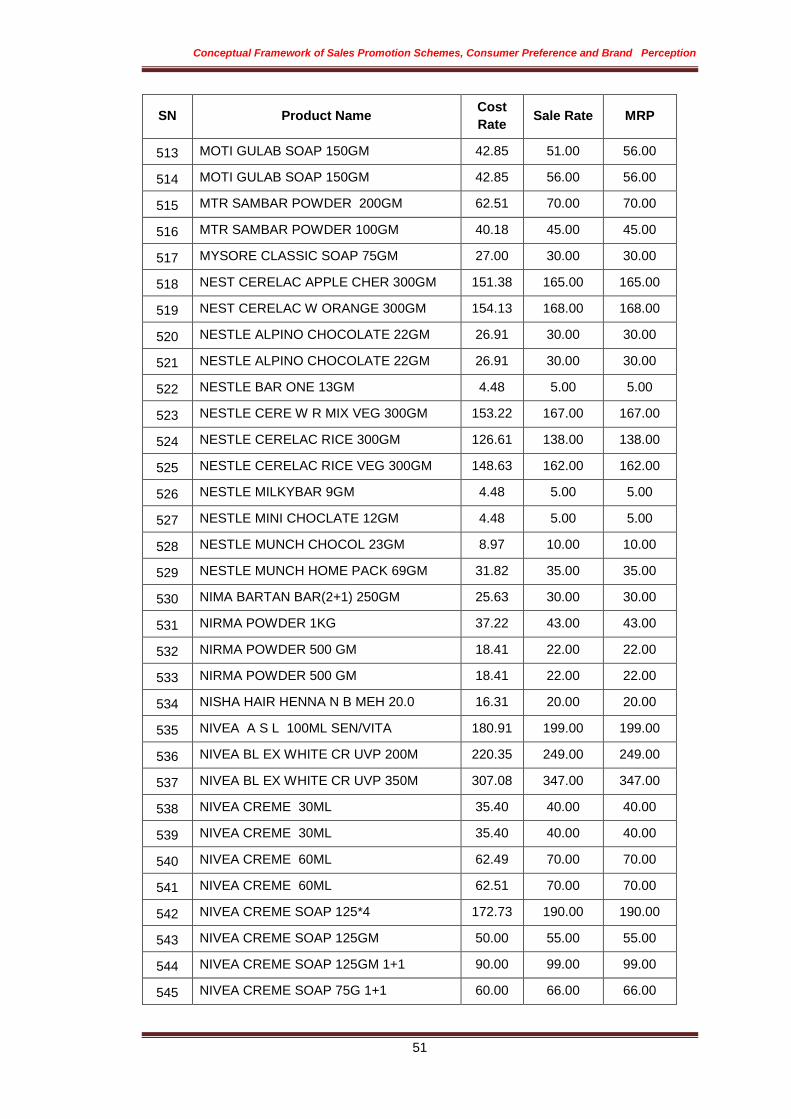
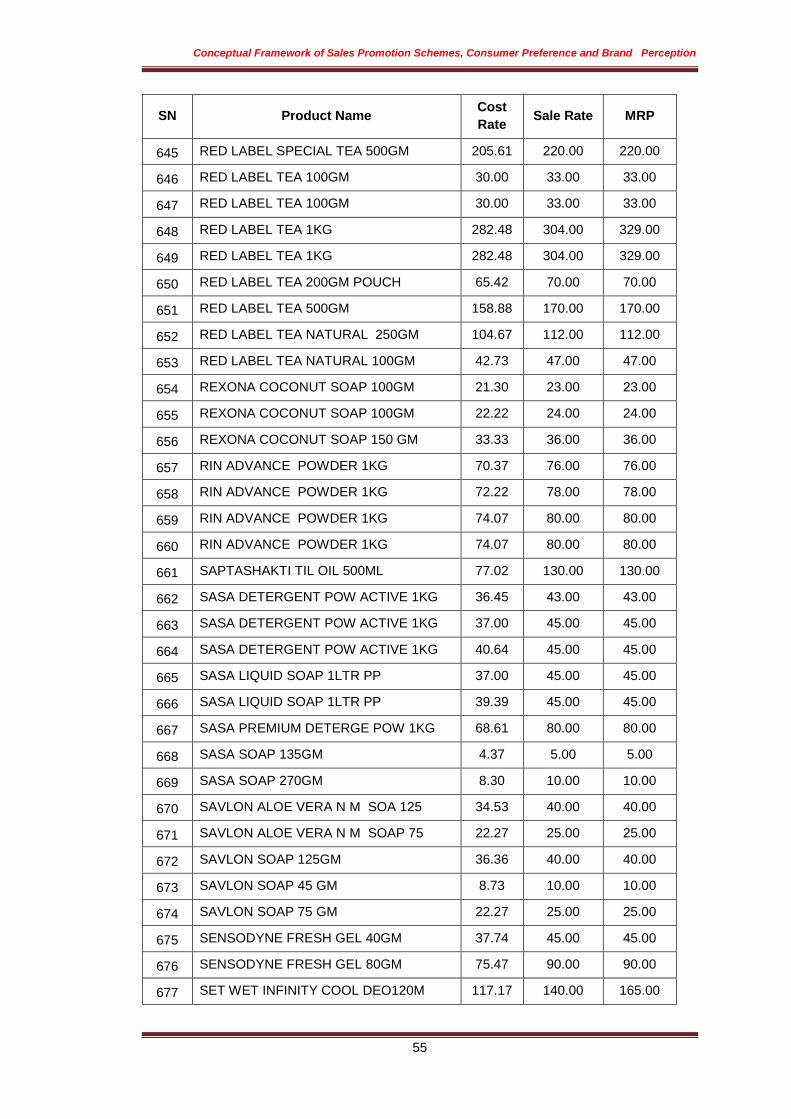
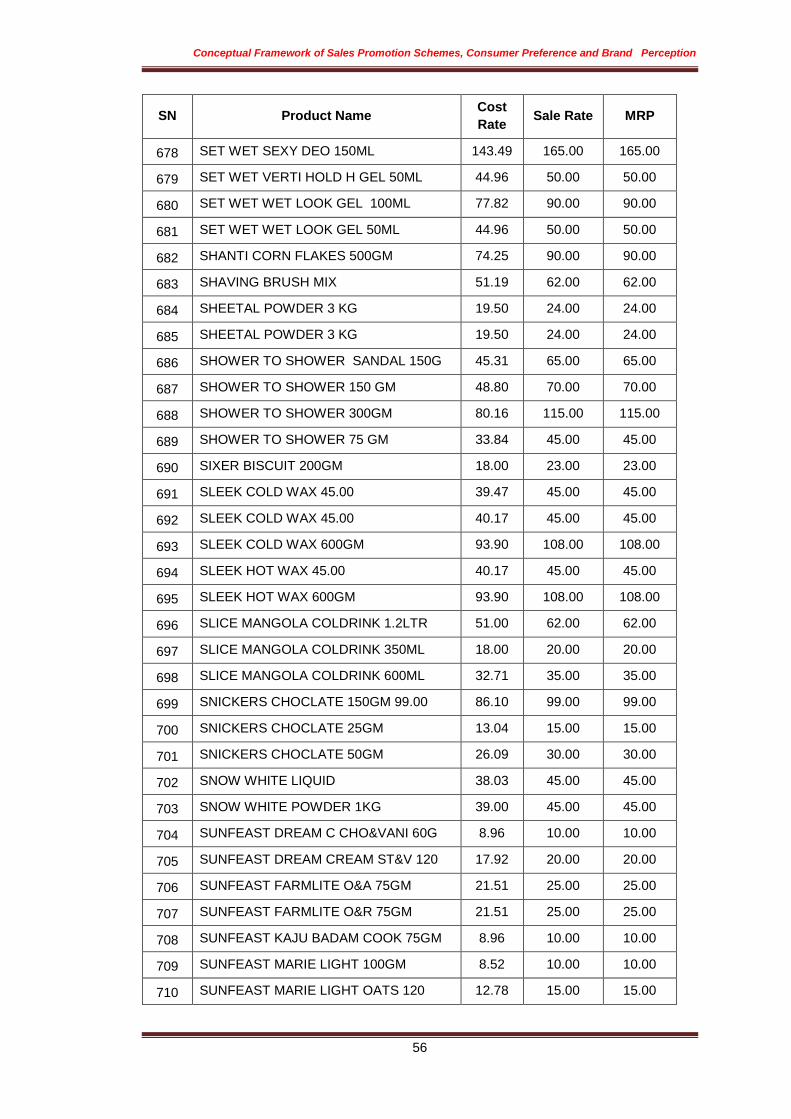
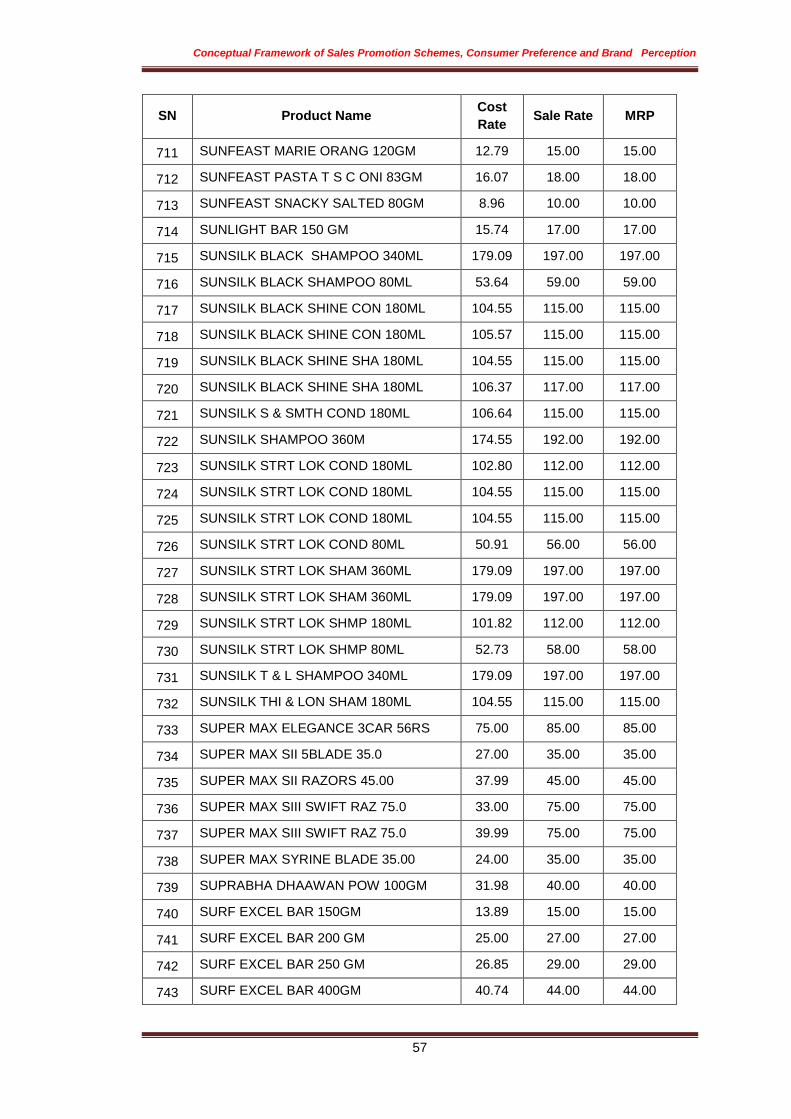
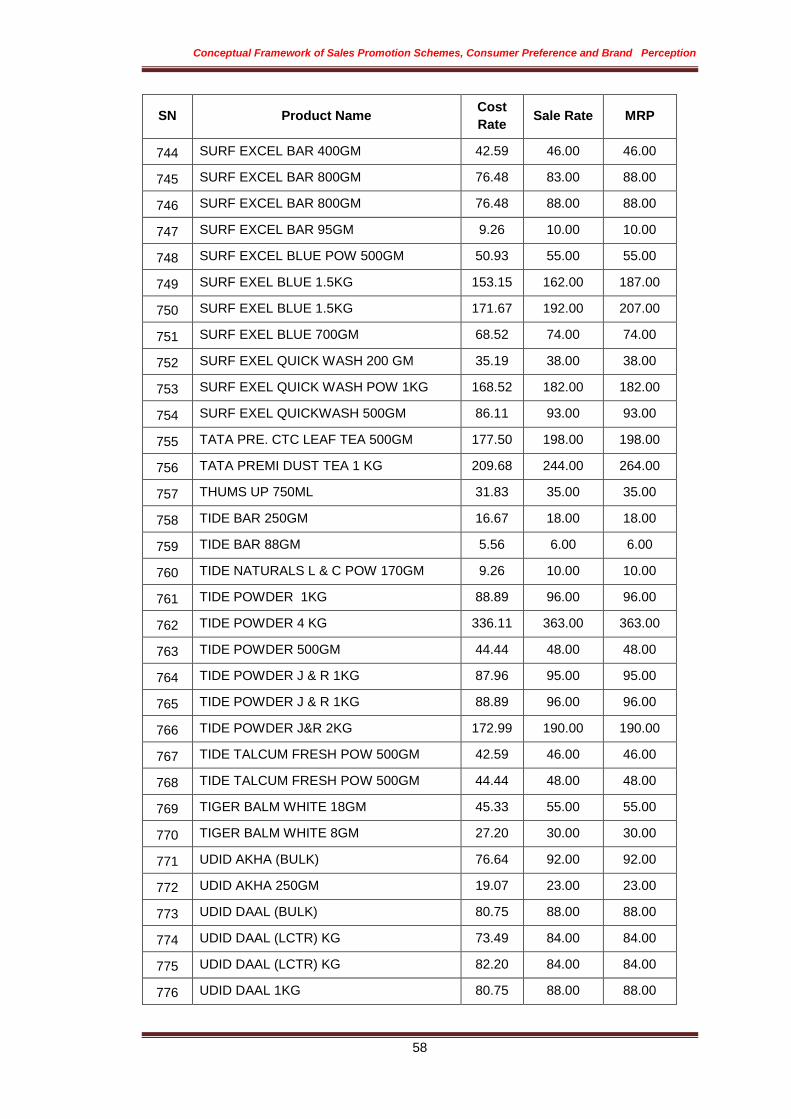
2.3.1 Product Categories as per Alphabetical order with weight, price, scheme as on 15th August 2014
SN Product Name Cost
Rate Sale Rate MRP
1 AIR WICK AIR FRES REFILL 60D 89.15 105.00 105.00
2 AIR WICK AIR FRESH COM 499.0 453.64 499.00 499.00
3 AIR WICK AIR FRESH COM 60DAY 131.43 155.00 155.00
4 AIR WICK AIR FRESH MIX 300ML 71.99 100.00 120.00
5 AIR WICK AIR FRESH MIX 300ML 88.34 115.00 115.00
6 AMUL BUTTER 500GM 162.50 177.00 177.00
7 AMUL CHEESE BLOCK 500GM 178.10 194.00 194.00
8 AMUL CHEESE CUBES 200 GM 78.05 85.00 85.00
9 B 50-50 BISCUIT 80GM 9.01 10.00 10.00
10 B 50-50 CHASKA MASKA 55GM 9.01 10.00 10.00
11 B CLASSIC TIME PASS 79GM 9.01 10.00 10.00
12 B CLASSIC TIME PASS 79GM 9.09 10.00 10.00
13 B CREAM MILK BIKIS 89GM 18.02 20.00 20.00
14 B JIM JAM TREAT 150GM 22.52 25.00 25.00
15 B JIM JAM TREAT150G+P M 100G 36.04 40.00 40.00
16 B LITTLE HEARTS 50.59GM 9.01 10.00 10.00
17 B MARIE GOLD 250GM 22.52 25.00 25.00
Page 4
Conceptual Framework of Sales Promotion Schemes, Consumer Preference and Brand Perception
36
SN Product Name Cost
Rate Sale Rate MRP
18 B MARIE GOLD 52GM 4.50 5.00 5.00
19 B MARIE GOLD 89GM 8.85 10.00 10.00
20 B MILK BIKIS GLUCO 200GM 18.02 20.00 20.00
21 B NUTRI CHOICE OATS 75GM 22.52 25.00 25.00
22 B NUTRI CHOICE OATS 75GM 27.03 30.00 30.00
23 B TIMEPASS 40GM 4.50 5.00 5.00
24 B VITA MARIEGOLD 300GM 29.74 33.00 33.00
25 BADISHEP 250GM 40.38 55.00 55.00
26 BREEZE SANDAL SOAP 100GM 3+1 46.30 50.00 50.00
27 CHANDRIKA H W 180ML 3+1 COM 109.09 120.00 120.00
28 CHANDRIKA SAVER PACK 75G*5 88.39 99.00 99.00
29 CHANDRIKA SOAP 75G 16.97 19.00 19.00
30 CHANDRIKA SOAP 75G 17.85 20.00 20.00
31 CHIK SHAMPOO BLACK 200ML 60.03 70.00 70.00
32 CINTHOL COOL SOAP 100GM 28.89 32.00 32.00
33 CINTHOL COOL TALC 100GM 36.82 45.00 45.00
34 CINTHOL COOL TALC 300GM 81.00 99.00 99.00
35 CINTHOL STRONG TALC 300GM 81.00 99.00 99.00
36 CLEAN & CLEAR C FAI CREAM 20G 58.04 65.00 65.00
37 CLEAN & CLEAR C FAI CREAM 40G 107.15 120.00 120.00
38 CLEAN & CLEAR F W MIX 20ML 15.62 20.00 20.00
39 CLEAN & CLEAR FW ME LEMON 50M 45.74 55.00 55.00
40 CLEAR ICE COOL MENT SHAM 375M 194.55 214.00 214.00
41 CLEAR ICE COOL MENT SHAM 80ML 56.36 62.00 62.00
42 CLEAR MEN C ITCH CONT SH 200M 122.73 135.00 135.00
43 CLINIC PLUS ANTI DAN SHA 175M 92.73 102.00 102.00
44 CLINIC PLUS ANTI DAN SHA 175M 95.46 105.00 105.00
45 CLINIC PLUS STR & LONG 175ML 83.64 92.00 92.00
46 CLINIC PLUS STR & LONG 80ML 46.36 51.00 51.00
47 CLOSE-UP A G PEPPERMINT S 150 68.18 75.00 75.00
48 CLOSE-UP RED T P 150GM 1+1 130.00 143.00 143.00
49 CLOSEUP RED TOOTH . P. .80GM 38.18 42.00 42.00
50 COLGATE 360 SURROU M/S TB 50.36 75.00 75.00
Page 5
Conceptual Framework of Sales Promotion Schemes, Consumer Preference and Brand Perception
37
SN Product Name Cost
Rate Sale Rate MRP
51 COLGATE 360 VISIBLE WHITE TB 53.04 79.00 79.00
52 COLGATE CIBACA TOP T P 80GM 22.73 25.00 25.00
53 COLGATE CIBACA TOP T P 80GM 23.64 26.00 26.00
54 COLGATE DENTAL CREA PASTE 100 33.33 39.00 39.00
55 COLGATE DENTAL CREA PASTE 100 34.18 40.00 40.00
56 COLGATE DENTAL CREAM 150GM 48.71 57.00 57.00
57 COLGATE DENTAL CREAM 18GM 4.35 5.00 5.00
58 COLGATE DENTAL CREAM 200GM NE 66.65 78.00 78.00
59 COLGATE DENTAL CREAM 300GM 100.84 118.00 118.00
60 COLGATE DENTAL CREAM 50GM 14.55 16.00 16.00
61 COLGATE EXTRA CLEAN T. B. S/M 6.20 17.00 17.00
62 COLGATE HERBAL TOOTH P. 200G 70.07 82.00 82.00
63 COLGATE KIDS 0-2 T B 20.00 16.71 24.00 24.00
64 COLGATE ZIGZAG T B 2+1 50.00 34.82 50.00 50.00
65 COMPLAN CHOCO REF 500GM 206.42 225.00 225.00
66 COMPLAN MEMORY C B RF 200GM 128.44 140.00 140.00
67 COMPLAN MEMORY C B RF 400GM 215.60 235.00 235.00
68 COMPLAN NUT GRO B KHE 400G J 228.18 251.00 251.00
69 DABUR CHYAWAN MIX FRUIT 1KG 250.01 285.00 285.00
70 DABUR CHYAWAN MIX FRUT 500GM 135.97 155.00 155.00
71 DABUR CHYAWANPRASH 250GM 73.69 84.00 84.00
72 DABUR GULABARI 60 ML 22.32 25.00 25.00
73 DABUR GULBARI 120ML 35.72 40.00 40.00
74 DABUR HAJMOLA IMLI 130TABS 22.32 25.00 25.00
75 DABUR HAJMOLA REG TAB 20.91 22.00 22.00
76 DABUR HAJMOLA REG TAB 22.32 25.00 25.00
77 DABUR HONEY 100 GMS 44.65 50.00 50.00
78 DABUR HONEY 250 GMS 89.28 100.00 100.00
79 DABUR HONEY 50GM 25.00 28.00 28.00
80 DABUR HONEY 50GM 26.79 30.00 30.00
81 DABUR LAL DANT MANJAN 150GM 43.64 48.00 48.00
82 DABUR LAL OIL 100ML 66.37 75.00 75.00
83 DABUR LAL OIL 200ML 123.89 140.00 140.00
Page 6
Conceptual Framework of Sales Promotion Schemes, Consumer Preference and Brand Perception
38
SN Product Name Cost
Rate Sale Rate MRP
84 DETTOL HYGIENE LIQ 200ML 28.80 32.00 32.00
85 DETTOL HYGIENE LIQ 200ML 32.12 37.00 37.00
86 DETTOL HYGIENE LIQ 200ML 33.63 37.00 37.00
87 DETTOL HYGIENE LIQ 200ML 33.64 37.00 37.00
88 DETTOL HYGIENE LIQ 500ML 74.54 82.00 82.00
89 DETTOL SENSITIVE H W 250ML BT 60.91 67.00 67.00
90 DETTOL SHAVINGCREAM 70GM 57.27 63.00 63.00
91 DETTOL SHAVINGCREAM 70GM 57.27 63.00 63.00
92 DETTOL SHAVINGCREAM 70GM 57.27 63.00 63.00
93 DETTOL SHAVINGCREAMCOOL 70GM 49.09 63.00 63.00
94 DETTOL SHAVINGCREAMCOOL 70GM 57.27 63.00 63.00
95 DETTOL SHAVINGCREAMCOOL 70GM 57.27 63.00 63.00
96 DETTOL SKI CAR SOAP 75G 2+1 55.30 60.00 60.00
97 DETTOL SOAP 125GM 33.08 37.00 37.00
98 DETTOL SOAP 125GM 2+1 91.24 99.00 99.00
99 DETTOL SOAP 125GM 2+1 96.77 105.00 105.00
100 DETTOL SOAP 125GM 2+1 97.70 106.00 106.00
101 DETTOL SOAP 75 GM 2+1 55.30 60.00 60.00
102 DETTOL SOAP 75 GM 2+1 58.06 63.00 63.00
103 DHARA GROUNDNUT 1 LTR PP 115.99 118.00 130.00
104 DHARA LIFE RICE B OIL 1 LTR P 94.90 97.00 130.00
105 DOVE GO FRESH NOURI B W 200ML 136.36 150.00 150.00
106 DOVE GO FRESH NUTR F W 100GM 144.04 165.00 165.00
107 DOVE GO FRESH NUTRI F W 50GM 78.95 90.00 90.00
108 DOVE GO FRESH NUTRI F W 50GM 86.84 87.00 99.00
109 DOVE H F R CONDITIONER 80ML 61.82 68.00 68.00
110 DOVE INTENSE REPAIR SHA 180ML 122.73 135.00 135.00
111 DOVE INTENSE REPAIR SHA 180ML 122.73 135.00 135.00
112 DOVE INTENSE REPAIR SHA 340ML 213.64 235.00 235.00
113 DOVE INTENSE REPAIR SHA 340ML 218.18 240.00 240.00
114 DOVE NOURIS OIL CARE SHA 180M 122.73 135.00 135.00
115 DOVE NOURIS OIL CARE SHA 180M 122.73 135.00 135.00
116 DOVE NOURIS OIL CARE SHA 340M 209.09 230.00 230.00
Page 7
Conceptual Framework of Sales Promotion Schemes, Consumer Preference and Brand Perception
39
SN Product Name Cost
Rate Sale Rate MRP
117 DOVE NOURIS OIL CARE SHA 340M 213.64 235.00 235.00
118 DOVE ORIGINAL DEO 169ML 160.87 185.00 185.00
119 DOVE SILK DRY DEO 100GM 147.83 170.00 170.00
120 DOVE SOAP 100GM 2IN1 (300GM) 151.11 174.00 174.00
121 DOVE SPLIT & RES COND 75ML 61.82 68.00 68.00
122 DOVE SPLIT & RES SHAM 340ML 204.55 225.00 225.00
123 DOVE SPLIT & RES SHAM 340ML 209.09 230.00 230.00
124 DOY CARE CREME SOAP75GM (3+1) 58.50 65.00 65.00
125 DOY CARE HONEY&GLY 75GM3+1 56.16 63.00 63.00
126 ENO ORANGE SACHET 5GM 5.01 6.00 6.00
127 ENO REGULAR 100GM 66.68 80.00 80.00
128 ENO REGULAR SACHET 5GM 5.01 6.00 6.00
129 ESSENCE MIX 20ML 24.15 30.00 30.00
130 EVEREST BIRYANI PUL MAS 50GM 42.10 50.00 50.00
131 EVEREST BLACK PEPPER POW 100G 100.85 120.00 120.00
132 EVEREST BLACK PEPPER POW 50GM 53.00 63.00 63.00
133 EVEREST CHAT MASALA 100,GM 37.00 44.00 44.00
134 EVERYOUTH SUN BLO CREAM 50G 106.20 125.00 125.00
135 EVERYOUTH FACE WASH FRUIT 100 66.90 90.00 90.00
136 EVERYOUTH FACE WASH FRUIT 60M 40.89 55.00 55.00
137 FAIR & LOV MAX F MEN 50GM 90.00 99.00 99.00
138 FAIR & LOV MULTI V F W 100GM 90.00 99.00 99.00
139 FAIR & LOV MULTI V F W 50GM 45.45 50.00 50.00
140 FAIR & LOV MULTI VITA 15GM 20.00 22.00 22.00
141 FAIR & LOV MULTI VITA 25GM 40.91 45.00 45.00
142 FAIR & LOV MULTI VITA 50GM 77.27 85.00 85.00
143 FAIR & LOV MULTI VITA 80GM 113.64 125.00 125.00
144 FAIR & LOV PMPL OFF FW 100G 90.00 99.00 99.00
145 G K ADV LOW SMOKE COIL 24.54 30.00 30.00
146 G K ADVANCED XPRESS CART 35ML 60.00 66.00 66.00
147 G K JUMBO 12 HOURS 10COIL 25.17 30.00 30.00
148 G K JUMBO 12 HOURS 10COIL 28.18 31.00 31.00
149 G K RED MINI JUMBO COIL 10 15.16 20.00 25.00
Page 8
Conceptual Framework of Sales Promotion Schemes, Consumer Preference and Brand Perception
40
SN Product Name Cost
Rate Sale Rate MRP
150 G K SHAKTI + 10MATS FREE (36. 32.73 36.00 36.00
151 G K SILVER POWER 30S MAT 45.45 50.00 50.00
152 G K SILVER POWER 30S MAT 45.45 50.00 50.00
153 GARNIER B-B CREAM 18GM 86.09 99.00 99.00
154 GARNIER B-B CREAM 40GM 173.04 199.00 199.00
155 GARNIER BLACK NATURALS NO 1.0 34.82 39.00 39.00
156 GARNIER BLACK NATURALS NO 2.0 34.82 39.00 39.00
157 GARNIER BLACK NATURALS NO 3.0 34.82 39.00 39.00
158 GARNIER COLOR C I RED NO 6.6 156.24 175.00 175.00
159 GARNIER COLOR NAT MEN NO 1 88.39 99.00 99.00
160 GARNIER COLOR NAT MEN NO 3 88.39 99.00 99.00
161 GARNIER MEN ACNO FIGHT FW100G 120.86 139.00 139.00
162 GARNIER POW L M SPF 15 50GM 156.52 180.00 180.00
163 GARNIER POWER LIGHT FACE 100M 130.43 150.00 150.00
164 GARNIER POWER LIGHT FACE W 50 73.91 85.00 85.00
165 GARNIER POWER LIGHT MOIS 20GM 73.91 85.00 85.00
166 GARNIER POWER LIGHT MOIS 50GM 147.83 170.00 170.00
167 GARNIER PUR AC NEEM FW 100G 65.22 75.00 75.00
168 GARNIER PUR AC NEEM FW 100G 69.56 80.00 80.00
169 GARNIER PUR AC PORE WASH 100G 130.43 150.00 150.00
170 GARNIER PURE FACE WASH 100ML 117.39 135.00 135.00
171 GARNIER PURE PIMP CONT PEN 10 86.09 99.00 99.00
172 GEMINI REF GRO OIL 5 LTR 508.22 520.00 520.00
173 GEMINI REF GRO OIL 1LT 96.20 98.00 98.00
174 GEMINI SOYA OIL 1 LTR 73.84 78.00 78.00
175 GEMINI SOYA OIL 1 LTR 75.50 78.00 78.00
176 GEMINI SOYA OIL 5LTR JAR 393.28 404.00 404.00
177 GEMINI SOYA OIL 5LTR JAR 401.00 407.00 407.00
178 GEMINI VANASPATI 1 LIT 71.45 74.00 74.00
179 GEMINI VANASPATI 1 LIT 71.50 74.00 74.00
180 GEMINI VANASPATI 500ML 36.39 40.00 40.00
181 GILLETTE SEN SKI SHA GEL 60G 59.82 67.00 67.00
182 GILLETTE FOAM LIME 200 ML 133.93 150.00 150.00
Page 9
Conceptual Framework of Sales Promotion Schemes, Consumer Preference and Brand Perception
41
SN Product Name Cost
Rate Sale Rate MRP
183 GILLETTE FOAM MENTHOL 200 ML 133.93 150.00 150.00
184 GILLETTE FOAM P&S 245ML 204.46 229.00 229.00
185 GILLETTE GEL E C 196GM 246.96 299.00 299.00
186 GILLETTE GUARD RAZOR RS 20.00 17.86 20.00 20.00
187 GILLETTE MACH 3 TURBO 2 CART 216.22 240.00 240.00
188 GILLETTE MACH 3 TURBO 2 CART 247.75 275.00 275.00
189 GILLETTE MACH 3 TURBO 4 CART 463.96 515.00 515.00
190 GILLETTE MACH 3 TURBO 8 CART 746.85 829.00 829.00
191 GILLETTE MACH3 12 BLEAD 746.85 829.00 829.00
192 GILLETTE MACH3 4 BLADE 332.43 369.00 369.00
193 GILLETTE MACH3 4 BLADE 350.45 389.00 389.00
194 GILLETTE MACH3 5 DEF SHA GEL 240.18 269.00 269.00
195 GILLETTE MACH3 REFILABLE RAZ 97.32 109.00 109.00
196 GILLETTE VECT-3 CART-2 RS99.0 88.39 99.00 99.00
197 GILLETTE VECT-3 CART-4 RS159. 141.96 159.00 159.00
198 GILLETTE VECT-3 CART-8 RS270. 241.07 270.00 270.00
199 GILLETTE VECT-3 RAZER RS89.00 61.61 69.00 69.00
200 GILLETTE VECTOR 2 CART RS29.0 29.46 33.00 33.00
201 GILLETTE VECTOR PLUS 2 CART 33.04 37.00 37.00
202 GILLETTE VECTOR PLUS 4 UP 58.04 65.00 65.00
203 GILLETTE VECTOR PLUS REZAR 34.82 39.00 39.00
204 GILLETTE VECTOR RAZOR 44.00 39.29 44.00 44.00
205 GILLETTE VENUS 4CART 393.86 449.00 449.00
206 GILLETTE WILMAN 5 BLAD 90.00 80.36 90.00 90.00
207 GODREJ KESH KALA 100 ML 39.90 48.00 48.00
208 GODREJ KESH KALA 100 ML 40.01 50.00 50.00
209 GODREJ KESH KALA OIL 40ML 18.78 27.00 27.00
210 GODREJ KESH KALA OIL 40ML 18.78 27.00 27.00
211 GODREJ NO 1 JASMINE 100GM 3+1 55.86 64.00 64.00
212 HALDIRAM RASGULLA 500GM 75.70 88.00 88.00
213 HALDIRAM RATLAMI SEV 150GM 25.78 30.00 30.00
214 HALDIRAM SOAN PAPDI 500GM 100.28 115.00 115.00
215 HALDIRAM SOAN PAPDI 500GM P B 108.42 125.00 125.00
Page 10
Conceptual Framework of Sales Promotion Schemes, Consumer Preference and Brand Perception
42
SN Product Name Cost
Rate Sale Rate MRP
216 HALDIRAM SOYA STICKS 150GM 29.40 34.00 34.00
217 HALDIRAM SPL SOAN PAPDI 500G 134.09 155.00 155.00
218 HALDIRAM SPL SOAN PAPDI 500G 151.20 175.00 175.00
219 HALDIRAM TASTY NUTS 150GM 25.78 30.00 30.00
220 HALKHUND (BULK) 150.41 200.00 200.00
221 HALKUND 100GM 15.04 20.00 20.00
222 HALKUND 250GM 37.60 50.00 50.00
223 HALKUND 500GM 65.17 84.00 84.00
224 HALLS MENTHOL XS 11.2GM 13.39 15.00 15.00
225 HAMAM H W NEEM&LEM 200ML 50.00 60.00 60.00
226 HAMAM H W NEEM&LEM 200ML 56.36 62.00 62.00
227 HAMAM SOAP 100GM 23.15 25.00 25.00
228 HAMAM SOAP 100GM 24.07 26.00 26.00
229 HAMAM SOAP 150GM 33.33 36.00 36.00
230 HAMAM SOAP 150GM 34.26 37.00 37.00
231 HAMAM SOAP 150GM 34.26 37.00 37.00
232 HANGER MIX 39.38 45.00 45.00
233 HANGER MIX 63.00 75.00 75.00
234 HANGER MIX 81.00 94.00 94.00
235 HANGER MIX 105.00 125.00 125.00
236 HAPPYDENT WHITE 10.00 8.50 10.00 10.00
237 HARBARA DAL 500GM 20.45 23.00 23.00
238 HARBARA DAL 500GM 20.45 23.00 23.00
239 HARBHARA DAAL (BULK) 40.91 50.00 50.00
240 HARBHARA DAAL (BULK) 40.91 46.00 46.00
241 HARBHARA DAAL 1KG 40.91 46.00 46.00
242 HARBHARA DAAL 1KG 40.91 46.00 46.00
243 HARPIC FRESH CIT.500ML 60.91 67.00 67.00
244 HARPIC FRESH PINE 500ML 59.07 68.00 68.00
245 HARPIC FRESH PINE 500ML 60.91 67.00 67.00
246 HARPIC HYGIENIC CITRUS 26GM 44.91 52.00 52.00
247 HARPIC HYGIENIC JASMINE 26GM 44.91 52.00 52.00
248 HARPIC HYGIENIC LAVENDER 26GM 44.91 52.00 52.00
Page 11
Conceptual Framework of Sales Promotion Schemes, Consumer Preference and Brand Perception
43
SN Product Name Cost
Rate Sale Rate MRP
249 HARPIC POWER TRIPLE ACT 1 LTR 113.63 125.00 125.00
250 HEAD & SHO FOR MEN SHA HR170M 155.20 176.00 176.00
251 HEAD & SHO FOR MEN SHA HR170M 160.00 176.00 176.00
252 HEAD & SHO MEN COOL B SHA 80M 79.09 87.00 87.00
253 HEAD & SHO MEN COOL B SHA170M 155.20 176.00 176.00
254 HEAD & SHO MEN COOL B SHA170M 160.00 176.00 176.00
255 HIT FIK SPRAY 320ML 117.26 129.00 129.00
256 HIT RATS 25GM 10.04 12.00 12.00
257 HIT RATS 25GM 10.04 12.00 12.00
258 HORLICKS JUNIOR 500GM CBD 200.00 216.00 216.00
259 HORLICKS CHOCLATE 500GM REF 178.71 193.00 193.00
260 HORLICKS CHOCLATE 85 GM REF 20.27 25.00 25.00
261 INDICA BLACK HAIR DYE 15.00 13.50 15.00 15.00
262 INDICA CREME HAIR COL MIX 30. 24.55 30.00 30.00
263 INDICA CREME HAIR COL MIX 30. 24.55 30.00 30.00
264 INDICA MINUT CREME H C 40GMIX 131.57 155.00 155.00
265 INDICA MINUT CREME H C 40GMIX 135.63 155.00 155.00
266 INDICA MINUT CREME H C65.0MIX 55.71 65.00 65.00
267 INDICA MINUT CREME H C65.0MIX 56.87 65.00 65.00
268 JOHNSON BABY CREAM 50 GM 51.42 60.00 60.00
269 JOHNSON BABY CREAM 50 GM 52.64 65.00 65.00
270 JOHNSON BABY HAIR OIL 60ML 33.82 40.00 40.00
271 JOHNSON BABY HAIROIL 100ML 60.50 63.00 63.00
272 JOHNSON BABY LOTION 100 ML 67.82 80.00 80.00
273 JOHNSON BABY LOTION 200ML 113.02 140.00 140.00
274 JOHNSON BABY LOTION 50 ML 33.91 42.00 42.00
275 JOHNSON BABY LOTION 500ML 258.34 320.00 320.00
276 JOHNSON BABY MILK CREAM 100GM 109.32 135.00 135.00
277 JOHNSON BABY MILK CREAM 100GM 116.30 135.00 135.00
278 JOHNSON BABY MILK CREAM 30 GM 36.64 45.00 45.00
279 JOHNSON BABY MILK CREAM 30 GM 38.77 45.00 45.00
280 JOHNSON BABY MILK CREAM 50GM 56.68 70.00 70.00
281 JOHNSON BABY MILK LOTIO 100M 70.86 87.00 87.00
Page 12
Conceptual Framework of Sales Promotion Schemes, Consumer Preference and Brand Perception
44
SN Product Name Cost
Rate Sale Rate MRP
282 JOHNSON BABY MILK LOTIO 100M 74.98 87.00 87.00
283 JOHNSON BABY MILK LOTIO 200GM 121.52 150.00 150.00
284 JOHNSON BABY MILK LOTIO 50ML 35.88 45.00 45.00
285 JOHNSON BABY MILK LOTIO 50ML 40.51 47.00 47.00
286 JOHNSON BABY MILK SOAP 75GM 34.11 37.00 37.00
287 JOHNSON BABY MILK SOAP 75GM 35.35 40.00 40.00
288 JOHNSON BABY OIL 500ML 283.48 330.00 330.00
289 JOHNSON BABY POW BLOSS 100GM 40.96 50.00 50.00
290 JOHNSON BABY POW BLOSS 50GM 21.76 27.00 27.00
291 JOHNSON BABY POW. 400GM 128.90 150.00 150.00
292 JOHNSON BABY POW. 400GM 129.33 150.00 150.00
293 JOHNSON BABY POW. 700GM 204.11 240.00 240.00
294 JOHNSON BABY POW. 700GM 210.54 245.00 245.00
295 JOHNSON BABY POWDER 100 GM 40.96 50.00 50.00
296 JOHNSON BABY POWDER 100 GM 44.25 50.00 50.00
297 JOHNSON BABY POWDER 200 GM 77.55 95.00 95.00
298 JOHNSON BABY SKINCAR 80 WIPES 163.25 190.00 190.00
299 JOHNSON BABY SKINCARE 10WIPE 30.17 35.00 35.00
300 JOHNSON BABY SKINCARE 20WIPES 50.41 65.00 65.00
301 JOHNSON HAIR OIL 200ML 95.50 110.00 110.00
302 JOHNSON HAIR OIL 200ML 98.50 110.00 110.00
303 JOHNSON NMTSHAMPOO 200ML 132.75 150.00 150.00
304 JOHNSON SKINCARE 80 WIPES1+1 272.99 320.00 320.00
305 JOHNSONS BABY POWDER 50G ALPH 22.11 27.00 27.00
306 JOHNSONS BABY SOAP 150GM 59.45 68.00 68.00
307 JOHNSONS BABY SOAP 25GM 8.06 10.00 10.00
308 JOHNSONS BABY SOAP 25GM 8.18 10.00 10.00
309 JOHNSONS BABY SOAP BLOSS 75GM 33.40 40.00 40.00
310 JOHNSONS BABY SOAP BLOSS 75GM 33.71 40.00 40.00
311 JOHNSONS BABY SOAP BLOSS 75GM 35.72 40.00 40.00
312 JOHNSONS BABY SOAP100GM 40.56 49.00 49.00
313 JOHNSONS BUDS 60 27.98 35.00 35.00
314 JOHNSONS NAPY PADS 60.00 63.98 75.00 75.00
Page 13
Conceptual Framework of Sales Promotion Schemes, Consumer Preference and Brand Perception
45
SN Product Name Cost
Rate Sale Rate MRP
315 KELLOGGS SPECIAL K 140GM 50.96 59.00 59.00
316 KELLOGGS SPECIAL K 140GM 53.64 59.00 59.00
317 KELLOGGS SPECIAL K 290GM 100.15 116.00 116.00
318 KELLOGGS SPECIAL K 435GM 146.84 170.00 170.00
319 KELLOGGS SPECIAL K 900GM 298.00 345.00 345.00
320 KELLOGGS SPECIAL K 900GM 313.64 345.00 345.00
321 KELLOGS ALMOND & HONEY 130GM 57.28 63.00 63.00
322 KELLOGS ALMOND & HONEY 130GM 59.10 65.00 65.00
323 KELLOGS ALMOND & HONEY 300GM 139.10 153.00 153.00
324 KELLOGS ALMOND & HONEY 650GM 271.83 299.00 299.00
325 KELLOGS BANANA COR FLAK 300GM 108.18 119.00 119.00
326 KELLOGS CHOCOS 250G 96.37 106.00 106.00
327 KELLOGS CHOCOS 250G 96.37 106.00 106.00
328 KIRTI GOLD SUNFLOWER OIL 1LIT 71.50 74.00 74.00
329 KISSAN MANGO SQUASH 700ML 102.68 115.00 115.00
330 KISSAN PINEAPP LE SQH 700ML 102.68 115.00 115.00
331 KISSAN CHILL TOM KETC 200GM 39.64 44.00 44.00
332 KISSAN CHILL TOM KETC 500GM 68.47 76.00 76.00
333 KISSAN CHILL TOM KETC 500GM 76.58 85.00 85.00
334 KISSAN CHILL TOM KETC SQZ 465 81.08 90.00 90.00
335 KISSAN CHILL TOM KETC SQZ 465 81.08 90.00 90.00
336 KISSAN FRE TOM KETCHUP 1KG B 112.61 125.00 125.00
337 KISSAN FRESH TOM KETCHUP 900G 144.14 160.00 160.00
338 KISSAN GRAPE SQH 700ML 102.68 115.00 115.00
339 KISSAN LEMON SQUASH 700ML 102.68 115.00 115.00
340 KISSAN LEMON SQUASH 700ML 102.68 115.00 115.00
341 KISSAN LIME JUICE CORDIAL 102.68 115.00 115.00
342 KISSAN MANGO JAM 200GM 45.05 50.00 50.00
343 KISSAN MANGO JAM 200GM 45.05 50.00 50.00
344 KISSAN MANGO JAM 500GM 100.90 112.00 112.00
345 KISSAN MARMALADE ORANGE 500GM 100.90 112.00 112.00
346 KISSAN MIX FRUIT JAM 200GM 43.24 48.00 48.00
347 KISSAN MIX FRUIT JAM 200GM 43.24 48.00 48.00
Page 14
Conceptual Framework of Sales Promotion Schemes, Consumer Preference and Brand Perception
46
SN Product Name Cost
Rate Sale Rate MRP
348 KISSAN MIX FRUIT JAM 500GM 89.19 99.00 99.00
349 KISSAN MIX FRUIT JAM 500GM 99.10 110.00 110.00
350 KISSAN MIX FRUIT JAM 500GM 99.10 110.00 110.00
351 KISSAN PINEAPPLE JAM 500GM 100.90 112.00 112.00
352 KISSAN ROSE SYRUP 700ML 107.14 120.00 120.00
353 KISSAN SWEET&SPICY SAUCE 200G 39.64 44.00 44.00
354 KISSAN SWEET&SPICY SAUCE 500G 67.57 75.00 75.00
355 KISSAN TOM KESTCHUP 200GM 38.74 43.00 43.00
356 KISSAN TOM KET SQUEEZO 450GM 81.08 90.00 90.00
357 KIT KAT CHOCOLATE 37.3GM 20. 18.18 20.00 20.00
358 KIT KAT CHOCOLATE 8.6GM 4.55 5.00 5.00
359 KIT KAT DARK CHOCOLATE 27.5GM 18.18 20.00 20.00
360 KIT KAT GIFT PACK 75.00 68.18 75.00 75.00
361 KIWI 2 IN 1 SHOE BRUSH 55.00 56.72 65.00 65.00
362 KIWI BROWN LIQ 40ML 27.92 32.00 32.00
363 KIWI DARK SHOE POLI TAN 40 GM 34.03 39.00 39.00
364 KIWI DARK TAN SHOE POLI 15GM 16.58 19.00 19.00
365 KIWI DRANEX 50GM 3+1 55.99 70.00 70.00
366 KIWI DRANEX SAC 17.27 20.00 20.00
367 KIWI EXPRESS SHIN NEUTRAL 7ML 45.38 52.00 52.00
368 KIWI LIQ BLACK SHOE POLI 75ML 48.00 55.00 55.00
369 KIWI LIQ SHOE POLI BROWN 75ML 48.00 55.00 55.00
370 KIWI NEUTRAL SHOE POLISH 75ML 48.00 55.00 55.00
371 KIWI NEUTRAL SHOE POLISH 75ML 48.17 53.00 53.00
372 KIWI SHOE CARE KIT 150.00 136.36 150.00 150.00
373 KIWI SHOE POLISH BLACK 15GM 17.27 20.00 20.00
374 KIWI SHOE POLISH BLACK 40G 34.03 39.00 39.00
375 LAKME ROSE POWDER 40GM 107.01 120.00 120.00
376 LAKME 9TO5 HYDRTNG SSC 30ML 438.59 500.00 500.00
377 LAKME CLEAN UP F FAIR F W 100 140.35 160.00 160.00
378 LAKME P M MOIS SPF 24PA++ 120 171.05 195.00 195.00
379 LAKME S E F UVL SPF30PA+ 100M 263.16 300.00 300.00
380 LAKME S E SKI LGT D-TAN FW50G 74.56 85.00 85.00
Page 15
Conceptual Framework of Sales Promotion Schemes, Consumer Preference and Brand Perception
47
SN Product Name Cost
Rate Sale Rate MRP
381 LAKME S E SKI LIGH+D-T FW100G 127.19 145.00 145.00
382 LAKME S E UVL SPF50 P+++100ML 416.67 475.00 475.00
383 LAKME S GL WINT INT MOIS 120M 171.05 195.00 195.00
384 LAKME S GL WINT INT MOIS 200M 259.01 299.00 299.00
385 LAKME SKIN GLOSS WINT CRE 50G 174.56 199.00 199.00
386 LAKME SUNEX F UV LOT ++30 100 350.88 400.00 400.00
387 LAKME SUNEX F UV LOT ++30 50M 197.37 225.00 225.00
388 LAKME SUNEX F UV LOT 24++ 200 328.95 375.00 375.00
389 LIFEBUOY CLI-CAR COMPL 75GM 25.00 27.00 27.00
390 LIFEBUOY CLI-CAR FRESH 125GM 41.67 45.00 45.00
391 LIFEBUOY CLI-CAR FRESH 125GM 45.37 49.00 49.00
392 LIFEBUOY CLI-CAR FRESH 75GM 25.00 27.00 27.00
393 LIFEBUOY CLI-CAR FRESH 75GM 25.93 28.00 28.00
394 LIFEBUOY H SANITI A FRESH 55M 50.00 60.00 60.00
395 LIFEBUOY H W COL C 200+185ML 102.73 113.00 113.00
396 LIFEBUOY H W COL CHAN PP 185M 52.73 58.00 58.00
397 LIFEBUOY H W COL CHAN PP 185M 52.73 58.00 58.00
398 LIFEBUOY H W COL CHANG 200ML 68.18 75.00 75.00
399 LIFEBUOY H W COOL FR 185ML 33.64 37.00 37.00
400 LIFEBUOY H W GREEN 185ML 26.18 31.00 31.00
401 LIFEBUOY H W GREEN 215ML 56.36 62.00 62.00
402 LIFEBUOY H W MILDCARE 900M PP 140.91 155.00 155.00
403 LIFEBUOY H W TOTAL 215ML 56.36 62.00 62.00
404 LIFEBUOY H W TOTAL 215ML 58.18 64.00 64.00
405 LIFEBUOY H W TOTAL 215ML 58.19 64.00 64.00
406 LIFEBUOY H W TOTAL 80ML 22.73 25.00 25.00
407 LIFEBUOY H W TOTAL10 185ML 33.64 37.00 37.00
408 LIFEBUOY H W TOTAL10 900ML PP 116.82 135.00 145.00
409 LIFEBUOY H W TOTAL10 900ML PP 131.82 145.00 145.00
410 LIFEBUOY H W TOTAL10 900ML PP 140.91 155.00 155.00
411 LIZOL 200 ML SANDAL 26.36 29.00 29.00
412 LIZOL 200ML 26.36 29.00 29.00
413 LIZOL 200ML LIME ( CITRUS ) 26.36 29.00 29.00
Page 16
Conceptual Framework of Sales Promotion Schemes, Consumer Preference and Brand Perception
48
SN Product Name Cost
Rate Sale Rate MRP
414 LIZOL 200ML LIME ( CITRUS ) 26.37 29.00 29.00
415 LIZOL 200ML ROSE ( FLORA ) 26.37 29.00 29.00
416 LIZOL 3 IN 1 PINE FRAGRA 975M 110.91 122.00 122.00
417 LIZOL 500 ML FLORAL 60.91 67.00 67.00
418 LIZOL 500 ML JASMNE 60.91 67.00 67.00
419 LIZOL 500 ML JASMNE 60.91 67.00 67.00
420 LIZOL 500 ML LAVENDER 60.91 67.00 67.00
421 LIZOL 500 ML LAVENDER 60.91 67.00 67.00
422 LIZOL 500 ML LIME ( CITRUS ) 60.00 66.00 66.00
423 LIZOL 500 ML(3 IN 1) 60.00 66.00 66.00
424 LIZOL 500 ML(3 IN 1) 60.91 67.00 67.00
425 LIZOL 975 ML JASMNE 110.91 122.00 122.00
426 LIZOL 975ML LIME ( CITRUS ) 111.82 123.00 123.00
427 LIZOL 975ML ROSE ( FLORA ) 111.82 123.00 123.00
428 LIZOL JASMINE 2LT 222.73 245.00 245.00
429 LIZOL LAVENDER 2LT 223.64 246.00 246.00
430 LIZOL SANDAL 500ML 60.91 67.00 67.00
431 LIZOL SANDAL 500ML 60.91 67.00 67.00
432 LIZOL SANDAL 975ML 110.91 122.00 122.00
433 LOREAL 6 OIL NOURIS COND 175M 120.53 135.00 135.00
434 LOREAL 6 OIL NOURIS COND 65ML 62.51 70.00 70.00
435 LOREAL 6 OIL NOURIS COND 65ML 71.43 80.00 80.00
436 LOREAL 6 OIL NOURISH SH 175ML 117.05 138.00 138.00
437 LUX BW STRAWBERRY&CREA125 ML 59.09 65.00 65.00
438 LUX BW MAGICAL SPL 240 ML 113.64 125.00 125.00
439 LUX BW MAGICAL SPL 240 ML 122.73 135.00 135.00
440 LUX BW PEACH & CREAM 125 ML 56.36 62.00 62.00
441 LUX BW PEACH & CREAM 125 ML 56.37 62.00 62.00
442 LUX BW SCARLET BLOSSAM 125ML 56.36 62.00 62.00
443 LUX BW SCARLET BLOSSAM 125ML 56.37 62.00 62.00
444 LUX CREAMY WHITE 75GM 25.00 27.00 27.00
445 LUX CREAMY WHITE 75GM 25.00 27.00 27.00
446 LUX FRESH SOAP 100GM 21.30 23.00 23.00
Page 17
Conceptual Framework of Sales Promotion Schemes, Consumer Preference and Brand Perception
49
SN Product Name Cost
Rate Sale Rate MRP
447 LUX FRESH SOAP 100GM 22.22 24.00 24.00
448 LUX FRESH SOAP 100GM 2+1 62.04 67.00 67.00
449 LUX FRESH SOAP 150GM2+1 78.70 85.00 85.00
450 LUX FRESH SPLASH SOAP 100GM*3 64.81 70.00 70.00
451 LUX FRESH SPLASH SOAP 150GM*3 83.33 90.00 90.00
452 LUX PH &CM H W 225ML 54.55 60.00 60.00
453 LUX SANDAL & CREAM 90GM 21.30 23.00 23.00
454 LUX SOFT TOUCH SOAP 100GM 22.22 24.00 24.00
455 LUX SOFT TOUCH SOAP 100GM2+1 64.81 70.00 70.00
456 LUX SOFT TOUCH SOAP 150GM2+1 83.33 90.00 90.00
457 LUX STRAWB &CM H W 200ML 36.36 40.00 40.00
458 LUX STRAWB &CM H W 225ML 58.18 64.00 64.00
459 LUX STRAWB &CM H W 225ML 58.18 64.00 64.00
460 LUX STRAWBE & CREAM 150GM 2+1 74.07 80.00 80.00
461 LUX STRAWBE & CREAM 150GM 2+1 74.07 85.00 85.00
462 MAGGI COCONUT MILK POWDER 100 71.56 78.00 78.00
463 MAGGI COCONUT MILK POWDR 25GM 18.35 20.00 20.00
464 MAGGI COCONUT MILK POWDR 25GM 21.10 23.00 23.00
465 MAGGI HOT & SWEET SAUCE 1KG 118.35 129.00 129.00
466 MAGGI HOT & SWEET SAUCE 200GM 41.28 45.00 45.00
467 MAGGI HUNGROOO NOODALS 420GM 53.21 58.00 58.00
468 MAGGI IMLI PICHKOO 80GM 13.76 15.00 15.00
469 MAGGI MASALA NOODLE 35GM 4.63 5.00 5.00
470 MAGGI MASALA NOODLES 140GM 18.35 20.00 20.00
471 MAGGI MASALA MAGIC 4.00 3.67 4.00 4.00
472 MAGGI MASALA NOODALS 420GM 55.05 60.00 60.00
473 MAGGI MASALA NOODALS 70GM 9.17 10.00 10.00
474 MAGGI MASALA NOODELS 560GM 73.40 80.00 80.00
475 MAGGI OATS NOODLES 292GM 87.16 95.00 95.00
476 MAPRO FALERO MIX PP 19GM 5.00 0.00 5.00 5.00
477 MAPRO FALERO STRAWBERRY 100GM 23.28 27.00 27.00
478 MAPRO FALERO STRAWBERRY 150GM 42.25 49.00 49.00
479 MAPRO FRUITY CUBES 100GM 29.35 36.00 36.00
Page 18
Conceptual Framework of Sales Promotion Schemes, Consumer Preference and Brand Perception
50
SN Product Name Cost
Rate Sale Rate MRP
480 MAPRO FRUITY CUBES 200GM 51.29 63.00 63.00
481 MAPRO FRUITY CUBES 200GM 51.36 63.00 63.00
482 MAPRO FRUITY SWEETS 200GM 51.29 63.00 63.00
483 MAPRO N O N G TOM KET 500GM 76.26 90.00 90.00
484 MAPRO ORANGE JAM 200GM 38.65 49.00 49.00
485 MAPRO ORANGE JAM 200GM 39.94 49.00 49.00
486 MAPRO ORANGE JAM 500GM B 87.93 108.00 108.00
487 MAPRO ORANGE JAM 500GM B 88.04 108.00 108.00
488 MAPRO PINEAPPLE JAM 200GM 38.65 49.00 49.00
489 MAPRO PINEAPPLE JAM 200GM 39.87 49.00 49.00
490 MAPRO PINEAPPLE JAM 500 ML 87.93 108.00 108.00
491 MAPRO PINEAPPLE JAM 500 ML 98.19 108.00 108.00
492 MAPRO STRWABERRY JAM 200GM 42.58 54.00 54.00
493 MAPRO STRWABERRY JAM 200GM 43.93 54.00 54.00
494 MAPRO STRWABERRY JAM 500 ML 97.69 120.00 120.00
495 MAPRO TOMATO KETCHUP 500GM 76.26 90.00 90.00
496 MAPRO TOPP CHOCOL SYRUP 200ML 58.62 72.00 72.00
497 MEGIC COCKROACH FORMULA 40GM 21.00 30.00 30.00
498 MORTEIN NAT GAR LIQ 45NIG 46.87 59.00 59.00
499 MORTEIN NAT GARD CO KILL 225M 80.25 92.00 92.00
500 MORTEIN NAT GARD CO KILL 425M 147.95 175.00 175.00
501 MORTEIN NAT GARD CO KILL 425M 149.49 175.00 175.00
502 MORTEIN NAT GARD LOW SM COILS 25.19 32.00 32.00
503 MORTEIN NAT GARD M KIL 225ML 79.46 92.00 92.00
504 MORTEIN NAT GARD M KIL 425ML 138.34 169.00 169.00
505 MORTEIN NAT GARD M KIL 425ML 153.64 169.00 169.00
506 MORTEIN POW BOOS 12 HO COILS 20.01 30.00 30.00
507 MORTEIN POW BOOS 12 HO COILS 20.57 26.00 31.00
508 MORTEIN POW GARD RED 10 COIL 18.53 22.00 27.00
509 MORTEIN POW GARD RED 10 COIL 18.71 23.00 28.00
510 MORTEIN POW GARD RED 10 COIL 19.18 28.00 28.00
511 MORTIN RAT KILL 25GM 9.82 12.00 12.00
512 MOTI GULAB SOAP 150GM 42.85 51.00 56.00
Page 19
Conceptual Framework of Sales Promotion Schemes, Consumer Preference and Brand Perception
51
SN Product Name Cost
Rate Sale Rate MRP
513 MOTI GULAB SOAP 150GM 42.85 51.00 56.00
514 MOTI GULAB SOAP 150GM 42.85 56.00 56.00
515 MTR SAMBAR POWDER 200GM 62.51 70.00 70.00
516 MTR SAMBAR POWDER 100GM 40.18 45.00 45.00
517 MYSORE CLASSIC SOAP 75GM 27.00 30.00 30.00
518 NEST CERELAC APPLE CHER 300GM 151.38 165.00 165.00
519 NEST CERELAC W ORANGE 300GM 154.13 168.00 168.00
520 NESTLE ALPINO CHOCOLATE 22GM 26.91 30.00 30.00
521 NESTLE ALPINO CHOCOLATE 22GM 26.91 30.00 30.00
522 NESTLE BAR ONE 13GM 4.48 5.00 5.00
523 NESTLE CERE W R MIX VEG 300GM 153.22 167.00 167.00
524 NESTLE CERELAC RICE 300GM 126.61 138.00 138.00
525 NESTLE CERELAC RICE VEG 300GM 148.63 162.00 162.00
526 NESTLE MILKYBAR 9GM 4.48 5.00 5.00
527 NESTLE MINI CHOCLATE 12GM 4.48 5.00 5.00
528 NESTLE MUNCH CHOCOL 23GM 8.97 10.00 10.00
529 NESTLE MUNCH HOME PACK 69GM 31.82 35.00 35.00
530 NIMA BARTAN BAR(2+1) 250GM 25.63 30.00 30.00
531 NIRMA POWDER 1KG 37.22 43.00 43.00
532 NIRMA POWDER 500 GM 18.41 22.00 22.00
533 NIRMA POWDER 500 GM 18.41 22.00 22.00
534 NISHA HAIR HENNA N B MEH 20.0 16.31 20.00 20.00
535 NIVEA A S L 100ML SEN/VITA 180.91 199.00 199.00
536 NIVEA BL EX WHITE CR UVP 200M 220.35 249.00 249.00
537 NIVEA BL EX WHITE CR UVP 350M 307.08 347.00 347.00
538 NIVEA CREME 30ML 35.40 40.00 40.00
539 NIVEA CREME 30ML 35.40 40.00 40.00
540 NIVEA CREME 60ML 62.49 70.00 70.00
541 NIVEA CREME 60ML 62.51 70.00 70.00
542 NIVEA CREME SOAP 125*4 172.73 190.00 190.00
543 NIVEA CREME SOAP 125GM 50.00 55.00 55.00
544 NIVEA CREME SOAP 125GM 1+1 90.00 99.00 99.00
545 NIVEA CREME SOAP 75G 1+1 60.00 66.00 66.00
Page 20
Conceptual Framework of Sales Promotion Schemes, Consumer Preference and Brand Perception
52
SN Product Name Cost
Rate Sale Rate MRP
546 NIVEA CREME SOAP 75GM 32.73 36.00 36.00
547 NIVEA CREME SOFT 75G 3+1 113.64 125.00 125.00
548 NIVEA CREME SOFT SHOW CRE 250 131.82 145.00 145.00
549 NIVEA DEO COOL KICK 150ML 159.09 175.00 175.00
550 NIVEA DEO F A BURST 150ML 159.09 175.00 175.00
551 NIVEA DEO F P BOOST 150ML 172.73 190.00 190.00
552 NYLE CLE&SHINE SHAMPOO 400ML 124.27 149.00 149.00
553 NYLE CLE&SHINE SHAMPOO 400ML 124.27 155.00 155.00
554 NYLE DRYNESS CONTROL SH 400ML 135.28 155.00 155.00
555 NYLE DRYNESS CONTROL SH 400ML 135.45 149.00 149.00
556 NYLE HAIR FALL SHAMPOO 180ML 86.40 99.00 99.00
557 NYLE HAIR FALL SHAMPOO 400ML 129.27 155.00 155.00
558 NYLE LONG & BOUNCY SHAM 100ML 40.91 45.00 45.00
559 NYLE LONG & BOUNCY SHAM 100ML 42.77 49.00 49.00
560 NYLE LONG & BOUNCY SHAM 100ML 42.77 49.00 49.00
561 NYLE LONG&BOUNCY SHAMP 450ML 140.91 155.00 155.00
562 NYLE LONG&BOUNCY SHAMP200ML 80.91 89.00 89.00
563 ODONIL JASMINE AIR FRE 50GM 30.92 34.00 34.00
564 ODONIL JASMINE AIR FRE 50GM 32.73 36.00 36.00
565 ODONIL LAVENDER AIR FRE 50GM 31.82 34.00 35.00
566 ODONIL MIX AIRFRSHNER 100GM 47.26 52.00 52.00
567 ODONIL MIX AIRFRSHNER 100GM 50.00 55.00 55.00
568 ODONIL MIX ROOM FRESH 140GM 59.10 65.00 65.00
569 ODONIL MIX ROOM FRESHEN 250G 104.55 115.00 115.00
570 ODONIL MIX ROOM FRESHEN 250G 109.09 120.00 120.00
571 ODONIL MIX ROOM FRESHEN 250G 109.09 120.00 120.00
572 PANTENE HFC SHAMPOO 180ML 138.18 152.00 152.00
573 PANTENE LIV CLE SHAMPOO 180ML 107.27 129.00 129.00
574 PANTENE LIV CLE SHAMPOO 180ML 126.36 139.00 139.00
575 PANTENE LIV CLE SHAMPOO 180ML 138.18 152.00 152.00
576 PANTENE LIVELY CLEAN SH 80ML 62.73 69.00 69.00
577 PANTENE LIVELY CLEAN SH 80ML 68.18 75.00 75.00
578 PANTENE LONG BLACK SHAMP 80ML 68.18 75.00 75.00
Page 21
Conceptual Framework of Sales Promotion Schemes, Consumer Preference and Brand Perception
53
SN Product Name Cost
Rate Sale Rate MRP
579 PANTENE LONG BLK SHAM 180ML 126.36 139.00 139.00
580 PANTENE LONG BLK SHAM 180ML 138.18 152.00 152.00
581 PANTENE NAT FUS CND F&L 170ML 112.17 129.00 129.00
582 PANTENE NAT FUS F&L SH 170ML 138.18 152.00 152.00
583 PANTENE NAT FUS S&L SH 75ML 58.18 64.00 64.00
584 PANTENE NAT FUS S&L SH 75ML 62.73 69.00 69.00
585 PANTENE SIL & SMO SHAMPO 80ML 68.18 75.00 75.00
586 PANTENE SILK SMO CARE SH 180M 138.18 152.00 152.00
587 PANTENE T DAMAGE SHAMPOO 180M 138.18 152.00 152.00
588 PARACHUTE A S ANTI D H C100G 75.15 83.00 83.00
589 PARACHUTE COCONUT OIL 175ML 41.99 47.00 47.00
590 PARACHUTE COCONUT OIL 175ML 44.72 50.00 50.00
591 PARACHUTE COCONUT OIL 175ML 46.35 52.00 52.00
592 PARK AVE CHROME STY GEL 100GM 82.47 95.00 95.00
593 PARK AVE DELVE DEO 100GM 0.00 180.00 180.00
594 PARK AVE GOOD MORN S C 70G 42.66 60.00 60.00
595 PARK AVE GOOD MORN S C 70G 48.61 63.00 63.00
596 PARK AVE HORIZON DEO 100GM 160.59 185.00 185.00
597 PARK AVE IMAGINE DEO 100GM 160.59 185.00 185.00
598 PARK AVE JAZZ DEO 100GM 192.00 216.00 216.00
599 PARK AVE NEON STY GEL 100GM 0.00 95.00 95.00
600 PARK AVE NEON STY GEL 100GM 82.47 95.00 95.00
601 PARLE MILK CREAM 60GM 8.66 10.00 10.00
602 PARLE MILK SHAKTI 126GM 8.66 10.00 10.00
603 PARLE MIX CHOCLAT 20.00 (12.5 13.97 20.00 20.00
604 PARLE MONACO REGULAR 200GM 17.32 20.00 20.00
605 PARLE MONACO REGULAR 200GM 21.66 25.00 25.00
606 PARLE MONACO REGULAR 40GM 4.33 5.00 5.00
607 PARLE MONACO REGULAR 80GM 8.66 10.00 10.00
608 PARLE MONACO REGULAR 80GM 8.66 10.00 10.00
609 PARLE MONACO ZEERA 80GM 8.68 10.00 10.00
610 PARLE NAMKEEN ALO LACH 25GM 8.22 10.00 10.00
611 PEARS OIL CLEAR F W 100GM 86.37 95.00 95.00
Page 22
Conceptual Framework of Sales Promotion Schemes, Consumer Preference and Brand Perception
54
SN Product Name Cost
Rate Sale Rate MRP
612 PEARS OIL CLEAR F W 60GM 63.64 70.00 70.00
613 PEARS OIL CLEAR H W 237ML 90.91 100.00 100.00
614 PEARS OIL CLEAR H W 237ML 90.91 100.00 100.00
615 PEARS OIL CLEAR&GLOW SOAP 75G 31.48 34.00 34.00
616 PEARS OIL CONT SOAP 75GM 25.00 27.00 27.00
617 PEPSODENT EXPERT PROTE 80GM 50.91 56.00 56.00
618 PEPSODENT EXPERT PROTE 80GM 51.82 57.00 57.00
619 PEPSODENT EXPERT PROTE 80GM 52.73 58.00 58.00
620 PEPSODENT EXPERT PROTE C150*2 132.27 173.00 173.00
621 PEPSODENT EXPERT PROTE C150*2 142.27 173.00 173.00
622 PEPSODENT EXPT PROT COMP T B 43.70 59.00 59.00
623 PEPSODENT EXPT PROT SENSI T B 43.70 59.00 59.00
624 PEPSODENT FIGHT T B 1+1 29.00 21.48 29.00 29.00
625 PEPSODENT FIGHTER MED T B 16.67 17.00 17.00
626 PEPSODENT FIGHTER SOFT T B 16.67 17.00 17.00
627 PEPSODENT G C 2IN1 PAST 150GM 70.91 78.00 78.00
628 PEPSODENT GC GUM EXPERT TB 35.38 46.00 46.00
629 PEPSODENT GERMI CHEC150G 1+1 77.27 85.00 85.00
630 PEPSODENT GUM C SOFT T B 2+1 68.15 92.00 92.00
631 PEPSODENT GUM CARE 150GM 1+1 121.64 137.00 147.00
632 PEPSODENT GUM CARE 150GM 1+1 133.64 147.00 147.00
633 PEPSODENT GUM CARE BRUSH 30.77 40.00 40.00
634 PEPSODENT GUM CARE T P 150GM 62.18 72.00 72.00
635 PEPSODENT GUM CARE T P 150GM 70.00 77.00 77.00
636 PEPSODENT GUM CARE T P 150GM 70.82 82.00 82.00
637 PEPSODENT GUM CARE T P 80GM 40.91 45.00 45.00
638 PEPSODENT PRO-SENSITIV T P 40 60.87 70.00 70.00
639 PONDS W B DSL CRE SPF 15 20GM 48.25 55.00 55.00
640 RED LABEL TEA 250GM 88.79 97.00 97.00
641 RED LABEL NATURAL 500GM 205.61 220.00 220.00
642 RED LABEL SPECIAL TEA 250GM 104.67 112.00 112.00
643 RED LABEL SPECIAL TEA 250GM 107.48 115.00 115.00
644 RED LABEL SPECIAL TEA 500GM 205.61 220.00 220.00
Page 23
Conceptual Framework of Sales Promotion Schemes, Consumer Preference and Brand Perception
55
SN Product Name Cost
Rate Sale Rate MRP
645 RED LABEL SPECIAL TEA 500GM 205.61 220.00 220.00
646 RED LABEL TEA 100GM 30.00 33.00 33.00
647 RED LABEL TEA 100GM 30.00 33.00 33.00
648 RED LABEL TEA 1KG 282.48 304.00 329.00
649 RED LABEL TEA 1KG 282.48 304.00 329.00
650 RED LABEL TEA 200GM POUCH 65.42 70.00 70.00
651 RED LABEL TEA 500GM 158.88 170.00 170.00
652 RED LABEL TEA NATURAL 250GM 104.67 112.00 112.00
653 RED LABEL TEA NATURAL 100GM 42.73 47.00 47.00
654 REXONA COCONUT SOAP 100GM 21.30 23.00 23.00
655 REXONA COCONUT SOAP 100GM 22.22 24.00 24.00
656 REXONA COCONUT SOAP 150 GM 33.33 36.00 36.00
657 RIN ADVANCE POWDER 1KG 70.37 76.00 76.00
658 RIN ADVANCE POWDER 1KG 72.22 78.00 78.00
659 RIN ADVANCE POWDER 1KG 74.07 80.00 80.00
660 RIN ADVANCE POWDER 1KG 74.07 80.00 80.00
661 SAPTASHAKTI TIL OIL 500ML 77.02 130.00 130.00
662 SASA DETERGENT POW ACTIVE 1KG 36.45 43.00 43.00
663 SASA DETERGENT POW ACTIVE 1KG 37.00 45.00 45.00
664 SASA DETERGENT POW ACTIVE 1KG 40.64 45.00 45.00
665 SASA LIQUID SOAP 1LTR PP 37.00 45.00 45.00
666 SASA LIQUID SOAP 1LTR PP 39.39 45.00 45.00
667 SASA PREMIUM DETERGE POW 1KG 68.61 80.00 80.00
668 SASA SOAP 135GM 4.37 5.00 5.00
669 SASA SOAP 270GM 8.30 10.00 10.00
670 SAVLON ALOE VERA N M SOA 125 34.53 40.00 40.00
671 SAVLON ALOE VERA N M SOAP 75 22.27 25.00 25.00
672 SAVLON SOAP 125GM 36.36 40.00 40.00
673 SAVLON SOAP 45 GM 8.73 10.00 10.00
674 SAVLON SOAP 75 GM 22.27 25.00 25.00
675 SENSODYNE FRESH GEL 40GM 37.74 45.00 45.00
676 SENSODYNE FRESH GEL 80GM 75.47 90.00 90.00
677 SET WET INFINITY COOL DEO120M 117.17 140.00 165.00
Page 24
Conceptual Framework of Sales Promotion Schemes, Consumer Preference and Brand Perception
56
SN Product Name Cost
Rate Sale Rate MRP
678 SET WET SEXY DEO 150ML 143.49 165.00 165.00
679 SET WET VERTI HOLD H GEL 50ML 44.96 50.00 50.00
680 SET WET WET LOOK GEL 100ML 77.82 90.00 90.00
681 SET WET WET LOOK GEL 50ML 44.96 50.00 50.00
682 SHANTI CORN FLAKES 500GM 74.25 90.00 90.00
683 SHAVING BRUSH MIX 51.19 62.00 62.00
684 SHEETAL POWDER 3 KG 19.50 24.00 24.00
685 SHEETAL POWDER 3 KG 19.50 24.00 24.00
686 SHOWER TO SHOWER SANDAL 150G 45.31 65.00 65.00
687 SHOWER TO SHOWER 150 GM 48.80 70.00 70.00
688 SHOWER TO SHOWER 300GM 80.16 115.00 115.00
689 SHOWER TO SHOWER 75 GM 33.84 45.00 45.00
690 SIXER BISCUIT 200GM 18.00 23.00 23.00
691 SLEEK COLD WAX 45.00 39.47 45.00 45.00
692 SLEEK COLD WAX 45.00 40.17 45.00 45.00
693 SLEEK COLD WAX 600GM 93.90 108.00 108.00
694 SLEEK HOT WAX 45.00 40.17 45.00 45.00
695 SLEEK HOT WAX 600GM 93.90 108.00 108.00
696 SLICE MANGOLA COLDRINK 1.2LTR 51.00 62.00 62.00
697 SLICE MANGOLA COLDRINK 350ML 18.00 20.00 20.00
698 SLICE MANGOLA COLDRINK 600ML 32.71 35.00 35.00
699 SNICKERS CHOCLATE 150GM 99.00 86.10 99.00 99.00
700 SNICKERS CHOCLATE 25GM 13.04 15.00 15.00
701 SNICKERS CHOCLATE 50GM 26.09 30.00 30.00
702 SNOW WHITE LIQUID 38.03 45.00 45.00
703 SNOW WHITE POWDER 1KG 39.00 45.00 45.00
704 SUNFEAST DREAM C CHO&VANI 60G 8.96 10.00 10.00
705 SUNFEAST DREAM CREAM ST&V 120 17.92 20.00 20.00
706 SUNFEAST FARMLITE O&A 75GM 21.51 25.00 25.00
707 SUNFEAST FARMLITE O&R 75GM 21.51 25.00 25.00
708 SUNFEAST KAJU BADAM COOK 75GM 8.96 10.00 10.00
709 SUNFEAST MARIE LIGHT 100GM 8.52 10.00 10.00
710 SUNFEAST MARIE LIGHT OATS 120 12.78 15.00 15.00
Page 25
Conceptual Framework of Sales Promotion Schemes, Consumer Preference and Brand Perception
57
SN Product Name Cost
Rate Sale Rate MRP
711 SUNFEAST MARIE ORANG 120GM 12.79 15.00 15.00
712 SUNFEAST PASTA T S C ONI 83GM 16.07 18.00 18.00
713 SUNFEAST SNACKY SALTED 80GM 8.96 10.00 10.00
714 SUNLIGHT BAR 150 GM 15.74 17.00 17.00
715 SUNSILK BLACK SHAMPOO 340ML 179.09 197.00 197.00
716 SUNSILK BLACK SHAMPOO 80ML 53.64 59.00 59.00
717 SUNSILK BLACK SHINE CON 180ML 104.55 115.00 115.00
718 SUNSILK BLACK SHINE CON 180ML 105.57 115.00 115.00
719 SUNSILK BLACK SHINE SHA 180ML 104.55 115.00 115.00
720 SUNSILK BLACK SHINE SHA 180ML 106.37 117.00 117.00
721 SUNSILK S & SMTH COND 180ML 106.64 115.00 115.00
722 SUNSILK SHAMPOO 360M 174.55 192.00 192.00
723 SUNSILK STRT LOK COND 180ML 102.80 112.00 112.00
724 SUNSILK STRT LOK COND 180ML 104.55 115.00 115.00
725 SUNSILK STRT LOK COND 180ML 104.55 115.00 115.00
726 SUNSILK STRT LOK COND 80ML 50.91 56.00 56.00
727 SUNSILK STRT LOK SHAM 360ML 179.09 197.00 197.00
728 SUNSILK STRT LOK SHAM 360ML 179.09 197.00 197.00
729 SUNSILK STRT LOK SHMP 180ML 101.82 112.00 112.00
730 SUNSILK STRT LOK SHMP 80ML 52.73 58.00 58.00
731 SUNSILK T & L SHAMPOO 340ML 179.09 197.00 197.00
732 SUNSILK THI & LON SHAM 180ML 104.55 115.00 115.00
733 SUPER MAX ELEGANCE 3CAR 56RS 75.00 85.00 85.00
734 SUPER MAX SII 5BLADE 35.0 27.00 35.00 35.00
735 SUPER MAX SII RAZORS 45.00 37.99 45.00 45.00
736 SUPER MAX SIII SWIFT RAZ 75.0 33.00 75.00 75.00
737 SUPER MAX SIII SWIFT RAZ 75.0 39.99 75.00 75.00
738 SUPER MAX SYRINE BLADE 35.00 24.00 35.00 35.00
739 SUPRABHA DHAAWAN POW 100GM 31.98 40.00 40.00
740 SURF EXCEL BAR 150GM 13.89 15.00 15.00
741 SURF EXCEL BAR 200 GM 25.00 27.00 27.00
742 SURF EXCEL BAR 250 GM 26.85 29.00 29.00
743 SURF EXCEL BAR 400GM 40.74 44.00 44.00
Page 26
Conceptual Framework of Sales Promotion Schemes, Consumer Preference and Brand Perception
58
SN Product Name Cost
Rate Sale Rate MRP
744 SURF EXCEL BAR 400GM 42.59 46.00 46.00
745 SURF EXCEL BAR 800GM 76.48 83.00 88.00
746 SURF EXCEL BAR 800GM 76.48 88.00 88.00
747 SURF EXCEL BAR 95GM 9.26 10.00 10.00
748 SURF EXCEL BLUE POW 500GM 50.93 55.00 55.00
749 SURF EXEL BLUE 1.5KG 153.15 162.00 187.00
750 SURF EXEL BLUE 1.5KG 171.67 192.00 207.00
751 SURF EXEL BLUE 700GM 68.52 74.00 74.00
752 SURF EXEL QUICK WASH 200 GM 35.19 38.00 38.00
753 SURF EXEL QUICK WASH POW 1KG 168.52 182.00 182.00
754 SURF EXEL QUICKWASH 500GM 86.11 93.00 93.00
755 TATA PRE. CTC LEAF TEA 500GM 177.50 198.00 198.00
756 TATA PREMI DUST TEA 1 KG 209.68 244.00 264.00
757 THUMS UP 750ML 31.83 35.00 35.00
758 TIDE BAR 250GM 16.67 18.00 18.00
759 TIDE BAR 88GM 5.56 6.00 6.00
760 TIDE NATURALS L & C POW 170GM 9.26 10.00 10.00
761 TIDE POWDER 1KG 88.89 96.00 96.00
762 TIDE POWDER 4 KG 336.11 363.00 363.00
763 TIDE POWDER 500GM 44.44 48.00 48.00
764 TIDE POWDER J & R 1KG 87.96 95.00 95.00
765 TIDE POWDER J & R 1KG 88.89 96.00 96.00
766 TIDE POWDER J&R 2KG 172.99 190.00 190.00
767 TIDE TALCUM FRESH POW 500GM 42.59 46.00 46.00
768 TIDE TALCUM FRESH POW 500GM 44.44 48.00 48.00
769 TIGER BALM WHITE 18GM 45.33 55.00 55.00
770 TIGER BALM WHITE 8GM 27.20 30.00 30.00
771 UDID AKHA (BULK) 76.64 92.00 92.00
772 UDID AKHA 250GM 19.07 23.00 23.00
773 UDID DAAL (BULK) 80.75 88.00 88.00
774 UDID DAAL (LCTR) KG 73.49 84.00 84.00
775 UDID DAAL (LCTR) KG 82.20 84.00 84.00
776 UDID DAAL 1KG 80.75 88.00 88.00
Page 27
Conceptual Framework of Sales Promotion Schemes, Consumer Preference and Brand Perception
59
SN Product Name Cost
Rate Sale Rate MRP
777 VANASPATI TOOP (LCTR) KG 79.67 87.00 87.00
778 VASELIN LIP CARE MIX 4GM 47.81 109.00 109.00
779 VASELIN MENZ A S WHI F C 50GM 109.65 125.00 125.00
780 VASELIN WPJ 42GM 38.82 45.00 45.00
781 VASELINE ALOE FRESH B L 300ML 172.73 190.00 190.00
782 VASELINE ALOE FRESH B L 300ML 180.91 199.00 199.00
783 VEET HAIR REMOVER SENSI 25ML 44.44 52.00 52.00
784 VEET HAIR REMOVER SENSI 60 ML 80.67 95.00 95.00
785 VEET HAIR REMOVER SENSI 60 ML 81.61 95.00 95.00
786 VICCO NARAYANI CREAM 15GM 35.46 39.00 39.00
787 VICCO NARAYANI CREAM 15GM 42.73 47.00 47.00
788 VICCO NARAYANI CREAM 30GM 66.36 73.00 73.00
789 VICCO NARAYANI CREAM 30GM 74.55 82.00 82.00
790 VICCO TURMERIC SKI CREAM 15GM 47.25 52.00 52.00
791 VICCO TV WSO 30GM 55.45 61.00 61.00
792 VICCO VAJRADANTI PESTE 50 GM 35.45 39.00 39.00
793 VICCO VAJRADANTI POWDER 25 GM 22.72 25.00 25.00
794 VICCO VAJRADANTI POWDER 50 GM 40.00 44.00 44.00
795 VICCO VAJRADANTI POWDER 50 GM 41.82 46.00 46.00
796 VICCO VAJRADANTI T. POW.100GM 67.26 74.00 74.00
797 VICCO VAJRADANTI T. POW.100GM 70.91 78.00 78.00
798 VICKS COUGH DROPS TABLAT 1RS 0.82 1.00 1.00
799 VICKS INHALER 0.5 ML 28.23 35.00 35.00
800 VIM ANTI GERM BAR 130GM 9.26 10.00 10.00
801 VIM BAR 300GM 21.30 23.00 23.00
802 VIM BAR 300GM 22.22 24.00 24.00
803 VIM BAR 500GM 39.81 43.00 43.00
804 VIM BAR 85GM 4.63 5.00 5.00
805 VIM D W LIQ YELLOW 500ML PP 82.41 89.00 89.00
806 VIM DISH WASH LIQUID 120ML 18.52 20.00 20.00
807 VIM DISH WASH POWDER 1KG 20.37 22.00 22.00
808 VIM DISHWAS LEMON 225ML PP 36.11 39.00 39.00
809 VIM DISHWAS ANTIGERM 250 ML 57.41 62.00 62.00
Page 28
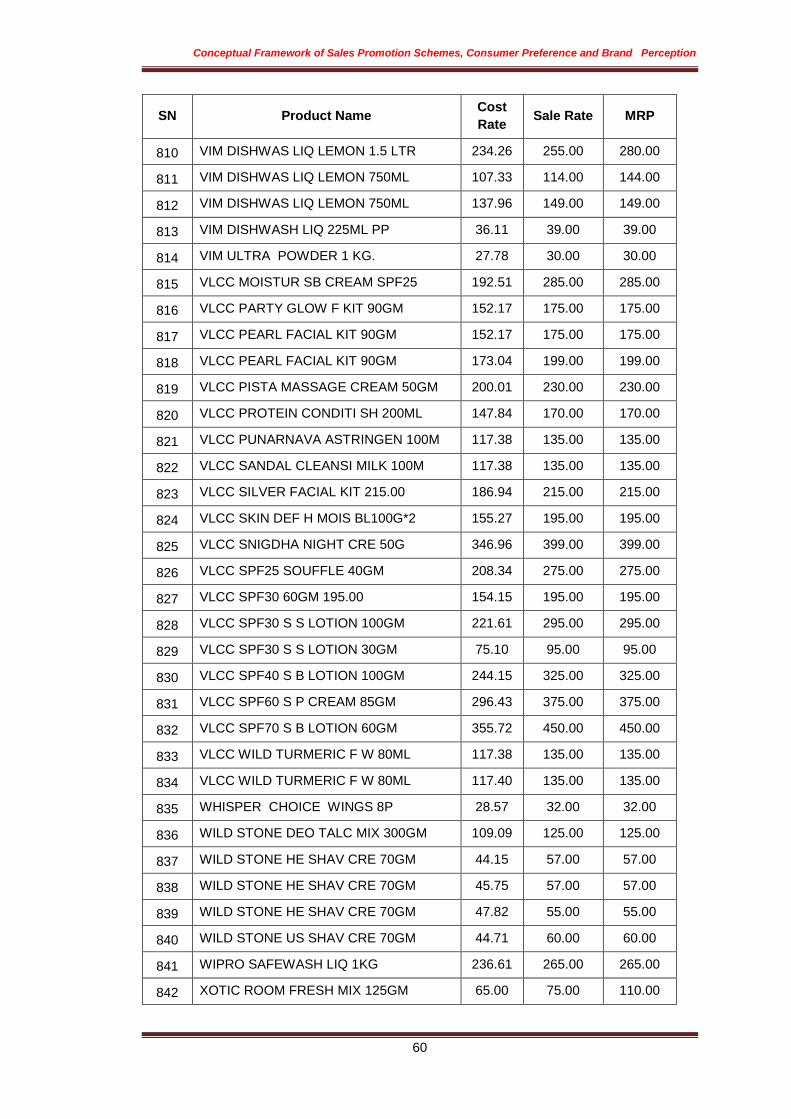
Conceptual Framework of Sales Promotion Schemes, Consumer Preference and Brand Perception
60
SN Product Name Cost
Rate Sale Rate MRP
810 VIM DISHWAS LIQ LEMON 1.5 LTR 234.26 255.00 280.00
811 VIM DISHWAS LIQ LEMON 750ML 107.33 114.00 144.00
812 VIM DISHWAS LIQ LEMON 750ML 137.96 149.00 149.00
813 VIM DISHWASH LIQ 225ML PP 36.11 39.00 39.00
814 VIM ULTRA POWDER 1 KG. 27.78 30.00 30.00
815 VLCC MOISTUR SB CREAM SPF25 192.51 285.00 285.00
816 VLCC PARTY GLOW F KIT 90GM 152.17 175.00 175.00
817 VLCC PEARL FACIAL KIT 90GM 152.17 175.00 175.00
818 VLCC PEARL FACIAL KIT 90GM 173.04 199.00 199.00
819 VLCC PISTA MASSAGE CREAM 50GM 200.01 230.00 230.00
820 VLCC PROTEIN CONDITI SH 200ML 147.84 170.00 170.00
821 VLCC PUNARNAVA ASTRINGEN 100M 117.38 135.00 135.00
822 VLCC SANDAL CLEANSI MILK 100M 117.38 135.00 135.00
823 VLCC SILVER FACIAL KIT 215.00 186.94 215.00 215.00
824 VLCC SKIN DEF H MOIS BL100G*2 155.27 195.00 195.00
825 VLCC SNIGDHA NIGHT CRE 50G 346.96 399.00 399.00
826 VLCC SPF25 SOUFFLE 40GM 208.34 275.00 275.00
827 VLCC SPF30 60GM 195.00 154.15 195.00 195.00
828 VLCC SPF30 S S LOTION 100GM 221.61 295.00 295.00
829 VLCC SPF30 S S LOTION 30GM 75.10 95.00 95.00
830 VLCC SPF40 S B LOTION 100GM 244.15 325.00 325.00
831 VLCC SPF60 S P CREAM 85GM 296.43 375.00 375.00
832 VLCC SPF70 S B LOTION 60GM 355.72 450.00 450.00
833 VLCC WILD TURMERIC F W 80ML 117.38 135.00 135.00
834 VLCC WILD TURMERIC F W 80ML 117.40 135.00 135.00
835 WHISPER CHOICE WINGS 8P 28.57 32.00 32.00
836 WILD STONE DEO TALC MIX 300GM 109.09 125.00 125.00
837 WILD STONE HE SHAV CRE 70GM 44.15 57.00 57.00
838 WILD STONE HE SHAV CRE 70GM 45.75 57.00 57.00
839 WILD STONE HE SHAV CRE 70GM 47.82 55.00 55.00
840 WILD STONE US SHAV CRE 70GM 44.71 60.00 60.00
841 WIPRO SAFEWASH LIQ 1KG 236.61 265.00 265.00
842 XOTIC ROOM FRESH MIX 125GM 65.00 75.00 110.00
Page 29
Conceptual Framework of Sales Promotion Schemes, Consumer Preference and Brand Perception
61
SN Product Name Cost
Rate Sale Rate MRP
843 YARDLEY ENG LAVEND SOAP 100GM 47.43 56.00 56.00
844 YARDLEY ENG ROSE SOAP 100GM 48.77 56.00 56.00
845 YARDLEY ENG ROSE TALC 250GM 112.62 125.00 125.00
846 YARDLEY ENGLISH LAVENDER 250G 121.63 135.00 135.00
847 YARDLEY EQUITY BODY SPARY150M 162.16 180.00 180.00
848 YARDLEY GENTLEMAN TALC 100GM 58.56 65.00 65.00
849 YARDLEY JASMINE TALC 250GM 121.63 135.00 135.00
850 YARDLEY LACE TALC 100GM 67.57 75.00 75.00
851 YARDLEY RACE BODY SPRAY 150ML 162.16 180.00 180.00
852 YARDLEY RED ROSES SOAP 100GM 49.12 58.00 58.00
853 Z. TALC 20GM 9.09 10.00 10.00
854 ZATAK GAMBLER DEO 150ML 127.43 150.00 150.00
855 ZATAK STRIKER DEO 150ML 127.43 150.00 150.00
856 ZATAK STRIKER DEO 150ML 130.44 150.00 150.00
Considering above mentioned FMCG Product categories, it can be observed
that two types of sales promotion schemes are very popular among the
marketers is Price off and value added sales promotion schemes. Again in
value added schemes free gift and % extra are widely used. This is
applicable across International, National and Local brands of the FMCG.
Furthermore from the point of views of consumer„s benefits, there are
immediate and delayed types of benefits offered by various sales promotion
schemes. Among two types of benefits immediate benefits are widely used.
While discussing with the experts and academician it is found that the
medium through which sales promotion schemes awareness created among
consumers also plays important role to prefer the particular sales promotion
scheme. Going with it, for measuring the consumer preference of sales
promotion schemes four attributes and their levels have been identified as
mentioned below.
Page 30
Conceptual Framework of Sales Promotion Schemes, Consumer Preference and Brand Perception
62
2.3.2 Identification of Attributes and Attributes Levels:
Sr. No Name of the Attribute Attribute Levels
1. Brand Type 1. International
2. National
3. Local
2. Awareness Medium 1. Point of purchase material
2. Mass Media
3. Word of Mouth
3. Type of Sales promotion Schemes 1. Price off
2. Value Added
4.. Type of Benefits 1. Immediate
2. Delayed
2.4 Brand Defined:
There are many definitions of what branding is and the common
thread in most of these definitions is that a brand must be clearly
differentiated. The earlier definition of a brand was proposed by the
American Marketing Association ―a brand is a name, term, sign,
symbol, or design, or a combination of them, intended to identify
the goods or services of one seller or group of sellers and to
differentiate them from those of competitors (O„Malley, 1991:107).
Although this definition was criticized for being too product-oriented
and with an emphasis on visual features as a differentiating factor,
Dibb, Simkin, Pride, and Ferrell (1997) modified this original definition
to a name, term, design, symbol or any other feature that identifies
one seller's good or service as distinct from those of other sellers.
The key change in the definition by Dibbs et al (1997) is ―any other
feature as this allows for intangibles such as brand image as a point of
differentiation and not only the tangible visual features.
Page 31
Conceptual Framework of Sales Promotion Schemes, Consumer Preference and Brand Perception
63
Ambler (2003) takes on similar viewpoint to that of Dibb et al (1997)
by expanding the definition further as a name, symbol or design that
identifies one or more product and it is something that is bought by the
consumers. Ambler (2003) further emphasize the difference between a
product and a brand by highlighting that unlike a product, which can be
produced in a factory and it can be copied by a competitor, a brand is
unique. Earlier definitions by Ambler (1995) was based on a
consumer oriented approach by defining a brand as a promise of the
bundles of attributes that someone buys and provide satisfaction.
The attributes that make up a brand may be real or illusory, rational or
emotional, tangible or invisible. Wood (2000) supports this view and
highlights that a brand can be defined from different perspective such
as consumers' perspective and/or from the brand owner's perspective.
In addition, brands are sometimes defined in terms of their purpose,
and sometimes described by their characteristics.
According to Leiser (2004), the understanding of brands today is
far beyond the simplistic view of a logo, tagline or advertising image
but a set of expectations and associations evoked from experience
with a company or product. Furthermore, it is all about how customers
think and feel about what the business or product can deliver across
the board. Batey (2008) elicit differences between a product and a
brand as follows: You buy a product for what it does; you choose a
brand for what it means.
A product sits on retailer„s shelves; a brand exists in consumers
„minds.
A product can quickly be outdated; a brand is timeless.
A product can be copied by a competitor; a brand is unique.
Davis (2002) reiterates that consumers do not have a relationship with
a product or service but he/she may have a relationship with a brand
because a brand is a set of promises and therefore the strongest
brands own a place in the consumer„s mind. Furthermore, strong
Page 32
Conceptual Framework of Sales Promotion Schemes, Consumer Preference and Brand Perception
64
brands can increase the value of a company as investors are
willing to pay more for intangible asset such as a strong brand
(Motameni and Shahrokhi, 1998; Davis 2002; Ambler, 2003;
Rooney, 1995). In the context of t his research paper, the question
could be asked what is a strong brand?
According to Aaker (1996), a strong brand has a strong brand which
is a set of assets such as: brand name awareness, brand loyalty,
perceived quality and brand associations. However building strong
brands is a challenge in today„s environment as there are substantial
pressures and barriers both internal and external. Aaker (1996),
further highlights that one needs to understand these pressures and
barriers in order to develop strong brand strategies. Some of the
barriers highlighted by Aaker (1996) are: price, proliferation of
competitors, fragmented media and so forth.
Barron (2003) takes on a view that strong brands are built on a solid
internal foundation based on four fundamentals:
• Create brand intent
• Align the organization
• Deliver customer experience
• Measure and refine
Creating brand intent maximizes the area of intersection between
what a company does well and distinctively and what its targeted
customers want or need. When brand intent is clear, it is important
the whole organization is aligned to ensure that the entire
organization is able to deliver the brand intent as this will help deliver
customer experience through organizational capability and processes.
Finally, a good evaluation programme will ensure that brands stay on
intent (Barron, 2003).
Nandan (2005) suggests that strong brands have two very key distinct
features namely brand image and brand identity however no matter
how good a company is such as having a unique vision, strong
Page 33
Conceptual Framework of Sales Promotion Schemes, Consumer Preference and Brand Perception
65
management or superior product if the core benefits of the brand are
not clearly communicated to the right target audience, the brand will
ultimately fail. This is evidenced by well-known strong brands such
as Coke, Pepsi, Mac Donald„s, Nike, Apple etc. that are always
communicated with clear benefits, brand image and identity. Also,
managers of strong brands understand the changing needs of
consumers and the micro and macro environments. According to
Davis (2000), an understanding of competitors is vital in building a
strong brand and the failure to understand one's competitors is
ultimately the failure to know one's customers: who they are, how they
think, and how the brand can be adapted to meet their needs.
Strong brands are developed over time and the branding
literature increasingly suggests that the strength of a brand is not due
to the strength of creating a difference in customer perceptions but
rather brand strength is due to the meaning that the brand creates
(Kay, 2005). Brands however need to be relevant and appeal to
the new generation of consumers and that is why branding has
evolved over the years and strong brands are always being revitalized
to maintain relevancy and to attract new consumers.
2.5 The evolution of branding:
The definition of branding has evolved over the years and the Oxford
English dictionary (Oxford, 2009) traces the development of the
word brandfrom the German word brandr which referred to the mark
made by burning with a hot iron and its usage was first noted in 1552.
According to Jevons (2005), branding was discovered long before the
earliest definition of marketing in 1561 which therefore strongly
suggests that branding was defined before the marketing subject was
discovered. Over the years the definition of branding has evolved from
referring to a brand as a name, symbol or logo(O„Malley, 1991:107) to
people„s perception about a product or a company (Barron, 2003) and
over time definitions within the business literature have included value
enhancement or adding value (Jevons, 2005).
Page 34
Conceptual Framework of Sales Promotion Schemes, Consumer Preference and Brand Perception
66
According to Rooney (1995), the use of branding by big business is
nothing new and branding itself is more than one hundred years old
with the majority of countries having started trademark acts to
establish the legality of a protected asset as far back as 1890. The
years 1800 through to 1925 were known as the richest period of
name giving (Hambleton, 1987). The 90„s saw a change in branding
with a focus on creating mutually beneficial situations for the
consumer and the brand. According to Berry (1993), many companies
realized that they needed adequate price control measures and
effective and efficient brand building activities to strengthen the brand
. Companies started applying brands to more diverse settings where
the role of branding has become more important.
The harsher environments in the 90„s forced organizations to work
harder to gain profits and thus there was a shift in the way brand
management was organized as it became a team effort within
organizations with a focus on enhancing the customer experience (de
Chernatony, 1996). The concept of branding also became more
globalised with global brands gaining more recognition and value.
According to Motameni and Shahrokhi (1998), brands that are
available in many different countries have more value than brands that
are available in a fewer markets.
Over the years, companies have used branding as part of marketing
strategy to grow and diversify their businesses and during the 1980„s,
brands were used as valuable assets for takeovers on the open
market and this saw a rise in acquisition of branded companies
(Rooney, 1995). The increase in acquisitions in the 80„s resulted in
many brands suffering because of the change in management that is
always associated with acquisitions and this resulted in many brands
losing a clear image in the consumers mind (Rooney, 1995).
According to Beverland (2005), brands have always been
commercial agents and brand managers take pride in their ability to
Page 35
Conceptual Framework of Sales Promotion Schemes, Consumer Preference and Brand Perception
67
meet the needs of their target market. However, these two desires are
in conflict with the recent trend towards positioning brands as
authentic, emphasizing the timeless values desired by consumers
while downplaying apparent commercial motives. The dual problem
for the firm is in creating images of authenticity while dealing with
the challenge that authenticity presents for brand management. As
such brands that seem to be too focused on the bottom line and not
on societal issues are sometimes viewed as not authentic.
According to Henkel, Tomczak, Heitmann and Herrmann (2007),
market saturation and consumer confusion have changed the role of
branding dramatically during the last decades. Consumers therefore
try to handle the flood of apparently exchangeable products and
services by demanding those goods that provide a holistic and
coherent consumption experience. As a result, brands are no longer
simple product labels, but they are communication platforms towards
customers and other stakeholders that convey specific attributes of
products or services as well as company values and mission
statements. Kunde (2002), highlights that today, however the western
world is over supplied and there is an overabundance of everything
and we live in an era of excess. Offering more of the same is no
longer a viable option and differentiation and uniqueness are
important. Kunde (2002) further highlights that there is only one place
that marketers must be serious about and that is the human mind.
As highlighted in the earlier sections, consumers do not
purchase products but purchase brands and therefore top of mind
awareness is important. If your brand can maintain top of mind
awareness and is unique and clearly differentiated, it becomes easier
for consumers to select this brand over those of competitors and it
becomes part of their repertoire. However no matter how much
marketing support goes behind a brand, it is important that the right
message about what the brand stand for is communicated. Today,
brand management is still as complex as it was before as brands
Page 36
Conceptual Framework of Sales Promotion Schemes, Consumer Preference and Brand Perception
68
are not static but evolve all the time and the role of brand
custodians is to ensure that the brand remains relevant in consumers„
mind and repertoire.
2.6 Brand and Perception:
Brand is normally used by most organizations as a measure of how
strong the brand is. Brand has been considered in many contexts,
Aaker (1991), defines brand from a consumer perspective of brand
loyalty, awareness, perceived quality and brand image whilst other
authors such as Farquhar (1989) define brand from a financial
perspective (added value endowed by the brand). Because brand is
so important for marketers, many invest millions in marketing
activities that are meant to increase it; however there seem to be
no link between brand measures and financial performance. Many
organizations track brand consistently in order to ascertain consumer
satisfaction, awareness and loyalty amongst other things. Although
this is a good practice, it does not add value if this information is not
shared with the rest of the organization especially the executives.
According to Ambler (2003), there is a big difference between
measuring brand valuation, market share and brand and more
often than not most companies focus on brand valuation rather than
brand. Brand is the asset itself whilst brand valuation measures
what the asset is worth. It is therefore logical to put measures in place
to track how the asset is performing. In essence, building strong brand
can influence future consumer behaviour and therefore increase the
value of a brand (Ambler, 2003). According to a survey on top 100
most valuable global brands 2009, knowing a brand„s value is
important as it enables business leaders, investors and other
stakeholders to make better decisions such as the return on
investment in marketing initiatives (Millward Brown, 2008). The
brand value is calculated based on the intrinsic value of the brand
derived from its ability to generate demand and is based on customer
opinion (brand) and financial performance (Millward Brown, 2008).
Page 37
Conceptual Framework of Sales Promotion Schemes, Consumer Preference and Brand Perception
69
This therefore supports the view that brand tracking is important to
ensure that the value of the asset is sustained.
A study conducted by Hong-bumm, Woo and Jeong (2003), on the
effect of consumer- based brand on firm„s financial performance,
they concluded that a lack of brand in hotel firms can damage
potential sales flow and that strong brand can cause a significant
increase in revenue. These findings were based on the fact that
consumers base their choice of hotel and how much they are prepared
to pay on key factors such as: brand loyalty, awareness, perceived
quality and brand image all of these which are key components of
measuring brand.
From the discussion above, it is evident that brands are the heart of
any business and if well managed, they can help increase the
firm„s financial value however the question is how many
organizations are focusing on the short term (sales and market share)
versus long term (investing in brand building activities that will drive
long term growth and thus creating sustainable financial growth value
of the firm).
Brand is another concept that is closely related to branding and brand
management. The concept of brand was invented in 1980„s and only
gained popularity in the 1990„s (Aaker, 1991). It is therefore still a
relatively new and complex concept that is often difficult to describe.
The steadily growing literature contains several often divergent
viewpoints on the dimensions of brand, the factors that influence it,
the perspectives from which it should be studied, and the ways to
measure it. However, there is agreement among researchers on the
general definition of the concept. Brand is defined as the marketing
effects or outcomes that accrue to a product with its brand name
compared with those that would accrue if the same product did not
have the brand name (Aaker 1991; Dubin, 1998; Farquhar, 1989;
Keller 2003; Leuthesser 1988).
Page 38
Conceptual Framework of Sales Promotion Schemes, Consumer Preference and Brand Perception
70
Ambler (2003: 281), defines brand as an important intangible asset
for the company, it can be seen as the reservoir of results gained by
good marketing but not yet delivered to the profit and loss account‖.
Yoo, Donthu and Lee (2000), define brand as the difference in
consumer choice between a branded and unbranded product given the
same level of product features. Aaker (1991) defines it as a set of
assets and liabilities connected to a brand that add to or detract from
its value to the customer and to the business and creating brand
profile involves the identification of the various customer associations
with a brand and levels of customer awareness and loyalty that set it
apart from competitors. Leiser (2004), concur and adds that all those
associations (positive, negative and neutral) evoked from customer
experience with a brand combine to create the brand„s.
Because brand is such a complex subject, it can be viewed from a
variety of perspectives. Motameni and Shahrokhi (1998), highlights
that although brand is generally viewed from two perspectives such
as: marketing decision making and financial perspective, there is a
need to view brands from a global perspective especially since
successful maintenance of global image and recognition translates
into hard currency in international business as is the case with
the likes of McDonald„s and Coca Cola. Marketing decision includes
aspects such as awareness, loyalty, quality and propriety brand
assets with an aim of improving efficiency of the marketing process.
Financial decision on the other hand involves financial market value
based techniques (Motameni and Shahrokhi, 1998).
Best (2005), defines brand the way the term in business is normally
defined as depicted in figure 2.2 below. According to Best (2005) in a
business, the owners is the value of the owner„s holdings in the
company and is determined by the difference between what a
company owns in assets and what a company owes in liabilities,
therefore the larger the ratio of assets to liabilities the greater the
owner„s. Brand can also be assessed the same way and to calculate
Page 39
Conceptual Framework of Sales Promotion Schemes, Consumer Preference and Brand Perception
71
brand one must simply subtract the total brand liability score from the
total brand asset score (Best, 2005).
Brand can also be used to distinctly separate selling from marketing
as in essence selling seeks an immediate order for a product and
aims to increase the revenue line of a profit and loss account
immediately whilst marketing invests resources before it expects to
reap the rewards (Ambler, 2003). Brand has become the most
valuable asset for many companies. Kohli and Thakor (1997), make a
very good point by highlighting that consumers do not buy jeans but
buy Levi„s and no one buys corn flakes but Kellogg„s and
furthermore, the strength of the brand names have resulted in
acquisitions amounting to billions for the following companies:
• Nestle acquired Perrier for $2.5 billion.
• Phillip Morris acquired Kraft for $13 billion.
• Nabisco was sold for over $25 billon.
According to Ambler (2003) there is also a distinct difference
between the asset (brand) and what the asset is worth (brand
valuation). Brand also plays an important role in increasing the value
of the business and companies pay good money for these assets
(Ambler, 2003; Motameni and Shahrokhi, 1998). Aaker (1996)
highlights that there are four major assets through which brand
generates value and these are: brand name and awareness, brand
loyalty, perceived quality and brand associations.
Because of the value that brand adds for shareholders, it is still
surprising that there are still debates as to whether brand building
activities are important or not and as a result companies that are
focused on short term gains do not perceive brands as important
assets. By viewing brands as assets, companies are better able to put
their brand building expenditure in context with the value that those
brands deliver (Davis, 2002).
Page 40
Conceptual Framework of Sales Promotion Schemes, Consumer Preference and Brand Perception
72
According to Yoo et al (2000), there are several dimensions of brand
and any marketing action has the potential to affect brand
because it represents the effect of accumulated marketing
investments into the brand. Furthermore, brand name recognition with
strong associations, perceived quality of product, and brand loyalty
can be developed through careful long-term investments. In a study
to examine selected marketing mix and brand, Yoo et al (2000),
recognized that there are two types of marketing management efforts
from a long term perspective of brand management namely: brand
building activity and brand-harming activity. It was observed that
frequent use of price promotions is a typical example of brand-
harming activity whilst high advertising spending, high price and
distribution through retailers with store images and high distribution
intensity are good examples of brand-building activity. The results of
regular price cutting can negatively affect brand as a perception is
created that product quality has been compromised. In their
recommendations, Yoo et al (2000), suggests that managers should
avoid frequent price cuts or a consistent low price strategy because
they lower perceived quality and product image.
From the above discussion, it is evident that brand is a major
marketing asset of many firms and that it can be used to drive long-
term growth and deliver value for shareholders. Although brand plays
a significant role in increasing shareholder value, it is important that
measures are put in place to track it. It is a well known fact that what is
not measured is not managed and therefore tracking and measuring
brand assist in creating brands that consistently deliver on their
promise. As brand is an intangible asset, most people struggle to
quantify it however various tools are available that have been used
effectively by many organizations to measure brand.
An attempt to define the relationship between customers and
brands produced the term “brand” in the marketing literature. The
concept of brand has been debated both in the accounting and
Page 41
Conceptual Framework of Sales Promotion Schemes, Consumer Preference and Brand Perception
73
marketing literatures, and has highlighted the importance of having a
long-term focus within brand management. Although there have been
significant moves by companies to be strategic in the way that brands
are managed, a lack of common terminology and philosophy within
and between disciplines persists and may hinder communication.
Brand, like the concepts of brand and added value has
proliferated into multiple meanings. Accountants tend to define
brand differently from marketers, with the concept being defined both
in terms of the relationship between customer and brand (consumer-
oriented definitions), or as something that accrues to the brand owner
(company-oriented definitions). It has been simplified that the variety of
approaches, by providing a classification of the different meanings of
brand as:
The total value of a brand as a separable asset when it is sold, or
included on a balance sheet;
• A measure of the strength of consumers' attachment to a brand;
• A description of the associations and beliefs the consumer has
about the brand.
The first of these is often called brand valuation or brand value,
and is the meaning generally adopted by financial accountants. The
concept of measuring the consumers' level of attachment to a brand
can be called brand strength (synonymous with brand loyalty). The
third could be called brand image, though used the term brand
description. When marketers use the term ”brand'' they tend to mean
brand description or brand strength. Brand strength and brand
description are sometimes referred to as ”consumer brand'' to
distinguish them from the asset valuation meaning.
Brand description is distinct because it would not be expected to
be quantified, whereas brand strength and brand value are
considered quantifiable. Brand value may be thought to be distinct as
Page 42
Conceptual Framework of Sales Promotion Schemes, Consumer Preference and Brand Perception
74
it refers to an actual or notional business transaction, while the other
two focus on the consumer. There is an assumed relationship between
the interpretations of brand. This relationship implies the causal chain
shown in Figure 1.
Very simply, brand description (or identity or image) is tailored to the
needs and wants of a target market using the marketing mix of
product, price, place, and promotion. The success or otherwise of this
process determines brand strength or the degree of brand loyalty. A brand's
value is determined by the degree of brand loyalty, as this implies a
guarantee of future cash flows.
It has been considered that using the term brand creates the illusion that an
operational relationship exists between brand description, brand strength and
brand value that cannot be demonstrated to operate in practice. This is not
surprising, given that brand description and brand strength are, broadly
speaking, within the remit of marketers and brand value has been considered
largely an accounting issue. However, for brands to be managed strategically
as long-term assets, the relationship outlined in Figure 1 needs to be
operational within the management accounting system. The efforts of
managers of brands could be reviewed and assessed by the measurement
of brand strength and brand value, and brand strategy modified accordingly,
Whilst not a simple process, the measurement of outcomes is useful as part
of a range of diagnostic tools for management.
Whilst there remains a diversity of opinion on the definition and basis of
brand, most approaches consider brand to be a strategic issue, albeit often
implicitly.
It has been suggested that managers of brands choose between taking
profits today or storing them for the future, with brand being the`` store of
Figure 1
The brand chain
Brand description brand strength brand value
Page 43
Conceptual Framework of Sales Promotion Schemes, Consumer Preference and Brand Perception
75
profits to be realised at a later date.
This definition of brand distinguishes the brand asset from its valuation.
This approach is intrinsically strategic in nature, with the emphasis away
from short -term profits. Davis (1995) also emphasizes the strategic
importance of brand when he defines brand value (one form of brand) as
the potential strategic contributions and benefits that a brand can make to a
company.'' In this definition, brand value is the resultant form of brand in
Figure 1, or the outcome of consumer-based brand.
Keller (1993) also takes the consumer-based brand strength approach to
brand, suggesting that brand represents a condition in which the consumer
is familiar with the brand and recalls some favourable, strong and unique
brand associations. Hence, there is a differential effect of brand knowledge
on consumer response to the marketing of a brand. This approach is aligned
to the relationship described in Figure 1, where brand strength is a function of
brand description.
It has been related that brand to added value by suggesting that brand
involves the value added to a product by consumers' associations and
perceptions of a particular brand name. It is unclear in what way added value
is being used, but brand fits the categories of brand description and brand
strength as outlined above.
Leuthesser (1988) offers a broad definition of brand as: the set of
associations and behaviour on the part of a brand's customers, channel
members and Parent Corporation that permits the brand to earn greater
volume or greater margins than it could without the brand name.
Marketers tend to describe, rather than ascribe a figure to, the outcomes of
brand strength. It has been suggested that brand increases the probability
of brand choice, leads to brand loyalty and ``insulates the brand from a
measure of competitive threats.'' Aaker (1991) suggests that strong brands
will usually provide higher profit margins and better access to distribution
channels, as well as providing a broad platform for product line extensions.
Page 44
Conceptual Framework of Sales Promotion Schemes, Consumer Preference and Brand Perception
76
Brand extension is a commonly cited advantage of high brand, Keller and
Aaker (1992) suggesting that successful brand extensions can also build
brand. Loken and John (1993) and Aaker (1993) advise caution in that poor
brand extensions can erode brand.
Farquhar (1989) suggests a relationship between high brand and market
power asserting that: The competitive advantage of firms that have brands
with high includes the opportunity for successful extensions, resilience
against competitors' promotional pressures, and creation of barriers to
competitive entry.
This relationship is summarized in Figure 2. Figure 2 indicates that there can
be more than one outcome determined by brand strength apart from brand
value. It should be noted that it is argued by Wood (1999) that brand value
measurements could be used as an indicator of market power.
Achieving a high degree of brand strength may be considered an important
objective for managers of brands. If we accept that the relationships
highlighted in Figures 1 and 2 are something that we should be aiming for,
then it is logical to focus our attention on optimizing brand description. This
requires a rich understanding of the brand construct itself. Yet, despite an
abundance of literature, the definitive brand construct has yet to be
produced. Subsequent discussion explores the brand construct itself, and
highlights the specific relationship between brands and added value. This
relationship is considered to be key to the variety of approaches to brand
definition within marketing, and is currently an area of incompatibility
between marketing and accounting.
The question of the short-term effectiveness of sales promotions (or lack of
it) is particularly important for brands with a high level of customer-based
Figure 2
The relationship between brand and market power
Brand description brand strength market power
Page 45
Conceptual Framework of Sales Promotion Schemes, Consumer Preference and Brand Perception
77
brand (from now on, referred to as high brands because of concerns
about the long-term effects of sales promotions on brand Existing
analytical models argue that, in such a situation, the high brand should price
discount in order to capture the buyers of the private label (Rao 1991).
However, empirical evidence on the effectiveness of sales promotions for
high and low brands is mixed. While some studies found that higher-quality
brands gain more from a price cut than lower quality brands (Blattberg and
Wisniewski 1989), others found the opposite (Bronnenberg and Wathieu
1997).
Keller„s (1993) defines the brand as it states that consumers are
more responsive to the marketing mix of brands with high levels of brand .
Blattberg and Wisniewski (1989) provide empirical evidence of the higher
promotion elasticity of high-quality brands in the case of a duopoly between
brands of differing perceived quality. There are also theoretical arguments
supporting the leveraging impact of brand on benefit congruency.
Compared to high brands, low- brands do not provide as many
benefits (utilitarian or hedonic) and are bought because of their lower
price. Low brands should therefore be less sensitive than high brands to
the congruency between their weaker benefits and those of the promotion.
Prior research provides evidence supporting this assertion.
The cross-promotion asymmetry documented by Blattberg and Wisniewski
(1989) implies that monetary promotions should be less effective for
the low- utilitarian brand despite their benefit congruency because of their
incapacity to attract the price insensitive buyers of the high brand. The
loss aversion argument that explains the cross-promotional asymmetry for
monetary promotions applies to non-monetary promotions as well. Non-
monetary promotions should be less effective for the low hedonic brand than
for its high- counterpart because the buyers of high brands are more reluctant
to trade down in hedonic product benefits (a loss) than buyers of low- brands
are to trade up (again).
Page 46
Conceptual Framework of Sales Promotion Schemes, Consumer Preference and Brand Perception
78
Perhaps because coupons and temporary price reductions are the most
common form of sales promotions, most research has assumed that
monetary savings is the only consumer benefit of sales promotions.
Consequently, while many studies have examined the costs of promotion
usage, comparatively few have examined their benefits to the consumer. It
has been concluded that:
1. Promotions can provide consumers with an array of hedonic and
utilitarian benefits beyond monetary savings. Hedonic benefits include
value- expression, entertainment, and exploration. Along with simple
monetary savings, utilitarian benefits also include product quality and
shopping convenience.
2. Non-monetary promotions provide more hedonic benefits and fewer
utilitarian benefits than monetary promotions. All benefits, except
quality, contribute to the overall evaluation of monetary and
nonmonetary promotions. However, each type of promotion is
primarily evaluated based on the dominant benefits it provides.
3. For high brands, sales promotions are more effective when they
provide benefits that are congruent with those provided by the product
being promoted. Specifically, monetary promotions are more effective
for utilitarian products than for hedonic products. Conversely, non-
monetary promotions are relatively more effective for hedonic products
than for utilitarian products.
In this research Definition of brand given by Aakar has been taken as a
working definition of Brand, as it is a consumer oriented definition of Brand.
Above Mentioned sources have been considered to measure Brand
perception namely, Brand Loyalty, Brand Awareness, Perceived Quality and
Brand Associations considering the sales promotion schemes.
Page 47
Conceptual Framework of Sales Promotion Schemes, Consumer Preference and Brand Perception
79
2.7 References:
1. Aaker, D. (1991), Managing Brand: Capitalizing on the value
of a Brand Name, The Free Press, New York, NY.
2. Aaker, D. (1996). Building Strong Brands, Free Press, New York,
NY.
3. Ambler, T. (1995), Building Brand Relationship„, December 1,
Financial Times.
4. Ambler, T. (2003), Marketing and the bottom line, 2nd edition.
London, Prentice Hall.
5. Available from:<http://www.bizzcommunity.com Barron, J. (2003),
How strong brands get on intent and stay there„ Journal of
Business Strategy, 3: 36-41.
6. Barwise, P. and Farley, J.U. (2004), Marketing Metrics: Status of
Six Metrics in Five Countries„, European Management Journal, 22
(3): 257-262.
7. Batey, M. (2008), Brand Meaning, Taylor and Francis Group, New
York.
8. Berry, J. (1993), Brand„, Brandweek, 34: 20-24.
9. Best, R.J. (2005), Market-based management: strategies for
growing customer value and profitability. 4th edition. Pearson:
Prentice Hall.
10. Beverland, M. (2005), Brand Management and the challenge of
authenticity„.
11. Blattberg and Kenneth J. Wisniewski (1989), Price-Induced
Patterns of Competition, Marketing Science, 8 (4), 81-100.
12. Bronnenberg, Bart J. and Luc Wathieu (1997), Asymmetric
Promot ion Effects and Brand Positioning, Marketing Science,
Vol. 15 (4), 379-94.
13. Chandon, Pierre and Brian Wansink (1999), When and Why
Does Consumer Stockpiling Accelerate Consumption? Working
paper No. 99-201, London Business School.
14. Davis, S. (2002), Brand Asset Management: how businesses
can profit from the power of brand, Journal of Consumer
Page 48
Conceptual Framework of Sales Promotion Schemes, Consumer Preference and Brand Perception
80
Marketing, 19 (4): 351- 358.
15. De Chernatony, L. (1996), Integrated brand building using brand
taxanomies„, Marketing Intelligence and Planning, 14 (7): 40-45
16. Dibb, S., Simkin, L., Pride, W.M. and Ferrell, O.C. (1997),
Marketing: Concepts and Strategies, 3rd European ed., Houghton
Mifflin,
17. Dubin, J. A. (1998), The Demand for Branded and Unbranded
Products: An Econometric Method for Valuing Intangible
Assets„, Studies in Consumer Demand: Econometric Methods
Applied to Market Data. Norwell, MA: Kluwer Academic
Publishers, 77-127.
18. Dunn, M. and Davis, S. (2004), Handbook of Business
Strategy, MCB UP Limited.
19. Farquhar, P. (1989), Managing Brand,„ Marketing Research, 1
(9): 24- 33.
20. Hambleton, R. (1987), The branding of America, Yankee Books,
New York.
21. Henkel, S., Tomczak, T, Heitmann, M. and Herrmann, A.
(2007), Managing brand consistent employee behaviors:
relevance and managerial control of behavioral branding.
Journal of Product and Brand management, 16 (5): 310- 320.
22. Hong-bumm, K. and Woo, G.K., Jeong, A.A. (2003), The effect
of consumer based brand on firms„ financial performance„,
Journal of Consumer Marketing, 20 (4): 335-351
23. Jevons, C. (2005), Names, brands, branding: beyond the
signs, symbols, products and services„, Journal of Product and
Brand Management, 12 (2): 117-118.
24. Journal of Product and Brand Management, 14 (7): 460-461
25. Kay, M.J. (2005), Strong brands and corporate brands,
European Journal of Marketing, 40 (7/8): 742-760.
26. Keller, K. L. (1993), Conceptualizing, Measuring, and Managing
Customer Based Brand,„ Journal of Marketing, 57 (1), 1-22.
27. Keller, Kevin Lane (1993), Conceptualizing, Measuring and
Page 49
Conceptual Framework of Sales Promotion Schemes, Consumer Preference and Brand Perception
81
Managing Customer-based Brand, Journal of Marketing, 57 (1),
1-22.
28. Kish, P., Riskey D.R. and Kerin, R.A. (2001), Measurement and
tracking Brand in the market place: The PepsiCo experience„,
International marketing Review, 18 (1):91-96
29. Kohli, C. and Thakor, M. (1997), Branding consumer goods:
insights from theory and practice, Journal of Consumer
Marketing, 14 (3): 206- 219.
30. Kunde, J. (2002), Unique Now or Never, Pearson Hall, Harlow
31. Leiser, M. (2004), Handbook of Business Strategy, MCB UP
Limited.
32. Leuthesser, L. (1988), Defining, Measuring, and Managing
Brand, „Working Paper No. 88-104, Marketing Science Institute,
Cambridge, MA.
33. LisaWood. (2000) Brands and brand: definition and
management, Management Decision, 38(9), 662-669.
34. Millward Brown, (2008), Recession marketing presentation
[online].
35. Motameni, R. and Shahroki, M. (1998), Brand valuation: a
global perspective„, Journal of Product and Brand Management, 7
(4): 275- 290.
36. Nandan, S. 2005. An exploration of the brand identity-brand
image linkage: A communications perspective, Journal of Brand
Management, 12 (4): 264-278.
37. O„Malley, D. (1991), Brand means businesses, Accountancy, 107:
107-108.
38. Oxford Dictionary. 2009. [Online]. Available from:
<http://www.askoxford.com/concise_oed/branding>, Oxford
University Press.
39. Rajagopal. (2008),‗Measuring brand performance through metrics
application„, Measuring Business Excellence, 12 (1): 29-38
40. Rao, Ram C. (1991) Pricing and Promotions in Asymmetric
Duopolies, Marketing Science, 10 (2), 131-44.
Page 50
Conceptual Framework of Sales Promotion Schemes, Consumer Preference and Brand Perception
82
41. Rooney, J.A. (1995), Branding: a trend for today and tomorrow„,
Journal of Product and Brand Management, 4 (4): 48-55.
42. Rust, R.T., Ambler, T., Carpenter, G. S., Kumar V. and
Srivastava, R. K. (2004), Measuring Marketing Productivity:
Current Knowledge and Future Directions„, Journal of Marketing,
68 (10): 76-89.
43. Wood, L. (2000), Brands and brand : Definition and
management Management Decision, 38 (9): 662-669.
44. Yoo, B., Donthu, N. and Lee, S. (2000), An examination of
selected marketing mix elements and brand„, Academy of
Marketing Science Journal, 28 (2): 195-211.