23
Conceptual Statistics Through Graphing Wen-hao Zeng Brian Nemsick Lijun Zhu Ricky Liou Ethan Hayes Drew Boatwright
| Date post: | 24-Dec-2015 |
| Category: |
Documents |
| Upload: | stephen-washington |
| View: | 223 times |
| Download: | 0 times |

Conceptual StatisticsThrough Graphing
Conceptual StatisticsThrough Graphing
Wen-hao Zeng
Brian Nemsick
Lijun Zhu
Ricky Liou
Ethan Hayes
Drew Boatwright
2
IntroductionIntroduction
• Goal of the project– Create a way for students and instructors to view
statistics on concepts through graphing
• Motivation– Currently there is no option to see statistics based on
concepts– Valuable information
3
So how do we start?So how do we start?
• Research– Two Methods
• Jquery/Highcharts• Python
• Division of Labor
4
Highcharts IntroductionHighcharts Introduction
• Highcharts is a platform for creating Interactive Javascript Charts.

5
Benefits of HighchartsBenefits of Highcharts
• Easy implementation on webpages• Multiple types of graphs• Highly Customizable• Full API• Many Demos
6
Getting The DataGetting The Data
• X-axis– Concepts in an assignment
• Y-axis– Numerical information

7
X-axisX-axis
• Con_per_assign.php– Looks at tags(concepts) for questions in an
assignment and stores those concepts in a table
8
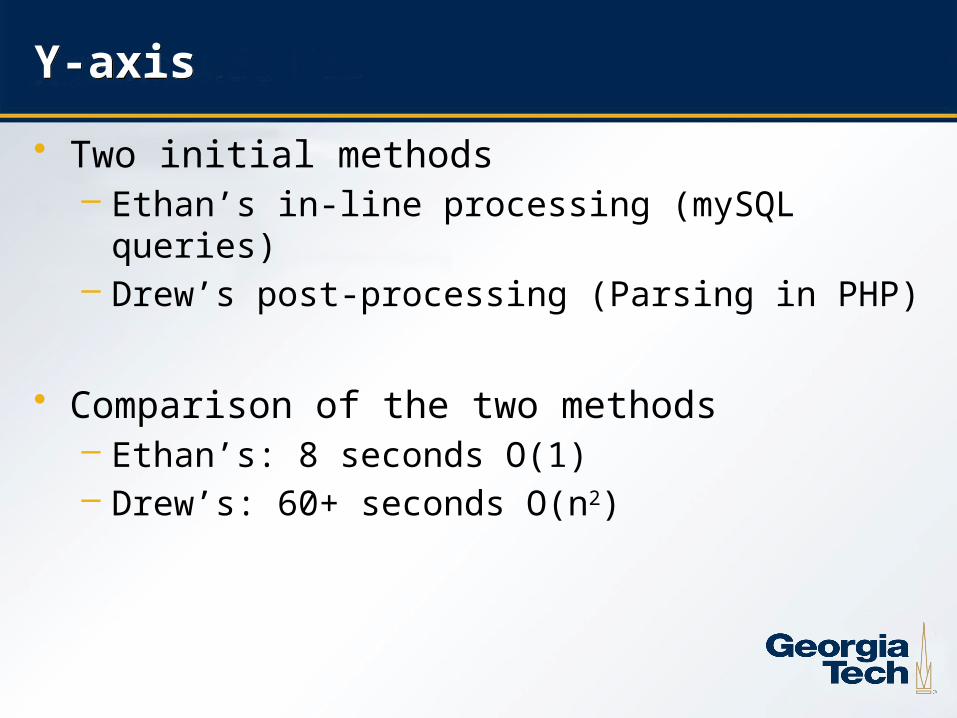
Y-axisY-axis
• Two initial methods– Ethan’s in-line processing (mySQL queries)– Drew’s post-processing (Parsing in PHP)
• Comparison of the two methods– Ethan’s: 8 seconds O(1)– Drew’s: 60+ seconds O(n2)
9
ImplementationImplementation
• Chart.php– Called through ITS_jquery
• GET variables passed through– Contains multiple graph views
• Student/Instructor/Stacked/Percentage
10
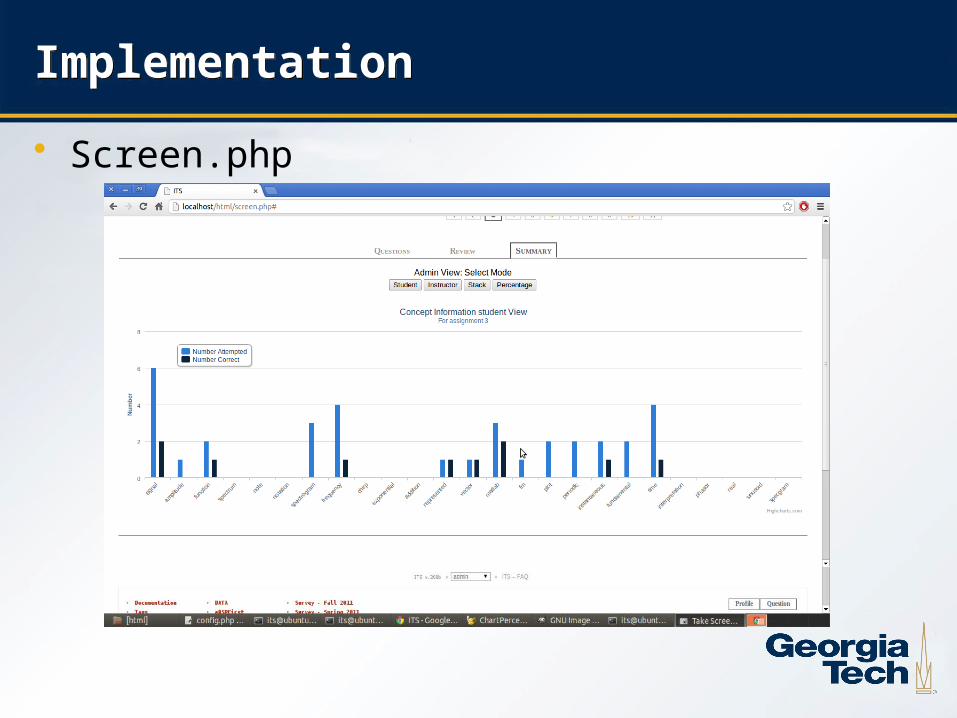
ImplementationImplementation
• Screen.php
11
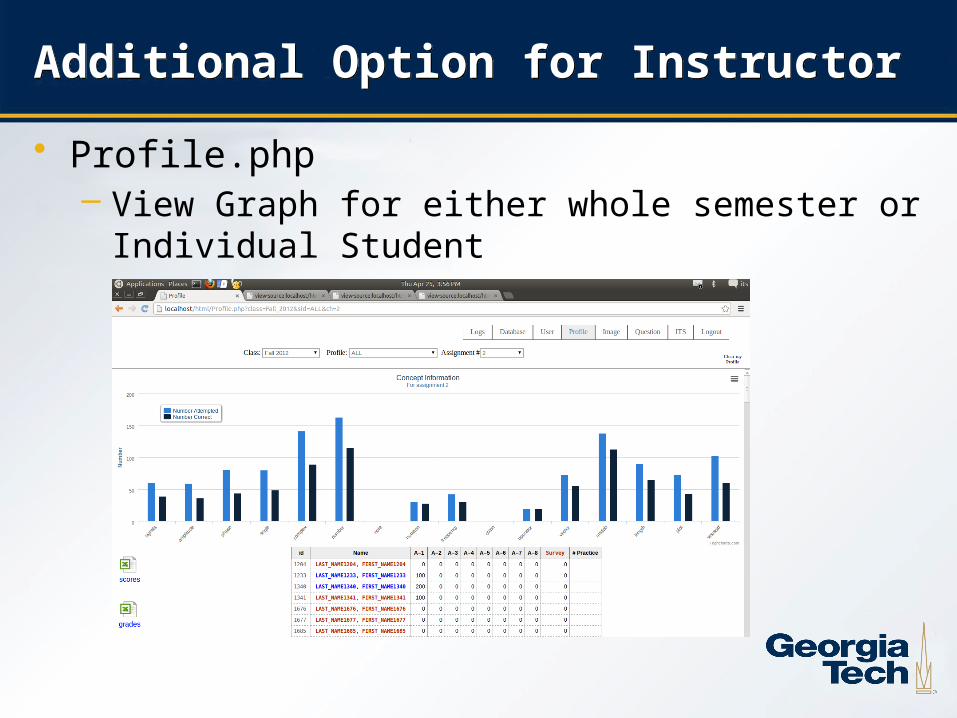
Additional Option for InstructorAdditional Option for Instructor
• Profile.php– View Graph for either whole semester or Individual
Student
12
Python IntroductionPython Introduction
• Python is a useful calculation and data analysis tool.
• However, ITS wasn’t compatible with Python• In order to allow future be based on Python,
fundamental works must be done• Producing a student summary graph is a good
objective for the fundamental work

13
What have we achievedWhat have we achieved
• Successful installation of several useful module for python, both on local and dev5– Matplotlib– MySQLdb
• Successful communication between PHP and Python– jpgraph
• Successful production of student summary graph using real student data from MySQL
14
Python Plotting ImplementationPython Plotting Implementation
• Use Python to extract the data from MySQL tables.
• Use Python to filter attempted concepts and to sort tags alphabetically.
• Plot tags and data with Matplotlib storing the result in a PNG file
• Use HTML/PHP to display the PNG file.• Have PHP pass the necessary inputs to generate
the appropriate graphs.

15
Python Plotting ImplementationPython Plotting Implementation
PHPStudent/Semester & assignment
Python
MySQL
Query
Display PNG Plot Matplotlib
Save PNG Plot
Tags & Data
16
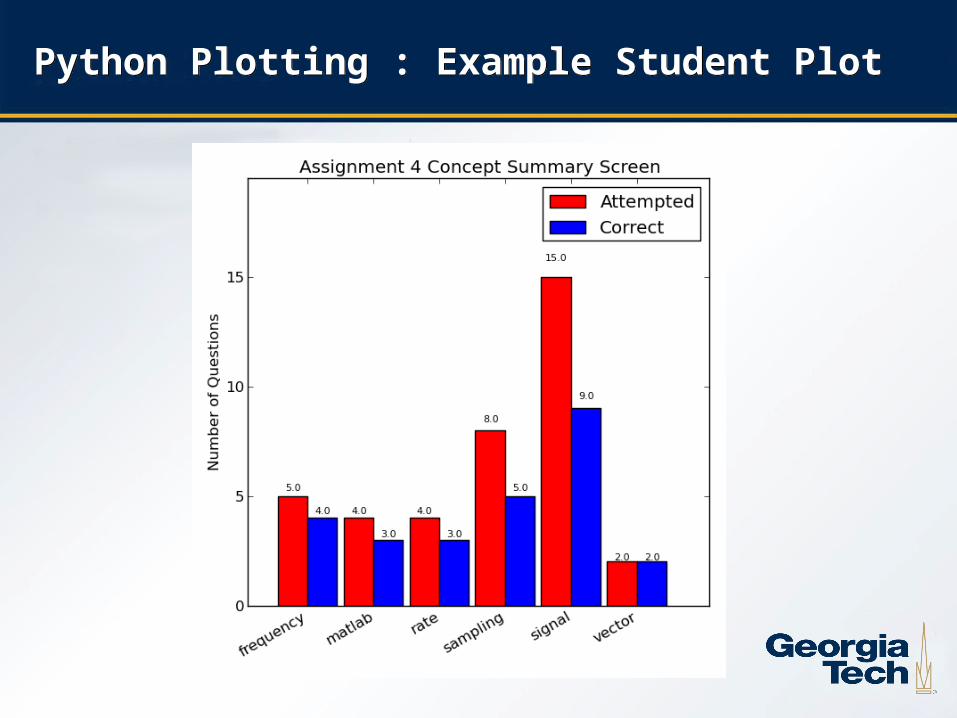
Python Plotting : Example Student PlotPython Plotting : Example Student Plot
17
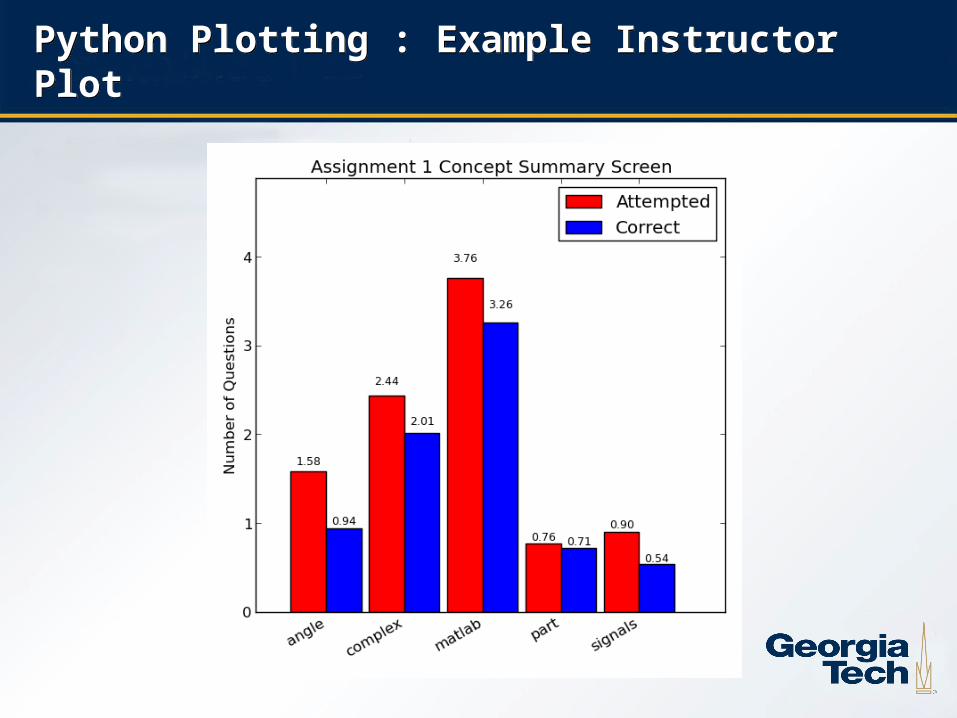
Python Plotting : Example Instructor PlotPython Plotting : Example Instructor Plot
18
PHP Plotting ImplementationPHP Plotting Implementation
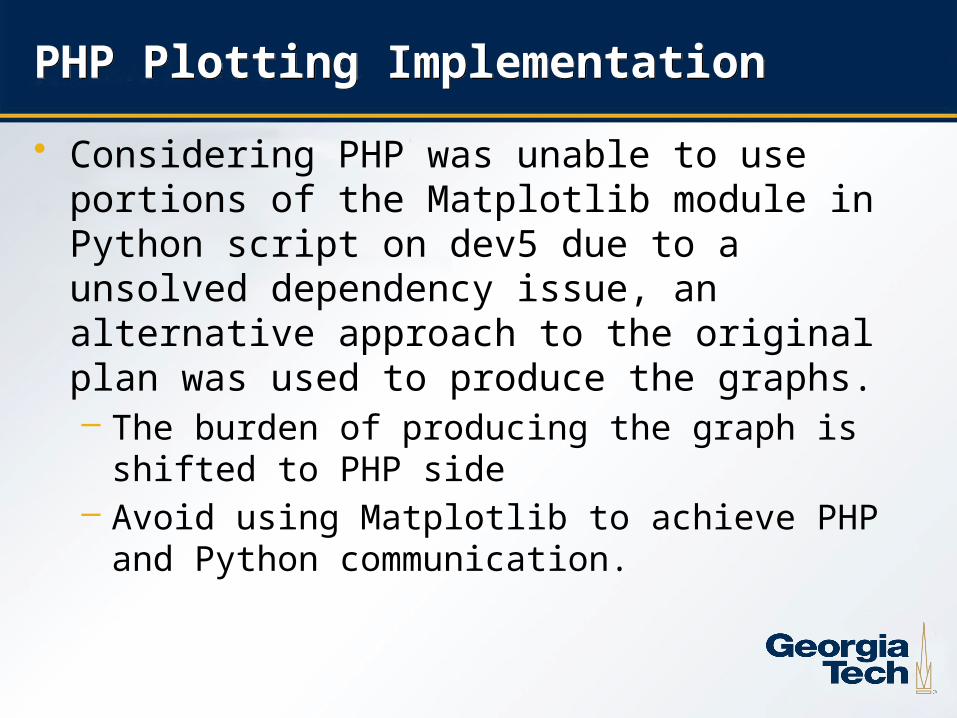
• Considering PHP was unable to use portions of the Matplotlib module in Python script on dev5 due to a unsolved dependency issue, an alternative approach to the original plan was used to produce the graphs.– The burden of producing the graph is shifted to PHP
side– Avoid using Matplotlib to achieve PHP and Python
communication.
19
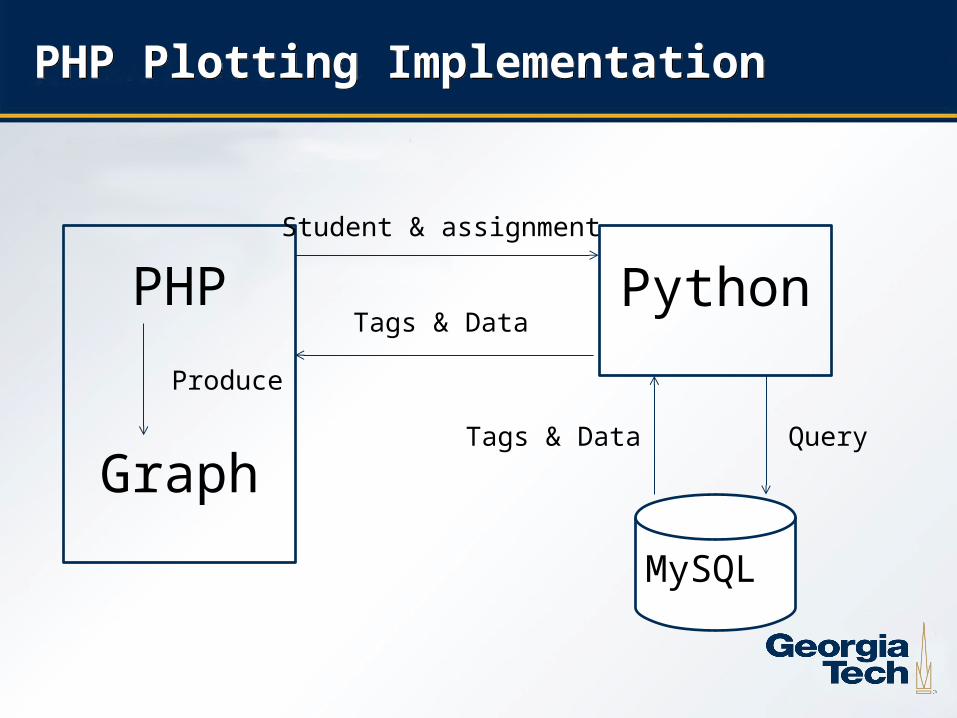
PHP Plotting ImplementationPHP Plotting Implementation
PHPStudent & assignment
PythonTags & Data
MySQL
QueryTags & Data
Graph
Produce

20
PHP Plotting ImplementationPHP Plotting Implementation
21
ResultsResults
• With these results…– We have two methods of graphing the statistical
information for concepts– We have a way of communicating with Python
through PHP.

22
Future WorksFuture Works
• Resolve the minor dependency issue with Matplotlib in PHP.
• Finding even more efficient queries to pull the Y-axis data.

23
Questions?Questions?


