Conceptualizing rill erosion as a tool for planning and evaluating soil conservation in Angereb watershed, Ethiopia: Methodological development Research Report for Q505 project supported by Eastern and Southern Africa Partnership Program (ESAPP) Gizaw Desta (2010) Amhara Region Agricultural Research Institute (ARARI) source: https://doi.org/10.7892/boris.69286 | downloaded: 13.3.2017
Transcript
Conceptualizing rill erosion as a tool for planning and evaluating soil
conservation in Angereb watershed, Ethiopia: Methodological development
Research Report for Q505 project supported by Eastern and Southern Africa Partnership
Program (ESAPP)
Gizaw Desta (2010)
Amhara Region Agricultural Research Institute (ARARI)
LIST OF TABLES ...................................................................................................................................................................................II
LIST OF FIGURES ...............................................................................................................................................................................III
ABBREVIATIONS................................................................................................................................................................................ IV
1.1 PROBLEMS OF SOIL EROSION.............................................................................................................................................................1
1.2 SWC EFFORTS AND LIMITATIONS ......................................................................................................................................................2
1.3 RESEARCH PROBLEMS AND QUESTIONS .............................................................................................................................................3
1.4 IMPORTANCE OF THE RESEARCH ........................................................................................................................................................3
1.5 RESEARCH OBJECTIVES ......................................................................................................................................................................5
2. APPLICATION OF RILL EROS ION PROCESS ES FOR SWC PLANNING............................................................6
3. SWC EXTENS ION APPROACHES ........................................................................................................................................8
4. RES EARCH METHODOLOGY.............................................................................................................................................10
4.1 STUDY AREA .................................................................................................................................................................................. 10
4.1.1 Selection of the study area ................................................................................................................................................. 10
4.1.2 Location and description of the study area..................................................................................................................... 11
4.2 SPECIFIC METHODS AND PROCEDURES............................................................................................................................................ 13
4.2.2 Survey of rill erosion........................................................................................................................................................... 18
4.2.3 Assessment of performance of SWC measures ............................................................................................................... 21
5. RES ULTS AND DISCUSS ION ................................................................................................................................................22
5.2 FARMERS’ PERCEPTION ON EROSION PROBLEM AND ITS IMPACTS .................................................................................................... 23
5.4 QUALITATIVE AND QUANTITATIVE ASSESSMENTS OF EROSION INDICATORS ...................................................................................... 27
5.5 RILL EROSION ON SMALL CASE-STUDY CATCHMENTS....................................................................................................................... 34
5.5.1 Rill characteristics and rill development along the topo-sequence ............................................................................ 37
5.5.2 Rill formation and development on the intra-terrace area .......................................................................................... 40
5.6 ASSESSMENT OF STONE TERRACES ON AGRICULTURAL FIELDS.......................................................................................................... 44
5.6.1 Technological assessment of stone terraces ................................................................................................................... 44
5.6.2 Comparison of terrace dimensions with design specifications.................................................................................... 49
5.6.3 Farmers’ assessment of stone terraces ............................................................................................................................ 51
5.7 IMPROVEMENTS ON SOIL CONSERVATION MEASURES ..................................................................................................................... 52
6. SUMMARY AND CONCLUS ION..........................................................................................................................................58
Fig.1 Steps for the participatory process ............................................................................................... 17
Fig. 2 Illustrations of rill survey sampling plots along transects at catchment scale.................................. 20
Fig. 3 Layout of stone terraces ............................................................................................................. 21
Fig. 4 Rain gauge and calibrated cylinder used for rainfall measurement ................................................ 22
Fig. 5. Cumulative daily rainfall distribution (July- August 2008) at different sites within Angereb watershed ................................................................................................................................... 23
Fig. 6 Spatial and temporal classification of indicators categorized for farmers‟ knowledge and capacity . 26
Fig. 7 Classification of local erosion indicators ..................................................................................... 26
Fig. 8 Accumulation of sediment behind erosion control structures ........................................................ 27
Fig. 9 Erosion underneath the terrace structure due to tillage ................................................................. 28
Fig. 10 Evidences of tillage erosion underneath stone structures ............................................................ 29
Fig. 11 Runoff erosion due to traditional ditches inside farms ................................................................ 29
Fig. 12 The change in gradient of ditches along the longitudinal section of the ditch ............................... 30
Fig. 13 Crop yield variability over slope length in the inter-terrace area (Gizaw, unpublished) ................. 31
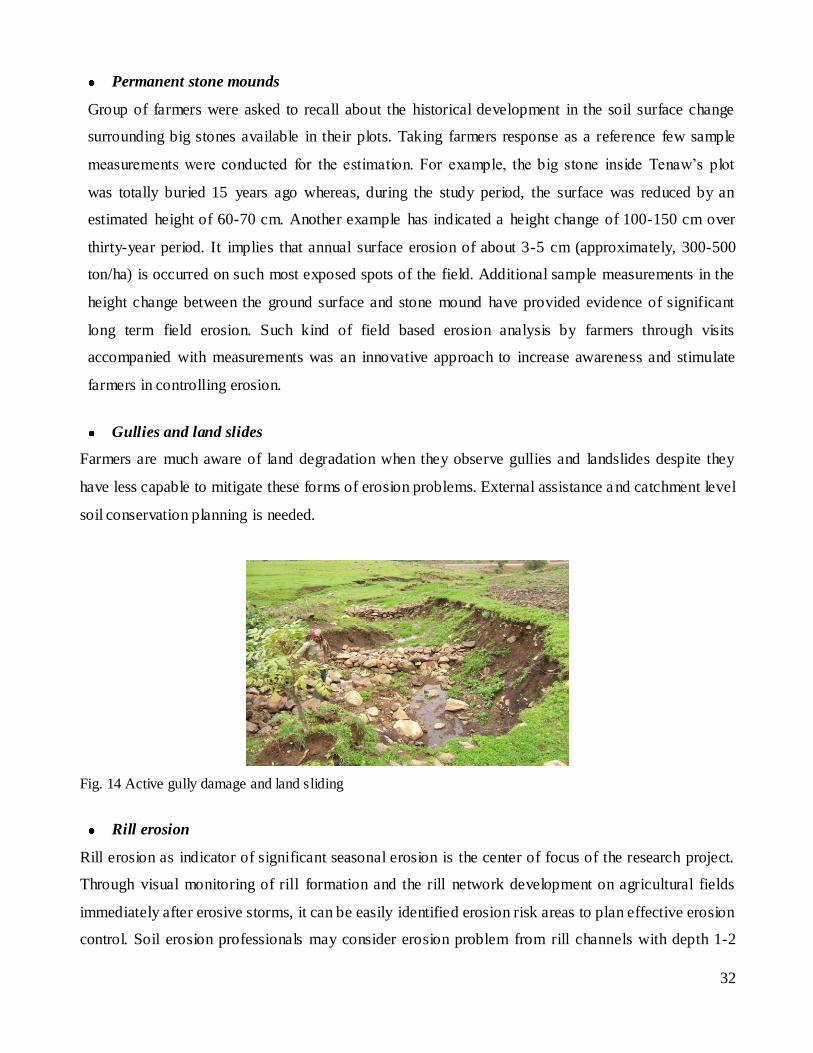
Fig. 14 Active gully damage and land sliding ....................................................................................... 32
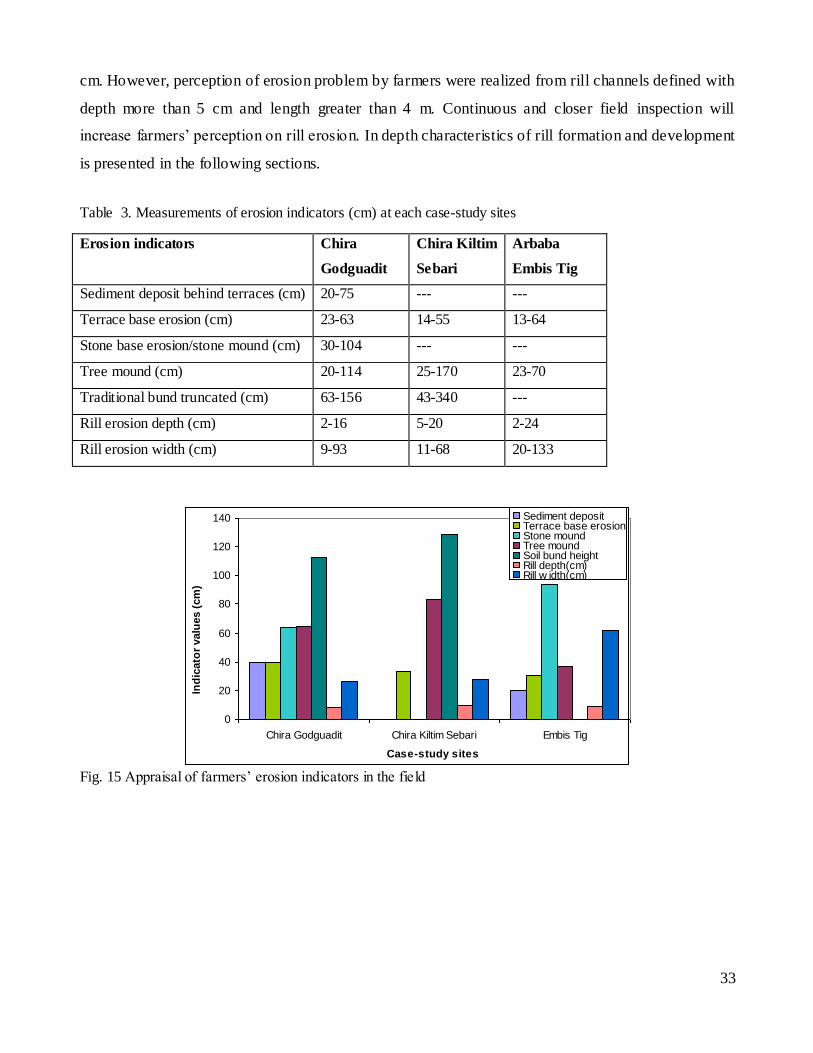
Fig. 15 Appraisal of farmers‟ erosion indicators in the field ................................................................... 33
Fig. 16 View of case-study catchments: Godguadit (top), Kiltimsebari (middle) and Embestig (bottom) ... 36
Fig. 17 Rill cross-section and rill density along the topo-sequence at the study catchments ...................... 38
Fig. 18 Characteristics of rill erosion related to slope shapes (Source: SCRP Andit Tid data base) ........... 39
Fig. 19 Cross sectional rill erosion and rill density on landscape positions and on intra-terrace area. ........ 41
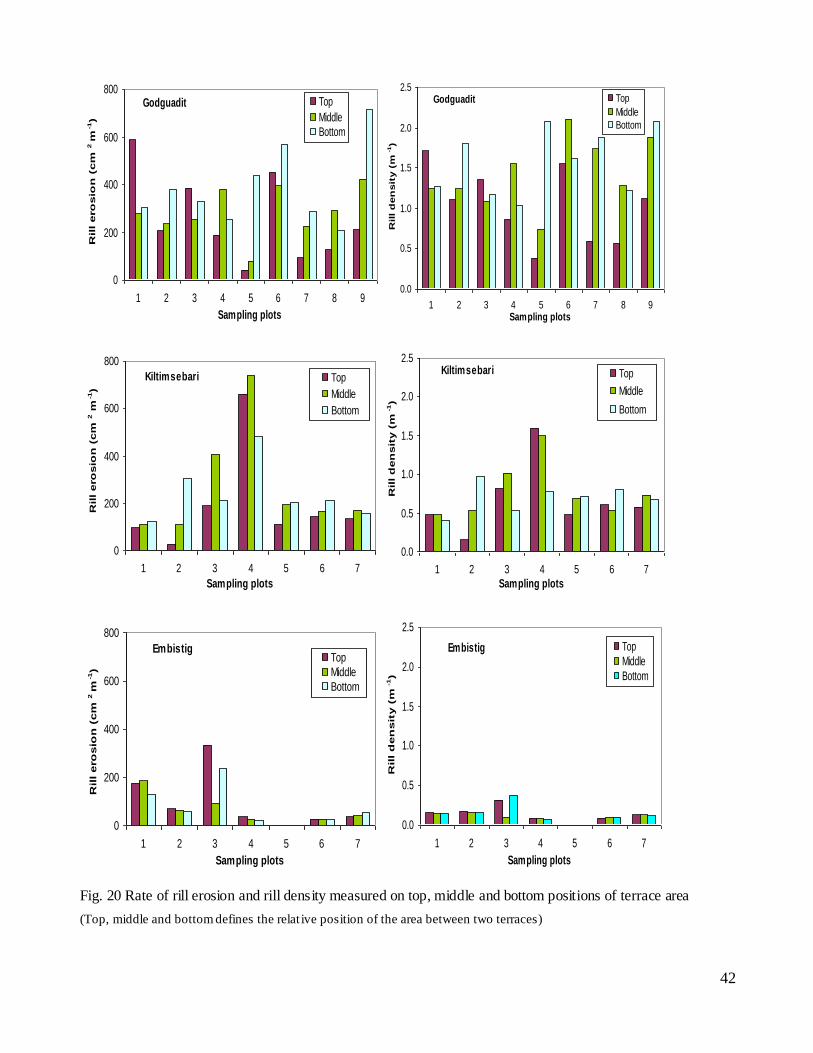
Fig. 20 Rate of rill erosion and rill density measured on top, middle and bottom positions of terrace area . 42
Fig. 21 Temporal variation of rill erosion and rill density measured in July to August, 2008 .................... 43
Fig. 22 Unstable and damaged stone terraces due to tillage of the terrace base on steep slopes ................. 46
Fig. 23 Existing terrace height (top) and cross-section (bottom) in relation to the design specification (shaded part) ............................................................................................................................... 47
Fig. 24 Existing terrace spacing and vertical interval (top) and design spacing at different soil depths (bottom) ..................................................................................................................................... 48
Fig. 25 Unacceptable range of terrace spacing (shaded range) from farmers‟ perspective ......................... 50
Fig. 26 Improved terrace structures using trenches ................................................................................ 53
Fig. 27 Improved terrace structures using high value spice plants ........................................................... 53
Fig. 28 Improvement on the cross section of terrace structures ............................................................... 54
Fig. 29 Old terrace structures shifted downslope ................................................................................... 54
Fig. 30 Series of check dams constructed along path ways..................................................................... 55
iv
Abbreviations
ACED Assessment of Current Erosion Indicators
REAM Rill Erosion Assessment Method
ARARI Amhara Region Agricultural Research Institute
CDE Center for Development and Environment
CEP Community Empowerment Program
EGS Employment Generation Schemes
ESAPP Eastern and Southern Africa Partnership Program
FFW Food-For-Work
FINNIDA Finnish International Development Agency
FPEESCP Farmers‟ Participatory Erosion Evaluation and Soil Conservation Planning
ILDP Integrated Livestock Development Project
ITCZ Inter-Tropical Convergence Zone
LLPPA Local Level Participatory Planning Approaches
MOARD Ministry of Agriculture and Rural Development
NGO Non-Governmental Organizations
PADETS Participatory Demonstration, Extension and Training System
PLUPI Participatory Land Use Planning and Implementation
PRA Participatory Rural Appraisal
SIDA Swedish International Development Agency
SLM Sustainable Land Management
SWC Soil and water Conservation
WFP World Food Program
v
Acknowledgments
This technical report is based on the research project at Angereb watershed which was financed by
Center for Development and Environment (CDE) through the East and Southern Africa Partnership
Programme (ESAPP). I would like to express my deepest gratitude to the CDE/ESAPP for financially
supporting the project. My special thanks are due to Prof. Dr. Hans Hurni for his comments in the
preparation of the project and during my field work. I would like to express our deepest gratitude to
the participant farmers in the study area who actively participated in the process, contributed
innovative ideas, and for allowing us to carry out different measurements on their crop fields. Special
thanks also go to the development agents, especially to Serkalem Abebe, and kebele administration in
the study sites who played a facilitating role in motivating, organizing and follow up of the
participatory process. I am also grateful to my institute, Amhara Region Agricultural Research
Institute (ARARI) and Debre Birhan Agricultural Research Center for the provision of the facilities to
conduct the field work and for the support in the administration of the project. I also enjoyed the
support in many ways from Gondar Agricultural Research Center, Integrated Livestock Development
Project (ILDP), and North Gondar Department of Agriculture and Rural Development while
conducting the field work.
1
1. Introduction
Given the central importance of agriculture in the economic development strategy of the country, any
deterioration in land resources poses serious consequences for Ethiopia‟s future sustainable economic
development. Small-scale agriculture is the dominant sector in the economy of Ethiopia. However, it
has become clear in Ethiopia that land use has gone contrary to the cause for its conservation. Land
degradation has become a widespread phenomenon particularly in mountainous agricultural lands. A
major environmental hazard associated with agricultural production in these ecosystems is soil
erosion. Rapid population growth and economic needs push farmers to cultivate steeper and more
fragile lands, resulting in an annual loss of 1 billion tons of top soil lost per year (Tefetro 1999). As a
consequence, farm productivity is reduced to 1 to 3 % (Mitiku, et al, 2006). A certain level of
environmental degradation is inevitable however; the critical issue is to ensure that the level of
resource use remains consistent with society‟s development objectives. There are many reasons why
soil degradation still occurs. Accelerated soil erosion induced by unlimited human activities is one of
the reasons for widespread land degradation. Combating land degradation and investing in the soil
conservation for future generations will be a major development task promot ing sustainable land
management. What is required is a holistic approach for planning, development and management of
the land which methodically identifies human and environmental needs.
1.1 Problems of Soil Erosion
Soil erosion is a serious threat for environmental degradation in the mountainous landscape of the
highlands of Ethiopia in both its economic costs and the areas affected. The hill slopes are under
cultivation without using control measures and appropriate land management practices that result in
low productivity, physical and ecological degradation. This part of the land increasingly experiences
high pressure for agricultural production. Soil conservation and management practices do not
correspond to the activities imposed on these land units. Poor land and water management practices
and lack of effective planning and implementation approaches for conservation are responsible for
accelerating degradation on agricultural lands and siltation of lakes, dams and reservoirs downstream.
Mismanagement of the land is blamed on the land users themselves by assuming lack of their
environmental awareness, ignorance or lack of responsibility due to the fact that they cultivate the
2
land for immediate livelihood goals. Thus, from the beginning one has searched for external solutions
and technologies that could help to stop erosion in Ethiopia (Yohannes and Herweg, 2000).
Accordingly, the SWC approaches were established in account of the above assumptions.
1.2 SWC Efforts and Limitations
The transfer and adoption of the promoted SWC technologies remained low (Hurni, 1984; Million,
1996; Herwege and Lude, 1999; Bewket and Sterk, 2002; Mitiku, et al, 2006). According to Mitiku
(2006) the list of reasons for low transfer and adoption by farmers are: the top-down approach in
extension activities, standard soil and water conservation technologies, lack of awareness of land
degradation by the land users, and land security issues. Yohannes and Herweg (2000) described the
limitations of the existing extension approaches and clearly indicated the need for an improved SWC
approach. The experience with the food-for-work approach and introduced SWC technologies shows
that the existing extension system has largely over-simplified the complexity of natural and human
settings and the interrelation of the biophysical and socio-economic issues. The authors concluded
that ignoring land users knowledge to cope with their own problems was one of the reasons for this
failure. Similarly Hurni (1986) indicated that introduced measures did not draw adequately on the
accumulated and specific knowledge of which farmers have. Great attention was not given to the area
specific soil erosion process based conservation measures before introducing large scale SWC
programme to Ethiopia. Systematic approaches through local problem identification were missing and
this has resulted in much lower impacts than expected. Ineffectiveness of SWC structures perceived
by farmers was an important factor discouraging farmers from participating in SWC activities
(Bewket, 2003).
Most of the SWC activities were designed using top-down approach. Since the implementation was
through the food-for-work and currently through safety net programs, the approach has contributed to
the dependency of farmers on government institutions and particularly on SWC extension program for
the planning and implementation of conservation measures on their own lands. The previous
conservation activities often failed to address such questions as:
3
What do the local farmers consider? Lacks to participate farmers and include their preferences
What are the local erosion indicators and appropriate SWC practices from farmers‟ perspective?
Important farmers‟ erosion indicators and suitable practices with respect to farmers‟ knowledge
and skill were missed to account in the planning and implementation process.
To what extent the local erosion indicators and related causes taken into account to evaluate
erosion and plan for SWC? This implies the method of technology development and verification
was not based on local erosion and runoff assessments and suitable techniques to control it.
These questions had to be answered to help to design appropriate and sustainable erosion controlling
strategies and approaches.
1.3 Research Problems and Questions
Low performance and adoption of SWC measures is the problem targeted to solve in the study. This
problem is emerged mainly due to the lack of consideration to area specific erosion process based
conservation technologies and knowledge and experience of farmers in the SWC extension system.
Systematic integration of both the socio-economic factors (knowledge, attitude and preference of
farmers) and technological requirements and characteristics is therefore needed.
The research questions:
1. What is the efficiency of existing SWC measures to control rill formation?
2. What SWC improvements are needed?
3. What are farmers‟ indicators to assess erosion risk and plan for SWC?
4. Do farmers perceive rill erosion as simple indicator of erosion and best represent farmer s‟
perspective?
5. Do rills used to evaluate erosion prone areas and indicate where to plan control measures?
1.4 Importance of the Research
SWC technologies that fit well to the local biophysical and social conditions and acceptable by
farmers are highly demanded. An appraisal of different soil conservation technologies must therefore
take into account not only the technological means involved but also the approaches that are supposed
to grant successful implementation of measures, the socio-economic environment, markets,
4
infrastructure, extension and other services, and the socio-cultural structures (Mitiku, et al, 2006). To
achieve this at small-holder farm level, there is a need for an understanding of specific land resources
degradation factors and indicators, and farmers‟ decision-making capacity, and how is the farmers‟
reaction to respective indicators in planning management options. Linking the farmers perspectives
and field erosion indicators can facilitate a farmer-participatory erosion research, evaluation, and
conservation planning and implementation, aiding to replace top–down approaches by bottom–up and
increase genuine participation to enhance adaptation of conservation technologies for sustainable land
management (SLM). It is most likely to improve the transfer and efficiency of SWC measures. In this
way compromisation of field level ecological and economic objectives of individual farmers can also
be achieved.
Planning and implementation of SWC measures ought to be undertaken through farmer-participatory
processes to ensure its sustainable adoption on the farm. Most soil and water conservation planning
approaches relied on empirical assessment methods by experts and hardly consider farmers‟
knowledge of soil erosion processes. Farmers‟ knowledge of on-site erosion indicators can be useful
in assessing the site-specific erosion risk before planning any conservation measures. Consequently,
wide scale adoption of farmers‟ erosion indicators in evaluating the soil erosion risk and existing
control measures may be a rational approach by which land-users undertake self evaluation of erosion
status on their own farms. Taking such an approach reinforces the realism of how farmers perceive
their interests, how they understand the way erosion impacts on their lives, and how they value the
costs and benefits of any measures of conservation that may be promoted. Such an approach is also
expected to facilitate the acceptance, transfer and application of technical findings and
recommendations. By this way, they would probably get convinced to adapt and/or implement
conservation technologies without external enforcement. According to Mitiku et al (2006) one
element of SLM, establishing processes for improved and more straightforward adaptation of
technological knowledge and increasing the testing of technologies, can be met by increasing farmers
knowledge on practical field erosion and sustainable land management. The process needs to address
different issues such as unsustainable production systems, SLM options, economical and
environmental impacts of land degradation, etc.
The development of this project was inspired by the fact that farmers have continued to cultivate
marginal and steep slopes for their subsistence living without the application of sustainable land
5
management practices. The study therefore focused to solve the problems of SWC technology transfer
and adoption by farmers in order to reduce the challenge of small holder farmers and the pressure on
this part of the land use system. This can be achieved by sharing and upgrading the practical oriented
knowledge of the land users on erosion processes and causes, and sustainable land management
interventions. Different strategies were employed that support to build farmers self confidence and
enhance their knowledge and awareness. Frequent group and individual field visits and subsequent
discussions to reach a consensus in order to identify and determine erosion indicators and causes as
well as to evaluate applied measures; farm erosion survey; estimation of soil loss retained on
conservation structures; and group meeting and discussions on issues of erosion phenomenon and land
management practices are the strategies followed. Special attention was paid to facilitating the land
users to identify and analyze their farm erosion problems, causes and corrective measures by
themselves. Using the new approach the land users enable to gain practical knowledge relevant for
decision making to adopt and innovate SWC technologies. They able to identify critical erosion
indicators, related causes and impacts; determine the critical erosion risk areas; evaluate the potentials
and limitations of existing soil conservation technologies; plan and implement locally suitable soil and
water conservation measures.
1.5 Research Objectives
Eventually, the project aimed to develop applicable erosion assessment and then conservation
planning approach using farmers‟ erosion indicators that can serve as a tool to evaluate erosion risk
and the efficiency of applied erosion control measures; and to plan soil and water conservation.
Specific objectives
1. To identify critical rill erosion areas and assess their causes
2. To design appropriate measures to reduce severity of rill erosion and test possible solutions
together with farmers on their fields
3. To develop guideline for SWC improvements using local erosion indicator assessment
methods based on field case studies
4. To prepare and publish a booklet (in Amharic and English) for extension agents jointly with
staff of CDE
6
2. Application of Rill Erosion Processes for SWC Planning
Failures in SWC suggest that more detailed information should be used for appropriate layout and
design of SWC measures – particularly where run on and erosion occur – what type of SWC is
needed, and exactly where. It is also suggested that the performance of SWC should be better
monitored over time. Rills and gullies indicate critical locations of a slope section, because runoff
concentration is high. Knowing the critical locations of a slope means being able to minimize the risk
of irreversible damage, to avoid failure with SWC, and thus to make it more efficient (Herweg and
Stillhardt, 1999). For a specific area, it is therefore necessary to consider where, and how to start soil
and water conservation. As a principle of erosion control, physical soil conservation measures should
be built on critical locations where rills start to occur.
During severe rainfall, overland flow concentrates and after crossing a threshold value causes rill
development resulting in high erosion rates (Rejman and Brodowski, 2005). This is the stage of rill
erosion, leading gradually to gully erosion. Rill erosion is geomorphologically significant because
runoff reaches its maximum detachment and transportation power when channeled into rills (Torri et
al., 1987). Rills are generally defined as flow channels that can be obliterated by tillage. Rills are used
to describe small forms of linear erosion, which result from hydraulic erosion by overland flow. Rills
are visible and noticeable linear erosion features easily identifiable by farmers (Herwege, 1996).
These processes of erosion would enable to assess spatial erosion development and identify the
critical locations of erosion along the slope profile. In order to identify erosion prone areas to plan a
control measure rills are simple and good indicators. The study made by Bewket and Sterk (2003)
indicates that the rill survey approach gives good semi-quantitative information on soil erosion in real
life situations of diverse farming and land use practices in a quick and inexpensive way. Thus, it is
commendable for practical conservation-oriented soil erosion assessment purposes.
Traditionally, soil erosion processes by water have been estimated using runoff plot measurements
and a wide range of erosion models. Because of lack of appropriate approaches to assess and evaluate
soil erosion and soil degradation, the land-use planners in most countries have adopted
recommendations that are based on modeling approaches that are not fitted to the local conditions.
Consequently, current estimates of soil erosion have been subjective and have not enabled extension
agents (or policy planners) to correctly estimate soil erosion and to accurately design cost-effective
Fig. 25 Unacceptable range of terrace spacing (shaded range) from farmers‟ perspective
In the same manner the cross section (height and width) of terraces has to be evaluated by farmers and
determined from their perspectives. Farmers have viewed the cross section from the point of stability
of construction material and labor availability to construct. Stone terraces were less preferable by
farmers mainly due to maintenance and labor cost aspects. Farmers low acceptance to stone terraces
can be an opportunity to promote integrated measures with biological materials which are more
environmental feasible and economically viable. Gradual accumulation of sediments behind terrace
structures can be retained with the support of biological materials because when the sediment
accumulates further the plants grow simultaneously.
51
Land occupied by terraces per hectare is about 15 % when terrace implementation was done based on
the mentioned guideline. It was estimated about 500 kg per hectare yield loss due to the area occupied
by terraces compared to 16 kg ha-1 under existing condition. There was an additional labor incurred
due to extensive terracing while the yield loss due to soil erosion was expected to be reduced to
tolerable level. More investigation is thus required from farmers‟ perspective by briefing the detail
technical considerations in the design and layout of terraces so that they will able to set a decision
system from an economic and ecological point of view. To see how effective the technical feasibility
of terraces an economic and ecological impact analysis of terraces is also necessary. Comparative
analysis has to be made for this purpose using simple measurable indicators such as soil loss, land
fragmentation, environmental changes, crop yield, land occupied by terraces and so on.
5.6.3 Farmers’ assessment of stone terraces
It was difficult for the farmers to realize the full benefits of soil conservation using terracing. Farmers
asserted that it was difficult to conclude that soil erosion was controlled after their field treated with
terraces. Farmers perceived the benefit of terracing. Their assessment criteria were mainly related to
the immediate benefit of terracing and the utility brought about by the retained sed iment; and the
expenses incurred for establishment and maintenance. Crop yield benefits, the amount of labor and
capital invested, and areas occupied by the structures, were the commonly indicated assessment
indicators by farmers. On fields treated with stone terraces, farmers pointed out that they noticed crop
yield reduction year after year and between upper and lower terrace sections. They said that the lower
was more productive than the upper terrace section. The choice of conservation measures was set
depending upon the area occupied and amount of labor required. The points below, often listed as
reasons for the failure of conservation measures (technological limitations), were some of the short
term assessment indicators explained by farmers.
High labor for construction and maintenance.
Considerable area occupied by terraces.
Narrow spacing for farming operations.
Lack of construction materials.
While using these local indicators, farmers did not give necessary attention to ecological sustainability
indicators. If a given conservation measure to be effective, it has to be measured in terms of both
economic and ecological indicators.
52
5.7 Improvements on Soil Conservation Measures
The major focus of the participatory learning and action approach is to mot ivate and realize farmers‟
experiences and attitudes on the erosion processes, causes and impacts of soil erosion in order to
increase the effectiveness of conservation measures. Once the farmers understood and analyzed the
erosion problems at field and landscape units through local indicators and the limitations of existing
conservation measures, they are asked to implement improvements that fit to their farming system and
are affordable. These improvements are designed to solve wide terrace spacing and un-stabilized
terrace cross sections, and minimize the identified causes and indicators of erosion like rill erosion,
ditch erosion, gullies, and others. Terraces can be effective if and only if they are used in combination
with other conservation measures. Through continuous field visits and on-site discussions land users
can explore possible improvement options and new techniques. There are some successes recorded in
improving the effectiveness of existing terraces in the case-study sites. More interestingly, some
innovative farmers establish homestead demonstration plots for different soil fertility management
measures which will help to motivate adjacent land holders. List of improvement options currently
practiced by the farmers are described and illustrated below.
Trenches along terrace lines
Modified trenches (dimension is modified to fit to the plot slope and terrace conditions) are
constructed to retain the runoff water and sediment from the terrace area (Fig. 26). It substitutes
graded runoff storage basins or channels. The modified trench improves the terrace and gives multi-
function:
Retain the excess runoff water which otherwise overtops the terrace and cause damage to the
structure and to down slope plots;
Avoid sediment loss and off-site damage on side waterways and adjacent plots from excess
drainage water from terrace channels;
Retain sediment eroded from terrace area;
Increase the amount of water goes to infiltration by reducing the overland runoff component;
Increase available soil moisture during terminal drought and thus improves productivity of
crops cultivated below the terrace structure;
Increase the interflow and in the long term it might improve recharging;
Use for compost preparation from weeds and other shrub species collected during cultivation
period;
53
Fig. 26 Improved terrace structures using trenches
Value-added plantations
Free grazing is the challenge to promote multi-purpose tree plantation and biological conservation
measures on terrace structures. Despite the grazing problem, in addition to local shrubs naturally
grown along terrace structures, currently some farmers adapt some value-added plantations such as
tena adam (Fig. 27) and grass pea and weeds for feed that fit into the annual cropping system, and
chibha tree plantation.
Fig. 27 Improved terrace structures using high value spice plants
Improvements in the top terrace section
Damage to stone terraces due to instable cross sections is common. It is also difficult to maintain or
improve stone terraces on steep slopes by adding more stones on top of it. Improvements are made on
the top cross section of the terrace structure. The height of structures on the top side is limited up to
the ground surface while the bottom riser height is increased to retain maximum sediments. This type
of improvements increases structural stability and does not liable to mechanical damage. The inclined
top cross section of the structure is developed through time by adding soil and local vegetation when
the storage capacity is filled up by eroded sediments.
54
Fig. 28 Improvement on the cross section of terrace structures
Shifting terrace position
Shifting terraces upward or down ward within an interval of 4-5 years is common farmers‟ practice in
the highlands. The farmers‟ reasoning to do this practice is that the deposited soil on the previous
terrace structure is presumed to be fertile in comparison to the soil at a distant from the structure. And
hence, crop yield increases when planting this part of land. However, limitations are observed after a
certain period of years. This practice has caused disturbance of the already long deposited soil formed
in the form of bench terrace and then the soil washed further down slope.
Fig. 29 Old terrace structures moved down slope
Check dam construction along water ways and gullies
Farmers have been constructing check dams on erosion risk waterways, foot paths and gullies.
Farmers try to quantify sediments retained in the check dams every rainfall storms and during the
whole season in order to increase their awareness about soil and nutrient loss from farm plots.
55
Fig. 30 Series of check dams constructed along path ways
Avoiding traditional ditches
Small trench like pits inside farm plots are discussed as options to substitute trad itional ditches to
control erosion upon lower section of plots and retain overland flow within the site. This minimizes
soil loss by ditches and reduces the area lost by drainage ditches.
While improving existing soil conservation measures at field and landscape levels, some of the
measures need careful collective decision and due emphasis during the implementation period.
i. Improving old and completely sediment filled stone terraces on steep slopes
Raise questions like: if maintenance is carried out at the original position does it control erosion
effectively? Is it not difficult to do continuous maintenance? When the stone terrace height is very
high, it is liable to damage and the runoff overtopping the structure cause severe erosion at the
bottom of the terrace structure.
If the terrace structure is removed and shifted to the upward or down ward position, the
accumulated sediments can easily wash away.
Thus, it is very important to discuss the advantages and disadvantages of maintaining stone
terraces on steep slopes to come up with effective solution
ii. Constructing cutoff drains
Cutoff drains are only required when inflow runoff is very high, otherwise it results in severe
damage when there is failure in the proper construction.
It is always advisable to integrate and support the cutoff drain with biological measures.
Cutoff drains are often the main source of conflict between farm owners in the topo-sequence. It is
therefore essential to agree on the layout of drains with the presence of all concerned land owners.
56
iii. Constructing new terrace structures
Terrace spacing is decided with the agreement of the land owner and it is in such away that rill
formation and development is avoided.
The upper and lower side height of terraces should not be necessarily equal on steep slopes in
order to retain washed sediments due to sheet erosion and to increase structural stability.
In order to increase the annual sediment storage capacity of terraces as well as to protect erosion
damage to down slope area it is highly recommended for integrating physical structures with
biological ones.
iv. Constructing traditional ditches
The first and foremost advice regarding to traditional ditches is to protect the generation of
concentrated runoff inside the field. If feasible replace with other in situ drain systems to control
soil erosion within the field plots.
Through past experiences on how the gradient affects runoff concentration and erosion in the ditch
system, improve the gradient without causing damage.
Care must be taken to avoid formation of gullies and terrace damage at the outlet of ditches.
v. Promoting improved land management systems
As a result of continuous cultivation and erosion problems most of the marginal lands on steep
slopes are degraded and unable to produce subsistence crop yields. It is better to change to other
land use systems that benefit the farmer economically and bring sustainable natural resources.
Since tillage frequency is one cause for accelerated erosion it is advisable to practice minimum
tillage techniques and strip cropping, and cultivate crops which need less frequent tillage
management.
Change in practices of farmers
Since the start of the research project farmers assessed erosion problems and accordingly planned
suitable erosion control measures on individual plots through consensus. Apart from the usual and
commonly available soil conservation measures in the area the above improvement options were
practiced in the project period. During the first year, some of the improvement options such as
trenches, plantation of high value plant species and modification of traditional ditches were only
observed on innovative farmer plots which need further commitment and follow up to scale up at the
landscape and catchment scales. In the first year, construction of trenches along the terraces was
practiced only by one farmer, while this practice was scaled out to additional nine farmers in the
57
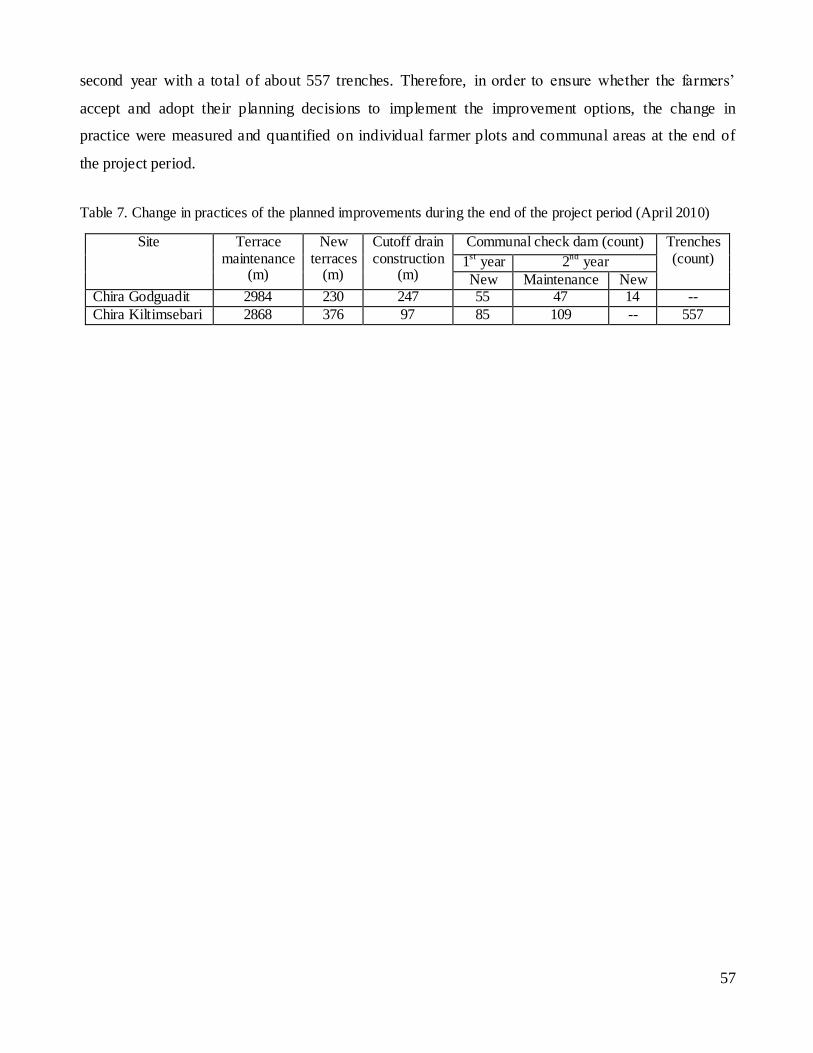
second year with a total of about 557 trenches. Therefore, in order to ensure whether the farmers‟
accept and adopt their planning decisions to implement the improvement options, the change in
practice were measured and quantified on individual farmer plots and communal areas at the end of
the project period.
Table 7. Change in practices of the planned improvements during the end of the project period (April 2010)
Site Terrace maintenance
(m)
New terraces
(m)
Cutoff drain construction
(m)
Communal check dam (count) Trenches (count) 1
st year 2
nd year
New Maintenance New Chira Godguadit 2984 230 247 55 47 14 --
Chira Kiltimsebari 2868 376 97 85 109 -- 557
58
6. Summary and Conclusion
Small holder farmers under the crop- livestock farming system usually manage their land plots for
short-term maximization of benefits rather than with a longer-term perspective of sustainable land
management. This means that they miss out on the longer-term benefits of environmental services. It
is thus essential that farmers and local planners in land management develop greater awareness about
the natural environments. In the highlands of Ethiopia, many soil conservation measures were
implemented to tackle soil erosion and land degradation but are not fitted to the farming system and
eventually less adopted by farmers. Less attention to local erosion assessment based conservation
approaches and lack of assessment of aspects that represent farmers‟ perspective are often indicated
reasons for the failure of soil conservation programs. Agricultural lands are exposed to soil erosion
because it experiences frequent tillage before and during the start of the rainy season annually. Given
such soil management practices rill formation is the predominant form of erosion which constitutes
about 13-60 t ha-1 (or 60-170 m3 ha-1), and without effective control measures it developed into gullies
and to severe land degradation. Therefore, there is a need for understanding the characteristics of local
specific rill formation and its development on different sets of environmental and land management
factors through interactive and participators approaches with farmers.
One important form of erosion assessment is from direct field measurement of erosion features consist
of rills. Rills are simple to identify by farmers in order to use as an indicator to control erosion on
their fields. It is in this smallest hydrological unit on the most upstream part of the river network
system that erosion takes place that lead to degradation of upper catchments and siltation of water
reservoirs. Thus erosion assessment at the scale of rill channels can be tak en as the basis for the
planning and design of erosion control strategies at any larger scale down the channel.
The low efficiency of stone terraces to control rill formation brings about 10 to 46 % biomass yield
reduction on top terrace area compared to bottom position. There was a general pattern of rill erosion
increase with slope length between terraces. Rill formation and rill development over the topo-
sequence has revealed the local specificity of erosion. The presence of conservation terraces, drainage
ditches, field boundaries, foot paths and waterways inside the catchment have also played great role
for the longitudinal rill development either by dissipating runoff energy or as sources of concentrated
runoff. These are detrimental factors for rill formation and development at individual field as well as
landscape scales which clearly indicates the role of land users‟ intervention. Individual farmer‟s
59
decision on the design and layout of terraces and land management practices in their own field
determined the spatial rill formation and development within terrace area. An integrated effect of
individual farmer‟s land management decision, and communal land use and sources of conflicts in the
management of runoff water determined rill formation and deve lopment on topo-sequence of the
landscape.
The methodology as well as the approach described here has provided positive impacts on the local
knowledge and attitude of farmers such that it is widely explored and utilized, and to be integrated
with technical solutions. In addition, the farmers have been empowered through the ownership of the
erosion assessment, planning of conservation measures and implementing processes. Action plans
developed by farmers through participatory learning and action become the means by which locally
suitable and cost effective soil conservation measures are improved, promoted and widely adopted. It
also brings an impact in generating innovative practices, minimizing sense of dependency, targeting
on sustainable land management options, and understanding the importance of seasonal effects of
tillage, sheet and rill erosion for long term land degradation.
The results of an interactive erosion evaluation and soil conservation planning exercise brought the
common understanding by the involving farmers of what needs to be done by them, where, for what
purpose and with what end in mind. This is in order that erosion problem issues can be tackled and
overcome by themselves, when supported and motivated by experts. By focusing erosion assessment
and evaluation at farmers level, improved soil conservation planning that match with the local
capacity will be developed that have direct relevance and application to sustainable land management
activities at grass roots level. In this way, it will be possible to establish farmers‟ team who are
responsible to assess and evaluate local erosion and plan for its control.
In summary the main strength of the participatory erosion assessment and evaluation approach as well
as rill erosion based assessment method by farmers is that it incorporates a grass roots level
knowledge and experience, as opposed to the typical top-down design and planning. Eventually, this
erosion assessment method using rill erosion indicator and local farmers‟ participatory approach can
be adopted at wider scale by developing working guideline in order to strengthen and support the
existing soil conservation extension service.
60
7. References
Bewket Weldeamlak, and Sterk, G., 2003. Assessment of soil erosion in cultivated fields using a survey
methodology for rills in the Chemoga watershed, Ethiopia. Agriculture, Ecosystems and Environment 97: 81–93
Birru, Y., 2007. Land Degradation and options for sustainable land management in the Lake Tana Basin (LTB), Amhara Region, Ethiopia. PhD Thesis, Centre for Development (CDE), University of Bern.
Carucci, V., 2000. Guidelines on water harvesting and soil conservation for moisture deficit areas in Ethiopia: the productive use of water and soil. Manual for trainers‟ first draft. Addis Ababa, November 2000.
Gime´nez, R., and Govers, G., 2002. Flow Detachment by Concentrated Flow on Smooth and Irregular Beds. Soil Sci. Soc. Am. J. 66:1475-1483
Herwege, K., 1996. Field manual for: Assessment of current erosion damage. Soil Conservation Research Programme, Ethiopia and Centre for Development and Environment, University of Berne, Switzerland.
Herweg, K. and Lude, E., 1999. The performance of selected soil and water conservation measures- case studies from Ethiopia and Eritrea. Catena 36.
Herwege, K. and Stillhardt, B., 1999. The variability of soil erosion in the highlands of Ethiopia and Eirterea. Average and extreme erosion rates. SCRP, Research Report 42. University of Bern, Switzerland in Association with MOA, Ethiopia.
Hurni, H., 1984. Soil conservation research project Ethiopia, Vol. 4, Third progress report (1981), University Bern and United Nations University.
Hurni, H., 1986. Guidelines for development agents on soil conservation in Ethiopia. CFSCDD, MOA, Addis Ababa.
Kilewe, A. M., 1986. Measurement and Prediction of soil erosion in Kiambu and Muranga Districts of Kenya. National Environmental Secretariat Publication, Nairobi.
Lakew Desta, Carucci, V., Asrat Wendem-Agegnehu and Yitayew Abebe (eds), 2005. Community Based Participatory Watershed Development: A Guideline (Part 1 and Part 2) Ministry of Agriculture and Rural Development (MOARD), Addis Ababa, Ethiopia.
Million, A. 1996. Traditional ditches in North Shewa, Ethiopian highlands. In: Chris Reij, Ian Scoones and Camilla Toulmin (eds). Sustaining the soil: Indigenous soil and water conservation in Africa, London. Pp 156-162
Mitiku, H., Herweg, K., Stillhardt, B., 2006. Sustainable Land Management – A New Approach to Soil and Water Conservation in Ethiopia. Mekelle, Ethiopia: Land Resources Management and Environmental Protection Department, Mekelle University, Bern, Switzerland: CDE, University of Bern, NCCR North-south, 269 pp.
Moore, I.D. and Burch, G.J., 1986. Modelling erosion and deposition: topographic effects. Transactions of the ASAE 29: 1624-1640.
Nyssen J., Poesen, J., Mitiku H., Moeyersons, J. and Deckers, J., 2000. Tillage erosion on slopes with soil conservation structures in the Ethiopian highlands. Soil & Tillage Research 57: 115-127
Rejman, J. and Brodowski, R., 2005. Rill characteristics and sediment transport as a function of slope length during a storm event on loess soil. Earth Surf. Process. Landforms 30: 231-239.
Rieke-Zapp, D. H., and Nearing, M. A., 2005. Slope shape effects on erosion: A Laboratory Study. Soil Sci. Soc. Am. J. 69:1463-1471
Taffa, T., 2002. Soil and water conservation for sustainable agriculture. Mega Publishing Enterprise, CTA Torri, D., Sfalanga, M., Chisci, G., 1987. Threshold conditions for incipient rilling. Catena Supplement 8: 97-
115. Yohannes, G. and Herweg, K., 2000. From indigenous knowledge to participatory technology development.
Centre for Development and Environment (CDE), University of Bern
61
8. Annex
Table A.Field plot characteristics of rill survey fields at case-study catchments
Catchment
Field
plots
Area
(ha)
Slope
(% )
Number
of
terraces
Average
terrace
spacing (m)
Total
length
(m)
Terrace
x-section
(m2)
Slope
position
Chira
Godguadit
1 0.17 40.97 2 15.00 78.00 0.89 Upper
2 0.21 31.41 3 14.50 147.00 0.53 Upper
3 0.30 42.82 4 12.00 147.00 0.73 Upper
4 0.50 37.75 3 17.20 131.00 0.27 Middle
5 0.41 34.04 3 10.00 153.00 0.76 Middle
6 0.06 42.95 2 5.00 47.00 0.59 Middle
7 0.18 38.07 3 14.00 126.00 0.43 Lower
8 0.67 36.92 2 17.00 165.40 0.42 Lower
9 0.06 39.77 2 15.20 22.40 0.79 Lower
Chira
Kiltimsebari
1 0.49 41.00 7 12.75 389.00 0.51 Upper
2 0.26 35.00 3 7.00 169.00 0.54 Upper
3 1.07 47.00 7 13.33 348.00 0.44 Middle
4 0.80 49.00 8 12.83 407.00 0.41 Middle
5 0.60 45.50 5 20.33 282.00 0.45 Middle
6 0.28 52.00 1 18.00 35.00 0.35 Lower
7 0.39 44.70 4 13.00 182.00 0.47 Lower
Arbaba
Embestig
1 0.54 31.25 5 11.63 360.50 0.59 Upper
2 0.54 32.13 3 14.15 222.10 0.54 Upper
3 0.57 25.50 4 11.60 219.30 0.37 Middle
4 0.10 28.20 2 18.20 51.60 0.42 Middle
5 0.06 9.00 1 - 25.00 0.25 Lower
6 0.34 11.80 1 - 59.50 0.44 Lower
7 0.09 22.00 1 - 27.00 0.42 Lower
62
Year 2008
0
10
20
30
40
50
60
70
80
1-Ju
n
8-Ju
n
15-Jun
22-Jun
29-Jun
6-Ju
l
13-Jul
20-Jul
27-Jul
3-Aug
10-A
ug
17-A
ug
24-A
ug
31-A
ug
7-Sep
14-S
ep
21-S
ep
Ra
infa
ll (
mm
)
Figure A. Rainfall pattern at the study catchments during July-August 2008
Figure B. Terraced hillslope exposed with soil erosion hazard