SHRP-S-666 Concrete Bridge Protection and Rehabilitation: Chemical and Physical Techniques Corrosion Inhibitors and Polymers Imad L. A1-Qadi, Brian D. Prowell, Richard E. Weyers, Tapas Dutta, and Harinath Gouru Virginia Polytechnic Institute and State University Neal Berke W.R. Grace Company Strategic Highway Research Program National Research Council Washington, DC 1993
Transcript
SHRP-S-666
Concrete Bridge Protectionand Rehabilitation:
Chemical and Physical Techniques
Corrosion Inhibitors and Polymers
Imad L. A1-Qadi, Brian D. Prowell, Richard E. Weyers, Tapas Dutta, and Harinath GouruVirginia Polytechnic Institute and State University
Neal Berke
W.R. Grace Company
Strategic Highway Research ProgramNational Research Council
Washington, DC 1993
SHRP-S-666Contract C-103
Program Manage:r: Don M. HarriottProject Manager: Joseph F. LamondProduction Editor: Marsha Barrett
Strategic Highway Research ProgramNational Academy of Sciences2101 Constitution Avenue N.W.
Washington, DC 20418
(202) 334-3774
The publication of this report does not necessarily indicate approval or endorsement of the findings, opinions,conclusions, or recommendations either inferred or specifically expressed herein by the National Academy ofSciences, the United States Government, or the American Association of State Highway and TransportationOfficials or its member states.
The research described herein was supported by the Strategic Highway Research Program(SHRP). SHRP is a unit of the National Research Council that was authorized by section128 of the Surface Transportation and Uniform Relocation Assistance Act of 1987.
We wish to acknowledge the help of the Pennsylvania Department of Transportation andthe Virginia Department of Transportation SHRP coordinators, District Bridge Engineersand maintenance personnel who graciously assisted us by providing access to and trafficcontrol for bridge test sites and in the procurement of the polymer impregnated bridge decktest specimens.
5. Laboratory Investigation of Polymer-Impregnated Concrete .............. 53
Introduction 53
Experimental Design 54Impregnation Treatment Process 57Optimizing Drying Temperature 60Analysis of Results 63Drying Temperature Optimization 72Corrosion Activity at Different Drying Temperatures 81Findings and Conclusions 85
Part II: Developing New Techniques: Laboratory Investigation of Corrosion Inhibitors . 87
6. Laboratory Investigation of Corrosion Inhibitors ..................... 89Introduction 89Selection of Corrosion Inhibitors 91
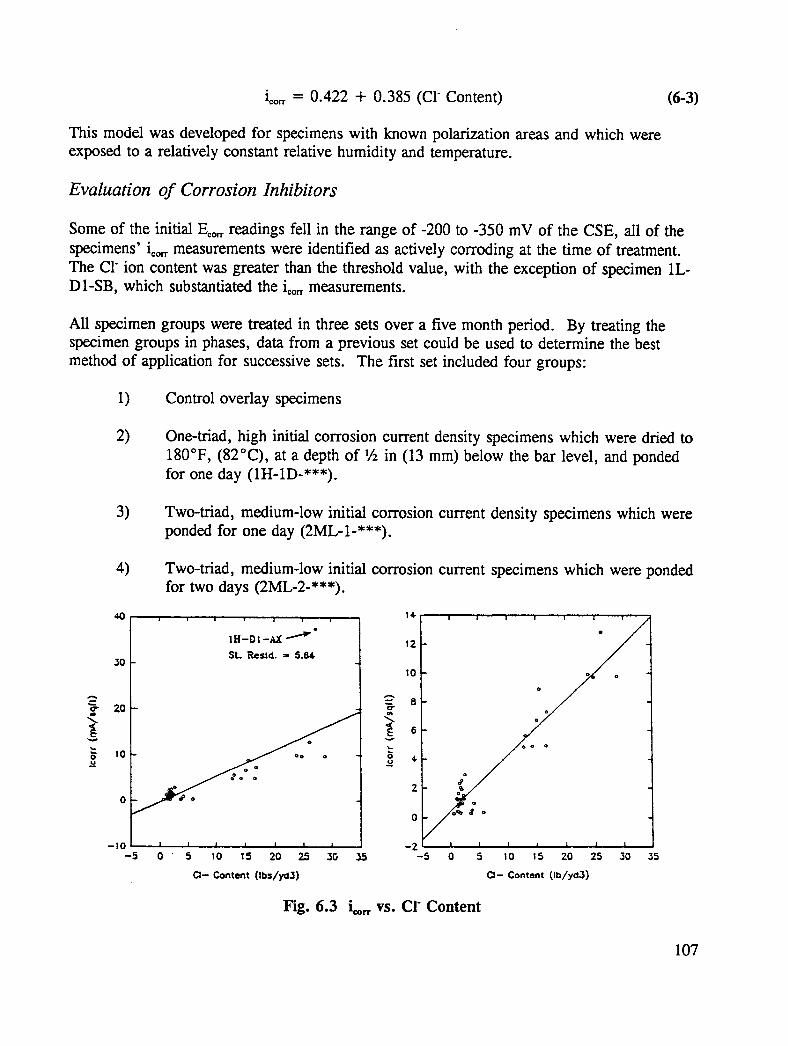
Experimental Design 92Results and Discussion 103
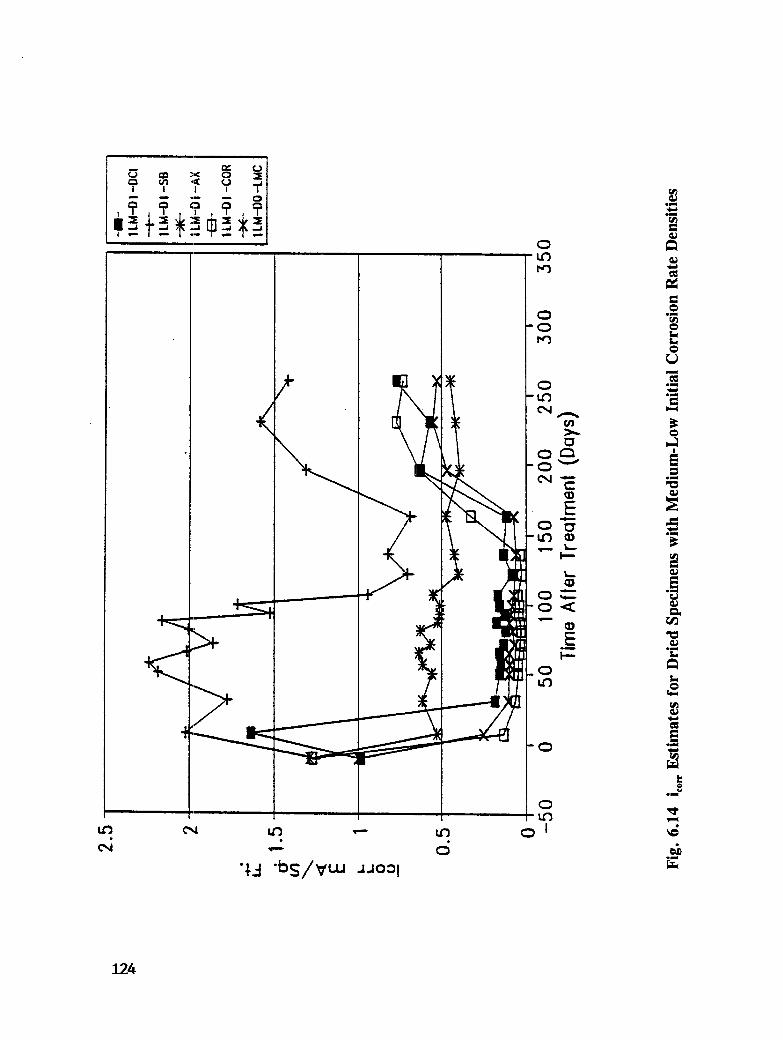
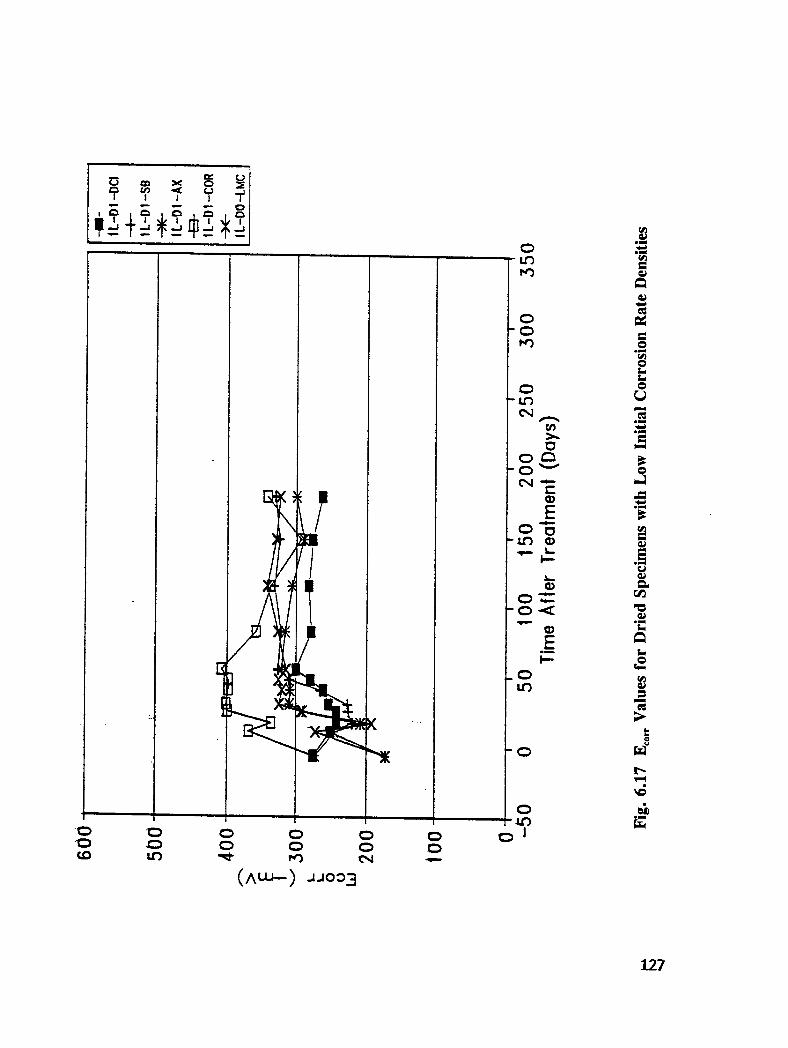
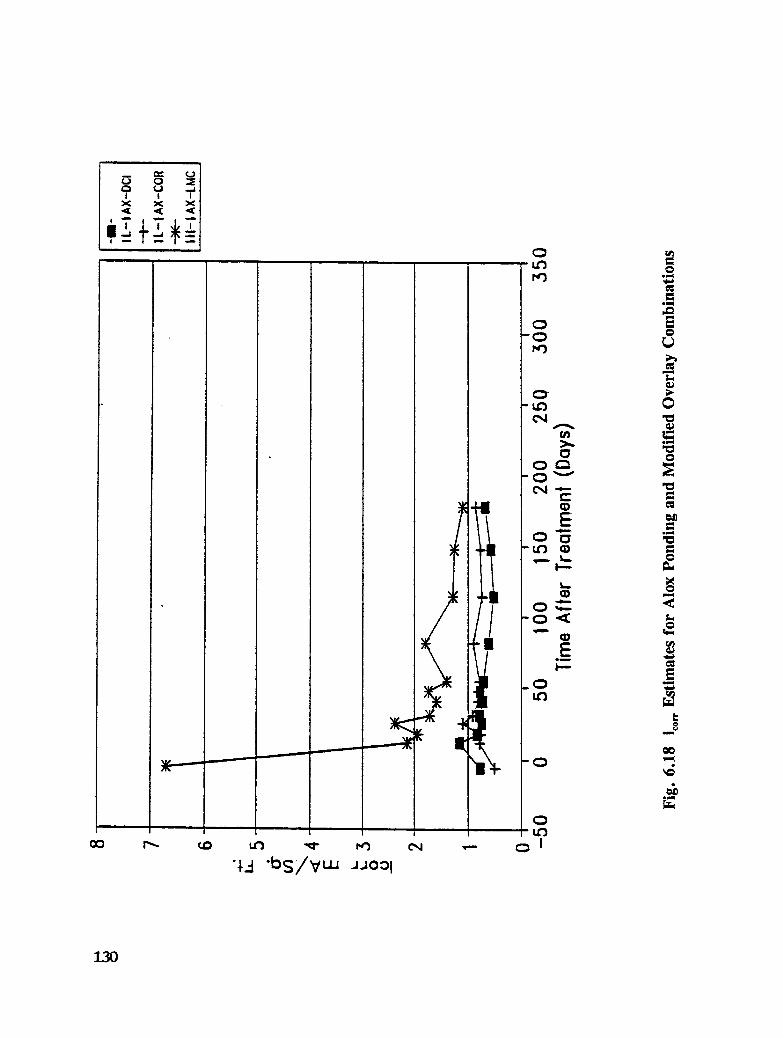
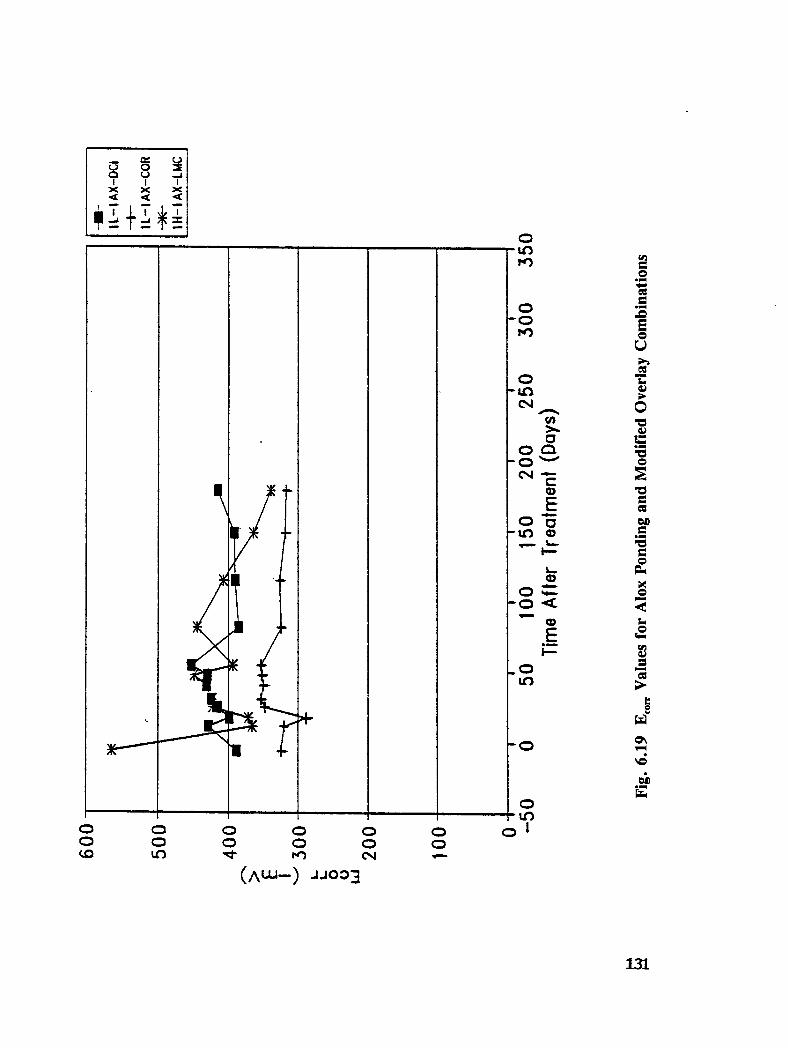
Control Overlays 108Alox Ponding and Modified Overlay Combinations 128Conclusions and Recommendations 142
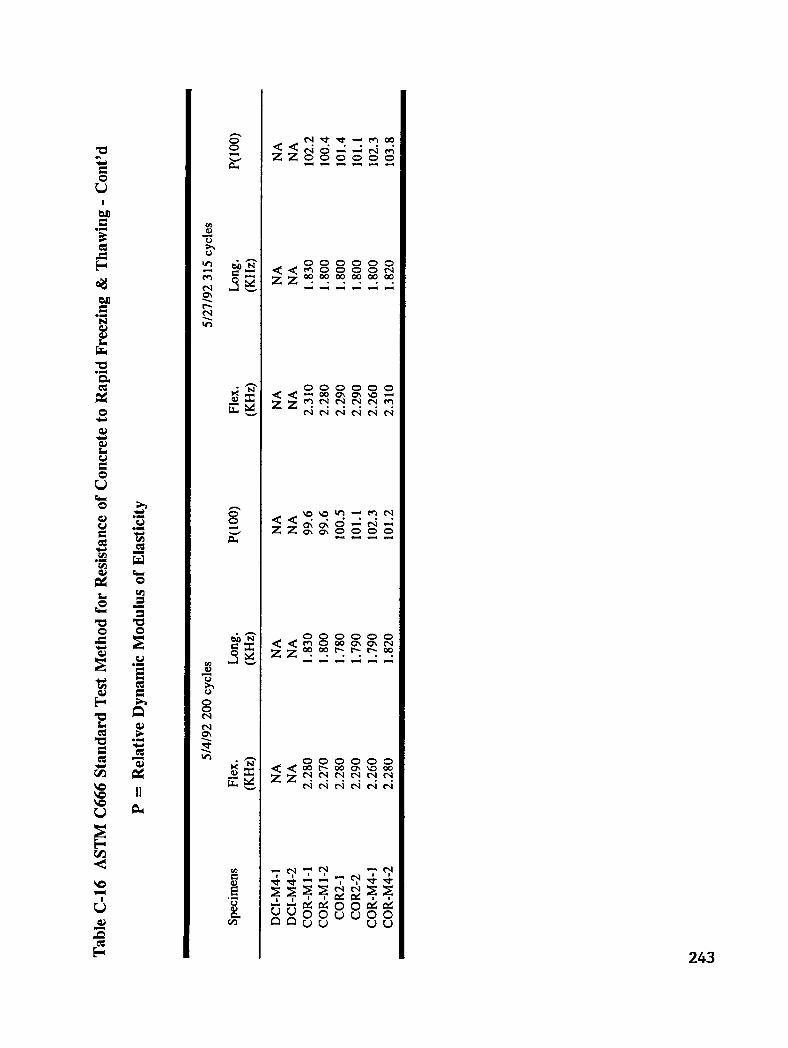
C-17 ASTM C666 Resistance of Concrete to Rapid Freezing and Thawing Elastic Modulus
Determination March 28, 1992 .............................. 244
xvii
Abstract
The chloride-induced corrosion of concrete reinforcing steel has been recognized for the past20 years as a primary factor contributing to concrete bridge component deterioration. Thisreport deals with the improvement of existing non-electrochemical methods for protecting andrehabilitating chloride-contaminated concrete with and without concrete removal and with thedevelopment of new methods. Existing methods include deep impregnation of the concretewith a polymer or with calcium nitriteand the new methods include corrosion inhibitorapplication processes and a resin concrete asphalt composite material.
The effectiveness of polymer-impregnated concrete to abate corrosion was evaluated on twobridge decks in Pennsylvania. The field data suggested that deep polymer-impregnation canincrease the service life of corrosion deteriorating decks by at least 30 years. Two methodsof impregnating calcium nitrite were also examined in the field. One involved drying theconcrete while the other used a grout.
In the laboratory, polymer-impregnated concrete was compared to other protectiontechniques. The study concluded that there was little difference between the five methodsevaluated: LMC overlay, LSDC overlay, polymer-impregnated concrete, polymer-impregnated concrete with a LMC overlay, and polymer-impregnated concrete with a LSDCoverlay. It was also found that the pre-impregnation drying temperature could be lowered to180°F (82°C) at 1/2 in (13 ram) below top rebar level.
Five corrosion inhibitors were evaluated in the laboratory. A treatment matrix wasestablished to evaluate the inhibitors' performance over three corrosion ranges as well as theeffect of application time and drying. The effect of inhibitors on overlay bond strength andthe durability of the inhibitor-modified concrete was also evaluated. Three inhibitortreatments were identified for large-scale testing; large specimens which were removed froma bridge deck were treated to evaluate the field application effectiveness of the corrosioninhibitor treatments. Service lives were estimated for the two most effective treatments.
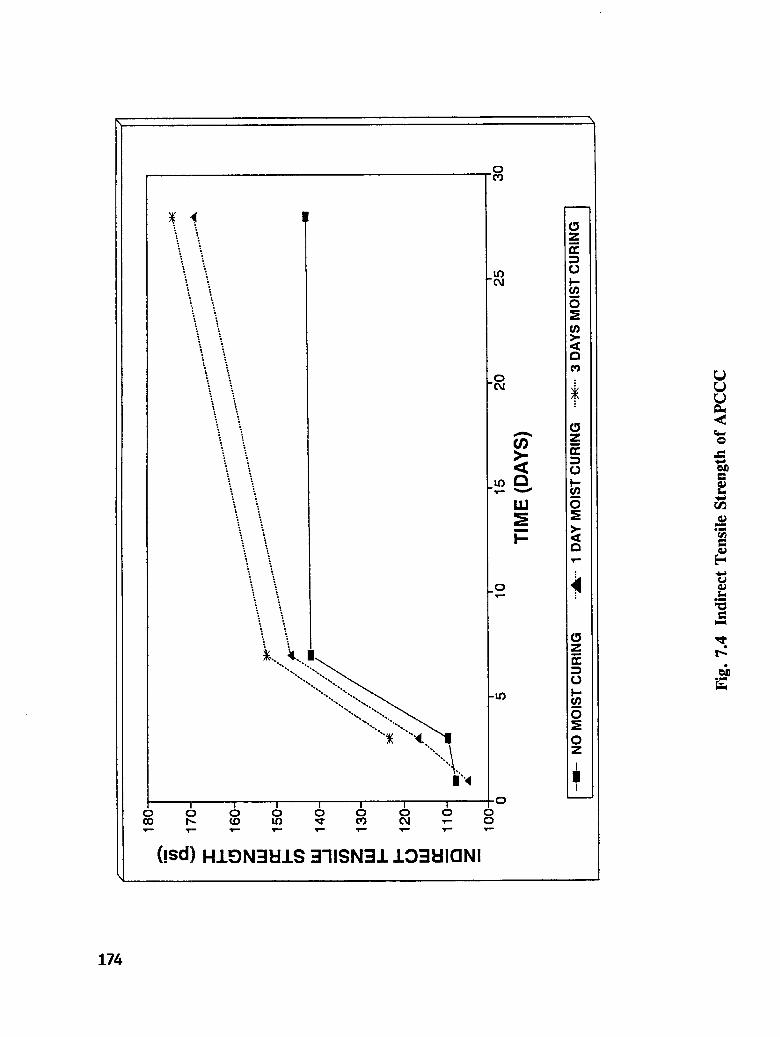
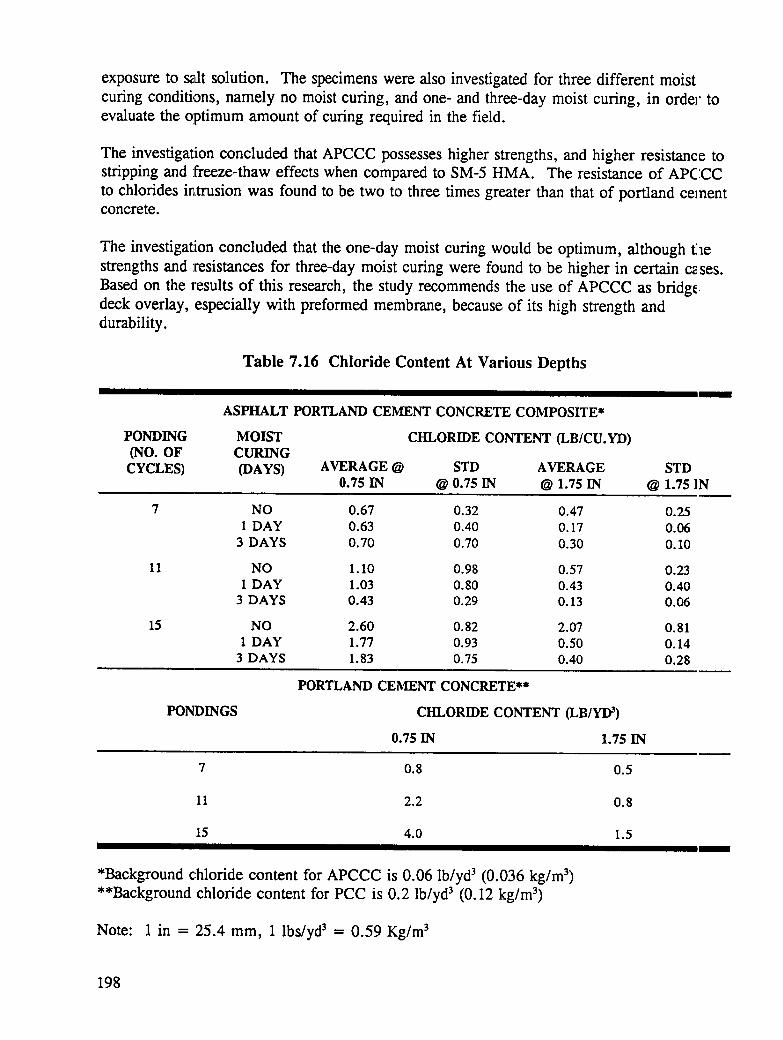
Asphalt Portland Cement Concrete Composite (APCCC) material was designed and evaluatedfor physical properties and durability characteristics for different moist and dry curingperiods. APCCC showed higher strength properties and resistance to freeze-thaw andstripping than hot-mix asphalts. It also was more resistance to chloride intrusion than
portland cement concrete. The study concluded that moist curing for one day was veryeffective. It is suggested that this material be used to rehabilitate existing bridge decks withhot-mix asphalt preformed membrane protection systems.
Executive Summary
Currently, several methods are accepted for preventing corrosion and for maintaining,repairing, and rehabilitating bridge deck components which deteriorate as a result ofchloride-induced reinforcing steel corrosion. These techniques can be considered in threecategories: methods which provide a protective coating for the reinforcement steel, methodswhich reduce the diffusion rate of chlorides and moisture into concrete and/or change thethermodynamics of the corrosion cell, and electrochemical methods. Techniques in thesecond category were used to meet the objective of this study, which is to develop newtechniques and to improve existing corrosion-protection techniques for concrete bridgecomponents.
This report is divided into two parts: Part One deals with improving existing techniqueswhile Part Two deals with developing new techniques. Existing techniques evaluatedincluded deep monomer impregnation, calcium nitrite impregnation, and a calcium nitritegrout. These techniques were evaluated in the laboratory and in the field. New promisingtechniques included inhibitor application processes and resin modified concrete.
To evaluate the deep polymer-impregnated concrete in the field, a post-treatment evaluationwas conducted of 2 bridge decks, one in Boalsburg and one in Bethlehem, Pennsylvaniawhich had been polymer-impregnated at an earlier time. Their corrosion activity wasmonitored periodically. The corrosion performance surveys included visual inspection,delamination survey, cover-depth survey, chloride content as a function of depth, corrosionpotentials, corrosion current density measurements, and petrographic analysis of drilledconcrete cores. The performance of the Boalsburg bridge deck was excellent 7 years afterimpregnation. The chloride content for polymer-impregnated deck was less than that ofcontrol section. However, the half-cell potentials were almost the same for polymer-impregnated and control sections. The corrosion current density for the control section, onthe other hand, was almost twice that of the polymer-impregnated section using a 3LP deviceand a Gecor device. The impregnation process was also found to increase concreteresistivity.
A test section of the Bethlehem bridge deck was polymer-impregnated, using a pressuremethod, when it was 8 years old. The entire deck was replaced 15 years after theimpregnation, and test sections were removed to the laboratory for continuing monitoring andexperimentation. The bridge deck test sections were monitored periodically. The removed
3
sections, polymer-impregnated and adjoining control section, were placed in the outdoorexposure area at the Structures and Materials Research Laboratory of Virginia PolytechnicInstitute and State University (VPI&SU). The slabs were inspected when they arrived atVPI&SU and repaired using LMC. A 60% reduction of chloride intrusion was noticed at 1.5in (38 mm) deep and greater. It was interesting to notice that the polymer-impregnated arearemained above the chloride content threshold level, 1.2 lb/yd 3 (0.7 kg/m 3) of concretes for14 years without spalling or delamination. The polymer-impregnated and control slabs hadthe same half-cell potentials when removed and placed at VPI&SU. However, after repair,the mean potential in the repaired non-impregnated section decreased by 61% and the meanpotential in the polymer-impregnated section (non-repaired) decreased by 39 % from theirarrival levels. The microscopic examination of polymer-impregnated cores showed that adeep monomer impregnation process would arrest steel corrosion in concrete. The corrosioncurrent density of the polymer-impregnated section was 10 times less than that of the control,using 3LP and Geocor devices. Based on the Bethlehem trial section, deep polymerimpregnation can increase the service life of a bridge deck by at least 30 years.
Calcium nitrite was introduced as an inhibitor to prevent and/or stop corrosion at thereinforcing steel in concrete in the 1980's. It was found, after trying many methods, that themost effective was drying concrete by heating it to above the boiling point of water. In1985, calcium nitrite was successfully used to impregnate large-scale slabs at the Universityof Texas at Austin. A parking deck in a garage was repaired using this technique. Noadverse structural effect to the concrete was noted. However, in the garage, severe surfacecontamination led to a minimal amount of calcium nitrite impregnation.
In this study, a section of a bridge deck which was undergoing corrosion due to chlorideintrusion was treated with calcium nitrite. Grooves were cut to bypass surfacecontamination. The procedure and equipment are described in the report. The calciumnitrite impregnation was successful. Both the mean and standard deviation of the CSEcorrosion potentials and the 3LP corrosion current density measurements after two yearsindicated a reduction in the corrosion activity. It was not possible to determine from thechloride content analyses whether the calcium nitrite performed well. For inhibition to takeplace, the chloride to nitrite ratio must be less than two at the rebar level; the ratio in thetested sample was high. Further surveys will be required to make an accurate assessment ofcalcium nitrite performance as an impregnate corrosion inhibitor.
A column undergoing severe spalling from corrosion was also treated using a groutcontaining 10% calcium nitrite by mass of cement. Holes were drilled to the reinforcementlevel and filled with the grout. The spalled area was patched with the same grout. The CSEcorrosion potentials in the patched area showed a 31% decrease after treatment and remainedconstant for the two year evaluation period. The corrosion current density measurementsalso decreased slightly for the grout-filled hole section. The practicality of using grouts andconcrete with high inhibitor contents was confirmed. This technology may be used incolumn repair where it is difficult to remove the column or apply other means of protection.It appears that the addition of calcium nitrite to concrete patches is promising and deserves
4
further investigation.
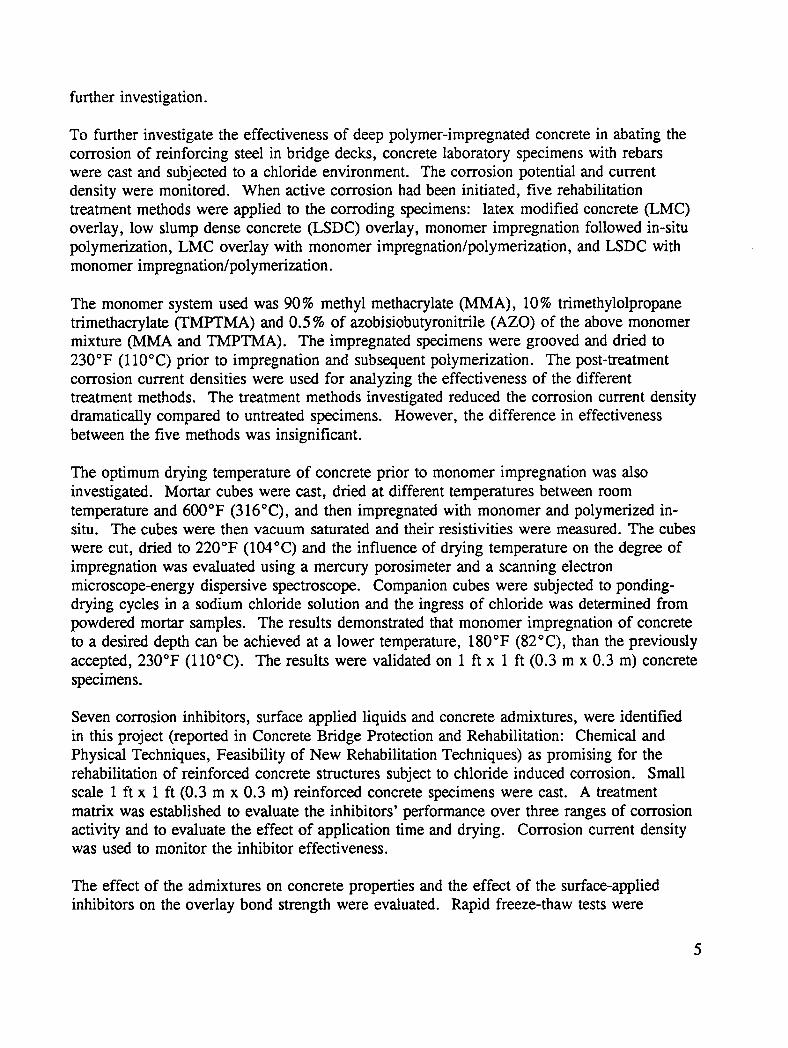
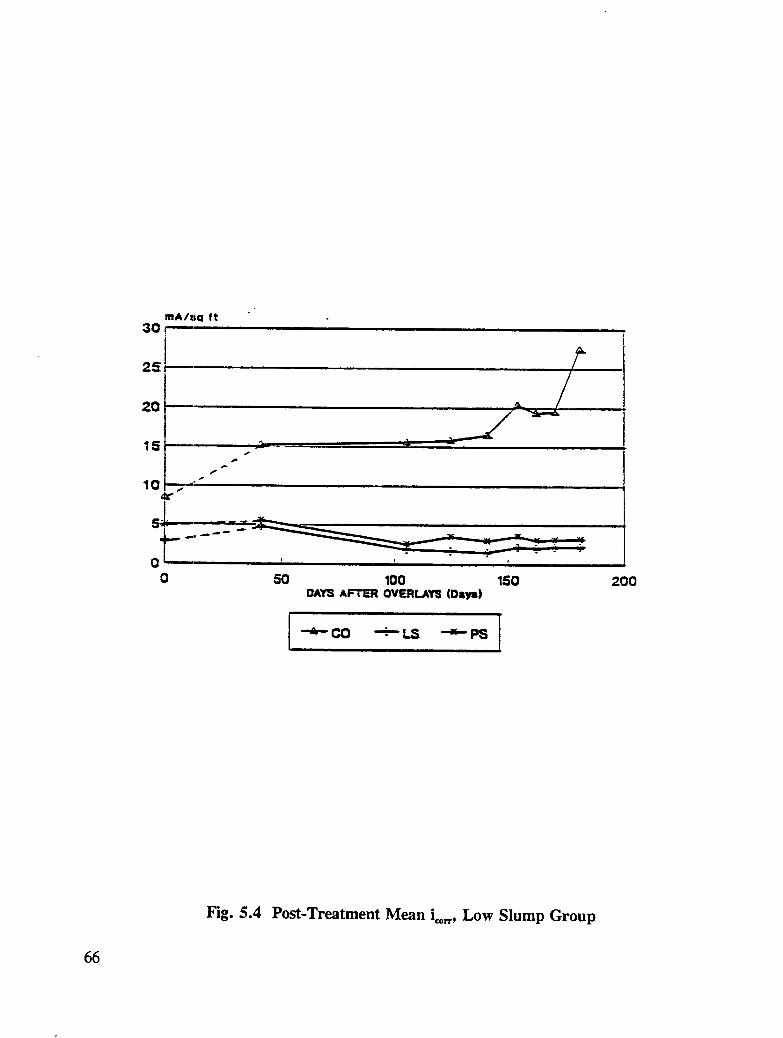
To further investigate the effectiveness of deep polymer-impregnated concrete in abating thecorrosion of reinforcing steel in bridge decks, concrete laboratory specimens with rebarswere cast and subjected to a chloride environment. The corrosion potential and currentdensity were monitored. When active corrosion had been initiated, five rehabilitationtreatment methods were applied to the corroding specimens: latex modified concrete (LMC)overlay, low slump dense concrete (LSDC) overlay, monomer impregnation followed in-situpolymerization, LMC overlay with monomer impregnation/polymerization, and LSDC withmonomer impregnation/polymerization.
The monomer system used was 90% methyl methacrylate (MMA), 10% trimethylolpropanetrimethacrylate (TMPTMA) and 0.5 % of azobisiobutyronitrile (AZO) of the above monomermixture (MMA and TMPTMA). The impregnated specimens were grooved and dried to230°F (110°C) prior to impregnation and subsequent polymerization. The post-treatmentcorrosion current densities were used for analyzing the effectiveness of the differenttreatment methods. The treatment methods investigated reduced the corrosion current densitydramatically compared to untreated specimens. However, the difference in effectivenessbetween the five methods was insignificant.
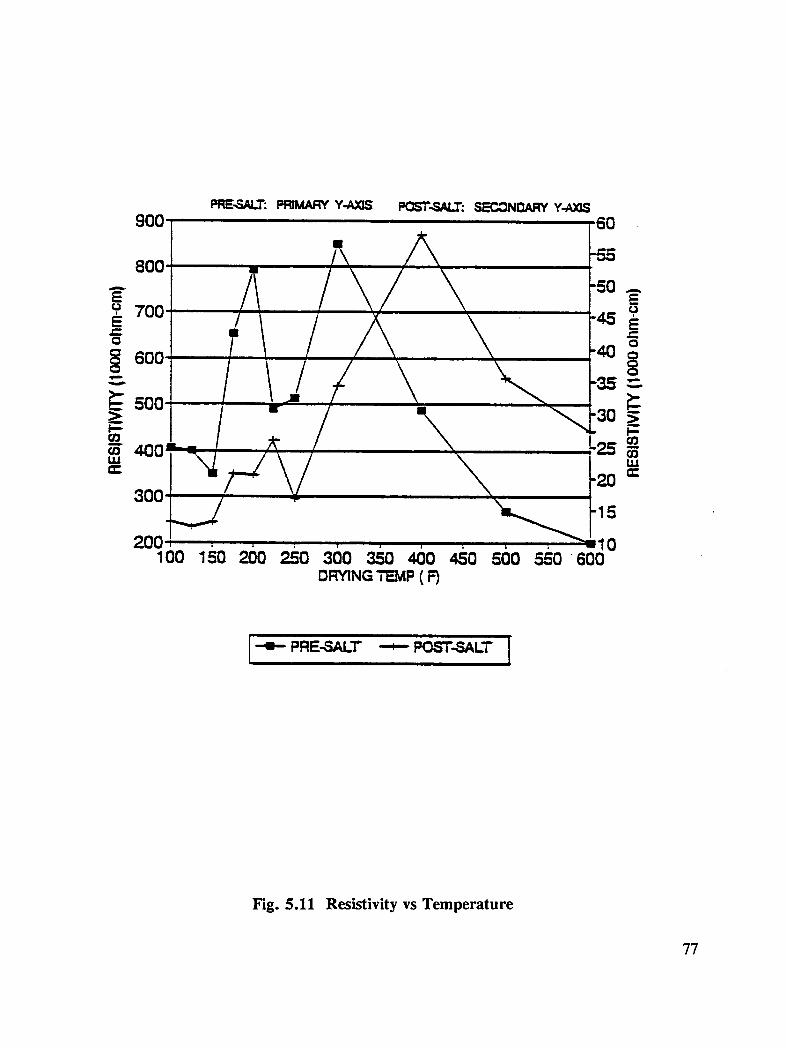
The optimum drying temperature of concrete prior to monomer impregnation was alsoinvestigated. Mortar cubes were cast, dried at different temperatures between roomtemperature and 600°F (316°C), and then impregnated with monomer and polymerized in-situ. The cubes were then vacuum saturated and their resistivities were measured. The cubes
were cut, dried to 220°F (104°C) and the influence of drying temperature on the degree ofimpregnation was evaluated using a mercury porosimeter and a scanning electronmicroscope-energy dispersive spectroscope. Companion cubes were subjected to ponding-drying cycles in a sodium chloride solution and the ingress of chloride was determined frompowdered mortar samples. The results demonstrated that monomer impregnation of concreteto a desired depth can be achieved at a lower temperature, 180°F (82°C), than the previouslyaccepted, 230°F (110°C). The results were validated on 1 ft x 1 ft (0.3 m x 0.3 m) concretespecimens.
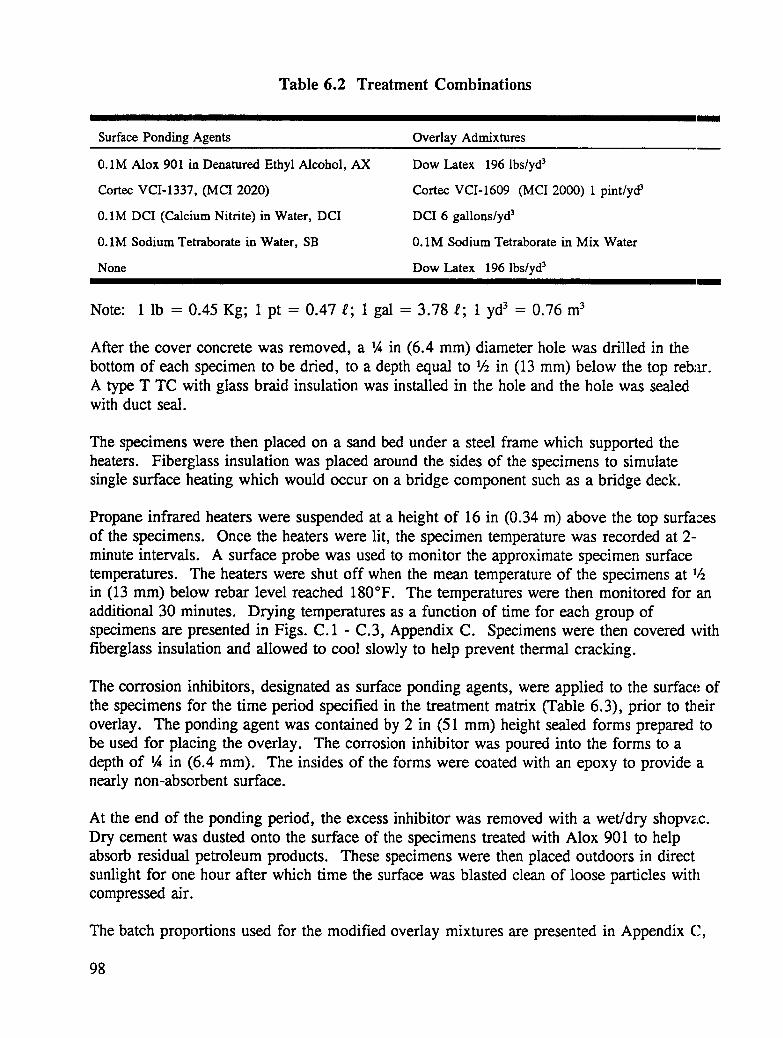
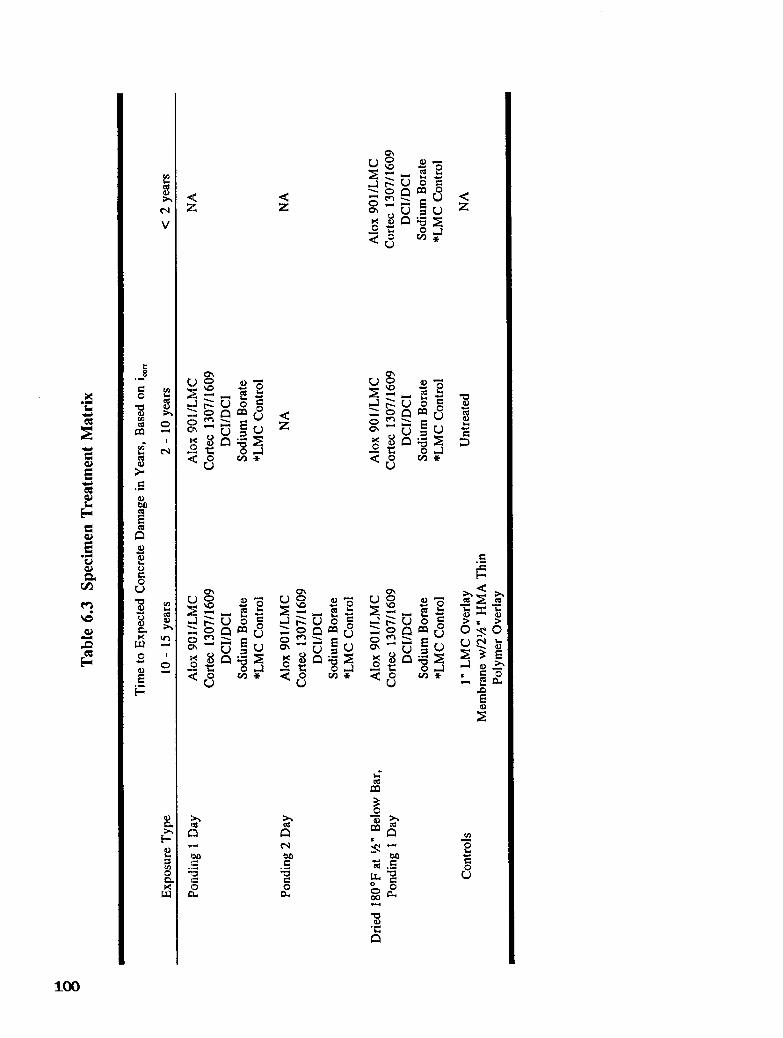
Seven corrosion inhibitors, surface applied liquids and concrete admixtures, were identifiedin this project (reported in Concrete Bridge Protection and Rehabilitation: Chemical andPhysical Techniques, Feasibility of New Rehabilitation Techniques) as promising for therehabilitation of reinforced concrete structures subject to chloride induced corrosion. Smallscale 1 ft x 1 ft (0.3 m x 0.3 m) reinforced concrete specimens were cast. A treatmentmatrix was established to evaluate the inhibitors' performance over three ranges of corrosionactivity and to evaluate the effect of application time and drying. Corrosion current densitywas used to monitor the inhibitor effectiveness.
The effect of the admixtures on concrete properties and the effect of the surface-appliedinhibitors on the overlay bond strength were evaluated. Rapid freeze-thaw tests were
conducted to estimate the durability of the inhibitor-modified concrete. Three combinationsof inhibitors were identified for large scale testing after 10 months of accelerated chlorideexposure. The large scale specimens were removed from an actual bridge deck and treatedto test the effectiveness of the select inhibitors and develop field application procedures.
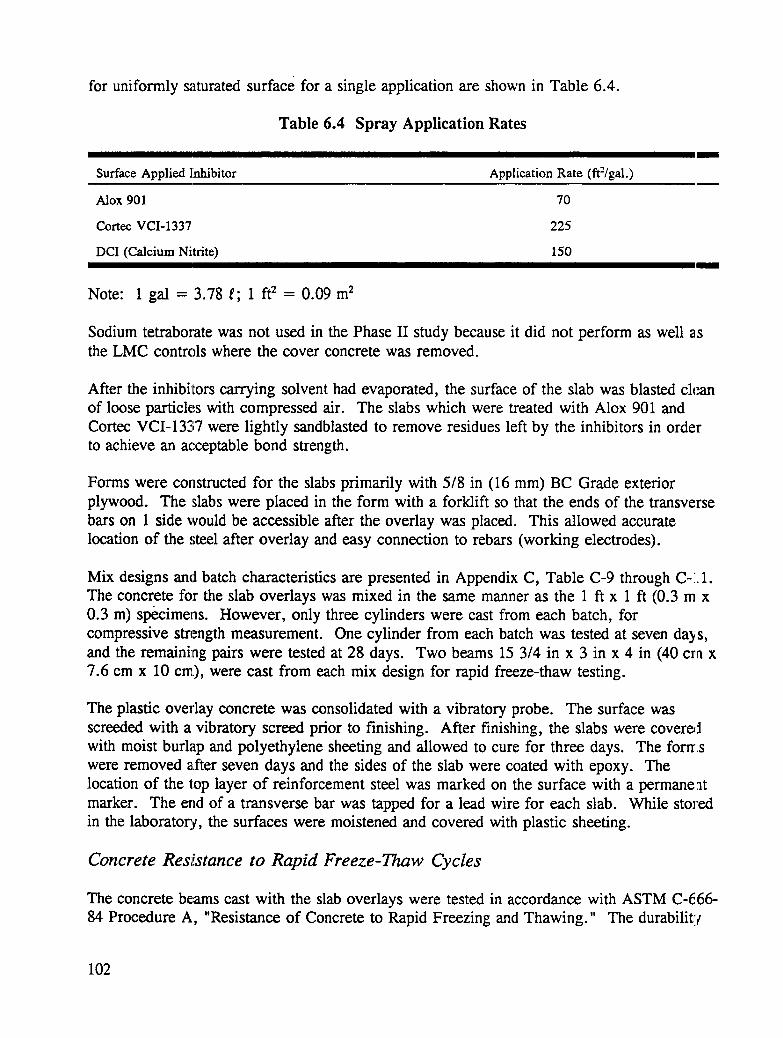
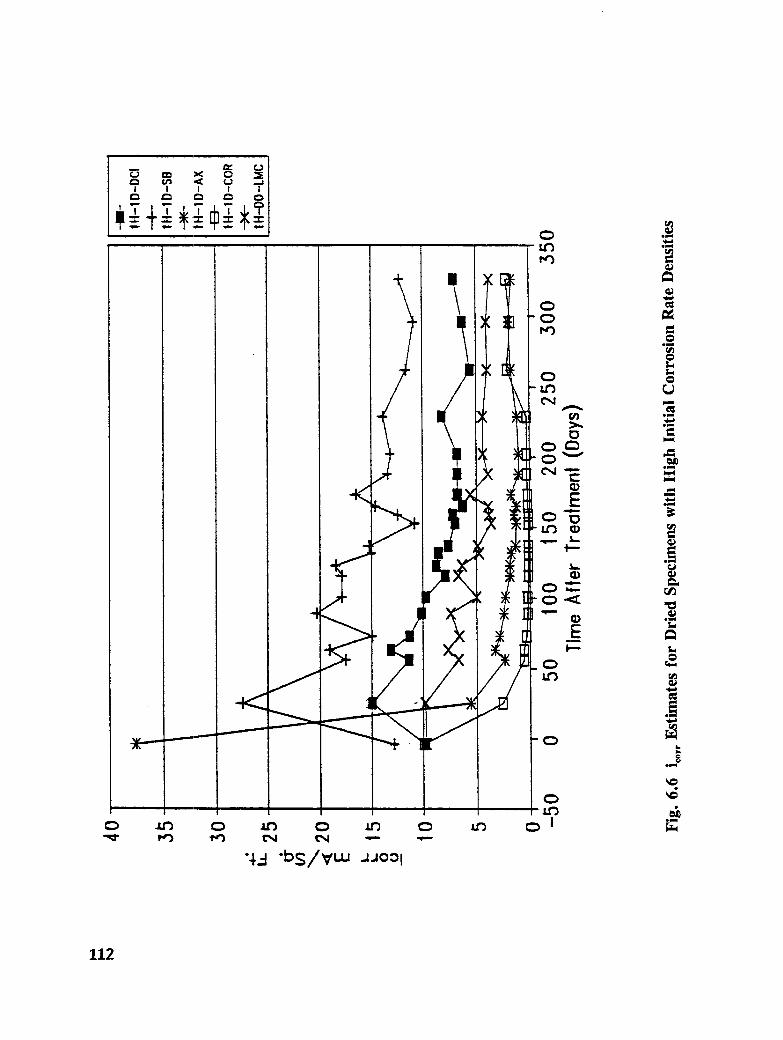
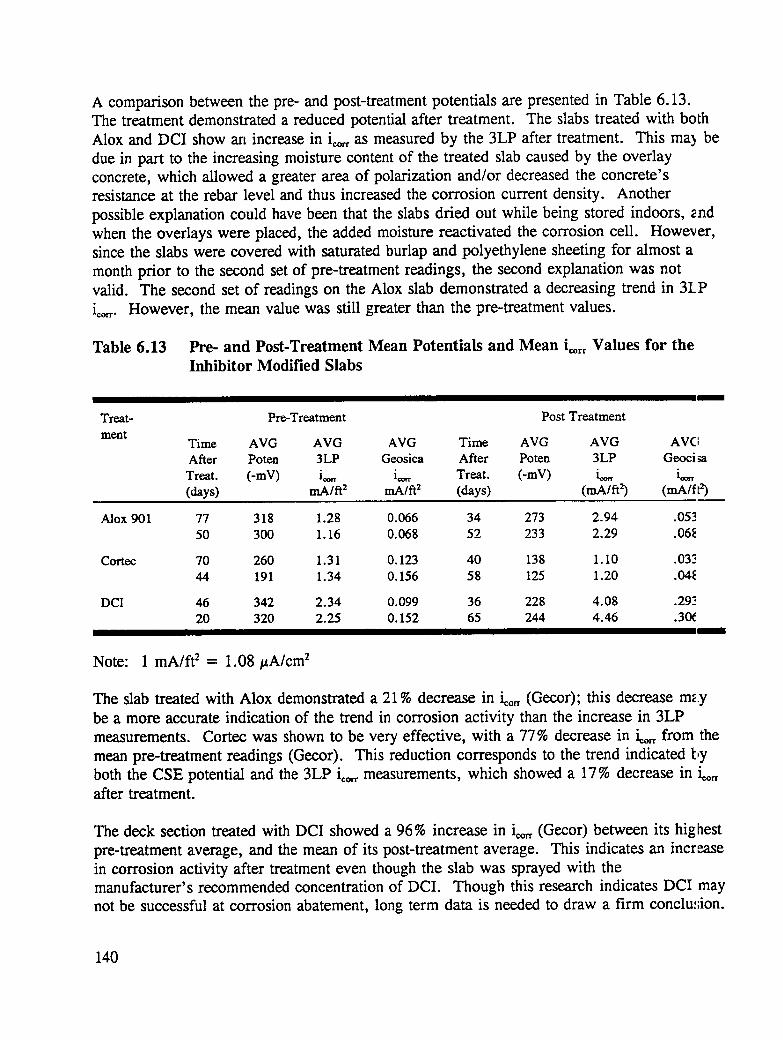
The researchers concluded that removing chloride-contaminated concrete above thereinforcing steel and replacing it with fresh concrete was an effective method whichfacilitated the application of corrosion inhibitors. Among the evaluated corrosion inhibitors,Alox 901 was a very effective surface-applied corrosion inhibitor; it increased the overlayservice life by twice, while Cortec 1307 and Cortec 1609 were effective inhibitors whenapplied as ponding agents and concrete admixtures, respectively. However, sand-blastingwas needed when using Alox 901 and Cortec 1337 because they had a detrimental effect onbond strength. Calcium nitrite (DCI) was effective in reducing low corrosion currentdensities when applied at the 0.1 M concentration. Also, the nitrite:chloride ratio isimportant. Insignificant difference was found in samples' performance subjected to pondingfor one or two days.
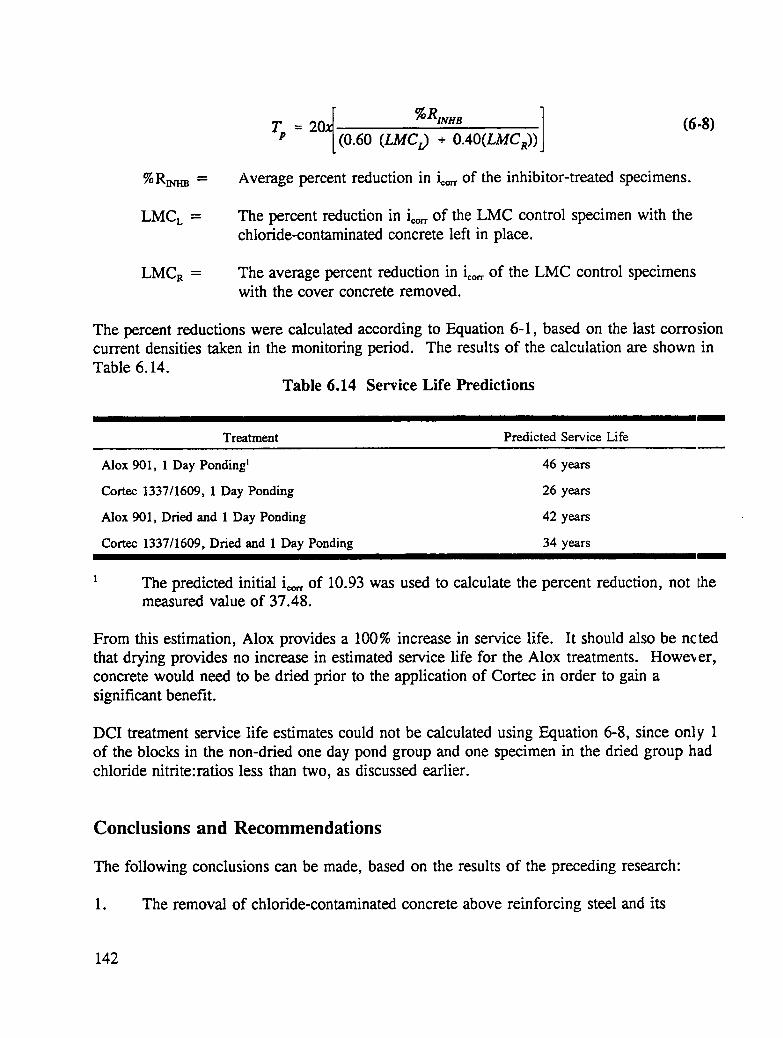
A model for service life prediction was developed. The model suggested that Alox 901inhibitor would increase the service life of reinforced concrete by twice when ponded for oneday while drying prior to ponding showed no additional increase in service. Ponding usingCortec 1337/1609 for one day after drying will increase the service life by at least 50%.
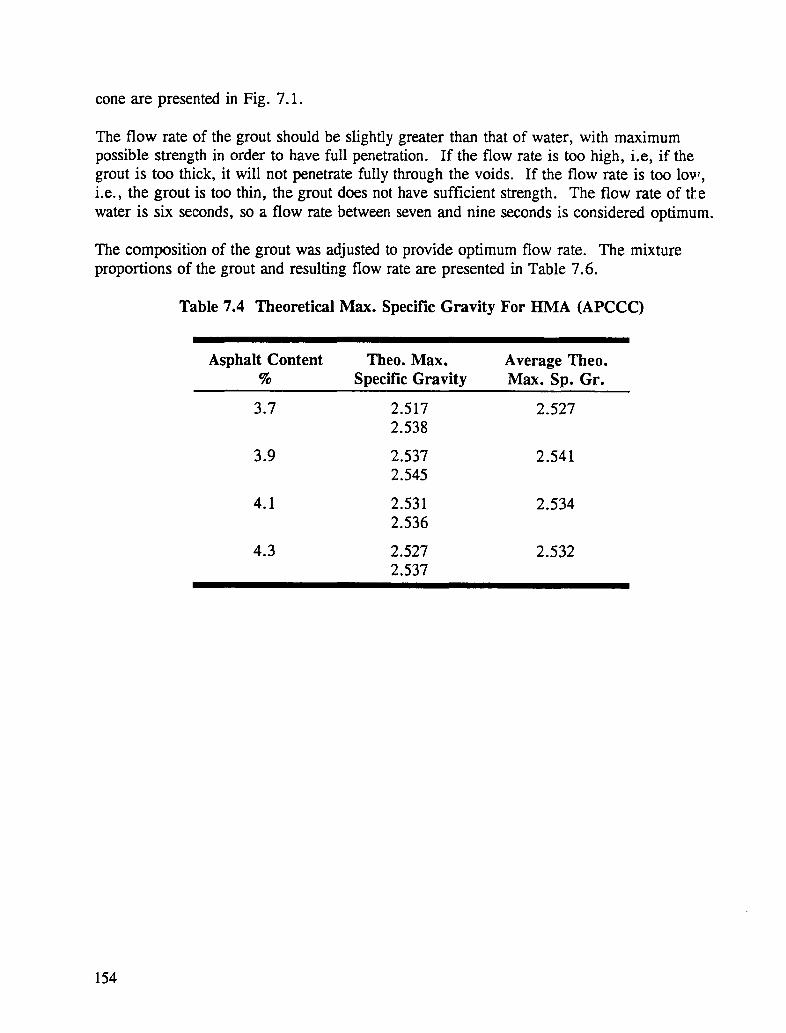
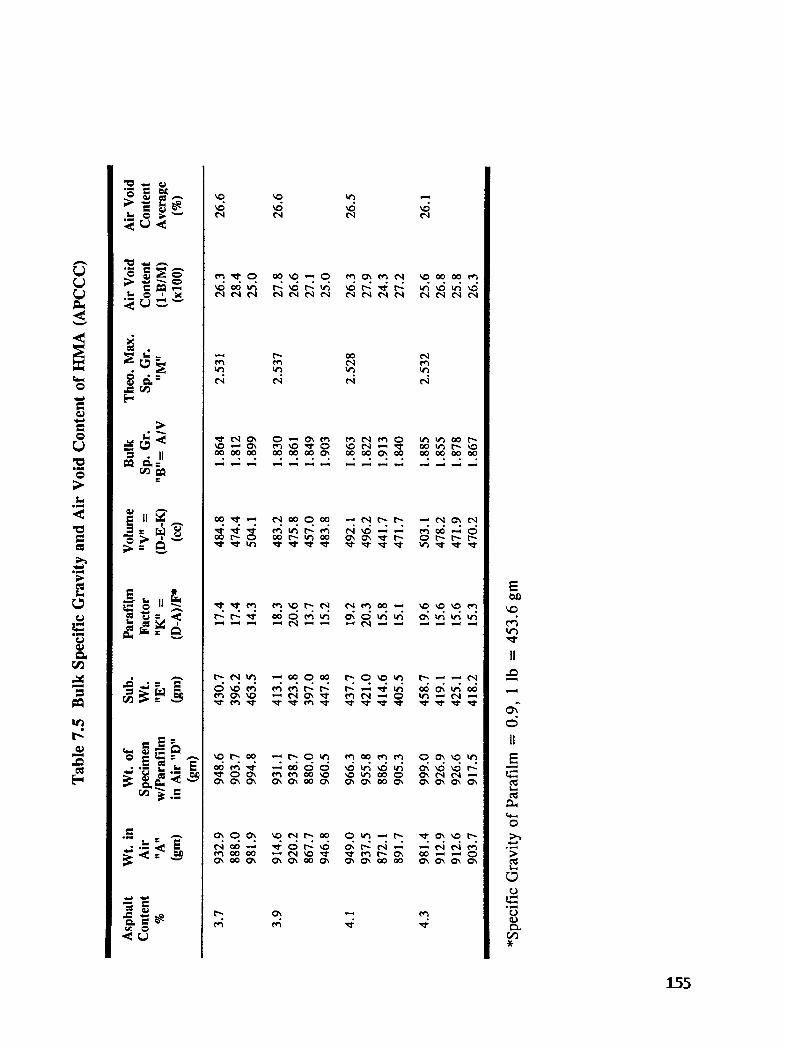
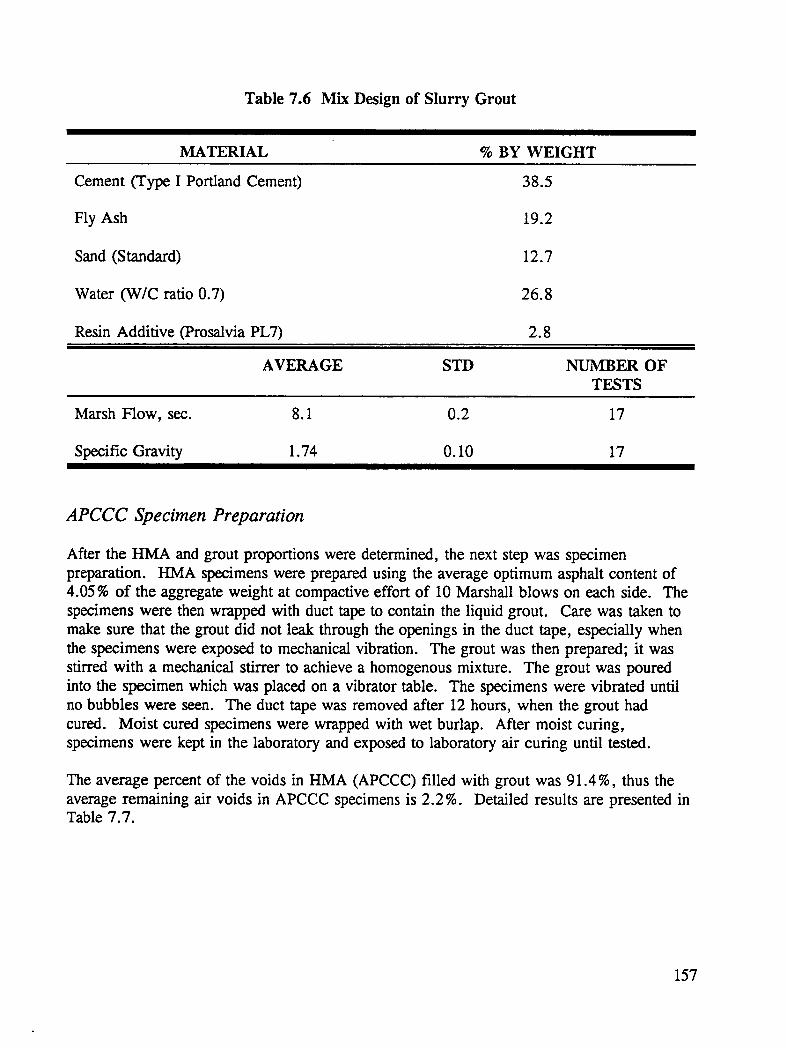
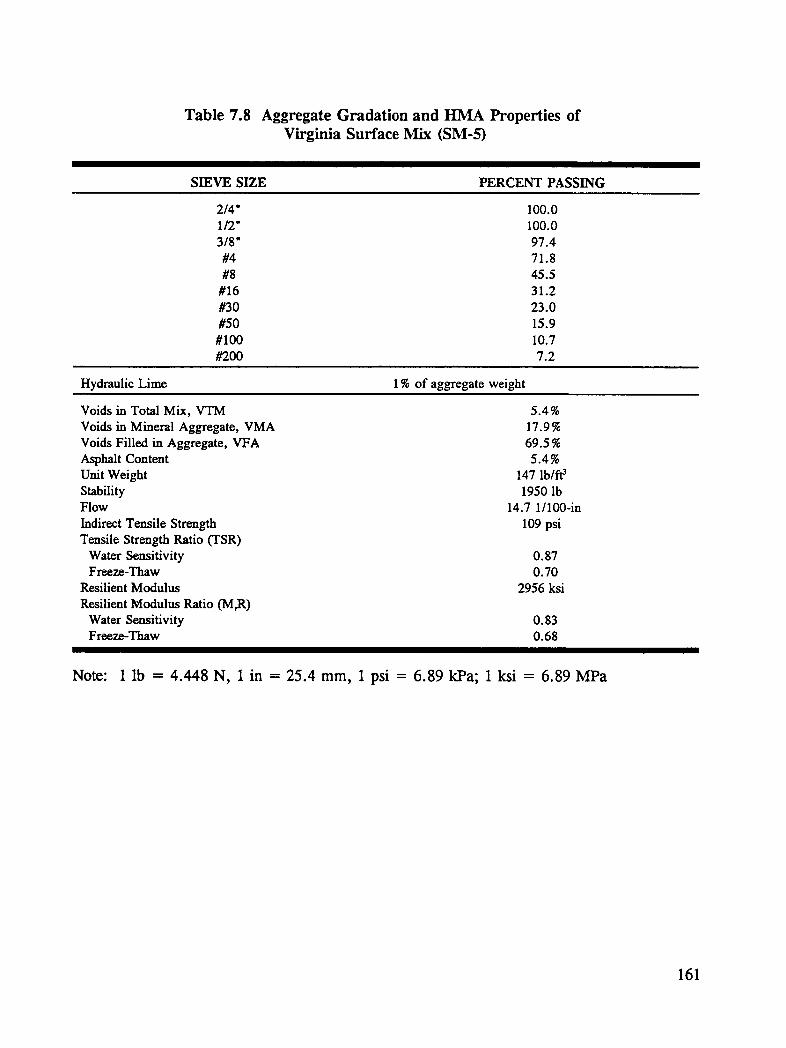
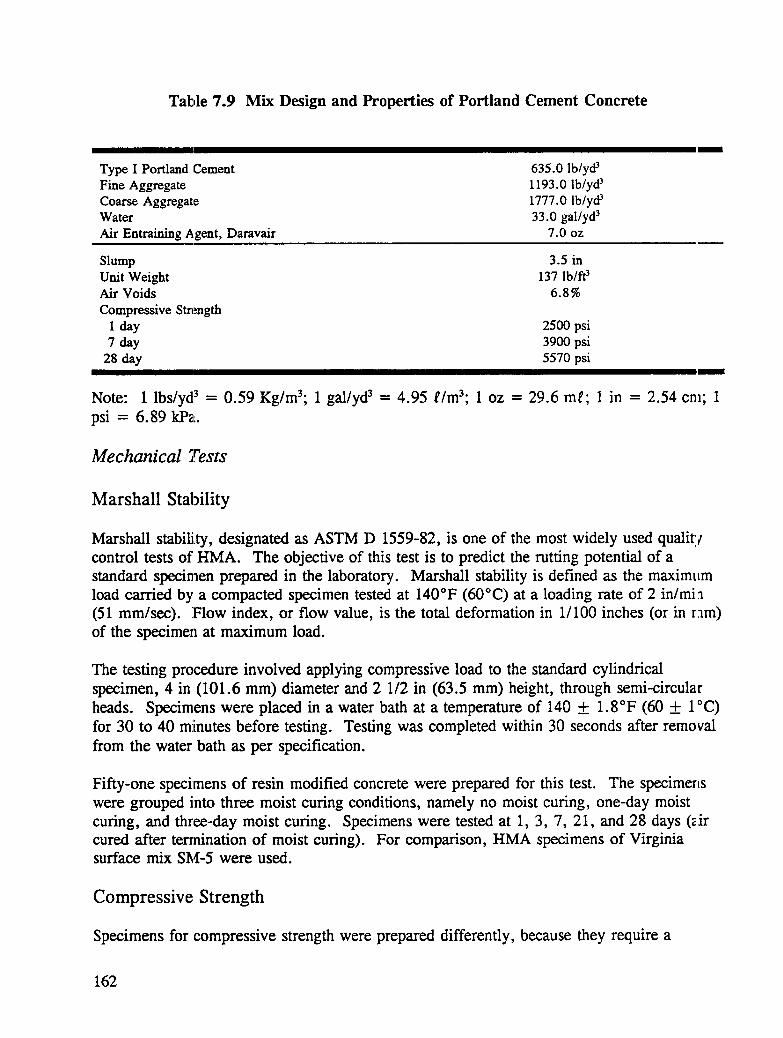
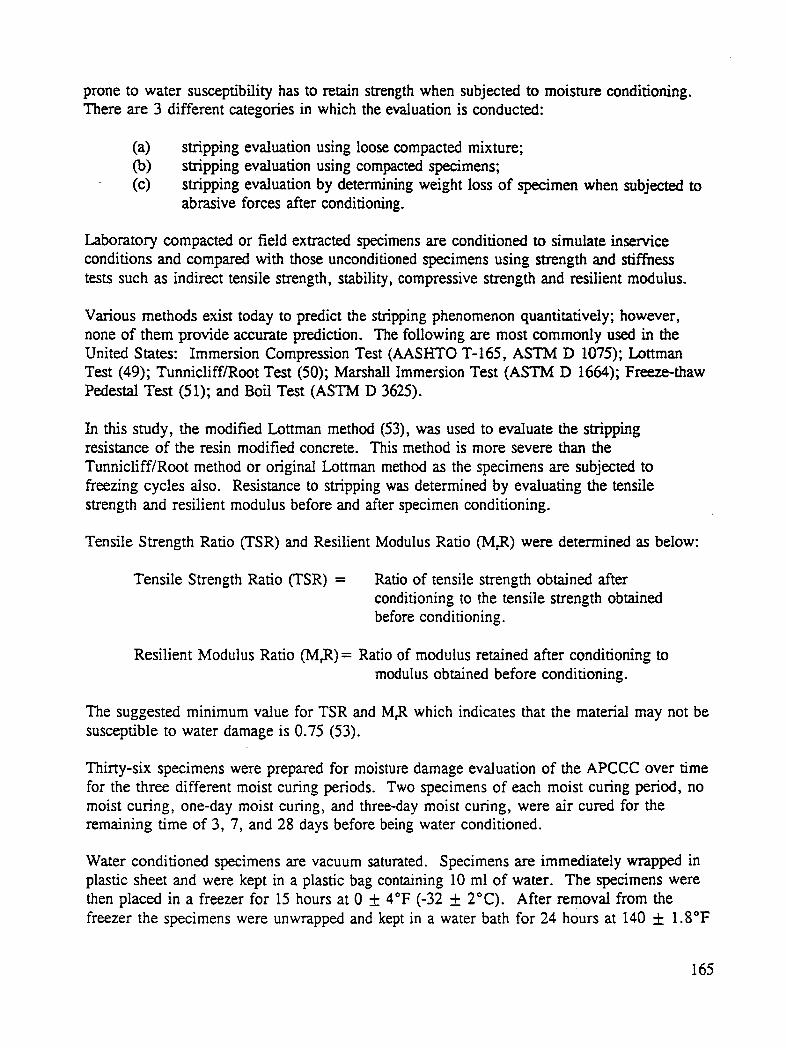
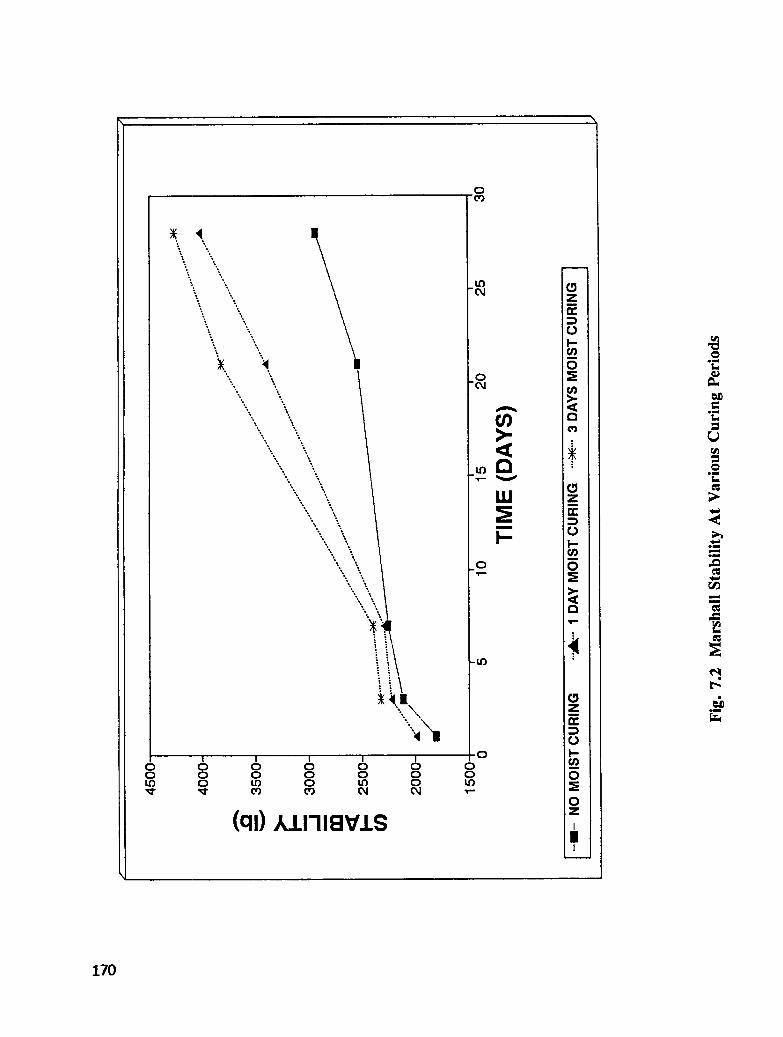
Another new technique was evaluated, Asphalt Portland Cement Concrete Composite(APCCC) material. APCCC is hot-mix asphalt with air voids in the range of 25 to 30%which are later filled with resin modified cement grout. The resin modified cement groutconsists of portland cement, fly ash, sand, water, and Prosalvia (PL7) additive. In this partof the project, APCCC was evaluated under laboratory conditions and the results werecompared to those of conventional highway materials: hot-mix asphalt and portland cementconcrete. The mixture of resin modified cement grout was designed. Hot-mix asphaltspecimens were prepared using the Marshall method at 25-30% air void and then filled withthe grout.
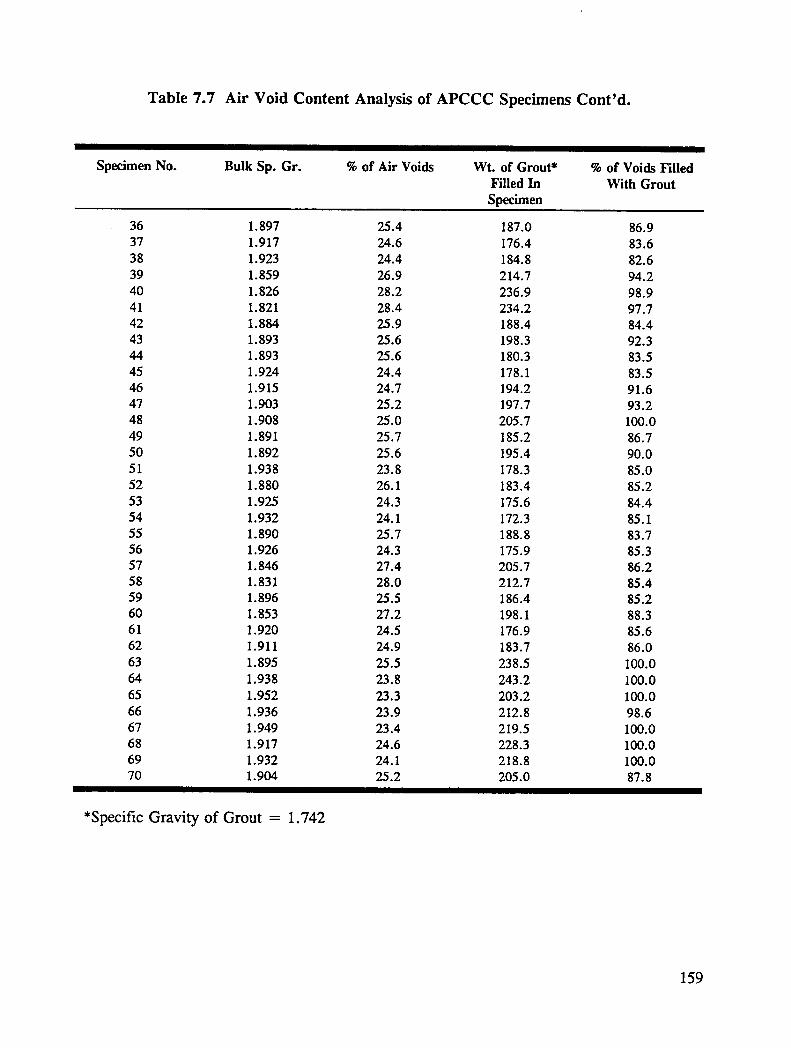
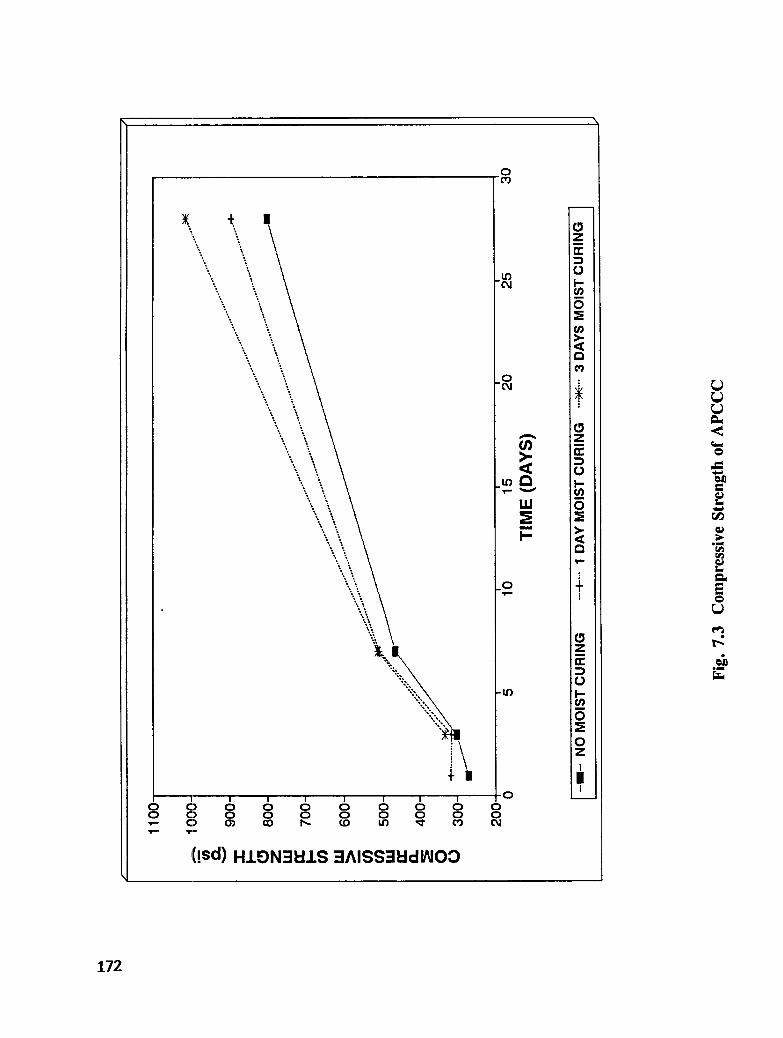
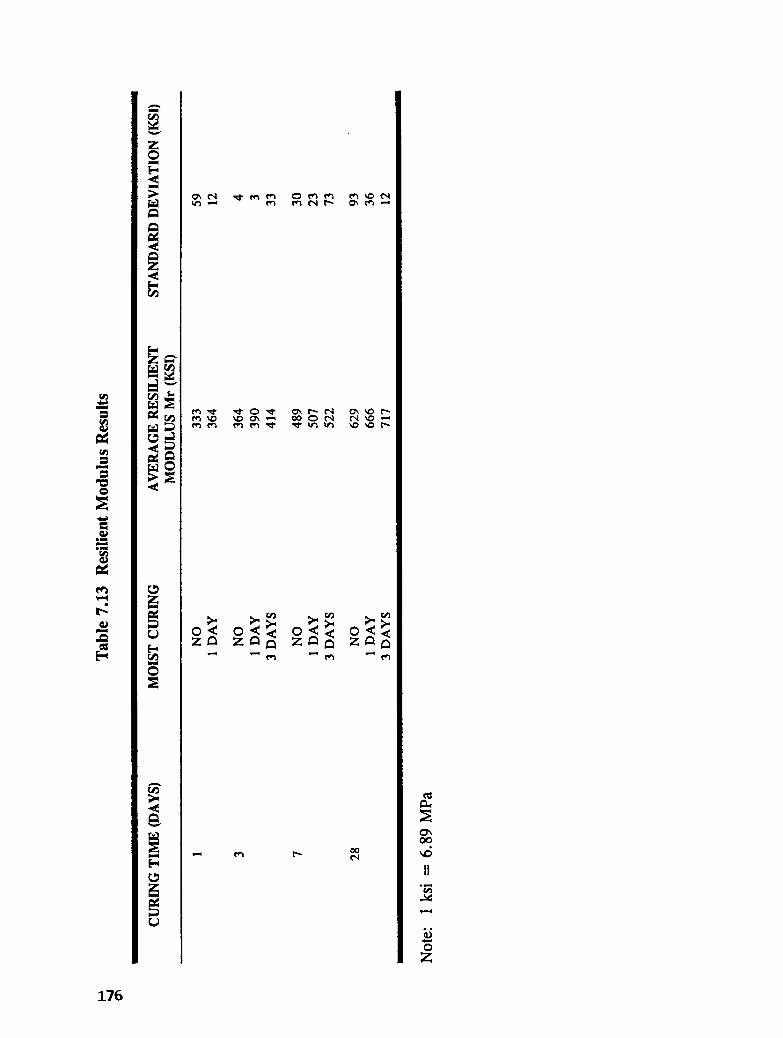
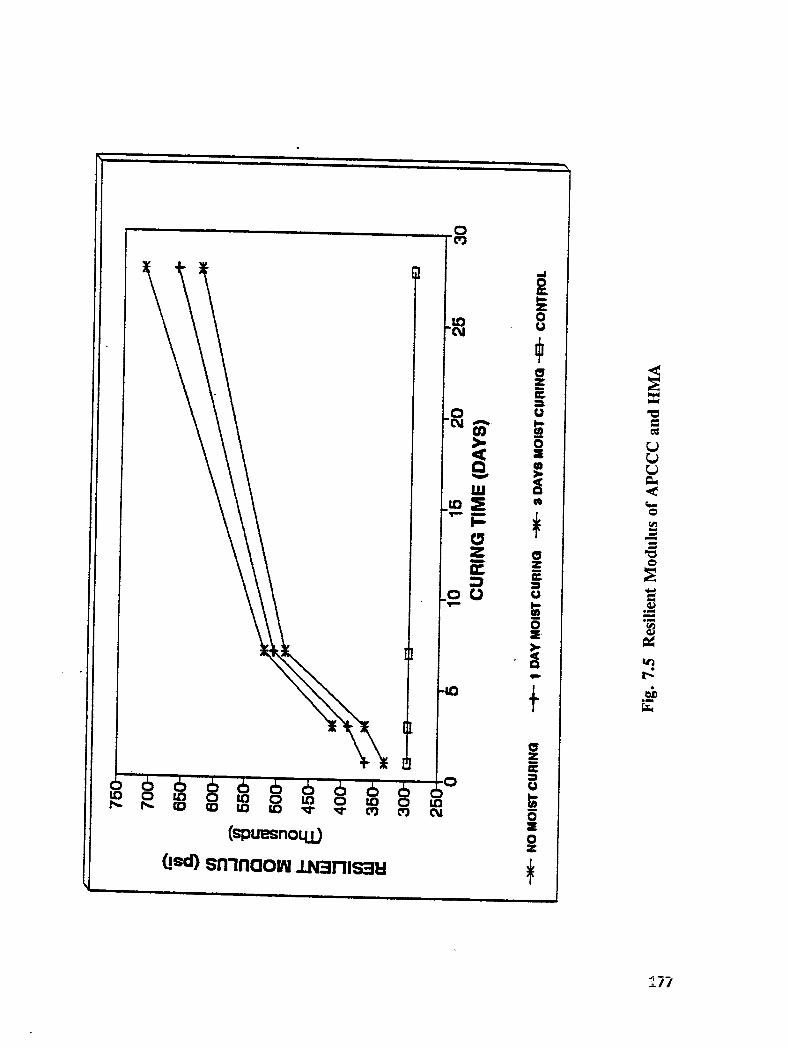
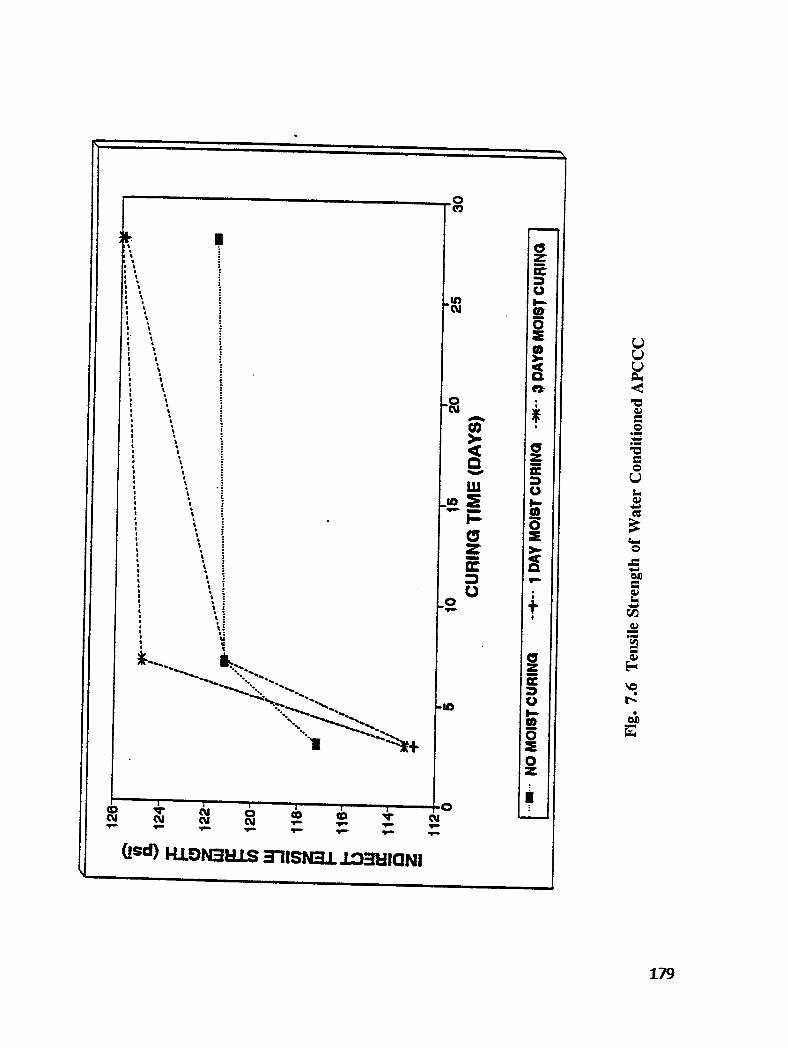
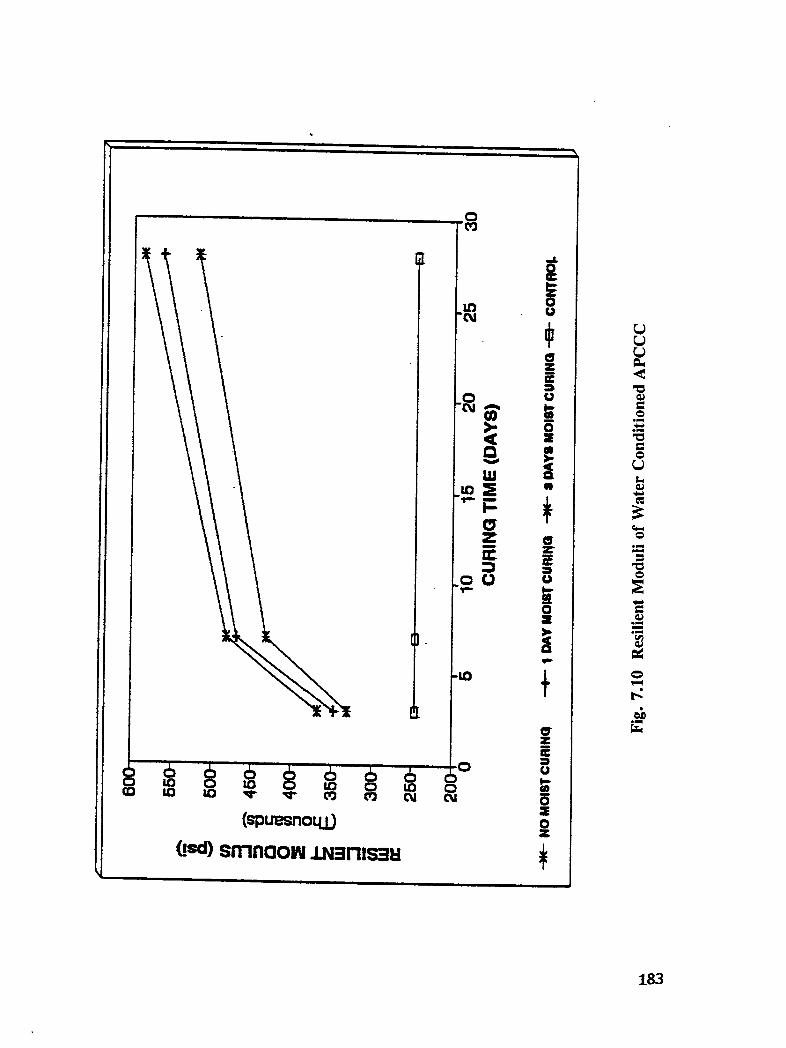
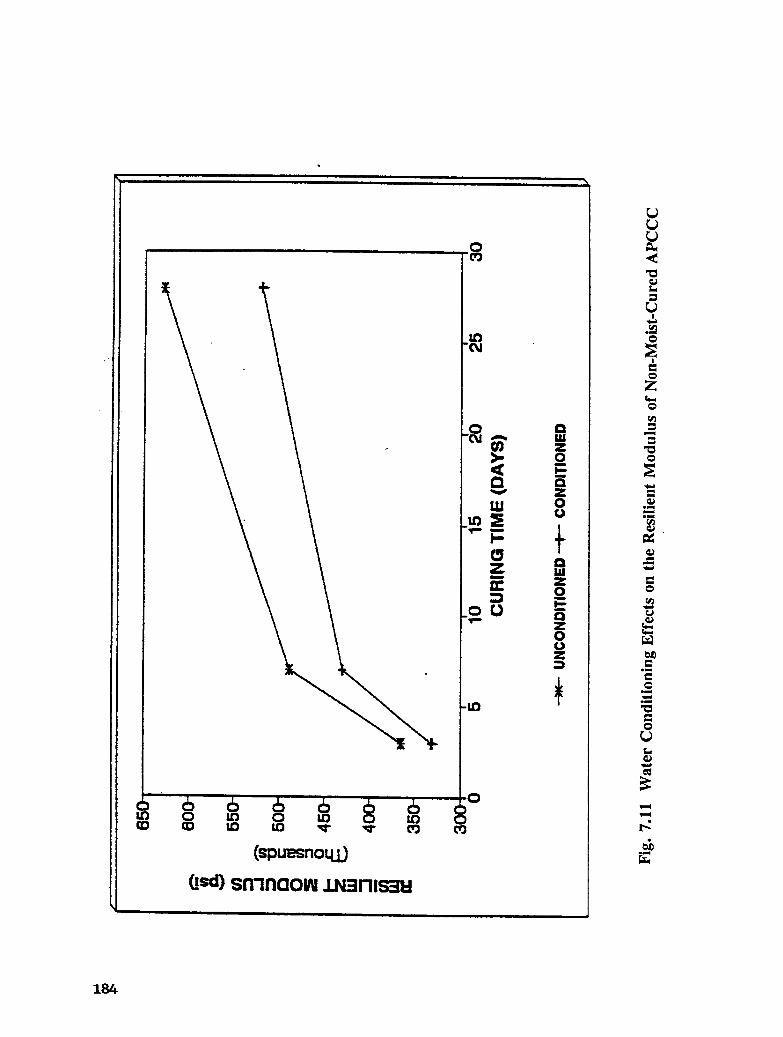
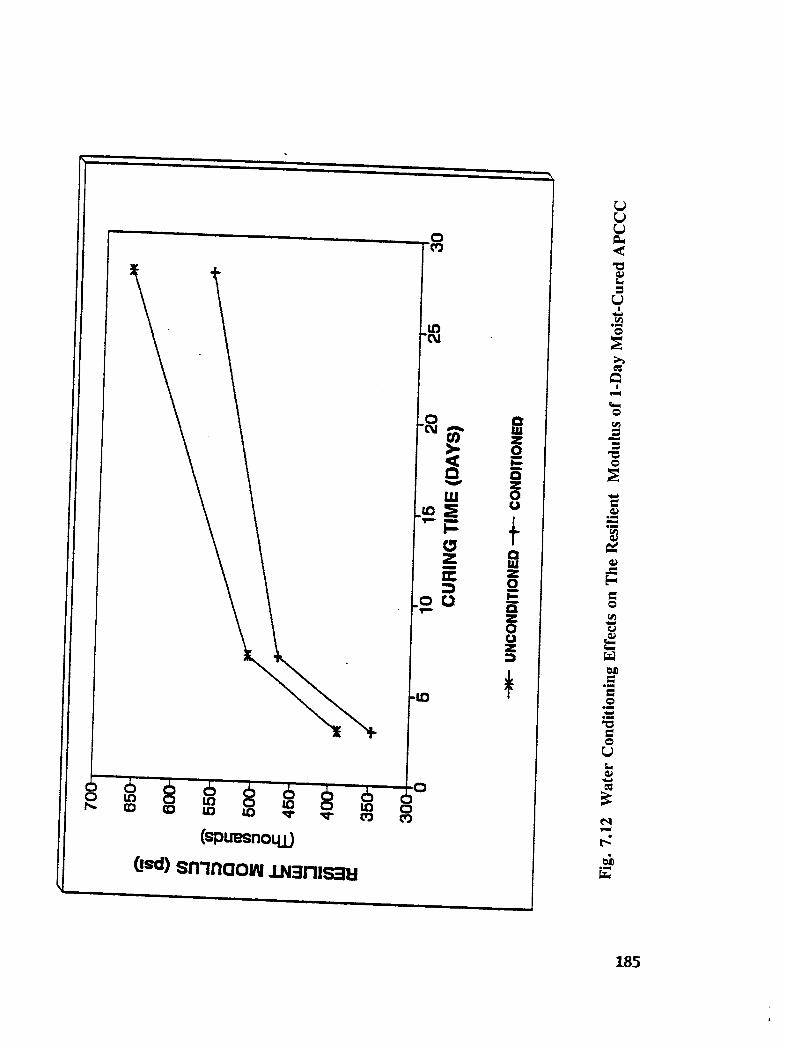
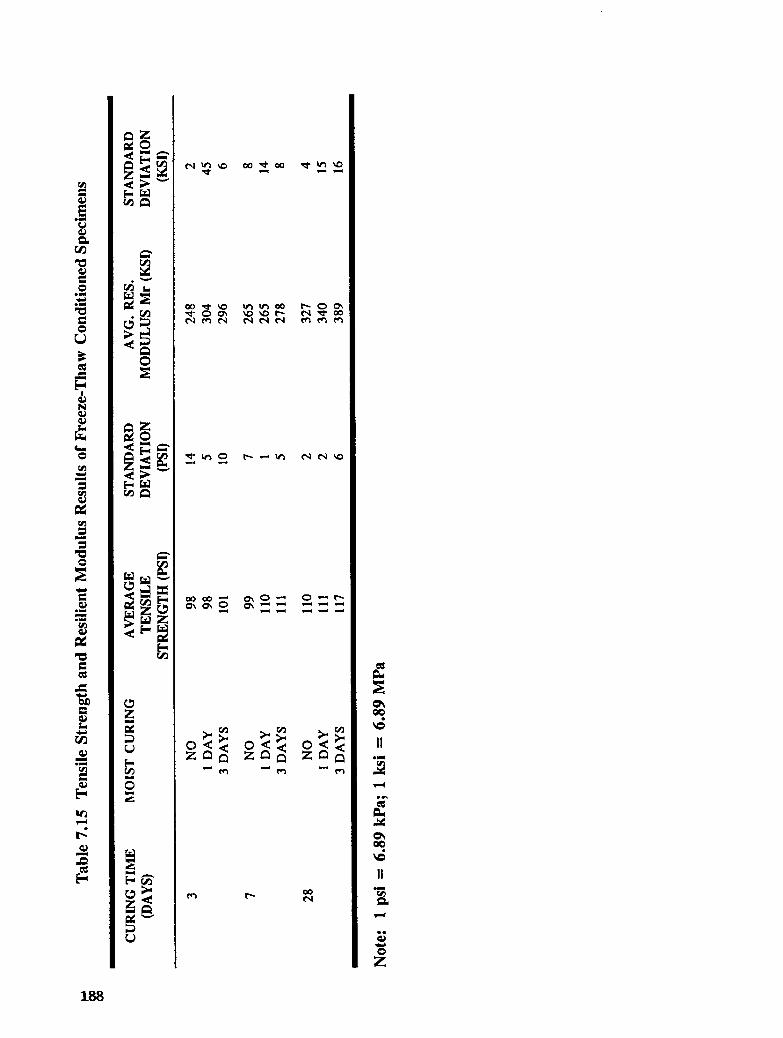
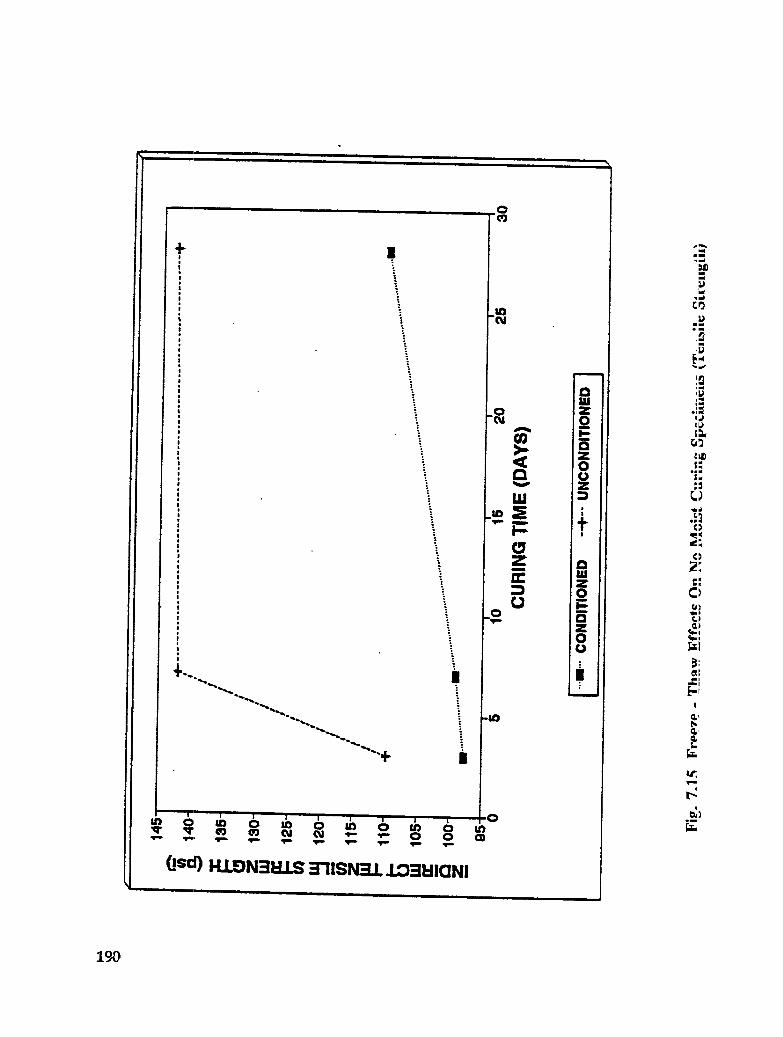
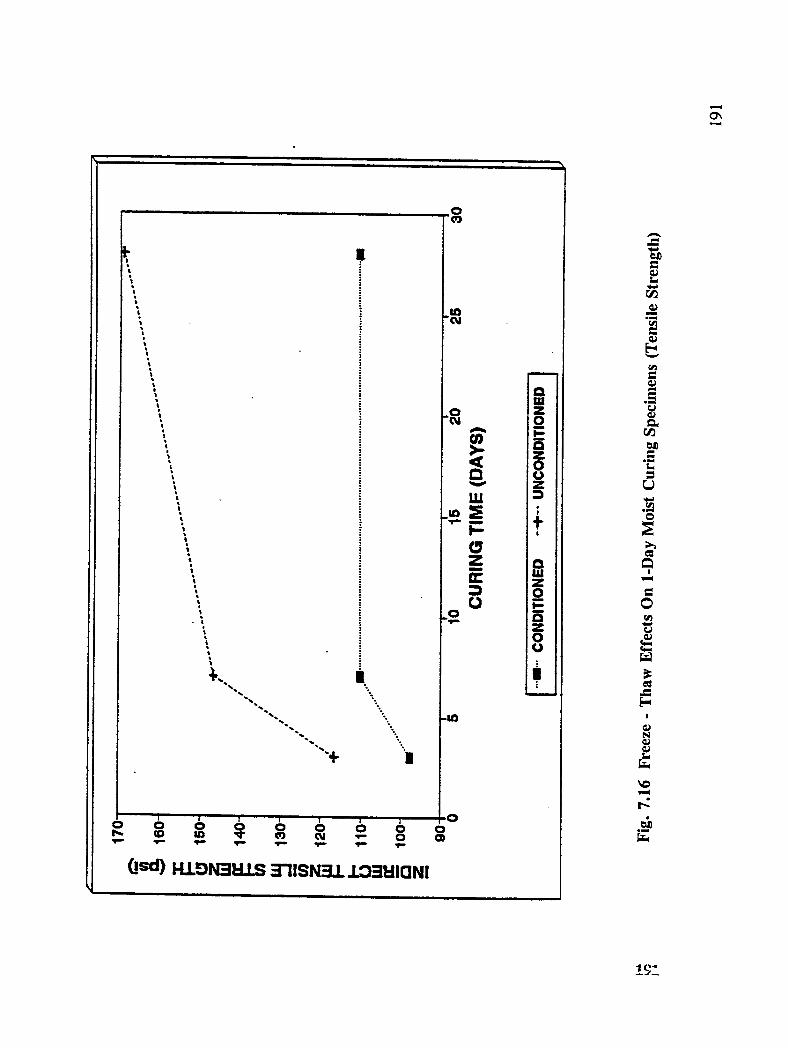
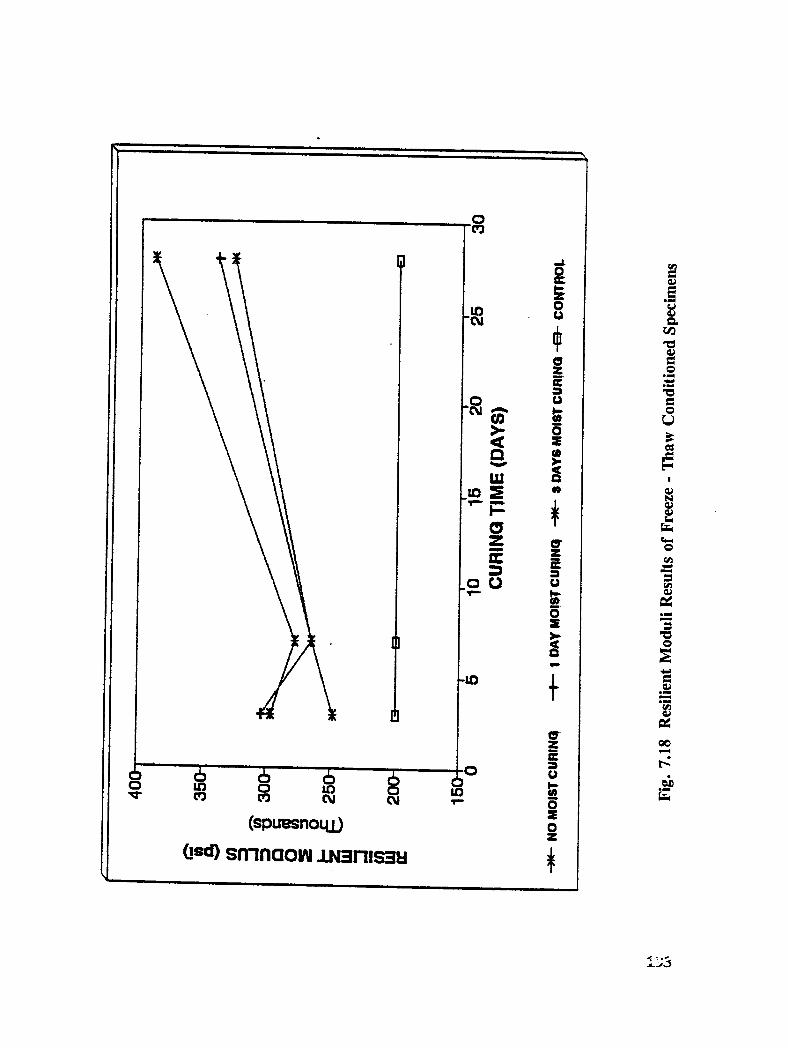
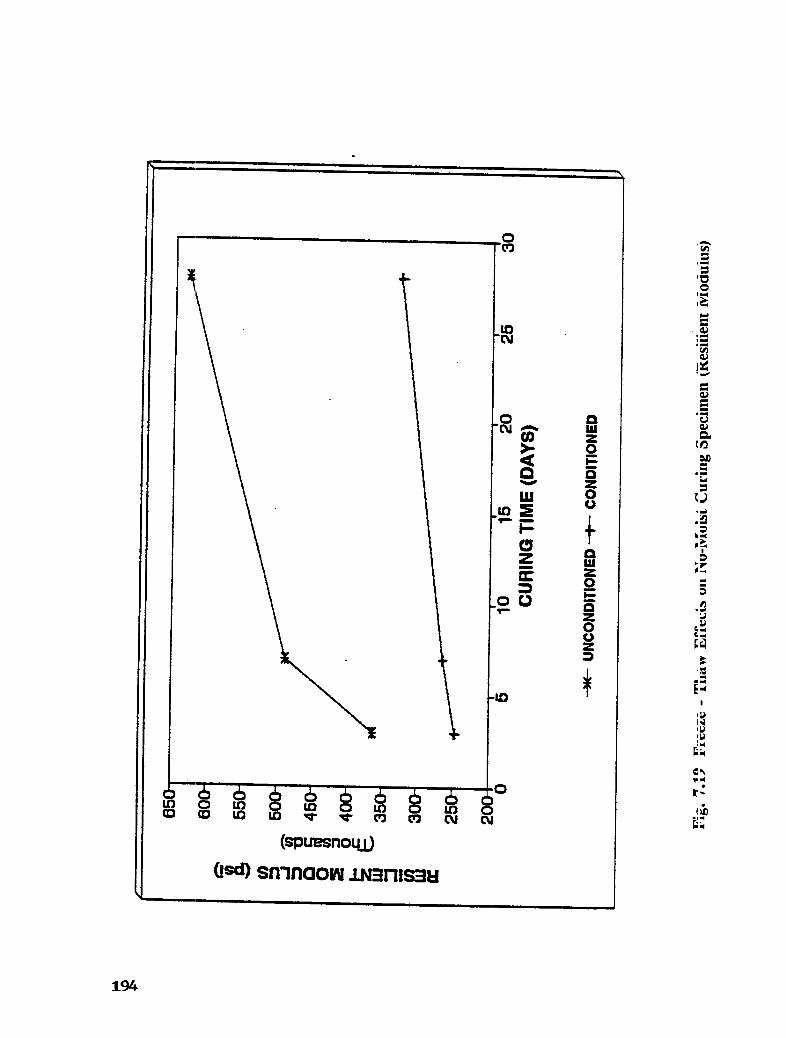
APCCC specimens were evaluated for stability, indirect tensile strength, compressivestrength, resilient modulus, water sensitivity, freeze-thaw effect and more importantly, forchloride intrusion. Specimens were moist cured for zero days, one day, or three days as partof total curing time, and tested after 1 day, 3 days, 7 days, and 28 days of curing (moist plusair).
All test results were compared with those of hot-mix asphalt, cast in accordance withVirginia surface mix SM-5; results of chloride intrusion resistance were compared to those ofportland cement concrete specimens exposed to similar conditions. The investigationconcluded that APCCC possesses greater strength properties and higher resistance tostripping and freeze-thaw effects than does hot-mix asphalt. Its resistance to chlorideintrusion is found to be two to three times that of normal portland cement concrete. Also,
the study suggested that the optimum moist curing is one day.
The study concluded that APCCC could be an effective alternative technique to be used as anoverlay on bridge decks along with preformed membranes due to its high strength, durability,and lower air void contentand may be used to rehabilitate existing bridge decks with anasphalt membrane system without removing the existing membrane.
7
1
Introduction
Background
Recently, a U. S. Department of Transportation report stated that 39% of the 576,665bridges in the nation's federally aided highway system are structurally deficient orfunctionally obsolete (1). Approximately, 20% of the cost to rehabilitate these bridges isattributed to chloride-induced corrosion of reinforced concrete.
Premature deterioration of reinforced concrete bridge decks was first recognized by highwayagencies in the late 1950's and early 1960's. An initial study suggested that the principalcause was spalling which resulted from steel reinforcing bar corrosion (2,3). The primarysource of chlorides in the northern climates is deicing salts, while in marine environments itis sea water and spray. Damage in marine environments may occur within 5 years ofexposure (4).
Prior to the initiation of corrosion, estimated to be 1.2 Ibs Cl/yd 3 (0.72 kg/m3), the pH ofthe concrete (greater than 12.5) is sufficiently high to prevent the corrosion of unprotectedreinforcement steel (5). The ingress of chlorides disrupts the protective layer of ferric oxideon the reinforcement steel. This breakdown, along with sufficient moisture and free oxygencreate a spontaneous corrosion environment.
Corrosion of the reinforcement steel results in cracking, delamination, and spalling of theconcrete cover. The damage is not usually sufficient to jeopardize the structural loadcapacity (6). However, the bridge rideability is affected by bridge deck damage and createspoor travel conditions. Bridge decks are usually rehabilitated when 20 to 40 % of the ridingsurface is spalled and/or delaminated (7).
By the 1970's, highway agencies had begun to identify the enormous cost involved in therepair and rehabilitation of deficient bridge components. In 1986, the cost of repairingbridges damaged by corrosion alone was estimated at $20 billion with an annual increase of
9
$0.5 billion (8).
A first response to bridge deck deterioration was to modify the design parameters. Thecover depth was increased from 2 in (51 mm) to 3 in (76 mm) which prolonged the timeneeded for the chloride to reach the top steel mat. The water to cement ratio was reduced to0.4 - 0.45 which would decrease the permeability of the concrete as well as reduce the rateof chloride diffusion. These methods did not abate or stop corrosion; however, they didextend the time required to initiate it.
Currently, several methods are used to prevent, repair, and rehabilitate bridge componentsdeterioration by chloride-induced corrosion. These methods can be divided into threecategories:
1. protect the reinforcing steel,2. reduce the concrete permeability and thus rate of diffusion, and3. electrochemical protection
In new structures, reinforcing steel may be protected by coating the steel prior to placing theconcrete or by using a corrosion inhibitor admixture. Epoxy-coated rebars have been widelyused in bridge construction after the advent of a bridge deck protection policy in 1972 (9).Although thermal cure of applied dry powdered epoxy is considered the best coating, thecoating reliability in general is still debatable due to shipping and handling damage. Thedielectric properties of the coating prevent the electrical coupling of the mats when only thetop mat is coated, thus preventing macro-cell corrosion. However, imperfections can lead toaccelerated corrosion (10). Galvanized reinforcing steel has also been used. A galvaniccouple is produced by the zinc which protects the steel even if the coating is damaged.
Concrete coatings and sealers have been used on new bridge components where chloridecontamination is not yet critical. These materials are considered low initial cost protectionmethods. Another common corrosion prevention practice is the use of organic and inorganiccorrosion inhibiting admixtures. Although the performance of inhibitors depends on thechemical composition of the inhibitor and the factors causing corrosion, inhibitors generallyform a stable film on the rebar surface.
The most common repair techniques (chloride contaminated concrete left-in-place) used onbridge decks are overlay systems: latex modified concrete, low slump dense concrete, thinpolymer, and hot-mix asphalt in conjunction with a membrane. These overlay systemsattempt to reduce the ingress of chlorides and moisture and thus reduce the corrosion ofreinforcing steel.
Prior to overlay, the unsound concrete is normally removed to or below the bar level and theexposed rebar is sandblasted to near white metal. This process is extremely expensive anddoes not guarantee the removal of all of the corrosion products from the bar. Thepreparation described above does not address the areas where the corrosion has not advanced
10
to a state where the concrete has cracked or delaminated, even though these areas may becritically chloride contaminated. If this is the case, then the corrosion process will continue,if the necessary moisture and free oxygen are available. Thus, the anticipated improvementin service life using these repair techniques may be significantly reduced because the steelcontinues to corrode in the critically chloride contaminated areas.
Two electrochemical rehabilitation methods have been developed, cathodic protection andchloride migration. Cathodic protection supplies an external source of current to thereinforcing steel, reversing the corrosion reaction. The current is applied through an externalanode added to the structure using a power of approximately 0.015 watts/m 2 of concrete (11),this power is minimal and can be supplied by a solar panel. This method can only beapplied to structures with electrically continuous reinforcing steel. In the chloride removalmethod, a DC potential is applied to the concrete which causes the chloride ions to migrateto a surface anode where they are captured by an electrolyte solution (12).
In this report, an evaluation of some of the existing techniques used to reduce or abatecorrosion of steel reinforcement is presented. In addition, new inhibitors and overlaysystems were evaluated in the laboratory.
Scope and Objectives
The main objectives of this project are two: to improve the existing non-electrochemicalcorrosion rehabitation techniques and to develop new non-electrochemical methods forrehabilitating chloride contaminated concrete bridge components. To satisfy the objectives ofthis study, existing techniques for rehabilitating chloride- contaminated concrete bridgecomponents were identified. The identified techniques were investigated to determine theirsuccess and possible improvement. Two bridge decks treated by monomer impregnation inPennsylvania in the last decade were evaluated to determine the corrosion reductioneffectiveness of deep polymer-impregnated concrete. Calcium nitrite impregnation of abridge deck and a calcium nitrite column repair in Virginia were conducted and thetechniques were evaluated.
To improve the deep polymer-impregnation technique, scaled down concrete bridge deckspecimens were cast and evaluated in the laboratory in a controlled environment. Fivedifferent methods were used: Latex-Modified Concrete (LMC) overlay, Low Slump DenseConcrete (LSDC) overlay, polymer impregnation, impregnation of specimens overlaid byLMC and impregnation of specimens overlaid by LSDC. The optimum drying temperatureprior to monomer impregnation was investigated using mortar cubes and concrete specimens.The nature and distribution of impregnated polymer molecules in concrete was evaluatedusing a Scanning Electron Microscope (SEM). The effect of monomer impregnation onresistivity was also examined for normal mortar as well as chloride-contaminated mortar.
This study also evaluated the effectiveness of the inhibitors, identified in Task 2 (13) of the
11
project, when applied in a manner practical for field construction and determined theprocedure which should be employed to ensure their successful application. This part of theproject was performed in three phases: evaluation of corrosion inhibitors, development offield technique, and estimation of the service life of the developed techniques.
Asphalt Portland Cement Concrete Composite (APCCC) was also evaluated as a bridge deckoverlay material to replace the hot-mix asphalt on decks with preformed membranes. Theinvestigation included the design of APCCC mixtures and the evaluation of APCCC formechanical properties and durability characteristics.
Research Approach
The research approach employed in the pursuit of the objectives of the research consisted ofthe following steps:
• Identification of existing and promising rehabilitation techniques* Evaluation of existing rehabilitation techniques in the field° Improving existing rehabilitation techniques• Development of new promising rehabilitation techniques• Laboratory evaluation of feasible rehabilitation techniques for decks with a
hot-mix asphalt (HMA) overlay-membrane protection system• Recommendation of feasible rehabilitation techniques for field validation
12
Part I: Improving Existing RehabilitationTechniques
2
Polymer Impregnated Deck Installations
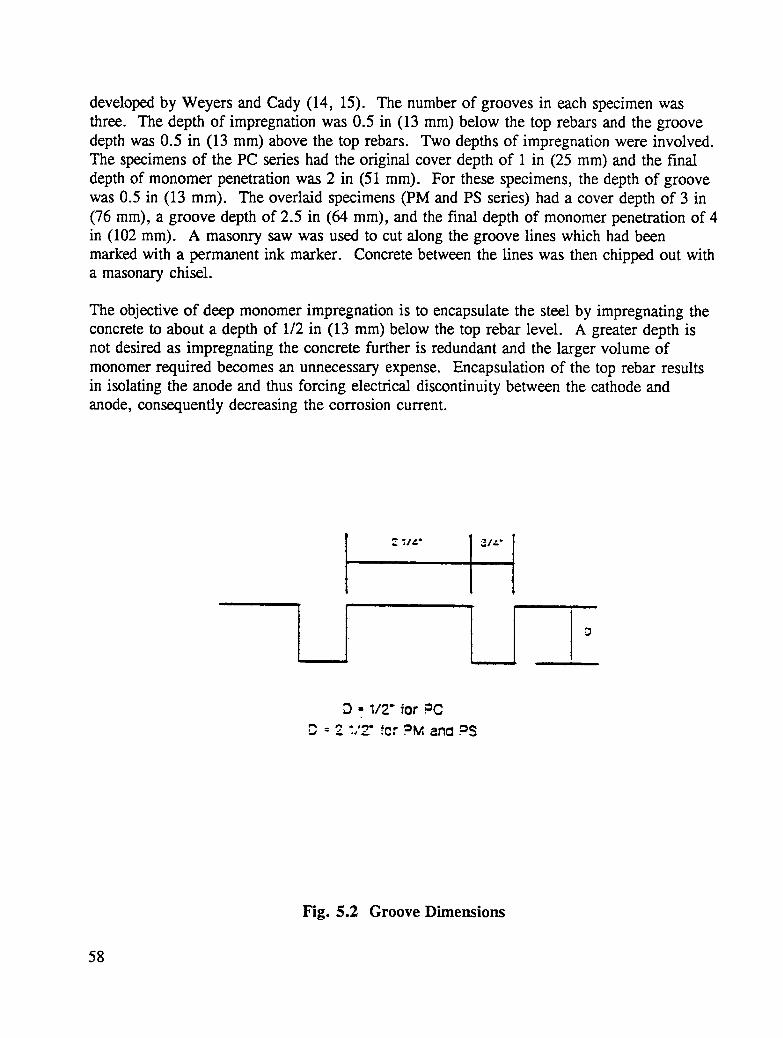
Introduction
In 1972, the National Cooperative Highway Research Program (NCHRP) sponsored aresearch project with an objective of developing a monomer impregnation process for bridgedecks. The process involves drying the concrete, monomer impregnation to a depth of 4 in(102 mm) to encapsulate the upper rebar mat, and then polymerizing the monomer in situ.The deep impregnation process should abate or arrest the reinforcing steel corrosion byreplacing the corrosion cell electrolyte (concrete pore water) with a dielectric polymer,immobilizing the existing chloride and reducing the ingress of further chlorides, water andoxygen. The research project culminated in the impregnation of a test section 3.5 ft by 11.5ft (1.1 m by 3.5 m) of a bridge deck in Bethlehem, Pennsylvania.
In 1985, the Pennsylvania Department of Transportation (Penn Dot) sponsored a researchproject to demonstrate the technical and economical feasibility of full scale impregnation ofbridge decks. Approximately one-half, 60 ft by 44 ft (18 m by 13.4 m), of a 131 ft (39.9 m)long center span of a bridge deck in Boalsburg, Pennsylvania was impregnated to a designdepth of 4 in (102 mm) using the grooving technique (14,15).
Field corrosion performance investigations were conducted on both bridge decks in 1989. InMarch of 1990, the Bethlehem bridge deck was replaced. Prior to replacement, theimpregnated section and an adjoining untreated control section were removed for furtherstudy. These decks sections are maintained in the outdoor exposure area at the VirginiaPolytechnic Institute and State University, Civil Engineering, Structures and MaterialsResearch Laboratory (S&M Lab). Since then, the corrosion activity has been periodicallymonitored. A second post-treatment corrosion assessment was carded out on the Boalsburgbridge in May 1992. The results of the corrosion performance surveys are presented,including: visual inspection, delamination survey, cover-depth survey, chloride contents as afunction of depth, corrosion potentials, petrographic analysis of drilled concrete cores, andcorrosion current density measurements.
15
Performana_ of Boalsburg Bridge Deck
Background
The Boalsburg bridge is a three-span multi-girder bridge, simply supported with steel plategirders. The end spans are 42 ft (12.8 m) and 38 ft (11.6 m) and the center span is 131 ft(40 m). The deck width, curb to curb, is 44 ft (13.4 m), consisting of two 12 ft (3.7 m)traffic lanes and two 10 ft (3.5 m) aprons. The concrete deck was placed in April 1972using permanent steel forms; it is composite design. The main reinforcement consists of No.5 bars on 6 in (15.2 cm) centers in the transverse direction, top and bottom. Thelongitudinal steel consists of No. 4 bars at 12 in (30.4 cm) in the top and No. 5 bars at 9 in(22.9 cm) in the bottom. The design deck thickness is 8 in (20.3 cm), with a 2 in (51 ram)minimum concrete cover depth.
Physical Damage Survey
In March 1983, a visual inspection of the deck indicated that the deck was in excellentcondition. The only deterioration observed was a series of shallow spalls about 0.5 in (12.7ram) deep immediately adjacent to the expansion joint cover plate at the east end of thecenter span. A cover depth survey showed the mean cover depth to be 2.9 in (72.6 mm)with a range of 2.3 to 3.3 (58.4 to 83.8 mm) and a standard deviation of 0.22 in (5.6 mm).
The mean value of the Copper-Copper Sulfate (CSE) half-cell measurements performed inMarch 1983, was -176 mV with a standard deviation of -28 mV. Therefore, the probabilitywas less than 10% that active corrosion cells existed in about 80% of the deck, and theremaining 20 % of the area showed potentials in the questionable zone. Chloride samplingand analyses, obtained at the same time demonstrated that less than 0.005 % of thereinforcing steel had a chance of being above the chloride corrosion threshold level (1.2lbs/yd 3, 0.71 Kg/m3). No delaminations associated with reinforcing steel corrosion werediscovered in March, 1983. It must be noted that all of these measurements were takenmore than two years prior to impregnation which took place in June 1985.
A section, approximately one-half the center span, 60 ft (18.3 m) long by 44 ft (14.6 m)wide was monomer (methyl methacrylate) impregnated using the grooving technique andpolymerized in situ in June, 1985 (16). The grooves were backfilled with latex modifiedmortar. The impregnation depth was approximately 3.5 in (89 mm).
Immediately after impregnation, drying shrinkage cracking was observed in both theimpregnated and control section cores. The observed cracks were fine and generallyshallow, less than 0.5 in (12 ram). The cracking frequency was almost the same for thecontrol and impregnated section. However, the cracks in the impregnated section weregenerally deeper.
16
In May 1992, a visual inspection and delamination survey showed that the deck was inexcellent condition after approximately 7 years of impregnation and 9 years after the pre-impregnation condition survey. The only visual evidence of concrete deterioration was a fewdelaminated areas along the east expansion joint in the control section. These delaminationswere in the same locale as the previously noted spalls which had been repaired at an earlierdate, which supports the suggestion that they were probably the result of poor constructionpractices. No additional delaminations were detected in the impregnated or control sections.
A cover depth survey was conducted on the entire center span. The mean cover depth was2.6 in (66 mm) with a range of 2.1 to 3.1 in (54 to 79 ram) and a standard deviation of 0.19in (5 mm) for 80 observations.
Chloride Contamination Levels
In March 1983, powdered concrete samples for chloride analyses were taken at mean depthsof 0.25, 0.75, 1.50, and 2.5 in (6.4, 19.1, 38.1, and 63.5 mm) in the aprons, right wheelpath, and the center of wheel path locations in both the to-be-impregnated and control areason the eastbound side of the bridge. Six years later, five powdered concrete samples weretaken from the outer wheel path in both the impregnated and control sections. The meandepths for these samples were 0.5, 1.0, 1.5, 2.0, 2.75, and 3.63 in (12.7, 25.4, 38.1, 50.8,69.9, and 92.2 mm). Thirty powdered concrete samples were taken in May 1992. Thesamples were taken in the aprons, right wheel path, and center of wheel path locations inboth the impregnated and control areas of the eastbound and westbound sides of the bridge.The mean sample depths were 0.5, 1.0, 1.5, 2.0, 2.5, and 3.0 inches (12.7, 25.4, 38.1,50.8, 63.5, and 76.2 mm).
The difference between the right wheel path chloride contents for the samples collected in1989 and 1983 and that of 1983 and 1992, for the impregnated and control sections, arepresented in Tables 2.1 and 2.2, respectively. This would be a measure of the effectivenessof the impregnation process to exclude or reduce the intrusion of chloride ions. Thedifference between the eastbound, right wheel path chloride contents were higher for thecontrol section for all depths except 2.5 in (64 mm) for both periods. The mean chloridecontent at a depth of 2.5 in (63.5 mm) was less than 1.2 lb/yd 3 (0.71 kg/m 3) of concrete inall cases, although there is some variability in the measurement technique. As has beennoted earlier, the first powdered concrete samples were obtained a little over 2 years beforethe section was monomer impregnated.
Though no pre-impregnation measurements were taken in the shoulder and the center ofwheel path areas, a relative comparison can be made between the current average chloridecontent in the impregnated and control sections. The results of these comparisons are shownin Tables 2.3 and 2.4 for the shoulder and center of wheel path, respectively.
17
Table 2.1 Difference in Average Chloride Content in Right Wheel Path,Eastbound Lane, 1983-1989
Without pre-irnpregnation chloride content measurements for these areas, it is impossible todraw firm conclusions as to the effectiveness of the impregnation process; however, theresults indicate that the impregnation process reduced the rate of chloride diffusion.
18
Table 2.3 Average Chloride Content in Shoulder, East and WestboundLanes, 1992
Depth Chloride Content (lbs/yd a) Difference Percent(in) (Con-Imp) Difference
In addition to the effectiveness of the impregnation process in reducing chloride intrusion, thepercent of reinforcing steel presently in critically contaminated concrete is also of interest.The chloride contamination levels at the depth of the reinforcing steel for the impregnatedand control sections in May, 1992 were approximately equal. Assuming 1.2 lb/yd 3 (0.71kg/m 3) of concrete as the corrosion threshold level, 0.03% of the reinforcing steel in thewheel paths was located in critically contaminated concrete, based on the cover depthdistributions as of May 1992.
Corrosion Potentials
Corrosion half-cell potentials were measured with a CSE in March 1983 and 1989 and in
19
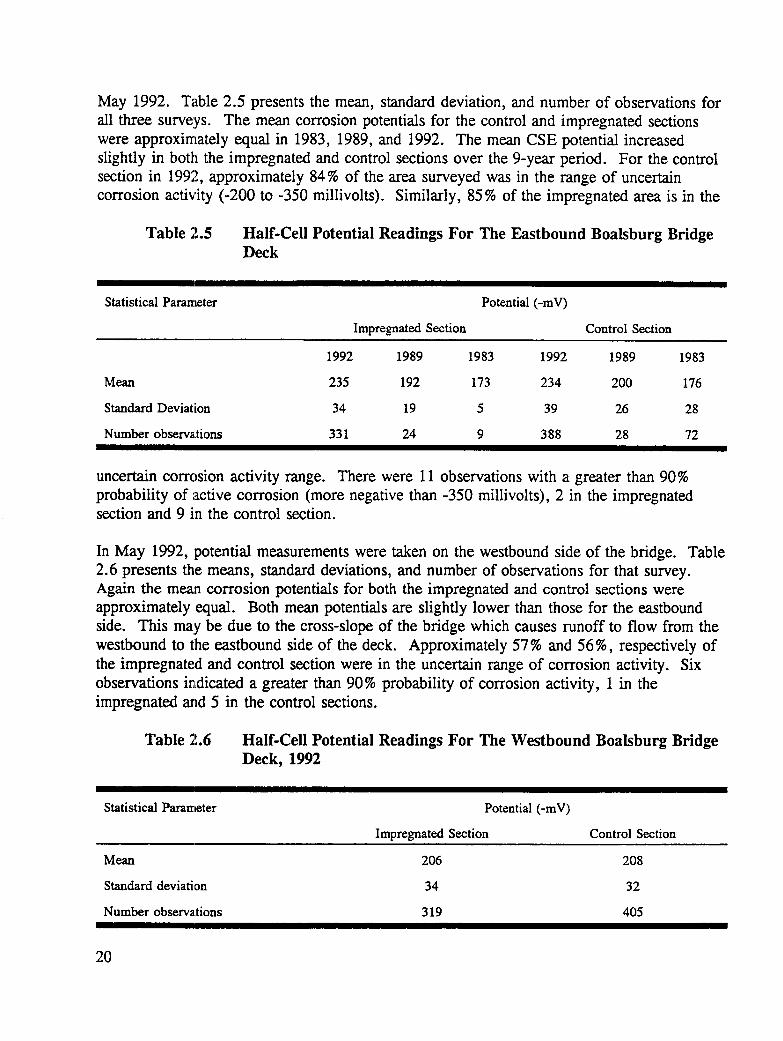
May 1992. Table 2.5 presents the mean, standard deviation, and number of observations forall three surveys. The mean corrosion potentials for the control and impregnated sectionswere approximately equal in 1983, 1989, and 1992. The mean CSE potential increasedslightly in both the impregnated and control sections over the 9-year period. For the controlsection in 1992, approximately 84% of the area surveyed was in the range of uncertaincorrosion activity (-200 to -350 millivolts). Similarly, 85% of the impregnated area is in the
Table 2.5 Half-Cell Potential Readings For The Eastbound Boalsburg BridgeDeck
Statistical Parameter Potential (-mV)
Impregnated Section Control Section
1992 1989 1983 1992 1989 1983
Mean 235 192 173 234 200 176
Standard Deviation 34 19 5 39 26 28
Number observa.tions 331 24 9 388 28 72
uncertain corrosion activity range. There were 11 observations with a greater than 90%probability of '.activecorrosion (more negative than -350 millivolts), 2 in the impregnatedsection and 9 in the control section.
In May 1992, potential measurements were taken on the westbound side of the bridge. Table2.6 presents the means, standard deviations, and number of observations for that survey.Again the mean corrosion potentials for both the impregnated and control sections wereapproximately equal. Both mean potentials are slightly lower than those for the eastboundside. This may be due to the cross-slope of the bridge which causes runoff to flow from thewestbound to the eastbound side of the deck. Approximately 57% and 56%, respectively ofthe impregnated and control section were in the uncertain range of corrosion activity. Sixobservations indicated a greater than 90% probability of corrosion activity, 1 in theimpregnated and 5 in the control sections.
Table 2.6 Half-Cell Potential Readings For The Westbound Boalsburg BridgeDeck, 1992
Statistical Parameter Potential (-mV)
Impregnated Section Control Section
Mean 206 208
Standard deviation 34 32
Number observations 319 405
20
Petrographic Analysis
Four inch diameter cores were drilled with a water cooled diamond bit for petrographicanalysis, two in the impregnated section and two in the control section. The depth ofimpregnation was determined to be 3 to 4 in (76.2 to 101.6 mmm) which agrees withprevious findings (16).
Petrographic analysis indicated that the concrete composition volume values were in therange of typical construction grade concrete. The coarse aggregate was a crushed limestone.The fine aggregate was a highly siliceous natural sand. Both the fine and coarse aggregateswere good quality aggregates. However, the quality of the cement paste was poor, showingconsiderable evidence of excessive mixing water. In addition to drying shrinkage cracks,there was excessive near-surface porosity and bleeding channels and high porosity and largeirregularly-shaped voids adjacent to coarse aggregate particles. Cracking was numerous,though minor, and was equally distributed between the impregnated and the control sections.
Two of the 4 cores contained steel rebar; one in the impregnated and one in the control area.The core from the impregnated area showed no corrosion. The core in the control areashowed heavy corrosion deposits from a supporting chair. The core was located immediatelyadjacent to a sliding plate expansion joint at the east end of the span. This was the areawhere spalling had occurred.
Corrosion Current
In May 1992 and March 1990, corrosion current density (ico,0 measurements were taken inboth the control and impregnated areas. In March 1990, the measurements were taken usinga 3LP device. The device is based on the linear polarization resistance technique withchanges in cathodic polarization currents measured at changes in potentials of 0, 4, 8, and 12millivolts. The value of the Tafel slope constant, B, is 40.76 millivolts. In May 1992, theGeocisa Gecor device was used in addition to the 3LP. The Gecor device is also based on
the linear polarization resistance technique with the addition of a guard ring electrode toconfine the area of polarization. The value of the Tafel slope constant, B for this device is26 millivolts. Table 2.7 presents the means, standard deviation, and number of observationsfor the 3LP and Gecor i_,,_measurements taken on the eastbound side of the deck. Table2.8, presents the results of the May 1992 icon.measurements and the cover depth at the testlocations.
21
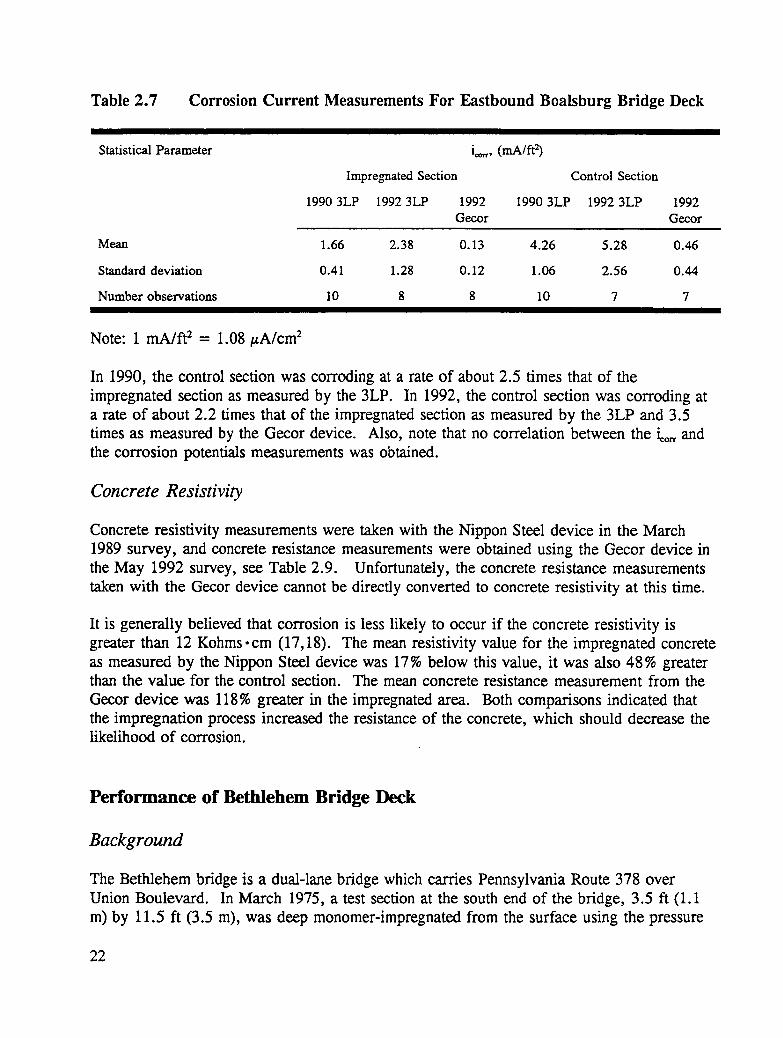
Table 2.7 Corrosion Current Measurements For Eastbound Boalsburg Bridge Deck
In 1990, the control section was corroding at a rate of about 2.5 times that of theimpregnated s_z.tionas measured by the 3LP. In 1992, the control section was corroding ata rate of about 2.2 times that of the impregnated section as measured by the 3LP and 3.5times as measured by the Gecor device. Also, note that no correlation between the i_o_andthe corrosion potentials measurements was obtained.
Concrete Resistivity
Concrete resistivity measurements were taken with the Nippon Steel device in the March1989 survey, and concrete resistance measurements were obtained using the Gecor device inthe May 1992 survey, see Table 2.9. Unfortunately, the concrete resistance measurementstaken with the Gecor device cannot be directly converted to concrete resistivity at this time.
It is generally believed that corrosion is less likely to occur if the concrete resistivity isgreater than 12 Kohms.cm (17,18). The mean resistivity value for the impregnated concreteas measured by the Nippon Steel device was 17% below this value, it was also 48% greaterthan the value for the control section. The mean concrete resistance measurement from theGecor device was 118% greater in the impregnated area. Both comparisons indicated thatthe impregnation process increased the resistance of the concrete, which should decrease thelikelihood of corrosion.
Performance of Bethlehem Bridge Deck
Background
The Bethlehem bridge is a dual-lane bridge which carries Pennsylvania Route 378 overUnion Boulevard. In March 1975, a test section at the south end of the bridge, 3.5 ft (1.1m) by 11.5 ft (3.5 m), was deep monomer-impregnated from the surface using the pressure
22
Table 2.8 Corrosion Current Measurements for the Boalsburg Bridge Deck, 1992
method. The bridge was 8 years old at the time of impregnation. The wheel path areaswere deeply rutted. The chloride content at the reinforcing steel depth in the impregnatedarea exceeded the corrosion threshold level but the deck was sound, with no spalled orpatched areas. Details of the deep impregnation with methyl methacrylate and in situpolymerization of the field test installation are presented by Mason et al. (19).
23
A visual examination of the bridge in December, 1983 revealed some obvious differences inperformance between the deck in general and the deep-impregnated test area. The visualdifference in performance initiated an investigation to identify the cause of the difference inthe visual corrosion protection performance. An investigation performed in February 1984consisted of a delamination survey, corrosion potential measurements, chloride contentanalysis, and a microscopic analysis of drilled concrete cores. The results of the study
Table 2.9 Concrete Resistivity and Resistance Measurements of The Boalsburg]Bridge Deck
have been reported by Cady and Weyers (20). A second investigation, performed in March1989, consisted of a visual inspection, delamination survey, corrosion potentials andmicroscopic analysis of drilled concrete cores.
In March 1990 the structure was replaced. Both the deep-impregnated test section and anadjoining section, 4.6 ft (1.4 m) by 10.3 ft (3.1 m), were removed and subsequently placedin the outdoor exposure area of the S&M Lab. Sections of both slabs were damaged duringremoval.
Visual Inspection and Delaminations
A visual inspection and delamination survey of an area about 14 ft (4.3 m) by 37 ft (11.3 m),encompassing the impregnated test area, was performed at the south end of the northboundtraffic lane in lvlarch 1989. Approximately, 20% of the non-impregnated area wasdelaminated or spalled due to reinforcing steel corrosion, whereas, the impregnated arearemained sound with no patched spalls, spalls, or delaminations, although one comer of theimpregnated area was patched as part of a repair to an adjacent spall in the untreated area.
The 2 deck sections which were transported to S&M Lab in May 1990, a visually inspectedand a delamination survey was conducted upon arrival. The impregnated slab area was 38 ft2(3.5 m2). One of the comers of the slab, 3.6 ft2 (0.3 m2), was damaged during removal. Anadditional 1.9 ft2 (0.2 m2) of one comer had been patched during the repair of an adjacentspall in an untreated area of the original bridge deck. No delaminations were located. Thedamaged comer was repaired with LMC.
24
The control slab area was 47 ft2 (4.4 m2) in area. A delamination survey revealed that 10.4ft2 (1.0 m2), roughly 22%, of the control slab was delaminated. In addition, 3.4 ft2 (0.3 m2)of the slab had been previously patched. The concrete in the damaged area was removed tothe bar level with a 50 Ib (23 kg) jack hammer. The exposed rebar was sandblasted to nearwhite metal. The damaged areas were patched with latex modified concrete, and a 2 in (51mm) overlay was placed over the entire slab in July 1990.
Cracking between the overlay and the substrate concrete was noticed on the edges of thecontrol slab in April 1991. A subsequent delamination survey found that 71% of the overlayhad delaminated from the substrate concrete. These delaminations were the result of poorconstruction practice.
The delaminated area was outlined with a concrete saw to a depth of 3/4 in (19 ram) and thedelaminated concrete removed with an impact hammer fitted with a chipper bit. A seconddelamination survey on the substrate concrete located an additional 1.3 ft2 (0.1 m2) ofcorrosion-induced delamination. The delaminated concrete was removed to a depth of 3/4 in(19 mm) below the rebar. Corrosion products were cleaned from the exposed rebar and anew LMC overlay was placed.
The most recent visual inspection and delamination survey was conducted in June 1992.Neither the impregnated slab or the control slab showed any sign of deterioration at thattime.
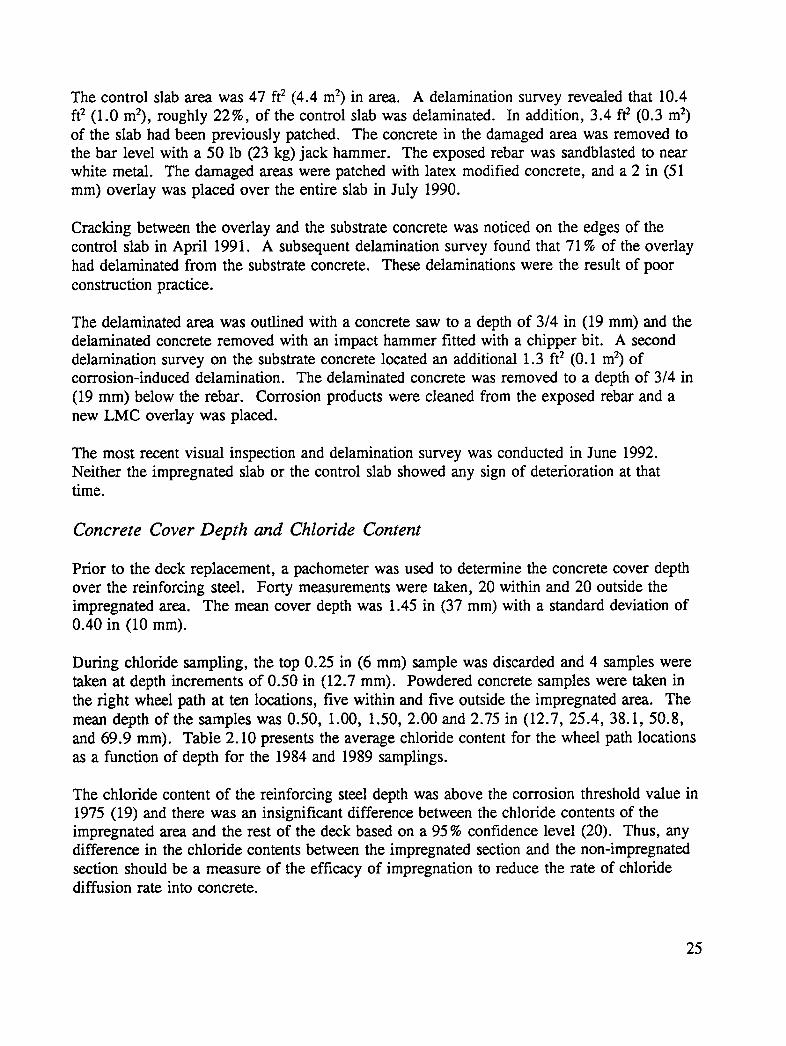
Concrete Cover Depth and Chloride Content
Prior to the deck replacement, a pachometer was used to determine the concrete cover depthover the reinforcing steel. Forty measurements were taken, 20 within and 20 outside theimpregnated area. The mean cover depth was 1.45 in (37 mm) with a standard deviation of0.40 in (10 mm).
During chloride sampling, the top 0.25 in (6 mm) sample was discarded and 4 samples weretaken at depth increments of 0.50 in (12.7 mm). Powdered concrete samples were taken inthe right wheel path at ten locations, five within and five outside the impregnated area. Themean depth of the samples was 0.50, 1.00, 1.50, 2.00 and 2.75 in (12.7, 25.4, 38.1, 50.8,and 69.9 mm). Table 2.10 presents the average chloride content for the wheel path locationsas a function of depth for the 1984 and 1989 samplings.
The chloride content of the reinforcing steel depth was above the corrosion threshold value in1975 (19) and there was an insignificant difference between the chloride contents of theimpregnated area and the rest of the deck based on a 95 % confidence level (20). Thus, anydifference in the chloride contents between the impregnated section and the non-impregnatedsection should be a measure of the efficacy of impregnation to reduce the rate of chloridediffusion rate into concrete.
25
As presented in Table 2.10, chloride contents in both the impregnated and control areaappeared to have continued to increase during the five year time period. The difference inchloride contents between the measurements indicate that more chloride penetrated theimpregnated concrete than the control concrete for the top 1 in (25 mm) of concrete.Research by Dutta (21) indicates that at higher drying temperatures, such as those usedduring drying, not all voids accessible by water would be filled by the monomer, probablydue to the large size of the organic monomer molecules. As a result, the impregnationprocess may make the top 1 in (25 mm) of concrete more susceptible to chloride intrusion.
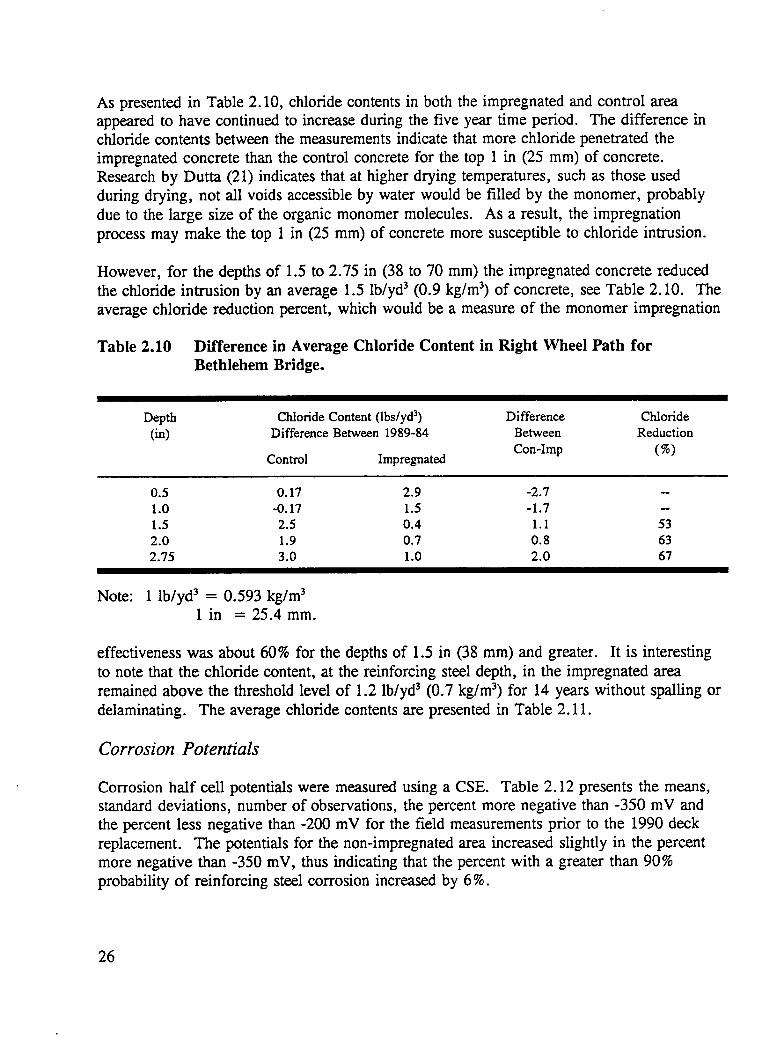
However, for the depths of 1.5 to 2.75 in (38 to 70 mm) the impregnated concrete reducedthe chloride intrusion by an average 1.5 lb/yd 3 (0.9 kg/m 3) of concrete, see Table 2. i0. Theaverage chloride reduction percent, which would be a measure of the monomer impregnation
Table 2.10 Difference in Average Chloride Content in Right Wheel Path forBethlehem Bridge.
Depth Chloride Content (lbs/yd 3) Difference Chloride(in) Difference Between 1989-84 Between Reduction
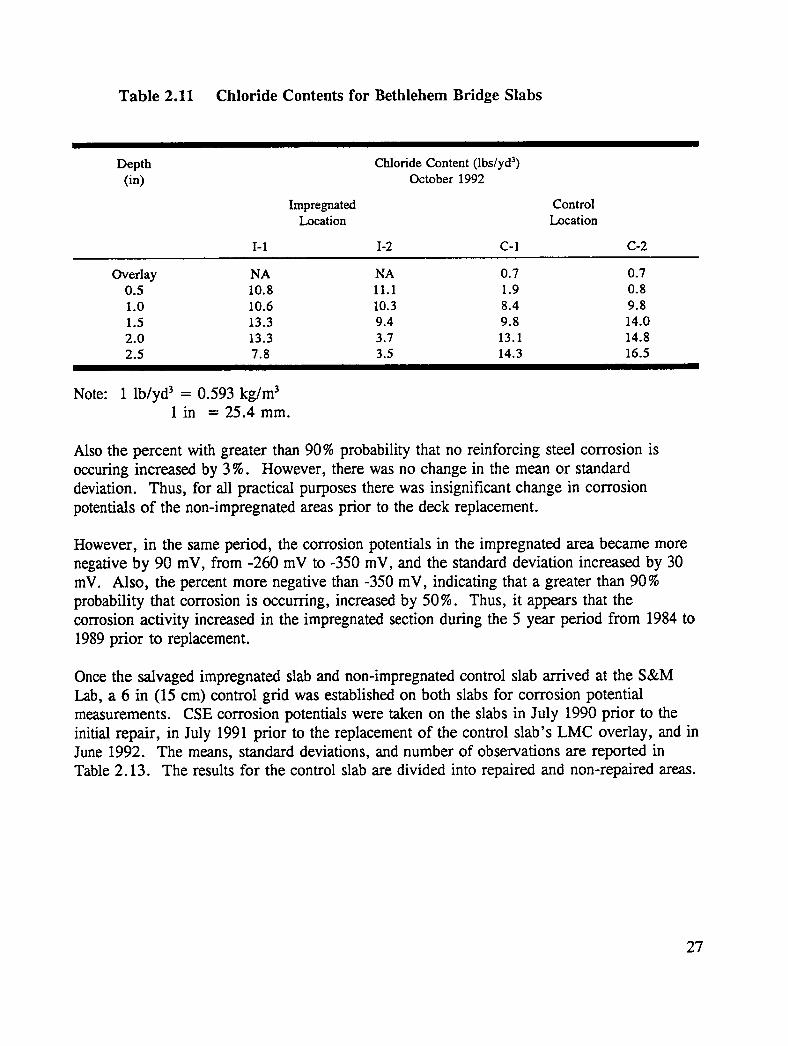
effectiveness was about 60% for the depths of 1.5 in (38 mm) and greater. It is interestingto note that the chloride content, at the reinforcing steel depth, in the impregnated arearemained above the threshold level of 1.2 lb/yd 3 (0.7 kg/m 3) for 14 years without spalling ordelaminating. The average chloride contents are presented in Table 2.11.
Corrosion Potentials
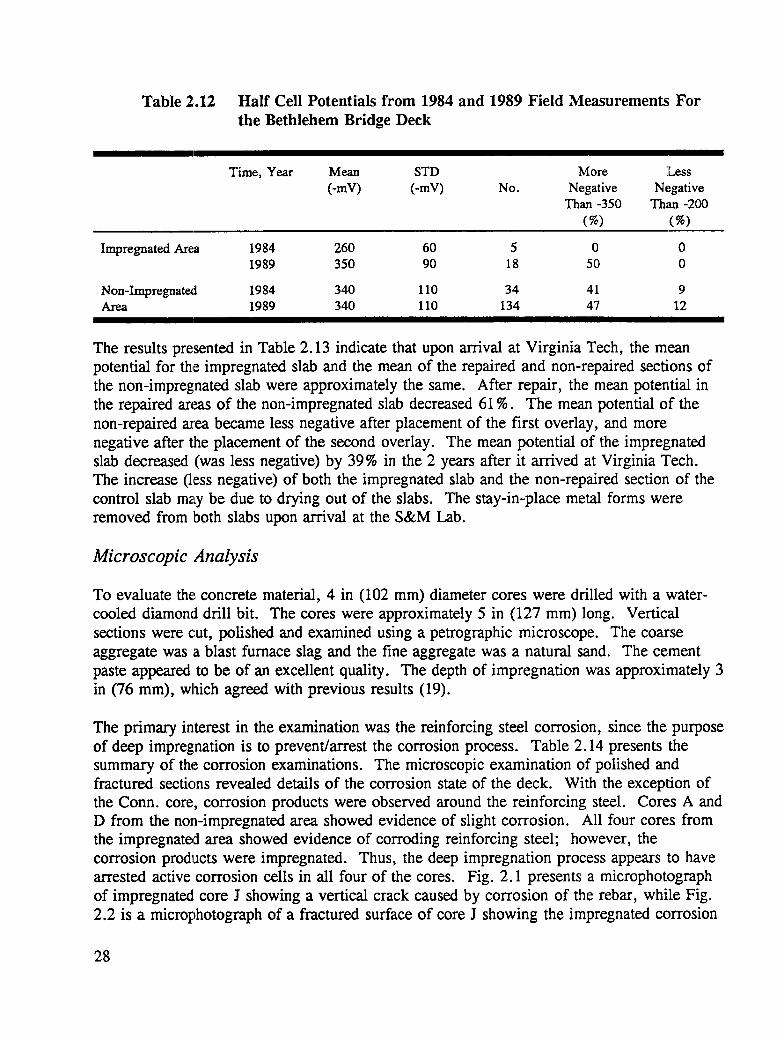
Corrosion half cell potentials were measured using a CSE. Table 2.12 presents the means,standard deviations, number of observations, the percent more negative than -350 mV andthe percent less negative than -200 mV for the field measurements prior to the 1990 deckreplacement. The potentials for the non-impregnated area increased slightly in the percentmore negative than -350 mV, thus indicating that the percent with a greater than 90%probability of reinforcing steel corrosion increased by 6%.
26
Table 2.11 Chloride Contents for Bethlehem Bridge Slabs
Depth Chloride Content (Ibs/yd 3)(in) October 1992
Also the percent with greater than 90% probability that no reinforcing steel corrosion isoccuring increased by 3 %. However, there was no change in the mean or standarddeviation. Thus, for all practical purposes there was insignificant change in corrosionpotentials of the non-impregnated areas prior to the deck replacement.
However, in the same period, the corrosion potentials in the impregnated area became morenegative by 90 mV, from -260 mV to -350 mV, and the standard deviation increased by 30mV. Also, the percent more negative than -350 mV, indicating that a greater than 90%probability that corrosion is occurring, increased by 50%. Thus, it appears that thecorrosion activity increased in the impregnated section during the 5 year period from 1984 to1989 prior to replacement.
Once the salvaged impregnated slab and non-impregnated control slab arrived at the S&MLab, a 6 in (15 cm) control grid was established on both slabs for corrosion potentialmeasurements. CSE corrosion potentials were taken on the slabs in July 1990 prior to theinitial repair, in July 1991 prior to the replacement of the control slab's LMC overlay, and inJune 1992. The means, standard deviations, and number of observations are reported inTable 2.13. The results for the control slab are divided into repaired and non-repaired areas.
27
Table 2.12 Half Cell Potentials from 1984 and 1989 Field Measurements Forthe Bethlehem Bridge Deck
Time, Year Mean STD More :Less(-mV) (-mV) No. Negative Negative
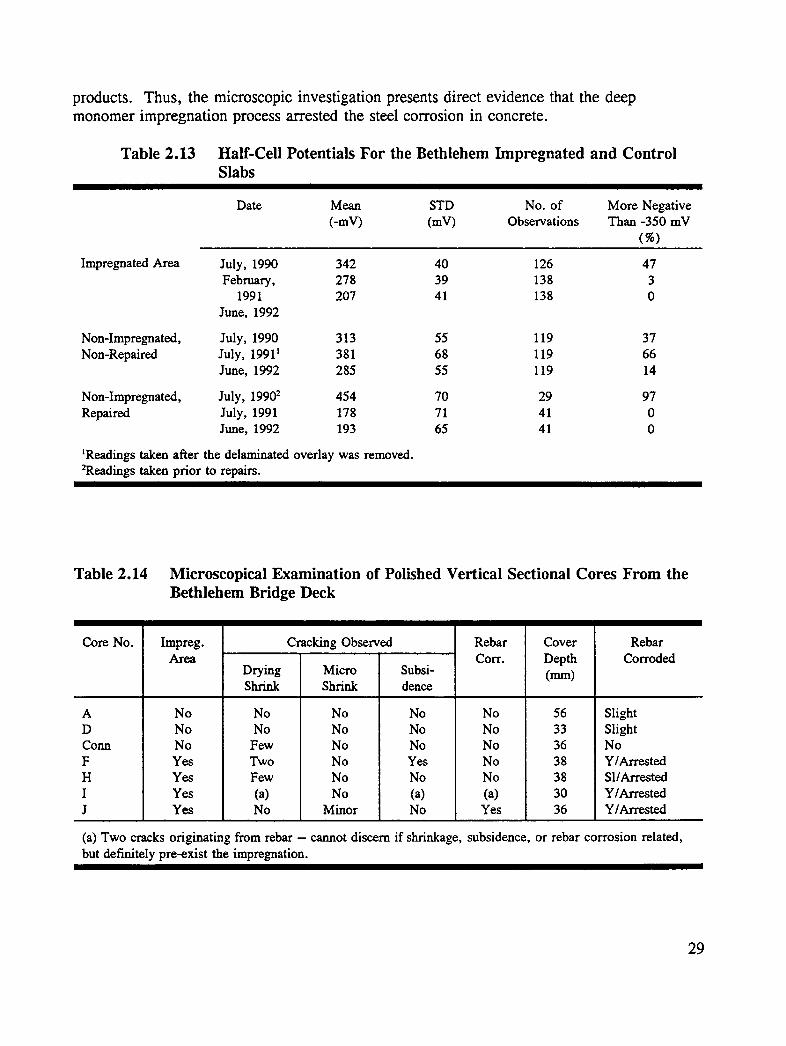
The results presented in Table 2.13 indicate that upon arrival at Virginia Tech, the meanpotential for the impregnated slab and the mean of the repaired and non-repaired sections ofthe non-impregnated slab were approximately the same. After repair, the mean potential inthe repaired areas of the non-impregnated slab decreased 61%. The mean potential of thenon-repaired area became less negative after placement of the first overlay, and morenegative after the placement of the second overlay. The mean potential of the impregnatedslab decreased (was less negative) by 39% in the 2 years after it arrived at Virginia Tech.The increase (less negative) of both the impregnated slab and the non-repaired section of thecontrol slab mzy be due to drying out of the slabs. The stay-in-place metal forms wereremoved from both slabs upon arrival at the S&M Lab.
Microscopic Analysis
To evaluate the:concrete material, 4 in (102 mm) diameter cores were drilled with a water-cooled diamond drill bit. The cores were approximately 5 in (127 mm) long. Verticalsections were cut, polished and examined using a petrographic microscope. The coarseaggregate was a blast furnace slag and the fine aggregate was a natural sand. The cementpaste appeared to be of an excellent quality. The depth of impregnation was approximately 3in (76 mm), which agreed with previous results (19).
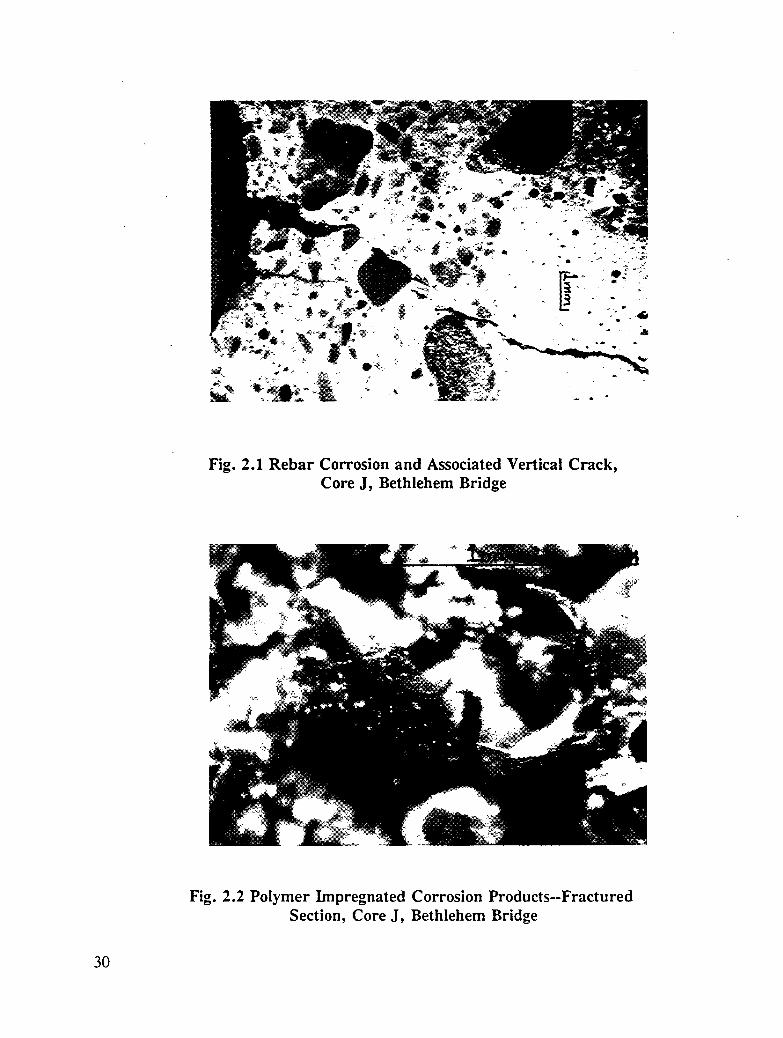
The primary interest in the examination was the reinforcing steel corrosion, since the purposeof deep impregnation is to prevent/arrest the corrosion process. Table 2.14 presents thesummary of the corrosion examinations. The microscopic examination of polished andfractured sections revealed details of the corrosion state of the deck. With the exception ofthe Conn. core, corrosion products were observed around the reinforcing steel. Cores A andD from the non-impregnated area showed evidence of slight corrosion. All four cores fromthe impregnated area showed evidence of corroding reinforcing steel; however, thecorrosion products were impregnated. Thus, the deep impregnation process appears to havearrested active corrosion cells in all four of the cores. Fig. 2.1 presents a microphotographof impregnated core J showing a vertical crack caused by corrosion of the rebar, while Fig.2.2 is a microphotograph of a fractured surface of core J showing the impregnated corrosion
28
products. Thus, the microscopic investigation presents direct evidence that the deepmonomer impregnation process arrested the steel corrosion in concrete.
Table 2.13 Half-Cell Potentials For the Bethlehem Impregnated and ControlSlabs
Date Mean STD No. of More Negative(-mV) (mV) Observations Than -350 mV
In March 1990, eight i_o. measurements were taken in both the control and impregnatedareas. The measurements were taken in sound areas for both the impregnated and controlareas; no delaminations were detected in the impregnated area. The ico, measurements of theMarch 1990 using the 3LP device are presented in Table 2.15. No correlations between thecorrosion potentials and the corrosion currents were found. Also, the i_o, measurements inthe impregnated section was found to be significantly less, 15 times lower, than that in thecontrol section.
Table 2.15 Corrosion Current Measurement For Bethlehem Bridge Deck
Impregnated Area Control Area
Location Corrosion Corrosion Corrosion Potential CorrosionPotential Current (mV, CSE) Current
Additional ico, measurements were taken on both the impregnated and the control slabssalvaged from the Bethlehem Bridge deck. The means, standard deviations, and number ofobservations are presented in Table 2.16.
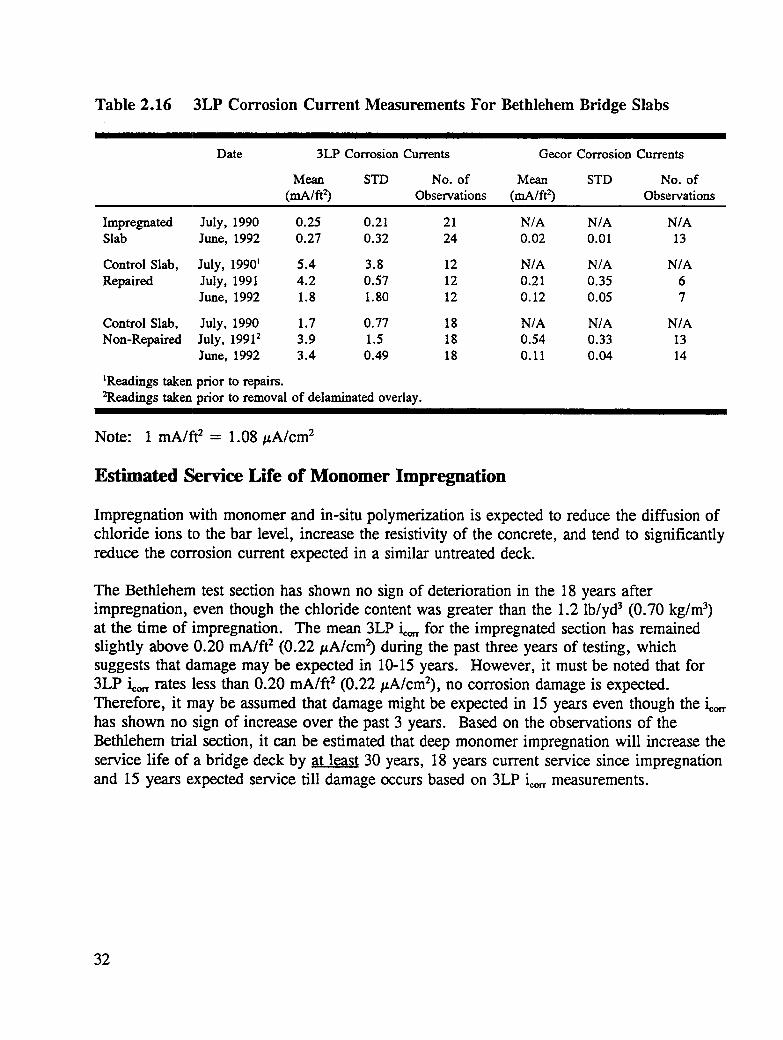
From Table 2.16, it can be seen that the i_o,_measured by both the 3LP and Gecor deviceswas approximately 10 times less in the impregnated section as compared to the controlsection. Based on the 3LP measurements, it may be estimated that damage may be expectedin the impregnated slab in 10-15 years whereas damage would be expected in the control slabin 2-10 years based on the study conducted by Clear (22). It must also be noticed that themean 3LP ioo_for the impregnated slab borders on the threshold of no corrosion activity,given at 0.20 mA/ft 2 (0.22 _A/cm 2) (22).
31
Table 2.16 3LP Corrosion Current Measurements For Bethlehem Bridge Slabs
Date 3LP Corrosion Currents Gecor Corrosion Currents
1Readings taken prior to repairs.:'Readings taken prior to removal of delaminated overlay.
Note: 1 mA/t't 2 = 1.08 _A/cm 2
Estimated Service Life of Monomer Impregnation
Impregnation with monomer and in-situ polymerization is expected to reduce the diffusion ofchloride ions to the bar level, increase the resistivity of the concrete, and tend to significantlyreduce the corrosion current expected in a similar untreated deck.
The Bethlehem test section has shown no sign of deterioration in the 18 years afterimpregnation, even though the chloride content was greater than the 1.2 lb/yd 3 (0.70 kg/m 3)at the time of :impregnation. The mean 3LP i_o_for the impregnated section has remainedslightly above 0.20 mA/ft 2 (0.22/_A/cm 2) during the past three years of testing, whichsuggests that damage may be expected in 10-15 years. However, it must be noted that for3LP ico_rates :less than 0.20 mA/ft 2 (0.22 #A/cm2), no corrosion damage is expected.Therefore, it may be assumed that damage might be expected in 15 years even though the i_o_has shown no sign of increase over the past 3 years. Based on the observations of theBethlehem trial section, it can be estimated that deep monomer impregnation will increase theservice life of a bridge deck by at least 30 years, 18 years current service since impregnationand 15 years expected service till damage occurs based on 3LP icon,measurements.
32
3
Calcium Nitrite Impregnation of Christiansburg Deck
Introduction
The two most common means of rehabilitating concrete bridge components in which steelcorrosion has caused distress are the removal and replacement of the concrete and/or the useof cathodic protection. In cases where delaminated and spalled areas are a small percentageof the deck area and the steel has not lost appreciable cross sectional area, cathodicprotection is the current method of stopping corrosion without concrete removal. In thisproject the feasibility of adding a known corrosion inhibitor, calcium nitrite, to repassivatethe reinforcing steel in concrete was examined. This rehabilitation method does not requireremoval of appreciable amounts of sound chloride contaminated concrete, nor does it requirelong-term maintenance of a cathodic protection system.
Laboratory testing was initiated at W. R. Grace & Co. in the mid 1980s to determine theconditions needed to impregnate hardened concrete with calcium nitrite to below thereinforcement level. Methods examined included vacuum impregnation, pressureimpregnation, ordinary soaking and drying the concrete by heating above the boiling point ofwater with subsequent soaking with an aqueous calcium nitrite solution. Only the lastmethod was successful in impregnating the concrete with calcium nitrite to below thereinforcement level. It was also determined that the cooling of the concrete had to becontrolled to prevent thermal shock.
In August 1985, a large scale bridge deck impregnation was performed at the University ofTexas at Austin (23). A 20 x 60 ft (6.1 x 18.3 m) bridge deck section was used for theevaluation. Two 10 x 20 ft (8.0 x 6.1 m) sections were dried to above 212°F (100°C) toapproximately mid-depth and slowly cooled. Detailed analyses of the heating and coolingprofiles as well as the crack distribution before and after heating were performed. There
33
were no new cracks due to the heating and cooling process and there was no growth inexisting cracks. Analysis of the concrete and measurement of liquid consumed in the soakingprocess both indicated that 18 lbs/yd 3 (10.8 kg/m 3) of nitrite penetrated 2 in (51 mm) into thedeck. Thus, the posttreatment process was successful.
In the summer of 1987, a 10 X 20 ft (3.0 x 6.1 m) section of a parking garage was subjectedto the calcium nitrite impregnation treatment. This structure was approximately 18 years oldand had severe delamination. Chloride levels were over 15 Ib/yd 3 (9 kg/m 3) in the top 1.25in (31.8 mm). The deck was successfully heat treated and slowly cooled without creatingcracks. However, nitrite analysis of cores showed that only 3.2 lb/yd 3 (1.92 kg/m 3) of nitritepenetrated to the 1-1.5 in (25-38 mm) depth. It was concluded that the reduced penetrationwas due to surface contamination and high surface chloride concentrations which blocked thenitrite.
Laboratory experiments showed that removing a contaminated surface layer on other fieldspecimens improved ingress. Thus, it was recommended either to scarify the surface or tocut grooves below the surface to improve the impregnation process.
In this work a 120x 8 ft (6.1 x 2.4 m) section of a bridge deck breakdown lane in the northspan was treated with calcium nitrite during the week of July 23, 1990. The bridge islocated on U. S. Route 460 Bypass, East of Christiansburg, VA, spanning Va. Route 732.The bridge consisted of three simple spans, with two travel lanes of 12 ft (3.7 m) each, and a10 ft (3 m) breakdown lane. The deck was grooved parallel to the expansion joints betweenthe spans, Fig. A-l, Appendix A. Based on previous experience, grooves were precut in thedeck to allow the calcium nitrite to ingress without having to penetrate surface impurities(16). Corrosion and chloride content measurements were performed. The section wasdemonstrating both active and passive corrosion currents which correlated well with thechloride concentrations. There were also a few delaminated areas.
Pretreatment Corrosion Measurements and Chloride Concentrations
Corrosion potentials and ico_ are presented in Fig. 3.1. The results showed that thebreakdown lane: of the bridge was corroding on the guardrail side of the area that was to betreated.
Chloride analysis results are given in Table 3.1 and correspond to positions in the deckschematic in Appendix A. Location 1-2 is at the guardrail and increasing letter valuesindicate locations nearer to the traffic line. Chloride content levels were in general muchhigher near the guardrail (1-2, A4, A26) most likely because traffic caused a buildup of snowand slush containing deicing salts at that location. Chloride content levels at the 2.25 in (57mm) nominal reinforcement depth were above 1.2 lb/yd 3 (0.9 kg/m 3) at several locations,which is considered a lower limit for chloride induced corrosion.
34
KEY,:Oft wlcth
80 _t ,_t
SW comerof test area length
Reference E]e_-bocle:Col:per Sulfate(CuSO4)
Fig. 3.1 Corrosion Potential Profile and Corrosion Polarization Resistance
Note: 1 lb/yda = 0.593 Kg/m3 1 Ibs/yd3 = 16 Kg/m31 in = 25.4 mm
35
Corrosion potential and ioo,_measurements (measured by 3LP) were performed within the 8 x20 ft (2.4 x 6.1 m) section before drying the deck. It rained the day before so there was nodifficulty in oblaining stable corrosion readings. The corrosion potentials (CSE) are shownin Fig. 3.1. Ia)cations of high negative potential occurred near the guardrail which was ingood agreement with the chloride data.
Corrosion polarization resistance measurements were measured under potentiostatic control.A portable computer-controlled potentiostat (Thompson Autostat-Software ControlledPotentiostat) was used with a copper wire mesh/sponge counter electrode. The polarizationresistance P_=,'_E/z_I at I=0, where E is the potential and I is the current, was determined.P'v is inversely proportional to the corrosion current (25).
Polarization resistance values at several locations are shown in Fig. 3.1. They are notcorrected for the area of steel polarized, and as such serve as a relative comparison betweencorroding and noncorroding sections that can be monitored over time. Since changes overtime are of interest rather than absolute values, the need for area correction is not greatbecause the reinforcement pattern is not expected to change. Note that it is likely that atleast 11.8 in 2 (76 cm 2) of rebar area is involved (based upon a 6 in (152 mm) long counterelectrode and 5/8 in (15.9 mm) rebars). Laboratory studies indicate that P'v values less than66,000 ohm.cna 2 are indicative of corrosion (25), so if an arbitrary 15.5 in 2 (100 cm2) area
was used, corrosion was occurring at several locations, Fig. 3.1. The low Rv valuesoccurred in regions of high negative corrosion potentials, indicating good agreement betweenthe methods. Note that no correction was made for concrete resistance, but since theconcrete was moist and of moderate w/c ratio (above 0.45), the correction is minor in thenoncorroding regions, and would mask higher corrosion currents in the corroding regions(26).
The chloride analyses, corrosion potentials, ioo,, polarization resistance, and corrosion dataare in good agreement. The post-treated area definitely had locations undergoing activecorrosion and others that appearred to be in the passive state. As such, the ability of theposttreatment process to arrest or reduce corrosion activity was measurable.
Treatment Process
Equipment
A plan view of the bridge deck and the treated area is presented in Fig. A-1, Appendix A.A series of 0.75 in (19 ram) diameter holes was drilled into the underside of the deck for
placement of thermocouples to monitor the heating/cooling of the bridge deck. Theapproximate location of the holes is shown in Fig. A-2, Appendix A. A pair of holes wasdrilled at each location. The deepest hole penetrated 4 in (102 mm) into the concrete fromthe underside of the deck. The distance between the deepest penetration of the hole and thedeck surface was 2 in (51 mm). A Type K and Type T TC were inserted into the hole, and
36
then sealed with a clay plug. The thermocouple leads were then taped to the underside of thedeck and brought over the side to temperature measuring instrumentation on the decksurface. The second hole was drilled to a depth of 2 in (51 mm) from the underside into theconcrete. A Type T TC was placed in this hole and sealed and taped in the same manner aspreviously discussed.
A multichannel digital thermometer was used to measure all Type K TCs. A total of 9 TypeK TCs were used, with 4 being placed on the surface of the concrete deck. The surface TCswere held in place with clay and blocks to insure solid contact with the surface of the deck.
Eight Type T TCs were attached to a portable data logger and serial printer programmed tomeasure up to 12 temperatures at 15 minute intervals. Due to battery discharge/damageduring transit, the data logger did not function properly. A backup hand held two channeldigital thermometer was used instead, to take a reading from the eight thermocouples at 15minute intervals. A ninth Type T TC was used to measure the heated air temperature insidethe insulating shell.
To provide fast, effective heating to the deck, a Dayton 600,000 BTU/hr. kerosene heaterwas utilized. The heater was modified to incorporate a centrifugal blower for an increasedoutput of air. A high temperature controller with adjustable on/off setpoint provided aconstant air temperature inside the shell. A Type K TC placed 6 in (152 mm) above thedeck surface at the center of the heated deck furnished the temperature signal.
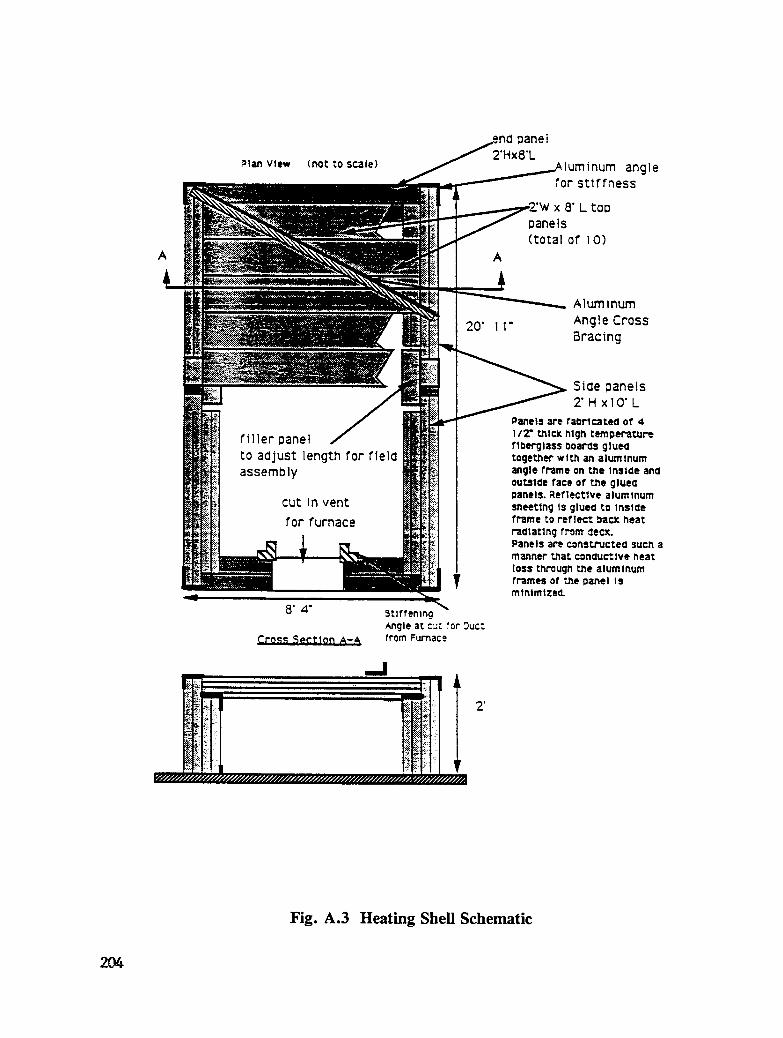
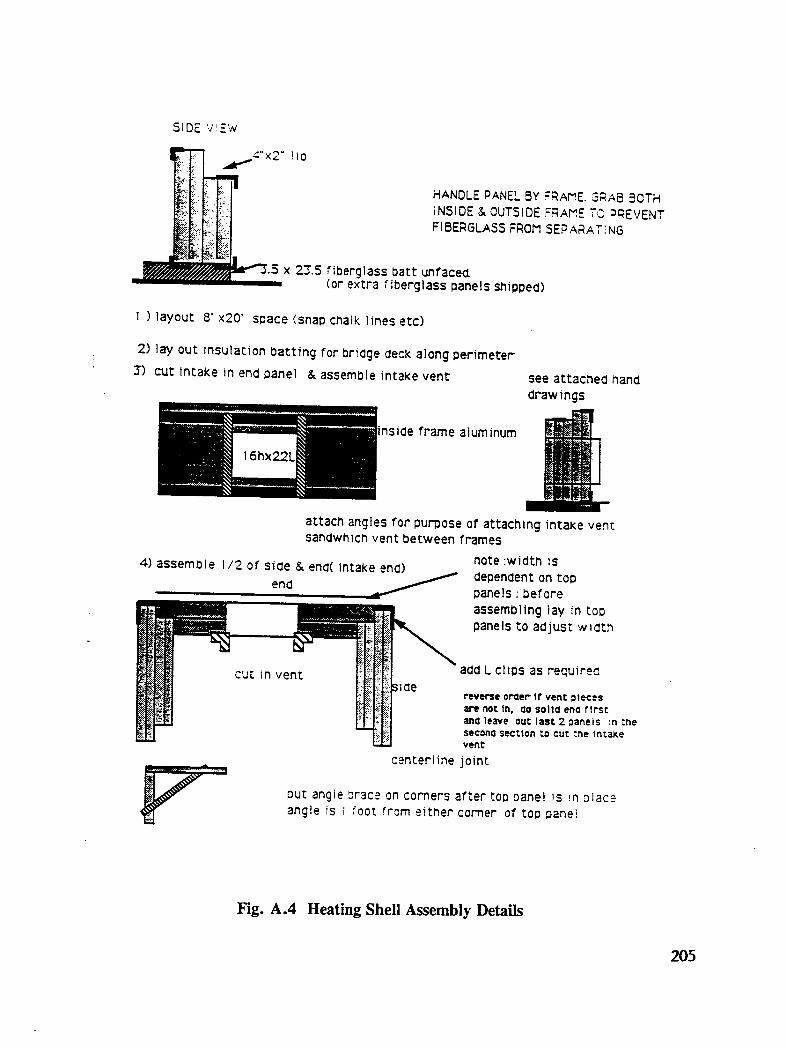
A lightweight modular heating shell was fabricated to trap the heated air above the concretedeck. The shell was built in a layered construction, with reflective aluminum sheetingattached to an inner frame of aluminum angle. Four 1/2 in (13 mm) thick high-temperaturefiberglass boards and sheets were glued together with high-temperature silicone caulking, andwere then glued to the inside frame. An outside frame of aluminum was then glued to thepanels. The outside fiberglass panel had a foil facing for water resistance. A detailedschematic is presented in Appendix A. Panels damaged during shipment and initial handling,were repaired using silicone caulk. The use of aluminum pop rivets to attach additionalpanels was not completely effective, and thus additional bracing and modifications weremade. A connecting duct between the furnace and the shell was assembled and pop rivetedonto the shell. Commercial use would require a more rugged and more easily assembledshell. A 3.5 ft3 (0.1 m3) gas powered drum mixer was used for grouting operations.
Procedure
The method of impregnating the concrete with calcium nitrite involved driving the free waterout of the concrete by heating the deck surface. In order to promote the ingress of calciumnitrite to the bar level, the bridge deck was grooved prior to drying. Grooves 3/4 in (19mm) wide by 1 1/2 in (38.1 mm) deep were cut into the deck with a walk-behind concretesaw. The grooves were cut 3 in (76 mm) on center on lines of equal contour. A majorconcern during the heating and subsequent cooling process was the temperature gradient thatexisted throughout the slab. Instrumentation of the deck was critical for monitoring any
37
temperature gradients that might have developed, since the deck was being heated from onesurface. Temperature monitoring capabilities were provided by a series of Type K and TypeT TCs as described in the Equipment section. The thermocouples provided criticalinformation on the depth of dry concrete and temperature gradients for the prevention ofthermal cracking, especially during cooling.
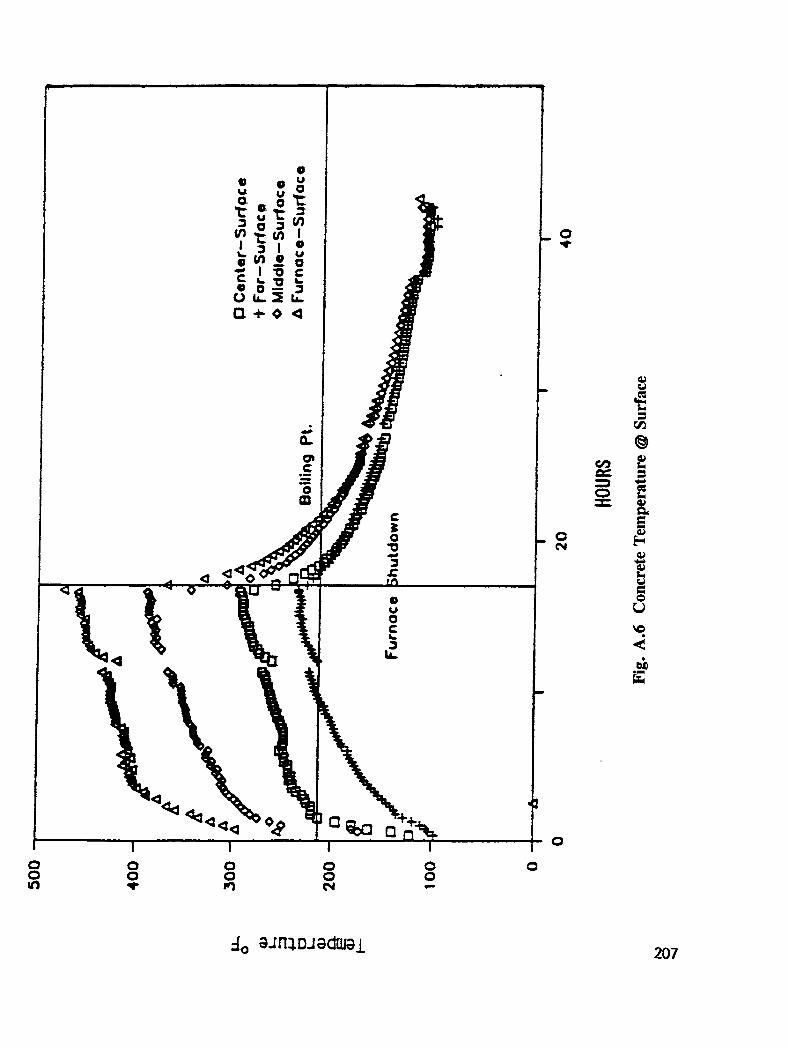
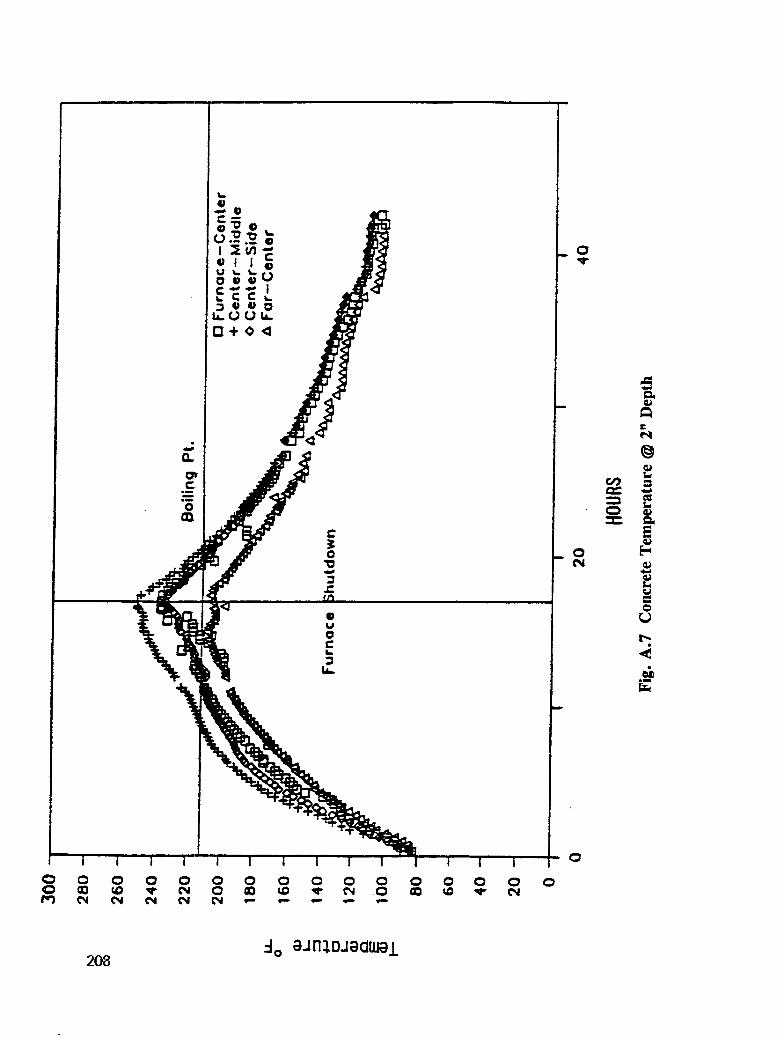
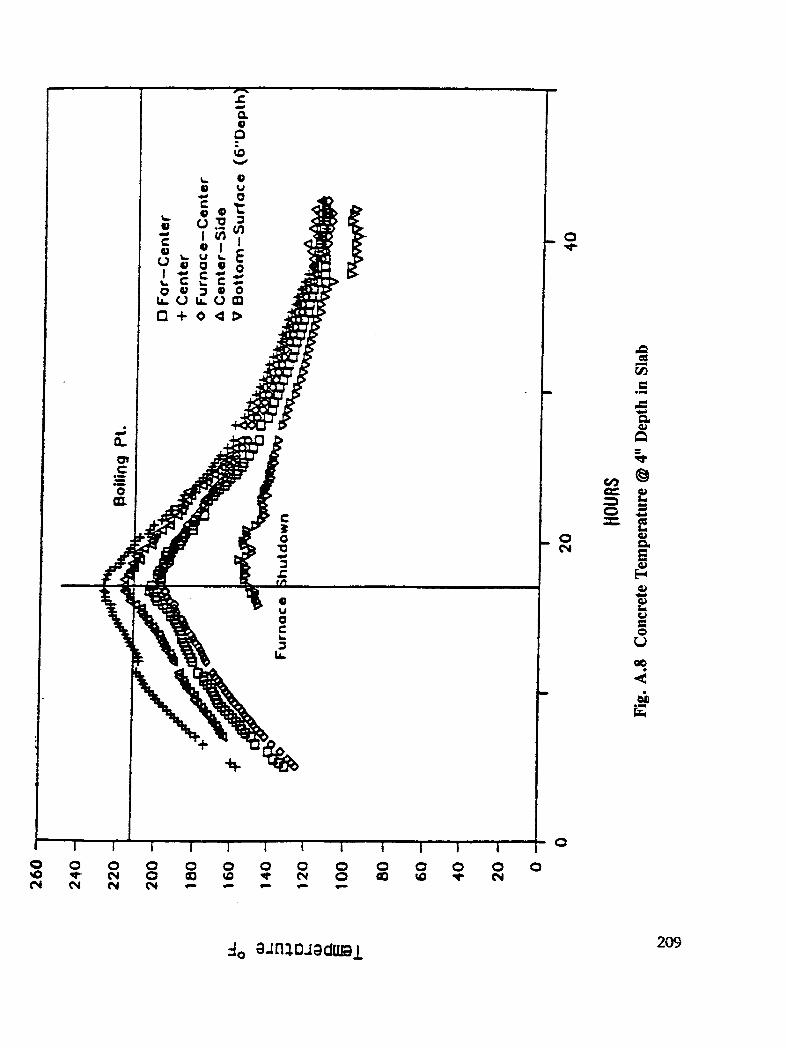
Plots of the temperature of the concrete slab at various depth as a function of time arepresented in Appendix A, Fig. A-6 through A-9. Furnace shutdown is marked on each plotto delineate between the heating and cooling cycles of the test. Temperatures ranged fromover 400°F (204°C) next to the duct from the furnace to 230°F (110°C) at the far end of theshell prior to furnace shutdown. The temperature differences between the various locationswithin the test area dropped dramatically after 1 hour of cooling. The differential was lessthan 100°F (38°C) versus over 200OF (76°C) prior to furnace shutdown. After 8 hours ofcooling, the temperature differential was only 200F (11 °C). Temperatures at 2 in (51 mm)and 4 in (102 rnm) depth of the concrete slab are presented in Fig. A-7 and A-8, AppendixA.
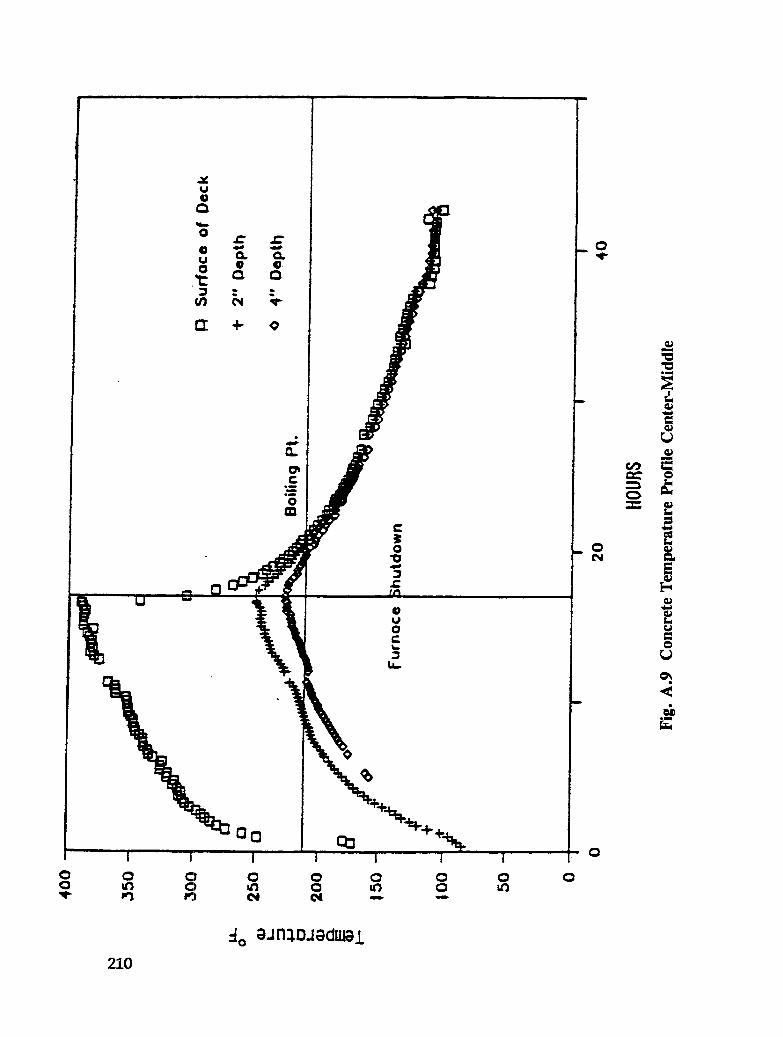
The boiling point was reached at 2 in (51 ram) depth except at the far end of the slab andwas reached at the 4 in (102 mm) depth for the center region of the slab. A temperatureprofile of center region of the slab, with surface, 2 in (51 mm) depth, and 4 in (102 mm)depth is presented in Fig. A-9, Appendix A. During the heating cycle, the concrete at anyappreciable depth into the slab was at a relatively constant temperature, with littletemperature difference between 2 in (51 ram) and 4 in (102 mm) depth. When the furnacewas turned off and the cooling cycle began, within three hours the three temperatures variedby only 15°F (6°C). A large temperature gradient which could cause cracking during thecooling of the deck was avoided by judicious opening of vents and by extending the coolingperiod until the concrete was slightly above ambient temperatures.
After the deck had been cooled, the heating shell was removed. A wooden 2 in x 4 in (51mmx 102 mm) dam for trapping any spilled or excess calcium nitrite solution wasconstructed around the test area and caulked along the concrete-wood interface. The 15%calcium nitrite solution was siphoned from the holding drum with a hose and poured intoeach of the grooves until the groove was full. The level of calcium nitrite solution wasmeasured in the holding drum prior to application and after the grooves had been filled toestimate the amount applied to the deck. A few small cracks were noticed during theapplication of c_alcium nitrite, but it was not known whether these cracks were a result of
heating the deck:, since a survey of any existing cracks prior to heating had not been done.However, before heating there were several areas of deck delamination due to corrosion in
the test section. The deck was then covered with a polyethylene tarp to prevent evaporationof the calcium rdtrite solution.
The calcium nit:rite solution was ponded for 24 hours. At the end of the 24 hour period, thetarp was removed. An inspection of the underside of the bridge deck slab revealed two smallcracks that had leaked some calcium nitrite. The amount of calcium nitrite which leaked
38
through the cracks was very small, certainly less than 1 quart (0.94 f). The calcium nitritewas then removed from the grooves with a wet-dry shop vacuum.
The 15% calcium nitrite ponded volume was 31.67 gallons (119 e). The recovered productwas 10.59 gallons (40 e). Therefore, approximately 20.8 gallons (78.5 e) was absorbed bythe deck. This is equivalent to 10.4 gallons (39 e) of 30% calcium nitrite which is thenominal composition of a commercial admixture, DCI Corrosion Inhibitor". Typically, 4gallons/yd 3 (20 1/m3) of 30% calcium nitrite is added to protect against 13 lb/yd 3 (7.8 kg/m 3)of ingressed chloride at the reinforcement level (27). The calculated dosages based upon theabove absorption are 10.5 gallons/yd 3 (52 e/m3)if penetration was to the 2 in (5 cm) leveland 5.3 gallons/yd 3 (26.2 e/m3)if penetration was to the 4 in (10 cm) level.
The treated deck was rinsed down with water using burlap as an applicator, in preparationfor filling the grooves of the treated area with a calcium nitrite-rich, latex- modified grout.The purpose of the grout was twofold: to prevent diffusion of the calcium nitrite out of theconcrete to a region of lower concentration (the higher concentration of calcium nitrite andthe lowered permeability of the latex modified grout would counteract the tendency of thecalcium nitrite to diffuse out of the treated concrete); and to return the treated deck section toan acceptable riding surface.
The calcium nitrite-latex-modified grout was mixed using a 3.5 ft3 (0.1 m 3) gas powereddrum mixer. Mixture proportions are presented in Table 3.2. Ice and a large quantity ofretarder was required to prevent flash set, and more importantly, to preserve initialworkability until the grout could be squeezed into the grooves. The retarder used wasDamtard-HC", at an addition rate of 10 oz/cwt of cement (38 mL/m3). This was requiredeven with the use of neutral set calcium nitrite (at normal addition rates), DCI-S CorrosionInhibitor". The addition rate of latex (DOW Chemical [48 % solids]) at 15% s/s (latex solidsto cement solids weight ratio) cement was responsible for a smooth, pourable, buthomogeneous grout which was ideal for application with a squeegee. Mix #3 had a reductionin latex content (11% s/s) because the supply ran out, and the reduction in latex wasreflected in the reduced workability of mix #3.
Wet burlap was applied to the deck after the application of the grout. The burlap wascovered with a polyethylene tarp and allowed to wet cure for 24 hours.
Visual lngpection and Delamination Survey
In January 1991, approximately 6 months after treatment, a visual inspection of the treatedand control areas of the bridge deck showed the deck to be in excellent condition. Someflaking of the excess latex grout between the grooves in the treated area was observed. Nodelaminations were located in the treated area at that time. One small delamination, 0.3 ft2(0.03 m2) was detected in the control section.
In July 1991, a visual inspection and delamination survey located delaminations in both the
39
treated and the: control sections of the deck. The total sum of delaminated area was 7.5 ft2
(0.70 m2) in the treated section and 7.1 ft2 (0.66 m2) in the control section. This represents4.7% and 3.5% of their respective areas. All delaminated areas were located in thebreakdown lane within 3 ft (0.9 m) of the parapet. A cover depth survey showed the meancover depth to be 2.2 in (56 ram) with a standard deviation of 0.33 in (8.4 mm) based on 80observations.
Table 3.2 Calcium Nitrite Grout Mixes Used To Fill Grooves in Deck
In July 1992, a visual inspection and delamination survey indicated a growth of thedelaminated areas. The total area sum was 8.8 ft2 (0.82 m2) for the treated section and 8.6ft2 (0.80 m 2) for the control section, representing 5.5% and 4.4% of the the areas sections,respectively. The additional delaminated area resulted from the growth of delaminationsidentified previously.
Chloride Contamination Levels
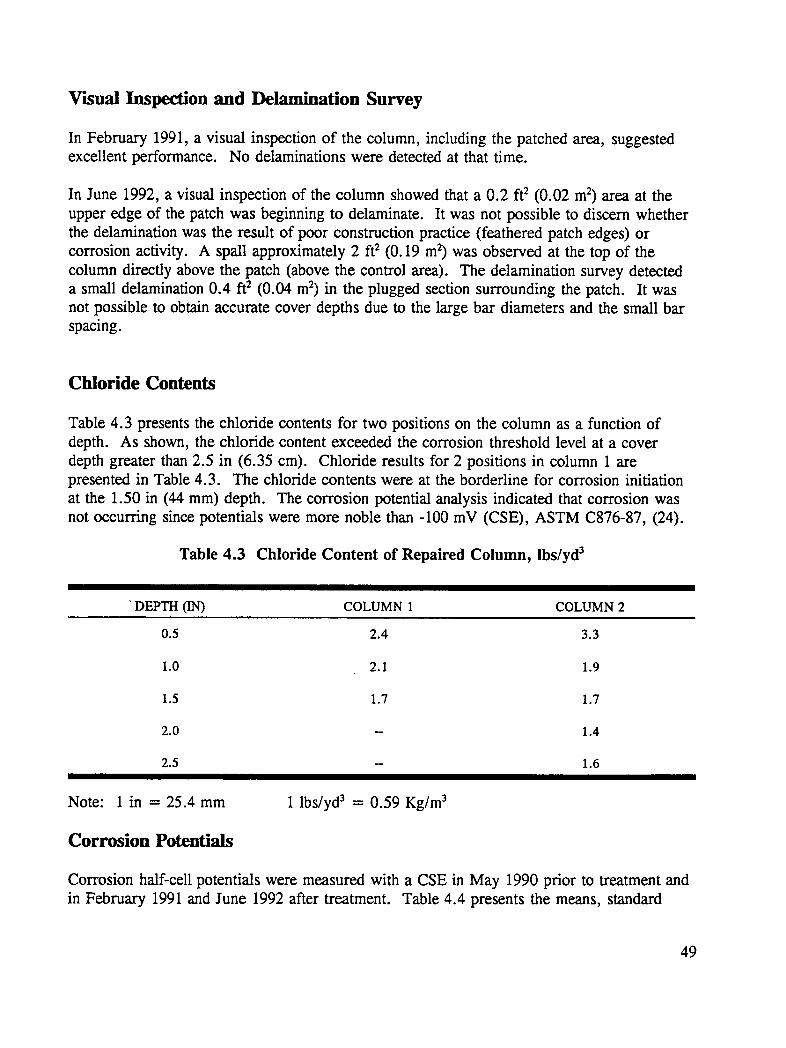
In July 1992, powdered samples for chloride analysis were taken at mean depths of 0.5, 1.0,1.5, 2.0, and 2.5 in (13, 25, 38, 51, and 70 mm). Twenty powdered samples werecollected, 10 each in the treated and control sections. The results are reported in Table 3.3.
Both samples from the treated area were greater than 1.2 lbs chloride/yd 3 (0.7 Kg/m 3) ofconcrete at the bar level. In the control section, sample A4 was significantly greater than thecorrosion initiation level at the bar level while E24 was less than the corrosion initiation
level. The degree of variance of the 2 samples in the control section probably results from
40
their location, sample A4 was taken within 2 ft (0.6 m) of the parapet, while sample E24was taken 10 ft (3.0 m) from the parapet.
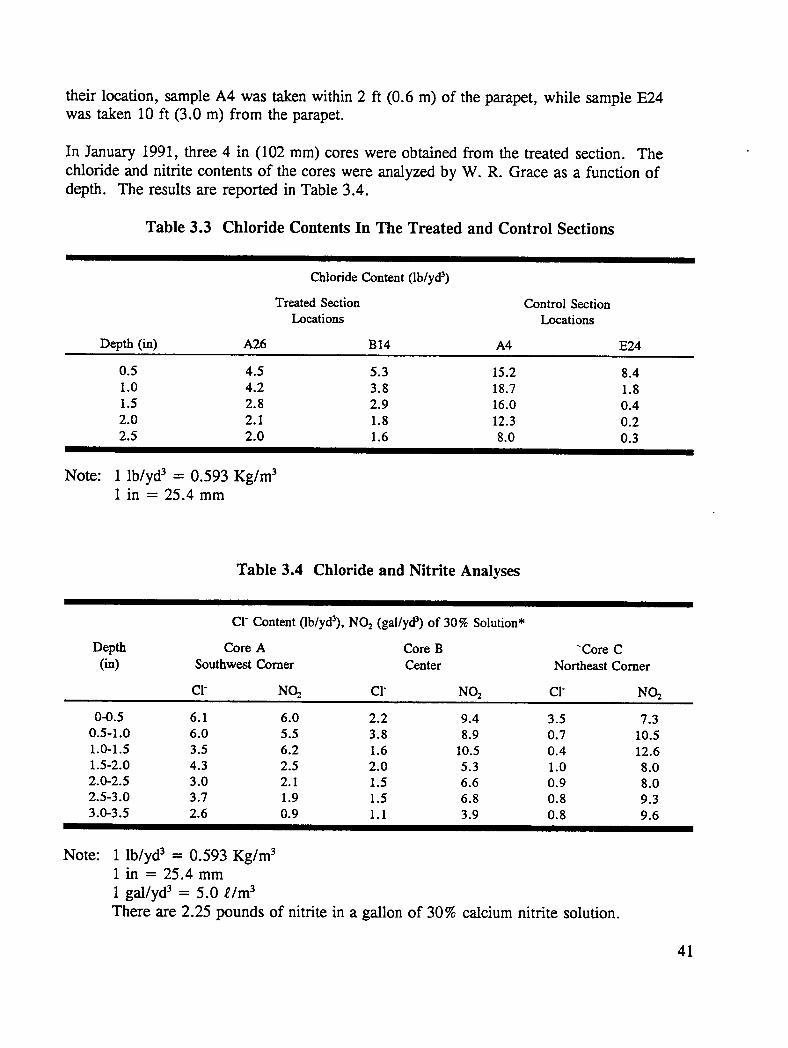
In January 1991, three 4 in (102 mm) cores were obtained from the treated section. The
chloride and nitrite contents of the cores were analyzed by W. R. Grace as a function ofdepth. The results are reported in Table 3.4.
Table 3.3 Chloride Contents In The Treated and Control Sections
Chloride Content (Ib/yd 3)
Treated Section Control SectionLocations Locations
1 gal/yd 3 = 5.0 e/m 3There are 2.25 pounds of nitrite in a gallon of 30% calcium nitrite solution.
41
Research conducted by Berke et al., (27), suggested that for inhibition to occur, thechloride:nitrite ratio must be less than 2. The average nitrite content at the bar level, 2.0-2.5in (51-64 mm)was 11.6 lbs NO2/yd3 (7.0 kg/m3), and the minimum measured nitrite content4.7 lbs NO2/yd:_(2.8 kg/m3). Therefore, inhibition should occur at chloride contents up to23.2 lbs C1-/yd3 (13.9 kg/m3), based on the average nitrite content at the bar level. All ofthe pre-treatment chloride contents were below this level.
Corrosion Potentials
Corrosion poterttials were measured with a CSE in accordance with ASTM 876-87 (24).Potential surveys were conducted in March 1990 prior to treatment, in January 1991, July1991, and July 1992. The means, standard deviations, and number of observations for thepre-treatment and post-treatment potential surveys are presented in Table 3.5.
The mean potentials for both the treated and control sections fall into the uncertain range ofcorrosion activity, -200 to -350 millivolts. The mean potential for the treated sectionincreased slight]Lyand the standard deviation decreased after treatment, indicating that thenumber of potential measurements more negative than -350 millivolts decreased.
Corrosion Current
Corrosion current density measurements were taken in both the treated and control areas inMarch 1990 prior to treatment and in January 1991, July 1991, and July 1992. The 3LPdevice was used to take measurements during all 4 surveys. In addition to the 3LP, theGecor device was used in the surveys conducted in July of 1991 and 1992. Table 3.6 and3.7 presents the means, standard deviations, and number of observations for the 3LP andGecor corrosion i_o,rmeasurements, respectively.
The 3LP io_ measurements for both the treated and the control section showed little changeafter treatment. Clear (22) suggested that for corrosion current densities from 1.0 to 10.0
42
mA/ft 2 (1.1 to 10.8 _A/m2), corrosion related damage would be expected in 2-10 years. Themean ic_ for both sections is within this range.
The Gecor mean corrosion increased in the treated section, after the initial measurements
with the device. However, further surveys will be required to verify this trend and to makean accurate assessment of calcium nitrite as a corrosion inhibitor when applied with thegrooving technique.
Conclusions
The ability to dry out a concrete bridge and successfully impregnate it with a knowncorrosion inhibitor was demonstrated. It appears to be a viable method of bridgerehabilitation that does not require the large-scale removal of sound concrete. The equipmentemployed is relatively nonsophisticated and can easily be scaled up to treat larger areas.However, cracked and delaminated areas would have to be repaired before the deck isimpregnated.
In July 1990, a 12 ft2 (1.1 m2) spalled area on the east pier, southern column of the structurewhich carries U. S. Route 460 westbound over VA Route 723 was repaired with a calciumnitrite-rich latex-modified concrete. In addition, a series of 1 in (25 mm) diameter holeswere drilled in a 24 ft2 (2.2 m2)area surrounding the patch. These holes were backfilledwith a calcium nitrite rich mortar, so that the inhibitor might migrate into the surroundingconcrete to provide additional protection. Post-treatment evaluations were carried out on thetreated and adjacent control areas in February 1991 and June 1991.
Equipment
Equipment necessary for the repair of the column with DCI latex concrete and grout wasminimal in comparison to that needed for the bridge deck post treatment. A 3.5 ft3 (0.1 m3)gas powered drum mixer was utilized for mixing the concrete for the column repair. Aplywood form was banded to the column for the concrete patch. A metal chute was used forplacing the concrete at the top of the form into the patch. A small Hobart mixer was used tomix the grout. Other equipment required was a scale, batching pails, accurate liquidmeasuring containers such as measuring cups for admixture dispensing, and concrete/groutfinishing tools.
Procedure
A series of 1 in (25 ram) diameter holes had been drilled in a 2 in (5.08 cm) grid patternoutside the spalled area, shown in Fig. 4.1, to the depth of the reinforcement. The areadrilled represented an area with corrosion problems. A calcium nitrite rich grout was mixed
Fig. 4.1 Column Repair Area and Corrosion Potentials
46
to fill the holes. The mix was based on several trial mixes performed at W. R. Grace & Co.Mixture proportions are presented in Table 4.1. DCI-S Corrosion InhibitorTM, a neutral setcorrosion inhibitor at normal dosage levels (2 % sis [calcium nitrite salt solids to cementsolids ratio by weight]), was to be used at 7.5 times the normal dosage rate. Latex (DOWChemical 48% solids) was used at 15% sds cement. Requirements for the grout were that ithad to have some workability but be stiff enough to remain in the drill holes. The first mix,with 15% latex was too fluid during the first 20 minutes after mixing.
For the second grout mix, the latex content was reduced to 10% s/s. The workability of thismix was better initially, but the mix rapidly hardened. Mix #1 exhibited the same behaviorafter 20 minutes, and not all of the grout could be used due to the accelerated rate ofstiffening. The third mix was mixed by hand because the Hobart mixer had developed amechanical problem. A latex addition rate of 12.5 % s/s was used with some success.During this time, the sun had moved into position to shine on the column and exacerbate thestiffening problem. Mix #4 and #5 contained 15% s/s and 17.5% sis latex, respectively.Latex addition was increased due to the increase in air temperature and the resultant loss ofworkability of the grout. A skim coat of mortar was placed over the hole pattern to preventdrying out of the grout and for cosmetic purposes.
A concrete mixture was proportioned and batched. The DCI-S Corrosion InhibitorTM percentsolid salt to cement solids (s/s) was 15%. The latex solids to cement solids (s/s) was 10%.Mixture proportions are presented in Table 4.2. Cement content for the mix was 758 pcy(455 kg/m3), with a design w/c ratio of 0.38. A problem developed with the mixture; themixture exhibited rapid stiffening and heat evolution and had to be discarded. Even with theaddition of Damtard-HC TM (a retarder) at 5 oz/cy (19 mL/m3), rapid hardening occurred atsuch a rate that some of the concrete had to be chipped out of the mixer.
A second concrete patch mix was batched with some modifications. DCI-S CorrosionInhibitor" percent s/s was reduced to 10%, and the initial amount of retarder increased by afactor of 4 to 20 oz/cwt (15-75 mL/m3). Ice was used for mix water, and the retarder,Daratard-HC was added to the mix water to be present at the start of hydration. During themixing of the revised mix, additional retarder was added, 12 oz/cwt (45 mL/m3), and twomore points of water were required (final w/c = 0.40) to obtain the desired workability forthe repair. The concrete had an estimated slump of approximately 8 in (20 cm), with nonoticeable segregation. The concrete was then rapidly placed inside the form by the chute.The outside of the form was vibrated with a hand vibrator to facilitate consolidation of theconcrete.
(aggregate absorption at 0.5 %)Note: 1 lbs/yd 3 = 0.593 Kg/m3; 1 in = 25.4 mm; cwt = 100 lbs, 1 oz = 29.6 ml
48
Visual Inspection and Delamination Survey
In February 1991, a visual inspection of the column, including the patched area, suggestedexcellent performance. No delaminations were detected at that time.
In June 1992, a visual inspection of the column showed that a 0.2 f12 (0.02 m2) area at theupper edge of the patch was beginning to delaminate. It was not possible to discern whetherthe delaminafion was the result of poor construction practice (feathered patch edges) orcorrosion activity. A spall approximately 2 f12(0.19 m2) was observed at the top of thecolumn directly above the patch (above the control area). The delaminafion survey detecteda small delaminafion 0.4 ft2 (0.04 m2) in the plugged section surrounding the patch. It wasnot possible to obtain accurate cover depths due to the large bar diameters and the small barspacing.
Chloride Contents
Table 4.3 presents the chloride contents for two positions on the column as a function ofdepth. As shown, the chloride content exceeded the corrosion threshold level at a coverdepth greater than 2.5 in (6.35 cm). Chloride results for 2 positions in column 1 arepresented in Table 4.3. The chloride contents were at the borderline for corrosion initiationat the 1.50 in (44 mm) depth. The corrosion potential analysis indicated that corrosion wasnot occurring since potentials were more noble than -100 mV (CSE), ASTM C876-87, (24).
Table 4.3 Chloride Content of Repaired Column, Ibs/yd 3
DEPTH ON) COLUMN1 COLUMN2
0.5 2.4 3.3
1.0 2.1 1.9
1.5 1.7 1.7
2.0 -- 1.4
2.5 - 1.6
Note: 1 in = 25.4 mm 1 lbs/yd 3 = 0.59 Kg/m 3
Corrosion Potentials
Corrosion half-cell potentials were measured with a CSE in May 1990 prior to treatment andin February 1991 and June 1992 after treatment. Table 4.4 presents the means, standard
49
deviations, and number of observations for all three surveys.
The mean corrosion potential in the patched area showed a 31% decrease after treatment andwas accompanied by a substantial decrease in the standard deviation. Both post-treatmentmean corrosion potentials are in the uncertain range of corrosion activity, indicating that thecalcium nitrite was effective in reducing corrosion activity even though the concrete was onlyremoved to the bar level. The mean potentials in both the plugged and control sections haveremained relatively constant since treatment.
Corrosion Currents
Corrosion current density measurements were taken with the 3LP device in February 1991and June 1992. No pre-treatment ic._ measurements were available. Table 4.5 presents themeans, standard deviations, and number of observations for the two surveys.
Table 4.4 Southern Column, East Pier CSE Half-Cell Potential Readings
1 Plugged section refers to the area where holes were drilled and backfilled withcalcium nitrite rich mortar.
50
Table 4.5 3LP Corrosion Current Measurements
i_,(mA/ftb
Measurement February, 1991 June, 1992Date
Mean STD n Mean STD n
Patched Section 2.92 NA 2 1.59 1.39 3
Plugged Section 2.06 1.54 3 1.90 1.20 5
The mean ico_value for the patched section decreased by 46% over a 16 month period.Corrosion damage would be expected in approximately 10 years based on this value (22).The mean ico_value for the plugged section also decreased slightly, possibly due to theinfluence of the calcium nitrite plugs.
Condusions
Due to the localized nature of corrosion attack on substructures, it is difficult and possiblymisleading to compare the treated and control sections on the columns. However, thecorrosion activity in the patched area appears to have decreased. Further monitoring,particularly corrosion currents, will be necessary to assess the effectiveness of the technique.The measured ioo_values may have been higher than the actual corrosion current density dueto the difficulty in determining the area of polarization. This would be especially true as thecorrosion current density decreased. The small delamination at the upper edge of the patchwas alarming, but may have been the result of poor construction practice at the time ofrepair.
The practicality of using grouts and concretes with high inhibitor contents is somewhatquestionable. Overall, the addition of calcium nitrite to concrete patches appears promisingand deserves further investigation.
51
5
Laboratory Investigation of Polymer-ImpregnatedConcrete
Introduction
Deep impregnation (to depths greater than 3.0 in [76 mm]) of monomer into concrete andsubsequent in-situ polymerization will abate corrosion and prevents its initiation. A deepgrooving method for impregnating concrete was developed by Weyers and Cady, and itstechnical and economical feasibility was subsequently demonstrated (14). The polymerizedmonomer (polymer) fills most of the void spaces of the concrete. The chloride intrusionresistance and the encapsulation of the present chloride stop the flow of corrosion current andprevents the onset or continuation of any corrosive activity.
It has been estimated that about 90% of the voids in concrete axe filled by the process ofpolymer impregnation (28). The factors which control monomer selection axe familiaritywith its use and its physical, chemical, fire hazard and health hazard properties. The bestmonomer system to impregnate concrete with is 90% methyl methacrylate (MMA), 10%trimethylolpropene trimethacrylate (TMPTMA), and 0.5 % of the above monomer mix ofazobisisobutyronitrile (Azo) (28). All of the above proportions axe by weight. MMA is themonomer, TMPTMA is a cross linking agent, and Azo is the initiator.
This monomer system is distinguished from other monomer systems by its low viscosity andits rapid auto accelerating polymerization reaction. However, this monomer system isflammable, toxic and has an irritating odor.
The primary objective of this study was to evaluate the effectiveness of monomerimpregnation as a possible method for arresting corrosion in chloride contaminated concrete
53
overlaid bridge deck. To achieve this, reinforced concrete specimens were cast simulatingbridge deck conditions and tested under controlled conditions. Specimens were exposed todeicer solution until corrosion was initiated. For comparison, overlaid systems were cast:LMC, and LSDC. For impregnation, the deep grooving technique was applied. Fivetreatments were evaluated: three control treatments: LMC overlay, LSDC overlay, andpolymer impregnation, and two rehabilitation treatments: impregnation of LMC overlaidspecimens and impregnation of LSDC overlaid specimens. Control, non-treated, specimenswere also cast.
The secondary objective of this study was to determine the optimum drying temperature ofthe concrete prior to monomer impregnation. This may reduce drying time and energy usageand may subs_ntially reduce impregnation costs. In order to accomplish this task, mortarcubes were cast, polymer impregnated at different temperatures and observed using aScanning Electron Microscope (SEM) and a Mercury Porsimeter. Comparison cubes weresubjected to chloride ponding-drying cycles and the chloride content of powdered sampleswas measured 1:odetermine the effectiveness of polymer-impregnated concrete in reducing theingress of chloride ions. To validate the hypothesis, several specimens with activelycorroding rebars, were impregnated after being dried at a relatively lower temperature.
Experimental Design
Specimen Preparation and Corrosion Initiation
To simulate bridge deck conditions, laboratory reinforced concrete specimens were cast.Eighteen specimens were cast with two triads of rebars in each specimen. Each specimenwas 12 in (305 ram) long and 10 3/8 in (264 ram) wide, see Fig. 5.1. Each triad consistedof one top reba.r and two rebars equidistant from the top rebar at the bottom, thus forming anisosceles triangle. The bottom rebars were 1 1/4 in (38 mm) from the bottom of thespecimens. The rebars were placed along the width of the specimen. They wereapproximately 11 7/8 in (302 ram) long, such that they extended about 3/4 in (19 mm)beyond the two ends of the specimens. The rebars used were #4 (ASTM specifications A615) with a 1/2 in (13 ram) nominal diameter. The overall height of the specimens was 4 in(102 mm). The top cover depth was usually 1 in (25 mm).
The forms for the specimens were 3/4 in (19 mm) plywood A-C exterior grade and fastenedby 2 in (51 mm) #8 dry wall screws. To accomodate the thermocouple wires, plexiglassspacers (3/4 in x 1/4 in [19 mm x 6 ram]) were used on one side of the forms, two spacersper form. Holes with 5/8 in (16 mm) diameter were drilled in the forms to accommodate therebars with adecluate clearance.
Rebars were cut to size, drilled and tapped at one end to a depth of 5/8 in (16 mm) toaccommodate 1/8 in (3 mm) diameter screws. In order to minimize the effects ofmanufacturing oil and existing rust on the rebars, the rebars were cleaned by soaking them ina hexane solution for about 20 minutes and then wiped clean. The rebars were then dried in
54
the oven at 240 ° F (116 ° C) for 10 minutes. To prevent corrosion from taking place at theexposed ends, the two ends were covered with electroplating tape such that the uncoveredlength of each rebar was known and hence corrosion currents could be normalized to asquare foot (square meter) of surface area of the rebar. To prevent concrete from adheringto the wooden forms, the forms were painted with two coats of form oil.
A type T TC was taped at the bottom center point of each top right hand rebar of eachspecimen. Type T plugs were attached to the other ends. The rebars along with the TCwire and spacers were assembled in each form in an inverted configuration to minimizeconsolidation (subsidence) cracking.
Five treatment methods were used and one set of control specimens was not subjected to anytreatment. Triplicate specimens were cast for each treatment and for the controls.Therefore, a total of 18 specimens were cast. The two-letter codes assigned to each groupwere as follows:
• CO: Specimens acted as controls, untreated,• LM: Specimens overlaid with LMC,• LS: Specimens overlaid with LSDC,• PC: Specimens polymer impregnated,• PM: Specimens overlaid with LMC and polymer impregnated, and• PS: Specimens overlaid with LSDC and polymer impregnated.
Concrete was then placed; mixture proportions and aggregate properties are presented inTable B. 1, Appendix B. The forms were removed after 24 hours of moist curing. Becausethe specimens were cast inverted, the surfaces were cleaned to remove any possible oilcontamination with muriatic acid (diluted hydrochloric acid).
The sides were coated with epoxy to prevent moisture loss and salt ingress from the sides.Plexiglass dikes 1 in (25 mm) high and 5/16 in (8 ram) thick were fixed to the top of eachspecimen using silicon rubber. Glass covers were used on the specimens to minimizemoisture loss during wet cycles. A resistor of 100 f_ was connected between the top rebarand the bottom right rebar of each triad. A jumper cable was fitted between the two bottomrebars of each triad, resulting in a macro-cell cathode-to-anode area of 2.
Prior to the first wet cycle, potential and temperature readings were taken. Temperaturereadings were measured by a digital type T TC meter. Potential readings were taken with aCSE in accordance with ASTM C-876 (24).
The 3LP was used to monitor the corrosion current density, i,o_. The corrosion current ofmetal is directly proportional to the corrosion rate (Faraday's 1st Law). The 3LP deviceimpresses a current in the reverse direction and polarizes the corrosion current. Adescription of the test procedure and interpretation of the results are given in the 3LP manual(29), and are repeated here as an aid to the reader. Interpretation of the obtained corrosion current
55
10.:175"
uuu dUu
o _o4.0"
0 0 0 0 m--]I.II"
I
Fig. 5.1 Plan and Elevation of Specimens
56
density (icon) values is as follows:
• ioo, < 0.2 mA/ft 2 (2.2 #A/m 2) ---,no corrosion damage is expected.• i_o_between 0.2 and 1.0 mA/ft 2 (2.2 and 10.8 #A/m 2) _ corrosion damage is
possible in 10 to 15 years.• ioo, between 1.0 and 10 mA/ft 2 (10.8/_A/m 2 and 108/_A/m 2) _ corrosion damage is
expected in 2 to 10 years.• io_ > 10 mA/f_ (10.8 _A/m 2) -, corrosion damage is expected in 2 years or less.
Five days after the concrete was placed, the first wet cycle was started. A 6 % (by weight)sodium chloride solution was used as the wet cycle ponding solution. The wet cycle durationwas 3 days. At the end of that period, the solution was removed from the specimens using awet-dry shop vacuum. During the dry cycle the ambient temperature was raised to 120°F(49°C) using several infra-red lamps. The high temperature dried the concrete and made itmoisture hungry to increase the penetration of chloride ions during the next wet cycle. Theduration of the dry cycle was 4 days.
During the ponding period, chloride contents of selected specimens were determined atdifferent depths using the a specific ion probe test method developed by James Instruments,Inc. (30). The results obtained by specific ion probe method were correlated to that obtainedby the standard AASHTO test method, T-260-78 (31).
The literature indicates that several different values of chloride ion concentration have been
suggested as a threshold value for the initiation of corrosion. The authors have consideredthe value of 1.2 lb/yd 3 (0.72 kg/m 3) of chloride ions in concrete as a requirement to initiatethe corrosion (32,33).
Treatment activities were started when it was determined that there was active corrosion in
most of the top rebars, all the potentials were more negative than -350 mV, the meancorrosion current density was 4.2 mA/ft 2 (4.5/xA/m 2) with most of the values being over 2mA/ft 2 (2.2/_A/m2), and the chloride contents at the rebar level of selected test specimenswere greater than 1.2 Ib/yd 3 (0.72 kg/m3).
Impregnation Treatment Process
During the treatment processes, the salt water ponding of all 18 specimens was suspended.Twelve forms were made to accommodate the 2-in (51 mm) height overlay. LMC overlayswere applied to the LM and PM series, while the LS and PS series were overlaid withLSDC. After the moist curing period (14 days), the sides of the overlays were coated withepoxy. The PC, PM and PS series specimens were grooved in preparation for monomerimpregnation.
For all the specimens, the groove width was 0.75 in (19 ram) and 3.0 in (76 mm) on center.The grooving parameters, see Fig. 5.2, were determined in accordance with the procedure
57
developed by Weyers and Cady (14, 15). The number of grooves in each specimen wasthree. The depth of impregnation was 0.5 in (13 mm) below the top rebars and the groovedepth was 0.5 in (13 mm) above the top rebars. Two depths of impregnation were involved.The specimens of the PC series had the original cover depth of 1 in (25 ram) and the finaldepth of monoraer penetration was 2 in (51 mm). For these specimens, the depth of groovewas 0.5 in (13 mm). The overlaid specimens (PM and PS series) had a cover depth of 3 in(76 mm), a groove depth of 2.5 in (64 mm), and the final depth of monomer penetration of 4in (102 ram). A masonry saw was used to cut along the groove lines which had beenmarked with a permanent ink marker. Concrete between the lines was then chipped out witha masonary chisel.
The objective of deep monomer impregnation is to encapsulate the steel by impregnating theconcrete to about a depth of 1/2 in (13 mm) below the top rebar level. A greater depth isnot desired as impregnating the concrete further is redundant and the larger volume ofmonomer required becomes an unnecessary expense. Encapsulation of the top rebar resultsin isolating the anode and thus forcing electrical discontinuity between the cathode andanode, consequently decreasing the corrosion current.
i
D • 1/2" for PCD = 2 ",".__ fcr .=M8n-J.=$
Fig. 5.2 Groove Dimensions
58
A drying temperature of 230°F (110°C) at 0.5 in (13 mm) below top rebar was used.Monomer impregnation of concrete had been used successfully at this temperature (20).Three propane-fired infrared heaters, placed side by side, were used to dry the specimens.In order to monitor the temperature at a depth of 0.5 in (13 mm) below the top rebar level,high temperature type T TC wires were encased in ceramic tubing and inserted into a holemade in the bottom of the specimens to a depth such that the TC junction was 0.5 in (13mm) below the top rebar. Nine specimens at a time were set up 9 in (23 cm) below theheaters.
Fiberglass insulation 3.5 in (89 mm) thick was wrapped around the specimens. Thefiberglass was supported by a layer of sand and gravel. The specimens were insulated toprevent the entry of heat from the sides. The TC wires were insulated to enable the TCjunction to measure the temperature at the proper location. A metal sheet with rectangularholes the same size as the specimen surfaces was placed over the specimens to assure thatonly the top surfaces of the specimens were exposed to the heaters. Two probes were usedto record the shaded ambient temperature and the temperature at the specimen surfaces.Along with the nine specimens, three cylinders 4 in (102 mm) diameter and 8 in (203 mm)long cast from the same concrete mix were also dried. The three cylinders were dried todetermine the rate of monomer impregnation through the concrete.
Temperatures were recorded at regular intervals after the heaters were turned on. After 70minutes of heating, the internal temperatures of two specimens reached 230°F (110°C).Since the internal temperatures of the other seven specimens were substantially lower, theheaters could not be turned off. To remedy the situation, the two adequately dried specimenswere covered with a metal sheet to prevent further heating of these specimens. The heaterswere turned off at 150 rain, when most of the specimens had the internal temperatures at therequisite value.
Because concrete acts as a heat sink, the internal temperatures of all the specimens continuedto rise (between 5 and 10°F [5 and 6°C]) until a thermal equilibrium was established.Temperature measurements were taken for about five hours. The specimens were thencovered with a layer of fiberglass insulation and left to cool for about 12 hours beforeimpregnation was started. This time was needed to minimize the difference between thesurface and internal temperature; the surface temperature had reached 529°F (296°C) whenthe heaters were turned off.
The ends of the grooves in the nine specimens were sealed with epoxy putty which does notdissolve in methyl methacrylate (MMA). The putty was also used to make 1 in (25 mm)high dikes on the three cylinders. The specimens and the cylinders were covered with plasticsheets. A slit was made in the middle of each plastic cover and covered by duct tape.
A mixture of 90% MMA and 10% TMPTMA was prepared by weight. Then 0.5% Azo, ofthe MMA and TMPTMA mixture, was added. The monomer was ponded on the top surfaceof the specimens and cylinders using a 20 ml pipette and placed through the slit in the plastic
59
cover. The slit was kept covered after the monomer was placed.
The three cylinders had impregnation times of 6, 14, and 23 hours. During that period moremonomer was added as needed to assure the availability of monomer for transfer into theconcrete. After the designated impregnation time for each cylinder was reached, the residualmonomer was drawn off with pipette. The cylinders were then placed in a hot water bath for4 hours at 185°F (85°C) for polymerization of the monomer. The cylinders were taken outof the bath and cut longitudinally in half using a masonry saw. The cut cylinders were thenetched with mu:datic acid. The acid etched all portions of the concrete except theimpregnated area. Thus, the depth of impregnation of the cylinders could be visuallydistinguished.
The depth of monomer impregnation in concrete is a function of the square root of time ofimpregnation (2:8). Using this relation, the data obtained from the acid etching of the threecylinders indicated that the time corresponding to the required depth was 16 hours.Accordingly, the specimens were impregnated for a period of 16 hours using the sameprocedure. At the end of that period, the residual monomer was drawn off with a pipetteand the specimens were polymerized in a water bath at 185°F (110°C) for 24 hours. Thegrooves in the PM and PS series were then filled with latex modified mortar (LMM).Application of ,',alt solution was resumed with the same wet and dry cycles used beforetreatments. Post treatment potential and corrosion current density measurements were takenperiodically.
Optimizing Drying Temperature
The objective of this part of the study is to investigate the possibility of using a lower dryingtemperature and to ascertain an optimum dry temperature of concrete prior to monomerimpregnation.
In order to accomplish this task, mortar cubes were cast, monomer impregnated at differenttemperatures, and observed using a Scanning Electron Microscope (SEM) and a MercuryPorosimeter. The cubes were subjected to chloride solution ponding-drying cycles and thechloride contents of powdered samples were measured to determine the effectiveness ofpolymer-impregnated concrete in reducing the ingress of chloride ions.
Forty-two 2 in (51 mm), mortar cubes were cast in accordance with ASTM C-109-90; thew/c ratio was 0.47 and the average compressive strength was 4450 psi (30.7 kPa). Fourteensets of cubes were cast; each set consisted of three cubes: A, B, and C. Set 14 served asthe control (CON). The cubes were moist cured for 30 days before air drying. Set 2 cubeswere air dried at 75°F (24°C). Cubes in set 3 through 13 were oven dried at highertemperatures ranging from 100°F (38°C) to 600°F (316°C), each set at a specifictemperature.
Each cube was fully dried at its designated drying temperature. A cube was considered fully
60
dry when the decrease in its original weight within a 24-hour period was less than 0.1% ofits weight. All cubes were placed in an oven at the same time and the oven was set to thelowest drying temperature, 100°F (38°C). When set 3 cubes were fully dried, they wereremoved and placed in a desiccator to prevent any moisture absorption before monomerimpregnation. The oven was then set at the next higher temperature, 125°F (52°C). Thisprocess continued until all cubes were dried.
At low temperatures, the cubes required a relatively longer time to dry, as water requires alonger time to evaporate at temperatures below the boiling temperature of water. It took 7 to11 days to dry cubes at temperatures below 225°F (100°C). As the temperature increased,the required drying time decreased; the drying time for set 12 cubes was 48 hours, at 5000F(260°C).
The monomer was mixed in the same way as the one applied to the concrete blocks. Themonomer impregnation was achieved in this case by submerging the cubes in the monomerfor a period of five days. That period was considered sufficient to complete the monomerimpregnation of the cubes (14).
After monomer impregnation, set 2 cubes, which were dried to an ambient temperature,showed random surface cracks. One cube had a small piece completely broken off. None ofthe other cubes which were dried to higher temperatures experienced any cracks. The samebehavior was noticed at an earlier time during a feasibility investigation. Repeatability ofthis cracking phenomenon suggested some expansive physiochemical reaction between thepore water and the monomer.
For polymerization, each cube was individually wrapped in aluminum foil and each set ofcubes was placed in water resistant plastic bags and immersed in a hot water bath at 185°F(85°C) for 24 hours. Aluminum foil and plastic bags were used to prevent the intrusion ofwater during the polymerization process. The cubes were then vacuum saturated and theirmoisture contents were determined.
Resistivity across opposite sides of each cube was estimated using Nilsson Soil ResistanceMeter. The suggested criteria used for interpreting resistivity values are presented below(17,18):
• If resistivity exceeds 12,000 fl-cm, corrosion is unlikely.• If resistivity is between 5,000 fl-cm and 12,000 f_-cm, corrosion is probable.• If resistivity is less than 5,000 f_-cm, corrosion is almost certain.
A separate study on marine structures in California indicated that at resistivity values over60,000 f]-cm, no corrosion would occur; but corrosion has been detected below 60,000 f_-cm(34). Other studies have suggested that corrosion is unlikely above 20,000 f_-cm and activecorrosion may occur at resistivities between 5,000 to 10,000 f_-cm (35).
61
A masonry saw was used to cut sections from cube C of each set. Pore size characteristicswere determined for one section using a mercury porosimeter. The total mercury intrusionvolume was the volume of mercury which could be forced into the specimen per gram of thespecimen weight under a maximum pressure of about 50,000 psi (345 MPa).
Chemical compositions were determined for the other section using a scanning electronmicroscope-energy dispersive X-ray spectroscope system (SEM-EDS). The evaluatedsections, in both tests, were approximately 2 x 1 x 1 in (51 x 25 x 25 mm), the maximumsize that can be accommodated in the mercury porosimeter. These sections were dried in anoven at 220°F (104°C) until their weight loss in a 24-hour period was less than 0.1% of theoriginal weigh1: before testing.
Although pore size distribution may be studied using other fluids and techniques, the mercuryintrusion technique is still the most widely used to examine the pore size distribution ofmortar sample:s. However, some limitations associated with this technique are wellrecognized. All pores are assumed to be cylindrical and accessible to mercury; although thepressure used !isiso-static, breakage in the pore structure may occur; contact angle of surfacetension will be different at different drying temperatures; and the volume of specimenrelative to the volume of the penetrometer may slightly affect the results.
Cube A of each set was submerged in a 6% (by weight) sodium chloride solution for 3 daysfollowed by 4 days of air drying. The wet and dry alternate cycles were continued for aperiod of 100 ,days. After that, resistivity values of the cubes were measured for a surfacedry condition. Each cube was then cut in half with a masonry saw. From one half, apowdered mortar sample was extracted from a square 1/4 in (6.4 mm) wide at 1/4 in (6.4mm) from the edge. Thus, the sampling depth was from 1/4 to 1/2 in (6.4 to 12.7 mm)from the specimen edge. The powdered samples were tested for chloride content using aCL-500 specific ion probe manufactured by James Instruments, Inc. (31).
The other half of each A cube was etched with muriatic acid. The acid was applied to astrip 1 in (25.4 mm) wide across the cube at its center, while the remaining portion of thecut surface was covered with duct tape.
Results of the drying temperature study, which will be discussed in the next section,suggested that a lower drying temperature than the one used for the treated overlay seriesblocks should be sufficient for effective monomer impregnation of concrete. To validatethose results, twelve specimens were cast with the same dimensions and rebar configurationas the previous blocks, except for the cover depth. Six specimens had 2 in (51 mm) coverdepth and the other 6 had a 3/4 in (19 mm) cover depth. Four specimens (two of each coverdepth) were dried to 150°F (66°C) at 1/2 in (13 mm) below the top rebar level, while theother 4 specimens were dried to 180°F (82°C). The other 4 specimens (two of each coverdepth) served as controls and were not impregnated.
Eight specimens were monomer impregnated, using the same procedure described earlier.
62
However, no grooves were cut in the specimens and the monomer was ponded on the topsurface. From the cylinder results, the time of impregnation for the specimens with 2 in (51mm) cover depth was 50 hours, and for the specimens with 3/4 in (19 mm) cover depth was16 hours. After polymerization, potential and corrosion current density readings were taken.
Analysis of Results
Polymer Impregnation of Overlaid Specimens
To minimize the effect of temperature on potentials and corrosion current readings, allmeasurements were taken at 72°F (22°C). The potential values and the corresponding 3LPcorrosion current values before and after treatments indicated that post-treatment potentialvalues did not accurately reflect the corrosion activity in the specimens. While the corrosioncurrent values in the treated specimens showed very little active corrosion, the correspondingpotential values for most specimens were well above the 90% active corrosion region, morenegative than -350 mV. The ic_ value is a more direct measure of corrosion activity thancorrosion potential.
The results are presented in the categories based on treatments: the first group includes CO,LM, and PM specimens; the second group includes CO, LS, and PS specimens; and the thirdgroup includes CO and PC. Throughout this section, the first group will be referred to asthe latex group, the second as the low slump group, and the third as the polymer-impregnated group.
The initial pre-treatment potential values ranged from about -225 mV to -260 mV, which isin the 90% no-corrosion region. During the first 50 days, the potential values became lessnegative indicating less corrosion activity, see Figs. B. 1 through B.3 in Appendix B. Apossible explanation is due to the formation of a passive layer of gamma iron oxide aroundthe steel which protects the rebar from further corrosion activity.
After 50 days, more negative potential values were measured due to the destruction of thepassive layer by the chlorides. At day 214, all specimens had potential values more negativethan -350 mV, which is in the 90% active-corrosion region.
Chloride contents were measured in selected specimens on days 71 and 190. At day 190, thechloride content at a depth of 1 to 1 1/2 in (25 to 38 ram), rebar level, for all the testedspecimens were well over the generally accepted threshold level for corrosion initiation, 1.2lb/yd3 (0.7 kg/m3).
The third method for monitoring the degree of corrosion was the i_o,values obtained by the3LP device. The mean of six readings were used for evaluation. The mean ico, values atday 214 were over 2 mA/ft2 (21.5 mA/m2) for all 6 series of specimens except the LMCoverlay specimens.
63
The specimens were prepared for the different treatments after day 214. It took about 33days to complete the entire treatment process, the corrosion activity most likely increasedduring that period. The mean post-treatment potential values are presented in Figs. B.4through B.6, Appendix B.
The mean values of the corrosion current density (see Figs. 5.3 through 5.5) indicated thatthe control specimens progressively corroded to extremely high levels with the passage oftime, while the corrosion current densities of treated specimens decreased and did notfluctuate significantly over time.
To compare the effectiveness of the different treatment methods, the percent change in eachpost-treatment ioo, value was computed on the basis of the last pre-treatment value as follows:
A = {(B- P)/B} x 100 (5.1)
where,
A = percent change,B = last pre-treatment ico_in mA/ft 2, andP = present ico,_in mA/ft 2.
Therefore, a positive ",_" value indicates that corrosion current has decreased from its pre-treatment level, while a negative ",_" value signifies a higher corrosion level compared to itspre-treatment value.
At day 181 after the application of the overlays, the control specimens (CO) had a "A" valueof-223.4% demonstrating the extreme corrosion activity of the untreated specimens as shownin Figs. 5.6 through 5.8. The latex (LM and PM) and polymer impregnated (PC) groupsdemonstrated values of over +50% at day 181, as presented in Figs. 5.6 and 5.8,respectively. "]['helow slump (LS and PS) group was well below +50% improvement level,as shown in Fig. 5.7. However, they remained in the positive range indicating that thetreatments had the desired effect of reducing corrosion levels. The low slump overlayspecimens had a value of +22.7% while the low slump overlay with polymer impregnationhad a slightly higher value of +36.2%. However, at 41 days after overlays, all treatedspecimens, except for the polymer-impregnated specimens, had negative "A" values. Apossible explanation is that a time lag is required before the overlays cause a decrease in thecorrosion current densities.
The absolute difference in the "A" between the last and first values may be a useful measureof the effectiveness of each treatment procedure. Table 5.1 summarizes this relationship.The maximum value of this measure was 91.03% for the LSDC specimens and the minimumvalue was 42.3,0% for the polymer-impregnated specimens with no well defined trendbetween the 3 .groups. This indicates that there was no appreciable difference in theeffectiveness of any treatment method. The specimens with only overlays demonstratedhigher values than polymer-impregnated overlays. This suggests that impregnation maydecrease the effectiveness of the overlays in abating corrosion.
64
mA/sa ft
301 a/
25; /
15 A J- - ,-,
I "10 .e ,.
0 50 100 150 2000AYS AFTER OVERLAYS (Days)
t
Fig. 5.3 Post-Treatment Mean i_o_, Latex Group
65
mA I:lcI ft30_
25! ;
2O
15 _-- a. -
10 ""
/
0 50 100 150 200DAYS AFTER OVF.RLAII_ (Oly=)
"6"C0 "-"_LS x I_ II
Fig. 5.4 Post-Treatment Mean i_o_, Low Slump Group
66
mA/s(l ft30
25 /
15 _ - ' _ -
1 "J
10 _ " "
°t0F--,T ..... ; ,i , ,-, : -, ,,- _
0 50 100 150 200DAYS AFTER OVERLAYS (DI,pl)
I-oo..,,o!
Fig. 5.5 Post-Treatment Mean i_o_, Polymer Impregnated Group
67
1013
1 I .4__ ._-- " I, _
500I,Mr,Dz -50,,=:_,. ,,. -_ro -1O0
-15Q ,
-200.
-25O6'o so lOO 12o 1_ 1_o 18o 2oo
DAYSA_ OVERLAYS(DAYS)
i
I I
Fig. 5.6 Percent Change in Mean i_or,,Latex Group
68
100 ....
5ot i . ,. ml i
0 _--_ "
:2:= _ ' ' " --100 / t ii i
--150
-200 , ,
1 i [1=1 i
DAYS AFTE_ OVERLAYS (DAYS)
' l--I--CO , L_ -_ PSi i i
Fig. 5.7 Percent Change in Mean Lo., Low Slump Group
Fig. 5.8 Percent Change in Mean i_o,,,Polymer Impregnated Group
7O
Table 5.1 Treatment Effectiveness
SPECIMEN LAST PRE- % CHANGE % CHANGE ABSOLUTE
TREATMENT I_., AT DAY 41 AT DAY 181 DIFFERENCE
(mA/sq ft) IN % CHANGE
LatexGroup
LM 1.76 -3.37 +79.85 83.22
PM 4.99 -2.89 +55.84 58.73
Low Slump Group
LS 2.82 -68.35 +22.68 91.03PS 4.92 -12.55 + 36.19 48.74
PolymerImpregnated
Group
PC 2.07 +41.73 +84.03 42.30
However, it was found that in the series with both overlays and monomer impregnation, thePM series (LMC overlaid-polymer impregnated) and the PS series (LSDC overlaid-polymerimpregnated) had the highest pre-treatment corrosion currents of 4.99 mA/ft 2 (5.35 t_A/m2)and 4.92 mA/ft 2 (5.34 #A/m2), respectively. It is conceivable that the higher corrosioncurrent densities had an effect on the "absolute difference in "A" values. It is reasonable to
expect that any treatment method would be more effective if the initial corrosion currentdensity is low.
By comparing the actual "A" values, the low slump group appears to be less effective thanthe other two groups. However, this measure might not be a very accurate representation ofthe situation, since it does not indicate the "degree" of the "A'.
The values of the "A" at day 41 (see Table 5.1) indicate that the low slump group had beenleast effective in abating corrosion at this age. The specimens which had been overlaid withLSDC (LS) had an unusually high negative "A" value, -68.35%, compared to the controlspecimens "A" values at the same time, -79.47%. The much lower negative "A" value(-12.55%) of the specimens with LSDC overlaid-polymer impregnation (PS) could probablybe attributed to the polymer impregnation. However, this value for the PS series was morenegative than for the other groups. The higher pre-treatment corrosion current densitiescould not be considered as a possible cause, since the specimens with LMC overlaid-polymerimpregnation (PM) also had similar high pre-treatment corrosion current densities. In thecase of the PM series, the "A" at day 41 was -2.89% which was comparable to the -3.37%value for the LMC overlaid specimens (LM).
71
A possible explanation for the apparently lower effectiveness of the low slump group is thatthe low slump mixture design for the LSDC overlay resulted in an imperfect compactionafter the overlay was placed. The LSDC overlay had a rough surface which suggests thepresence of more void spaces resulting in increased permeability for more rapid progress ofchloride ions after treatment.
Drying Temperature Optimization
The impregnation results of this part of the study are presented in Table 5.2. The amount ofwater loss increased as drying temperature increased. The volume of impregnated monomerwas 20% at 75°F (24°C) and 10.5% at 100°F (300C). The volume of impregnatedmonomer was 8.8% at 125°F (52°C) and it increased at higher drying temperatures up to400°F (204°C) above which it remained constant at 10.3%, see Fig. 5.10.
The cubes at 750F (24°C) were visibly cracked after the monomer impregnation and the highmonomer content was most likely due to direct physical entry of some monomer into thecracked cubes rather than entry by capillary flow. Although cubes dried at 100°F (38°C)were not visibly cracked, the anomaly in the monomer content might be due to direct entryof monomer via micro-cracks invisible to the naked eye. These cracks may be caused by theshrinking of hydrated material while the unhydrated particles act as inclusion in the paste,restraining it from shrinking freely.
The difference in volume between water lost and monomer gained increased with dryingtemperature. Thus, at higher drying temperatures, water-accessible voids were not beingrefilled with monomer. A possible explanation is that the monomer molecules, large organicmolecules, were filling voids only above a certain limiting size, and void sizes below thatlimit could not be filled with the large monomer molecules (molecular weight of Azo = 164,MMA = 98, and TMPTMA = 311). Another explanation may be the irrecoverable closureof smaller pores (39).
The moisture content values obtained after vacuum saturation of the cubes are presented inFig. 5.11. The: lowest value of moisture content was at a drying temperature of 200°F(93°C), above which the moisture content increased with increasing drying temperature. Attemperatures below boiling point of water, the higher moisture contents are probably due tothe result of remaining water after drying. At higher temperatures, the water could refillsmaller voids which monomer could not fill. At 2000F (930C), most available void spaceshad been filled with monomer molecules, resulting in a low absorbed moisture content. Themoisture contents of the control cubes (Set 14) were much higher (2.67%) than any of theimpregnated cubes, as shown in Table 5.2. Thus, some degree of monomer impregnation ispossible at low drying temperatures.
72
A
Lt_
< 1Q
l.UH
0Z0
l.t.. •0
0> 8.8
_oo 200. aOO 4oo sOO sooORYING _P (F)
Fig. 5.9 Volume of Monomer Loaded vs Temperature
73
0
0
z
Z _ ._o 0'_ _ _ _ I_ _I_ 0'_ _ t'M _'_ t_
m ,_ _ _'_ _ t'_ _0 I_ '_ '_" _ '_' _,1 ,""
v
o
• _ ;=0
o Z m
_ "_" . ,u. _, <
"_ _ _ _ _ ..... _ _:o N Z
< 0
,,4 ['_0 _ Z
_- _ u_ o _ o _ o o o o o ua <- e_ u_ e- o ea _ o o o o m ua
74
For the resistivity measurements, resistivity values before salt application showed peak valuesat drying temperature of 200°F (93°C) and 300°F (149°C) and then decreased at highertemperatures, as shown in Fig. 5.12. The lowest resistivity value was 200,000 f_-cm. Asnoted previously, other studies suggested that no corrosion will occur above a resistivityinterrange of 12,000 f_-cm to 60,000 f_-cm (17; 18; 34). Thus even if the most conservativevalue is used, the lowest resistivity value obtained was in the no-corrosion region.
Resistivity values followed a trend which supported the corresponding values of moisturecontent. Around 200°F (93°C), moisture content was the lowest and resistivity was near itspeak. Since the ionic solution is a conducting agent, resistivity of concrete increases withdecreasing moisture content.
Resistivity values after salt application were much lower than pre-salt application values (seeFig. 5.12). The trend after salt application was similar to that before salt application withrespect to drying temperature. Apart from a large downward shift, there was apparently aslight shift to the right (an increase in the drying temperature).
Values of the post-salt application resistivity were low due to the C1- ions in the mortar porewater. The value corresponding to 200°F (93°C) was 20,500 f]-cm, which is greater thanthe lowest suggested no-corrosion value of 12,000 f]-cm, but less than the highest suggestvalue of 60,000 f_-cm. However, the possibility remained that the surfaces of the cubes werenot fully dry. Some micromolecular layers of salt water may have been absorbed on thesurface when post-salt application resistivity values were taken, which could have reduced thevalues.
The results of the mercury porosimeter showed that at lower drying temperatures, the totalmercury intrusion volume was high, as fewer voids were filled with polymer. At pre-impregnation drying temperatures of 200°F (93°C) and 225°F (107°C), there was an abruptdecrease in total intrusion volume. Thus, it appears that most of the available voids at these
temperatures were filled with polymer (see Table 5.3). At higher temperatures, totalintrusion volume increased. More void spaces were present which were too small formonomer molecules to occupy but large enough for mercury to enter. As expected, controlcubes had more intrusion volume (0.0606 cc/g) than any of the impregnated cubes except forcubes dried at 175°F (79°C).
The above conclusion was further supported by total pore area of cubes dried at differenttemperatures. At lower temperatures, the total pore area was high; at 200°F (93°C) and225°F (107°C), the total pore area was the least; and at higher drying temperatures, the totalpore area increased, see Fig. 5.13. The total pore area of the control cubes was higher thanthat of any of the impregnated cubes.
The average pore diameter showed a decrease at temperatures over 250°F (121°C). Thisindicates that, in spite of larger total pore area at higher temperatures, the average porediameter of available pores is smaller and supports the hypothesis of selective filling of poresby monomer. The high value of average pore diameter at 225°F (107°C) and 250°F(121°C) may be due to the ink-well effect. The ink-well effect usually refers to a voidwhich has a small pore opening and a large cavity so a large amount of mercury is injectedinto the sample: at the size of the small pore opening.
The SEM was used to identify the elements and their relative quantities, as presented inTable 5.4. Since few conclusions could be drawn from the absolute values of the amounts of
each element identified, the ratios of carbon to some of the elements were calculated.Carbon does not normally occur in concrete, but it is a major component of polymers. Onthe other hand, calcium (Ca) and silica (Si) occur only in cements and not in polymers. Thevalues of C/Ca increased abruptly at drying temperatures of 225°F (107°C) and 250°F(1210C), indicating the presence of larger quantities of polymer. The Ca/Si at 225°F(107°C) was very low, possibly because the cementitious particles were masked by polymerin the spots the; SEM scanned.
78
0.06" "-",,, E
_,lO <> 0.04 mn-Z <0 ,,t
0.03 =Q
rr ft.F-- .j
_z 0.02 -z"_ 0
0.01 :I _"OF-
0100 200 300 400 soo 660
OR¥1NGTEMP (F)
'-'_- TLINTRU VOL l TLPOREAREA I
Fig. 5.12 Intrusion Volume Pore Area vs Temperature
Although the SEM results could be interpreted as supporting previous conclusions, definiteinferences should not be drawn from this test for the following reasons:
1. The SENI scans a small area of the sample. As the sample is non-homogeneous, therelative ratios of elements in one spot might be a biased representation of the sampleas a whole.
2. The SEM scans only the cut surface; certain elements which might be present insignificaaat quantities below the cut surface would not be represented in the results.Also, obtaining thin layers of mortar cubes to test concrete at different depths was notfeasible.
The relationship between chloride content and drying temperature (see Fig. 5.20) indicatedthat with higher drying temperatures there was a decrease in chloride content as highervolumes of polymer resisted the CI ingress into cubes. This observation is in agreementwith resistivity measurements (Fig. 5.13). In general, the increase in chloride contentaccompanied a decrease in resistivity. The maximum chloride content was 0.66 lb/yd 3 (0.39kg/m 3) at a drying temperature of 125°F (52°C). For control cubes, the chloride contentwas much higher, 14.38 lb/yd 3 (8.54 kg/m3). With the absence of polymer molecules,chloride ions re_adily diffused into the mortar cubes.
Application of acid had no discernable effect on any of the impregnated cubes. The polymerprevented the dissolving of cement particles. However, in the non-impregnated cubes, thecement portion was attacked by the acid. For a more visual demonstration of thisphenomenon, both impregnated and unimpregnated cubes were colored with a permanentmarker and then etched with the acid. In the impregnated cubes, the color remained almostthe same while in the non-impregnated cubes, the color started to fade after repeatedapplications of the acid.
80
0.66
0.64
u
I---Z;I,l.lI-,-z 0.6
°':=: 0.58
0.54,360 sOos o.600
DRYINGTEMP(F)
Fig. 5.13 Chloride Content vs Temperature
Corrosion Activity at Different Drying Temperatures
To achieve this objective, three drying temperatureswere applied: 150°, 180°, and 230°F(66°, 82°, and 110°C), respectively, at 1/2 in (13 mm) below the rebar level at the time theheaterswere turnedoff.
As indicated earlier, 18 specimens were dried to a temperature of 230°F (110°C) at 1/2 in(13 mm) below the rebar level. All specimens had a 1 in (25 ram) cover depth and 2 in (51mm) of overlay except the polymer impregnated (PC) series, which attained the requisitetemperature before the other specimens, see Fig. 5.15. It took 155 minutes to achieve theneeded temperature. The internal temperature for the overlaid specimens increased by 5 ° to10°F (3° to 6°C) after the heaters were turned off. The surface temperature reached 529°F(276°C) and then decreased sharply for two hours after the heaters were turned off, afterwhich point the rate of cooling was gradual. After 850 minutes from the time the heaterswere turned off, the surface temperature was 50°F (10°C) and the internal temperature was100°F (38°C).
81
A one-hour during was needed for heating to 150°F and 180°F (66°C and 82°C,respectively) at 1/2 in (13 ram) below the rebar level for the 2 in (51 mm) cover depth. Thetemperature increased by 8 ° to 18°F (4 ° to 10°C) after the heaters were turned off in thecase of 2 in (51 ram) cover depth. When the cover depth was 3/4 in (19 ram), thetemperature increased by 20 ° to 24°F (11 ° to 13°C), and the drying time was about 1/2hour.
At the time of impregnation, the 3/4 in (19 ram) cover depth specimens had very high ratesof corrosion (see Fig. 5.16). One of the specimens had a visible crack running on thesurface vertically over the left rebar, and another specimen had corrosion products on the topbut did not have any visible cracks. There were other specimens with the same cover depth(which were not treated) that had visible signs of active corrosion. It is likely, at that pointin time, that most if not all of the specimens with 3/4 in (19 ram) cover depth had somestructural damage due to high corrosion currents even though it was not visible in allspecimens. After impregnation, the corrosion currents in all specimens decreased. After aperiod of time, the corrosion currents in the 3/4 in (19 mm) cover depth specimens started torise. However, the "% change" was still positive at day 89 (see Fig. 5.17). After dryingand subsequent impregnation, cracking above the rebar was visually evident in thesespecimens, most specimens displaying hair-line cracks. The cracks were responsible forallowing large quantities of chloride ions to enter the impregnated specimens resulting insome corrosion despite the presence of polymer in the concrete.
For the 2 in (51 mm) cover depth specimens, the mean corrosion current densities were verylow and not in the active corrosion region. The corrosion current at day 89 afterimpregnation figr these specimens were actually higher than their pre-impregnation values.However, the corrosion current was still low and not in the active corrosion region.
82
I ml
_PS.,,, " PM _- PC I
Fig. 5.14 Temperature at 1/2 in (13 ram) Below Top Rebar vs Time
The following findings were obtained during this part of the study:
1. The CSE was found to be an unreliable instrument after active corrosion cells hadbeen successfully abated by the various treatment methods.
2. Reducing concrete drying temperature from 230°F (110°C) to 180°F (82°C) resultedin a drying time reduction factor of 2.5.
3. Structural damage in concrete impairs the effectiveness of polymer impregnation as acorrosion abatement technique.
4. Polymer molecules, being large organic molecules, fill up voids in concreteselectively, depending on void size.
5. Polymer impregnation of mortar cubes provided good resistance against the ingress ofchloride ions.
The following conclusions were reached.
1. This study concluded that there was insignificant difference in the effectiveness of thefive treatment methods used in this investigation: LMC overlay, LSDC overlay,polymer impregnation, LMC overlay with polymer impregnation, and LSDC overlaywith polymer impregnation. However, the treatments involving LSDC overlay mightbe less effective than the other four methods investigated.
2. Pre-impregnation drying temperatures can be lowered to 180°F (82°C) at 1/2 in (13mm) below top rebar level at the time the heaters are turned off. Due to the thermalgradient, the temperature at that depth would continue to rise to about 200°F (93°C).
3. The study on the mortar cubes yielded the conclusion that optimum impregnation isachieved at a drying temperature of about 200°F (93°C).
4. Polymer impregnation of concrete is an effective technique to reduce the chlorideintrusion.
85
% Change100 r
6O
40
2O
0 i''' ' _ i
0 SO 100 150 200DAYSAFTER IMPREGNA130N (D=y=)
I ' lqV"PC-230 F (1"_ -'=--PM-180 F 13/4") "_PC-lSO F1314"_
Fig. 5.116 Percent Change in Mean i=o. (1", 1/4"; 150 ° F, 180 ° F, 230 ° F)
86
Part II: Developing New Techniques:Laboratory Investigation of Corrosion
Inhibitors
6
Laboratory Investigation of Corrosion Inhibitors
Introduction
As presented in Part I, there are several methods that can be used to rehabilitate reinforcedconcrete bridge decks which have deteriorated as a result of chloride induced corrosion. Afeasibility study on corrosion inhibitors identified four inhibitor combinations (13). In thispart of the investigation, procedures were developed to apply corrosion inhibitors on bridgecomponents for which the chloride-contaminated concrete has been removed to at least thetop layer of reinforcing steel. Inhibitor effectiveness was evaluated in conditions simulatingfield construction. The study was performed in three phases: evaluation of corrosioninhibitors, development of field treatment procedures, and estimation of service life.
The first phase employed 1 ft x 1 fi (0.3 m x 0.3 m) laboratory specimens in whichcorrosion was accelerated by cyclic chloride solution exposure. A treatment matrix wasdevised to test the effectiveness of the application procedures on varying rates of corrosion.The change in corrosion current was measured using non-destructive techniques.
Treatments proven effective in the first phase were used in the second phase, determiningnecessary application procedures for field use. Various parameters that would influenceconstructability were investigated: inhibitor influence on the strength, workability, anddurability of modified concrete. This phase culminated in the treatment of sections removedfrom a deteriorated bridge deck. The third phase attempted to estimate the additional servicelife resulting from the treatments.
Corrosion inhibitors are used to prevent or delay corrosion of metals exposed to corrosiveenvironments. Corrosion inhibitors are generally classified as anodic, cathodic or mixedinhibitors according to their function. Anodic inhibitors reduce the rate of reaction at theanode. They usually react with the corrosion products to form a protective coating on themetal surface. Cathodic inhibitors act to prevent the reaction at the cathode. Griffin (36)
89
states, "Reactive products of cathodic inhibitors do not bond to the metal surface as tightly asthose of anodic inhibitors and are, therefore, less effective." Cathodic inhibitors act
indirectly since they do not prevent metal dissolution. Mixed inhibitors influence both theanodic and the cathodic sites. This is especially advantageous in reinforced concrete due lothe prominence: of micro-cell corrosion.
Inhibitors are classified as follows (37): adsorbed layer formers, oxidizing inhibitors-passivators, conversion layer formers, and scavengers. Adsorbed layer formers are organicinhibitors which strongly adsorb to the metal surface and interfere with the anodic orcathodic reactions in the area of adsorption. The effectiveness of these inhibitors ismeasured as a percent reduction as shown in Equation 6-1 (36).
%inhibition =10_-_ --_) (6-1)
where,R = corrosion current without inhibitor, andR* = corrosion current with inhibitor
The percent inhibition is a function of the surface coverage of the adsorbed layer.
Nitrogen is usually the active atom in an adsorbed layer inhibitor acting in a non-acidelectrolyte on steel. Typical compounds of nitrogen used as inhibitors are organic nitrate.,.and amines. The bond strength of the adsorbed layers is due to the nitrogen atom's highdensity of eleclxons and ability to form co-ordinate bonds (38).
Vapor phase inhibitors (VPI or Volatile Corrosion Inhibitor VCI) are similar to adsorbedlayer inhibitors. Miksic (39) stated that: "Volatile Corrosion Inhibitors axe secondaryelectrolyte layer inhibitors that possess appreciable saturated vapor pressures underatmospheric conditions, thus allowing significant vapor phase transport of the inhibitivesubstance. '° Aliphatic and cyclic amines and nitrites with a high vapor pressure typicallymake up these inhibitors (38).
Oxidizing inhibitors or passivators are another form of barrier inhibitor which act by shiftingthe electrochemical potential of the corroding metal such that an insoluble oxide or hydro:rideforms on the metal surface (37). Sodium nitrite and chromates are examples of thisinhibitor. Another form of passivators are metal soaps which are a form of the basicpigments (me_d oxides) and oxidation products of oil, such as cinnamic and pelargonic acid,which form passivating films on the metal surface (38).
Conversion layer inhibitors form insoluble compounds on metal surfaces without oxidation.In neutral or basic solution, the presence of calcium and magnesium ions inhibits corrosicnby the formation of an insoluble calcareous scale on the metal surface (37).
90
Finally, scavengers act as neutralizing inhibitors by removing concentrations of corrosivematerials such as CI ion.
The effect of corrosion inhibitors is generally concentration dependent, which may causewhat is called dangerous inhibitors. Dangerous inhibitors increase the rate of attack inunprotected areas, similar to the haloing effect which is sometimes produced around patchesdue to the increase in the cathodic area after repair. Most anodic inhibitors are dangerousinhibitors (36).
Selection of Corrosion lnhibitors
In research reported in Task 2 (13), seven corrosion inhibitors and two sealers wereevaluated to determine their effectiveness in reducing corrosion currents in reinforcedconcrete specimens (40). The following five corrosion inhibitors were identified as showingpromising results and were recommended for further study:
1. Alox 901 (proprietary oxygenated hydrocarbon produced by the partialoxidation of an aliphatic hydrocarbon): An organic inhibitor which forms aprotective film by conversion to a metallic soap.
2. Cortec VCI-1337 [MCI-2020] (a proprietary blend of surfactants and aminesalts in a water carrier): A secondary electrolyte layer inhibitor withappreciable vapor pressure under atmospheric pressure or volatile corrosioninhibitor, (VCI) (39). The product is designed to migrate in a vapor phase andadsorb on a metallic surface forming a monomolecular film at both anodic andcathodic sites.
3. Cortec VCI-1609 [MCI-2000] (proprietary alkanolamines): This product isdesigned to migrate and inhibit in a manner similar to VCI-1337 with thedifference that it is a concrete admixture.
4. DCI (calcium nitrite, Ca(NO_)z): The nitrite ions in this inhibitor are thoughtto compete with the chloride ions for the ferrous ions at the anode. The nitriteand ferrous ions react as follows:
2Fe Ät +Fe203+H20 (6-2)
This reaction forms a stable passive layer on the reinforcement steel (41).
DCI is designed as a concrete admixture for corrosion inhibition. Unlike itspredecessor sodium nitrite, it does not adversely effect the strength gain of theconcrete. However, it does act as a strong accelerator, normally requiring theaddition of a water reducer and a retarder in the concrete mixture.
91
5. Sodium tetraborate (Na2B407): An experimental inhibitor which forms aprotective layer on the metal surface through the reaction of borate andoxygen. This reaction appears to be highly dependent on the pH of the poresolution. Tests indicate that the borate ion is more mobile in concrete than the
chloride ion, indicating an ability to migrate faster to the rebar in concrete(42).
Experimental Design
Overview
The task of developing repair and rehabilitation techniques using corrosion inhibitors forreinforced concrete structures was accomplished in three phases:
I) Evaluation of Corrosion InhibitorsII) Development of Field Treatment Specifications
III) Estimation of Service Life
Initial corrosion inhibitor evaluations were carded out on 1 ft x 1 ft (0.3 m x 0.3 m)reinforced concrete specimens. Thirty-six specimens with varied ranges of corrosion actb,itywere treated. Specimens were cast having one or two triads of reinforcing steel (rebar).After initial curing, the specimens were alternately ponded with a 6% (by weight) salt wal:ersolution and allowed to air dry to induce corrosion.
Half-cell measurements were initially used to monitor corrosion activity in the specimens.Once a drop in the corrosion potential indicated the initiation of corrosion activity, anunguarded linear polarization device, the 3LP, was used to monitor the corrosion currentdensity. Chloride measurements were taken at the bar level prior to treatment.
Overlay bond strength tests were performed initially on 16 well cured 1 ft x 1 ft (0.3 m x0.3 m) specimens prior to the treatment of 5 ft x 5 ft (1.5 m x 1.5 m) slabs.
Bridge deck slabs were treated in Phase II. The slabs were salvaged from a bridge deckremoval project on 1-80 in Pennsylvania. Three combinations of inhibitors and modifiedoverlays were applied. Both the 3LP and a linear polarization device with a guard ringelectrode (Geocisa Gecor Device) were used to monitor the corrosion current of treatedspecimens.
Freeze-thaw durability tests were performed on the modified overlay concrete used in PhaseII, using ASTM C-666-84 Standard, "Resistance of Concrete to Rapid Freezing andThawing, procedure A."
92
Specimen Preparation
Twenty-four specimens with one and two triads of reinforcement steel were cast. Formswere constructed for 12 specimens of each configuration. The dimensions for the one andtwo triad configurations are presented in Figs. 6.1 and 6.2, respectively.
The forms were made of 3/4 in (19 ram) BC grade exterior plywood fastened with drywallscrews. The reinforcement steel was supported by plywood spacers placed at the two ends ofthe form, and 5/8 in (16 mm) diameter holes were drilled in the spacers to accommodate theASTM grade 60 #4 bar with a nominal 0.5 in (13 mm) diameter. The three 12 in (305 mm)bars were cleaned with hexane and oven dried to remove any manufacturing latencies. Theends of each bar were covered with electroplating tape to provide a known length of exposedcorrodible steel.
Prior to placing the concrete, the forms were twice coated with form oil and the rebar placedin the holding spacers. A type T TC was attached to the center of the top rebar withelectroplating tape. To minimize the initiation of subsidence cracking, specimens were castin an inverted position. A vibratory table was used to consolidate the fresh concrete.
The first set of one triad with 2 in (51 mm) cover specimens was cast with ready-mixconcrete in accordance with Virginia A4AE Bridge Deck Air Entrained concretespecifications. A set of two triads, with 2 in (51 mm) cover specimens was cast 20 dayslater. The ready-mix concrete for both sets, had the same specifications and was producedby the same supplier. The mixture proportions are presented in Appendix C, Table C-1.
The one triad with 1 in (25 mm) cover depth specimens were cast 83 days later. Theconcrete cover was reduced to decrease the necessary time for the chlorides to diffuse to thetop reinforcing steel and initiate corrosion. The concrete for this group of specimens wasbatched in a 2 ft3 (0.057 m 3) pan mixer in the laboratory. Four batches were required toproduce the 12 specimens. The mixture proportions are presented in Table C-1 and theaggregate properties are presented in Table C-2, Appendix C.
Once the concrete was placed and consolidated, the specimens were covered with moistburlap and polyethylene sheets and allowed to cure for 3 days prior to form removal.
One end of each rebar was tapped to accommodate a No. 10-24 x 3/8 in (9.5 mm) machinescrew. The top and bottom layers of steel in each triad were connected with a 100fl resistorand the two bars in the bottom layer were connected with 18 gauge wire as shown in Figs.6.1 and 6.2. A male subminiature connector was attached to the type T TC leads.
The sides of the specimens were coated with epoxy to reduce diffusion of oxygen and water-vapor to simulate the boundary conditions on an actual bridge deck.
93
, li II II
, , II I| I
12"
' riII li ]I
IIZ"
.q,.
_L ---T
_..__.,_. 2- ___. --1-
100 o_____"
Fig. 6.1 One-Triad Specimen Configuration
94
ASTM =4 Bmr-
1Z" 10 1/
ta
ii
i
,[, , 0 • , i I = , , • '= ,
[ o j! I w o
-"=1 "-- I/2"
I=lexr_lass Ork:e
F
,,,,, __o00I-ml
'=" 3" "=='- 3 '''= _ q 1/2"
Fig. 6.2 Two Triad Specimen Configuration
95
Corrosion Initiation
The specimens were ponded with 400 ml of a 6% (by weight) NaC1 solution on a weeklybasis. The salt water was ponded on the specimens for three days, after which, it wasremoved with a wet/dry vacuum. The specimens were then allowed to air dry for four daysbefore the cycle was repeated. Plexiglass dikes, 10 in x 10 in x 2 in (254 mm x 254 mm x51 ram), were attached to the top surface of each specimen using silicone caulk to contain thesalt water solution. The specimens were stored in an insulated conditioning room tominimize temperature fluctuations.
One day after the removal of the salt water, half-cell potentials measurements were taken ,)neach specimen. Three measurements were taken along the surface above each bar using aCSE reference half-cell and hand held voltmeter in accordance with ASTM C-876-87 (24).
A specimen was considered to be actively corroding when the mean potential value was n_orenegative than -1350inV.
After the probable initiation of corrosion, the specimen's corrosion current density wasmeasured using; a 3LP device. The corrosion current density (icon)was calculated using tteStern-Geary equation. The Tafel slope constant was estimated at B = 40.76 mV (22).According to Farraday's Law, the corrosion current (lco,) is directly proportional to thecorrosion rate. Thus, ico_(corrosion current density) measurements provide a relativeindication of the corrosion activity in the specimens. Clear (22) correlated the i_o,measurement with the time to expected damage of the concrete as presented in Table 6.1.
After the first year of salt water ponding cycles, 3LP estimates were routinely taken on all ofthe specimens, even those with potentials more noble (less negative) than -350 mV CSE.
Chloride measurements as a function of depth were also taken from the specimens to pro,_idean additional indication of corrosion activity. Powdered concrete samples were collected in1/2 in (13 mm) increments starting at a depth of 1Ain (6.5 mm). The samples were collectedusing a rotary _tmpact hammer equipped with a 11/8in (29 mm) masonry bit. The sampleswere obtained with a vacuum-assisted collection device through a hole in the tip of the bil(31).
Table 6.1 icon.Correlated to Time to Expected Damage
i_.,, (mA/Ft_ Time to Expected Damage
i._ < 0.20 Not Expected
0.20 < i..,_ < 1.0 Possible in 10-15 years
1.0 < i._,_ < 10 2-10 years
I._,, > 10 < 2 years
96
The C1- ion concentration of the sample was measured using the specific ion electrodemethod (31). The method uses an acid-based solution to digest three grams of the collectedpowdered concrete sample. The chloride threshold necessary for the initiation of corrosionwas considered 1.2 lb/yd 3 (0.7 kg/m3).
The corrosion inhibitors were divided into four cells of surface ponding agents and concreteadmixtures. The application concentrations were based on the research reported earlier (13).An untreated latex-modified overlay was included as a control in each cell combination. Thetreatments were applied to specimens with chloride-contaminated concrete cover removed tothe rebar level. Table 6.2 presents the inhibitor combinations and application concentrations.
Three application methods were used to apply the inhibiting agents: one-day ponding, two-day ponding, and one-day ponding of specimens dried to 180°F (82°C) at 1/2in (13 ram)below the top reinforcement.
Three overlay systems were applied to specimens for which the chloride-contaminatedconcrete cover was not removed. These systems were 1 in (25 mm) LMC overlay, 21/2 in(64 mm) hot-mix asphalt overlay with a waterproof preformed membrane, and a thin polymerconcrete overlay.
In order to investigate the effectiveness of the treatments on varying corrosion currents, thecorroding specimens were divided into three categories based on time to expected damage ascorrelated to ico_(see Table 6.3). The matrix shown in Table 6.3 was designed toincorporate the effect of different treatment procedures and materials on the range ofcorrosion current densities.
The specimens were treated in three separate groups. The first group included the blockswith one- and two-day ponding of specimens with low corrosion current densities, 1-dayponding of dried specimens with high initial corrosion current densities, and the overlaycontrols.
After monitoring the ico, estimates of the one- and two-day ponding groups for two months,it was determined that two-day ponding did not have a significantly different effect oncorrosion current densities than did one-day ponding, see Fig. 6.8 and 6.10. Therefore,further treatments with two-day ponding and control overlays were eliminated.
The second treatment group included one-day ponding and one-day ponding with drying ofspecimens with medium initial corrosion current densities. The third treatment groupconsisted of one day ponding of dried specimens with low initial i_ estimates.
Prior to the application of the corrosion inhibitors, the chloride contaminated cover concretewas removed to the top layer of reinforcing steel. The top surface of the specimen wassawed perpendicular to the rebar at I/2 in (13 mm) intervals using a water-cooled masonrysaw with a 1/16 in (1.6 mm) thick diamond blade. The cut depth was set to avoid contactwith the rebar. The sawed cover concrete was removed with a hammer and a masonrychisel.
After the cover concrete was removed, a 1Ain (6.4 mm) diameter hole was drilled in thebottom of each specimen to be dried, to a depth equal to 1/2in (13 mm) below the top reb:u'.A type T TC with glass braid insulation was installed in the hole and the hole was sealedwith duct seal.
The specimens were then placed on a sand bed under a steel frame which supported theheaters. Fiberglass insulation was placed around the sides of the specimens to simulatesingle surface heating which would occur on a bridge component such as a bridge deck.
Propane infrared heaters were suspended at a height of 16 in (0.34 m) above the top surfacesof the specimens. Once the heaters were lit, the specimen temperature was recorded at 2-minute interval.,;. A surface probe was used to monitor the approximate specimen surfacetemperatures. The heaters were shut off when the mean temperature of the specimens at 1/2in (13 mm) below rebar level reached 180°F. The temperatures were then monitored for anadditional 30 minutes. Drying temperatures as a function of time for each group ofspecimens are presented in Figs. C. 1 - C.3, Appendix C. Specimens were then covered withfiberglass insulation and allowed to cool slowly to help prevent thermal cracking.
The corrosion inhibitors, designated as surface ponding agents, were applied to the surface;ofthe specimens for the time period specified in the treatment matrix (Table 6.3), prior to theiroverlay. The ponding agent was contained by 2 in (51 mm) height sealed forms prepared tobe used for placing the overlay. The corrosion inhibitor was poured into the forms to adepth of IA in (6.4 mm). The insides of the forms were coated with an epoxy to provide anearly non-absorbent surface.
At the end of the ponding period, the excess inhibitor was removed with a wet/dry shopv_c.Dry cement was dusted onto the surface of the specimens treated with Alox 901 to helpabsorb residual petroleum products. These specimens were then placed outdoors in directsunlight for one;hour after which time the surface was blasted clean of loose particles withcompressed air.
The batch proportions used for the modified overlay mixtures are presented in Appendix C,
98
Table C-3 through C-6. The initial mixes were modified with progressive treatment groupsto provide improved strength, workability, and freeze-thaw durability. The overlay concretewas batched in a 2 ft3 (0.057 m3) pan mixer.
A thick grout was applied to the surface of each specimen immediately prior to placing theconcrete. The grout was obtained by sieving out the coarse aggregate from a portion of theconcrete mixture. The specimens were placed on a vibratory table to consolidate the overlayconcrete. The slump, air content, and unit weight of the plastic overlay concrete wasmeasured. The overlaid specimens were covered with moist burlap and polyethylenesheeting for three days. After curing, the sides of the specimens were recoated with epoxyand the ponding dikes reinstalled. Until 28 days after placement, the specimens were pondedwith water.
Six 4 in x 8 in (102 mm x 152 mm) cylinders were cast from each concrete batch. Thecylinders were cured at 70" + 2°F and 100% relative humidity. The compressive strengthof pairs of cylinders was measured at 1, 7, and 28 days in accordance with ASTM C-39-86,"Compressive Strength of Cylindrical Concrete Specimens." Fresh and hardened concretemixture characteristics are summarized in Appendix C, Table C-3 through C-6.
Three control overlays were used for comparison purposes: 1 in (25 mm) LMC overlay,thin polymer concrete overlay, and 2% in (64 mm) hot-mix asphalt (HMA) overlay withwaterproof preformed membrane. The 1 in (25 mm) overlay was placed in the same manneras the above treatments.
A non-skid flexible epoxy-urethane co-polymer, MARK-163 Flexogrid, produced byPolycarb was used as the binder for the thin polymer overlay. The application procedure isdescribed in Appendix C, Table C-7A. The aggregate was a Morie #3 basalt. Particle sizegradation and physical characteristics of the aggregate are given in Appendix C, Table C-7B.The overlay was applied in accordance with the manufacturer's specifications.
W. R. Grace's Bituthene preformed membrane system was used with hot-mix asphaltoverlay. The preformed membrane was applied according to the manufacturer'sspecifications. The hot-mix asphalt, a Virginia SM5 surface mixture, was heated andcompacted in a 21A in (64 ram) plywood form built around each specimen. The mixtureproperties of the HMA are presented in Appendix C, Table C-8.
99
0
.!_ ._ _ ._ o_
Post-Treatment Corrosion Monitoring
Chloride exposure of specimens to a 6% NaC1 solution applied on a three-day ponding andfour-day drying cycle was resumed 28 days after the overlay placement. Corrosion currentdensity estimates were taken with the 3LP on a regular basis to monitor the corrosionactivity. The readings were taken on the second day of the drying cycle.
Determination of Bond Strength
The bond strength between the modified overlay and base concrete was measured todetermine the influence of the corrosion inhibitors. A poor bond strength would indicate thatthe overlay would probably delaminate and spall under traffic loading and/or freezing andthawing cycles. The bond strength was measured using a method described in ACI 503R(43).
Treatment of Bridge Deck Slabs
The bridge deck slabs were salvaged from a bridge deck replacement project on 1-80 inPennsylvania. The slabs were stored indoors for a month prior to treatment to minimizetemperature fluctuation, and covered with moist burlap and polyethylene sheeting to preventmoisture loss.
Prior to treatment, a corrosion survey was conducted on the slabs similar to that whichwould be conducted on an actual bridge deck. The survey concluded: sounding fordelaminations, cover depths, corrosion potentials, ioo,,estimates with both the 3LP and Gecordevices, and chloride measurements.
The measurements were taken on all the transverse bars across the slab before a second
measurement was taken at a different location on a single transverse bar. The 3LPmeasurements were taken at least one hour after the Gecor measurements. Chloridemeasurements were taken at two locations on each slab.
Prior to the application of the corrosion inhibitors, the cover concrete was removed to thetop layer of reinforcing steel. In order to obtain the same surface texture found on a bridgemilled in the field, a commercial milling machine was used by a professional crew. Theslabs could not be properly anchored to allow accurate milling, therefore, to avoid damagingthe slabs, the remainder of the cover concrete was removed by sawing the slab with a walk-behind concrete saw using a 3/16 in (4.8 mm) thick diamond blade. The sawed concrete wasremoved with an electric demolition hammer.
The surface ponding technique used for the 1 ft x 1 ft (0.3 m x 0.3 m) specimens would bedifficult and expensive under field conditions. Therefore, surface-applied corrosioninhibitors were sprayed on the slabs using a _h gallon (1.8 L) polyethylene garden sprayer.Three equal spray applications were applied to the slab; the second and third applicationswere applied IA hour and 12 hours after the initial spraying, respectively. The spraying rates-
101
for uniformly saturated surface for a single application are shown in Table 6.4.
Sodium tetmborate was not used in the Phase II study because it did not perform as well asthe LMC controls where the cover concrete was removed.
After the inhibitors carrying solvent had evaporated, the surface of the slab was blasted cllmnof loose particles with compressed air. The slabs which were treated with Alox 901 andCortec VCI-1337 were lightly sandblasted to remove residues left by the inhibitors in orderto achieve an acceptable bond strength.
Forms were constructed for the slabs primarily with 5/8 in (16 ram) BC Grade exteriorplywood. The slabs were placed in the form with a forklift so that the ends of the transversebars on 1 side would be accessible after the overlay was placed. This allowed accuratelocation of the .,_teelafter overlay and easy connection to rebars (working electrodes).
Mix designs and batch characteristics are presented in Appendix C, Table C-9 through C-I. 1.The concrete for the slab overlays was mixed in the same manner as the 1 ft x 1 ft (0.3 m x0.3 m) spe,cimens. However, only three cylinders were cast from each batch, forcompressive strength measurement. One cylinder from each batch was tested at seven days,and the remaining pairs were tested at 28 days. Two beams 15 3/4 in x 3 in x 4 in (40 era x7.6 cm x 10 era), were cast from each mix design for rapid freeze-thaw testing.
The plastic overlay concrete was consolidated with a vibratory probe. The surface wasscreeded with a vibratory screed prior to finishing. After finishing, the slabs were coveredwith moist burlap and polyethylene sheeting and allowed to cure for three days. The forrrtswere removed _Lfterseven days and the sides of the slab were coated with epoxy. Thelocation of the top layer of reinforcement steel was marked on the surface with a permanentmarker. The end of a transverse bar was tapped for a lead wire for each slab. While storedin the laboratory., the surfaces were moistened and covered with plastic sheeting.
Concrete Resistance to Rapid Freeze-Thaw Cycles
The concrete beams cast with the slab overlays were tested in accordance with ASTM C-666-84 Procedure A, "Resistance of Concrete to Rapid Freezing and Thawing." The durabilitl/
102
factor for the concrete was determined by measuring the reduction in the fundamentaltransverse resonant frequency. The resonant frequency was measured using Grindo-SonicMK4x Instrument.
Results and Discussion
Pre-treatment Corrosion Current Density Measurements
A specimen identification code was developed for the 1 ft x 1 ft (0.3 m x 0.3 m) specimensbased on specimen configuration, initial corrosion activity, and applied treatment. Forexample,
Code: 1H-D 1-DCI
1H --- A specimen containing 1 triad of reinforcing steel, with a high potentialcorrosion current density according to Table 6.1.
D1 --, Specimen was dried to 180°F (82°C) at a depth of ½ in (13 mm) below thereinforcing steel, and ponded with corrosion inhibitor for 1 day.
DCI --- Corrosion inhibitor applied to specimen according to Table 6.2.
The only exceptions to this system were the control overlay specimens presented in Table 6.5where
2M --, Two in (5.08 cm) cover depth medium initial corrosion rate
2L --, Two in (5.08 cm) cover depth low initial corrosion rate
Prior to treatment, the specimens were grouped according to their initial corrosion currentdensities to compare inhibitor effectiveness. The groups were categorized as low, medium,and high according to time to expected damage presented in Table 6.1. In addition, amedium-low category was added for specimens in which the i_o,_values fell in the low end ofthe 1-10 mA/ft 2 (10.76 - 107.6 mA/m 2) range, which is the medium category.
The specimen codes will be used to identify treatments throughout this part of the report.
The pre-treatment ico,_and Eoo, values, and CI concentrations at the bar level for thespecimens immediately prior to treatment are presented in Table 6.6. The CI content as afunction of depth is presented in Appendix C, Table C-14. Since the CI ion concentrationrepresents somewhat of a potential rate for the corrosion reaction, an effort was made todetermine if a correlation exists.
103
Table 6.5 Control Overlay Specimen Identification Codes.
Specimen Treatment
2M-LMC 1 in LMC Overlay with CI" contaminated cover
concrete left in place
2L-BC 2th in Bituminous Concrete Overlay with a
preformed membrane; CI" contaminated coverconcrete left in place
2L-TP Thin Polymer Overlay, CI contaminated coverconcrete left in place
2M-CON Untreated Control
104
Table 6.6 Average pre-treatment corrosion current density, potential, and chloride
ion content at the reinforcing steel level for all treated specimens.
Specimens i_ E_o_(CSE) CI"Ion
(mA/ft 2) (-mV) (lbs/yd 3)
1H-D 1-DCI 9.78 476 28.8
1H-D 1-SB 12.84 445 26.1
1H-D1-AX 37.48 491 27.3
1H-D 1-COR 9.93 489 23.8
1H-D1-LMC 9.72 473 24.7
2ML-1-DCI 1.91 246 2.0
2ML-1-SB 2.34 298 1.6
2ML-1-AX 1.50 303 2.3
2ML-1-COR 1.21 200 1.6
2ML-2-D CI 2.04 294 1.8
2ML-2-SB 0.93 258 1.5
2ML-2-AX 2.53 376 2.0
2ML-2-COR 1.20 213 1.2
2ML-O-LMC 1.31 310 2.3
2M-LMC 2.95 390 2.6
2L-BC 1.63 280 1.4
2L-TP 0.94 261 1.8
Continued.
105
Table 6.6 Average pre-treatment corrosion current density, potential, and chlorideion content at the reinforcing steel level for all treated specimens(Continued).
Using the t21-content as the predictor variable for i_,,,, the calculated R2 was 59.1% (r =76.9%) including the data representing specimen 1H-D1-AX which had a microcrack in tlaeconcrete above the rebar. The influence of 1H-D 1-AX was very significant as thestandardized residual was 5.64. Another model was developed without specimen 1H-D1-AX.The R2 value fiar the model was 90.2% (r = 95.0%), indicating a good correlation betweenic_,,and el corttent in lbs/yd 3 as shown in Fig. 6.3. The estimate standard error of themodel is 1.099 and number of samples is 35. The regression equation is:
106
i_,,, = 0.422 + 0.385 (CI- Content) (6-3)
This model was developed for specimens with known polarization areas and which wereexposed to a relatively constant relative humidity and temperature.
Evaluation of Corrosion Inhibitors
Some of the initial Eoo, readings fell in the range of -200 to -350 mV of the CSE, all of thespecimens' ico_measurements were identified as actively corroding at the time of treatment.The CI ion content was greater than the threshold value, with the exception of specimen 1L-D1-SB, which substantiated the ioo,_measurements.
All specimen groups were treated in three sets over a five month period. By treating thespecimen groups in phases, data from a previous set could be used to determine the bestmethod of application for successive sets. The first set included four groups:
1) Control overlay specimens
2) One-triad, high initial corrosion current density specimens which were dried to180°F, (82°C), at a depth of 1/2in (13 mm) below the bar level, and pondedfor one day (1H-1D-***).
3) Two-triad, medium-low initial corrosion current density specimens which wereponded for one day (2ML-I-***).
4) Two-triad, medium-low initial corrosion current specimens which were pondedfor two days (2ML-2-***).
The effectiveness of an inhibitor treatment method was based primarily on the i_o_measurements obtained from the 3LP. Though the 3LP does not have a guard-ring electrodeto confine the area of polarization, the 1 ft x 1 ft (0.3 m x 0.3 m) specimens have a knownarea of corroding steel which is approximately equal to the 3LP's contact area. Eco_measurements 'were included for comparison. The average values of ico, and Eco_.for the twotop bars were considered in the case of the two-triad specimens.
Control Overlays
The post-treatment ioo.and E_o_values for the control overlays are presented in Figs. 6.4 and6.5, respectively. The control overlays represent typical treatment methods used in currentpractice. One specimen (2L-0-LMC) for which the cover concrete was removed prior tooverlay is included as a comparison.
Both of the 1 in (25 mm) LMC overlay (2M-LMC), where the chloride contaminatedconcrete was hfft in place, and the 2 in (51 mm) LMC overlay where the chloridecontaminated concrete was removed to the bar level, (2L-0-LMC), showed an increase in i_and Eco_ imtnediately after treatment. This is probably due to the increased moisture contentin the specimens resulting from the overlays. Measurements taken 63 days after treatmentindicate downward trends in the corrosion current densities.
The later decrease in ico, an E¢o, for 2L-0-LMC was probably caused by a combination of thespecimen's drying out, an increase in the pH around the bar resulting from the freshconcrete, and the migration of chlorides into the overlay which decreased their concentrationat the bar level. In the case of 2M-LMC, the initial decrease in i_,,,_and Eco, was probablydue to the spec:imen's drying out as a result of the decreased permeability of the overlay.
The preformed membrane installed with the hot-mix asphalt overlay (2L-BC) and the thinpolymer overlay (2L-TP) specimens were both impervious layers which prevented i_ orE¢o_measurements from being taken from the top surface. Therefore, the measurementswere taken from the bottom of the specimen with the resistor(s) between the upper and lowermats of steel disconnected immediately prior to the measurements. The time period betw,_endisconnecting the resistor and taking the measurement was probably too short for the testarea to reach a new equilibrium which would have excluded the portion of the i_o, related tomacro-cell corrosion.
Both 2L-BC and 2L-TP exhibited more than a 50% decrease in corrosion current densityafter treatment, though neither specimen dropped below 0.2 mA/ft 2 (1.08 mA/mZ), indical:ethat the corrosion had not ceased. The decrease is probably due to a lack of moistureresulting from the impervious overlays. The fluctuation in the E_o, measurements may be:due to the high resistance of the concrete resulting from the low moisture content.
108
High Initial icon, Dried Specimens
The post-treatment performance of the treated specimens is shown in Figs. 6.6 and 6.7. TheLMC control specimen (1H-D0-LMC) displayed a 60% reduction in corrosion currentdensity over a period of 202 days after treatment and remained almost constant at an averagei___of 4.1 mA/ft2 (43.9 mA/m_).
The specimens treated with Alox and Cortec showed dramatic decreases in corrosion currentdensity immediately after treatment. Since the corrosion current density of the controlspecimen did not decrease as rapidly, the decreases in the treated specimens may be assumedto be caused by the reaction of the corrosion inhibitors with the corrosion cells.
The high initial _ decrease of the Alox-treated specimen (1H-D1-AX) may be somewhatmisleading based on the previous discussion of its initial corrosion current density.However, even if the predicted value of io._, 10.93 mA/ftz (117.6 mA/m_), based on thespecimens' CI content is used (equation 6-4), the treatment still showed a significantdecrease.
More important, sufficient quantifies of the inhibitor seemed to have been absorbed into thespecimen, as a result of drying, to have formed a stable metal soap layer on the rebar. Thislayer reduced metal dissolution so that the average _ values from 56 to 326 days aftertreatment was 1.8 mA/ft2 (19.4 mA/m2), see Fig. 6.6. This represents an 80% decrease incorrosion current density. However, it is also possible that the inhibitor seeped into a micro-.crack surrounding the rebar, allowing greater quantities of the inhibitor to react with therebar than is normally possible.
Corrosion activity in specimen (1H-D1-COR), which was treated with Cortee, ceased, asindicated by its corrosion current density, (0.20 mA/ft_ [2.15 mA/m2]), for the periodbetween 56 and 229 days after treatment. The initial application of Cortec 1337 wasapparently sufficient to form a monolayer over the majority of the corrosion sites to stopcorrosion. After 229 days, it appears that the gaseous diffusion of the inhibitor from theoverlay was not sufficient to maintain a complete monolayer and the ic,_values increasedslightly.
The specimens treated with DCI and sodium borate (1H-D1-DCI and 1H-D1-SB,respectively) showed increases in corrosion current density immediately after treatment.Though 1H-D1-SB demonstrated a decreasing trend after the initial increase, only 1 valueobtained 153 days after treatment, was lower than the initial i_o,. However, the datacollected by Webster et al. (44) in a preliminary study suggested that the effectiveness ofsodium borate is pH dependent. The pH of chloride-contaminated corrosion products mightnot be sufficiently high for the sodium borate to act as an effective inhibitor.
109
110
1.11
112
113
The specimen treated with DCI (1H-D1-DCI) showed a relatively consistent decrease in i_,_after its initial increase until 159 days after treatment; at that point it appeared to bestabilizing around 6.8 mA/ft 2 (73.2 mA/m2). The E_o,,measurements showed a fairlyconsistent increase until 262 days after treatment, after which they became more negative.
Overall, DCI did not perform as well as the control specimen. The ineffectiveness of DC[may be due to 'the short ponding period or the low concentration of calcium nitrite used ferponding.
An effort was made to estimate the CI/NO2 ratio at the bar level for specimens treated wi:hDCI. The CI content was 28.8 lbs/yd 3 (17.3 kg/m 3) immediately prior to treatment. Aspresented in the previous section, mortar cubes dried to 175°F (79.4°C) had a 9.7% byvolume absorption of monomer. From this absorption percentage it was estimated that thenitrite content at the bar level was 1.9 lbs/yd 3 (1.1 kg/m3), resulting from the application of a0.1 M calcium nitrite solution as presented in Equation 6.5.
Nitrite (NO2) content = A v x U_ x Ico_ x 91.___99 (6.4)132
where,
Av -'-- Percent absorption of the concrete by volume expressed as a decim_.
Uwi := Unit weight of the inhibitor, 8.5 lbs/gal (1030 kg/m3).
It,,, = Inhibitor concentration percent by weight, expressed as a decimal, 0 1M = 1.32% calcium nitrite.
91.9/132 = Molecular ratio of nitrite to calcium nitrite.
Research conducted by Berke and Rosenberg (41) concluded that for inhibition to occur, taechloride:nitrite ratio must be less than 2. For the DCI-treated specimen, the estimatedchloride nitrite ratio was 15.
Medium-Low Initial i¢o_, 1 day Ponding
The io_ an Eo,,_.measurements for the specimens with medium-low initial corrosion currentdensities were la'eated with a 1 day ponding application and inhibitor-modified overlay areshown in Figs. 6.8 and 6.9, respectively. Though the initial corrosion current densities weresomewhat divergent, the group displays similar trends to the previous group. Although all ofthe treatments demonstrated a reduction in ico,, the specimen treated with Alox (2ML-1-AX)showed the most significant improvement.
114
11_
116
The mean ic,,_for the Alox treatment was 0.097 mA/ft 2 (0.10 #A/cm 2) from 89 days aftertreatment till the end of the study. The corresponding E_o=approached 200 inV. Thesemeasurements indicate the cessation of corrosion activity in the specimen. The improvedperformance of Alox in relation to the other inhibitors may be due to its carrier solvent,alcohol. The alcohol may displace some of the capillary water allowing more of the inhibitorrobe absorbed. This effect would not have been noticeable in the dried specimens.
The specimens treated with Cortec (2ML-1-COR), DCI (2ML-1-DCI), and the LMC control(2ML-0-LMC) performed almost identically. The specimen treated with DCI had the bestnumeric improvement, stabilizing at approximately 1 mA/_ (1.08 9Alto 2) below itspretreatment corrosion current. The improved performance of DCI is probably related to therelatively low initial chloride content, 2.0 Ibs/yd 3 (1.2 kg/m3), which required a lowerconcentration of calcium nitrite to compete with the CI" ions for the Fe + �ionsin order toform a protective layer. Additionally, the initial drop in _ suggested an inhibitive actionsince the specimen did not demonstrate the same initial increase as the control.
The chloride:nitrite ratio for DCI treated specimens was estimated in an effort to confirm thistheory. Concrete will lose 1/2% to 3 % by weight of evaporable water if it is maintained at arelative humidity of 50% (45). Using a 3% water loss in air drying, and assuming re-saturation of the exposed concrete at the bar level with a 0.1 M calcium nitrite solution, anitrite concentration of 1.1 lbs/yd 3 (0.66 kg/m 3) can be estimated using Equation 6.6:
Nitrite (NO_) Contem = A w x Wc x I_on x 91.9 (6-5)132
where,
A,, = Percent absorption of the concrete by weight expressed as a decimal.
Wc = Unit weight of the concrete, 145 lbs/ft 3 (2349 kg/m3).
I_,,, = Inhibitor concentration percent by weight, expressed as a decimal, 0.1M = 1.32% calcium nitrite.
91.9/132 = Molecular ratio of nitrite to calcium nitrite.
The corresponding chloride:nitrite ratio based on this estimation is 1.8 This indicatessufficient nitrite content to control corrosion (41).
The Cortec treatment performed well. However, both the corrosion current density andpotential showed an upward trend toward the end of the monitoring period.
The sodium borate treatment also seems somewhat effective in this case. The specimen
117
stabilized at 1.57 mA/ft 2 (1.69 #A/cm2), an improvement of 0.77 mA/ft 2 (0.83/zA/cm 2) overits pre-treatment corrosion current density. However, this reduction was not sufficient tomove it into the next lowest category for time to expected damage.
Medium-Low Initial icon, 2-Day Ponding
The progression of post-treatment icon.and Eoo, group of measurements for the medium-lowinitial i¢_ two-day inhibitor ponding group is presented in Figs. 6.10 and 6.11, respectively.A comparison of the overall performance of this group with the previous group, which wasponded for only one-day, indicates no significant reduction in corrosion current density.Since neither set of specimens was dried, the capillaries were probably filled with water,allowing a finite amount of absorption independent of the ponding time. Based on theseobservations, additional treatments utilizing a two-day ponding period were terminated.
The specimen treated with Alox displayed the greatest decrease in corrosion current densityuntil 159 days after treatment, when it experienced an abrupt increase in ioo,_and Eo°,_. Theincrease is probably due to a failure of some portion of the metal soap layer.
It was suspected that since the remainder of the rebar was largely passive, the area where thefailure occurred experienced accelerated corrosion as a result of the high anode-to-cathodratio. However, sufficient quantities of the inhibitor were apparently present to allow apartial healing of the layer. Overall, this may be an example of the reaction caused by adangerous inhibitor.
The specimen treated with sodium borate also displayed a performance unlike the previousgroup. In this case, the inhibitor seems to have been completely ineffective. The final i_value was 73 % higher than the pre-treatment value, even though the CI ion content waslower than that in the previous group.
In all 3 treatment groups examined thus far, the control overlay has had the most noble f.nalEc°_ measurement. This may be due to the fact that the inhibitors block the corrosionprocess, while in the case of the control the reduction in corrosion current density was mostlikely due to a decrease in the CI ion concentration.
Medium Initial ico,,, 1-Day Ponding
The post-treatment io,,_and Eoo, for the specimens with medium initial ico_values which wereexposed to surface applied inhibitors for one-day are presented in Figs. 6.12 and 6.13,respectively. These specimens were included in the second treatment set.
An untreated control specimen (1M-CON) with the chloride-contaminated cover concrete leftin place was included in this group of specimens. The decrease in its corrosion currentdensity in the first 50 days after treatment of the other specimens is due to the temporaryremoval of the: specimen from the 6% NaC1 ponding cycle which allowed the specimen to
118
119
120
121
122
dry out. The specimen was used to demonstrate corrosion current density measurementdevices at an AASHTO convention during that period. A crack was produced in thespecimen from the expanding corrosion products 99 days after the treatment of the otherspecimens. A corrosion current density of 15.0 mA/ft 2 (16.2/_A/cm 2) was measured at thattime.
All specimens, for which the chloride-contaminated cover concrete was removed showedimprovement after treatment. The specimens treated with Alox and Cortec performed almostidentically, tending to fluctuate around a corrosion current of 2.0 mA/ft 2 (2.2/xA/cm 2) from59 days after treatment till the conclusion of the investigation. This represents approximatelya 60% reduction in ion. The LMC overlay, without any inhibitors, showed a 57% reductionin ico,_by the end of the monitoring period. The specimens treated with DCI and sodiumborate each improved by about 1 mA/ft 2 (1.08/zA/cm 2) after treatment. However thisimprovement was less than the controls. The Ec,,_ measurements for the DCI treatment didimprove, and were more noble than the LMC control.
Medium-Low Initial ico,, Dried Specimens
The post-treatment progression of i_o, and Eco, values for the group of specimens withmedium-low initial corrosion current densities which were dried to 180°F (82°C) at a depthof 1/2in (13 mm) below the bar level are shown in Figs. 6.14 and 6.15, respectively. Thereduction in i_ estimates shown for all specimens except 1ML-D1-AX prior to 196 daysafter treatment are inaccurate. The resistors connecting the upper and lower mats orreinforcing steel on those specimens were discontinuous. The resistors were replacedbetween 163 and 196 days after treatment and all other specimens were checked for a similarproblem. The rise in i_,,_and E_,,_seen in those specimens 196 days after treatment clearlydemonstrates the effect of an increase in anode-to-cathodic ratio. Overall, Alox was the bestperforming inhibitor in this group.
Low Initial icon, Dried Specimens
ico, and E_o, measurements for the dried specimens with low initial corrosion currentdensities are presented in Figs. 6.16 and 6.17, respectively. The highest pre-treatment ioo,_for this group of specimens was 0.42 mA/ft_ (0.45 tzA/cm 2) and the highest E_o. was -275mV. Effectively, these specimens were barely corroding prior to treatment. Consideringthose observations, it was not surprising that the corrosion current density in the majority ofthe specimens increased after treatment.
One exception to this trend was the specimen treated with DCI (ll-D1-DCI). In this case, itacted to repress the initiation of corrosion. This explains the reported effectiveness ofcalcium nitrite as a corrosion inhibitor when included in the concrete during initialconstruction. Treatments utilizing DCI seem to be effective on areas with low initialcorrosion currents and may be effective at higher rates if a sufficient concentration of theinhibitor can be introduced to the corroding area. The concentration used for surface
123
_ _' .,.. ,.. &
_,+ + +,,+, ._
-ie
• ,_ _ .
+, -+ +
_._______ ___
: _
O
• _ ,_"J+3"bs/vw _ooI
124
125
eq .-_
-_
e-
--E _
o _m _
e_
"Izl "bs/vw _ooI
126
127
application on the small scale specimens was 0.1 M as recommended in research perforrr,edby Dressman et al. (46). As reported earlier in this report, the concentration used in asimilar study on U. S. 460 in Virginia was 15% solids by weight which is 11.4 timesstronger than 0.1 M.
Tlae chloride content prior to treatment, the estimated nitrite content at the bar level, thechloride:nitrite ration, and the performance relative to the control are presented in Table 6.7for each specimen treated with DCI. An examination of the specimens with chloride:niu_teratios less than 2, reveals that all of these specimens performed better than the LMC eortrol.This supports the theory that DCI would be effective if sufficient concentrations of nitritecould be introduced into the treated area. The application of a 15% calcium nitrite solutionto a non-dried treatment area should provide sufficient nitrite to control corrosion up to It CI"concentration of 24.9 lbs/yd3 (14.9 kg/m3) as calculated by Equation 6.6.
Table 6.7 Chloride:Nitrite Ratios for Specimens Treated with DCI.
SinceAloxis a hydrocarbon,it cannotbe includedas an admixturein a concretemix.Therefore, only the initial concentration of Alox absorbed by the specimen during pondingwill be available to form a protective layer on the reinforcing steel which makes the long-term effectiveness of the treatment questionable. For this reason, three additional specimenswere treated;;their post-treatment i=o,_and E°_ measurements are presented in Figs. 6.18 and6.19.
All three specimens were ponded with Alox; one was overlayed with LMC, one with aCo/'tec-modified concrete, and one with DCI-modified concrete. Sodium borate wasexcluded since previous sets showed it to be an ineffective corrosion inhibitor for theapplication investigated at this point.
128
Specimen 1H-1AX-LMC displayed an 84 % reduction in ico_during the monitoring period.Unfortunately, the initial corrosion current densities on the remaining two specimens weretoo low to show any meaningful change during the monitoring period.
Summary of Inhibitor Treatment Performance
In this section the most successful inhibitors in abating corrosion chemically were identifiedas well as the most effective method for their application.
Two inhibitors, Alox and Cortec, demonstrated their ability to reduce corrosion, regardlessof the pre-treatment i_o. values. Alox seemed to perform better than Cortec if the specimenswere not dried prior to ponding, probably because the ethyl alcohol used as a solventdisplaced some of the capillary water and allowed more of the inhibitor to be absorbed.
The LMC controls demonstrated the next best overall performance. Removing the chloride-contaminated concrete above the rebar reduced the driving potential for the corrosionreaction. In addition, the fresh concrete helped to reestablish the high pH normally found inuncontaminated concrete.
DCI proved to be an effective treatment when applied to specimens with low initial corrosioncurrents. Its lack of performance at higher ico. densities may be concentration-dependent.
Although some specimens treated with sodium borate showed improvement, the inhibitor didnot perform as well as the LMC controls.
No increased inhibitive effect could be discerned for non-dried specimens with similar i_o_.values ponded for two days as compared to specimens ponder for only one day. Theeffectiveness of drying appears to be dependent on the type of inhibitor used and is discussedlater in the report.
In order to better evaluate the performance of the inhibitors, an effort was made to separatethe portion of reduction in i_o. due solely to the inhibitor from the improvement resultingfrom removing the chloride-contaminated concrete.
Due to the variation in initial corrosion current densities, Equation 6-1 was used to calculatethe percent change in i_°. for the controls. Equation 6-7 was developed to determine thepercent change of a treatment resulting from the application of the inhibitor.
(%Changed.caveat - %Change co_ol)%Changei,aa, = 100 x (6-6)
%Change_o,_ol
129
iz_-z_._iI, Q
=e_
Q NO
• "0 _
• • -_-'j 0
_ ""1
• I_ O
E _+I -_ _ =
L_ 0
0a._ --,-I-II o,--
-O<E _--- _
_= ._
o_
.._
|
130 _ Q_ _ _t" I'_ _ _ _ i
"_.A"bs/v_ JJOOl
130
131
The reduction in io_ was found to be highly variable and dependent on the initial corrosion1current density as shown in Figs. 6.20 and 6.21. Specimens with medium initial ioo, valuesshowed the greatest initial reduction. Specimens with high initial corrosion current densitiesshowed a time dependent reduction. Therefore, corrections based on the percent change c,fthe controls could lead to large errors in the estimation of the inhibitor performance unles:;their initial ic,,_values were very close.
The relationship between CI concentration and ic_ represents an alternative method toestimate inhibitor effectiveness. Chloride samples were taken from 1H-D0-LMC and 1ML-0-LMC to determine the chloride content at the bar level. A comparison was made betweenthe measured and predicted ioo,,values based on the CI contents. For specimen 2L-0-LMC,the measured i_ was 1.02 mA/ft 2 (1.10 t_A/cm2) and the predicted value was 0.92 mA/ft:'(10.7 #A/cm2). While for 1H-D0-LMC, the measured ioo, was 3.73 mA/ft = (4.02 #A/cm _)and the predicted value was 5.58 mA/ft 2 (6.02 _A/cm2). The CI contents for the specimensare shown in Appendix C, Table C-15. The predicted i_o, values are presented in Table _.8.
Table 6.8 Estimation of the reduction in i,_ resulting from the application ofcorrosion inhibitors.
l
Percent
Measured i,_ Predicted i,_ Difference Reduction z
Specimen (mA/ft 2) (mA/ft:) (mA/ft =) (Inhibitor)
1H-D 1-DCI 7.06 4.15 -2.91 -29.8 %
1H-D 1-SB 12.1 4.12 -8.07 -62.9 %
1H-D 1-AX 1.65 5.74 4.09 37.4 %2
1H-D1-COR 2.1 5.93 3.83 38.6 %/
Note: 1 mA/ft 2 = 10.8 _A/cm 2
Percent Reduction was calculated by dividing the difference between the predicted andmeasured i_,,_rates by the pre-treatment corrosion current density. A negative per:entreduction indicates that the reduction of i_,,_was less than what would be expectedfrom the removal of the chloride-contaminated concrete with no inhibitor applied.
2 The predicted initial ic,,_of 10.9 mA/ft 2 (11.8 _A/cm 2) was used to arrive at thispercentage. If the measured io_ of 37.4 mA/ft 2 (40.5/_A/cm 2) is used, the reduct2onis 10.9%. The change was made based on earlier observations of the specimens'measurext initial ion..
As shown in Table 6.8, both Alox and Cortec have a sufficient effect on corrosion currentdensity beyond that obtained from removing the chloride contaminated concrete only, andthus should be included in Phase III evaluation.
132
_0 I i I I I I I
_o- F_i",,\-¢0- _ "
c 20-
_J
o --_u-
_-60 -
--80 i i i i I I I
-50 0 50 100 150 200 250 300 350
Time After Treatment (Days)
Fig. 6.20 i=,.,, Percent Change for Non-Dried Specimens
133
100 l i i , l ' , ,
75-
50-
= 25-0t-
O O--LI_{C/ o ILM-DO-LMC
0 -u _ IL-DO-LMCL..
C_
L_
o -25 -..9.°
-50 -
-75 -
-100 t _ I 1 I I 1-50 0 .50 100 150 200 250 300 350
Time After Treatment (Days)
•Fig. 6.21 i_,, Percent Change for Dried Controls
134
Bond Strength Evaluation
The bond strength between the overlays and the substrate concrete was measured 160 daysafter the treatment of the first set of specimens. The cores were drilled at least 1l/z in (38ram) away from the reinforcing steel in order to minimize any disturbance of the corrosioncell. The bond strength was measured at a minimum of three locations on each specimen inaccordance with ACI-503-R (43). The results of these measurements are presented in Table6.9.
A bond strength of 250 lbs (1112 N) was considered the minimum bond strength needed toprevent the overlay from delaminating under freeze-thaw cycles and traffic loadings. Theaverage bond strengths for two of the Alox and Cortec treated specimens were below thislimit. No other treatments showed reduction in bond strength.
The grout appeared to have cured on the specimens treated with Alox, but an oily residuewas found between the cured grout and the base concrete. The grout on the specimenstreated with Cortec was both porous and powdery. It generally disintegrated under the waterpressure from the coring ring.
Three additional specimens were treated in an effort to improve the bond strength, two withCortex and one with Alox. The Alox specimen and a Cortec specimen were first pondedwith the inhibitor. After the excess inhibitor was removed, dry cement was dusted on thesurface to absorb any residue. The powdered cement was removed by wire brushing andcompressed air. The other Cortec specimen was dried under a heat lamp for 24 hours afterthe excess inhibitor was removed. The bond strength of these specimens was tested afterseven days of curing. An LMC control specimen was cast at the same time to determine theeffect of the decreased curing time. The bond strengths for those specimens with inhibitor-modified concrete are shown in Table 6.10. Though the specimen treated with Alox showedsome improvement, it was not considered sufficient for field use. The decreased curing timehad no significant effect on the LMC control.
A second attempt was made to improve the bond strength by sand-blasting the specimen priorto overlay. Both specimens ponded with Alox and Cortec were tested. In addition, aspecimen was overlaid with concrete containing 2 lbs/yd 3 (1.2 kg/m 3) of VCI 1609. Thisspecimen was not ponded. The bond strength for these specimens was measured after sevendays of curing.
The results of these tests are shown in Table 6.11. All specimens developed adequate bondstrength. Therefore, light sand-blasting was used to improve bond strength for futuretreatment using Alox or Cortec.
135
Table 6.9 Overlay Bond Strength for Inhibitor Modified Concrete
Treatment Specimen Average Bond Strength STD Bond Strength (lbs)(lbs)
Table 6.10 Overlay Bond Strength for Inhibitor Modified Concrete
Treatment Average Bond Strength STD Bond Strength(lbs) (lbs)
Alox 901 Surface Pond. Surface dusted with dry 67 31cement and wire brushed prior to overlay.
Cortec 1337 Surface Pond. Surface dusted with dry 0 0cement and wire brushed prior to overlay.
Cortec 1337 Surface Pond. Specimen dried under a 0 0heat lamp for 24 hours.
LMC Control 847 151
Note: 11b =4.448N
Table 6.11 Overlay Bond Strength For Inhibitor Modified Concrete
Treatment Core # Bond Strength (Ibs) Failure Plane
Alox 901 1 860 Base Concrete
Surface Pond, 2 640 50/50 Base Concrete/Bond
Sandblasted prior to 3 1240 50/50 Base Concrete/Bondoverlay AVG 913
STD 304
Cortec 1337 1 650 Grout Failure
Surface Pond, 2 1040 50/50 Base Concrete/Bond
Sandblasted prior to 3 860 50/50 Base Concrete/Bondoverlay AVG 850
STD 195
Cortec 1609 1 940 Base Concrete Failure
2 lbs/yd 3 2 740 Base Concrete Failure3 830 Base Concrete Failure
AVG 837STD 100
Note: 11b =4.448N
137
Freeze-Thaw Durability of Inhibitor-Modified Concrete
Beams were cast for rapid freeze-thaw testing from the same mixture proportions used foIthe large scale specimens. In addition, beams were cast from a normal concrete without anyinhibitors added, as a comparison. The mixture proportions, and properties of the fresh andhardened concrete are presented in Appendix C, Table C-12. The inhibitor-modified beamswere exposed to the number of cycles shown in Table 6.12. The mixture proportions aregiven in Appendix C, Tables C-9 through C-11. The flexural and longitudinal frequenciesare shown in Appendix C, Tables C-17 and C-18.
"['able 6.12 Durability Factors for Inhibitor Modified Concrete
I
Mix Design Initial Air Content Number of Cycles of Durability Factor _Exposure
DCI-M4 9.0% 492 13.3
DCI-M43 5.3 % 240 91.0
Cortec-M1 7.4% 315 100.0
Cortec-2-M 1 6.4 % 315 100.0
Cortec-M--4 6.5 % 315 100.0
Normal-M 1 6.8 % 265 100.0
LMC-M2 10.5% 215 100.01
The calculated durability factor is the average of 2 beams with the exception of thLMC beam.
2 Since the relative modules dropped below 50% after 49 cycles, the durability factorwas calculated at 49 cycles. Further exposure led to the disintegration of thespecimen.
3 Retest of DCI.
From this data the only inhibitor which appears to have a detrimental effect on the freeze-thaw durability of the concrete is DCI. However, the following observations should bementioned.
1) DCI has been used in the field for 26 years with no previous reports ofsignificant freeze-thaw deterioration.
138
2) The mix had not reached its initial set nine hours after the concrete was
placed. This was originally believed to be the result of using very cold mix-water, but later evidence indicates a cement problem.
3) Similar problems were noticed with other mixes made with the same cementand high-range water reducers.
4) This mix exhibited a percent decrease in 28-day strength compared to previousmixes.
The portland cement was replaced by another cement from a different manufacturer. Newbeams were cast from a DCI mixture prepared with the new cement. The beams had aninitial air content of 5.3%. The mixture proportions and properties of the fresh andhardened concrete are presented in Appendix C, Table C-13. After 240 FT cycles, theaverage durability factor for these beams was 91. The improved durability supports theprevious contention that the low durability factor was due to the portland cement.
Evaluation of Bridge Deck Specimens
The treatment of the bridge deck specimens was to provide an opportunity to test the fieldapplication methods prior to the field validation work. Since it would be difficult to pond theinhibitor on an entire deck, spray application techniques were developed. The specimenssprayed with Alox and Cortec were lightly sandblasted prior to overlay in order to improvebond strength. DCI was included in the bridge deck slab treatments at the manufacturer'srecommended concentration. To validate previous observations regarding the low calciumnitrite concentration.
A delamination survey indicated that the deck sections were sound. Two complete sets ofpotentials, icon, and chloride measurements were taken on the slabs prior to treatment. Priorto treatment, slab damage accrual at the time of the slabs' removal from the PA 1-80 deckprevented complete survey measurements. Potential measurements were taken on thetransverse rebar between the longitudinal bars. i_o, measurements were performed with both3LP and Gecor devices. The correlation between 3LP and Gecor i_o,_was poor, r = 7.7%.Theoretically, the guard-ring electrode on the Geocisa device should confine the area ofpolarization and provide a better estimate of the corrosion activity after treatment.
All three slabs were in the medium-low initial i_o, category prior to treatment. The meanico,, as measured by 3LP, was approximately 1 mA/ft 2 (1.08/zA/cm 2) higher on the slabtreated with DCI.
Because of the amount of time required to take i_o_.readings on the slabs using both 3LP andGecor devices, measurements were taken simultaneously on different slabs. Therefore,measurements were taken on the same date, and not the same number of days before or aftertreatment. For this reason only trends can be compared.
139
A comparison between the pre- and post-treatment potentials are presented in Table 6.13.The treatment demonstrated a reduced potential after treatment. The slabs treated with bothAlox and DCI show art increase in ioo, as measured by the 3LP after treatment. This ma_ bedue in part to the increasing moisture content of the treated slab caused by the overlayconcrete, which allowed a greater area of polarization and/or decreased the concrete'sresistance at the rebar level and thus increased the corrosion current density. Another
possible explanation could have been that the slabs dried out while being stored indoors, _ndwhen the overlays were placed, the added moisture reactivated the corrosion cell. However,since the slabs were covered with saturated burlap and polyethylene sheeting for almost amonth prior to the second set of pre-treatment readings, the second explanation was notvalid. The second set of readings on the Alox slab demonstrated a decreasing trend in 3I_Pico,. However, the mean value was still greater than the pre-treatment values.
Table 6.13 Pre- and Post-Treatment Mean Potentials and Mean icorr Values for theInhibitor Modified Slabs
1
Treat- Pre-Treatment Post Treatmentmerit
Time AVG AVG AVG Time AVG AVG AVGAfter Poten 3LP Geosica After Poten 3LP Geoci_a
The slab treated with Alox demonstrated a 21% decrease in i,o,, (Gecor); this decrease m_.ybe a more accurate indication of the trend in corrosion activity than the increase in 3LPmeasurements. Cortec was shown to be very effective, with a 77% decrease in _ from themean pre-treatment readings (Gecor). This reduction corresponds to the trend indicated byboth the CSE potential and the 3LP ioor_measurements, which showed a 17% decrease in i,._after treatment.
The deck section treated with DCI showed a 96% increase in i_o_,(Gecor) between its highest
pre-treatment average, and the mean of its post-treatment average. This indicates an increasein corrosion activity after treatment even though the slab was sprayed with themanufacturer's recommended concentration of DCI. Though this research indicates DCI maynot be successful at corrosion abatement, long term data is needed to draw a firm conclm;ion.
140
Additional monitoring to assess the effectiveness of the corrosion treatments for the slabs isrequired.
Three cores were drilled into each of the treated slabs after 28 of days curing. The averagebond strengths measured for those cores are as follows: Alox 901,217 lbs (960 N); Cortec1337/1609, 400 lbs (1780 N); and DCI, 680 lbs (3020 N). The average bond strength forthe slab treated with Alox 901 was below the acceptable limit of 250 lbs (1112 N). Previousdata had shown that a good bond could be obtained with sand blasting.
Prediction of Service Life
An estimate of the increase in treatment service life was calculated based on the reduction in
corrosion current density of the blocks. The estimate cannot predict the actual time ofinhibition provided by the inhibitors, nor does it include the possibility of premature failuredue to debonding. However, it helps maintenance engineers in assessing the treatment costeffectiveness.
The following assumptions were made to develop the prediction model:
1. The service life of a typical LMC overlay is 20 years (10).
2. At the time of a typical LMC deck overlay placement, 40 % of the bridge deckis delaminated or spalled. The chloride-contaminated concrete would beremoved in these areas. Therefore, the average reduction of the non-driedLMC control specimens was used to represent the area of a bridge deck wherethe chloride-contaminated concrete was removed. The average ico, reductionfor the controls is weighted by a factor of 0.4 since it represents only 40% ofthe components area in a typical rehabilitation process.
3. The reduction in corrosion current seen in specimen 2M-LMC was used tomodel the other 60 % of a typical LMC deck overlay where the chloride-contaminated cover concrete is left in place. The reduction in i_,,_wasweighted by a factor of 0.6.
4. The corrosion current densities on the deck at the time of rehabilitation are
assumed to be equally represented by the specimens with low, medium-low,medium, and high initial corrosion current densities such that the averagereduction seen in the blocks could be used, with one exception. The resultsfrom the low initial i_o, dried specimens were not included.
Cortec 1337/1609, Dried and 1 Day Ponding 34 years
i The predicted initial i_o,,of 10.93 was used to calculate the percent reduction, not themeasured value of 37.48.
From this estimation, Alox provides a 100% increase in service life. It should also be nctedthat drying provides no increase in estimated service life for the Alox treatments. Howe,er,concrete would need to be dried prior to the application of Cortec in order to gain asignificant benefit.
DCI treatment service life estimates could not be calculated using Equation 6-8, since only 1of the blocks in the non-dried one day pond group and one specimen in the dried group hadchloride nitrite:ratios less than two, as discussed earlier.
Conclusions and Recommendations
The following conclusions can be made, based on the results of the preceding research:
1. The removal of chloride-contaminated concrete above reinforcing steel and its
142
subsequent replacement with fresh concrete is an effective means of reducingcorrosion.
2. The removal of the cover concrete facilitates the direct application of corrosioninhibitors.
3. Alox 901 is a very effective surface-applied corrosion inhibitor and potentially capableof doubling the service life of an overlay.
4. Cortec 1307 and Cortec 1609 are effective inhibitors when applied as ponding agentsand concrete admixtures, respectively.
5. Alox 901 and Cortec 1337 have a detrimental effect on bond strength. This problemcan be mitigated with sand-blasting.
6. DCI (calcium nitrite) is somewhat effective at reducing low corrosion currents whenapplied at the. 1M concentration.
7. Cortec 1609 has no adverse effects on the freeze-thaw durability of concrete.
8. A correlation can be derived between the chloride content at the bar level and the
corrosion current density of the reinforcing steel for laboratory conditions wheremoisture content and temperature are relatively constant.
9. Ponding corrosion inhibitors for two days has no significantly different effect thandoes pondings for one day.
Based on the limited time and scope of this study, the following recommendations can bemade for further research:
1. Long-term monitoring to determine the period of inhibition needs to be investigated,in order to more accurately predict the service life of inhibitor treatments.
2. The chloride threshold for the initiation of corrosion after treatment should bedetermined in order to understand the effectiveness of inhibitors.
3. Further research should be conducted towards the improvement of overlay bondstrength.
4. A better corrosion current measurement device which utilizes a guard-ring electrodeshould be developed.
143
.
Laboratory Evaluation of Asphalt Portland CementConcrete Composite
Introduction
Presently, many bridge deck overlay materials are used in bridge deck repair. However,many of these overlay materials in addition to their high costs, are rigid and lack flexibility.
A material new to the United States, Asphalt Portland Cement Concrete Composite(APCCC), which is a combination of hot-mix asphalt (HMA) and modified portland cementgrout, showed some promise when used in the field (47). APCCC has been extensively usedin Europe as an overlay in airports where heavy loads and oil spillage occur. Recently, theArmy Corps of Engineers applied this technique as airport pavement overlay (47). It isreported that this material provides greater resistance to wear and abrasive forces and also tooil spillage. However, the durability performance of the material relative to United Statesenvironments has not been evaluated.
In this research, an effort has been made to evaluate this material, which is a combination ofHMA and portland cement concrete (APCCC) to utilize the unique properties of bothmaterials. Thus, this material possesses both flexible and rigid characteristics. It is neitheras rigid as portland cement concrete nor as flexible as HMA. A proposed use of the materialis the rehabilitation of bridge decks with HMA preformed membrane protection systems.Because of its expected higher resistance to chloride ions, it may not be necessary to removethe existing membrane. The present HMA overlay would be milled off and replaced withAPCCC and possibly result in significant cost savings.
Background
Asl_halt Portland Cement Concrete Composiie (APCCC), or the Salviacim process as it isknown in Europe, was developed in France by the Jean Lefebvre Group as a cost-effectivealternative to portland cement concrete and hot-mix asphalt to withstand fuel spillage and
145
abrasive forces. APCCC can be best described as semi-flexible or semi-rigid material which
possesses the fuel, abrasion, and wear resistance characteristics of portland cement conc::eteand the flexible characteristics of hot-mix asphalt. It is an open graded HMA with an a::rvoid content of 25 to 30% that is later filled with resin modified cement grout. Thematerials and mixture proportion requirements are modified to produce a suitable air vo!dcontent in the hot-mix asphalt and the grout mixture design is modified to ensure fullpenetration through the hot-mix asphalt.
HMA is designed to act as a support layer and is used to determine the thickness of theAPCCC. The placement of HMA in the field does not require any special skilled labor;however toual quality control is required throughout. The open graded HMA is placed '_,ithconventional asphalt paving equipment. It is not compacted but only smoothed with a 2-tonroller. The asphalt content generally ranges between 3.5 and 4.5 %.
The grout consists of cement, fly ash, sand, water and resin additive. Resin additive,Prosalvia (PL7), is a cross polymer resin of styrene-butadiene. It acts as a water-reducingagent. The grout is designed to ensure full penetration through voids. Water to cement ratiois between 0.65 and 0.70. The grout can be mixed in a conventional concrete batch phmt orin a small portable mixer. The grout is placed after the hot-mix asphalt is cooled. It shouldbe poured immediately after mixing in order to avoid segregation of material. A 3-tonvibratory roller is usually used to assure the penetration of the grout through the voids.
In the 1970's, the U.S. Army Corps of Engineers at Waterways Experiment Station (X,X/ES)•evaluated this material. The results were not favorable, due to lack of technical guidance.They achieved an air void content of only 15 to 20% and had thick grout which resulted ininsufficient penetration; as a result, tests failed. In 1987, they re-evaluated this materi_.lbecause it was yielding very good results in European countries. The evaluation includedsite observations in France, Great Britain and Australia. The research at WES was aimed atevaluating tlhe effectiveness of the material for abrasion and oil spillage resistance (47).Some pilot projects have been completed since 1987.
To evaluate APCCC as a potential pavement material, the U.S. Army Corps of Enginezrs atWES constructed test strips of 150 x 150 ft (48 x 48 m) and evaluated them for abrasiveresistance. Track vehicle maneuvers were conducted and an Accelerated Loading Facility(ALF) was used to evaluated the APCCC under heavy rubber tired traffic.
For rubber abrasive resistance evaluation, loading included M1 and M60 tanks with grossweights of 113,000 lb (51,000 kg) and 100,000 Ib (45,000 kg), respectively; 600 180" pivotsteer turns :and 5000 straight passes were applied with tracked vehicles to test the strip.After 420 turns at the same location, the vehicle produced sufficient rough abrasion and high-stress that ravelling occurred. After 600 pivot steer turns, the turning traffic was stoppedbecause the abrasion action produced a ravelled area 1-in deep covering 35 ftz (3.3 m2_. The5000 straight passes produced only surface wearing.
146
Five different oils and fuels, namely, jet aviation fuel, gasoline, diesel, synthetic oil, andhydraulic oil were used to evaluate the fuel resistance of APCCC. Spillage area was 8 x 10ft (2.4 x 3.0 m) and materials were spilled from a height of 30 in (76 cm) at a rate of onequart per 20-30 minutes. The fuels and oils were allowed to remain for 30 days after 30cycles of spillage before evaluation.
Visual observations showed no significant damage, but field cores showed penetration offuels and oils into APCCC causing various levels of deterioration. Diesel fuel penetrated 1in (25 mm) and caused the most damage; other fuels and oils penetrated less than 1/2 in (13mm). This test is more severe than observed in the field as real field spills are clearedregularly and are not allowed to soak for several months.
FHWA's Accelerated Loading Facility (ALF) was used to traffic an APCCC test strip of 48ft (14.6 m). ALF-simulated truck traffic used a load of 19,000 lbs (8,600 kg) to a dualwheel assembly with tire pressures 140 psi (965 kPa) and applied 80,000 passes. Noappreciable damage except slight wearing of excess grout was observed in the wheel path,which indicated that vehicular traffic had no significant effect on APCCC and suggested thatAPCCC should have good field performance.
APCCC pilot projects have been constructed since the late 1980s, including 10,000 yd2(8,000 m2) as a taxiway at John Wayne Airport in late 1990. APCCC performed well whentested after a year. At Miami International Airport, APCCC also performed well except forsome hairline shrinkage cracks due to improper application of the grout. A 2600 yd2 (2174m2) pilot project was constructed at the Tampa International Airport. Some excess grout wasnoticed along the outside areas and some hairline shrinkage cracks in the center. Otherwise,the overall appearance was excellent.
The performance of APCCC in Europe has been evaluated over a longer period of time. AtMerignac Airport in Bordeaux, France, APCCC was rated good-to-exceUent after 12 years ofservice. Although random cracks were observed, APCCC withstood fuel spillage andloading without showing any rutting. APCCC was used also as an overlay on portlandcement concrete pavement in the same airport and was able to control reflection cracks. Ingeneral, APCCC performed better than an adjacent HMA section.
Other sites in France and England have been evaluated in the past decade. The sitesincluded helicopter fields, airports, and tank facilities. No appreciable damage was foundafter almost 10 years of service.
Scope and Objective
To reduce the chloride intrusion into bridge decks, new materials other than portland cementconcrete have been considered in the past two decades as bridge deck overlays. With theavailability of various alternative materials, the selection has become a complicatedprocedure. It is necessary to assess not only the initial cost, but also future maintenance
147
costs. Existing bridge deck overlays, except HMA, possess high strength but are rigid andcostly.
The excellent performance of APCCC in Europe for the last 30 years and the successfulcompletion of pilot projects and airport pavements by USACE at WES and their reasonab.ygood performance promoted more thorough evaluation of this material under laboratoryconditions so t!hat it may be considered as a bridge deck overlay material.
The research reported here has evaluated the mechanical properties of APCCC and itsdurability ch_acteristics. The research involved development of mix designs for HMA a:adfor the resin modified cement grout. The specimens cast from this design were thenevaluated for raechanical and durability characteristics. As this material had a cementcomponent, the tests were conducted after various curing periods. The research involvedtwo phases: Phase I involved the design of the two components of APCCC, namely HMA atthe required air void content and resin modified cement slurry grout which can penetrate :heHMA. Phase II involved the evaluation of APCCC for mechanical characteristics: stabili:yand flow, compressive strength, indirect tensile strength and resilient modulus; and durabilitycharacteristics: stripping, freezing-thawing, and chloride intrusion.
Research Approach
In order to ewduate the performance of this material, a valid HMA was designed. Anoptimum mix yeas chosen with an air void content in the range of 25 to 30 %. The resinmodified cement grout was also investigated to obtain the required viscosity which wouldallow the grout to penetrate through the HMA.
A preliminary study was conducted using the Marshall method to develop a HMA specimenwhich had the required air void content. Different compactive efforts and different asphaltcontents were used. A mix design was chosen based on optimum unit weight, optimum _.irvoid content, _ad optimum voids in mineral aggregate. Resin modified grout was designexlsuch that it would penetrate through the HMA specimen under low vibration.
In order to ev_duate the performance of APCCC, tests were conducted for different moist andair curing periods and after different weathering conditions. All tests were performed atlaboratory temperature. Specimens were tested for three curing conditions namely no mcistcuring, one day moist curing, and three day moist curing. Stability testing was conducte_t at1, 3, 7, 21, and 28 days for all three curing conditions. Compressive strength, indirecttensile, and resilient modulus tests were performed at 1, 3, 7 and 28 days for all moistcuring conditions. Effects of weathering on APCCC were tested at 3, 7 and 28 days bysubjecting specimens to rapid freezing and thawing and water sensitivity tests at the end ofthe curing period. The weathering effects were evaluated by means of determining indir_x:ttensile strength and resilient modulus before and after conditioning. The ratio of strengthvalues obtained before and after conditioning should be no less than 0.75. Chloride intrusionspecimens were subjected to 7, 11, and 15 wet/dry ponding cycles of 3 % NaCI solution. A
148
wet/dry ponding cycle is seven days, four days of air drying followed by three days pondingwith the NaC1 solution.
Experimental Program
Materials
The materials used in the HMA were Virginia Department of Transportation (VDOT) #68and #10 dolomitic limestone aggregate supplied by Acco Stone Company located inBlacksburg, VA; the asphalt cement was AC-20. Hydrated lime was used as an anti-stripping agent in HMA specimens of resin modified concrete and VDOT SM-5 HMA wasused as the control. The materials used for the grout were Type I portland cement, fly ash,water, standard sand, and resin additive. The fly ash was provided by Marshall ConcreteCompany of Christiansburg, VA. Resin additive, Prosalvia 7 (PL7), was manufactured byJean Lefebvre Construction Company in France. Daravair air-entraining agent was used inthe control portland cement concrete specimens. The properties of the aggregate used in theHMA are presented in Table 7.1.
Table 7.1 Aggregate Properties
FINE AGGREGATE COARSE AGGREGATE
Bulk Specific Gravity 2.79 2.65
Apparent Specific Gravity 2.82 2.68
Absorption 0.7 % 0.4 %
Average Bulk Specific Gravity of Aggregate Blend 2.67
Average Apparent Specific Gravity of Aggregate Blend 2.71
Mix Design
HMA Design
The primary objective of the HMA design is to provide a mixture with maximum possibledensity in the desired range of air void content. Various methods may be used such as theMarshall method, Hubbard-Field method, Hveem method, Smith or Asphalt Institute Tri-Axial method, Gyratory testing method, and Laboratoire Central des Ponts et Chaussees(LCPC) rubber tire method. These methods are empirically based and have beenstandardized to reach worldwide acceptance. Any of these methods may be used to design a
149
mixture for a given aggregate and aggregate gradation meeting criteria based on pastexperience. These methods have been developed to measure stability and to establish acorrelation between laboratory specimens and field mixture. Methods used to establish th.scorrelation vaEy from direct compression with or without hand rodding, to hand tamping,impact hammer, kneading action, gyrating shear, vibration and simulated rolling.
In this research, the Marshall method was used to design the HMA. It is the standard in theState of Virginia, where this research was conducted, and it is the most widely used methodin the United States, and abroad. The objective of the Marshall method, used in this study,was to design _m optimum compactive effort, and optimum asphalt content for the givenaggregate in order to achieve desired air void content. The HMA design, in this study,involves aggregate gradation, optimum compactive effort, and optimum asphalt content.
Aggregate gradation was chosen as standardized by the additive manufacturer, Jean LefebvreConstruction Company, and is presented in Table 7.2. In order to determine the optimumnumber of blows required to produce the required air void content for a given asphalt cot tentand aggregate gradation, different compactive efforts were used. Asphalt content of 3.9% byweight of aggregate was chosen to determine the optimum compactive effort. As the voidcontent required was in the range of 25-30%, the required compactive effort would be verysmall. Thus, five different compactive efforts were used, 10, 15 and 20 blows on each sideand 15 and 20 blows on only one side of the specimen. Marshall specimens were prepar_in accordance with ASTM D-1559 and were evaluated for bulk specific gravity and air voidcontent. The compactive effort that gave the optimum percent of air void content was chosenas optimum compactive effort (number of blows). The analysis is presented in Table 7.3 Inthis research, 10 blows on each side provided the optimum percent of air void content andwas used throughout the research. Although 15 blows on 1 side resulted in a lower bulkspecific gravity, the researcher elected to use 10 blows on each side because the Marshallmethod compacts specimens on both sides.
Optimum asphalt content is the one which produces maximum stability and maximum densityin the desired range of air void content. It depends on the type and shape of aggregate,compactive effort and desired final voids. In order to design the optimum asphalt conten_:,different amounts of asphalt were used and Marshall specimens were cast and evaluated fardensity, percent air voids and voids in mineral aggregate (VMA). In practice, 21/2%increments are normally used below and above the expected optimum asphalt content. In thisresearch, 0.2% increments were used below and above the expected optimum asphaltcontent. Expected optimum asphalt content can be calculated using empirical formulas bz.sedon the surface area concept, such as Califomia Highway Department formula, Nebraskaformula, and French formula.
150
Table 7.2 Aggregate Gradation
% PASSING
SIEVE #68 #10 Aggregate* Specified
Aggregate Aggregate Blend Limits
1" 100.0 100.0 100.0 100
3/4" 100.0 100.0 100.0 100
1/2" 59.3 100.0 67.0 65 - 75
3/8" 31.0 I00.0 44.0 50 -65
#4 6.0 90.0 22.0 23 - 33
#8 2.0 55.0 12.0 9- 17
#16 0.0 44.7 8.5 7 - 13
#30 0.0 26.3 5.0 5- 10
#50 0.0 16.0 3.0 4- 8
#100 0.0 13.0 2.5 2- 6
#200 0.0 10.0 0.95* 1- 3
* Additional 0.95 % (by weight of aggregate) hydrated lime was used
Note: 1 in = 25.4 mm
The California Highway Department formula is
P = 0.015a + 0.013b + 0.17c (7-1)where,
P = percent of bitumen in the mix by weight,a = percent of aggregate retained on #10 sieve,b = percent of aggregate passing #10 sieves and retained on #200 sieve, andc = percent of aggregate passing #200 sieve.
The numerical factors used with a, b, c are related to surface area of aggregates. Thismethod is limited to locally available materials as it employed only two sieve sizes.
The Nebraska formula is
P = AG(0.2a) + 0.06b + 0.10c + Sd (7-2)where,
P = percent of bitumen residue by weight of mixture at the time of laying,
151
A = absorption factor for aggregate retained on #50 sieve,G = specific gravity correction factor of aggregate retained on #50 sieve,a = percent of aggregate retained on #50 sieve,b = percent of aggregate passing #50 sieve and retained on #100 sieve,c = percent of aggregate passing #100 sieve and retained on #200 sieve,d = percent of aggregate passing #200 sieve.
This method is preferred over the California Department Highway formula because it m'.tkesuse of more aggregate sizes. However, these methods do not include shape, surface textureand adsorption of aggregate. Other state highway departments have their own formulas toevaluate optimum asphalt content based on their experiences.
In this research, the French formula was used to evaluate the estimated optimum asphaltcontent as described below (47):
(-)(k)(_)_ls ("-3)
2.65- - ('r-.4)
Yo
where,
3'o = apparent specific gravity of aggregate,k = richness modulus having a value of 3 to 3.5 depending upon the maximum
aggregate size and gradation,= conventional specific surface area
-- 0.25G + 2.3S + 12s + 135f,G = percent of material retained on l/4-in,S = percent passing l/4-in and retained on #50 sieve,s = percent passing #50 and retained on #200 sieve, andf = percent passing #200 sieve.
The estimated optimum asphalt as calculated using the French formula was found to be 4.1%of the aggregate weight using a K value of 3.25. Marshall specimens were prepared using10 blows on each side with asphalt contents of 3.7%, 3.9%, 4.1% and 4.3% by weight ofaggregate to determine the actual optimum asphalt content. The optimum asphalt contentwas chosen as the one which produced optimum unit weight, optimum air void content, andoptimum voids in mineral aggregate (VMA)..
152
Table 7.3 Optimum Compactive Effort
No. of Sample Average STDBlows No. Bulk Bulk
Sp. Gr. Sp. Gr.
15 1 1.781 0.0511 Side 2
20 1 2.013 0.1661 Side 2
10 1 1.875 0.003Each Side 2
15 1 1.897 0.017Each Side 2
F = Specific gravity of parafilm = 0.9
Theoretical maximum specific gravity was calculated for each mixture of different asphaltcontent in accordance with ASTM D 2041-78, and the results are presented in Table 7.4.Bulk density of HMA specimens was determined using parafilm wrapping rather than usinguncoated or melted paraffin coating as suggested by ASTM standards D 2726-88 and 1188-83because of the extreme openness of the mixture and coarse surface texture. If the specimenwas left uncoated, water will enter the voids and reduce the effective volume of specimensand give erroneously lower values of air voids. Even when melted paraffin coating is used itis difficult to apply the coating without filling surface voids. Also, the coating cannot beremoved easily, and the specimens cannot be used for further testing. The parafilm (sheet)wrapping could be removed and thereby specimens could be used for further testing. Thespecific gravity of parafilm material is the same as melted wax, and the formula used inASTM 1188-83 is applicable in calculating air void contents. The results are presented inTable 7.5.
Unit weight, air void content and voids in mineral aggregate was determined and plotted as afunction of asphalt content. Optimum asphalt contents from three plots were selected, andthe average of the three values was chosen as the average optimum asphalt content for themixture. The average optimum asphalt content was 4.05 %.
Resin Modified Cement Grout
The primary objective of the cement grout design is to assure its penetration through thevoids in HMA under vibration. The primary design parameter for the grout design is itsflow rate. The grout flow rate is determined by the time needed for 0.26 gal (1 e) of groutto flow through a Marsh Flow Cone and is expressed in seconds. The dimensions of the
153
cone are presented in Fig. 7.1.
The flow rate of the grout should be slightly greater than that of water, with maximumpossible strength in order to have full penetration. If the flow rate is too high, i.e, if thegrout is too thick, it will not penetrate fully through the voids. If the flow rate is too low,i.e., the grout is too thin, the grout does not have sufficient strength. The flow rate of tl_ewater is six seconds, so a flow rate between seven and nine seconds is considered optimum.
The composition of the grout was adjusted to provide optimum flow rate. The mixtureproportions of the grout and resulting flow rate are presented in Table 7.6.
Table 7.4 Theoretical Max. Specific Gravity For HMA (APCCC)
Asphalt Content Theo. Max. Average Theo.% Specific Gravity Max. Sp. Gr.
3.7 2.517 2.5272.538
3.9 2.537 2.5412.545
4.1 2.531 2.5342.536
4.3 2.527 2.5322.537
I
154
.° .... °° ....e_
e_
_ _,,_ _- _o_ __ ___ 444 d_d N_ d_N
e_
_ N
_ II
-- d_m dMN_ N_4_ _Md _
m oN II
0
°_
155
155 mm I.D.
315 mm
60 mm
\
10 mm
Fig. 7.1 Schematic Diagram of Marsh Flow Cone
156
Table 7.6 Mix Design of Slurry Grout
MATERIAL % BY WEIGHT
Cement (Type I Portland Cement) 38.5
Fly Ash 19.2
Sand (Standard) 12.7
Water (W/C ratio 0.7) 26.8
Resin Additive (Prosalvia PL7) 2.8
AVERAGE STD NUMBER OFTESTS
Marsh Flow, sec. 8.1 0.2 17
Specific Gravity 1.74 0.10 17
APCCC Specimen Preparation
After the HMA and grout proportions were determined, the next step was specimenpreparation. HMA specimens were prepared using the average optimum asphalt content of4.05% of the aggregate weight at compactive effort of 10 Marshall blows on each side. Thespecimens were then wrapped with duct tape to contain the liquid grout. Care was taken tomake sure that the grout did not leak through the openings in the duct tape, especially whenthe specimens were exposed to mechanical vibration. The grout was then prepared; it wasstirred with a mechanical stirrer to achieve a homogenous mixture. The grout was pouredinto the specimen which was placed on a vibrator table. The specimens were vibrated untilno bubbles were seen. The duct tape was removed after 12 hours, when the grout hadcured. Moist cured specimens were wrapped with wet burlap. After moist curing,specimens were kept in the laboratory and exposed to laboratory air curing until tested.
The average percent of the voids in HMA (APCCC) filled with grout was 91.4%, thus theaverage remaining air voids in APCCC specimens is 2.2%. Detailed results are presented inTable 7.7.
157
Table 7.7 Air Void Content Analysis of APCCC Specimens
I
Specimen No. Bulk Sp. Gr. % of Air Voids Wt. of Grout* % of Voids FilledFilled In With Grout
To evaluate the performance of the APCCC, the mechanical and durability properties we::ecompared with those of HMA, but chloride intrusion resistance was compared to that ofportland cement concrete.
HMA control specimens were Virginia surface mixture SM-5. The aggregate gradation _.ndthe control HMA properties are presented in Table 7.8. Portland cement concrete controlspecimens used for the chloride intrusion comparison were prepared as typical bridge deckmixes used in the state of Pennsylvania. The composition of materials and the properties ofthe portland cement concrete are presented in Table 7.9.
Marshall stabili_ty,designated as ASTM D 1559-82, is one of the most widely used qualiUcontrol tests of HMA. The objective of this test is to predict the rutting potential of astandard specimen prepared in the laboratory. Marshall stability is defined as the maximtLmload carded by a compacted specimen tested at 140°F (60°C) at a loading rate of 2 in/mia(51 mm/sec). Flow index, or flow value, is the total deformation in 1/100 inches (or in ram)of the specimen at maximum load.
The testing procedure involved applying compressive load to the standard cylindricalspecimen, 4 in (101.6 mm) diameter and 2 1/2 in (63.5 ram) height, through semi-circularheads. Specimens were placed in a water bath at a temperature of 140 + 1.8°F (60 + 1°C)for 30 to 40 minutes before testing. Testing was completed within 30 seconds after removalfrom the water bath as per specification.
Fifty-one specimens of resin modified concrete were prepared for this test. The specimerLswere grouped into three moist curing conditions, namely no moist curing, one-day moistcuring, and three-day moist curing. Specimens were tested at 1, 3, 7, 21, and 28 days (sircured after termination of moist curing). For comparison, HMA specimens of Virginiasurface mix SM-5 were used.
Compressive Strength
Specimens for compressive strength were prepared differently, because they require a
162
minimum height to diameter ratio of one. The specimens for testing compressive strengthwere prepared in a 4-in (101.6 ram) mold and the HMA was placed in three layers and handcompacted using a Marshall hammer and applying 10 blows on each layer. This providedthe specimens with an air void content in the range of 25 to 30%. The specimens were thenfilled with resin modified cement slurry grout in accordance with the procedure presentedearlier.
Thirty-three specimens were prepared. Specimens were grouped into the three-curingperiods, no moist curing, one-day moist curing, and three-day moist curing. Specimens weretested at 1, 3, 7, and 28 days (air cured after termination of moist curing). Specimens werecapped with sulfur capping compound before testing, to provide a smooth, fiat load surface.
Indirect Tensile Strength
Tensile strength is one of the most widely used tests to determine the characteristics of HMAmaterials. Thirty-three APCCC specimens were prepared. Specimens were air cured aftermoist curing (no curing, one-day moist curing and three-day moist curing) until tested at 3,7, and 28 days. The test was performed in accordance with ASTM D 4123-87. The rate ofloading used was 2.0 in/rain (51 mm/min). Tensile strength was calculated as follows:
Tensile Strength - 2P (7-5)rcd_
where,
P = maximum load applied to specimen, lb (N);£ = length of the specimen, in (m); andd = diameter of the specimen, in (m).
Resilient Modulus
Diametral modulus measures the stiffness and temperature susceptibility of asphalt pavingmixtures. Several moduli such as Young's, shear, complex, dynamic, double punch,resilient and Shell homograph are commonly used for structural evaluation of asphaltmixtures. Resilient modulus is more appropriate for use in multilayer elastic programs thanare other moduli, because it represents the elastic stiffness of material after repeated loadings(48).
The modulus or elastic stiffness depends on time and temperature. Resilient modulus isdefined as the ratio of the applied stress to the recoverable (resilient) strain after repeatedloading. The diametral resilient modulus was determined using a MTS and Mark II ResilientModulus testing apparatus.
163
The resilient modulus of specimens under dry conditions (without conditioning) weredetermined at the Virginia Transportation Research Council in Charlottesville, VA. A 0.1second load pulse is applied every three seconds across the vertical diameter of a cylindricalspecimen and the resultant deformation along the horizontal diameter is measured. Thus,Poisson's ratio is needed to determine the resilient modulus. For SM-5 HMA specimens_ aPoisson's ratio of 0.35 was used. But, for resin modified concrete specimens the Poisson'sratio cannot be found in the available literature; hence it is necessary to determine thePoisson's ratio to calculate the resilient modulus.
In order to determine Poisson's ratio, it is necessary to determine the vertical and horizontaldeformations. An MTS machine was used to determine vertical and horizontal deformations.The Poisson's ratio calculated for these specimens was used to evaluate the resilient modalusfor unconditioned specimens tested using the Mark II Resilient Modulus device.
The resilient modulus is calculated as given in the equation below:
Modulus(M,) - L*(v +0.273)• 106 (7..6)(t,aH)
where,
M, = Resilient modulus, psi (Pa)L = Load, lb (N)J, = Poisson's ratiot = Thickness of specimen, in (m)AH = Horizontal strain, micro inches (microns)
Durability Tests
Water Sensitivity (Stripping)
Moisture susceptibility or deterioration of asphalt mixture due to the detrimental effects c,fwater (stripping) causes loss of bond strength (adhesion) at the aggregate-asphalt interfac,•,and/or loss of cohesion of asphalt due to the presence of moisture, and external and internalforces. Therefore, moisture in HMA can cause severe damage to its long-term performance.This damage manifests itself as stripping and softening which cause structural strength artdmixture stiffness loss. Flushing may occur when some of the stripped asphalt cement rises tothe surface. This may develop deformations in the form of shoving and rutting and may alsoreduce the resilient modulus.
Stripping has been recognized as a critical problem since the early 1970's, reducing theserviceability and durability of HMA, with costly consequences. Thus the evaluation ofmaterials for stripping resistance has gained importance. An aggregate-asphalt system not
164
prone to water susceptibility has to retain strength when subjected to moisture conditioning.There are 3 different categories in which the evaluation is conducted:
(a) stripping evaluation using loose compacted mixture;(b) stripping evaluation using compacted specimens;(c) stripping evaluation by determining weight loss of specimen when subjected to
abrasive forces after conditioning.
Laboratory compacted or field extracted specimens are conditioned to simulate inserviceconditions and compared with those unconditioned specimens using strength and stiffnesstests such as indirect tensile strength, stability, compressive strength and resilient modulus.
Various methods exist today to predict the stripping phenomenon quantitatively; however,none of them provide accurate prediction. The following are most commonly used in theUnited States: Immersion Compression Test (AASI-ITO T-165, ASTM D 1075); LottmanTest (49); TunniclifflRoot Test (50); Marshall Immersion Test (ASTM D 1664); Freeze-thawPedestal Test (51); and Boil Test (ASTM D 3625).
In this study, the modified Lottman method (53), was used to evaluate the strippingresistance of the resin modified concrete. This method is more severe than the
Tunnicliff/Root method or original Lottman method as the specimens are subjected tofreezing cycles also. Resistance to stripping was determined by evaluating the tensilestrength and resilient modulus before and after specimen conditioning.
Tensile Strength Ratio (TSR) and Resilient Modulus Ratio (MAR) were determined as below:
Tensile Strength Ratio (TSR) = Ratio of tensile strength obtained afterconditioning to the tensile strength obtainedbefore conditioning.
Resilient Modulus Ratio (MAR)= Ratio of modulus retained after conditioning tomodulus obtained before conditioning.
The suggested minimum value for TSR and MaR which indicates that the material may not besusceptible to water damage is 0.75 (53).
Thirty-six specimens were prepared for moisture damage evaluation of the APCCC over timefor the three different moist curing periods. Two specimens of each moist curing period, nomoist curing, one-day moist curing, and three-day moist curing, were air cured for theremaining time of 3, 7, and 28 days before being water conditioned.
Water conditioned specimens are vacuum saturated. Specimens are immediately wrapped inplastic sheet and were kept in a plastic bag containing 10 ml of water. The specimens werethen placed in a freezer for 15 hours at 0 + 4°F (-32 + 2°C). After removal from thefreezer the specimens were unwrapped and kept in a water bath for 24 hours at 140 + 1.8°F
165
(60 + 1°C).. The specimens were then removed from the water bath and kept at testinl_temperature for three hours (room temperature) before testing. Resilient modulus andindirect tensile strength were then performed on the water conditioned specimens. IndirectTensile Strength for conditioned specimens was tested in accordance with ASTM D 4123-87.
For the resilient modulus testing, cyclic loads between 0.1 to 0.4 of tensile strength wereused. The load was transmitted through the curved strips of 1/2 in (13 ram) wide and i. 1/2in (63.5 ram) long. The load was applied in the squarewave form of 0.1 second of lo2dapplication and releasing the load for 0.9 seconds, thus the frequency was 1 I-Iz.
The data were acquired by LTN (Lab Tech Notebook) data acquisition system, using fourchannels. One channel was used to measure the load, one for vertical deformation and theother two to measure the horizontal deformations through LVDTs mounted on either sic e ofthe specimen. The data were acquired at a rate of 100 points per second to accuratelyrepresent the deformation curve.
Freezing and Thawing
Freezing and thawing is the foremost test used to evaluate the performance of concrete anderenvironmental conditioris. Repeated freezing and thawing cycles produce disruptive for.:escaused by the volume expansion of water during freezing will cause damage to inadequatelyprotected m_Lterials (54). Water in the capillary pores of cement paste expands uponfreezing, and if the volume is greater than the available space, then the excess water flcwsunder the pressure of expansion. If flow pressure exceeds the tensile strength of paste,cracking occurs, allowing more water to enter during the thawing cycle, and causing m,gredamage during freezing.
The apparatus, the temperature of the freeze thaw cycles, and the duration of each cycle usedin this study were in accordance with ASTM C-666-84, Standard Test Method for Resistanceof Concrete to Rapid Freezing and Thawing; however the specimen shape and size weredifferent. The temperature changed from 40*F to 0°F (4°C to -32°C) during freezing ;rod0°F to 40OF (-32"C to 4°C) during thawing. The time for one freezing and thawing cycle isranged between about four hours, thus achieving an average of six cycles per day.
APCCC spe('imens prepared using the Marshall procedure 4 in (101.6 mm) diameter and 21/2 in (63.5 ram) thick, were used to evaluate the effect of freezing and thawing cycles onthis material. As the depth-to-diameter ratio is less than one, the dynamic modulus of thespecimens could not be determined by the transverse frequency method.
As a result, the effects of freezing and thawing were determined by calculating the indi:'ecttensile strength and resilient modulus before and after conditioning. Because no procedJreexists to evaluate the freeze-thaw effects on HMA specimens, resin modified concretespecimens were evaluated after being subjected to 25 rapid freeze-thaw cycles.
166
Thirty-six specimens were prepared for evaluating the resistance of APCCC to rapid freezingand thawing conditioning for the different curing periods.
Chloride Intrusion
Chlorides arrive at the reinforcing steel in concrete in three different ways: they may bepresent in the original mix at the time of concrete placement, for example in mixing water,in aggregates, or in accelerators; they may enter through cracks; and they may ingressthrough pore structure, i.e., by diffusion.
In this research, the Specific Ion Probe method was used to determine chloride contents of
specimens based on the results of SHRP C-101 (55). Nine APCCC specimens exposed tothree moist curing periods, no moist curing, one-day moist curing and three-day moistcuring, air cured to 28 days. After curing, three specimens from each group were subjectedto 7, 11 and 15 wet/dry ponding cycles using 3% sodium chloride solution. Each cycleconsisted of four days of air curing and three days of salt solution ponding.
After completion of dry/wet cycles, the specimens were cut into quarters and each quarterwas then cut into three parts and at least 3 grams of powdered grout was collected at twodepths from the top surface; 0.75 in (19 ram), between 0.25 in (6 ram) and 1.25 in (32 mm),and 1.75 in (44 mm), between 1.25 in (32 ram) and 2.25 in (57 ram). The collected grout atdifferent depths from various specimens was stored in labeled plastic containers until chloridecontents were measured.
Extreme care was taken during drilling to avoid collecting any asphalt or crushed aggregates.Asphalt cement contains chemicals which may influence the specific ion probe readings.Powdered samples were collected from the control portland cement concrete specimens atcorresponding depths to correlate the results of the two materials.
The specific gravity of the grout was 1.742 and unit weight was 2935 lb/yd 3 (17.1 kN/m3).Thus, to convert the percentage of chloride ions into lb/yd 3 a factor of 29.3 was used.However, the sample was extracted only from the grout and this constituted only 25.3% ofthe whole material by volume (volume of grout and air voids). In order to convert the
chloride into weight per volume of the APCCC the above obtained factor was reduced by74.7% to measure the amount of chloride in weight per volume of APCCC.-
The multiplier for the portland cement concrete was 39.5 to determine the amount of chloridecontent in lb/yd 3 of portland cement concrete.
167
Results and Discussion
Marshall Stability
The stability results for all three moist curing levels of APCCC specimens are presented inTable 7.10 and Fig. 7.2. The results indicate that stability of APCCC increases with tim_for all moist curing levels. For example, at three-day testing, the stability of APCCC w2s2111 Ib (9389 N) for no moist curing, 2218 lb (9866 N) for one-day moist curing, and 2?.39lb (9961 N) for three-day moist curing, whereas the corresponding values at 28 day testirgwere 3017 lb (113421N), 4028 lb (17918 N), and 4264 lb (18968 N), respectively.
The stability, in general, increased with the moist curing period. For example, at seven-daytesting, the stability was 2259 lb (10047 N) for no moist curing, 2289 lb (10180 N) for cne-day moist curing, and 2396 lb (10658 N) for three-day moist curing. For all moist curingconditions, the stability values were higher than for the control mixture SM-5 HMA, whichhad an average stability of 1956 Ib (8700 N). The results also showed that the stability cfAPCCC for one-day moist curing was 17% greater than that of SM-5 HMA at three-daytesting, and 205% greater at 28 days.
Compressive' Strength
The results of compressive strength measurements for APCCC specimens at all three mo!stcuring periods are presented in Table 7.11 and Fig. 7.3. The compressive strength of th_APCCC was fiaund to increase with curing and time as does that of portland cementconcrete. The: compressive strengths at three day testing were 300 psi (2070 kPa) for nomoist curing, 316 psi (2180 kPa) for one-day moist curing, and 332 psi (2290 kPa) for three-day moist curing, whereas the corresponding values at 28 day testing were 799 psi (5510kPa), 894 psi (6160 kPa), and 1013 psi (6990 kPa), respectively.
Compressive strength of APCCC at 28 day testing was found to be three times that of HMA.Compressive strength gained between one-day and three-day moist curing was insignificant atthree and seven day testing. However, a greater difference was noticed between one day andthree day moist curing at 28 day testing.
Indirect Tensile Strength
The results of the indirect tensile strength test for APCCC for all three moist curing periodsare presented in Table 7.12 and Fig. 7.4. An increase of about 40% in tensile strength wasobserved between three day and 28 day testing.
Tensile strengths of APCCC at three day testing were 110 psi (756 kPa) for no moist curing,117 psi (806 kPa) for one day moist curing, and 123 psi (894 kPa) for three day moistcuring, whereas the tensile strengths for corresponding moist curing levels at 28 day testingare 143 psi (985 kPa), 169 psi (1166 kPa), and 174 psi (1197 kPa), respectively.
168
_'_ _ r_ _ L"_ 0 '_- i_
_" _'_ _ o o<
z"
4
o
Z 169
00
170
r4_
olltra_ra_
0z
171
0 1co
Jf |
'\ \\
o
uJ _N r_I-- _
.o _r_
I I I I I I I I C)C) 0 0 0 0 C) C) C) C) 00 0 0 C) C) 0 C) C) C) C)_-- 0 (3) QO I_ (.0 Lr) _' C¢)T" 'I=-
,(!sd)HION=IEIIS =IAISS=II::IdlNO0
172
Z
r_
_ _ o< _ o
O0
oZ
173
0
-04
o-04 r,.)
AU) =>. .=
i im
\ ° o
_.,, _, I,, r-
"''" _ -u)
I I I I I I I OO C) O O O O O O O_0 h- (D 14') _" 0') 0,1 "1-- O
(!sd) HION':II::llS 371SN31 1031:110NI
174
An increase of 30% for no moist curing, 55% for one day moist curing, and 59% for threeday moist curing is observed at 28 day testing compared to tensile strength of SM-5 HMA.Indirect tensile strength of SM-5 HMA was found to be 109 psi (715 kPa). Insignificantdifference in tensile strength was found between one day and three day moist curing.
Resilient Modulus
The results of resilient modulus tests at 1, 3, 7, and 28 days testing for all three moist curinglevels of APCCC are presented in Table 7.13 and Fig. 7.5. The resilient modulus at roomtemperature for APCCC was found to be higher than that of SM-5 HMA at all investigatedcuring periods and increased with time. The resilient modulus increased by 73 % for nomoist curing, 71% for one-day moist curing, and 73% for three-day moist curing, whentested at and 28 days. The resilient modulus was found to increase with moist curing; atseven-day testing, the resilient modulus was 489 ksi (3370 MPa) for no moist curing, 507 ksi(3490 MPa) for one day moist curing, and 522 ksi (3600 MPa) for three-day moist curing.
The average resilient modulus for SM-5 HMA was found to be 296 ksi (2040 MPa).APCCC, tested at 28 days, showed an increase of 212% in resilient modulus over SM-5HMA for no moist curing, 225% for one-day moist curing, and 242% for three-day moistcuring when tested at room temperature.
Water Sensitivity
The tensile strengths of the water-conditioned specimens using modified Lottman method arepresented in Table 7.14 and Fig. 7.6. Comparison between tensile strengths ofunconditioned and water-conditioned APCCC specimens are presented in Figs. 7.6 through7.9.
The results showed that all tensile strength ratio (TSR) values for APCCC exceeded 0.75 atall times for all moist curing levels except for one-day moist curing and three-day moistcuring at 28 day testing. TSR for SM-5 HMA was 0.87. The tensile strengths ofconditioned specimens of APCCC for all moist curing levels were found to exceed theunconditioned specimens of SM-5 HMA at all periods.
Tensile strength ratios (TSR) were, in general, found to decrease with moist curing and alsodecrease with time, which is contradictory. Visual observations indicated that the surfaces ofconditioned specimens were not similar to those of unconditioned specimens; because ofwater conditioning, the surface grout peeled off, making the surface irregular. As a result,the loading strips were not in a good contact along the loaded strip, resulting in concentratedloads and thereby lower tensile strength values. The specimens, did not have any cracks.
Resilient moduli of the water conditioned APCCC specimens are presented in Table 7.14.The comparison of the resilient modulus of APCCC with that of SM-5 HMA are presented inFig. 7.10. Comparisons between resilient moduli of unconditioned and water conditionedspecimens, for all moist curing levels are presented in Figs. 7.11 through 7.13.
175
J_ zo _<zo _<zo _<0
oooo ,,_
0Z
176
177
o.,
O0 O0 O0 O0 t'_ t"'..r_
m
="o
e_meu
r_
=u z
[" "< II
[..
oo
,,d!
O0
0Z
178
179
180
181
182
-.,--
183
184
185
186
Resilient modulus ratio (M_R) of the SM-5 HMA was found to be 0.83. Resilient modulusratios (M_) of the APCCC for all moist curing levels were found to exceed 0.82, at alltimes. One day moist curing was, in general, found to have the highest M,R valuescompared to no moist curing and three-day moist curing.
The resilient modulus of the water-conditioned APCCC specimens was found to exceed eventhe resilient modulus of the unconditioned SM-5 HMA. Resilient moduli of the water
conditioned APCCC specimens at 28 day testing were found to be 620 ksi (3580 MPa) for nofor no moist curing, 563 ksi (3880 MPa) for one-day moist curing, and 5870 ksi (4050 MPa)for three-day moist curing compared to resilient modulus of 296 ksi (2040 MPa) of theunconditioned SM-5 HMA.
Freeze-Thaw
So far, the effects of freeze-thaw have not been well investigated for HMA. However, thefreeze-thaw effects of portland cement concrete have been studied extensively using ASTMC-666 and C-672.
Tensile strengths of the APCCC specimens tested after being subjected to 25 rapid freeze-thaw cycles are presented in Table 7.15 and Fig. 7.14. Tensile strength ratios of theAPCCC specimens ranged between 0.66 and 0.89, whereas tensile strength ratio of SM-5HMA was found to be 0.70.
Tensile strength of conditioned specimens was found to increase with moist curing and time;however, the tensile strength ratios were found to decrease with time, possibly because thesurface grout had slightly peeled off, causing an irregular surface area. However, no visualcracks were observed after specimens were subjected to freeze-thaw conditioning, tending tosupport the observation that specimens were not highly prone to freeze-thaw deteriorationafter 25 cycles of freeze-thaw. Specimens of no moist curing yielded highest TSR values atthree and 28 day testing. Whereas one-day moist curing yielded highest TSR at seven-daytesting, followed by three-day moist curing and no moist curing, see Figs. 7.15 through7.17.
Resilient moduli of the APCCC specimens tested at 3, 7, and 28 days for all three moistcuring periods are presented in Table 7.15 and Fig. 7.18. Comparisons betweenunconditioned and conditioned specimens at all moist curing levels are presented in Figs.7.19 through 7.21.
The resilient modulus ratio of SM-5 HMA was found to be 0.68. Resilient modulus ratio
(M_R) of the APCCC specimens ranged from 0.51 to 0.78. No moist cured specimensyielded the highest M_R values at seven and 28 day testing, followed by the one-day moistcuring and three-day moist curing. However, differences between the MfR values of no-moist-curing and one-day-moist-curing specimens were insignificant.
At three-day testing, one-day moist curing had the highest MrR value followed by 3 daymoist curing and no moist curing.
187
0101[.,g,r]
o
N
c_
_=_ _,_ o- o_,...c_
om
F-,om
_., ,..M
[.
_ _ II_ ""
0Z
18_
19{)
o
•F II
I
t wl
• b
t
• ._j); o Z ,=.,
A _l[,. i_0; tD -', Z "i:• '_ 0 ::
| ,ql_
', LU _ ._
;, I-, --, ;,_t
, Z Q; _ m• Z ::, :) o C_
t
• z _t
; • ,_:
"+ II _'r-.
r-:
o ._.bo o o & _. _ o _ o
(]sd) FLL_)N_N t___'iIS_ J.ONEIICINI
192
194
195
i%
Chloride Content
The chloride content of APCCC and portland cement concrete specimens, after dry/wet cyclepondings are presented in Table 7.16 and Figs. 7.22 and 7.23. The background chloridecontent of the resin grout for all moist curing levels was 0.06 lb/yd3 (0.03 kg/m3), for theportland cement mortar it was 0.2 lb/yd3 (0.12 kg/m3).
The results show that chloride content increased with time of exposure to salt solution. Afterseven dry/wet cycles, the chloride content of the APCCC at 0.75 in (19 mm) and 1.75 in (44mm) were 0.67 lb/yd3 (0.40 kg/m3) and 0.47 Ib/yd3 (0.28 kg/m3) for no moist curing, 0.63lb/yd3 (0.38 kg/m3) and 0.17 lb/yd3(0.10 kg/m3)for one-clay moist curing, and 0.7 lb/yd3(0.42 kg/m3)and0.3 lb/yd3 (0.18 kg/m3) for three-day moist curing, whereas after 15 dry/wetcycles of pondings the chloride contents at corresponding depths were 2.6 lb/yd3 (1.6 kg/m3)and 2.1 lb/yd3 (1.3 kg/m3) for no moist curing, 1.8 lb/yd 3 (1.1 kg/m3) and 0.5 lb/yd3 (0.3kg/m3) for one-day moist curing, and 1.8 Ib/yd3 (1.1 kg/m 3) and 0.4 lb/yd3 (0.2 kg/m3)forthree-day moist curing, respectively.
The chloride intrusion decreased with moist curing as presented in Table 5-16. For example,after 11 pondings, at 0.75 in (19 ram) and 1.75 in (44 mm) from the top surface, thechloride contents were 1.1 lb/yd3 (0.66 kg/m3)and 0.57 lb/yd 3 (0.34 kg/m3) for no moistcuring, 1.0 lb/yd3(0.6 kg/m3) and 0.43 lb/yd3(0.26 kg/m3) and 0.13 lb/yd3 (0.08 kg/m3)forthree-day moist curing, respectively. The values for portland cement concrete atcorresponding depths were found to be 2.2 Ib/yd3(1.3 kg/m3) and 0.8 Ib/yd3 (0.48 kg/m3),respectively.
The discrepancy in the values of the chloride content of APCCC may be explained by thepossibility of the presence of small amounts of asphalt cement in the drilled powder of theresin grout, despite the extreme care taken during the sampling. A possible indication of thatis the high standard deviation especially for the samples obtained at 1.75 in (44 mm) fromthe specimens exposed to 15 cycles of ponding. However, the results showed that thechloride content, in general, in APCCC was lower than that in portland cement concrete.
In the field, moist cured for one-day, APCCC may resist chloride intrusion two to threetimes longer than would portland cement concrete.
SUMMARY AND CONCLUSIONS
An investigation was undertaken of the effectiveness of APCCC as a potential bridge deckoverlay. The study included stability, compressive strength, indirect tensile strength,resilient modulus, water sensitivity (stripping) and freezing and thawing effects. Toinvestigate the potential of APCCC as a corrosion abatement technique, an attempt was madeto evaluate the resistance of APCCC to chloride intrusion.
Each investigated property was evaluated over a period of 28 days to determine the effect oftime; however, the chloride intrusion test was conducted over a period of 15 weeks of
197
exposure to salt solution. The specimens were also investigated for three different moistcuring conditions, namely no moist curing, and one- and three-day moist curing, in order toevaluate the optimum amount of curing required in the field.
The investigation concluded that APCCC possesses higher strengths, and higher resistance tostripping and freeze-thaw effects when compared to SM-5 HMA. The resistance of APC:CCto chlorides i_trusion was found to be two to three times greater than that of portland cementconcrete.
The investigation concluded that the one-day moist curing would be optimum, although t]_estrengths and :resistances for three-day moist curing were found to be higher in certain _ses.Based on the results of this research, the study recommends the use of APCCC as bridgedeck overlay, especially with preformed membrane, because of its high strength anddurability.
Table 7.16 Chloride Content At Various Depths
ASPHALT PORTLAND CEMENT CONCRETE COMPOSITE*
PONDING MOIST CHLORIDE CONTENT (LB/CU.Y'D)(NO. OF CURING
CYCLES) (DAYS) AVERAGE @ STD AVERAGE STD0.75 IN @ 0.75 IN @ 1.75 IN @ 1.75 IN
7 NO 0.67 0.32 0.47 0.25I DAY 0.63 0.40 0.17 0.06
3 DAYS 0.70 0.70 0.30 0.10
11 NO 1.10 0.98 0.57 0.231 DAY 1.03 0.80 0.43 0.40
3 DAYS 0.43 0.29 0.13 0.06
15 NO 2.60 0.82 2.07 0.811 DAY 1.77 0.93 0.50 0.14
3 DAYS 1.83 0.75 0.40 0.28
PORTLAND CEMENT CONCRETE**
PONDINGS CHLORIDE CONTENT (LB/YD 3)
0.75 IN 1.75 IN
7 0.8 0.5
11 2.2 0.8
15 4.0 1.5
*Background chloride content for APCCC is 0.06 lb/yd 3 (0.036 kg/m 3)**Background chloride content for PCC is 0.2 lb/yd 3 (0.12 kg/m 3)
Note: 1 in = 25.4 mm, 1 lbs/yd 3 = 0.59 Kg/m 3
198
o_
'e-- r-.
E °
-CDi-- ,-
("4
-_ z_
LO 0 I0 " LO )r,-
(pA'no/ql) .IN: ! NO::) ::l(]ll:JO"lHO
19g
2OO
Appendix A
Virginia 460 Bridge Data and Analysis
201
East -- TrafficDirection West
1
Te,_ Section
DCI Post
Tr_
Plan view of BridgeDec}<
Cross SectionA-A
Si3alled columntreatedwith DCI
itexinchGrout
and Concrete
--Fig.-A,1 Sketch of Post Treatment Test SiteUS Rt. 460 Bypass West Between Christiansburg and Blacksburg, VA
_ ; J'3".5 x 23.5 fiberglass batt unfacecL(or extra Fiberglass panels shipped)
1 ) layout 8' x20' sl_ace (snap chalk lines etc)
2) lay out insulation batting for bridge deck along perimeter
3") cut; intake in end panel & assemt31e intake vent see attached handdraw ings
11inside frame aluminum
attach angles for purpose of attaching intake ventsandwnicn vent between frames
note :widthis4) assemole 112 of side & end( intake encI)
dependent on topend panelsbefore
assemblinglayintoo
panelsto adjustw_dth
7
cut invent add Lclipsas reduire_-
_Ide revef_eoRle¢"ifvent =feces
ii are nor. in, _o soltcl enc_flrscana leave out last 2 _anels m "hese¢on_ section _.ocut the intakevent:
centerline joinl:
_ . 1
puc angle or_ce on corners after too panel is _n olaceangle is ; FootFrom eithercorner of too _anei
Fig. A.4 Heating Shell Assembly Details
2O5
5) lay :r..-" ".,;coanels loose (total of 4, one was rlvettecl _n ;n ste9 =4)ancl measure expansion Factor For center ]omt )5) place _;ces in place for acljusting center jointsee draw:n g acljust center joint it must be20' -" slo_ From imperfectfitof tol_panels3-4"?more or less
topview SlCleviewstuffin
loose _ts isinsulation paneh
les
filler
calculate slop nased on _lacing 3 loose panels as tightas I_ossible w'tn the fixecll_anel, it snoulQ De 8' then t
tl_ere is no sloo otherwise, measure along the side wallsanclcalculate slop ((8 -8')/4)xll)
Fig. B.6 Post-Treatment Mean Potential, Polymer ImpregnatedGroup
218
Appendix C
Corrosion Inhibitors Material Propertiesand Performance Characteristics
219
Table C-1. Virginia A4AE Bridge Deck Air Entrained Concrete, Batch Quantities,lb/yd 3.
SSDItem Basis
Cement 635
Water 212
Coarse Aggregate 11200
Fine Aggregate 1878
Air Entrainment Agent (AEA) 8.0 oz
Super Plasticizer 1',9.2 oz
Air Content 5.5 %
Slump 2 I/2 "
Concrete Batch Quanities and Mix Characteristics for 1" Cover Depth Specimens,lb/yd 3.
SSDItem Basis
Cement 635
Water 204
Coarse Aggregate 1882
Fine Aggregate 1208
AEA 8.0 oz
Superplasticizer 19.2 oz
220
Table C-2. Gradation and Properties of Coarse and Fine Aggregates.
Sieve No. Fine Agg. Coarse Agg.
1/2" 100 100
3/8" 99.1 97.5
# 4 96.1 14.0
# 8 83.2 0.8
# 16 68.6 0.7
# 30 47.6 0.6
# 50 11.8 0.5
# 100 1.7 0.4
# 200 0.2 0.2
Pan 0.0 0.0
Property Fine Agg. Coarse Agg.
Bulk Specfic Gravity, 2.58 2.58Dry Basis
Bulk Specific Gravity, 2.58 2.60SSD Basis
Absorption, (%) 0.16 0.69
Fineness Modulus 2.92
Dry Rodded Unit Weight (lbs) 91.3
221
Table C-3. Cortec 1609 Modified Mix Designs, SSD Basis Batch Quantities (lb/yd3:,and Properties of Fresh and Hardened Concrete for 1 ft x 1 ft SpecimenOverlays.
I Day Strength (psi) 1990 2350 21107 Day Strength (,psi) 3960 4580 412028 Day Strength (psi) 4740 5450 4640
222
Table C-4. DCI Modified Mix Designs, SSD Basis Batch Quantities (lb/yd3), andProperties of Fresh and Hardened Concrete for 1 ft x 1 ft SpecimenOverlays.
Slump (inches) 1.50 0.50 1.50Entrained Air (%) 5.5 4.2 6.1Unit Weight (Ib/yd a) 138 144 143
1 Day Strength (psi) 3380 2090 29807 Day Strength (psi) 6070 6170 520028 Day Strength (psi) 6650 7560 6470
223
Table C-5. Latex Modified Mix Designs, SSD Basis Batch Quantities (lb/yd3), andProperties of Fresh and Hardened ,Concrete for 1 ft x 1 ft SpecimenOverlays.
1. ENR Washington Observer. Engineering News Record 277, No. 2 (July 15, 1991): 7.
2. Portland Cement Association, U.S. Bureau of Public Roads & Ten State Highway Agencies Durabilityof Concrete Bridge Decks, Report 5. Washington, D.C.: 1969, 46.
3. Portland Cement Association U.S. Bureau of Public Roads & Ten State Highway Agencies, Durabilityof Concrete Bridge Decks, Final Report. Washington, D.C.: 1970, 35.
4. Browne, R. D. "Design Prediction of the Life for Reinforced Concrete in Marine and Other Chloride
Environments." Durability of Building Materials 1, (1982): 113-125.
5. Funashi, M. "Predicting Corrosion-Free Service Life of a Concrete Structure in a ChlorideEnvironment." American Concrete Institute Materials Journal 87, No. 6 (November - December 1990):581-587.
6. Cady, P. D. and R. E. Weyers. "Predicting Service Life of Concrete Bridge Decks Subject toReinforcement Corrosion." Corrosion Forms and Control for Infrastructure, American Society forTesting and Materials STP 1137. Philadelphia: American Society for Testing and Materials, 1992.
7. Cady, P. D. and R. E. Weyers. "Deterioration Rates of Concrete Bridge Decks." Journal ofTransportation Engineering, ASCE, I10, No. 1 (January, 1984): 34-44.
8. AASHTO, FHWA, Transportation Research Board, NCHRP, Strategic Highway Research Program.Research Plans, Final Report, Technical Research Area 43 (May, 1986): pp. TRA 4-1 through TRA 4-60.
9. "Durability of Concrete Bridge Decks." NCHRP Synthesis of Highway Practice No. 57. TransportationResearch Council. Washington, D.C., May, 1979.
10. Babei, K. and N. M. Hawkins. "Evaluation of Bridge Deck Protective Strategies." NationalCooperative Highway Research Program Report, No. 297. Washington, D. C." TransportationResearch Board, September 1987, 35.
11. Tvarusko, A. "Cathodic Protection of Rebars in Old and New Concrete Structures." Evaluation and
Rehabilitation of Concrete Structures and Innovations in Design, SP-128, American Concrete Institute,vol. 1. Detroit: American Concrete Institute 1991, 359-372.
12. Slater, J. E. et al. "Electrochemical Removal of Chlorides From Concrete Bridge Decks."Transportation Research Record, No. 604. Washington, D. C.: Transportation Research Board, 1976,6-15.
245
13. Dillard, J. G., J. O. Glanville, W. D. Collins, I. L. A1-Qadi, and R. E. Weyers. Concrete Bridg_
Protection and Rehabilitation: Chemical and Physical Techniques, Strategic Highway ResearchProgram, SHRP-S-XXX, National Research Council, Washington, D.C., 1993, 168.
14. Weyers, R. E., and P. D. Cady. "Development: Deep Grooving - A method for ImpregnatingConcrete Bridge Decks." Transportation Research Record 962. 1984: 14-18.
15. Weyers, R. E., and P. D. Cady. "Application: Deep Grooving - A method for Impregnating Conc:reteBridge Decks." Transportation Research Record 962. 1984: 19-21.
16. Weyers, R. E., and P. D. Cady. "Deep Impregnation of Concrete Bridge Decks." TransportationResearch Record 1184. 1988: 41-49.
17. Manning, David G. "Detecting Defects and Deterioration in Highway Structures." National
Cooperative Highway Research Program, Synthesis of Highway Practice 118. Washington, D. C.:Transportation Research Board, National Research Council, July 1985.
18. Vassie, P. R. A Survey of Site Tests for the Assessment of Corrosion in Reinforced Concrete, LR 953:England, U.K., Transport and Road Research Laboratory, 1980.
19. Mason, J. A. et al. "Use of Polymers in Highway Concrete." NCHRP Report 190. Washington, D.C.: Transportation Research Board (1978): 77.
20. Cady, P. D., and R. E. Weyers. "Field Performance of Deep Polymer Impregnations" Journal ofTransportation Engineering, American Society of Civil Engineers 113, No. 1 (January 1987), 1-15.
21. Dutta, T. "Evaluation of the Effectiveness of Deep Polymer Impregnation as a Corrosion AbateTechnique for Overlaid Bridge Decks." Blacksburg, VA: Virginia Polytechnic Institute and StateUniversity, April 1991:111-124.
22. Clear, K. C. "Measuring Rate of Corrosion of Steel in Field Concrete Structures." TransportationResearch Record No. 1264 (1990): 12-17.
23. Carrasquillo, R. L. Evaluation of a Posttreatment Procedure of an Existing Reinforced Concrete t'ridgeStructure, Final Report Prepared for W. R. Grace & Co., Austin, TX. January, 1986.
24. American Society for Testing and Materials C876-87: Standard Test Method for Half-Cell Potentit:ls ofUncoated Reinforcing Steel in Concrete. Philadelphia: American Society for Testing and Material;;,1987.
25. Berke, N. S., and M. C. Hicks. "Electrochemical Methods of Determining the Corrosivity of Steel in
Concrete." Silver Anniversary Symposium on Corrosion Testing and Evaluation American Society forTesting and Materials STP 1000. Eds. R. Baboian and S. W. Dean. Philadephia: American Soci_,tyfor Testing and Materials, 1990, 425.
26. Berke, N. S., D. F. Shen, and K. M. Sundberg. "Comparison of Current Interruption andElectrochemical Impedance Techniques in the Determination of Corrosion Rates of Steel in Cohere te."
The Measurement and Correction of Electrolyte Resistance in Electrochemical Tests, American So _.ietyfor Testing and Materials STP 1056. Eds. L. L. Scribner and S. R. Taylor. Philadelphia: Ameri:anSociety for Testing and Materials, 1990, 191-201.
246
27. Berke, N. S., and A. Rosenberg. "Technical Review of Calcium Nitrite Corrosion Inhibitor in
Concrete." Transportation Research Record No. 1211. Washington, D. C.: Transportation ResearchBoard, National Research Council, 1989, 18-27.
28. Manson, J. A. et al. "Use of Polymers in Highway Concrete." National Cooperative Highway ResearchProgram 190. Washington, D. C.: Transportation Research Board, 1978.
29. Clear, K. C. 3LP Package - Test Procedure, Data Analysis, Procedure and General Information June,1988.
30. James Instruments, Inc. CL Test Model 500 Instruction Manual. Chicago: James Instruments, Inc.,1988, I 1.
31. Herald, H. E. et al. Condition Evaluation of Concrete Bridges Relative to Reinforced Corrosion,Volume 6: Method for Field Determination of Total Chloride Content, Report No. SHRP-S-328,Washington, D. C.: Strategic Highway Research Program, National Research Council, 1992, 155.
32. Clear, K. C. "Reinforcing Bar Corrosion in Concrete: Effect of Special Treatments." SP-49, AmericanConcrete Institute, Detroit: 1975, 71-82.
33. Clear, K. C. Time to Corrosion of Reinforcing Steel In Concrete Slab, Report No. FHWA RD-76-70.Washington, D. C.: Federal Highway Administration, April 1976.
34. Tremper, B., J. L. Beaton, and R. F. Stratfull, "Causes and Repair of Deterioration to a CaliforniaBridge Due to Corrosion of Reinforcing Steel in a Marine Environment Part II: Fundamental Factors
Causing Corrosion." Highway Research Bulletin 182. Washington, D. C.: Transportation ResearchBoard, National Research Council, 1958, 18-41.
35. Browne, R. D.. "Mechanisms of Corrosion of Steel in Concrete in Relation to Design, Inspection andRepair of Offshore and Coastal Structures." Performance of Concrete in a Marine Environment, SP-65,American Concrete Institute, 169-204.
36. Griffin, D. F., "Corrosion Inhibitors for Reinforced Concrete." Corrosion of Metals in Concrete, SP49-8, American Concrete Institute, Detroit: 1975, 95-102.
37. Dean, S. W., Jr. et al. "Inhibitor Types." Materials Performance. 20, Vol. 1, No. 11, NationalAssociation of Corrosion Engineers (November, 1981): 47-51.
38. Wrangl'n, G. An Introduction to Corrosion and Protection of Metals. New York: Chapman and Hall,1985, 165-173.
39. Miksic, B. A. "Use of Vapor Phase Inhibitors for Corrosion Protection of Metal Products." Corrosion
83. No. 308. Houston: National Association of Civil Engineers, 1983.
40. Dillard, J. G. et al. "Surface Characterization of Reinforcing Steel and the Interaction of Steel with
Inhibitors in Pore Solution." Transportation Research Record 30, Washington, D. C.: TransportationResearch Board National Research Council, 1991 in press.
41. Berke, N. S., and A. Rosenberg, "Technical Review of Calcium Nitrite Corrosion Inhibitor in
concrete." Transportation Research Record No. 1211. (1991): 18-27.
247
42. Dillard, J. G. et _.I. "Migration of Inhibitors in Aquoaus Solution Through Concrete." TransportationResearch Record No. 30, Washington, D. C.: Transportation Research Board National Research
Council, 1991, in press.
43. "Field Test for Surface Soundness and Adhesion." American Concrete Institute Manual of Concret.,Practice Part 5, American Concrete Institute, Detroit: 1991, Appendix 30-32.
44. Webster, L. A. et al. "Electrochemical Studies of Rebar Corrosion and Inhibition in simulated Por_
Solution." Transportation Research Record No. 30, Washington, D. C.: Transportation Research BoardNational Research Council, 1991, in press.
45. Kosmatka, S. H. and W. C. Panarese. Design and Control of Concrete Mixtures, Skokie: PortlamCement Association, 1990, 6.
46. Dressman, S. et al. "A Screening Test for Rebar Corrosion Inhibitors." Transportation ResearchRecord 30, Washington, D. C.: Transportation Research Board National Research Council, 1991, in
press.
47. Ahlrich, R. C., and G. L. Anderton. Construction and Evaluation of Resin Modified Concrete
Pavement, Final Report No GL-91-13, Waterways Experiment Station, Vicksburg: U. S. Army Corpsof Engineers, July 1991, 86.
48. Mamlouk, M. S., and R. T. Sarofim. "Modulus of Asphalt Mixtures -- an Unresolved Dilemma."Transportation Research Record No. 1171. Washington, D.C.: 1988, 193-198.
49. Lottman, R. P. "Predicting Moisture-Induced Damage to Asphaltie Concrete: Ten Year FieldEvaluation." Final Report, NCHRP Project 4-8(4). Washington, D. C.: Transportation ResearchBoard, National Research Council, 1986.
50. Tunnieliff, D. G. and R. E. Root. "Testing Asphalt Concrete for Effectiveness of AntistrippingAdditives." Proceedings, Association of Asphalt Paving Technologists 52 (1983): 535-560.
51. Kennedy, T. W., F. L. Roberts, and K. W. Lee. "Evaluation of Mixture Susceptibility of Asphal:
Mixtures Using the Texas Freeze-Thaw Pedestal Test." Proceedings, Association of Asphalt PavingTechnologists 51. Kansas City: 1982, 327-341.
52. AI-Swailmi, S. and R. L. Terrol. "Evaluation of Water Damage of Asphalt Concrete Mixtures Using
the Environmental Conditioning system (ECS)." Presented at the Annual Meeting of Association ofAsphalt Paving Technologists, Charleston, SC, 1991.
53. Parker, F., Jr., and F. A. Gharaybeh. "Evaluation of Tests to Assess Stripping Potential of AsphaltConcrete Mixtures." Transportation Research Record No. 1171. Washington, D. C.: 1988, 18-2_.
54. Detwiler, R. J., B. J. Dalgleish, and R. B. Williamson. "Assessing the Durability of Concrete in
Freezing and Thawing." American Concrete Institute Materials Journal, American Concrete Insti rote(Jan-Feb 1989): 29-35.
55. Herald, S. E., et al. Condition Evaluation of Concrete Bridges Relative to Reinforced Corrosion,Volume 6: Method for Field Determination of Total Chloride Content, Report No. SHRP-S-328.
Washington, D. C.: National Research Council, July 1992, 155.
248
Concrete and Structures Advisory Committee
Chairman Liaisons
James J. Murphy
New York Department of Transportation (retired) Theodore R. FerragutFederal Highway Administration
Vice Chairman
Howard H. Newlon, Jr. Crawford F. JencksVirginia Transportation Research Council (retired) Transportation Research Board
Members Bryant Mather
USAE Waterways Experiment StationCharles J. Arnold
Michigan Department of Transportation Thomas J. Pasko, Jr.
Federal Highway AdministrationDonald E. Beuerlein
Koss Construction Co. John L. Rice
Federal Aviation Administration
Bernard C. Brown
Iowa Department of Transportation Suneel VanikarFederal Highway Administration
Richard D. Gaynor
National Aggregates Association�National Ready Mixed Concrete 11/19/92Association
Expert Task GroupRobert J. Girard
Missouri Highway and Transportation Department Charles J. Arnold
Michigan Department of TransportationDavid L. Gress
University of New Hampshire Jack J. Fontana
Consultant
Gary Lee Hoffman
Pennsylvania Department of Transportation Ronald I. Frascoia
State of Vermont Agency of TransportationBrian B. Hope
Queens University Andrew D. Halverson
Minnesota Department of TransportationCarl E. Locke, Jr.
University of Kansas Gary Hoffman
Pennsylvania Department of TransportationClellon L. Loveall
Tennessee Department of Transportation Crawford Jencks
Transportation Research BoardDavid G. Manning
Ontario Ministry of Transportation Paul D. Krauss
Wiss Janney Elsmer AssociatesRobert G. Packard
Portland Cement Association Louis Kuhlmann
Larkin Laboratory--Dow Chemicals USAJames E. Roberts
California Department of Transportation Alberto Sagues
University of South FloridaJohn M. Scan.Ion, Jr.
Wiss Janney Elstner Associates Frederick Szczepanek
New York Department of TransportationCharles F. Seholer
Purdue University Paul Virmani
Federal Highway AdministrationLawrence L. Smith
Florida Departmentof Transportation Consultant to the Expert Task GroupJohn Broomfield