SHRP-S-665 Concrete Bridge Protection and Rehabilitation: Chemical and Physical Techniques Feasibility Studies of New Rehabilitation Techniques John G. Dillard, James O. Glanville, William D. Collins, Richard E. Weyers and Imad L. AI-Qadi Virginia Polytechnic Institute and State University Strategic Highway Research Program National Research Council Washington, DC 1993
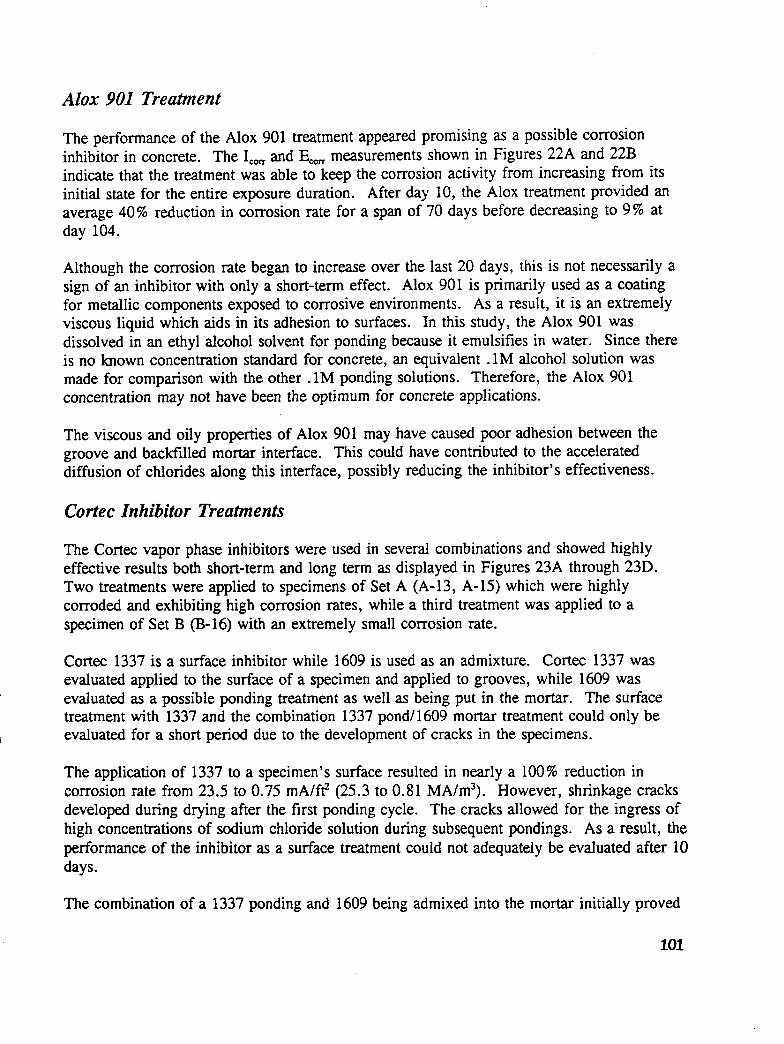
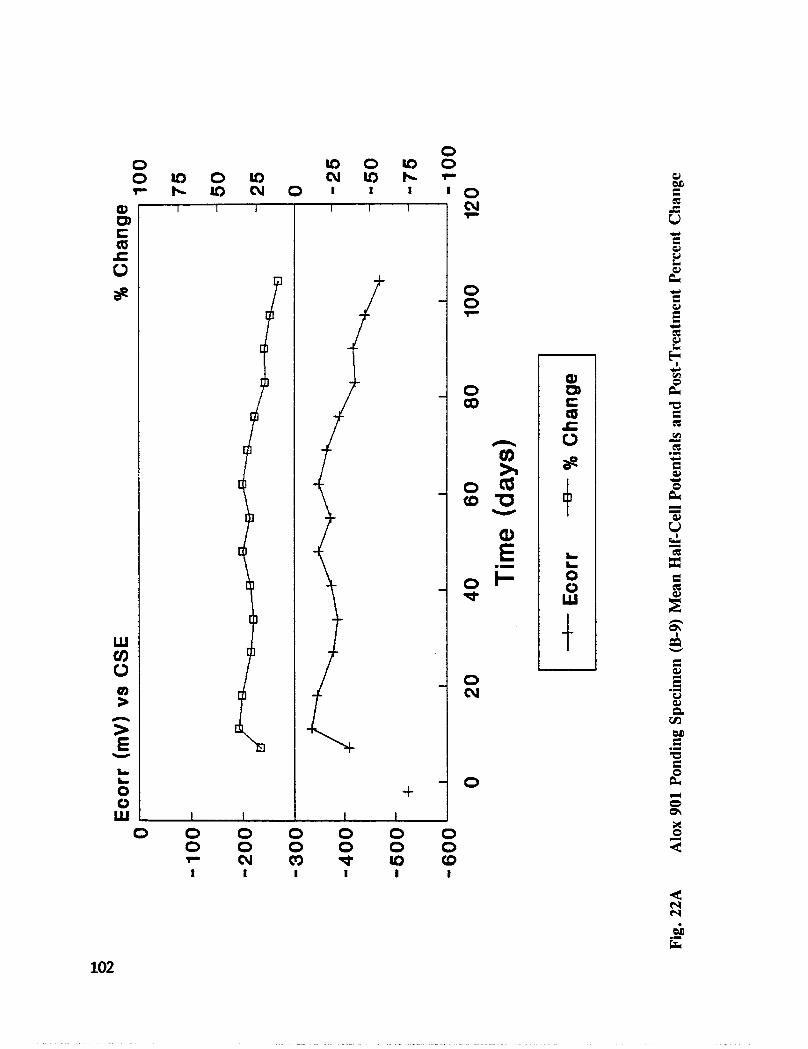
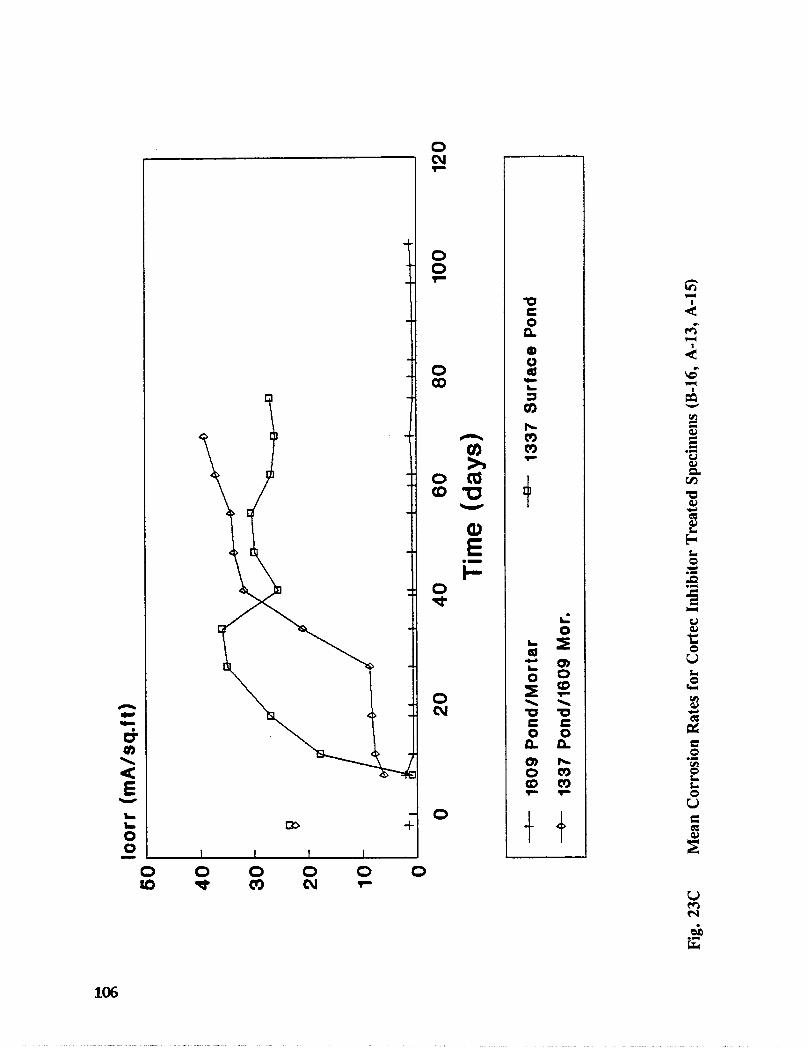
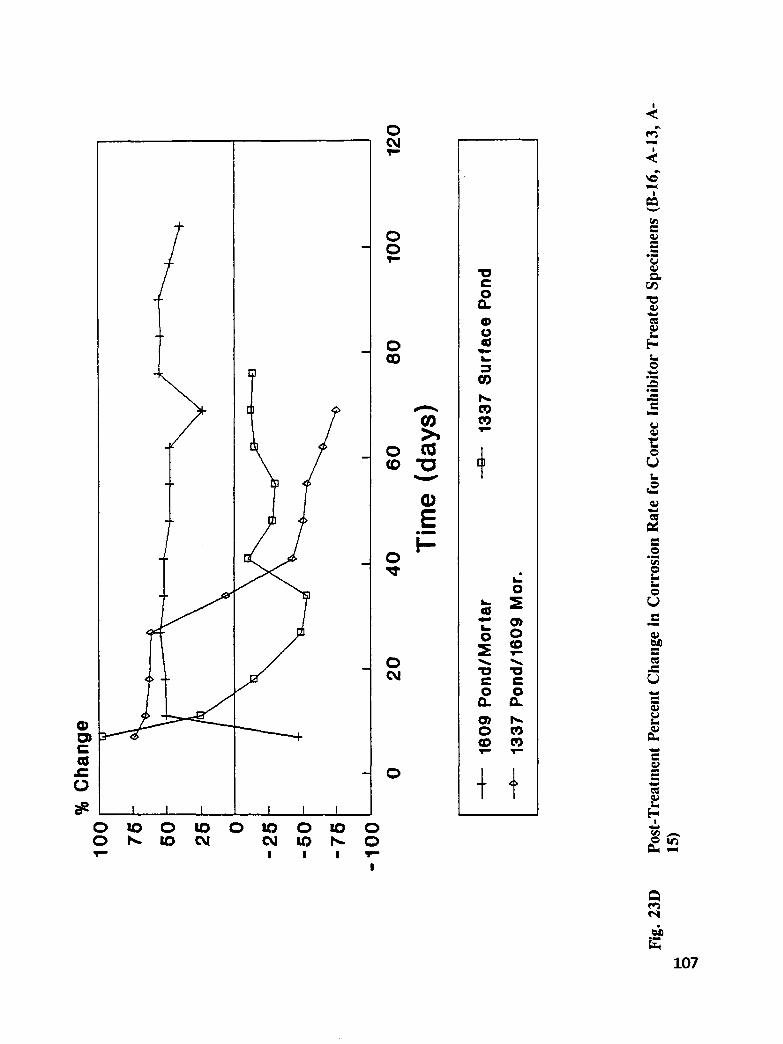
Transcript
SHRP-S-665
Concrete Bridge Protectionand Rehabilitation:
Chemical and Physical Techniques
Feasibility Studies of New Rehabilitation Techniques
John G. Dillard, James O. Glanville, William D. Collins,Richard E. Weyers and Imad L. AI-Qadi
Virginia Polytechnic Institute and State University
Strategic Highway Research ProgramNational Research Council
Washington, DC 1993
SHRP-S-665Contract C- 103
Program Manager: Don M. HarriottProject Manager: Joseph F. LamondProduction Editor: Marsha Barrett
Strategic Highway Research ProgramNational Academy of Sciences2101 Constitution Avenue N.W.
Washington, DC 20418
(202) 334-3774
The publication of this report does not necessarily indicate approval or endorsement of the findings, opinions,conclusions, or recommendations either inferred or specifically expressed herein by the National Academy ofSciences, the United States Government, or the American Association of State Highway and TransportationOfficials or its member states.
The research described herein was supported by the Strategic Highway Research Program(SHRP). SHRP is a unit of the National Research Council that was authorized by section128 of the Surface Transportation and Uniform Relocation Assistance Act of 1987.
We wish to acknowledge the help of the SHRP coordinators, and maintenance and materialengineers at the state transportation departments who graciously assisted us in the fieldinstallations of the experimental corrosion abatement techniques which make up the basisfor this study, especially Washington, Minnesota, New York and Pennsylvania.
1. Background ............................................ 5Corrosion of Steel Reinforcement in Concrete ....................... 6Factors Affecting Corrosion in Reinforced Concrete .................... 7Inhibitor Use in Reinforced Concrete ............................. 8
2. Part I: Evaluation of Feasible Corrosion Inhibitor Treatments ............ 11Introduction ........................................... 11
Research Approach ....................................... 11Experimental Program ..................................... 12
Rebar Source, Surface Preparation, and Test Solutions ............. 12Rapid Screening Test Development ........................ 12Surface Characterization of Rebar and Its Interaction with Inhibito ..... 13
Migration of Corrosion Inhibitors Through Mortar ............... 15Electrochemical Studies of the Effect of Inhibitors on ReinforcingSteel Corrosion ..................................... 16
Results and Discussion .................................... 19
Rebar Cleaning and Sample Preparation ...................... 19Rapid Screening Test ................................. 20Selection and Performance of the Corrosion Inhibitors ............. 23
Summary and Observations ............................. 24Surface Characterization of Rebar and Its Interaction with Inhibitors ..... 24Sodium Nitrite ..................................... 26
Dequests ......................................... 33Summary and Observation .............................. 33
V
Migration of Corrosion Inhibitors Through Concrete .............. 34Summary and Observation .............................. 42Electrochemical Studies of the Effect of Inhibitors on ReinforcingSteel Corrosion ..................................... 42
Comparison of Visual Inspection and Surface Analysis ............ 56Summary and Observation .............................. 56Recommendations ................................... 56
3. Part II: Development of Feasible Corrosion Inhibitor and Chloride ScavagingTreatments ............................................ 61Introduction ........................................... 61
Research Objective and Approach ........... _ .................. 62Experimental Program ..................................... 63
Fig. 1. Schematic diagram of the solution penetration-aspirator apparatus and concretedisk ............................................ 17
Fig. 2. Oxygen ls Photoelectrion Spectra ......................... 30
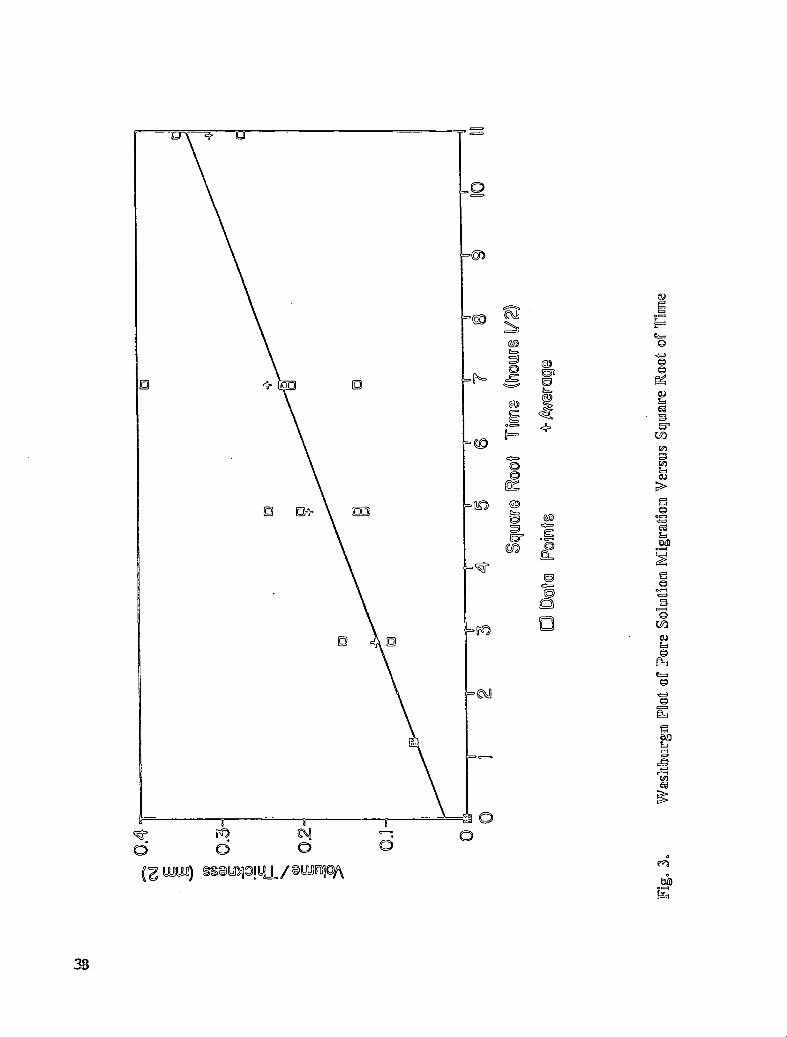
Fig. 3. Washburn Plot of Pore Solution Migration Versus Square Root ofTime .................... . ...................... 38
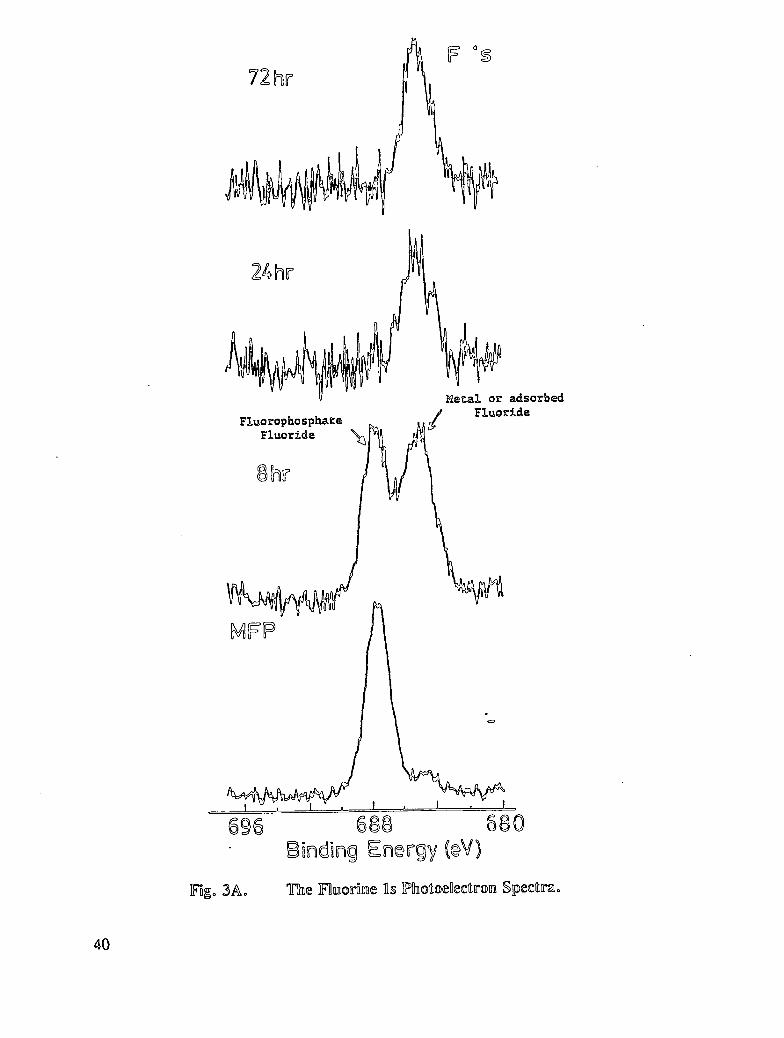
Fig. 3A. The fluorine ls Photoelectron Spectra ....................... 40
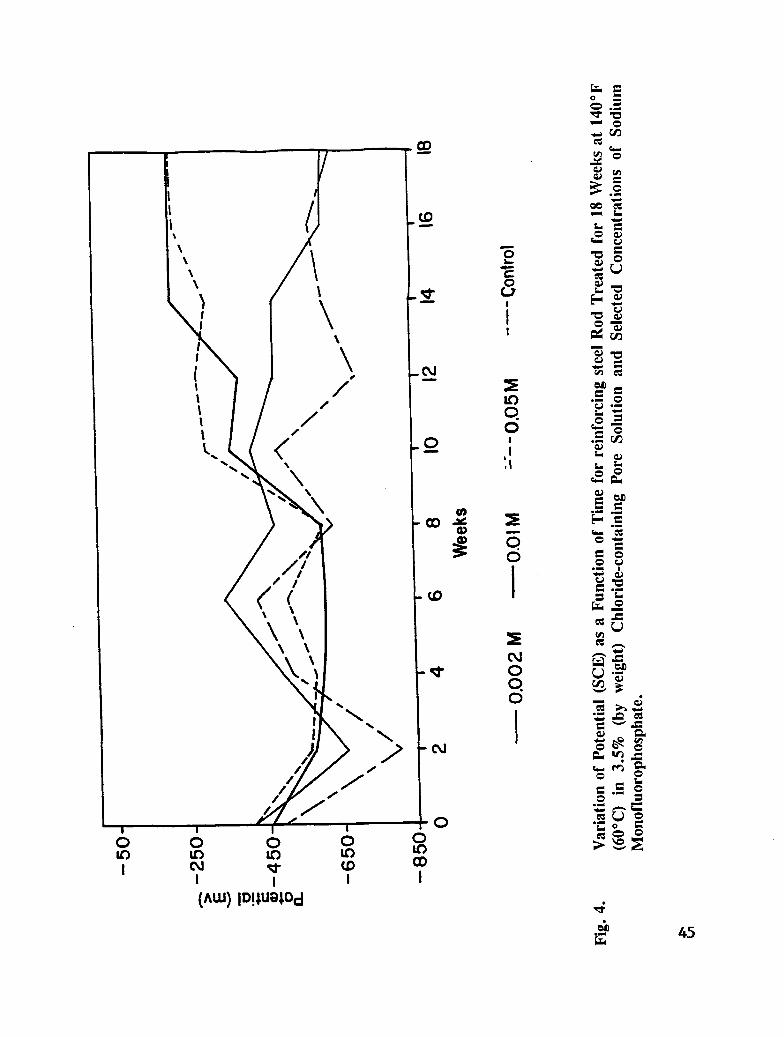
Fig. 4. Variation of Potential (SCE) as a Function of Time for Rebar Rod Treated for18 Weeks at 140°F (60°C) in 3.5% (by weigh0 Chloride-containing PoreSolution and Selected Concentrations of Sodium Monofluorophosphate. . . 45
Fig. 5. Variation of Potential (SCE) as a.Function of Time for Rebar Rod Treated for18 Weeks at 140°F (600C) in 3.5% (by weight) Chloride-containing PoreSolution and Selected Concentrations of Sodium Nitrite ............. 46
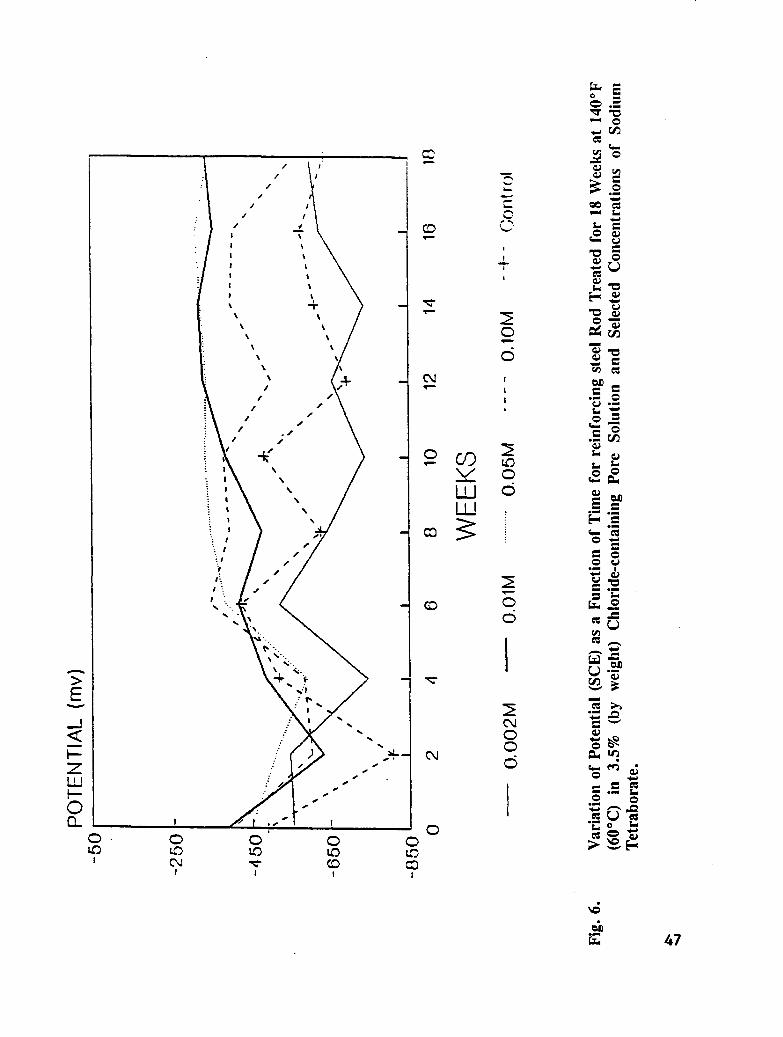
Fig. 6. Variation of Potential (SCE) as a Function of Time for Rebar Rod Treated for18 Weeks at 140°F (60°C) in 3.5% (by weight) Chloride-containing PoreSolution and Selected Concentrations of Sodium Tetraborate .......... 47
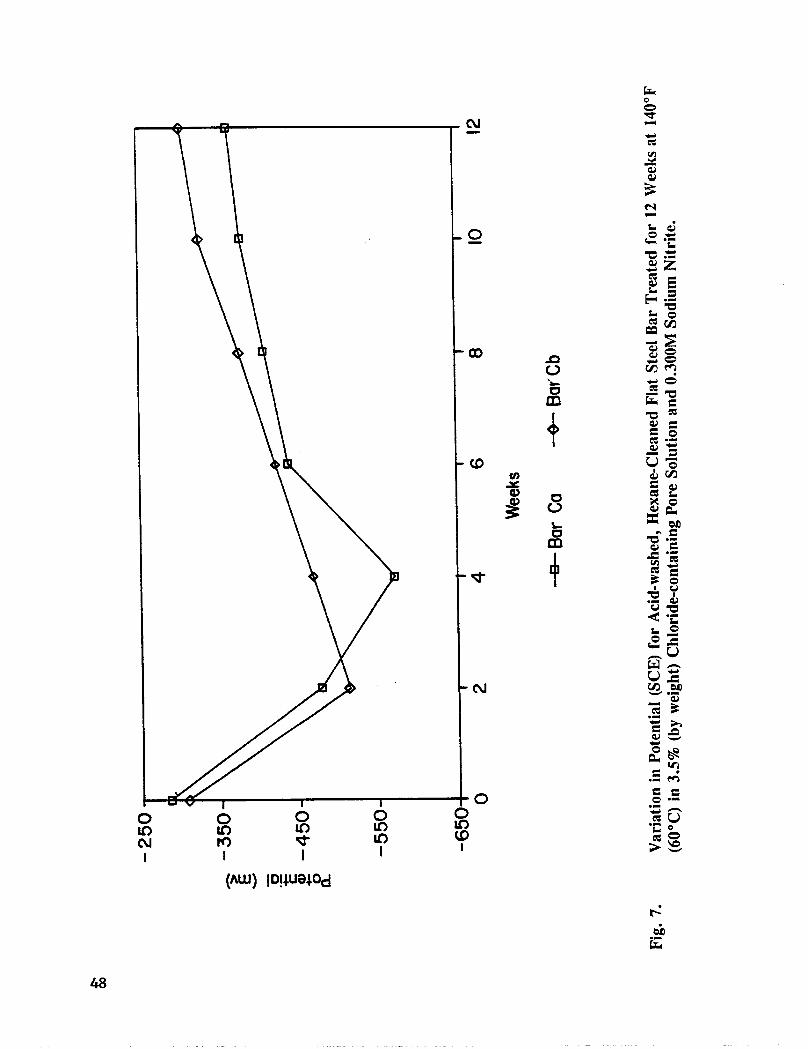
Fig. 7. Variation in Potential (SCE) for acid-washed, Hexane Cleaned Flat Steel BarTreated for 12 Weeks at 140°F (60°C) in 3.5% (by weight) Chloride-containing Pore Solution and 0.300M Sodium Nitrite .............. 48
0 Fig. 8. Variation in Potential (SCE) for acid-washed, Hexane Cleaned Flat RebarTreated for 12 Weeks at 140°F (60°C) in 3.5% (by weight) Chloride-containing Pore Solution and 0.670M Sodium Nitrite ............. 49
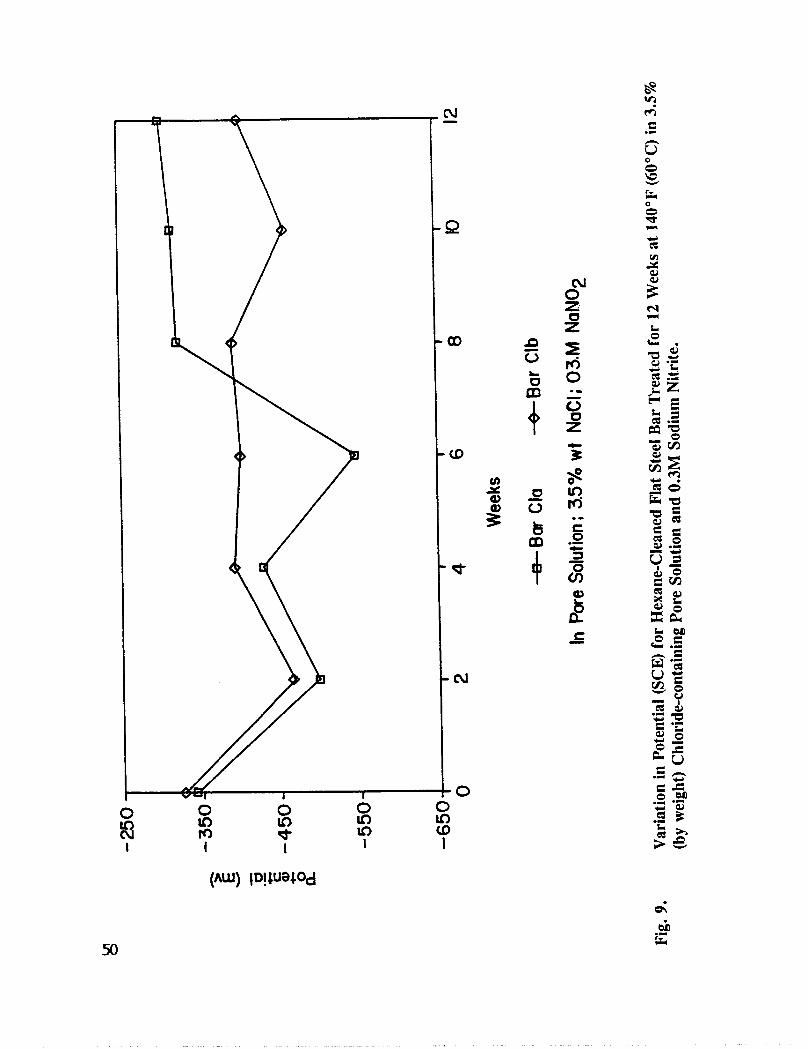
Fig. 9. Variation in Potential (SCE) for Hexane Cleaned Flat Rebar Treated for 12Weeks at 140°F (600C) in 3.5 % (by weight) Chloride-containing PoreSolution and 0.300M Sodium Nitrite ....................... 50
ix
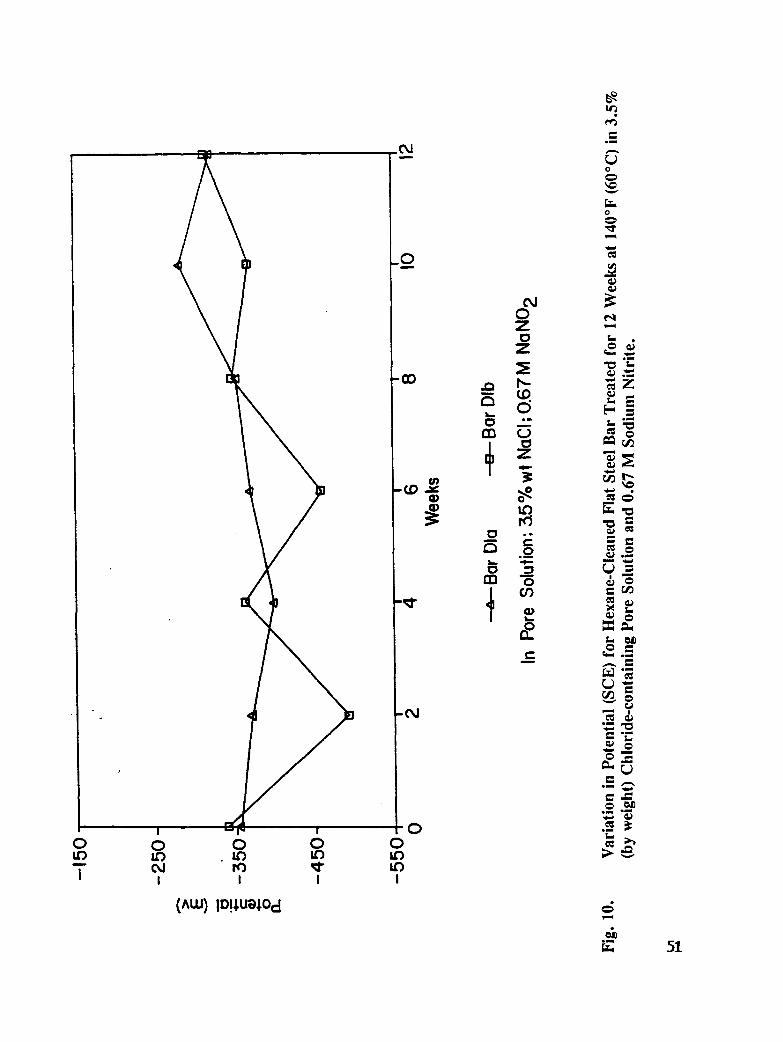
Fig. 10. Variation in Potential (SCE) for Hexane Cleaned Flat Rebar Treated for 12Weeks at 140°F (60°C) in 3.5% (by weight) Chloride-containing PoreSolution and 0.670M Sodium Nitrite ....................... 51
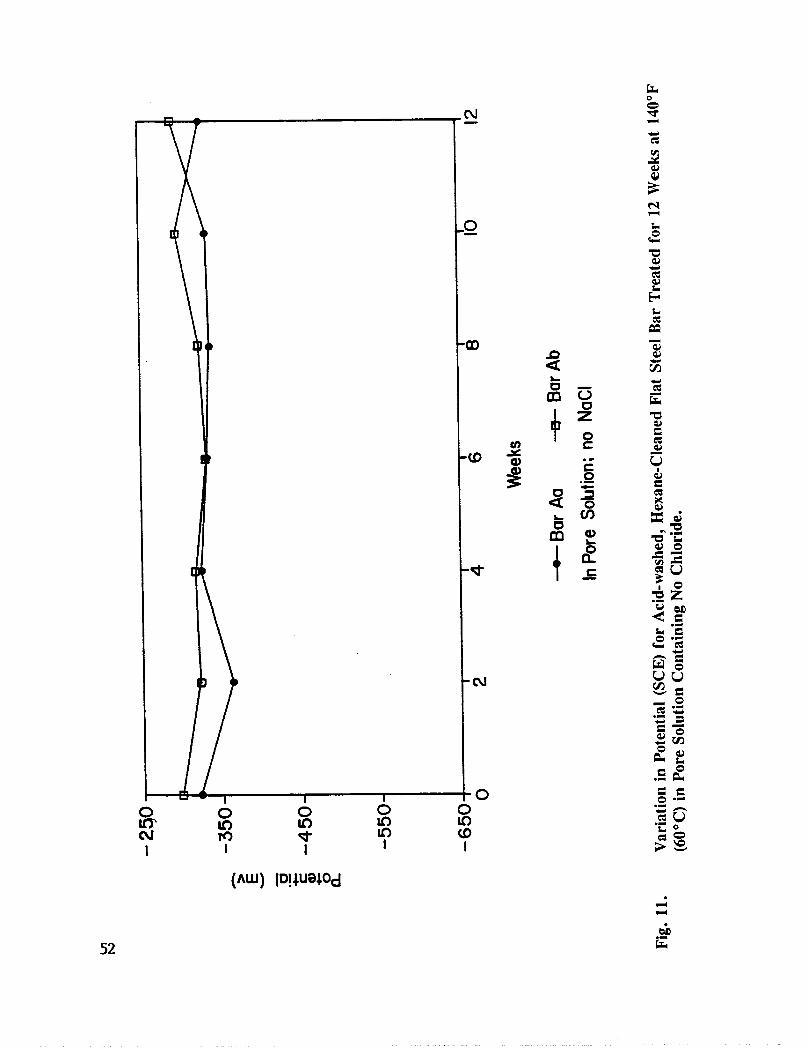
Fig. 11. Variation in Potential (SCE) for acid-washed, Hexane Cleaned Flat RebarTreated for 12 Weeks at 140°F (60°C) in Pore Solution Containing NoChloride ........................................ 52
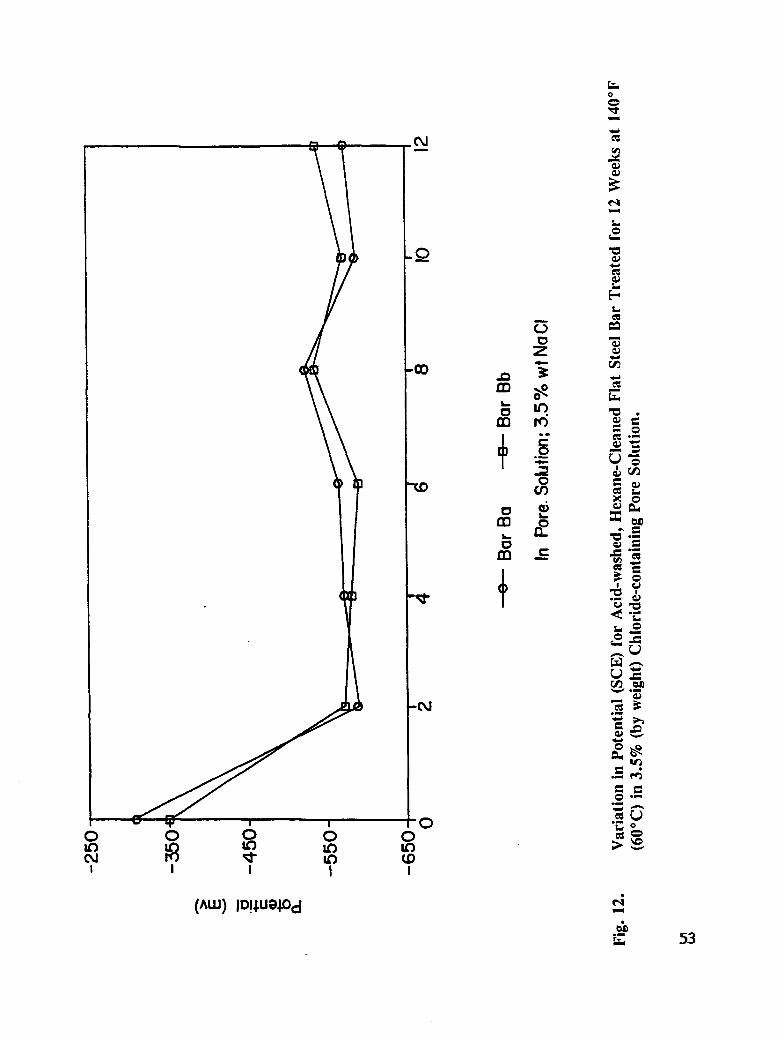
Fig. 12. Variation in Potential (SCE) for acid-washed, Hexane Cleaned Flat RebarTreated for 12 Weeks at 140°F (60°C) in 3.5% (by weight) Chloride-containing Pore Solution .............................. 53
Fig. 13. Variation in Potential (SCE) for Hexane Cleaned Flat Rebar Treated for 12Weeks at 140°F (60°C) in 3.5% (by weight) Chloride-containing PoreSolution ......................................... 54
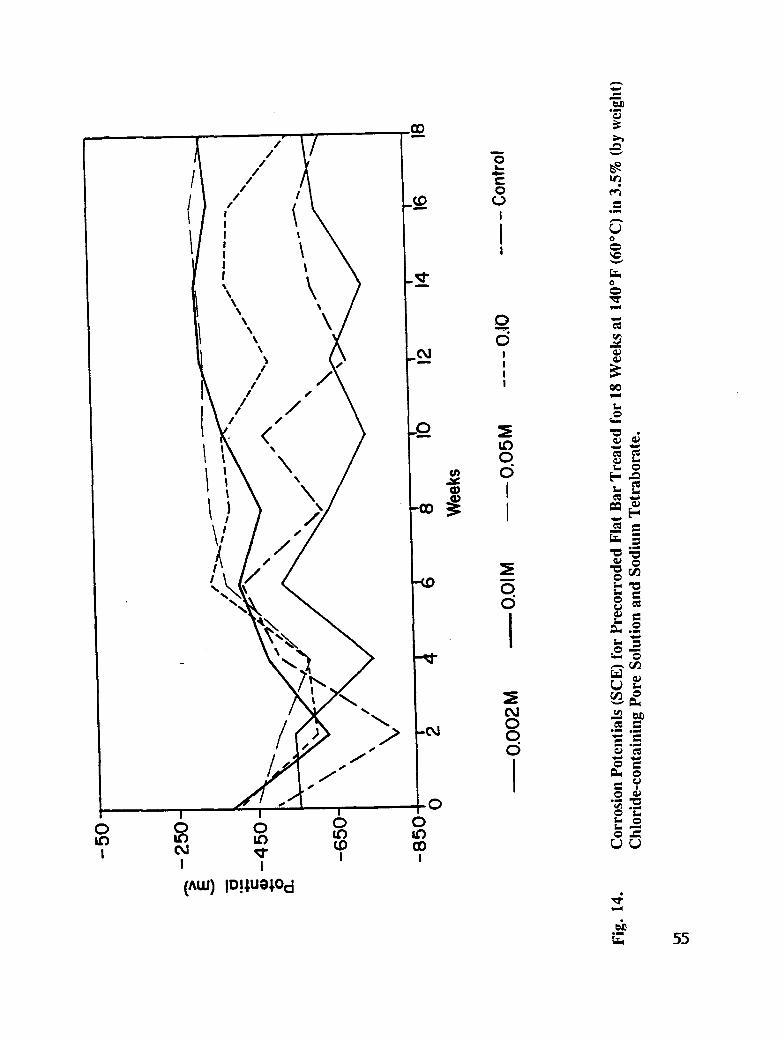
Fig. 14. Corrosion Potentials (SCE) for Pre-corroded Flat Bar Treated for 18 Weeks at140°F (60°C) in 3.5 % (by weight) Chloride-containing Pore solution andSodium Tetraborate ................................. 55
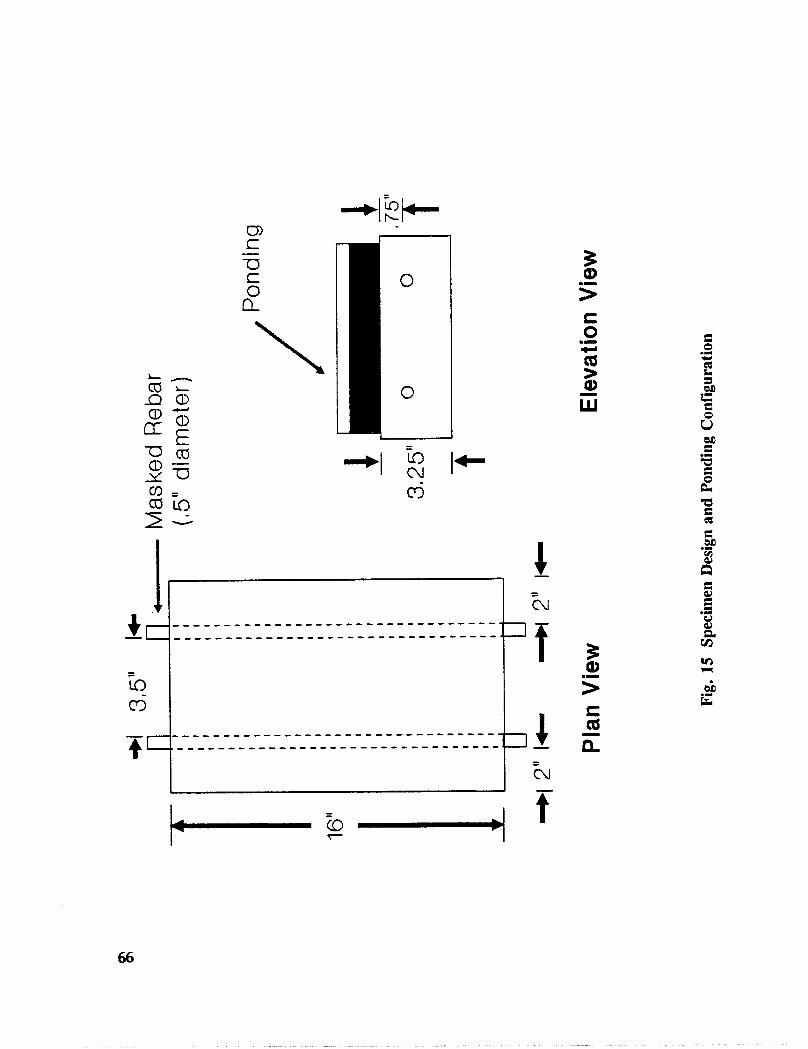
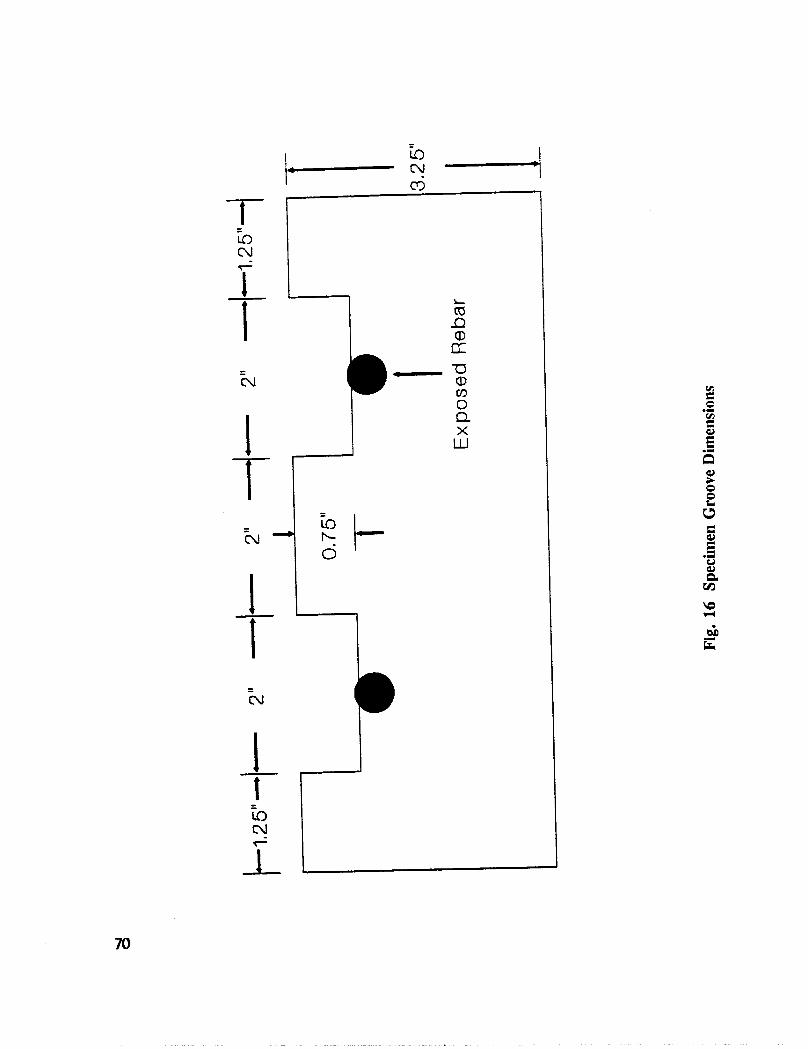
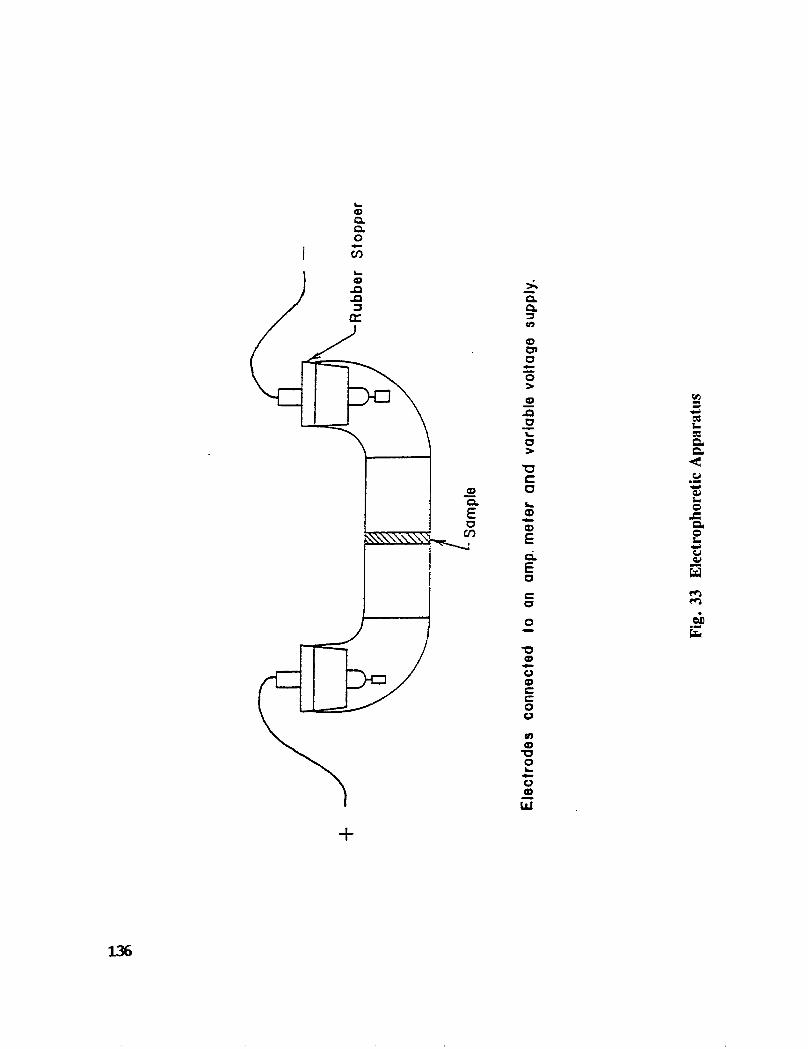
Fig. I5. Specimen Design and Ponding Configuration ................. 66
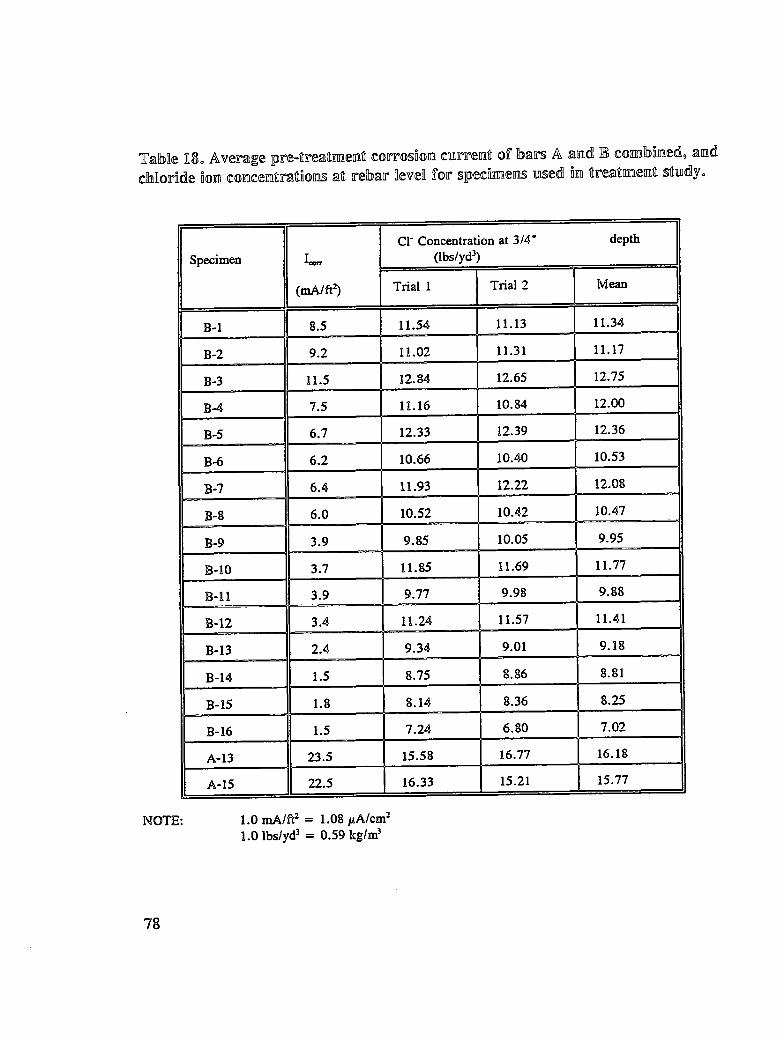
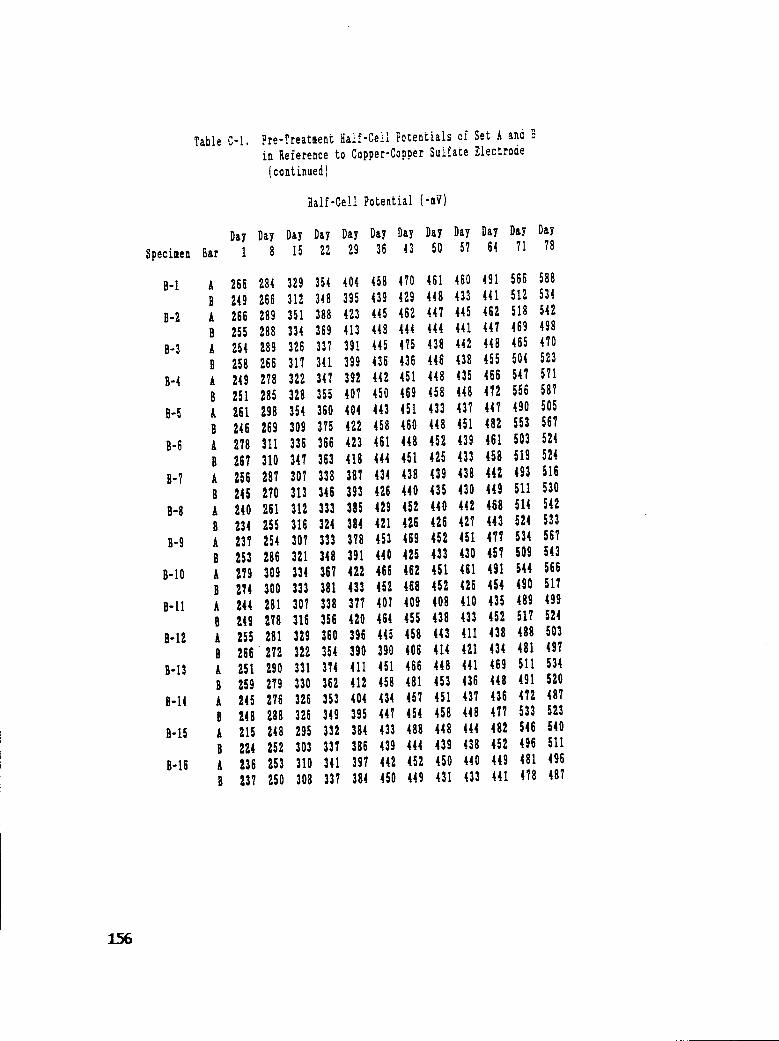
Table 18. Average pre-treatment corrosion current of bar A and B combined, andchloride ion concentrations at rebar level for specimens used intreatment study .................................... 78
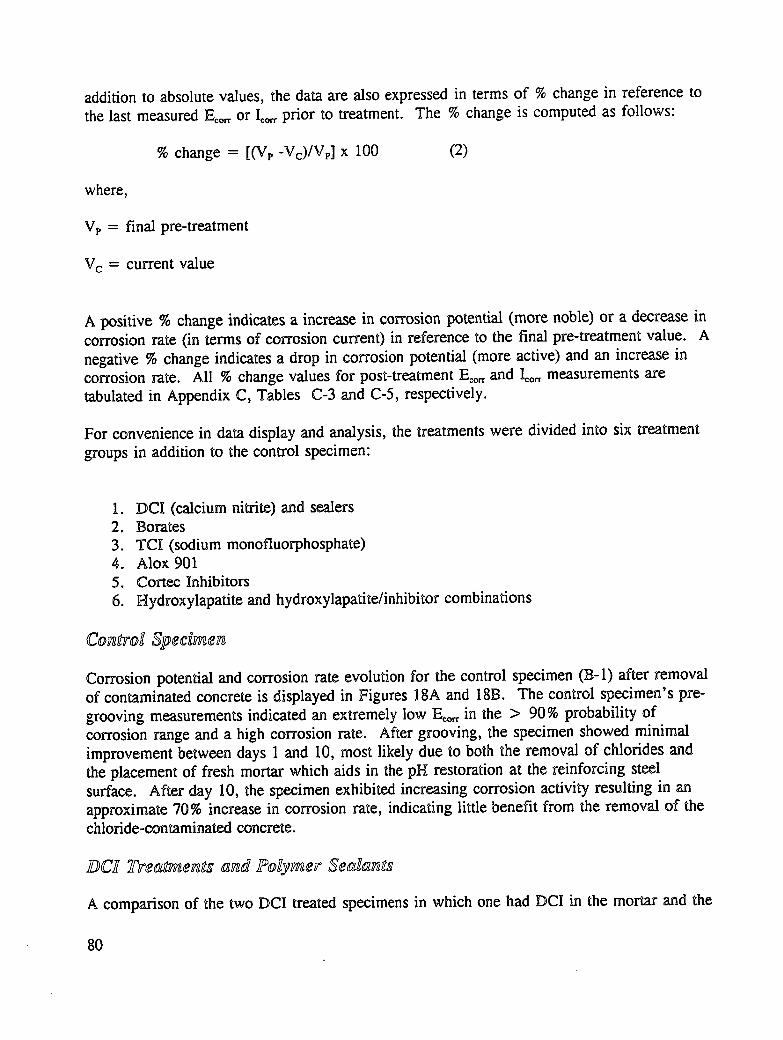
Table 19. One-way analysis of I_.,, variance between Bars A and B in eachspecimen at an a=0.05 level ............................ 81
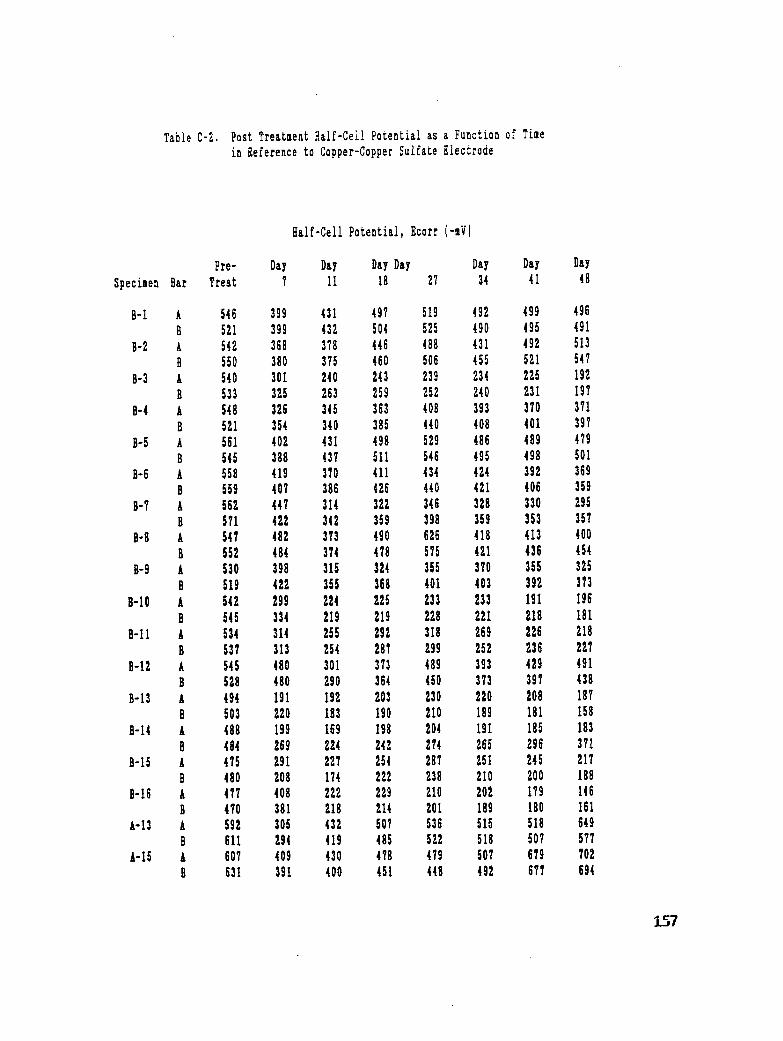
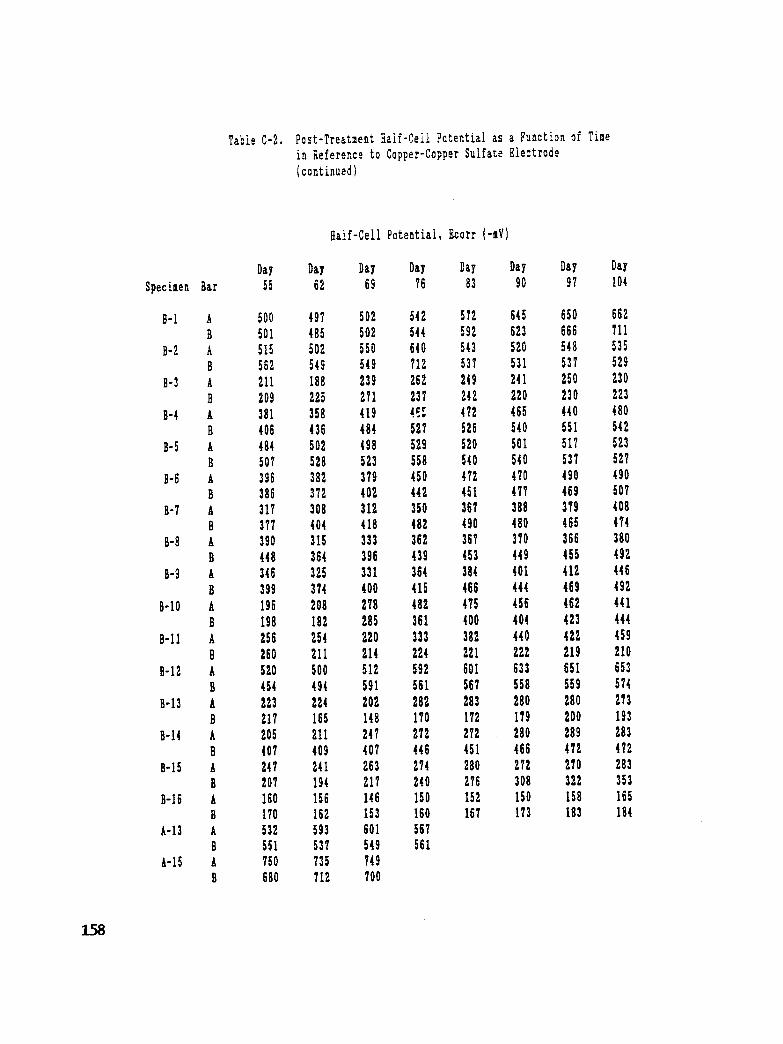
Table C-2. Post Treatment Half-Cell Potential as a Function of Time in Reference
xiv
to Copper-Copper Sulfate Electrode ...................... 157
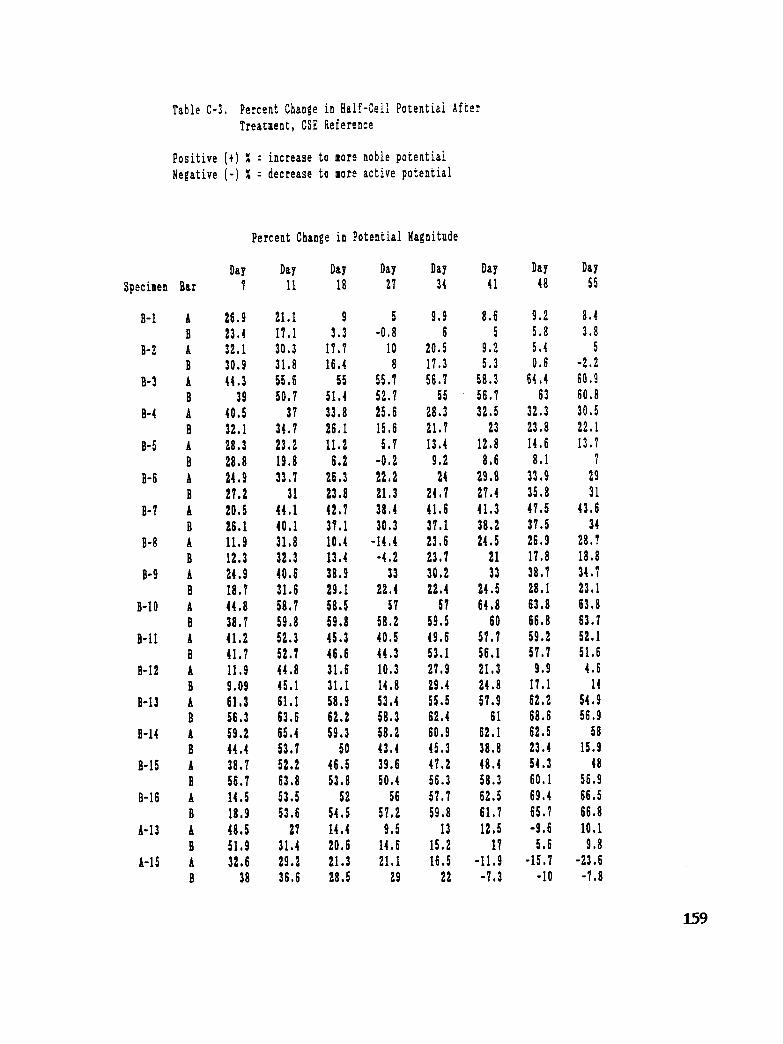
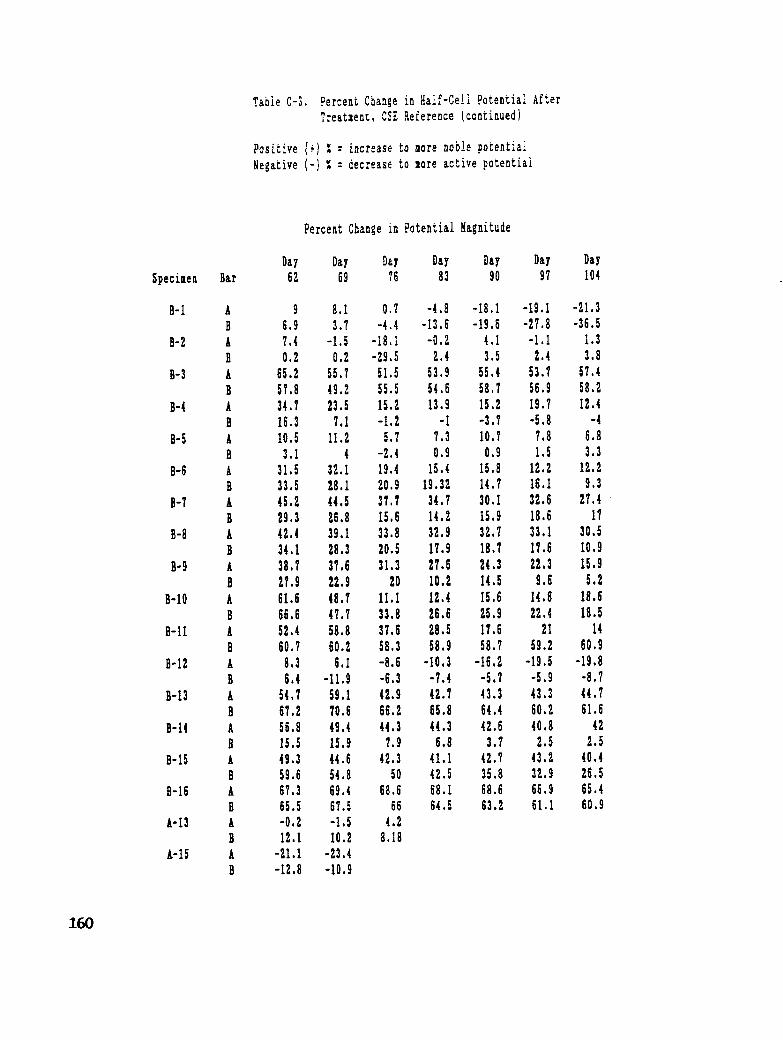
Table C-3. Percent Change in Half-Cell Potential After Treatment, CSE Reference 159
Table C-4. Post-Treatment Corrosion Current as a Function of Time ......... 161
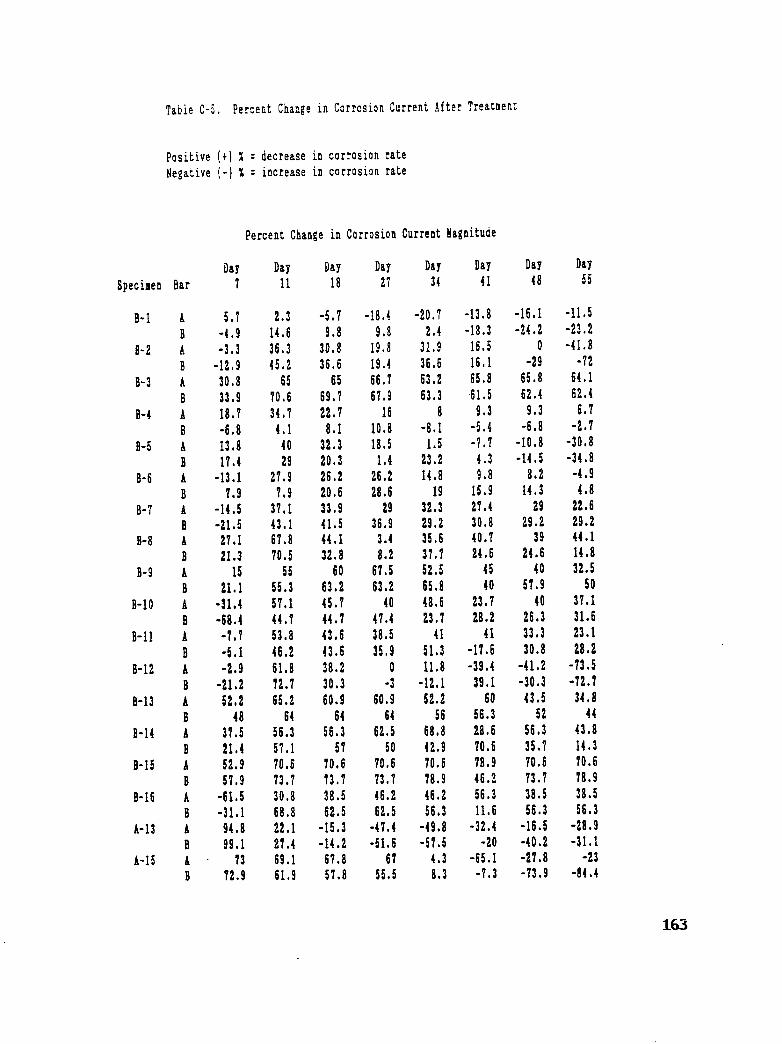
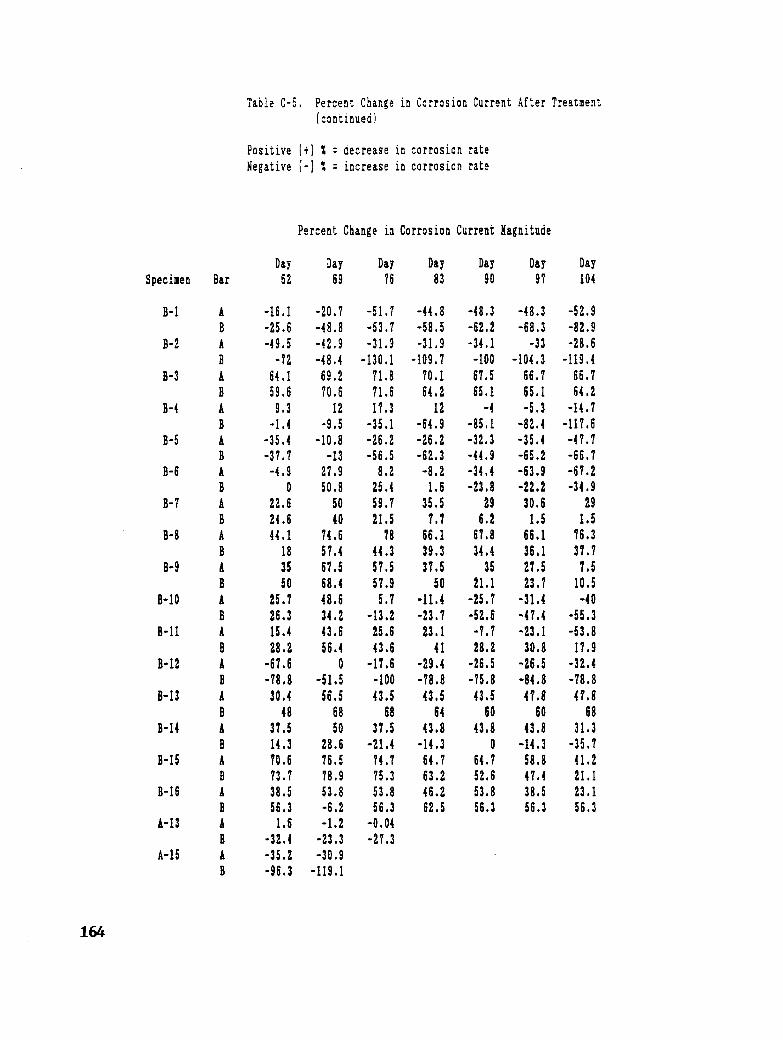
Table C-5. Percent Change in Corrosion Current After Treatment ........... 163
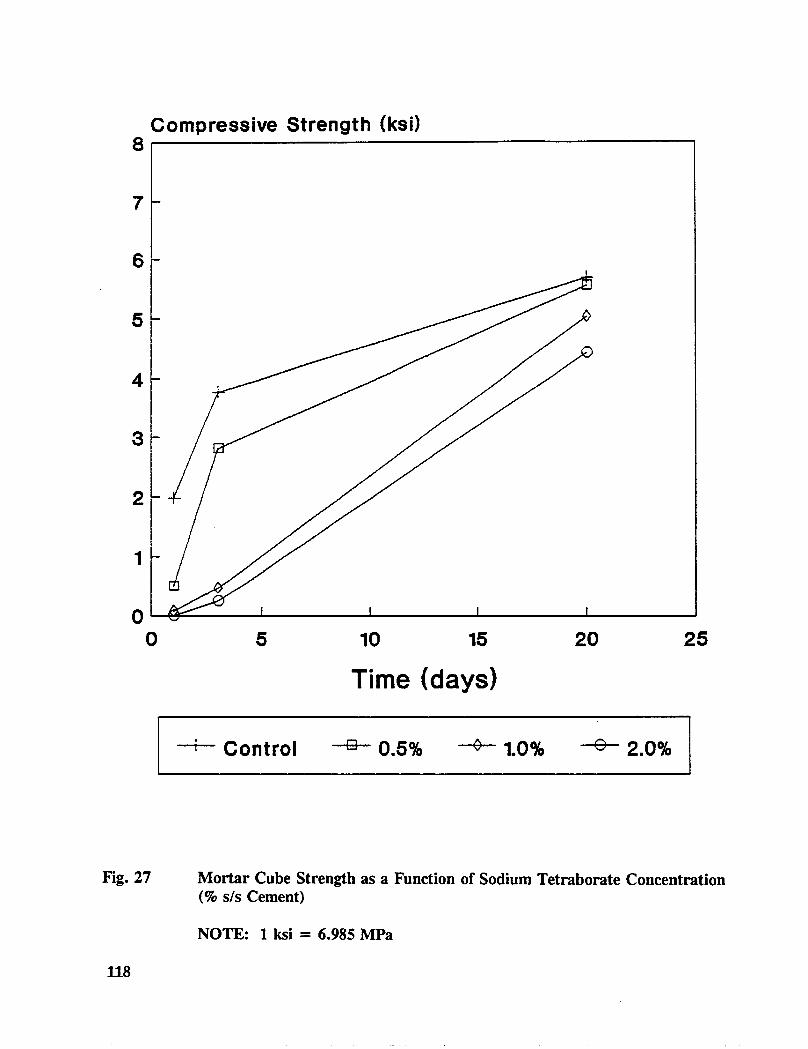
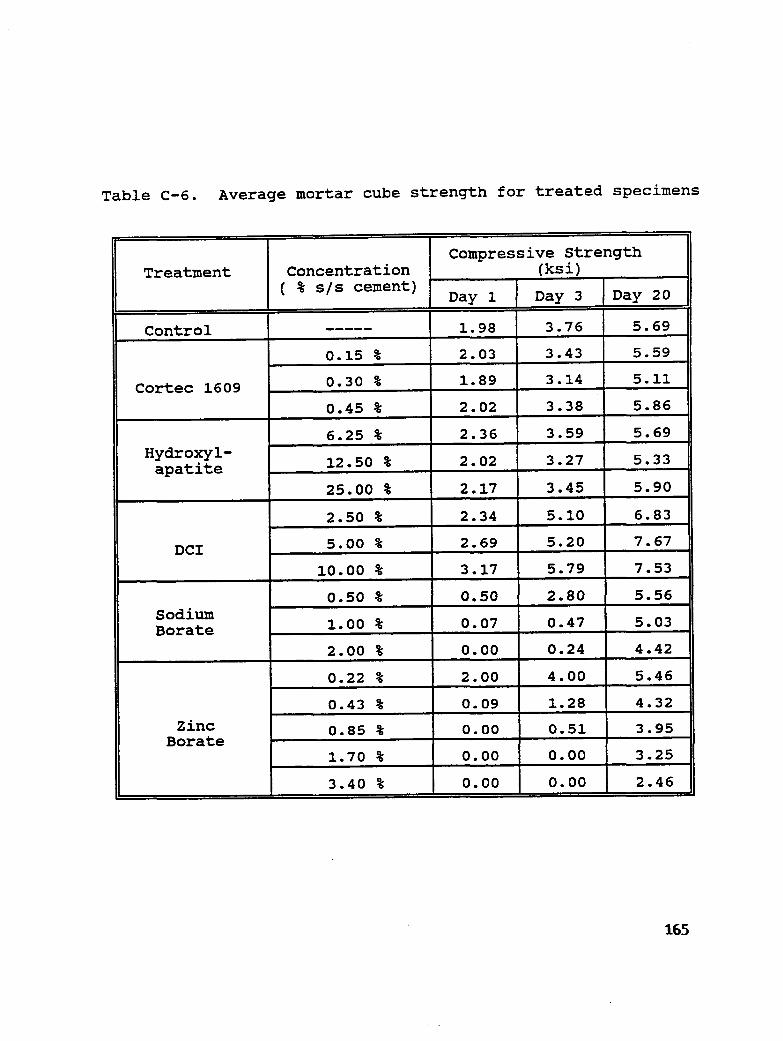
Table C-6. Average mortar cube strength for treated specimens ............ 165
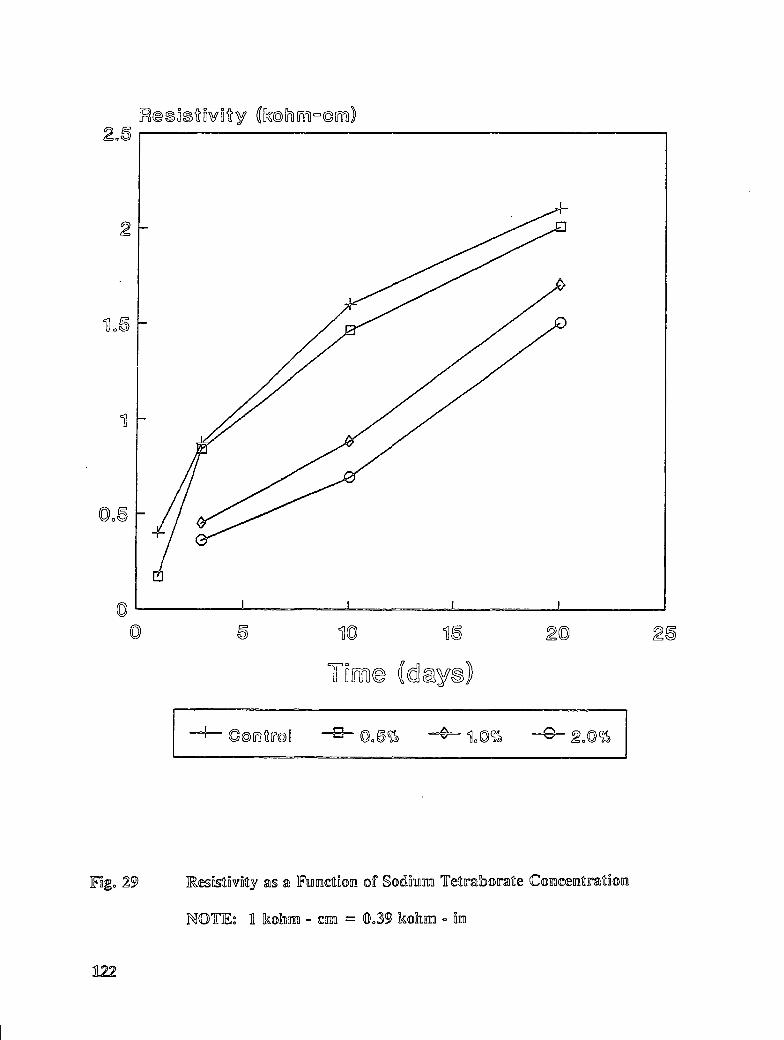
Table C-7. Average mortar cube resistivity for treated specimens ........... 166
XV
Abstract
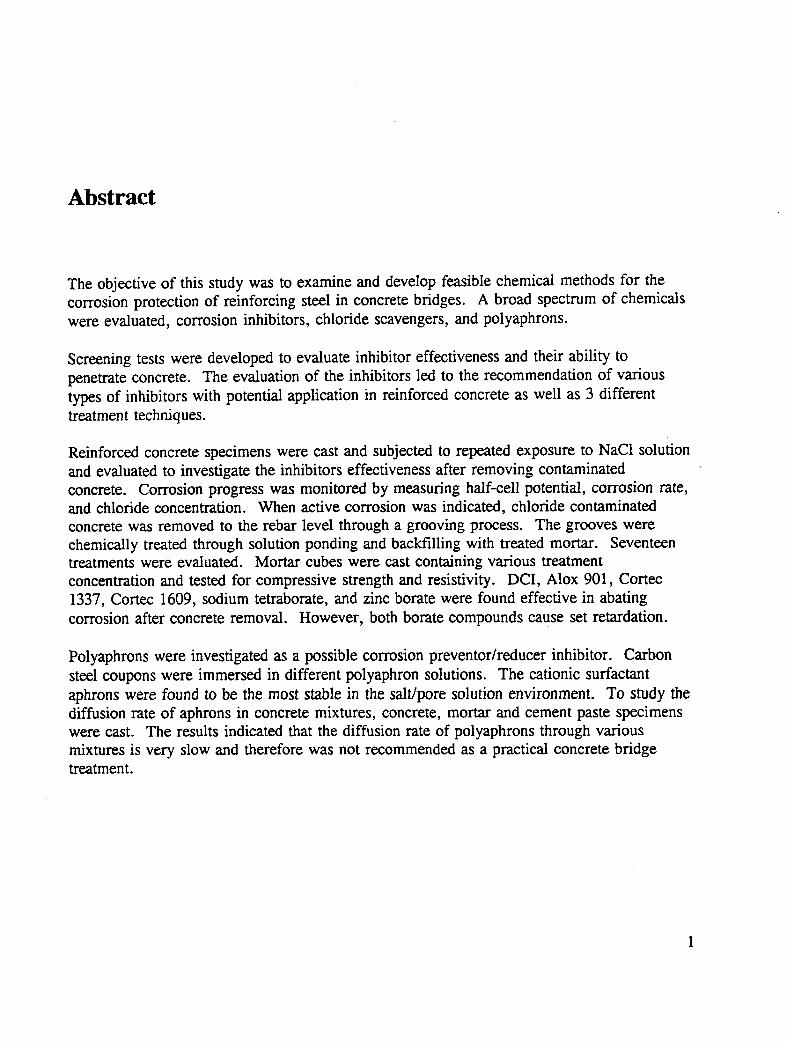
The objective of this study was to examine and develop feasible chemical methods for thecorrosion protection of reinforcing steel in concrete bridges. A broad spectrum of chemicalswere evaluated, corrosion inhibitors, chloride scavengers, and polyaphrons.
Screening tests were developed to evaluate inhibitor effectiveness and their ability topenetrate concrete. The evaluation of the inhibitors led to the recommendation of varioustypes of inhibitors with potential application in reinforced concrete as well as 3 differenttreatment techniques.
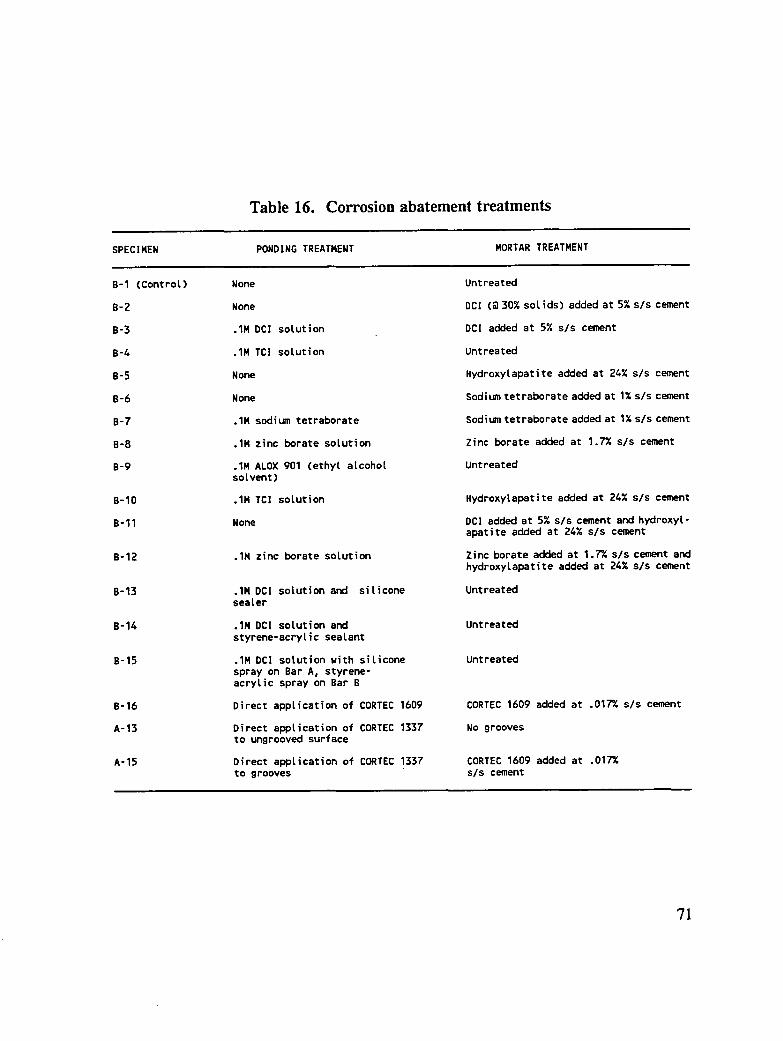
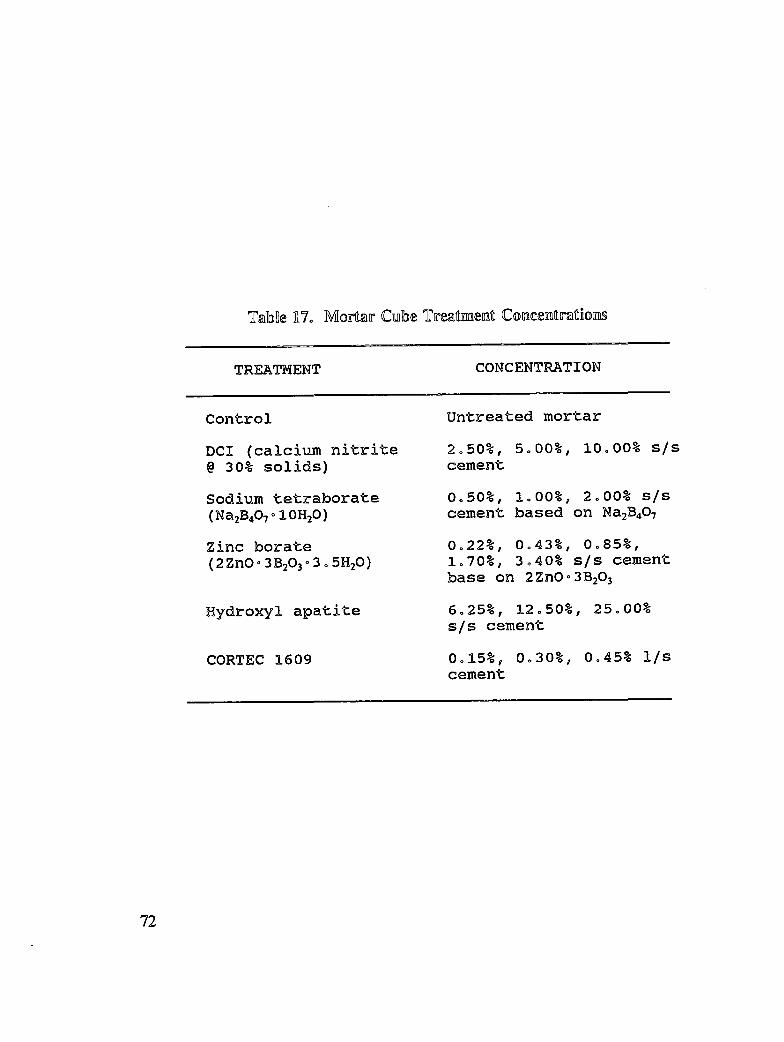
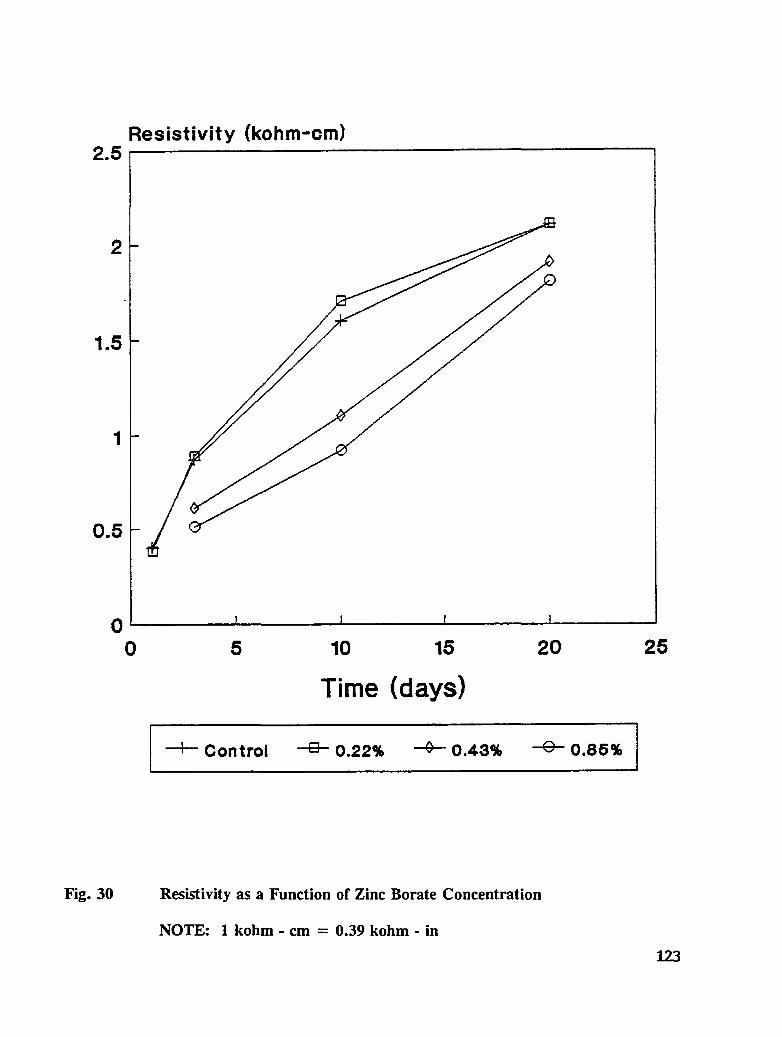
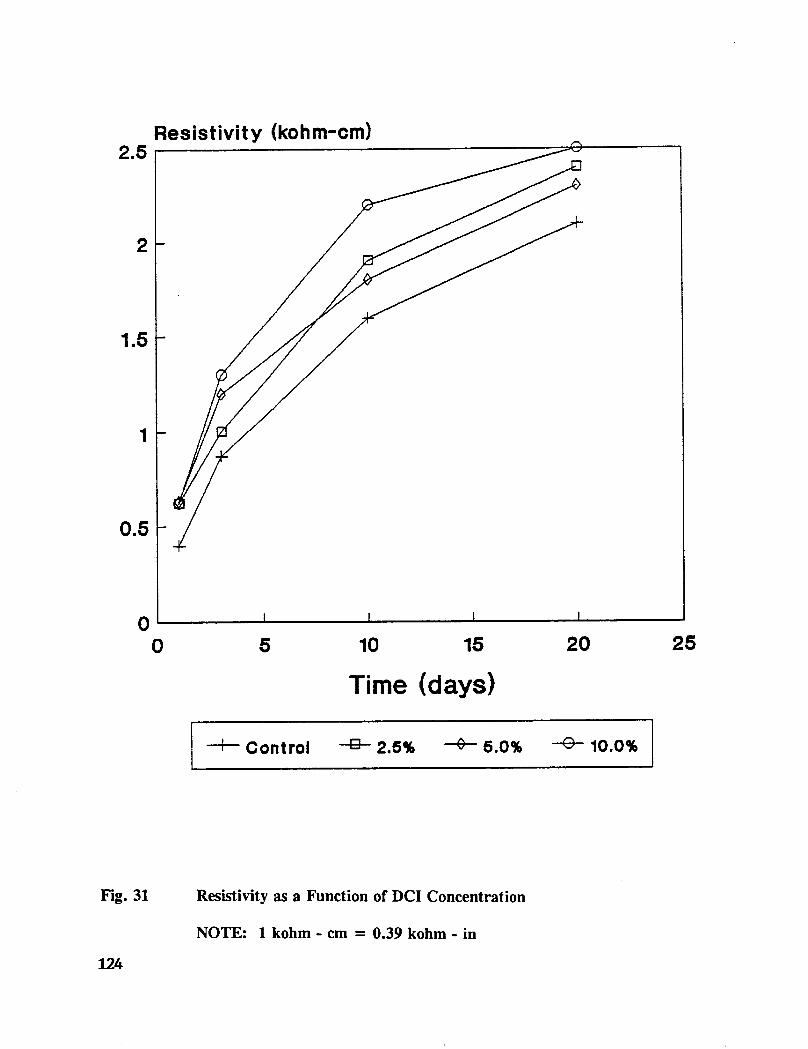
Reinforced concrete specimens were cast and subjected to repeated exposure to NaC1 solutionand evaluated to investigate the inhibitors effectiveness after removing contaminatedconcrete. Corrosion progress was monitored by measuring half-cell potential, corrosion rate,and chloride concentration. When active corrosion was indicated, chloride contaminatedconcrete was removed to the rebar level through a grooving process. The grooves werechemically treated through solution ponding and backfilling with treated mortar. Seventeentreatments were evaluated. Mortar cubes were cast containing various treatmentconcentration and tested for compressive strength and resistivity. DCI, Alox 901, Cortec1337, Cortec 1609, sodium tetraborate, and zinc borate were found effective in abatingcorrosion after concrete removal. However, both borate compounds cause set retardation.
Polyaphrons were investigated as a possible corrosion preventor/reducer inhibitor. Carbonsteel coupons were immersed in different polyaphron solutions. The cationic surfactantaphrons were found to be the most stable in the salt/pore solution environment. To study thediffusion rate of aphrons in concrete mixtures, concrete, mortar and cement paste specimenswere cast. The results indicated that the diffusion rate of polyaphrons through variousmixtures is very slow and therefore was not recommended as a practical concrete bridgetreatment.
Executive Summary
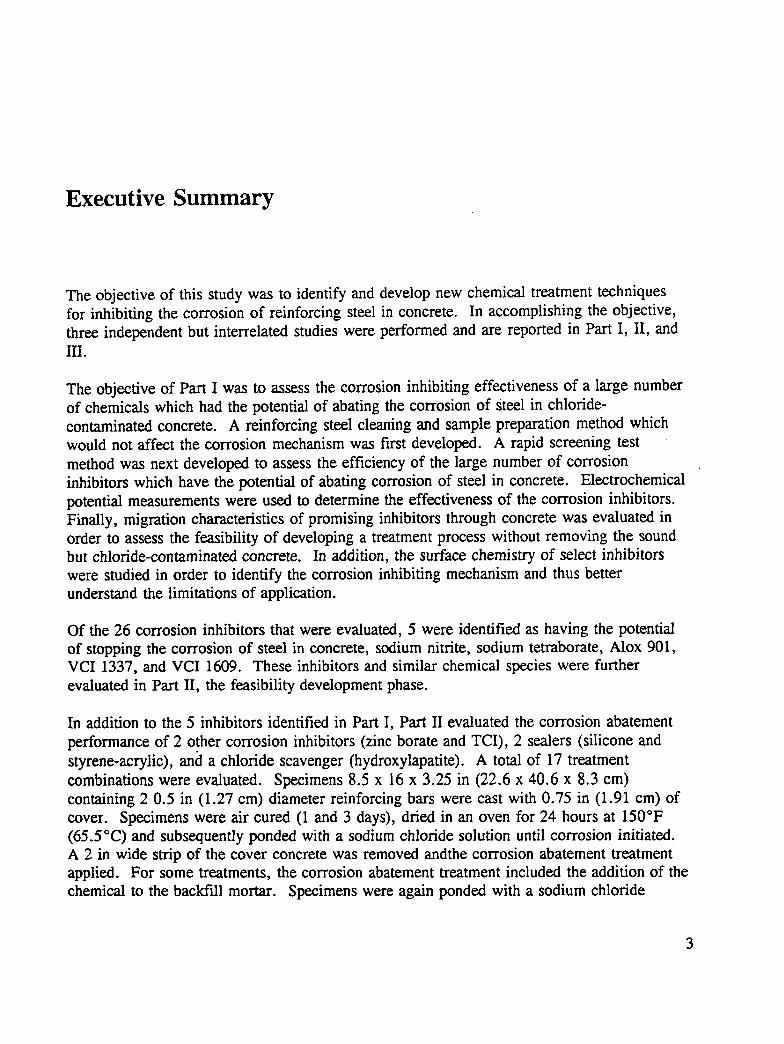
The objective of this study was to identify and develop new chemical treatment techniquesfor inhibiting the corrosion of reinforcing steel in concrete. In accomplishing the objective,three independent but interrelated studies were performed and are reported in Part I, II, andIII.
The objective of Part I was to assess the corrosion inhibiting effectiveness of a large numberof chemicals which had the potential of abating the corrosion of steel in chloride-contaminated concrete. A reinforcing steel cleaning and sample preparation method whichwould not affect the corrosion mechanism was first developed. A rapid screening test
method was next developed to assess the efficiency of the large number of corrosioninhibitors which have the potential of abating corrosion of steel in concrete. Electrochemicalpotential measurements were used to determine the effectiveness of the corrosion inhibitors.Finally, migration characteristics of promising inhibitors through concrete was evaluated inorder to assess the feasibility of developing a treatment process without removing the soundbut chloride-contaminated concrete. In addition, the surface chemistry of select inhibitorswere studied in order to identify the corrosion inhibiting mechanism and thus betterunderstand the limitations of application.
Of the 26 corrosion inhibitors that were evaluated, 5 were identified as having the potentialof stopping the corrosion of steel in concrete, sodium nitrite, sodium tetraborate, Alox 901,VCI 1337, and VCI 1609. These inhibitors and similar chemical species were furtherevaluated in Part II, the feasibility development phase.
In addition to the 5 inhibitors identified in Part I, Part II evaluated the corrosion abatementperformance of 2 other corrosion inhibitors (zinc borate and TCI), 2 sealers (silicone andstyrene-acrylic), and a chloride scavenger (hydroxylapatite). A total of 17 treatmentcombinations were evaluated. Specimens 8.5 x 16 x 3.25 in (22.6 x 40.6 x 8.3 cm)containing 2 0.5 in (1.27 cm) diameter reinforcing bars were cast with 0.75 in (1.91 era) ofcover. Specimens were air cured (1 and 3 days), dried in an oven for 24 hours at 150°F(65.5°C) and subsequently ponded with a sodium chloride solution until corrosion initiated.A 2 in wide strip of the cover concrete was removed andthe corrosion abatement treatmentapplied. For some treatments, the corrosion abatement treatment included the addition of thechemical to the backfill mortar. Specimens were again ponded with a sodium chloride
solution after the groove backfilled mortar was moist cured for 7 days. Corrosion abatementeffectiveness was assessed by monitoring the corrosion potential and the corrosion currentdensity. Five corrosion inhibitors were identified as being effective in chloride contaminatedconcrete. Field treatment processes using the 5 inhibitors were further developed andcorrosion abatement performance further evaluated in Task 5 of this study, Concrete BridgeProtection and Rehabilitation: Chemical and Physical Techniques, Corrosion ProtectionSystems.
Part III of this report addresses the use of polyaphrons as a corrosion inhibitor carrier to stopthe corrosion of steel in chloride-contaminated concrete. Migration studies using electricalpotential as the driving force demonstrated that the migration rate was too slow for practicaluse.
4
1
Background
According to conservative estimates, one-half of all highway bridges in the United States(1,2) are deteriorating from chloride induced corrosion of the reinforcing steel. A similarsituation prevails in the United Kingdom (3). Reinforcing steel corrosion in bridges is anoutcome of the repeated wintertime application of deicing salts such as sodium chloride andcalcium chloride (4,5). Chloride destroys the reinforcing steel passive layer and formscorrosion products, which occupy a greater physical volume. The resulting internalexpansion causes cracking and spalling of the concrete cover. Once cracking has occurredconditions deteriorate rapidly. The principal factors that must be controlled to inhibitcorrosion include oxygen, chloride ions, water, and the pH of the concrete. Approaches tocontrol these factors have used inhibitors, electrochemical protection procedures, scavengers,buffers, and coatings (6-10).
The use of corrosion-inhibitors is one approach to prevent or reduce the corrosion of steel.Most corrosion inhibitors for steel are used in acidic or neutral conditions where uninhibited
attack may be very rapid; by comparison, corrosion of steel under the alkaline conditions inconcrete is very slow. However, because even slow corrosion can cause significant damageduring the long life required of reinforced concrete bridges, concrete inhibitors do have arole to play (11). At least one corrosion inhibitor is currently commercially available.Calcium nitrite as a concrete admixture has been widely used during the past decade.Concrete containing calcium nitrite has considerable resistance to chloride induced corrosion(12,13).
The work reported here involved 3 tasks: 1) to search for substances (i) that could beapplied to existing, chloride-contaminated bridge components, (ii) that would penetrate the
i concrete, and (iii) that, on arrival at the reinforcing steel, would stop or inhibit corrosion; 2)to employ screening tests under laboratory conditions to test (i) inhibitor effectiveness and(ii) inhibitor penetration through concrete; and 3) to study the surface chemistry ofreinforcing steel following interaction with inhibitors. Such an inhibitor substance wouldpermit a relatively inexpensive treatment of reinforcing steel corrosion in existing
components without removing concrete.
Cosros_o_ e_ $teen _e_n_erceme_t _n Co_csete
Corrosion of steel in concrete occurs by an electrochemical reaction in which 2 of the anodicand cathodic reactions are:
Anodic reaction: Fe _ Fe_+ + 2e
Cathodic reaction: H20 + 1/205 + 2e --:,2OH (1)
The development of anodes and cathodes is due to the presence of heterogeneities in thecorrosion cell. Heterogeneities can exist at the surface of reinforcing steel due tometallurgical segregation, varying grain orientations, and local differences in the electrolyte,such as concentration gradients [14].
The spontaneous anodic steel corrosion reaction quickly stops in a highly alkaline mediumsuch as portland cement concrete, unless sufficient levels of chloride or other aggressiveagents are present. The steel is passivated by the high pH of the pore water solution. Thispassivation is due to the formation of a thin layer of gamma ion oxide (Fe203) that serves asa stable barrier to further metal dissolution. In the absence of chloride ions in solution, the
gamma iron oxide film on steel is reported to be stable at pH levels as low as 11.5 [16].
The two major causes of the destruction of the passive layer on steel reinforcing steel are thepresence of chloride ions in combination with oxygen and the decrease in the pH value of thepore solution caused by carbonation reactions which consume both calcium and sodiumhydroxides within the pore water solution. Carbonation, however, is not a major problemfor bridges because the penetration depth of carbonation is, in most cases, less than thereinforcement cover depth on decks. Concrete of a normal water/cement ratio is unlikely toshow carbonation beyond a depth of approximately 1/2 in. (1.27 era) even after prolongedweathering [16]. Reinforcement corrosion causes a decrease in bar diameter, cracking andspalling due to the expansive iron oxide products.
While the structure of the passive film formed in high pH environments and the mechanismof its deterioration by chloride ions is not fully understood, it is generally accepted that thechloride ions become incorporated in the passive film, displacing some of the oxygen presentand increasing both the passive film's solubility and conductivity.
Because there are imperfections in the passive film and an inhomogeneous distribution ofchloride ions along the reinforcing steel surface, the passive film layer breaks down on alocal scale, creating microgalvanic cells. The local areas of high chloride concentration andfilm imperfections act as anodic sites where the iron dissolution takes place, while theremaining passive areas serve as cathodes at which oxygen reduction occurs. In addition tochloride and oxygen availability, the rate of corrosion will also depend on the cathode/anode
6
ratio and the electrical resistivity of the concrete between the cells.
In the concrete surrounding the anode area, the concentration of positive iron ions increasesand the pH decreases; consequently the formation of the negative hydroxyl ions occurs at thecathodic sites. The decrease in pH at the local anodic sites allows for the formation of asoluble complex of iron chloride [14]. The iron-chloride complex forms by the reactions:
Fe €2C1--, Fe2+ + CI + 2e
Fe2+C12 + 2H20 _ Fe(OH)2 + 2H + + 2C1-
The soluble FeC12 complex can diffuse away from the anode, promoting further corrosion.When the complex diffuses away from the anode where both the pH and concentration ofdissolved oxygen are higher than the immediate anode area, the complex breaks down andiron hydroxide precipitates. This frees chloride ions which again react with ferrous ions atthe anodic sites. As long as there is sufficient oxygen and moisture, the corrosion process is
autocatalytic in nature and it continues without depleting the chloride. Should the solubleiron-chloride complex diffuse away from the steel-concrete interface and the iron oxidize in avoid, then no expansive forces are created. Only when the iron oxidizes at the concrete-steelinterface are expansive forces created and subsequent spalling occur.
Chlorides may be present in concrete from several different sources. They may beintroduced through unbound chloride-containing aggregate or by the addition of calciumchloride as a set accelerator. The predominant source of chlorides, however, is from theenvironment, including deicing salts and sea water. The transport of chlorides throughconcrete has both a primary and secondary mode. The primary mode of transport is chloridediffusion through the pore water solution in concrete. The secondary mode of transport ischloride penetration through cracks. Cracks may develop as a result of externally appliedloads, drying shrinkage, subsidence, or expansive stresses placed on the concrete from thevolume of corrosion products formed on embedded reinforcing steel.
Through diffusion and transport through cracks, a critical chloride threshold level is reachedat the concrete/steel interface at which corrosion begins. For reinforced concrete, a limitingor maximum allowable value of 0.4% CI/cement wt [17] and 1.2 lbs CI/yd 3 (0.71 kg/m 3)of concrete [18] have been determined. It has also been determined that a chloride ion tohydroxyl ion ratio greater than 0.6 C1/OH is needed to initiate corrosion [19].
Factors Affecting Corrosion in Reinforced Concrete
A number of factors play a role in the initiation and propagation of corrosion in reinforcedconcrete. The water/cement ratio and consolidation of the concrete, reinforcing steel cover
depth, and curing conditions can all be optimized to decrease the diffusion rate and increasethe time it takes for the chlorides to initiate corrosion.
7
The chloride ion can affect the corrosion reaction differently depending upon the cationassociated with it. The rate of corrosion in concrete mixed with calcium chloride has been
found to be greater than the rate in concrete mixed with sodium chloride. Although themechanism for this effect is not well understood, the difference in corrosion rates is partiallydue to calcium chloride's diffusivity which is 3 to 4 times that of sodium chloride [20].
An essential factor required for corrosion of steel in concrete is the presence of oxygen. Therate of oxygen diffusion through concrete is significantly affected by the extent to which theconcrete is saturated with water. Investigations have shown that conditions will beconducive to corrosion in those parts of a concrete structure that are exposed to periods ofintermittent wetting and drying, and the rate of steel corrosion will be slow if the concrete iscontinuously water-saturated [21]. In saturated concrete, dissolved oxygen will primarilydiffuse through the pore water, while in dry concrete, the diffusion of gaseous oxygen ismore rapid. However, in order to react at the cathode, the oxygen must be in a dissolvedform, therefore, corrosion is more active in reinforced structures that are partially dry orundergo intermittent wetting and drying.
Another factor of importance is the effect of concrete resistivity or electrical resistance on thecorrosion reaction. Resistivity is mainly controlled by water content, with oven-dry concretehaving a resistivity of 4 x l0 s 9-in (1 × 10⁹ _l-cm) and water saturated concrete on the orderof 4 x 10³ fl-in (1 x 10⁴ 9-era) [20]. When concrete is dry, the corrosion cell no longer hasthe electrolyte provided by the ion containing pore solution; therefore, lower moisturecontents reduce the ionic conduction in the concrete which reduces the corrosion rate.Admixtures can also affect the resistivity of concrete by contributing or binding ions, or
filling pores which reduces amount of electrolyte.
]I h b tor Use I e rnTreedl Co crete
There is no general theory of corrosion inhibition that applies to all situations because themechanism of inhibition varies depending upon the factors causing corrosion and the natureof the inhibitor. The fundamental concept of inhibition is the development of a stablecompound with the metal surface and the formation of an adsorption complex with the metaloxide.
Inhibitors are of three basic types: anodic, cathodic, and mixed. Anodic inhibitors functionby arresting the reaction at the anode. In ideal situations, they react with existing corrosionproducts to form a highly insoluble film that adheres tightly to the metal surface [22]. Thisfilm can act as a barrier to metal dissolution by preventing the metal surface from contactingthe corrosive electrolyte. Cathodic inhibitors function to reduce the cathodic reaction.However, cathodic inhibitors are less effective than anodic inhibitors because their reactiveproducts do not bond as well to the metal surface. A mixed inhibitor may be desired inmany cases because microcell corrosion is common in reinforcing steel. The microscopicdistances separating the anodic and cathodic areas that characterize microcell corrosion may
8
warrant the use of a mixed inhibitor since the anodic and cathodic sites cannot be isolated.The mixed inhibitor would affect both the anodic and cathodic reactions simultaneously.
Numerous chemical admixtures, both organic and inorganic, have been recommended as
specific inhibitors of steel corrosion. However, many of the admixtures have deleteriouseffects on concrete, such as set retardation. Some inorganic compounds which have beensuggested as inhibitors are stannous chloride, zinc and lead chromates, potassium dichromate,calcium hypophosphite, sodium nitrite, and calcium nitrite [23]. Organic inhibitors that havebeen recommended are sodium benzoate, ethyl aniline, and mercaptobenzothiazole [23].Calcium nitrite has been the most promising inhibitor used in the United States [24]. Sodiumnitrite, which is still used extensively in Europe, was used prior to the development ofcalcium nitrite, but it caused a number of deleterious effects, including low strength, erraticsetting times, efflorescence, and the increased probability of alkali-aggregate reaction [25].
One form of inhibitor that has received little attention for use in concrete is the scavenger.
Scavengers are substances that remove corrosive reagents from solution through bindingreactions. Most of the scavengers used in corrosive environments act as scavengers ofdissolved oxygen and aqueous solutions. Substances such as sodium sulfite and hydrazinereact with dissolved oxygen to form reaction products that do not contribute to the corrosionprocess. Unfortunately, these scavengers show little promise for concrete due to thenormally unlimited supply of oxygen. Added to concrete, these substances would be quicklydepleted of their scavenging ability. Although scavengers are not currently used inreinforced concrete, interest exists in finding or developing substances to bind chloride ionsin reinforced concrete.
Inhibitors were originally used as admixtures in fresh concrete to prevent future corrosion.However, inhibitors may be applied through impregnation and diffusion through the surfaceof the concrete in existing chloride-contaminated structures.
9
2
PART I: Evaluation of Feasible Corrosion InhibitorTreatments
Introduction
The principal objectives of this work were 1) to develop a rapid, inexpensive screening testto evaluate potential corrosion-inhibiting agents for reinforcing steel in concrete, 2) toexamine chemical surface changes of reinforcing steel following treatment with inhibitorswith the intent of developing a rapid, surface-sensitive qualification scheme for potentialinhibitors, 3) to assess the relative mobility of inhibitors through concrete in the effort topredict the rate at which an inhibitor could be delivered to reinforcing steel in concrete, and4) to evaluate electrochemical potential changes during the process of corrosion and itsinhibition. It was envisioned that the most promising candidate inhibitors, as identified inthese tests and characterization studies, would be brought forward into a program of larger-scale testing in concrete presented in part two of this report.
Research Approach
As part of the investigation, companies that offer corrosion inhibitors were contacted andsample materials were obtained for evaluation and testing. Among the materials investigatedwere common and well-known corrosion inhibitors. These materials served as reference
standards against which the performance of new materials could be compared. Thus, theselection of candidate materials was based on the industrial state-of-the-art and included a
group of inhibitors which offered a range of inhabitation modes. Some materials were film-formers while others altered the reinforcing steel surface chemically.
In this section of the report, the experimental approach for each aspect of the research is firstoutlined, then results and discussion for the respective investigations are presented, and
11
finally a detailed summary of the specific recommendations is presented. The organizationof research activities in this part of the report is as follows:
A. rebar source, surface preparation and test solutions;B. rapid screening test development;C. surface characterization of reinforcing steel and the interaction of reinforcing
steel with inhibitors;D. migration of corrosion inhibitors through concrete;E. electrochemical studies of the effect of inhibitors on reinforcing steel
corrosion;F. potential long-term testing methods;G. impregnation of concrete disks with polymeric materials.
Experimental Program
Rebar Source, Surface Preparation, and Test Solutions
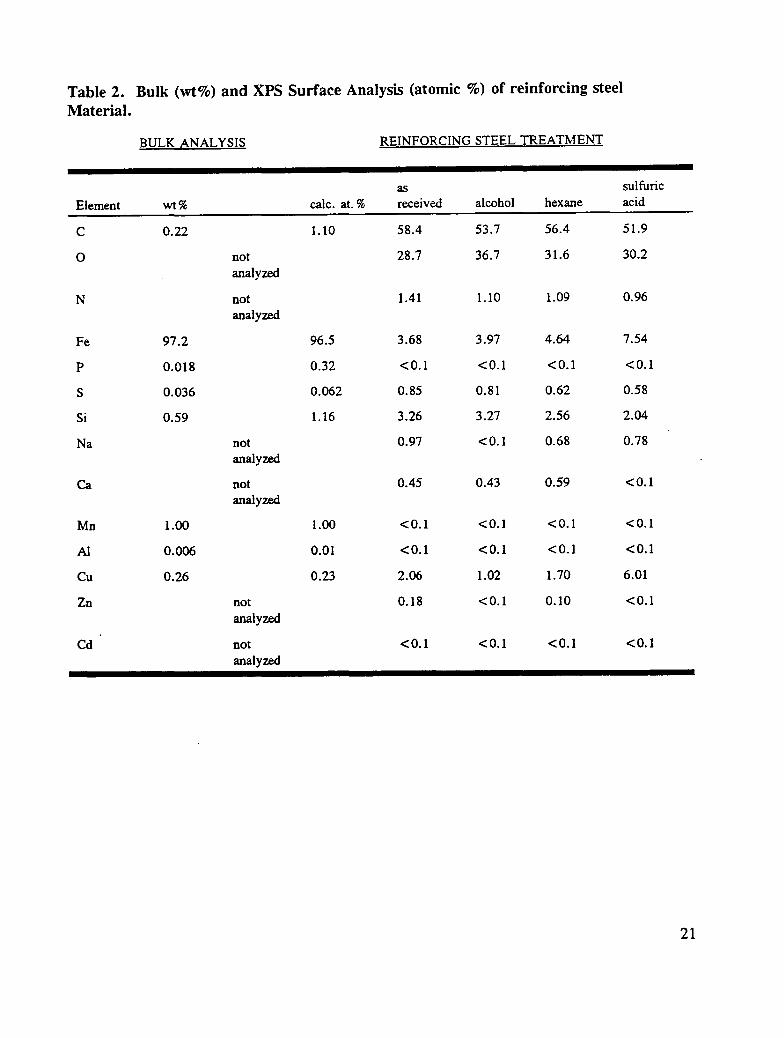
Reinforcing steel reinforcing steel produced from a single heat were obtained from RoanokeElectric Steel Co., Roanoke, VA. Bulk analysis of the reinforcing steel material (wt. %)was provided by the vendor and is summarized in Table 2.
The #5 reinforcing steel, conforming to ASTM 615, test specimens were prepared by firstcutting bar sections in half longitudinally; 1" specimens were then cut from the split bar.Test specimens were cleaned in an organic solvent to remove dirt and grease. Cleaningsolvents selected for tests included hexane, isopropanol and acetone. Specimens were alsocleaned in a 50% (w/w) sulfuric acid, distilled water solution for one minute at roomtemperature, rinsed three times with distilled water, and dried at 230" F (110 ° C).
Corrosion of reinforcing steel in chloride-contaminated concrete occurs where aqueoussolutions within the pores of the concrete contact the reinforcing steel. The existence of suchpore solutions is necessary to provide a conduit by which chloride ions may diffuse from thesurface of the concrete to the reinforcing steels. In the work reported here, a synthetic poresolution, which contained a high concentration (3.5 w/w %) of NaC1, was used (26).
Synthetic pore solution was prepared with reagent grade laboratory chemicals. Thecomposition of the synthetic pore solution was 0.300 M sodium hydroxide, 0.600 Mpotassium hydroxide, and saturated calcium hydroxide in distilled water (26). Prior to use,all solutions were air saturated.
Rapid Screening Test Development
Rebar test specimens were prepared in replicate (usually 5 or 10 replicates per test) by
12
placing approximately 0.34 oz. (10 mL) of the aerated test solution in a small plastic vial andcompletely submerging a single reinforcing steel test specimen into the solution. The vialswere loosely capped and placed in a laboratory oven and maintained at 140 ° F (60 ° C).Solutions were replenished periodically and replaced every two weeks.
Each test specimen was carefully examined with a 5x hand magnifying lens and gradedperiodically on the basis of estimate percent surface corrosion. The corrosion observationswere made on the original (curved) surface of the reinforcing steel only (not the freshly cutsurface).
Accurately weighted quantities of the inhibitors were added to the chloride-doped simulatedpore solution to test the comparative effectiveness of the inhibitors. Control solutions werechloride-doped pore solution without added corrosion inhibitor. Corrosion inhibitors wereobtained as reagent grade chemicals from laboratory supply houses. Commercial productswere obtained as manufacturer's samples. Their chemical nature and manufacturer are
presented in Table 1.
To calculate molarities of commercial samples (Table 1 inhibitors) of proprietary compositionand, hence, of unknown molecular weight, a molecular weight of 250 g/mol was assumed.
Surface Characterization of Reinforcing Steel and Its Interaction Withlnhibitors
To facilitate the preparation of samples for surface analysis, a notch was cut in the 1 in.(2.54 cm) specimens at approximately 3/4 in. (1.91 cm) from one end of the specimen.After immersion in the inhibitor test solution, the 3/4 in. (1.91 cm) portion of the treated barwas separated from the 1 in. (2.54 cm) specimen and analyzed. By using this procedure theintegrity of the treated reinforcing steel surface could be maintained, and no cutting of thesamples was required following treatment. The curved, outer portion of the reinforcing steelspecimen was analyzed.
The test solutions were simulated pore solution (0.600M KOH, 0.300M NaOH, saturatedwith Ca(OH)2), pore solution containing 3.5% (w/w) NaC1; and pore solution containing3.5% (w/w) NaC1 and 0.3 M inhibitor. The inhibitors studied included sodium nitrite(NaNO2), sodium molybdate (Na2MoO4), sodium dihydrogenphosphate (NaH2PO4), sodiummonofluorophosphate (Na2PO3F), sodium tetraborate Na2B407) , and three commercialreagents: Dequest 2000, 50% active aqueous solution; Dequest 2010, 60% active aqueoussolution; and Dequest 2054, 35 % active aqueous solution.
The test solutions were aerated for at least one hour before reinforcing steel samples wereintroduced into the solutions. Exposure times were varied from 1 - 8 days. Samples weremaintained at 140° F (60 ° C). Five replicate specimens of each exposure were used toprovide data for statistical analysis of the results.
13
"_blle 2. CoralL_erciallCor_'osion ]Ir_ibitors
_I'H_]I_ @JR CHEMI_CAL NATU]RE
Monsanto Chemical Co.
Dequest 2000 amino tris (methylene phosphonic acid), 50% active aqueous solution
De,quest 2010 hydroxy-ethylidene diphosphonic acid, 60% active aqueous solution
Miramine TOC substituted imidazoline of tall oil fatty acid
Monocor BE borate ester
Mona Industries Ltd
Monacor 39 imido ester carboxylic acid derivative
Witco Corporation
Witeamine PA 78-B salt of fatty imidazoline
Witcamine PA 60-B salt of fatty imidazoline...... • " I
Two kinds of experiments were carried out with respect to reinforcing steel immersion inpore solutions: initial and delayed. In experiments termed "initial" inhibition, hexanecleaned reinforcing steel was immersed for 8 days in pore solution at 140°F (60°C)containing 0.300 M inhibitor and 3.5% NaC1. At the end of the exposure period, reinforcingsteel specimens were removed, rinsed with distilled water and characterized by XPS (X-rayphotoelectron spectroscopy). ]::or experiments indicated as "delayed" inhibition, hexanecleaned reinforcing steel was immersed for 8 days in pore solution at 140o1:: (60°C)containing 3.5 % NaC1. At the end of this period, the specimens were then immersed for 8days in pore solution at 140°F (60°C) containing 3.5 % NaC1 plus 0.3130 M inhibitor. At theend of the exposure time, the reinforcing steel samples were removed from solution, washed
14
with distilled water, and the surface chemistry evaluated via XPS.
Surface analysis measurements (27) were carried out using a PHI Perkin-Elmer 5300
photoelectron spectrometer (28). Photoelectrons were generated using Mg K_ radiation (hv= 1253.6 eV). Ejected photoelectrons were analyzed using a hemispherical analyzer and theelectrons were detected using a position sensitive detector. In the presentation of elemental
analysis results, photoelectron spectral peak areas were measured and subsequently scaled toaccount for ionization probability and an instrumental sensitivity factor to yield results whichare indicative of surface concentration in atomic percent. The precision for the concentrationevaluations was determined from measurements on 5 different reinforcing steel specimens.
The binding energy scale was calibrated by setting the Cls hydrocarbon peak binding energyat 285.0 eV (29). At least two different measurements on 2 different reinforcing steelsamples were made and the average results are considered.
Migration of Corrosion Inhibitors Through Mortar
Mortar cylinders, 1.18 in (3.0 era) in diameter and approximately 3.94 in (10 cm) long, werecast with a water to cement ratio of 0.47. To better simulate the penetration of solute
through concrete, the sand content of the mortar mixture was equivalent to that of the totalaggregate content of a typical bridge deck concrete. The cylinders were cured in a humiditychamber for 7 days.
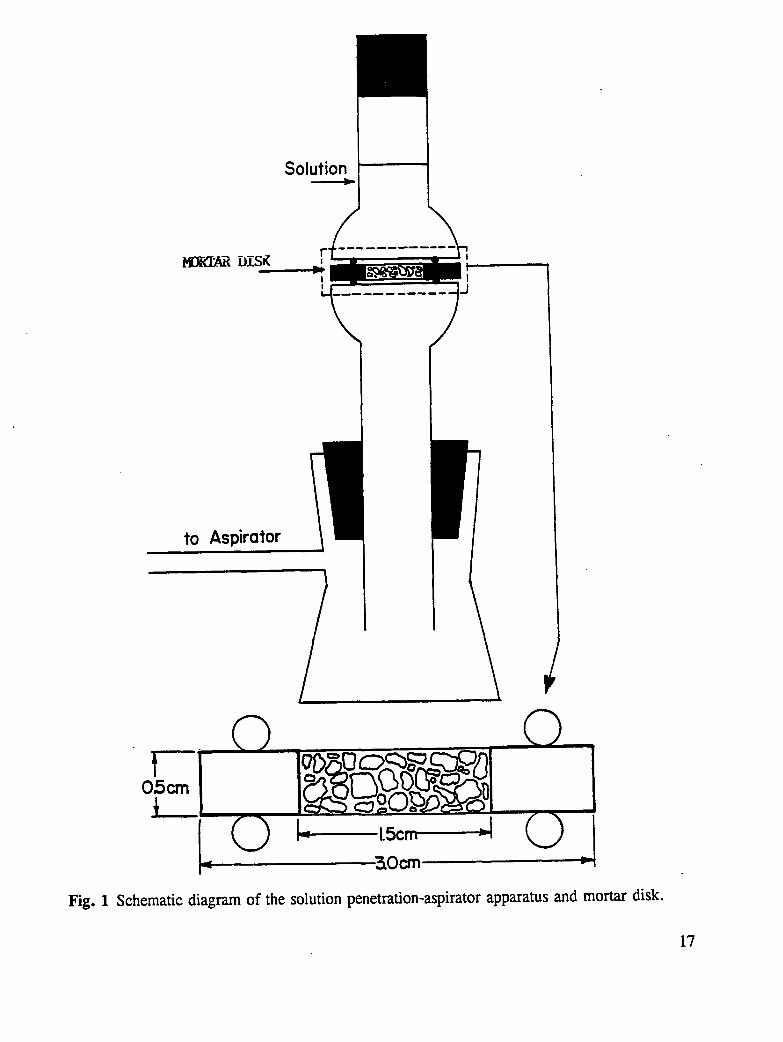
The cured mortar cylinders were sliced to form disks approximately 0.25 + 0.04 in. (0.6+0.1 cm) thick. The edges of these disks were sealed with an epoxy resin, leaving aneffective penetration diameter of 0.60 in (1.5 cm). Rubber "O"-rings were placed on theepoxy surfaces while the epoxy was still tacky to assure good adhesion between the "O"-ringand the concrete surface. A schematic representation of the mortar disk specimen is shownin Fig. 1. The disks were then placed between 2 glass flanges and connected to a vacuumsource.
The specimen and holder were attached to a vacuum line to detect leaks in the epoxy seal orin the concrete disks themselves. This evacuation process also dried the specimens. Thespecimen holder was then attached to a vacuum flask and evacuated using a water aspirator.In this arrangement, one side of the disk was exposed to the vacuum and the other side wasexposed to air at atmospheric pressure as shown in Fig. 1. A measured quantity of solutionwas placed on the air side of the system and a rubber stopper was placed on the open tube toeliminate any solvent loss due to evaporation. Vacuum was maintained on the specimens forvarious periods of time, and the fluid remaining in the reservoir was measured. Whensurface analyses were to be carried out, the disk was carefully removed from the apparatus,dried at 140°F (60°C) for 15-20 min.
Solutions studied for penetration of inhibitors through mortar were: 0.300M RbC1; chloride-containing simulated pore solution containing 3.5 % NaC1 by weight; and chloride-containingsimulated pore solutions with inhibitor at a concentration of 0.300M. In the preparation of
15
the inhibitor solutions, sufficient inhibitor was added to pore solution to achieve aconcentration of 0.300M. The inhibitors of interest in this study were sodium metaborate,Na2B40710H20, and sodium monofluorophosphate, Na2PO3F (MFP).
XPS analyses were performed on selected portions of the specimens using a PHI Perkin-Elmer 5300 electron spectrometer which has been modified for small-spot measurements(28). Due to the porous nature of the concrete and the amount of water retained in thespecimens (even after heating), the specimens were maintained at liquid nitrogen temperature(-150°C) for the XPS analysis. The XPS analysis allows identification of elements thatoriginate from the inhibitor and to determine their surface concentrations and thus, thepenetration time of solute through the disk. The analysis of the specimens was carried outfor upper and lower (vacuum side) portions of fractured disk specimens. The spot size forthe analysis was 0.04 by 0.12 in. (1 by 3 ram). The binding energy data were used todetermine the chemical nature of inhibitor elements.
Eectrochemica Seudies of the Effect of _nhibitors 9n einfarcing SteelCorrosion
Electrochemical measurements were made to determine the corrosion potential of steelreinforcement reinforcing steel immersed in test solutions. For all experiments, a standardcalomel electrode was used as the reference electrode. The potentials were measured using aFisher Accumet Model 910 pH/voltmeter. ASTM Standard C876 (30) relates potentialranges to the probability of corrosion was adopted. These values were converted from acopper sulfate electrode (CSE) scale to a saturated calomel electrode (SCE) scale. In orderto obtain satisfactory results, several protocols were assessed.
Protocol 1
Test specimens were prepared by cutting 3 1/2-inch (8.9 cm) rods from the standardreinforcing steel. Bulk and surface analyses of the rods are summarized in Table 2, page 18.One end of each specimen was drilled and tapped to permit electrical connections. Thespecimens were cleaned in hexane and allowed to dry. The cut end and wire connectionwere coated with epoxy (Tru-Bond TB-700).
The test solutions were simulated pore solution containing 3.5 % NaC1 by weight, andsimulated pore solution containing 3.5 % NaC1 by weight and the following concentrations ofinhibitor: 0.002M, 0.01M, 0.05M, and 0.1M. The inhibitors studied were sodium nitrite(NaNO2), sodium monofluorophosphate (Na2PO3F), and sodium tetraborate (Na2B4OT). Thetest solutions were aerated for 2 hours prior to reinforcing steel immersion. Duplicatesamples of reinforcing steel, each contained in 8.45 oz. (250 mL) of solution, were
Fig. 1 Schematic diagram of the solution penetration-aspirator apparatus and mortar disk.
17
maintained at 140°F (60°C) for 18 weeks. To minimize evaporation of solution, the bottleswere covered with plastic. The test solutions were replaced every 2-3 weeks to maintainproper aeration, volume, concentration, and pH. Potential measurements were taken every 2weeks.
Protocol 2
In these experiments, 3 in x 1 in x 1/4 in (7.62 x 2.54 x 0.64 cm) segments of A36 flatstock steel were tested. The bars were drilled and tapped in one end to permit electricalconnections. Bars were cleaned in hexane and allowed to dry. Additional bars were cleanedin a 1:1 solution of sulfuric acid and deionized water. The latter bars were also scrubbed
with a Scotchbrite pad, rinsed with deionized water, allowed to dry, cleaned with hexane,and allowed to dry. Two coats of Nybco epoxy paint were applied to each end of thereinforcing steel and allowed to cure according to the manufacturer's specifications.
The test solutions were simulated pore solution; pore solution containing 3.5 % NaC1 (byweight); pore solution containing 3.5% NaC1 (by weight) and 0.300M NaNO2; and poresolution containing 3.5% NaC1 and 0.670M NaNO2. The test solutions were aerated for 2hours before use. The solution volume was maintained at 6.76 oz. (200 mL). Specimenswere maintained in solution for 28 weeks at 140°F (60°C). Duplicate specimens wereprepared and the bottles were covered with plastic. The test solutions were replaced every 2weeks, l_otential measurements were taken every 2 weeks.
Protocols 3 and 4
The third and fourth protocols also utilized A36 flat stock steel. Electrical contact was madewith an alligator clip attached to an insulated copper wire/BNC connector. The bar segmentsin these experiments were washed in hexane and allowed to dry. When the potentialmeasurements were to be taken, the bar was removed from the test solution, the end of thebar was dried, and electrical connection was made with the alligator clip.
For the third experiment, each specimen was placed in a 4.22 oz. (125 mL) solution ofdeionized water containing 10% NaC1 (by weight). These specimens were placed in an ovenat 14001:: (60°C) for one hour in order to produce an active corrosion potential. Each barwas then placed in 4.22 oz. (125 mL) of the test solution and the bottle loosely capped. Thetest solutions were pore solution; pore solution containing 3.5% NaC1 (by weight); and poresolutions containing 3.5% NaC1 (by weight) and sodium tetraborate inhibitor at theconcentrations; 0.0021VI, 0.01M, 0.5M, and 0.1M. Another bar specimen was immersed inthe original Mprecorrosion" solution; this specimen served as a control or reference specimen.The solutions were aerated for 2 hours prior to reinforcing steel immersion. The testsamples were prepared in duplicate and maintained at 14001:: (60°C) for 56 days. The testsolutions were replaced every 2 weeks. Potential measurements were taken several timesweekly and then at selected intervals.
18
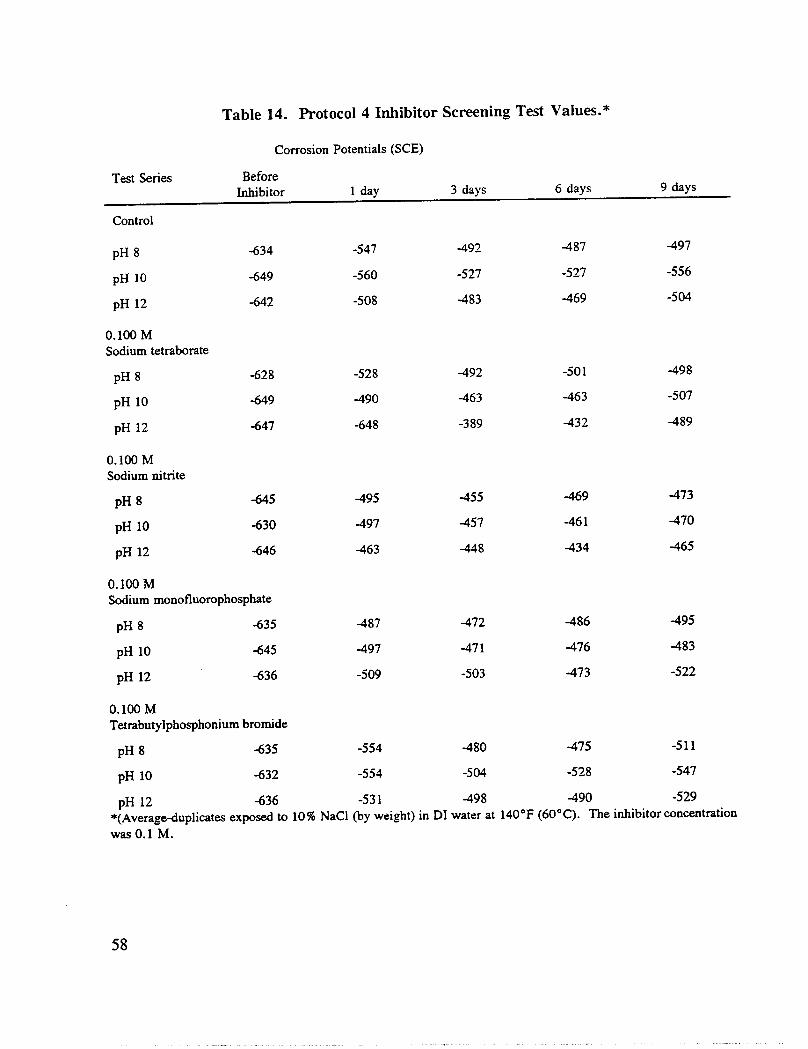
In the last protocol (fourth protocol), bars were cleaned in hexane and dried. The bars were"precorroded" in aerated deionized water containing 10% NaC1 (by weight) at pH 8.5 - 8.6for 1 week at 140°F (60°C). Measurements of the corrosion potentials were taken after 1week. The bars were subsequently placed in 3 duplicate test solutions. The pH of eachduplicate solution was adjusted to 8, 10 and 12, respectively. These adjustments were madewith HC1, NaOH and NaI-ICO3. The solutions consisted of deionized water containing 10%NaC1 (by weight) and deionized water containing 10% NaC1 (by weight) and 0.100Minhibitor. The inhibitors were sodium nitrite, sodium tetraborate, sodium
monofluorophosphate and tetrabutylphosphonium bromide ([CH3(CH2)3]4PBr). The volumewas maintained at 4.22 oz. (125 mL) and the temperature at 140°F (60°C) for 9 days.Potential and pH measurements were taken after 1, 3, 6, 9 and 18 days. The solutions werereplaced after 18 days. At this time, the NaC1 concentration was decreased to 1.75% (byweight) and the inhibitor concentration was increased to 0.600M, except for the concentrationof tetrabutylphosphonium bromide, which was maintained at 0.100M. Additional duplicatetest solutions and reinforcing steel specimens were prepared to include pH 12.5 and pH 13.0.Potential and pH measurements were taken after 3 and 6 days at the new conditions. The pHof each solution was readjusted after the third day.
Results, Discussion and Conclusions
Rebar Cleaning and Sample Preparation
Initial reinforcing steel cleaning experiments were carried out so that throughout the study acommon pretreatment designed to remove grease and dirt would be used, and thus a kind of"standard" surface would be studied. To this end, the organic solvents alcohol, and hexane,
and an aqueous acid solution were investigated to discover which treatment least altered theas-received reinforcing steel surface. The surface analysis results obtained in theseexperiments are summarized in Table 2. Hexane cleaning was selected for the followingreasons:
1) the chemical content and the chemical nature of the surface elements on thereinforcing steel surface were not altered significantly;
2) residual solvent on the treated surface was minimal and less than that found followingtreatment with alcohol, acetone, or other organic solvents.
Following alcohol cleaning, a greater concentration of oxygen and lower concentrations ofcopper and zinc are at the surface. In addition the chemical nature of carbon was altered toabout 25 at. % whereas the concentration of this group on as-received reinforcing steel wasabout 10 at. %. For sulfuric-acid-treated reinforcing steel, significant surface concentrationchanges are noted among the metals: the iron and copper concentrations are greater than theas-received specimens, whereas the surface contents for calcium and zinc are below thedetection level, < 0.1 at. %. Thus, cleaning the reinforcing steel surface with sulfuric acid,caused significant change in surface chemical content. The present experiments are to
19
simulate, as closely as possible, long-term reinforcing steel exposure to the corrosiveconditions found in the construction and/or repair of bridges; the severe alterations caused bysulfuric acid cleaning were not accurate simulations of normal exposure. Thus, it wasconcluded that cleaning with a hydrocarbon solvent (hexane) was the preparation methodmost likely to yield good results in accelerated laboratory corrosion tests.
_ap_d Screening Test
At the beginning of this study, all basic test parameters were open to investigation.Preliminary experiments led to the conclusion that testing would have to be conducted at anelevated temperature if results were to be achieved after a reasonably short time. The finalchoice of 140°F (60°C) is sufficiently high for rapid testing, yet sufficiently low that theneeds for solution replenishment and replacement are kept within manageable limits.
The baseline data by which the extent of corrosion in chloride-doped pore solution at 140°F(60°C) was judged and is presented in Table 3. Under the conditions finally selected for thescreening tests, the controls suffer surface corrosion to the extent of about 1% per day. Theresults in Table 3 are based on 10 replicate specimens and presents the standard deviations ofthe average percent corrosion. Despite the fact that this test is based solely on visualestimates of the extent of corrosion, the estimated standard deviations show that with asufficient number of replicate specimens, a good estimate of corrosion can be reliablyobtained.
Experiments using the known corrosion inhibitors sodium nitrite and sodiummonofluorophosphate provided data concerning how long to conduct the tests, at whattemperature to maintain the oven, and when to either replenish or change solutions.
Also during the preliminary phase of the investigation a number of studies were made on theeffect of specific inhibitor concentration on the extent of corrosion. The effect of varyingsodium nitrite concentration on the percent corrosion is presented in Table 4. The effect ofvarying sodium molybdate concentration is presented in Table 5. As shown, sodium nitriteis a more effective corrosion inhibitor than sodium molybdate.
Sodium nitrite is one of the best available inhibitors under the test conditions, and the resultspresented in Table 4 demonstrate that it is effective even at concentrations as low as 0.00200molar. Conversely; sodium molybdate is one of the worst inhibitors under the testconditions. Corrosion in 0.002 molar sodium molybdate environment is indistinguishable
20
Table 2. Bulk (wt%) and XPS Surface Analysis (atomic %) of reinforcing steel
Material.
BULK ANALYSIS REINFORCING STEEL TREATMENT
as sulfuric
Element wt% talc. at. % received alcohol hexane acid
C 0.22 1.10 58.4 53.7 56.4 51.9
O not 28.7 36.7 31.6 30.2
analyzed
N not 1.41 1.10 1.09 0.96
analyzed
Fe 97.2 96.5 3.68 3.97 4.64 7.54
P 0.018 0.32 <0.1 <0.1 <0.1 <0.1
S 0.036 0.062 0.85 0.81 0.62 0.58
Si 0.59 1.16 3.26 3.27 2.56 2.04
Na not 0.97 < 0.1 0.68 0.78
analyzed
Ca not 0.45 0.43 0.59 <0.1
analyzed
Mn 1.00 1.00 <0.1 <0.1 <0.1 <0.1
AI 0.006 0.01 <0.1 <0.1 <0.1 <0.1
Cu 0.26 0.23 2.06 1.02 1.70 6.01
Zn not 0.18 <0. I 0.10 <0.1
analyzed
Cd not <0.I <0.I <0.1 <0.1
analyzed
21
Tablle 30 gesullts of Cont_'o_ Tests Cor_'os_on
Tests of control samples in chloride doped pore solution without inhibitor (controls) at 140 ° F (60 ° C).
Time (days) Percent Corrosion*
35 26 _+ 8
56 52 + 22
*Reported values are the average of ten replicate samples.
Tabne 40 Corrosion ]Inhib_tioza of Sodium Nitrite
Corrosion of reinforcing steel samples in chloride-doped pore solution at 140 ° F (60 ° C),exposure time, 28 days.
Corrosion of reinforcing steel samples in chloride-doped pore solution at 140 ° F (60 ° C), exposuretime 33 days.
Sodium Molybdate Concentration*mol/L Percent Corrosion Number of Rerflieates
0.00200 25 4-14 10
0.0100 23 4- 9 10
0.0500 13 4- 9 10
0.100 11 4- 3 10
0.5OO 8 + 2 10
Control 25 + 1 I0
22
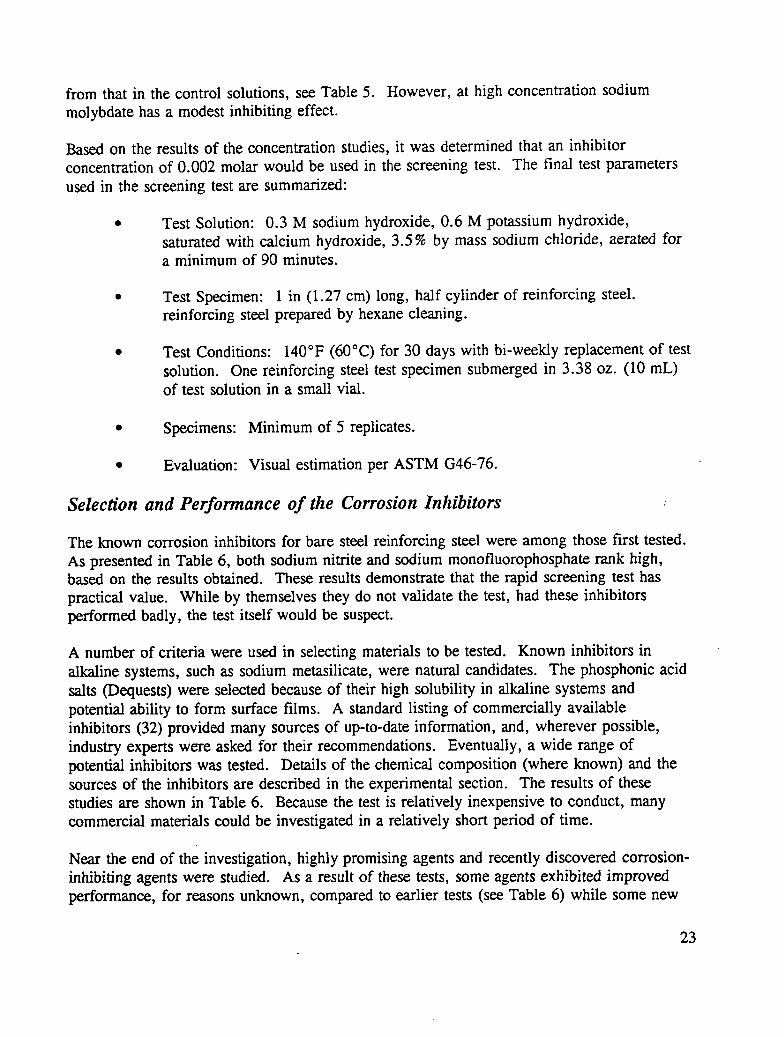
from that in the control solutions, see Table 5. However, at high concentration sodium
molybdate has a modest inhibiting effect.
Based on the results of the concentration studies, it was determined that an inhibitorconcentration of 0.002 molar would be used in the screening test. The final test parametersused in the screening test are summarized:
• Test Solution: 0.3 M sodium hydroxide, 0.6 M potassium hydroxide,saturated with calcium hydroxide, 3.5% by mass sodium chloride, aerated fora minimum of 90 minutes.
• Test Specimen: 1 in (1.27 cm) long, half cylinder of reinforcing steel.reinforcing steel prepared by hexane cleaning.
• Test Conditions: 140°F (60°C) for 30 days with bi-weekly replacement of testsolution. One reinforcing steel test specimen submerged in 3.38 oz. (10 mL)of test solution in a small vial.
• Specimens: Minimum of 5 replicates.
• Evaluation: Visual estimation per ASTM G46-76.
Selection and Performance of the Corrosion Inhibitors ,
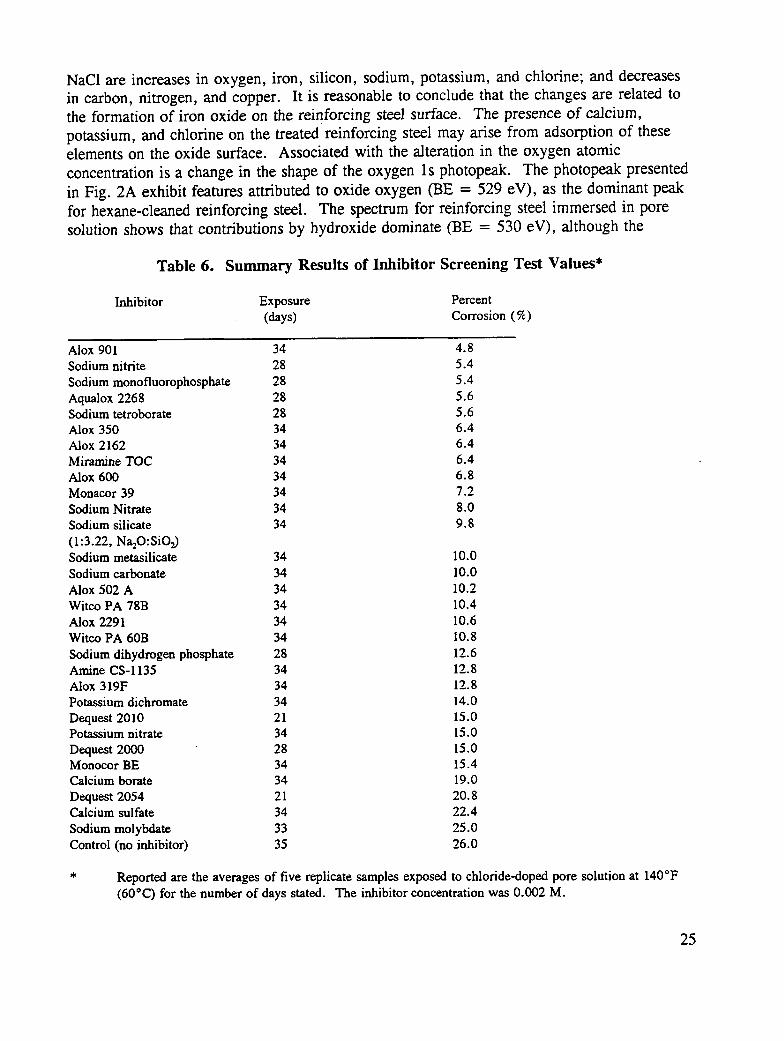
The known corrosion inhibitors for bare steel reinforcing steel were among those first tested.
As presented in Table 6, both sodium nitrite and sodium monofluorophosphate rank high,based on the results obtained. These results demonstrate that the rapid screening test haspractical value. While by themselves they do not validate the test, had these inhibitorsperformed badly, the test itself would be suspect.
A number of criteria were used in selecting materials to be tested. Known inhibitors inalkaline systems, such as sodium metasilicate, were natural candidates. The phosphonic acidsalts (Dequests) were selected because of their high solubility in alkaline systems andpotential ability to form surface films. A standard listing of commercially availableinhibitors (32) provided many sources of up-to-date information, and, wherever possible,industry experts were asked for their recommendations. Eventually, a wide range ofpotential inhibitors was tested. Details of the chemical composition (where known) and thesources of the inhibitors are described in the experimental section. The results of thesestudies are shown in Table 6. Because the test is relatively inexpensive to conduct, manycommercial materials could be investigated in a relatively short period of time.
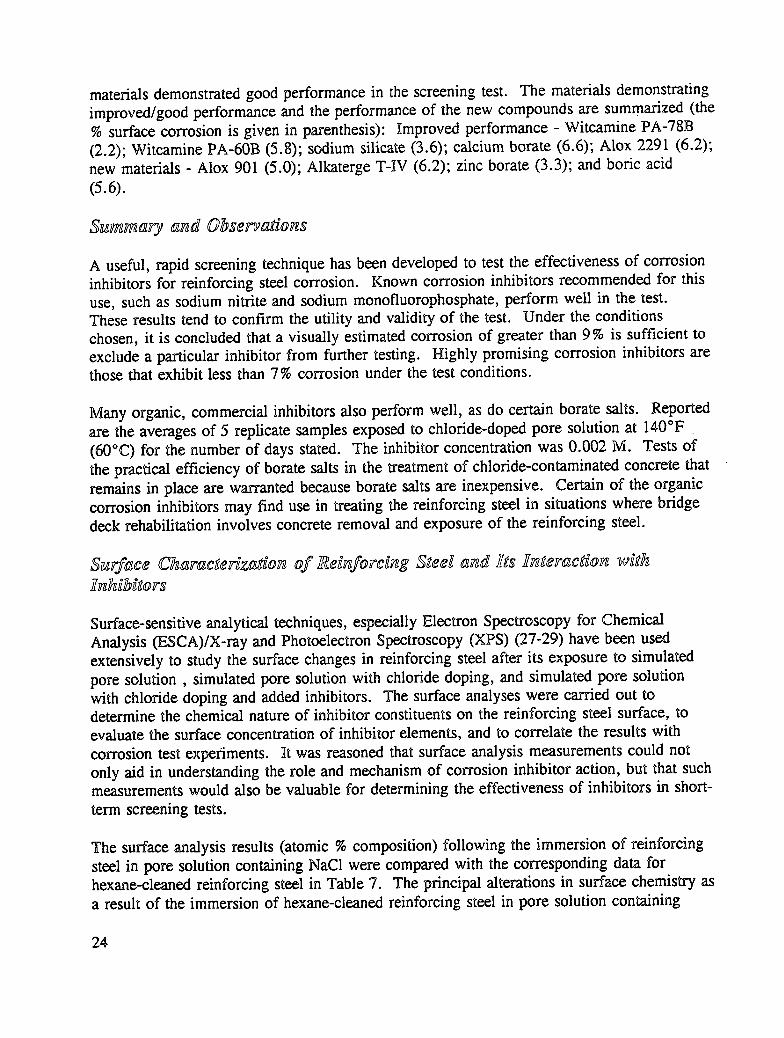
Near the end of the investigation, highly promising agents and recently discovered corrosion-inhibiting agents were studied. As a result of these tests, some agents exhibited improvedperformance, for reasons unknown, compared to earlier tests (see Table 6) while some new
23
materials demonstrated good performance in the screening test. The materials demonstratingimproved/good performance and the performance of the new compounds are summarized (the% surface corrosion is given in parenthesis): Improved performance - Witcamine PA-78B(2.2); Witcamine PA-60B (5.8); sodium silicate (3.6); calcium borate (6.6); Alox 2291 (6.2);new materials - Alox 901 (5.0); Alkaterge T-IV (6.2); zinc borate (3.3); and boric acid(5.6).
Summary and Gbservadons
A useful, rapid screening technique has been developed to test the effectiveness of corrosioninhibitors for reinforcing steel corrosion. Known corrosion inhibitors recommended for thisuse, such as sodium nitrite and sodium monofluorophosphate, perform well in the test.These results tend to confirm the utility and validity of the test. Under the conditionschosen, it is concluded that a visually estimated corrosion of greater than 9% is sufficient toexclude a particular inhibitor from further testing. Highly promising corrosion inhibitors arethose that exhibit less than 7% corrosion under the test conditions.
Many organic, commercial inhibitors also perform well, as do certain borate salts. Reportedare the averages of 5 replicate samples exposed to chloride-doped pore solution at 140°F(60°C) for the number of days stated. The inhibitor concentration was 0.002 M. Tests ofthe practical efficiency of borate salts in the treatment of chloride-contaminated concrete thatremains in place are warranted because borate salts are inexpensive. Certain of the organiccorrosion inhibitors may find use in treating the reinforcing steel in situations where bridgedeck rehabilitation involves concrete removal and exposure of the reinforcing steel.
S_rface C_araceezizaC_gn of _e_nfozc_ng Seee_ and figsfneezac_gn w_¢_fn_ib_eors
Surface-sensitive analytical techniques, especially Electron Spectroscopy for ChemicalAnalysis (ESCA)/X-ray and Photoelectron Spectroscopy 0fPS) (27-29) have been usedextensively to study the surface changes in reinforcing steel after its exposure to simulatedpore solution, simulated pore solution with chloride doping, and simulated pore solutionwith chloride doping and added inhibitors. The surface analyses were carded out todetermine the chemical nature of inhibitor constituents on the reinforcing steel surface, toevaluate the surface concentration of inhibitor elements, and to correlate the results withcorrosion test experiments. It was reasoned that surface analysis measurements could notonly aid in understanding the role and mechanism of corrosion inhibitor action, but that suchmeasurements would also be valuable for determining the effectiveness of inhibitors in short-term screening tests.
The surface analysis results (atomic % composition) following the immersion of reinforcingsteel in pore solution containing NaC1 were compared with the corresponding data forhexane-cleaned reinforcing steel in Table 7. The principal alterations in surface chemistry asa result of the immersion of hexane-cleaned reinforcing steel in pore solution containing
24
NaC1 are increases in oxygen, iron, silicon, sodium, potassium, and chlorine; and decreasesin carbon, nitrogen, and copper. It is reasonable to conclude that the changes are related tothe formation of iron oxide on the reinforcing steel surface. The presence of calcium,potassium, and chlorine on the treated reinforcing steel may arise from adsorption of theseelements on the oxide surface. Associated with the alteration in the oxygen atomic
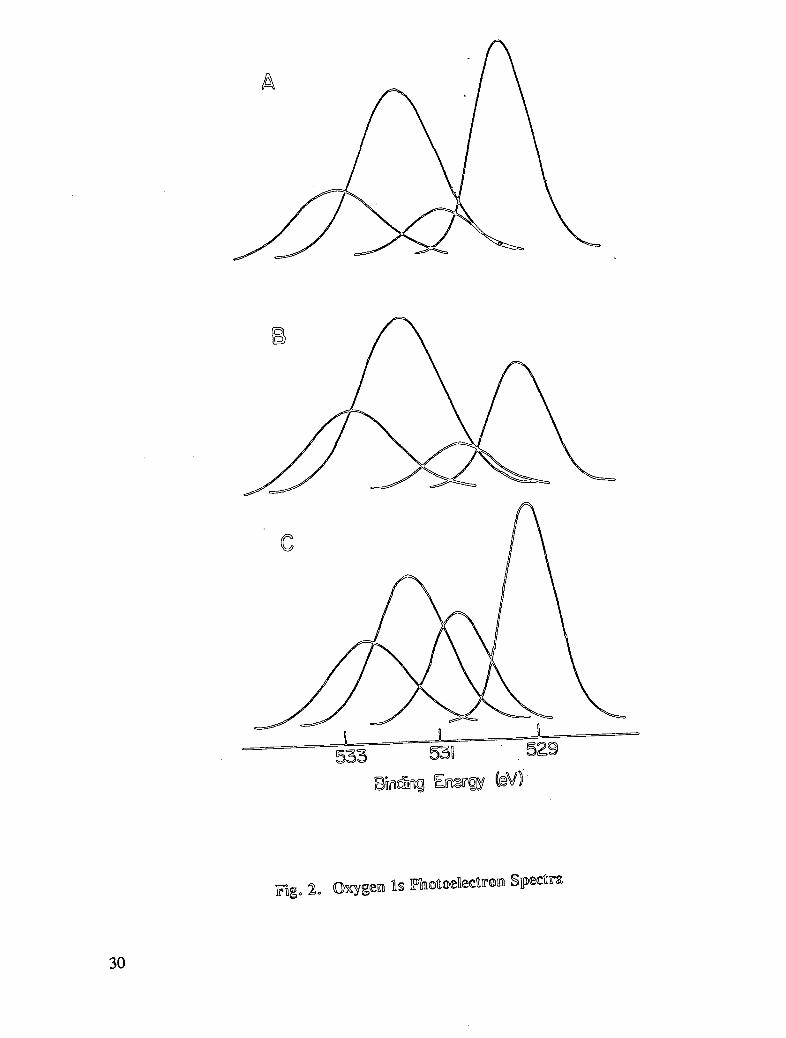
concentration is a change in the shape of the oxygen 1s photopeak. The photopeak presentedin Fig. 2A exhibit features attributed to oxide oxygen (BE = 529 eV), as the dominant peakfor hexane-cleaned reinforcing steel. The spectrum for reinforcing steel immersed in poresolution shows that contributions by hydroxide dominate (BE = 530 eV), although the
Table 6. Summary Results of Inhibitor Screening Test Values*
Dequest 2000 28 15.0Monoeor BE 34 15.4Calcium borate 34 19.0
Dequest 2054 21 20.8Calcium sulfate 34 22.4
Sodium molybdate 33 25.0Control (no inhibitor) 35 26.0
* Reported are the averages of five replicate samples exposed to chloride-doped pore solution at 140°F(60"C) for the number of days stated. The inhibitor concentration was 0.002 M.
25
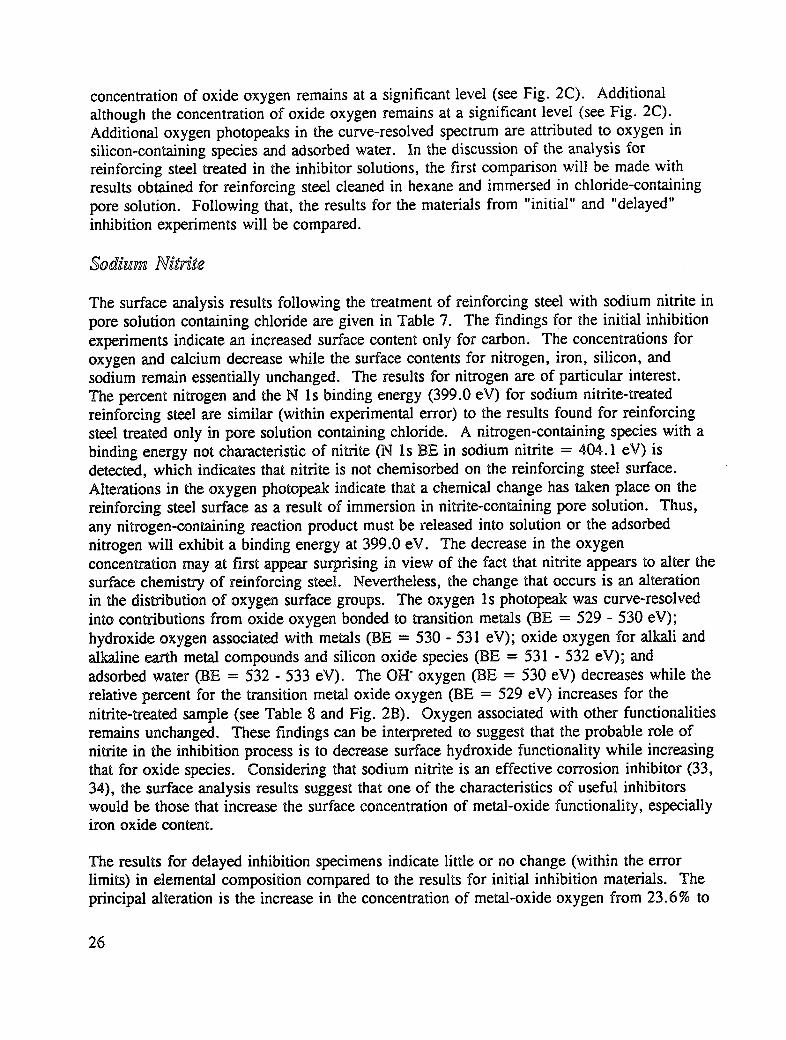
concentration of oxide oxygen remains at a significant level (see Fig. 2C). Additionalalthough the concentration of oxide oxygen remains at a significant level (see Fig. 2C).Additional oxygen photopeaks in the curve-resolved spectrum are attributed to oxygen insilicon-containing species and adsorbed water. In the discussion of the analysis forreinforcing steel treated in the inhibitor solutions, the first comparison will be made withresults obtained for reinforcing steel cleaned in hexane and immersed in chloride-containingpore solution. Following that, the results for the materials from "initial" and "delayed"inhibition experiments will be compared.
Sodigm Nigrige
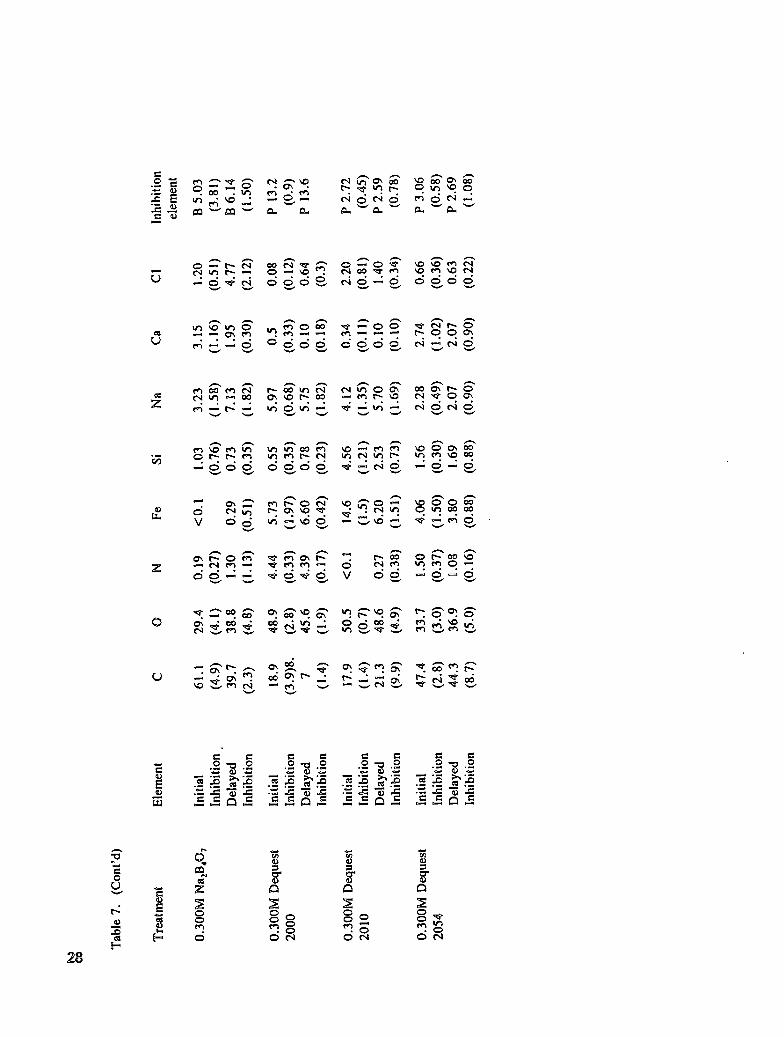
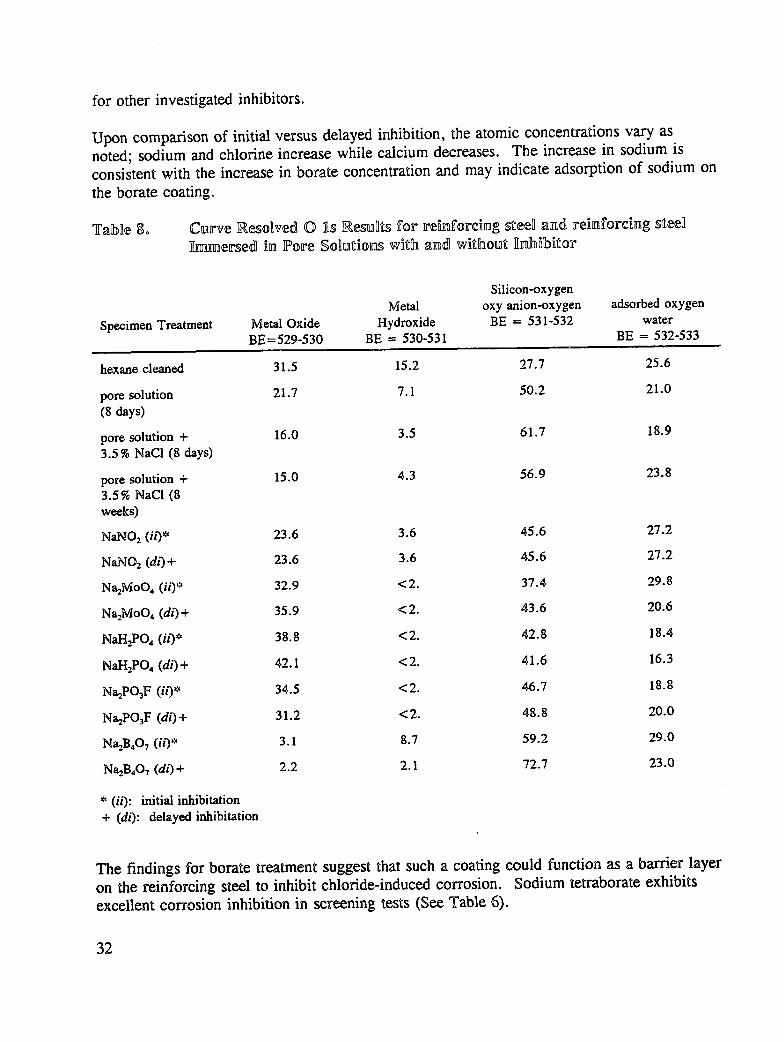
The surface analysis results following the treatment of reinforcing steel with sodium nitrite inpore solution containing chloride are given in Table 7. The findings for the initial inhibitionexperiments indicate an increased surface content only for carbon. The concentrations foroxygen and calcium decrease while the surface contents for nitrogen, iron, silicon, andsodium remain essentially unchanged. The results for nitrogen are of particular interest.The percent nitrogen and the N ls binding energy (399.0 eV) for sodium nitrite-treatedreinforcing steel are similar (within experimental error) to the results found for reinforcingsteel treated only in pore solution containing chloride. A nitrogen-containing species with abinding energy not characteristic of nitrite (N ls BE in sodium nitrite = 404.1 eV) isdetected, which indicates that nitrite is not chemisorbed on the reinforcing steel surface.Alterations in the oxygen photopeak indicate that a chemical change has taken place on thereinforcing steel surface as a result of immersion in nitrite-containing pore solution. Thus,any nitrogen-containing reaction product must be released into solution or the adsorbednitrogen will exhibit a binding energy at 399.0 eV. The decrease in the oxygenconcentration may at first appear surprising in view of the fact that nitrite appears to alter thesurface chemistry of reinforcing steel. Nevertheless, the change that occurs is an alterationin the distribution of oxygen surface groups. The oxygen 1s photopeak was curve-resolvedinto contributions from oxide oxygen bonded to transition metals (BE = 529 - 530 eV);hydroxide oxygen associated with metals (BE = 530 - 531 eV); oxide oxygen for alkali andalkaline earth metal compounds and silicon oxide species (BE = 531 - 532 eV); andadsorbed water (BE = 532 - 533 eV). The OH oxygen (BE = 530 eV) decreases while therelative percent for the transition metal oxide oxygen (BE = 529 eV) increases for thenitrite-treated sample (see Table 8 and Fig. 2B). Oxygen associated with other functionalitiesremains unchanged. These findings can be interpreted to suggest that the probable role ofnitrite in the inhibition process is to decrease surface hydroxide functionality while increasingthat for oxide species. Considering that sodium nitrite is an effective corrosion inhibitor (33,34), the surface analysis results suggest that one of the characteristics of useful inhibitorswould be those that increase the surface concentration of metal-oxide functionality, especiallyiron oxide content.
The results for delayed inhibition specimens indicate little or no change (within the errorlimits) in elemental composition compared to the results for initial inhibition materials. Theprincipal alteration is the increase in the concentration of metal-oxide oxygen from 23.6% to
35.5 %. It is likely that the increase is associated with the formation of additional passiveiron oxide at the surface. This interpretation is similar to that suggested by others whoundertook characterization studies (33, 34). In screening tests it was demonstrated thatsodium nitrite is an effective corrosion inhibitor.
Sodium Molybdate
The interaction of sodium molybdate with reinforcing steel either via initial or delayedinhibition experiments (see Table 8) produced an increased surface concentration of iron andassociated iron oxide. Molybdenum was detected on the reinforcing steel surface at aconcentration of about 0.5 atomic % and a corresponding increase in the oxygen associatedwith Mo(VI) at BE = 531.0 eV was noted. A comparison of the Mo 3d5/2binding energyfor Na2MoO4 (BE = 232.4 eV) with that for molybdenum from the two reinforcing steelexposure experiments (BE = 232.2 and 232.3 eV, respectively, for initial and delayedinhibition experiments) shows that molybdenum as molybdate, Mo(VI), is adsorbed on thereinforcing steel surface. A decrease in calcium and an increase in silicon concentrationswere found compared to the data obtained for reinforcing steel exposed only to chloride-containing pore solution. Within experimental error, the concentration of other elements didnot change. The increase in iron and oxide oxygen and the detection of molybdenum asMo(VI) indicate that molybdenum affects the reinforcing steel surface through an adsorptionprocess such that oxide constituent contributions are increased at the surface. If molybdateacts as an oxidizing agent, the surface analysis results provide no indication of what thereduced molybdenum product would be. The molybdenum photopeak was characteristic onlyof molybdenum (VI), i.e., no reduced molybdenum species were detected at the surface.Lack of detection of reduced molybdenum could occur if the reduced product is not adsorbedon the reinforcing steel surface or if the concentration of reduced molybdenum is too small tocontribute significantly to the Mo 3d photoelectron signal. However, screening corrosiontests performed in this study show that molybdate is a relatively poor inhibitor. Oxygenspectra were not curve-resolved, only interpreted in a qualitative manner.
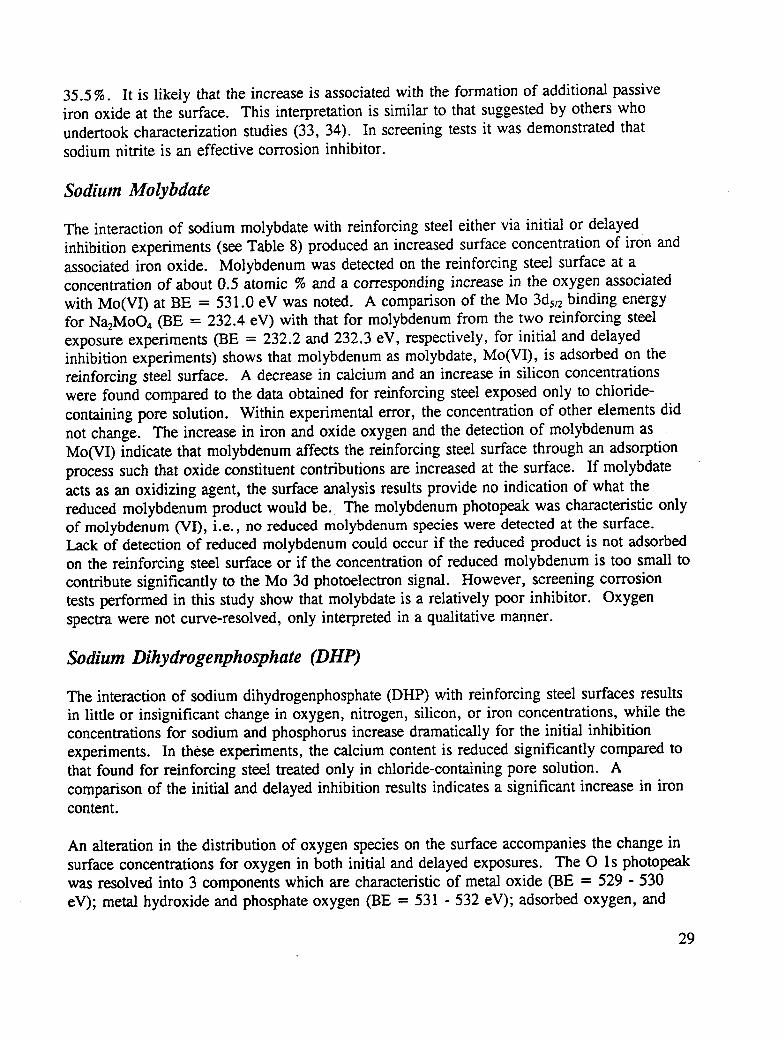
Sodium Dihydrogenphosphate (DHP)
The interaction of sodium dihydrogenphosphate (DHP) with reinforcing steel surfaces resultsin little or insignificant change in oxygen, nitrogen, silicon, or iron concentrations, while theconcentrations for sodium and phosphorus increase dramatically for the initial inhibitionexperiments. In these experiments, the calcium content is reduced significantly compared tothat found for reinforcing steel treated only in chloride-containing pore solution. Acomparison of the initial and delayed inhibition results indicates a significant increase in ironcontent.
An alteration in the distribution of oxygen species on the surface accompanies the change insurface concentrations for oxygen in both initial and delayed exposures. The O ls photopeakwas resolved into 3 components which are characteristic of metal oxide (BE = 529 - 530eV); metal hydroxide and phosphate oxygen (BE = 531 - 532 eV); adsorbed oxygen, and
29
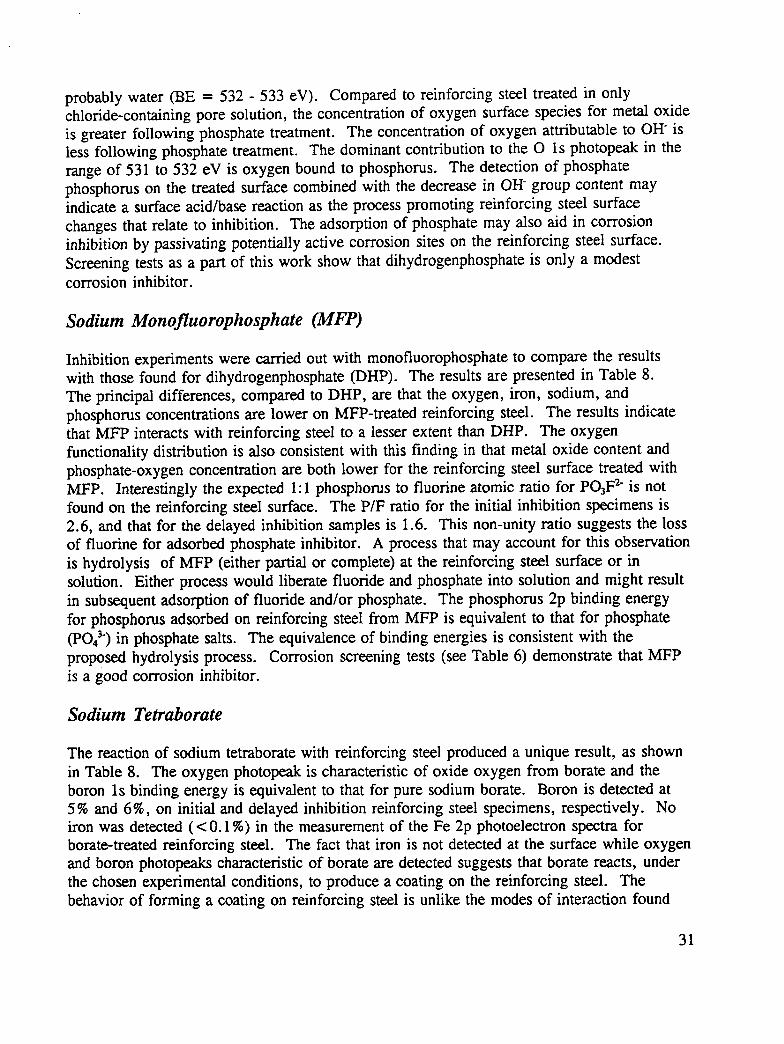
probably water (BE = 532 - 533 eV). Compared to reinforcing steel treated in onlychloride-containing pore solution, the concentration of oxygen surface species for metal oxideis greater following phosphate treatment. The concentration of oxygen attributable to OH isless following phosphate treatment. The dominant contribution to the O ls photopeak in therange of 531 to 532 eV is oxygen bound to phosphorus. The detection of phosphatephosphorus on the treated surface combined with the decrease in OH- group content mayindicate a surface acid/base reaction as the process promoting reinforcing steel surface
changes that relate to inhibition. The adsorption of phosphate may also aid in corrosioninhibition by passivating potentially active corrosion sites on the reinforcing steel surface.Screening tests as a part of this work show that dihydrogenphosphate is only a modestcorrosion inhibitor.
Sodium Mono fluorophosphate (MFP)
Inhibition experiments were carried out with monofluorophosphate to compare the resultswith those found for dihydrogenphosphate (DHP). The results are presented in Table 8.The principal differences, compared to DHP, are that the oxygen, iron, sodium, andphosphorus concentrations are lower on MFP-treated reinforcing steel. The results indicatethat MFP interacts with reinforcing steel to a lesser extent than DHP. The oxygenfunctionality distribution is also consistent with this finding in that metal oxide content andphosphate-oxygen concentration are both lower for the reinforcing steel surface treated withMFP. Interestingly the expected 1:1 phosphorus to fluorine atomic ratio for PO3F2 is notfound on the reinforcing steel surface. The P/F ratio for the initial inhibition specimens is2.6, and that for the delayed inhibition samples is 1.6. This non-unity ratio suggests the lossof fluorine for adsorbed phosphate inhibitor. A process that may account for this observationis hydrolysis of MFP (either partial or complete) at the reinforcing steel surface or insolution. Either process would liberate fluoride and phosphate into solution and might resultin subsequent adsorption of fluoride and/or phosphate. The phosphorus 2p binding energyfor phosphorus adsorbed on reinforcing steel from MFP is equivalent to that for phosphate(PO43) in phosphate salts. The equivalence of binding energies is consistent with theproposed hydrolysis process. Corrosion screening tests (see Table 6) demonstrate that MFPis a good corrosion inhibitor.
Sodium Tetraborate
The reaction of sodium tetraborate with reinforcing steel produced a unique result, as shownin Table 8. The oxygen photopeak is characteristic of oxide oxygen from borate and theboron ls binding energy is equivalent to that for pure sodium borate. Boron is detected at5% and 6%, on initial and delayed inhibition reinforcing steel specimens, respectively. Noiron was detected (< 0.1%) in the measurement of the Fe 2p photoelectron spectra forborate-treated reinforcing steel. The fact that iron is not detected at the surface while oxygenand boron photopeaks characteristic of borate are detected suggests that borate reacts, underthe chosen experimental conditions, to produce a coating on the reinforcing steel. Thebehavior of forming a coating on reinforcing steel is unlike the modes of interaction found
31
for other investigated inhibitors.
Upon comparison of initial versus delayed inhibition, the atomic concentrations vary asnoted; sodium and chlorine increase while calcium decreases. The increase in sodium isconsistent with the increase in borate concentration and may indicate adsorption of sodium onthe borate coating.
Tabne 80 Curve _o_ved 0 _.s _esullL_ for re_z_forcing _eell and reinforcing steel_r_e_ed in Fore SoDut_on.swith and w_thout ]¥ahibitor
The findings for borate treatment suggest that such a coating could function as a barrier layeron the reinforcing steel to inhibit chloride-induced corrosion. Sodium tetraborate exhibitsexcellent corrosion inhibition in screening tests (See Table 6).
32
Dequests
Dequests (phosphorus-containing compounds having various structures) axe widely used forcorrosion prevention in alkaline aqueous environments. Dequest 2000 is a trialkylphosphateamine. There axe significant differences in atomic composition upon comparing initial anddelayed inhibition results. The important surface composition changes for Dequest-treatedreinforcing steel compared to reinforcing steel treated in chloride-containing pore solution axeincreases in nitrogen, phosphorus, and sodium, and a decrease in calcium. The P/N surfaceratio of these samples is 3:1, a result indicative of the presence of adsorbed Dequest activecomponent, trialkylphosphate amine. The oxygen spectra indicate contributions from ironoxide, but the principal contribution is from the phosphate functional group. The phosphorusatomic composition (13 at %) indicates significant adsorption on reinforcing steel specimens.
The adsorption of Dequest 2010 on reinforcing steel is noted by the appearance ofphosphorus in the spectra for initial and delayed inhibition specimens. The concentration ofthe respective individual elements is equivalent when comparing initial and delayedtreatments, except for iron and silicon. For the latter elements the concentration is greaterfollowing the initial inhibition treatment. The oxygen photopeak could be resolved toindicate contributions from metal oxide and adsorbed oxygen (probably water), (see Table 8).However, the principal contribution is from the phosphate-oxygen species. The phosphorus2p binding energy data are indicative of the adsorption of the phosphorus component withoutchange in chemical nature, i.e., no measurable or detectable change in the oxidation state ofphosphorus occurs. Based on the percent surface phosphorus, the adsorption of Dequest2010 is less favorable by at least a factor of 4 (in a mole percent basis) compared to theadsorption of Dequest 2000 on reinforcing steel specimens.
The interaction of Dequest 2054, (an ethylenediaminete trialkylphosphate) with reinforcingsteel does not produce any significant differences in the surface composition when comparinginitial and delayed tests. Based on the amount of phosphorus present, the quantity of thismaterial present on reinforcing steel is a least a factor of two less than that for the activecomponent in Dequest 2010. The oxygen functionality includes contributions principallyfrom iron oxide and phosphate from the inhibitor. In general, the corrosion inhibitionperformance of Dequest materials is not superior to the simple metal salts discussed earlier.
Summary and Observation
The mode of inhibitor interaction with reinforcing steel samples can be grouped into 3classes based on the surface analysis results:
• nitrite: interactions lead to the formation of an iron oxide surface butthe inhibitor itself is not adsorbed as nitrite;
,, borate: Interacts to form a coating on the reinforcing steel surfacerendering substrate iron undetectable by surface-sensitiveanalytical measurements;
33
o other inhibitors: interact via adsorption on reinforcing steel and lead toenhancement of oxide oxygen surface functionalities. In someinstances, the oxide functionality could be associated with ironoxide.
On the basis of surface analysis measurements alone, it is impossible to conclude that anyone inhibitor is better or worse than another, either in initial or delayed inhibition processes.However, the present findings are fully consistent with the known corrosion inhibitionabilities of materials in current use. Furthermore, because the promotion of a characteristicsurface iron oxide layer is typical of known inhibitors, it is concluded that any new substancethat produces a similar layer is itself likely to be a good candidate inhibitor. In addition,another potentially beneficial corrosion-inhibition process has been revealed in studies ofsodium metaborate solutions where a coating is produced on the reinforcing steel surface.
Mggratgon of Corrosioe_ gg_ibieors T&ro_g_ Concrege
The effectiveness of an inhibitor is influenced or even controlled by its deliverability to theconcrete-rebar interface. The study of a related phenomenon, diffusion of chloride inconcrete, has attracted attention as a part of the effort to understand the corrosion of steelreinforcing bars in concrete structures. However, the diffusion of corrosion inhibitor has notbeen investigated. In this part of the study, the migration of inhibitors in aqueous solutions,using sample test specimens designed to permit accelerated migration of inhibitor solution,has been examined. The principal objectives of this phase of the work were to evaluate therate of inhibitor migration, to determine whether any change in the chemical nature of theinhibitor had occurred as a result of interaction with concrete, and to inquire whether theanion to cation concentration ratio was affected by migration through the mortar disks. Theuse of mortar disks permitted acquiring information regarding the migration of inhibitors in ashort time frame. The combination of short experiment times and sensitive surface analysismethods enabled rapid evaluation of inhibitor migration and a determination of the chemicalnature of the migrating solutes.
The study of the migration of inhibitor solute species through concrete disks was investigatedby determining the volume of solution passing through the disks and by analyzing the upperand lower disk surfaces after exposing the disks to the solution for designated periods oftime. In the presentation of the results, the volume of solution migrating through the disks isnormalized by dividing the volume transported by the thickness of the disk. The data pointspresented in Fig. 3 represent the migration of solutions for rubidium chloride, sodiumchloride in pore solution, and sodium tetraborate in chloride-containing pore solution. Thedata points are not distinguished, in the figure, since the volume change measured for eachsolution followed the same behavior. The volume change is a linear function of the squareroot of time. This finding is in agreement with the prediction of the Washburn equation(35). The significant advantage of the present sample configuration is that the chemicalnature of the diffusing species can be determined by subsequent surface analysis of fracturedor whole concrete disks.
34
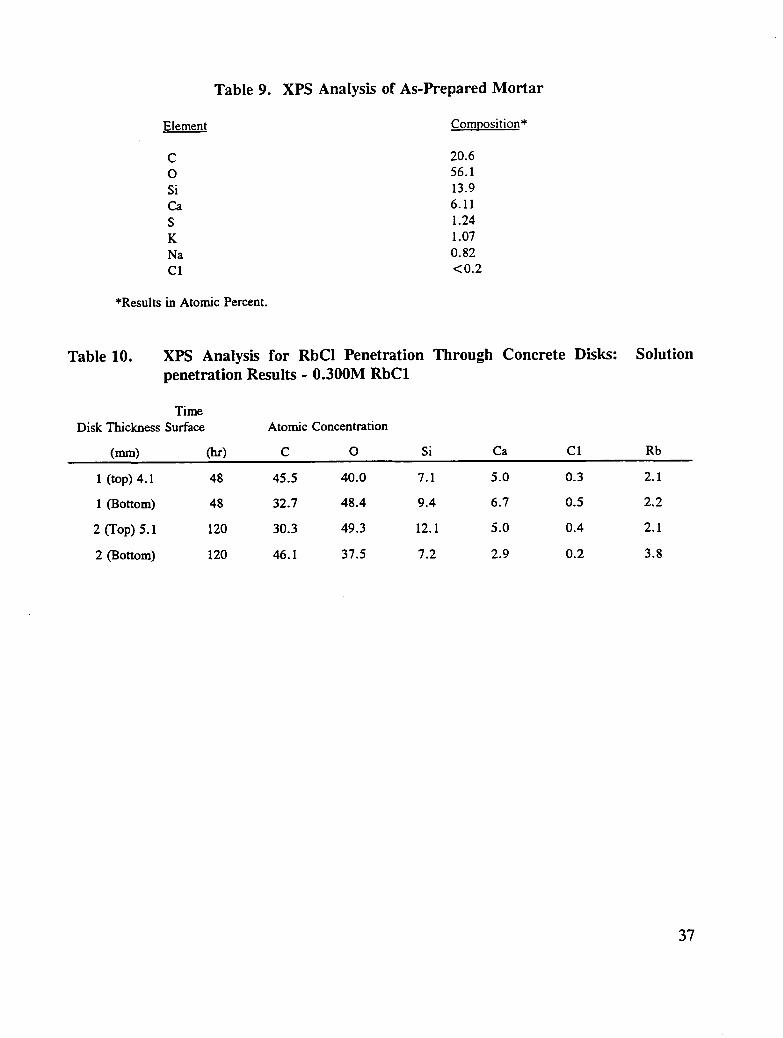
In the surface characterization measurements, the composition of a mortar (cement + sand)disk was determined in order to evaluate what elements, at what concentration, were presenton the disk surface and thus what species could be studied without interference in themigration process. The average elemental composition from measurements on arepresentative group of disks is presented in Table 9. The surface chemistry is characterizedby silicon, calcium, sodium, potassium, oxygen, sulfur, and carbon. Chlorine was detectedat the detection level (<0.2%) in some specimens. (The chemical nature of the metals, asinferred from binding energy measurements, corresponds to that expected for alkali (+ 1) andalkaline earth (+2) metals.) Silicon is present as silicon-oxygen species and sulfur exists assulfate in these specimens. In the concrete specimens, concentrations of inhibitor elementsthat are of interest are low or below the detection limits. Thus only the detection of inhibitor
that had migrated through the disk was possible.
The results for the migration experiments involving aqueous solutions of RbCI aresummarized in Table 10. Rubidium chloride was chosen because rubidium is readilyamenable to XPS analysis and is not present in concrete and thus provides an unambiguousresult. Solutions of RbC1 were ponded on one surface and evacuated on the other side oftwo disks of different thickness, 0.16 and 0.20 in. (4.1 and 5.1 ram), for 48 and 120 hours,
respectively.
The concentrations of rubidium on the top and bottom portions of the disks wereapproximately equal, indicating that after each time period, the salt had migrated through thedisk. Within the experimental error the chlorine content was the same for top and bottomparts of the disks. However, the chlorine content was significantly less than the rubidiumconcentration. If equivalent migration had taken place, equal atomic concentrations ofrubidium and chlorine should have been detected. The migration of rubidium appears, fromthe presented results, to occur more rapidly. To maintain electroneutrality, the migration ofrubidium with another anion, as a cation-anion pair, could have taken place, leading to alower chloride concentration. The identity of another potential anion is not revealed from thepresent XPS results.
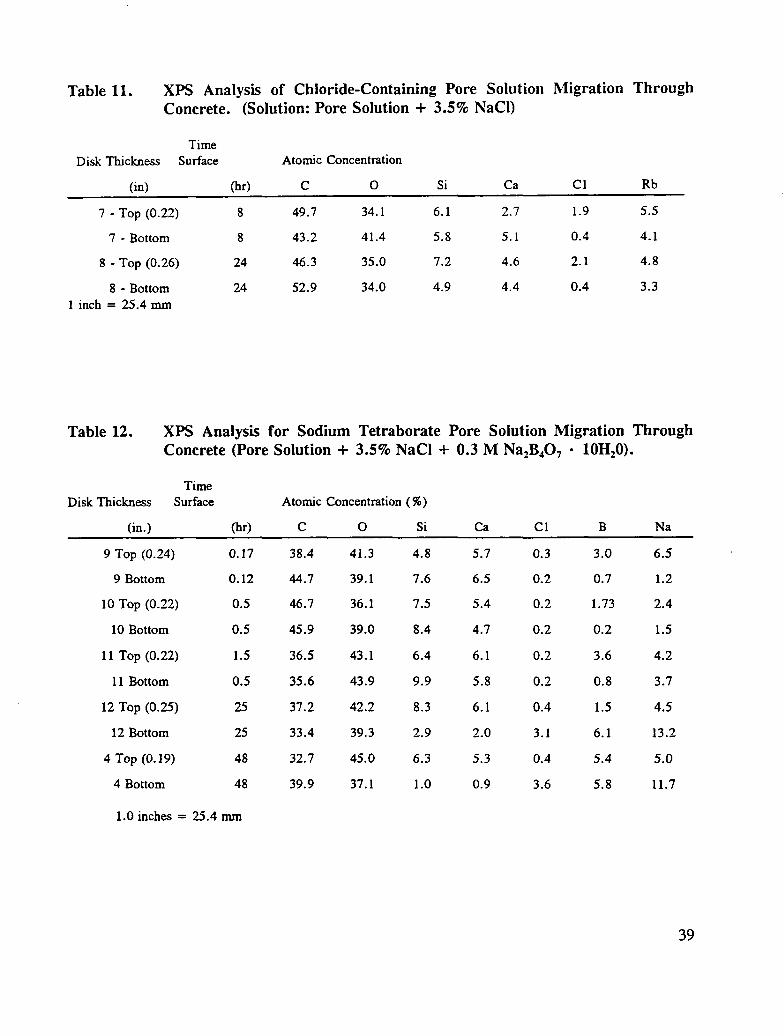
Since the migration experiments involving inhibitors was conducted using chloride-containingpore solution, the migration of pore solution containing 3.5 % NaC1 (by weight) was alsoinvestigated. The surface analysis data are given in Table 11. The analytical results forsodium and chlorine reveal that the cation migrated through the disk within 8 or 24 hours,for the specimens studied. The respective sodium concentrations on the top and bottomportions of the two disks are equal. The chloride concentration, on either the top or bottompart of the specimen, is less than that for sodium. It appears that an anion exchange processmust be taking place with species in the concrete specimen. Elements that could beassociated with the cation, including halide ions, were not detected in the XPSmeasurements. Although sulfate sulfur was detected in the spectra, the concentration ofsulfur does not change sufficiently or in a consistent manner such that it could be associatedwith cation migration. Migration of hydroxide ions along with the cation could take placeand provide an explanation for the observed results. An examination of the O ls
35
photoelectron spectra do not reveal any significant increase in hydroxide oxygen. However,an increase associated with hydroxide migration would be difficult to distinguish since theconcentration of oxygen from other chemical species in the concrete is high, especiallysilicon-oxygen and calcium-oxygen-containing entities.
The results for penetration into concrete by sodium borate in chloride-containing poresolution are presented in Table 12. Surface analysis results are presented as a function oftime for the upper and lower surfaces of the disks following penetration of the solute.Penetration of borate to the bottom of the disk occurs at about 24 hours as evidenced by the
large boron percent (6.1%) for that specimen. This percentage is to be compared with thevalue of 0.8% boron for the bottom surface of the specimen examined after 1.5 hours. It isalso noted that the chlorine and sodium concentrations are greater for the 24 hour specimenthan for the 1.5 hour specimen. This finding is related to the migration of sodium chloridefrom the pore solution. In addition, the silicon and calcium contents are smaller for thosesurfaces where inhibitor is present. This result is attributed to the fact that small crystalline
particles of inhibitor material were visible on the disk surface, thus masking the silicon andcalcium presence in the concrete. Since the inhibitor solution was in contact with the uppersurface of the disks for the duration of these experiments, it is surprising that the boron
content for the upper surfaces was not constant. The values range from 5.4% (48 hours) to1.5% (25 hours). The variation in the percent may be a result of the heterogeneity ofconcrete and the relatively small spots (1X3 mm2) that were analyzed on the disks. Thebinding energies for the B ls level in the salt that appeared on the upper, BE = 192.2 eV,and lower, BE = 192.3 eV, disk surfaces were equivalent to the value, BE = 192.2 eV,measured for 0.300M sodium borate-pore solution frozen on the XPS sample probe. Thus, itis concluded that interaction of aqueous borate with concrete does not result in degradation ordecomposition of the inhibitor. These results indicate also that introduction of borateinhibitor to the reinforcing steel-concrete interface as a result of borate migration should bepossible in a reasonable time period.
The experiments with MFP (sodium monofluorophosphate) yielded the surface analysisresults given in Table 13. Before considering the results, it is informative to recall theelements that exist in the inhibitor solution. The solution, composed of NaOH, NaC1, andNa2PO3F, (plus KOH and Ca(OH)2) yield respective total concentrations of Na = 1.500M;C1 = 0.600M; P = 0.300M; and F = 0.300IVi, or the atomic ratio Na:CI:F:P = 5:2:1:1.Analysis of the top surface of the disk in contact with MFP-pore solution for 8 hours exhibitsa ratio Iqa:CI:F:P = 5:0.75:1.1:1.2. This result is in agreement with the expected ratioexcept that the chlorine content is significantly lower than expected. Examination of theresults for longer exposures reveals that the chlorine percent remains at about 0.3%, a levelwhich is near the detection limit for chlorine. It is reasonable to suggest that chlorine aschloride is adsorbed below the surface of the disk. Following 24 hours of exposure and upto 114 hours, the concentration of sodium at the upper disk surface remains at aconcentration of 5-6%, while the concentration on the lower surface is in the range of 1-3%.If it is recognized that sodium from IqaCl and IqaOH represent 60% of the total sodiumpresent, and if the initial sodium content for the 8 hour top surface is taken as representative
36
Table 9. XPS Analysis of As-Prepared Mortar
Element Composition*
C 20.6O 56.1Si 13.9Ca 6.11
S 1.24K 1.07Na 0.82C1 <0.2
*Results in Atomic Percent.
Table 10. XPS Analysis for RbCI Penetration Through Concrete Disks: Solutionpenetration Results - 0.300M RbC1
TimeDisk Thickness Surface Atomic Concentration
(ram) (lu') C O Si Ca C1 Rb
1 (top) 4.1 48 45.5 40.0 7.1 5.0 0.3 2.1
1 (Bottom) 48 32.7 48.4 9.4 6.7 0.5 2.2
2 (Top) 5.1 120 30.3 49.3 12.1 5.0 0.4 2.1
2 (Bottom) 120 46. I 37.5 7.2 2.9 0.2 3.8
37
.0
Table 11. XPS Analysis of Chloride-Containing Pore Solution Migration Through
Concrete. (Solution: Pore Solution + 3.5% NaCI)
Time
Disk Thickness Surface Atomic Concentration
(in) Oar) C O Si Ca CI Rb
7 - Top (0.22) 8 49.7 34.1 6.1 2.7 1.9 5.5
7 - Bottom 8 43.2 41.4 5.8 5.1 0.4 4.1
8 - Top (0.26) 24 46.3 35.0 7.2 4.6 2.1 4.8
8 - Bottom 24 52.9 34.0 4.9 4.4 0.4 3.31 inch = 25.4 mm
Table 12. XPS Analysis for Sodium Tetraborate Pore Solution Migration Through
of the concentration for sodium for solute that has not migrated sufficiently into the disk,
then the expected concentration for sodium, if it had penetrated the disk at longer times,would be greater than 8%. The sodium content on the lower disk surface, 1-3 %, indicatesthat sodium has not penetrated the disks in these experiments.
The concentration of phosphorus on the top disk surfaces remain at about 6-4-1%, while thaton the lower portion of the disks is 0.3+0.1%. The concentration of fluorine does notchange significantly on the lower disk surfaces. These data indicate that phosphorus andfluorine and thus MFP does not appear to migrate through the concrete disks under thepresent experimental conditions.
The surface analytical results for MFP elements show that before 8 hours the P:F ratio wasthe expected 1:1, within experimental error. Beyond 8 hours, the P:F ratio is in the range8.1 to 4.7, with an average value of 5.8 for 4 specimens. This result indicates that chemicalalterations must be occurring for MFP as a result of its interaction in pore solution withconcrete. The photoelectron spectra in the F ls region for a frozen (-150 ° C) 0.300M MFPpore solution and for the top portions of disks following migration experiments are shown inFig. 3. For MFP dissolved in pore solution, only one fluorine photopeak is detected; F IsBE = 687.5 eV. This binding energy is consistent with values measured for fluorine bonded
to phosphorus in other fluorophosphates (36). The F ls photoelectron spectrum is for the topportion of a disk following MFP interaction with concrete for 8 hours reveals 2 fluorinepeaks with binding energies at 688.0 and 685.3 eV. The higher binding energy photopeak is
41
associated with fluorine attached to phosphorus in monofluorophosphate.
The fluorine photopeak at the lower binding energy is assigned to fluoride as metal fluoridesor as adsorbed fluoride. In the fluoride spectra for concrete specimens that had been exposedto MFP for longer time periods (24 and 72 hours, see Fig. 3A), only one F ls peak is notedwith a binding energy at approximately 685 eV. These findings support the notion thatinteraction of MFP with concrete leads to chemical changes in MFP and that these changesoccur within 24 hours. The surface analysis results are consistent with the formation offuoride and phosphate specimens in the hydrolysis reaction. Assuming that fluoride isproduced, the surface analytical results, which show a greater concentration of phosphorus onthe disk surface, indicate that fluoride is not as strongly adsorbed on the concrete surface asis phosphate or that fluoride diffuses into the concrete disk at a faster rate than phosphate.These findings demonstrate that MFP itself may not be the effective inhibitor, but itshydrolysis products may be the active species delivered at the reinforcing steel-concreteinterface.
Smmary arid Gbservaiore
The migration of inhibitor constituents through mortar disks has been studied, and themigration followed a square root of time dependence. The migration time was determinedby measuring the change in volume for solutions in contact with concrete disks while oneside of the disk was maintained under vacuum. Analysis of the disk surfaces was used alsoto measure the time required to penetrate the disks. The chemical nature of the emergingsolute was evaluated with respect to elemental concentrations and chemical form frombinding energy measurements using photoelectron spectroscopy. The transport of sodiumtetraborate through the disk resulted in no chemical change in the inhibitor. Migration ofsodium monofluorophosphate, however led to hydrolysis of the salt. It is suggested that thehydrolysis of monofluorophosphate produces fluoride ions and phosphate species in solution.The effect of these ions on the integrity and strength of concrete was not investigated.
Eecerec&emc Studies of eke Effec of nhibieozs einfozcig SeeeCorzos
The measurement of electrochemical potential has been used to evaluate relative inhibitoreffectiveness. Measurements were made as a function of time; both in the presence andabsence of inhibitors and at various concentrations. The results are presented andcomparisons are made with parallel tests using visual inspection and surface analyticaltechniques.
Protocol I
The variation in potential for the 18-week tests is summarized in Figs. 4 through 6, forsodium monofluorophosphate, sodium nitrite, and sodium tetraborate, respectively. The
42
important result is that these 3 inhibitors were effective in making the corrosion potentialmore positive. Only in the last 8 weeks did the potential approach a passive condition (i.e.,potential of reinforcing steel in pore solution only) for some of the reinforcing steels ininhibitor-containing solutions. There are 2 aspects of this experiment which mitigate againstits use as a screening technique. First, there was great variability in the potentialmeasurements taken with cylindrical reinforcing steel. Second, the effect of the inhibitorswas revealed only after 12-14 weeks, and over this period complications were introduced bythe deterioration of the electrical connections and the epoxy which covered them. To combat
these problems, A36 flat bar was used in all subsequent experiments measuring the potentialof the reinforcing steel-SCE reference electrode couple.
Protocol 2
The objectives of this experiment were the following: to determine whether flat stock A36steel gives less variability in potential measurements than cylindrical reinforcing steel, todetermine the influence of sodium nitrite concentration on electrochemical potential, and todetermine whether the method of cleaning (acid-washing plus cleaning in hexane compared tocleaning only in hexane) influences the potential measurements using flat stock mild steel.
The results of these studies showed that flat mild steel showed less variability in potentialmeasurement, and the effects of the inhibitor were revealed after approximately four weeks.The results are presented in Figs. 7 through 10. Fig. 11 shows the variation in potential foracid-washed/hexane-cleaned flat reinforcing steel in pore solution containing no chloride orinhibitor. The results demonstrate that the measured potential was relatively constant duringthe test. The results in Figs. 12 and 13 show the dramatic change in potential for flat stockimmersed in pore solution containing 3.5 % NaC1 (by weight). In these tests the potentialwas more negative, indicating that severe corrosion occurred within two weeks of initiatingthe test. The effect of added NaNO2 at two different concentrations is shown in Figs. 7through 10. It is apparent in these figures that more positive potentials were obtained in ashorter time for the more concentrated inhibitor solution.
The significant conclusions after 12 weeks are the following:
• Flat mild steel stock gave less variability in potential measurements than cylindricalrebar.
• The method of cleaning did not seem to influence the differences in potentialmeasurements.
• The higher concentration (0.670M) of sodium nitrite did not give a more positivepotential than the highest concentration previously used (0.300M).
• The time to recovery of an "inhibited" reinforcing steel surface was more rapid formore concentrated solutions.
The only corrosion observed on the reinforcing steel specimens was located at the reinforcingsteel-epoxy interface. Upon removing the epoxy, the ends of the bars immersed in 0.670M
43
NaNO2 were comparable to the ends of the bars in pore solution only; they appeared onlyslightly corroded. However, the corrosion on the ends of the bars exposed to the salt/noinhibitor solution was severe. The bars immersed in pore solution containing chloride and0.300M sodium nitrite were somewhat corroded. The potentials were monitored for 10weeks following the removal of the epoxy, and a substantial increase was noted in the control(salt/no inhibitor). It seems that the ends of the reinforcing steel became repassivated whenexposed to the highly alkaline conditions of the pore solution (pH 13.5).
Protocol 3
Protocol 3 was devised to investigate the effect of sodium tetraborate on precorroded A36flat bar stock. After 1 day of being immersed in pore solution containing 3.5 % NaC1 (byweight, and the pore solution, sodium chloride and sodium tetraborate, the potentials of theprecorroded reinforcing steel increased dramatically. The results are presented in Fig. 14.This occurred for all specimens, even the control. The potentials increased even further overthe next several days, and remained in the low-probability of corrosion state for the length ofthe experiment. An interpretation of this result is that in the highly alkaline conditions of thesimulated pore solution prevented the ongoing activity of the corrosion cell. Also, with thelack of stress points and areas in which the pH could be more acidic than the pore solution(13.5), the initiation of corrosion could not take place.
Protocol 4
This protocol was designed to produce a control condition of continuously active corrosion,thus enabling one to screen inhibitors without immediate repassivation. There was not asubstantial difference in potential between the control and inhibitor solutions during the first18 days. However, with the decreased salt concentration and/or increased inhibitorconcentration, differences in inhibitor performance were revealed as presented in Tables 14and 15. In general, sodium nitrite, a known corrosion inhibitor, performed the best over thewide range of pH values. It produced the highest increase in potential for pH values, 8, 10,12 and 12.5. Sodium monofluorophosphate, another known corrosion inhibitor, performedsecond best, except at pH 13.0 where it ranked relatively poorly. Sodium tetraborateexhibited excellent behavior in this experiment and ranked as the best inhibitor at pH 13.0.Tetrabutylphosphonium bromide was ineffective at 0.100M concentration except at pH 13.0.There were also noticeable changes in pH. For the sodium nitrite solutions, there was ageneral increase in pH at initial pi,i values of 8 and 10. This may be attributed to theformation of OH- anions in solution from hydrolysis involving NO2- with I-I20. For sodiummonofluorophosphate solutions, there was a decrease in pH for initial pH values of 10 and12. A process which may account for this observation is the hydrolysis of MFP in solutionsto produce I-IF.
44
47
48
(_u) ID!J,Ue_Od
.____. 49
(AW) IO!_.ue,tocl
51
o
e_l _"m
m
=oI-
E-
z
_=x
", 0_z
-<.=.
=o-a
i i _ 0 = =
o o o o o _0I,_ t_ I,_ I._ i.'3 ..Od rt_ _" _ ¢D _.oI I I I I ;_,_
(AUJ) ID!,I.Ue,I.Od
.__52 a,
o
ed =
.0
z _-CD _ ,.
_,_ .,i
ell ,-.
_.=,_. o
om
e_
o
=,_oJ..I
o_ oN
0 "_,o0 0 0 0 0 =c_
N _" _ tOi I I I I
(AUJ) ID!_Ue_d.___ 53
Comparison of V_zual Znspec_on and Surface Analysis
Corrosion screening tests demonstrate that sodium nitrite, sodium monofluorophosphate andsodium tetraborate are all good corrosion inhibitors. Results from Protocols 1, 2 and 4support these findings. Surface analysis measurements suggest that sodium tetraborate reactsto form a coating on the reinforcing steel surface. This coating could function as a barrierlayer to inhibit chloride-induced corrosion, thereby increasing the electrochemical potentialvalues as noted in Protocols 1 and 4. Furthermore, surface analysis of MFP-treated
reinforcing steel suggests hydrolysis of MFP as a likely cause of the resultant non-unityphosphorus-to-fluorine atomic ratio on the reinforcing steel surface. This idea is supportedby the decrease in pH noted for initial pH values 10 and 12 in Protocol 4.
Se,mmary ae_d _bserva_or,
Known corrosion inhibitors, sodium nitrite and sodium monofluorophosphate, are effective at
making the corrosion potential of reinforcing steel in chloride-doped pore solutions morepositive, as is sodium tetraborate. Sodium tetraborate is especially effective at pH 13.0, thepH that most closely simulates the concrete environment.
Pore solution produces an environment that is too alkaline for rapid screening of inhibitors.This highly basic solution results in rapid repassivation of corroded reinforcing steel. It doesnot accurately simulate the reinforcing steel in concrete conditions because the high alkalinityis continually maintained.
Long-term monitoring of corrosion potentials is a useful method to study the behavior ofcorroding reinforcing steels in a bridge deck or laboratory test pad. However, the procedureis too slow for screening inhibitors at reasonable concentrations.
_ecemmendat_em
The following are the recommendations for part one of this investigation.
Treatment Method I:
This technology is well known as a liquid/solution treatment for existing structureswith or without preliminary drying or any concrete removal. After preliminarydrying, a concrete structure will readily imbibe a solution during subsequent coolingand reabsorption of moisture. The technique is the most direct available fordelivering inhibitor to the reinforcing steel surface without any physical concreteremoval.
Known materials for this application include calcium nitrite solutions. Materialsrecommended for further evaluation: solutions of alkaline and alkaline earth metal
borates, calcium borate, zinc borate, and alkali silicates.
56
Treatment Method II:
Partial removal of concrete by milling, grooving, or drilling to displace heavilycontaminated concrete and provide more efficient access of inhibiting agents to thereinforcing steel.
Recommendations from C-103-2B, "Removal of Chloride-Contaminated Concrete",for materials for further evaluation: alkaline and alkaline earth metal borates, boric
acid, zinc borate. Treatment may be with solutions (with or without preliminarydrying); in situ treatment with the recommended inhibitors in solid form deservesengineering evaluation.
57
Table 14. Protocol 4 Inhibitor Screening Test Values.*
Corrosion Potentials (SCE)
Test Series Before
Inhibitor 1 day 3 days 6 days 9 days
Control
pH 8 -634 -547 -492 -487 -497
pH 10 -649 -560 -527 -527 -556
pH 12 -642 -508 -483 -469 -504
0.100 MSodium tetraborate
pH 8 -628 -528 -492 -501 -498
pH 10 -649 -490 -463 -463 -507
pH 12 -647 -648 -389 -432 -489
0.100 MSodium nitrite
pH 8 --645 -495 -455 -469 -473
pH 10 -630 -497 -457 -461 -470
pH 12 -646 -463 -448 -434 -465
0.I00 M
Sodium monofluorophosphate
pH 8 -635 -487 -472 -486 -495
pH 10 -645 -497 -471 -476 -483
pH 12 -636 -509 -503 -473 -522
0.100 M
Tetrabutylphosphonium bromide
pH 8 -635 -554 -480 -475 -511
pH 10 -632 -554 -504 -528 -547
pH 12 -636 -531 -498 -490 -529
*(Average-duplicates exposed to 10% NaCI (by weight) in DI water at 140*F (60"C). The inhibitor concentrationwas 0.1 M.
58
Table 15. Results of Protocol 4 Inhibitor Screening Test Values.*
Test Before After 18 days After 3 After 6Series Inhibitor previous exposure days at days at
10% NaCI in (by weight) New Cond. New Cond.DI water, 60°C0.1 M inhibitor
* Averages of duplicate samples exposed to 1.75% NaCI (by weight) in deionized water. The inhibitorconcentration was 0.600 M for all inhibitors except tetrabutylphosphonium bromide which was 0.100 M.
59
3
Part II: Development of Feasible Corrosion Inhibitor andChloride Scavaging Treatments
Introduction
The non-electrical techniques which axe employed in reinforced concrete construction toprotect steel against corrosion can be categorized into three basic types of protectionschemes:
1. modifications to the concrete to either decrease the diffusion of chlorides,2. increase the threshold level of chlorides needed to initiate corrosion, and
3. modifications to the reinforcing steel.
Most of the protection techniques currently used axe grouped into the first category in whichthe concrete environment is directly altered. This can be accomplished in the concretedesign stage by utilizing the lowest water/cement ratio and by complete consolidation toreduce the permeability of the concrete, and by design and construction of required coverdepths. However, in severely aggressive environments, additional measures may benecessary to increase the impermeability of the concrete.
One widely-used technique to increase concrete impermeability is the placing of overlaysystems on bridge decks, which includes the use of latex-modified concrete, polymerconcrete, and low-slump dense concrete.
Polymers axe also extensively used as both concrete surface coatings and for impregnation.Epoxy surface coatings reduce the rate of penetration of chloride-containing moisture andsomewhat limit the ingress of oxygen necessary to fuel the corrosion process. Polymerimpregnation involves the penetration of a liquid monomer into the voids of hardened
61
concrete and subsequent in situ polymerization. Current impregnation measures havecentered around the use of methyl methacrylate.
Common corrosion prevention practice also incorporates the use of corrosion inhibitingadmixtures, both organic and inorganic. The mechanism of inhibition varies, dependingupon the chemical nature of the inhibitor and the factors causing the corrosion, butfundamentally, they act to form a stable film on the reinforcing bar surface which in turnrequires higher levels of CI or longer time periods in order to penetrate to the bare metalsurface. Inhibitors are currently being used as admixtures in new concrete structures as apreventative measure.
Besides modification of the concrete environment, the reinforcing steel surface may also betreated prior to concrete placement. However, this technology has little application in thisinvestigation because the scope of the project is limited to treating existing chloride-contaminated concrete built with bare reinforcing steel.
1ResearchObjec1: veand Alppreach
The primary objective of Part H is to evaluate the effectiveness and feasibility of removingchloride-contaminated concrete in conjunction with the application of chemical treatments asa possible method for mitigating corrosion in chloride-contaminated bridge components.
The objective was fulfilled through the completion of two phases of testing. The first phaseconsisted of the accelerated exposure of small scale reinforced concrete specimens to asimulated deicing salt environment until the initiation of corrosion. The chloride-contaminated concrete above the reinforcing steels in each specimen was removed and theremaining groove was treated chemically through a ponding of treatment solution and/orbackfilling with a chemically treated mortar. Several corrosion inhibitors, polymer sealers,and a chloride scavenger were tested individually and in combination to ascertain the mosteffective treatment. Seventeen different treatment combinations were applied to specimensand an untreated control specimen was included. The corrosion behavior of the specimenswas monitored after treatment. From this phase of the study, the relative effectiveness of thetreatments could be compared over a prolonged exposure period.
The second phase of the study addressed the effects of the treatment chemicals on thestrength and resistivity of mortar when admixed. The treatments were evaluated through thetesting of mortar cubes cast with varying concentrations of the chemicals. The testinginvolved the measurement of compressive strength and electrical resistivity during severalpoints in the curing stage of the mortar cubes. These tests would assess the acceleration orretardation of the hydration process and identify changes in resistivity that may increase ordecrease the corrosion rate.
62
Experimental Program
Introduction
The state of reinforced concrete bridges subjected to chloride-laden environments wassimulated in the laboratory using scaled-down reinforced concrete specimens. Thirty twospecimens were cast containing two lengths of reinforcing steel in each specimen. After aninitial period of curing, the specimens were exposed to alternate wetting with sodiumchloride solution and drying at an elevated temperature.
The corrosion activity of the specimens was monitored using both a saturated calomel half-cell (SCE) to measure corrosion potentials and a linear polarization device (3LP) to measurecorrosion rates. When corrosion activity in the reinforced concrete was confirmed throughboth electrochemical measurements and measurements of the chloride ion concentration at the
reinforcing steel level, seventeen specimens were deemed suitable for the application ofanticorrosion treatments.
The treatment substances consisted of commercial and experimental inhibitors, two polymersealants, and an experimental chloride scavenging mineral. The application of the treatmentsinvolved removal of chloride-contaminated concrete above the corroding reinforcing steels ineach specimen and the subsequent treatment through ponding and/or backfilling with a treatedmortar. Comparison of the treated specimens to an untreated control specimen andevaluation of the pre- and post-treatment corrosion behavior allowed for the determination ofeach treatment's effectiveness in reducing corrosion activity. From this study, the mosteffective treatment could be selected for large-scale study and possible field application.
In addition to the electrochemical testing, tests were also conducted to determine the effect ofusing the treatment admixtures on mortar strength and resistivity. Mortar cubes were cast
• containing various concentrations of treatment substances. During the first twenty days ofcuring, cubes were periodically tested for both compressive strength and mortar resistivity.These measurements served as an indicator of any deleterious effects caused by admixing thetreatment substances. The suitability of each treatment is dependent not only on itscorrosion-arresting ability but also on any potentially detrimental effect on the properties ofconcrete.
Apatite, a mineral, was incorporated into the scope of this study as a possible chloride-ion-scavenging mineral. Unlike the other treatments used, apatite has had no formalinvestigation of its ability to aid in the reduction of corrosion in reinforced concrete. As aresult, tests were conducted to determine its effectiveness in consuming chloride ions in bothan aqueous medium and in concrete.
63
M_ter_ls
Coarse and Fine Aggregates
The coarse aggregate used in this study was crushed limestone quarried near Blacksburg,Virginia. The fine aggregate used was natural sand, primarily containing mica, quartz andsandstone, and was processed near Wytheville, Virginia. The gradations and other physicalcharacteristics of both aggregates are given in Appendix A, Tables A-1 and A-2.
Cemeng
For all concrete and mortar mixes in this investigation, Type I Portland cement was used.
Ckem_ca_ Adm_z_zes
In order to attain the desired concrete and mortar characteristics, an air-entraining admixture,
water-reducing agent, and initial set retarder were used.
Corros_oz_ Abaeeme_ Trea_e_ts
The study included inhibitors, polymer sealants, and a suspected chloride-ion-scavengingmineral.
Based on the results of Part I of this investigation involving aqueous corrosion tests in
simulated pore solution and a search of newly introduced commercial products, the followinginhibitors and sealants were selected as treatments after removal of chloride-contaminatedconcrete:
1. I)CI (calcium nitrite, Ca(IqO2)2): An anodic inhibitor developed by the W'R GraceCompany that currently has widespread use as an admixture in new reinforced concretestructures.
2. TCI (sodium monofluorophosphate, Na2POaF): An inhibitor developed by the DomtarCorporation. TCI was developed to be added to deicing salt and through subsequentapplications is said by the manufacturer to diffuse to the reinforcing steel surface.
3. Sodium tetraborate (Na2B4OT)." experimental inhibitor that interacts to form a coatingon a reinforcing steel surface which serves as a barrier to metal dissolution [38]. Thehydrated form of sodium tetraborate (Na2B4OT* 10I"I20) was used.
4. Zinc borate (2ZnO° 3_O3): experimental inhibitor evaluated in conjunction withsodium tetraborate to determine the effectiveness of varying borate forms. This studyevaluated the hydrated form of zinc borate (2ZnO° 3B203- 3.5H20).
64
5. ALOX 901 (proprietary): An organic inhibitor manufactured by the Alox ChemicalCompany.
6. CORTEC VCI-1337 (proprietary blend of surfactants and amine salts in a watercameO: an organic corrosion inhibitor that is designed to migrate through concrete and isattracted to the surfaces of steel reinforcing bars. The inhibitive substance supposedly
migrates via vapor phase transport and forms a protective molecular monolayer on thereinforcing steel surface. This inhibitor was developed to be applied through surfaceinjection.
7. CORTEC VCI-1609 (Proprietary alkanolamine): The inhibitor works under the sameprinciple as VCI-1337 but has a different formulation and is used as an admixture toconcrete.
8. Silicone: a Dow Coming sealer dissolved (10% by weight) in hexane. It serves as
polymeric barrier on concrete, reducing any ingress of chlorides, oxygen, and water.
9. Styrene-acrylic: a National Starch copolymer sealer dissolved in (10% by weight) indistilled water and treated with a coalescence agent (ethyl acetate). It serves as a polymericbarrier on concrete, reducing any ingress of chlorides, oxygen, and water.
In addition to the above substance, a synthetic hydroxylapatite (Ca_0(PO4)6(OH)2)wasevaluated as a possible chloride-ion-scavenging mineral. The hydroxyl form of apatite waschosen because it is the most widespread apatite mineral and it could be obtained in thenecessary quantities for experimentation. Hydroxylapatite has the general formulaM_0(XO4)67_awhere M can be various metals or H30 •As, Ge, P, Si, or Cr, and Z=OH, F, C1, Br, or CO3. Apatite is being studied as a possible chloride ion scavengerbecause substitutional solid solution is extensive among the apatite series members [37].Therefore, it has been hypothesized that the possible substitution of CI for OH in thehydroxylapatite molecule may serve as a corrosion-limiting reaction.
Specimen Preparation
Specimen Configuration
Molding forms for sixteen specimens were constructed in order to cast specimens ofdimensions 16 in. (40.6 cm) L x 8.5 in. (21.6 cm) W x 3.25 in. (8.3 cm) H as shown inFig. 15.
The reinforcing steel used in the specimens was ASTM standard A615 reinforcing steel witha diameter of 0.5 in. (1.27 cm). For each specimen, two pieces of reinforcing steel were cutto a length of 17.5 in. (44.45 cm) and one end of each reinforcing steel was drilled andtapped to accommodate 1/8 in. (.32 era) diameter screws. The reinforcing steels were
65
cleaned with hexane to remove any residual rust and oil, and 2.5 in. (6.35 cm) of eachreinforcing steel end was masked with electroplating tape leaving a bare steel length of 12.5in. (31.75 cm). Masking the ends of the reinforcing steels eliminated the possibility of theexposed ends corroding after concrete placement and provided a known corroding length ofsteel.
Specimen Casting
In order to achieve a 3/4 in (1.91 cm) cover depth over the reinforcing steels, the concretespecimens were cast inverted so that the top surface of the final specimen was formed at thebottom surface of the mold. This was done in order to minimize the possibility ofsubsidence cracking with such a small cover depth.
Several trial concrete batches were mixed to determine the mix composition that yielded thedesired concrete properties. The final mix composition and physical properties are detailedin Appendix A, Tables A-3 and A-4. Four batches of this concrete composition were mixed,with each batch providing concrete for four specimens (Set A). The forms were set on aSyntron vibratory table during placement of concrete to insure proper consolidation.
A second set (Set B) of 16 specimens was cast using the same molds and procedurementioned above. The concrete mix composition and physical properties are presented inAppendix A, Tables A-5 and A-6.
Post-casting Treatment
In order to aid in accelerating the diffusion of chlorides and the eventual initiation ofcorrosion in the specimens, the cast specimens were only allowed to cure for a short periodof time before application of sodium chloride solution. The short cure time allowed for onlylimited hydration of the concrete, thus leaving the concrete more permeable. Set Aspecimens cured in air at room temperature for 24 hours at which time they were removedfrom the formwork and their top surfaces (surface in contact with form bottom) were etchedwith muriatic acid to remove any residual form oil. Set B specimens were allowed to curefor 72 hours in air before being removed from the formwork and etched.
After the etching process, both sets of specimens were placed in a drying oven at 150°F(65.5°C) for 24 hours. Subjecting the specimens to an elevated temperature served to driveout a portion of the unbound water near the surface of the concrete. Removing water fromthe pore system would aid in accelerating the diffusion of chlorides through the concrete.
As a means of simulating the single surface diffusion on a bridge deck surface, the sides ofeach specimen were coated with 2 layers of epoxy. The bottom surfaces of the specimenswere left uncoated to allow for oxygen diffusion during the ponding stage. A plexiglassponding dike was attached to the top of each specimen using a silicon rubber sealant.
67
Co_'ros_on _nit_ation
The specimens were subjected to alternating 3 day pondings with 25.4 ozs. (750 ml) of 6%by weight NaC1 solution and 4 day dryings in a conditioning chamber. The drying cycleconsisted of 24 hours at room temperature and 72 hours at 150 °F (65.5 ° C). Plexiglasscovers were placed over the ponding dikes to minimize moisture loss and solutions wereremoved after the ponding cycle using a wet/dry shop-vac.
Prior to the first wetting cycle, half-cell potential measurements using a reference half-celland hand-held multimeter were taken at three positions spanning the area directly above eachreinforcing steel. A saturated calomel electrode (SCE) was used as the reference half-celland measurements were adjusted to the copper sulfate half-cell (CSE) based on the knownpotential difference. Subsequent potential measurements were taken after the first day ofdrying following each ponding cycle.
Both sets of specimens were cycled until there was a sustained drop in the half-cell potentialsto indicate a high probability of corrosion based on the corrosion probability ranges (30). Inorder to support the indication of corrosion, a three electrode-linear polarization device (3LP)developed by Kenneth C. Clear, Xnc.,was used to measure the corrosion current of eachreinforcing steel. The 3LP test procedure is based on the Stern-Geary equation (38), with B= 40.76, and simply measures the amount of current change needed to polarize the workingelectrode (rebar) to a fixed change in potential. Since corrosion current (Icon.)is directlyproportional to corrosion rate, the I_o,values could be used to determine the extent ofcorrosion activity in the specimens.
The resulting corrosion current values were interpreted based on the following guidelines[39]:
damage possible in the range of 10 to 15 years* 1.0 mA/ft2 < I_ < 10 mA/ft2 ..... > corrosion
damage expected in 2 to 10 yearso Io,_ > 10 mA/ft2 ..... > corrosion damage expected
in 2 years or less
Corrosion current values greater than 1.0 mA/ft 2 were considered indicative of adequatecorrosion activity to start treatments.
Ch_or_e Co_centra_:_o_ l_ea_re_e_
A third means used in characterizing the corrosion activity in the specimens prior totreatment was the measurement of the chloride ion concentration at the reinforcing steellevel. Using an impact hammer/drill and vacuum assisted collection device, concrete powder
68
samples were taken from a depth of 1/2 in. (1.27 cm) to 1 in. (2.54 cm) at a locationbetween the reinforcing steels in each pad. The measurement of the chloride content of sucha sample would approximate the chloride ion concentration at the reinforcing steel surfacelevel of 3/4 in. (1.91 era).
The chloride ion concentration of each sample was measured twice using a specific ionelectrode test procedure. The basic procedure involved the extraction of CI from the powdersamples via an acidic digestive solution and the use of a Cl-specific ion probe to measure theconcentration in terms of a voltage. This voltage reading is used in a determined calibrationequation that yields the ion concentration in terms of lbs/yd 3.
Chloride levels exceeding 1.2 lbs/yd 3 (0.71 kg/m 3) [18] were considered sufficient to initiatecorrosion of the reinforcing steel in the specimens.
Treatment of Specimens
Before application of the treatment, the chloride-contaminated concrete above the reinforcingsteel in each pad was removed. A groove area 2 in. (5.08 cm) wide and 3/4 in. (1.91 cm)deep was marked off for removal along the length of each pad above each reinforcing steelas shown in Fig. 16. A masonry saw was used to make four 1/8 in. (0.32 era) wide, 3/4 in.(1.91 cm) deep cuts within the 2 in. (5.08 cm) groove width above each reinforcing steel,being careful not to contact the reinforcing steel. The remaining concrete in the groove areawas then removed using a masonry chisel in order to expose the top portion of eachreinforcing steel.
Most of the specimens of Set A had developed cracks above the reinforcing steels due to theexpansion of corrosion products prior to grooving. During grooving, the first specimen ofSet A split in two as the crack above the reinforcing steel propagated under the stress of themasonry saw. The exposed bar was uniformly corroded and had lost about 1/8 in. (0.32 cm)of its diameter, thus, for the most part, specimens from Set A were determined to be toohighly corroded for assessing the efficiency of the proposed abatement treatments. However,two of the specimens that exhibited lower corrosion currents and higher potentials wereselected to be treated and will be referred to as specimen A-13 and specimen A-15.Specimen A-13 was left ungrooved while A-15 was grooved. No problems were experiencedwith the grooving of Set B,therefore, eighteen specimens were deemed suitable for treatment.
Application of Treatments
The treatments and combinations of treatments applied to the eighteen specimens are listed inTable 16. The treatment concentrations are expressed in Molar concentrations for pondingapplication and in terms of % s/s (percent molecular weight of the salt to cement weight)cement for mortar applications. Mortar concentrations were determined as follows:
69
70
Table 16. Corrosion abatement treatments
SPECIHEN PONDING TREATHENT MORTARTREATMENT
B-1 (Control) None Untreated
B-2 None DCI (@30_ solids) added at 5% s/s cement
B-3 .1N DCI solution DCI added at 5_ s/s cement
B-4 .1N TCI solution Untreated
B-5 None Hydroxytapatite added at 24_ s/s cement
B-6 None Sodium tetraborate added at 1_ s/s cement
4. Hydroxylapatite: the apatite concentration was based on the theoretical removal ofCI by the two hydroxyl groups in each molecule of hydroxylapatite. An apatiteconcentration was calculated that would theoretically remove 10 lbs C1-/yd3 (5.93 kg/m 3) ofconcrete.
For both sodium and zinc borate, all concentrations were based on the unhydrated, reactiveportions of their molecules, Na2B407 and 2ZnO. 3B203 respectively.
For the ponding treatments, the grooves were filled with the treatment solution, covered withplastic to limit evaporation, and allowed to sit for ten days. For specimens B-13 and B-14,the polymer sealants were ponded in the bottom 1/4 in. (0.64 cm) of the grooves for twohours after which the remaining solvent solution was decanted off. Each bar in specimen B-15 was treated with 10 g of sprayed polymer sealant solution. Specimen A-13 was notgrooved in order to evaluate the effectiveness of CORTEC 1337 migratory inhibitor throughconcrete without exposed reinforcing steel.
Upon completion of the 10-day treatment exposure period, the grooves were backfilled withdoped or undoped mortar, depending upon the treatment combination (Table 16). The basicmortar mix for the backfill is detailed in Appendix A, Table A-7. In order to insureadequate bonding between the groove surfaces and the new mortar, the grooves were surface-moistened with water mist and a thick cement slurry was applied to the grooves prior toplacement of the mortar. The specimens were placed on a vibratory table during mortarplacement to insure proper consolidation.
All the backfilled specimens were placed under moist burlap and a plastic sheet cover andallowed to cure for 7 days. During the curing period, the burlap covers were moistenedperiodically.
Corrosion of Treated Specimens
At the completion of the 7-day cure, half-cell potential and corrosion current measurementswere taken for each bar in the specimens. The ponding dikes were replaced on thespecimens and the ponding/drying cycle was resumed, but with 3 % by weight NaC1 solution.
During the post-treatment corrosion monitoring, careful attention was paid to the formationof any cracks on the specimens, especially around the mortar/groove interface.
A corrosion treatment's effect on mortar properties must be considered in addition to itscorrosion abatement effectiveness if it is proposed for field use. In order to evaluate theproposed treatments' effects on mortar, 2 in. (4.08 cm) mortar cubes were cast, inaccordance to ASTM C-109-80 " Compressive Strength of Hydraulic Cement Mortars," withvarying treatment concentrations as shown in Table 17. The mortar cube mixtureproportions are presented in Appendix A, Table A-8. Nine cubes were made for eachtreatment concentration. During the first 20 days of curing, strength and resistivitymeasurements were taken periodically.
Strengt_ Measurements
Mortar cube compressive strength measurements were conducted after 1, 3, and 20 days ofcuring in accordance with ASTM C-109, see Table C-6. Mortar cubes that had not hardenedsufficiently to be placed in the testing apparatus were considered to have zero strength.
_esiztivfgy Mec_s_remen_s
Mortar cube resistivity measurements were taken after 1, 3, 10, and 20 days of curing. Thecubes being used for the 20-day strength tests were utilized for the resistivity measurements.The resistivity of the cubes was obtained through the use of a modified Nilsson SoilResistance Meter. The procedure for the resistivity measurements is detailed in Appendix B.A resistivity measurement was taken across each of the three opposite faces on three cubesfor each treatment concentration. After the completion of each set of measurements, thecubes were returned to baths of saturated lime water for further curing.
In order to evaluate hydroxylapatite's ability to scavenge chloride ions, three different testswere conducted to determine the possibility and extent of any substitution of CI for OH inthe hydroxylapatite molecule.
pN Me_geremengs
The substitution of C1- for OH in an aqueous medium would result in the release of thehydroxyl ion into solution. A simple pH measurement can detect the increased concentrationof hydroxyl ions. The pH of the solution that would theoretically result from a 100% CI/OH substitution could be determined from the equation:
pH = 14.00 - pOH (1)
74
where,
pOH = -log [moles of OH/volume of solution in litres]
A 25 g sample of hydroxylapatite was placed in a beaker of 200 ml of 5 % by weight NaC1solution. The solution was agitated using a magnetic stirrer and the pH was measured as afunction of time over a span of 24 hours with an electronic pH meter. The pH of the saltsolution and of a solution containing 25 g of hydroxylapatite with 200 ml of distilled waterwas taken for comparison. Another test was run with the apatite/salt solution being heated to
a temperature of 150 °F (65.5 ° C) and pH measurements were taken over a span of 24hours.
Specific Ion Electrode Measurements
The same technique used in determining the chloride ion concentration in the concretespecimens (see Chloride Concentration Measurements section) was employed to measure theability of hydroxylapatite to pick up chloride ions. 25 g samples of hydroxylapatite wereplaced into containers containing 5%, 10%, and 15% by weight NaCI solution. One set ofcontainers was agitated at room temperature for 24 hours while a second set was heated to150 °F (65.5 ° C) and agitated for 24 hours using a magnetic stirrer. The hydroxylapatitesamples were then filtered from the solutions, rinsed and stirred with distilled water, filteredagain, and allowed to dry. Each sample was subjected to 5 cycles of rinsing and drying.
3 g of each sample, including a control sample, were analyzed using the specific ionelectrode technique to determine the presence of any chloride ions that may have beenscavenged. Since hydroxylapatite is soluble in acidic solutions, any scavenged CI would bereleased from the crystal structure when subjected to the acidic digestive solution prior tochloride measurement by the specific ion electrode.
Differential Thermal Analysis
Differential thermal analysis (DTA) was conducted on both untreated hydroxylapatite andhydroxylapatite-exposed NaC1 solution. Two 25 g samples of hydroxylapatite were exposedto 200 ml of 5% by weight NaC1 solution at room temperature and at 150 OF (65.5 ° C) for24 hours. The samples were then subjected to the same rinsing/drying process as in thespecific ion probe tests. DTA scans were performed on an untreated sample and on both thetreated samples to determine the degree of the CI/OH substitution. The procedure used forthe DTA process is detailed in Appendix B.
Results and Discussion
Throughout the course of Part II, the following topics were subjects of the investigation:
75
o corrosion abatement effectiveness of chemical treatments applied to corrodingreinforced concrete after removal of chloride-contaminated concrete;
° the effects of treatment admixes on the physical properties of cement mortar.
In addition to the above, the chloride-ion-scavenging ability of hydroxylapatite was evaluated.
Based on half-cell potential measurements taken after the first ponding with NaC1 solution,the two sets of specimens exhibited remarkably different corrosion potentials during the first70 days of exposure. The evolution of the mean corrosion potentials for Set A and Set B isshown in Fig. 17 with the initial value indicating Eoo, after the first ponding. The meancorrosion potentials for the individual bars in each pad are listed in Appendix C, Table C-1.Half-cell potential measurements were attempted prior to the initial ponding but stable valuescould not be obtained because of the highly dried concrete.
For ease of understanding and uniformity, the half-cell potential measurements will bereferred to in terms of copper-copper sulfate reference electrode (CSE) values.
Since the concrete mix designs for both Set A and g were similar, the difference in curingtime seemed to have played a major role in corrosion activity initiation. Set A, cured forone day, exhibited initial corrosion potentials, Eco,, values less than -350 mV, indicatingmore than a 90% probability of corrosion (see Table C-l). Set B, cured for three days,required exposure for more than 20 days before falling below -350 mV. The one-day curefor Set A before ponding left the concrete's pore system extremely open due to thediminished time for cement hydration. This was exhibited during the first ponding in whichthe Set A specimens absorbed the entire 25 ozs. (750 ml) of 6% by weight NaC1 solution inless than 24 hours.
After 100 days of exposure, 14 of the 16 specimens of Set A developed surface crackscaused by expanding corrosion products. These 14 specimens were deemed unsuitable forfurther evaluation because of the high degree of corrosion.
Verification of corrosion activity in the remaining 18 specimens can be seen in both theaverage corrosion current of bars A and B, and in the chloride ion concentrationmeasurements taken prior to grooving, as presented in Table 18. Ico, values greater than 1.0mA/ft 2 (1.08/zA/cm 2) and chloride concentrations values greater than 1.2 lbs/yd 3 (0.71kg/m 3) were taken as indicators of corrosion initiation.
The values in Table 17 indicate a similarity in corrosion current and chloride ionconcentration for each group of specimens made from the same concrete batch (B-1 to B-4,B-5 to B-8, B-9 to B-12, and B-13 to B-16). The decrease in I_ and chloride concentrationwith succeeding concrete batches indicates improvement in the concrete quality. A possible
i ....,,.o-6SO I r .... r 1 , , , ' I ' -720o _o 20 ao 40 60 60 70 60 90 _00 zzo mo
Time (days)
Set A --G-Set B II
Fig. 17 Mean Pre-Treatment Half-Cell Potentials
77
Table _lSoAverage pre-_rea_me_ corrosion curren_ of bars A and _ con_b_ned_andchllor_de_onconce_n_r_fionsat rebar nevellfor spechuens used _n treat_nent study.
CI" Concentration at 3/4" depthSpecimen I**_ (lbs/yd 3)
explanation may lie in the human factors of increased efficiency and improved castingpractices with succeeding batches.
A simple linear regression (SLR) analysis was conducted on both the average pre-treatmentcorrosion potentials and chloride ion concentrations to determine their degree of correlationwith the corrosion current values. A SLR analysis yields the coefficient of determination (ra)
which represents the proportion of the total variability of I_o. values that are explained oraccounted for by the Eco,_or chloride concentration values. A high value of r2 indicates astrong correlation. The r2 value for the Econ-correlation with I_o. was 66.0% and the valuefor the chloride concentration correlation was 81.0%. The chloride concentration showed a
greater degree of correlation than _, as the chloride sample set was able to account for15.0% more of the I_o. sample set.
Ico. is linearly proportional to corrosion rate, but neither Eoo. nor chloride ion concentrationwere found to have a high enough correlation (90-95 %) to exhibit a linear relationship withIoo,_and, therefore, they were not used as an accurate measurement of corrosion rate. As aresult, in the analysis of the corrosion abatement treatments, I_o. measurements willpredominantly be presented as an indication of treatment effectiveness.
Evaluation of Corrosion Abatement Treatments
To aid in the treatment effectiveness analysis, the following guidelines are used in datapresentation:
• Since corrosion potentials are only an indicator of the probability of corrosion and notthe degree or rate of corrosion, _ data are presented but not focused upon unless pertinentto treatment evaluation in relation to I_o.. When displayed, all _o. values are the mean ofsix measurements taken on Bars A and B in each specimen. All E_ data are tabulated inAppendix C, Table C-2.
• I_o_data are presented as the mean of the corrosion current in Bars A and B in eachspecimen. Since corrosion current is linearly proportional to corrosion rate, corrosioncurrent and corrosion rate will be used synonymously through the analysis of results.
The statistical comparison of Bars A and B using a one-way analysis of I_,,. variance wasperformed and their evaluation based on F-ratios and p-values is presented in Table 19.Although some specimens showed significantly different behavior between the bars, it waspredominantly due to differences in magnitude while the bars still exhibited similar trends.All the corrosion current data are tabulated in Appendix C, Table C-4.
Due to the high variance in the final half-cell potential and corrosion current measurementsprior to treatment, the absolute post-treatment values measured are not an accurate indicationor good comparison measure of treatment effectiveness when used alone. Therefore, in
79
addition to absolute values, the data are also expressed in terms of % change in reference tothe last measured Eoo,_or Ico,_prior to treatment. The % change is computed as follows:
% change = [(Vp -Vc)/Vp] x 100 (2)
where,
Vr = final pro-treatment
Vc = current value
A positive % change indicates a increase in corrosion potential (more noble) or a decrease incorrosion rate (in terms of corrosion current) in reference to the final pro-treatment value. A
negative % change indicates a drop in corrosion potential (more active) and an increase incorrosion rate. All % change values for post-treatment Eco, and I¢o,_measurements aretabulated in Appendix C, Tables C-3 and C-5, respectively.
For convenience in data display and analysis, the treatments were divided into six treatmentgroups in addition to the control specimen:
6. Hydroxylapatite and hydroxylapatite/inhibitor combinations
Conarg Specgmen
Corrosion potential and corrosion rate evolution for the control specimen (B-l) after removalof contaminated concrete is displayed in Figures 18A and 18B. The control specimen's pro-grooving measurements indicated an extremely low Eco, in the > 90 % probability ofcorrosion range and a high corrosion rate. After grooving, the specimen showed minimalimprovement between days 1 and I0, most likely due to both the removal of chlorides andthe placement of fresh mortar which aids in the pH restoration at the reinforcing steelsurface. After day 10, the specimen exhibited increasing corrosion activity resulting in anapproximate 70% increase in corrosion rate, indicating little benefit from the removal of thechloride-contaminated concrete.
DCff Treplmenes avid Pogymer Seaga_es
A comparison of the two DCI treated specimens in which one had DCI in the mortar and the
80
Table 19. One-way analysis of I_o. variance between Bars Aand B in each specimen at an a=0.05 level.
Specimen F-Ratio t p-Value: SignificantlyDifferent
(Yes/No)
B-1 0.09 0.763 No
B-2 3.62 0.067 Yes
B-3 O. 12 0.728 No
B-4 10.40 0.003 Yes
B-5 2.14 0.153 No
B-6 0.60 0.445 No
B-7 3.48 0.072 Yes
B-8 6.47 0.016 Yes
B-9 1.12 0.298 No
B-10 2.35 0.136 No
B-11 3.25 0.081 Yes
B-12 2.09 0.158 No
B-13 1.21 0.281 No
B-14 6.08 0.020 Yes
B-15 0.31 0.583 No
B-16 0.00 0.967 No
A-13 0.01 0.932 No
A-15 0.91 0.352 No
_Tabulated F-ratio for 16 observation sample sets 03-1 thru B-16) = 2.76. For 12 observation sample sets(A-13) F-ratio = 2.82, and for 11 observation sample sets (A-15) F-ratio = 2.95.
:'P-values less than 0.10 indicate significant difference [40].
81
82
Icorr (mA/sq.ft) % Change25 IOQ
75
20-50
- 2515-
- ,' ._-_-__ o_o , ' _ --25
"" - - -50
5
- -75
0 I , f , I T -1000 20 40 60 80 100 120
I Icorr -_ % Change|
Fig. 18B Control Specimen (B-l) Corrosion Rates and Post-Treatment Percent Change
83
other was ponded as well as back.filled with DCI mortar showed that the specimen which wasponded exhibited a far better corrosion abatement performance as reflected in Figures 19Athru 19D. Ioo, values reflect an average 25 % reduction in corrosion rate in the mortartreatment specimen (B-2) during the first 40 days and then a 65 % increase to more than 15mA/ft 2 (16.1 mA/cm _) at day 100. It appears as though the DCI present in the mortar incontact with the reinforcing steel and groove was sufficient to further stabilize the Fe203passive layer which resulted in the slight reduction in the corrosion rate for a short period.However, diffusion of DCI was not great enough to sustain a high enough nitriteconcentration at the reinforcing steel to compete sufficiently against diffusing chlorides;therefore, the Fe 2 in solution began complexing with the chlorides to further thecorrosion process instead of reacting with the nitrite to eventually enhance the stability of thepassive film. The specimen's initial performance was better than the control specimen, butdeteriorated rapidly after 40 days.
The DCI specimen treated both through ponding and mortar (B-3) exhibited highly effectivecorrosion abatement. After day 7, the specimen showed greater than a 50% increase incorrosion potential (more noble) and 60% decrease in corrosion rate for the entire exposureduration through day 104. The ponding appeared to allow the development of a soundpassive layer on the reinforcing steels to inhibit the anodic reaction and promoted thediffusion of DCI into the concrete surrounding the reinforcing steels. This passive layer incombination with the high nitrite concentration provided by the ponding and subsequentmortar backfill was effective enough to provide a higher and longer corrosion abatement thanjust the mortar-treated specimen.
The effectiveness of DCI ponding can also be seen in the three specimens (B-13, B-14, B-15); these grooves were ponded with DCI and a polymer sealer was applied beforebackfilling with untreated mortar. The post-treatment Eco, and Ico, values for each polymersealer applied (see Table C-2) are shown in Figures 19E thru 19H. The corrosionmeasurements for the styrene-acrylic specimen (13-14) are expressed in terms of Bar A only,due to the development of a crack at the groove interface above Bar B which allowed therapid diffusion of chlorides and the acceleration of corrosion.
Without distinguishing between the sealers, both the Eco. and Icon show an approximate 50 %average improvement during the entire 104 days of exposure. However, this is somewhatmisleading, because the pre-treatment corrosion rate for each of the specimens was low,falling between 1.5 and 2.5 mA/ft 2. The initial level of corrosion rate can conceivably playa factor in the magnitude of the % change in corrosion potential and rate after treatment.Any treatment method applied to specimens of low corrosion activity would reasonably beexpected to cause a greater % change in magnitude than if applied to specimens of highercorrosion activity. Although the absolute change in magnitude would be smaller, the %change in magnitude would most likely be greater. This problem can only be overcome byusing specimens of relatively identical corrosion rates or evaluating specimens of varyingcorrosion rates over a longer duration.
84
O
O
- Or_
O :"
0_ c
- _D "_ o E-
- _ _
- _ __ N
_ 0 ::04 =
0> _ - ,_ <E
O _-OLU I I I I I I
0 0 0 0 0 0 0 00 C) 0 0 0 0 0
I I I I I I I
85
l °
g
_ 0 _
•C - O
_ I I I I I I "
o _ o _ o _ o _ o .-_o h. tO OJ Od tO h- 0 _"'P" I I I 'P"
I
86
0
°
0 II- 0 __.
.,<E
- O_ _
0 [.
cO "0z
i - I',-_ _ r4>_ _o {If =
- (O "{_ 0_. .__
- _
0 ,._ '-- _ I_ ["
_ r,.)0 _
_ 0 _ ,.CO _=
=e_
°] C) "-"
E ==
t_.. - J_ _'_,.- n +0o r,p
-=. I I I o,,C> _ C> kO 0 "_
e_
87
O
C_
,e,- I_
0 Er_
0 '- c_
0 =
CO "1_ -.
_ C) m
¢D "_ 0 =Q,. ..o
-[1II
_ QI-- ---
I._
_ 0 _
• 0 _
_ I I I I f I ,-.
0 _0 0 I0 C) I0 C) I0 Q
I I I 'e-l
88
8g
r_
91
92
It cannot readily be determined to what degree the polymer sealers play a role in thecorrosion abatement process. Since the DCI pond/mortar specimen showed great reductionin both corrosion potential and rate, it is reasonable to expect that the DCI ponding played amajor role in the corrosion abatement of the polymer sealer specimens as well. It is possiblethat the sealers provided an additional physical barrier to chloride ions, moisture, and evenoxygen diffusion, which would enhance the effectiveness of the DCI.
The sealers alone probably would not have been effective due to the level of chloride presentin the specimens. At the reinforcing steel level, the specimens contained an average of 8.75lbs C1-/yd3 (5.19 kg/m 3) (see Table 18) of concrete which is more than seven times theaccepted level of 1.2 lbs Cl/yd 3 (0.71 kg/m 3) needed to initiate corrosion in concrete.Without the DCI to effectively form a passive layer, the reinforcing steels would have stillbeen subjected to this level of chloride underneath the sealant. Since the sealer was onlyplaced in the groove, moisture could still diffuse through the concrete on either side of thegroove and around the sealant. The sealers were evaluated in combination with DCI becausewhen used in the field, sealers may be applied in conjunction with an inhibitor treatment.
In comparing the different sealants, no great distinction could be made to determine the mosteffective between silicone and styrene-acrylic, or between ponding the sealers and sprayingthem. The spraying of the sealants appeared to be just as effective as applying them throughponding. The advantage to spraying, however, is that it uses less material and takes lesstime for application.
In the overall evaluation of the DCI-treated specimens, treatment through a combination ofponding and backfilling with treated mortar exhibited the greatest effectiveness in reducingcorrosion. Such a treatment provides a sufficient NO2"/CI ratio to suppress the anodicreaction and increase the stability of the passive film. The application of sealers may aid inthe reduction of corrosion in combination with DCI, but the degree to which they affect the
corrosion process could not be determined.
Borate Treatments
The three specimens treated solely with borate-based inhibitors were:
1. B-6, treated with sodium tetraborate placed in the mortar (SB Mortar).
2. B-7, treated with sodium tetraborate ponding and placed in the mortar (SBPond/Mortar)
3. B-8, treated with zinc borate ponding and placed in the mortar (ZB Pond/Mortar).
The post-treatment corrosion potentials and corrosion rates for each specimen are shown inFigures 20A thru 20D.
93
g _
_N
_ NII
° _C3 CO CD _ C_l _
96
All 3 treatments seemed to have had a similar effect on the evolution of _o, for eachspecimen. More than a 25 % increase in potential was experienced by all three specimens forthe majority of the exposure duration. The final values were all greater than the pre-treatment values.
A better comparison between the treatments can be made on the basis of the corrosion rates.The SB mortar specimen displayed the least effect of its treatment with a small decrease incorrosion rate between days 10 and 30, with an eventual 50% increase. Both the SBpond/mortar and ZB pond/mortar specimens showed an average 30% reduction in corrosionrate between days 20 and 60. At longer exposure duration the zinc borate treated specimenexperienced an actual further decrease in corrosion rate exceeding 50%.
The borate treatments appeared to be effective for a longer duration when applied both as aponding and in the mortar when simply just added to the mortar. The additionalconcentration of borate provided via diffusion through the mortar appears to be adequate toextend the time of corrosion abatement. Of the treatments, both the SB and ZB pond/mortartreatments performed equally well initially, but the zinc borate specimen outperformed theSB at the later stages of exposure. This difference in behavior may be related to the rate ofdiffusion of the inhibitors through mortar. The zinc borate may have a higher rate ofdiffusion which allows it to better maintain a sufficient concentration at the reinforcing steelsurface to stem corrosion.
In the borate-treated specimens involving both ponding and placement in mortar, theconcentration of borate at the reinforcing steel level was sufficient to allow the formation of acorrosion inhibiting coating which served as a barrier to increased metal dissolution.
TCff Tv'eaemee_g
The treatment of specimen B-4 with a TCI (sodium monofluorophosphate) ponding appearedto be effective based on corrosion potentials as shown in Fig. 21A. The corrosion potentialsremained more noble than the pre-treatment value for the entire exposure period. However,the corrosion rate measurements shown in Fig. 21B, show an example of how E,,,measurements can be misleading. The specimen experienced only a slight decrease incorrosion rate for 25 days before it began to increase and exceed the pre-treatment corrosionrate. TCI inhibitor functions as a diffusional inhibitor; however, it does not appear asthough it effectively diffused into the concrete surrounding the reinforcing steel to provideany substantial inhibition.
The ineffectiveness of TCI may have been a result of a low treatment concentration, but nostandard application concentration has been developed except in conjunction with surfaceapplication of de-icing salts (2.5% sis salt). The concentration used, however, appeared tobe high enough to stabilize the corrosion rate between days 35 and 70 at its pre-treatment 10o,level before deteriorating. Increased treatment concentrations may yield better results.
98
00 ID C) ID 00 _ 0 It) c_ I0 I_ ,e-,P I_ LO _ 0 i i i 0
r- =
0 .-t =
0 _, ,r- _
E
.t..,
// / ° ._=
o
=
; + °> _ _
> ._E _e_
I- - 0 =_0 -4-o _0 0 0 0 0 0 0 --
0 0 0 0 0 0,e- _ O'J ,_" It) (.DI I I I I I
.__99
00 I_D 0 _ 00 _ 0 IuD o,I I_D I_ ,i--
J i J i i i C_II_) 'P
T-
=
- CO _
0r,_
E °E ,__ _-_- !.-_ 0
o _r _ C> _ =
•_. ==.
/ _-
=
E _ "=-
_l, _ _•l +
0 I I I II
..__.Ou
Alox 901 Treatment
The performance of the Alox 901 treatment appeared promising as a possible corrosioninhibitor in concrete. The I0o_and Eco, measurements shown in Figures 22A and 22Bindicate that the treatment was able to keep the corrosion activity from increasing from itsinitial state for the entire exposure duration. After day 10, the Alox treatment provided anaverage 40% reduction in corrosion rate for a span of 70 days before decreasing to 9% atday 104.
Although the corrosion rate began to increase over the last 20 days, this is not necessarily asign of an inhibitor with only a short-term effect. Alox 901 is primarily used as a coatingfor metallic components exposed to corrosive environments. As a result, it is an extremelyviscous liquid which aids in its adhesion to surfaces. In this study, the Alox 901 wasdissolved in an ethyl alcohol solvent for ponding because it emulsifies in water. Since thereis no known concentration standard for concrete, an equivalent. 1M alcohol solution wasmade for comparison with the other. 1M ponding solutions. Therefore, the Alox 901concentration may not have been the optimum for concrete applications.
The viscous and oily properties of Alox 901 may have caused poor adhesion between thegroove and backfilled mortar interface. This could have contributed to the accelerateddiffusion of chlorides along this interface, possibly reducing the inhibitor's effectiveness.
Cortec Inhibitor Treatments
The Cortec vapor phase inhibitors were used in several combinations and showed highlyeffective results both short-term and long term as displayed in Figures 23A through 23D.Two treatments were applied to specimens of Set A (A-13, A-15) which were highlycorroded and exhibiting high corrosion rates, while a third treatment was applied to aspecimen of Set B (B-16) with an extremely small corrosion rate.
Cortec 1337 is a surface inhibitor while 1609 is used as an admixture. Cortec 1337 was
evaluated applied to the surface of a specimen and applied to grooves, while 1609 wasevaluated as a possible ponding treatment as well as being put in the mortar. The surfacetreatment with 1337 and the combination 1337 pond/1609 mortar treatment could only beevaluated for a short period due to the development of cracks in the specimens.
The application of 1337 to a specimen's surface resulted in nearly a 100% reduction incorrosion rate from 23.5 to 0.75 mA/ft 2 (25.3 to 0.81 MA/m3). However, shrinkage cracksdeveloped during drying after the first ponding cycle. The cracks allowed for the ingress ofhigh concentrations of sodium chloride solution during subsequent pondings. As a result, theperformance of the inhibitor as a surface treatment could not adequately be evaluated after 10days.
The combination of a 1337 ponding and 1609 being admixed into the mortar initially proved
to be a highly effective inhibitor treatment. During the first 30 days of exposure, thetreatment resulted in an average I_o,_decrease of more than 60%. However, the developmentof shrinkage cracks at the groove/mortar interface over each bar allowed the rapid influx ofchlorides and resulted in a rapid increase in corrosion rate.
The use of 1609 as a ponding inhibitor was experimental, but resulted in a stable reduction inboth Eoo,,and Ic,,_. The specimen in which 1609 was ponded and placed in mortar had a lowpre-treatment corrosion rate of 1.45 mA/ft2; therefore the magnitude of corrosion reductionwas small but the percent change in magnitude was great. It is reasonable to expect betterperformance because of the low corrosion rate, but the stability of the corrosion rate drop incombination with the large drop in E_o,,magnitude further supports the treatment'seffectiveness.
Over a duration of 104 days, the treatment was able to prevent the corrosion rate fromincreasing from its low initial value, even though the specimen's chloride concentration wasincreasing. In addition, the corrosion potential increased (became more noble) more than60% and remained at this level for the entire exposure duration. No other treatment besidesDCI ponding was able to keep the corrosion potentials of a specimen so low for such aduration, regardless of the magnitude of the pre-treatment corrosion rate.
Both Cortec inhibitors appear to be effective corrosion abatement treatments. The pondingof either inhibitor provided adequate reduction in corrosion activity via the vapor phasetransport of the inhibitor to the reinforcing steel surface and the resulting formation of aprotective monolayer. This monelayer reduced both the anodic and cathodic reaction rates.The long-term effectiveness of 1337 ponding treatments could not be evaluated and thedetermination of the more effective ponding agent between 1337 and 1609 could not readilybe made. However, since 1337 is recommended as a ponding inhibitor by the manufacturer,it is reasonable to expect 1337 to perform better than 1609 when ponded. The degree towhich the 1609 admixed in the mortar plays in corrosion abatement could not readily bedetermined from the treatment combinations.
Nydzoxygapafige Treaemene,s
The treatment effects of using hydroxylapatite alone and in combination with inhibitors canbe seen in the Eco,_and I_o,,measurements shown in Figures 24A through 24D. Theadmixing of hydroxylapatite (HA Mortar) to the backfilled mortar showed little effect on thecorrosion rate of the treated specimen. However, this is not an accurate measure of themineral's chloride-ion-scavenging ability. The chloride threshold level at the reinforcingsteel surface was equivalent to 12.36 lbs Cl/yd 3 (see Table 18). Therefore, even with theremoval of the grooved concrete, it could be expected that a chloride level sufficient to drivethe corrosion process would still exist in the concrete surrounding the unexposed portions ofthe reinforcing steels. Since hydroxylapatite is insoluble in high pH environments, it has noability to diffuse to scavenge chloride ions. The only chloride ions that come in contact withhydroxylapatite are those that diffuse through the backfilled mortar.
_.08
C:)c_
109
0OJ
The use of hydroxylapatite in combination with an inhibitor treatment showed little benefitwhen used in combination with a zinc borate ponding and mortar admixture. However,when used with TCI ponding or DCI in mortar, there appeared to be some improvement inperformance. Both the TCI and DCI specimens with apatite sustained a longer reduction incorrosion rate than the TCI and DCI specimens without apatite. This could possibly be dueto chloride scavenging, synergistic effects, or the fact that the apatite specimens with TCIand DCI had pre-treatment corrosion rates lower than the corresponding specimens withoutapatite. Despite this improvement, the 30-40% reduction in corrosion rate for bothspecimens lasted only for a duration of 60 days before increasing to rates higher than pre-treatment.
Hydroxylapatite does not appear to be an effective treatment in itself after removal ofchloride contaminated concrete.
Selection of Most Effective Treatments
In determining the most effective corrosion abatement treatments based solely on corrosionmeasurements, the treatments were evaluated in terms of greatest % improvement in/_o_-, I_improvement at selected days during exposure, and length of Ico, improvement. Thecomparison of the best treatment or treatments from each experimental group is detailed inTable 20.
All the following treatments have indicated effectiveness in abating corrosion based onelectrochemical measurements and axe possible candidates for reinforced concrete treatmentafter removal of chloride contaminated concrete:
1. DCI ponding and in mortar2. Alox 901 ponding3. Cortec 1337 ponding and Cortec 1609 in mortar4. Cortec I609 ponding and Cortec 1609 in mortar5. Zinc borate or sodium tetraborate ponding and in mortar
Of the above treatments, DCI showed the greatest effectiveness based on the level in which ahigh pre-treatment corrosion rate was reduced and the duration of its effectiveness. Theborate based treatments also proved effective for the same duration but at an averagecorrosion rate reduction of 30-40% compared to DCI's 50-60%. The other three treatmentsappeared effective, but due to a low pre-treatment corrosion rate or the formation of cracks,their electrochemical data is not as well defined as for the DCI and borate treatments.
Mortar Strength and Resistivity Evaluation
Mortar cube strength and resistivity was evaluated to determine any deleterious effects that
Ieracks formed in specimen allowing chloride ingress,therfore_ values at days 55 and i04 are not representative oftreatment corrosion abatement.
114
treatments or level of treatments may have on cement mortar properties. The compressivestrength measurements would indicate hydration retarding or accelerating properties of thetreatments used as admixtures. The resistivity would also indicate retardation or accelerationof set based on the fact that resistivity is a function of permeability which increases withhigher degrees of hydration. In addition, the resistivity measurements could possibly detectthe contribution of ionic species to the mortar which may contribute to increased currentflow. An increase in the ability of current to flow through the mortar would increase therate of corrosion of reinforcing steel embedded in the mortar.
Treatment Effects on Mortar Compressive Strength
Compressive strength measurements taken over a span of 20 days indicated little differencein strength between the control group and those cubes treated with Cortec 1609 orhydroxylapatite. Fig. 25 presents a comparison of the control cube strengths with thestrengths of the cubes containing the highest concentrations of Cortec 1609 (0.45% 1/scement) and hydroxylapatite (25.00% s/s cement). There was also no observed effect of theconcentration level within the Cortec 1609 and hydroxylapatite specimens. The compressive
strength data for all the cubes are tabulated in Appendix C, Table C-6.
DCI (calcium nitrite) is a known set accelerator and, at low concentrations, can increase thecompressive strength of concrete [24]. This is evident in Fig. 26 which compares the controlgroup strength with those of the different DCI concentration groups. For every DCIconcentration, the mortar strength was greater than the untreated control cubes and thedifference in magnitude increased with increased curing time. At 20 days, each DCIconcentration had increased the mortar strength by more than 20% over untreated mortar.Strength increase was also a function of increasing DCI concentration. It should be notedthat a small amount of set retarder was added to the 5% and 10% DCI concentration cubes to
combat rapid setting.
The calcium nitrite and small amounts of calcium nitrate in DCI serve as an acceleratingadmixture. The presence of the strong NO_ anion in DCI tends to accelerate the solubilityof calcium ions from the cement compounds, resulting in more calcium ions to participate inthe aluminate and silicate hydration reactions. An increase in the hydration rate of thecement translates into higher compressive strengths in shorter time. However, long-termstrengths may be sacrificed because accelerated hydration produces hydration products oflarger particle size which have less strength than smaller particles of a slower hydrationprocess.
Unlike calcium nitrite, both borate based inhibitors exhibited set retarding properties as seenin Figs. 27 and 28. Sodium tetraborate so heavily retarded the set of the mortar that cubesof 2.0% s/s cement concentration did not have sufficient set strength at 24 hours to beremoved from their molds. Even the 0.5% and 1.0% concentration showed heavyretardation as their compressive strengths were 75% and 96% lower than the control groupstrength after one day. The 0.5% concentration cubes reduced the strength difference in
115
Compressive Strength (ksi)8
n
D
5-
4-
HA • 25 % s/s cement2
Cortec 1609 - 0.45% I/s cement
D
0 I I I I
0 5 10 15 20 25
Time (days)
I Control E] Cortec 1609 b Hydroxylapatite
Fig. 25 Mortar Cube Strength vs Time for Highest Concentration Cortec 1609(0.15%) and Hydroxylapatite (25%) Cubes
NOTE: 1 ksi = 6.895 MPa
116
Compressive Strength (ksi)8
m
m
5
4
3
2
0 I I I I
0 5 10 15 20 25
Time (days)
I Control a 2.5% o 5.0% o 10.0%
Fig. 26 Mortar Cube Strength as a function of DCI Concentration (% s/sCement)
NOTE: 1 ksi = 6.895 MPa
117
Compressive Strength (ksi)8
5
4
3
2
1
0 I I I I
0 5 10 15 20 25
Time (days)
t Control : 0.5% 0 1.0% o 2.0%
Fig. 27 Mortar Cube Strength as a Function of Sodium Tetraborate Concentration(% s/s Cement)
Fig. 28 Mortar Cube Strength as a Function of Zinc Borate Concentration (% s/sCement)
NOTE: 1 ksi = 6.895 MPa
119
relation to the controls with time to point of only a 2 % difference after 20 days. The two
higher concentrations still had extremely low strengths after 3 days, but rapidly increasedbetween days 3 and 20.
Zinc borate exhibited the same type of behavior as the sodium tetraborate but to a higherdegree. Original concentrations of 1.7% and 3.4 % s/s cement did not have sufficient setstrength at days 1 or 3 to be removed from the mold, therefore, lower concentrations of0.22%, 0.43%, and 0.85% were used. The 0.22% concentration showed little effect onstrength as shown in Fig. 28. However, almost doubling the concentration to 0.43% resultedin a 95% reduction in strength after 24 hours and a 66% reduction after 3 days. The 0.85%concentration strength was even lower, with no set strength after 24 hours. However, after20 days, the 0.22% and 0.43% concentrations had compressive strengths within 30% of thecontrol group. The two highest concentrations eventually set within 20 days withcompressive strengths equal to 3.25 and 2.46 ksi respectively.
Both sodium tetraborate and zinc borate showed the same set retarding characteristics. The
high concentration mortar cubes began to set in a characteristic manner for both boratetreatments. The setting process was most rapid at the open surface of the cube molds andthen progressed downward along the outer edges of the cube, with the slowest set being atthe bottom surface of the cube in contact with the mold. Also characteristic of the boratetreatments was the evolution of the strengths. High concentrations showed drastic reductionin initial strengths, but a rapid increase between days 3 and 20.
Borates are classified under Type B set retarding admixtures and were popular in the 1930's[41] but are rarely seen in use today. The borates form insoluble calcium borate salts whichtie up calcium ions needed for the hydration process. The zinc borate may have had agreater set retardation effect because one molecule of zinc borate provides six boride ionswhile a molecule of sodium tetraborate provides only four boride ions. In addition to theborate effects, the presence of Na Zn 2+ reduces the solubility of calcium ions, thusreducing the rate of hydration even further.
The long-term strengths of set retarded mortars tend to reach and even exceed normallycured mortar strengths [41]. The slower rates of hydration product formation allows greateralignment of the hydration products in the cement paste which produces higher laterstrengths. This may account for the great increase in strength magnitude between days 3 and20 for the higher borate concentrations.
Based on the mortar cube strength study, only the borates have a deleterious effect.However, the set retardation effect may be overcome the use of a set accelerating admixture.The admixing of DCI tends to only improve compressive strength which further supports itsuse a corrosion treatment after removal of chloride-contaminated concrete. Both
hydroxylapatite and Cortec 1609 showed no positive or negative effects on mortar strength.
L20
Treatment Effects on Mortar Resistivity
Effects on resistivity were only found in those treatments that produced compressive strengtheffects due to a change in hydration rate. Since resistivity is a function of permeabilitywhich is dictated by the degree of hydration, it is reasonable to expect that set retardationwould decrease resistivity and set acceleration would increase it. This is reflected in Figs.29 through 31 which display resistivity as a function of inhibitor concentration for sodiumtetraborate, zinc borate, and DCI respectively. The average resistivity values for eachtreatment and concentration group are tabulated in Appendix C, Table C-7.
For sodium tetraborate and zinc borate, the higher concentrations which produced a higher
degree of set retardation also exhibited lower resistivity values than the control specimens.Since set retardation means a slower formation of hydration products, the reduction in
permeability of the system also proceeds slower. The lower concentration zinc and sodiumborate specimens which exhibited strengths more similar to the control cubes, also exhibitedlike resistivity values. One day resistivity values could not be measured on the two higher•zinc and sodium borate concentration specimens because their low set strengths made themtoo fragile to handle.
The DCI mortar cubes behaved opposite of the borate cubes. Since DCI accelerated thehydration process, the permeability reduction of the cubes was also accelerated due to therapid formation of hydration products. As a result, increasing DCI concentrations yieldedhigher resistivity values and all resistivities were greater than the control group resistivities.The difference in resistivities is small after 24 hours but gradually increased with the rapidset of the cubes.
None of the specimens were determined to contribute highly conductive ionic species to themortar cubes. Hydroxylapatite and Cortec 1609 exhibited resistivities similar to the control,while the rest of the treatments' resistivities were dictated by the change in setting rate.
Chloride-Ion Scavenging Ability of Hydroxylapatite
The apatite series, all of which has the same type of hexagonal crystal structure, includeshydroxylapatite (CaI0(PO4)6(OH)2)and chlorapatite (Ca_0(PO4)6C12).The nature of apatite'sstructure renders it particularly prone to substitution. Studies have shown thathydroxylapatite readily undergoes an OH-/F substitution in which the product is fluorapatite(CaI0(PO4)6F2)[42] and the ion exchange was found to be irreversible. The possibleirreversible substitution of CI for OH" in concrete would provide a means of scavenging thechloride ions and simultaneously releasing hydroxyl ions which would enhance the pH of theconcrete. However, three tests were conducted to evaluate the possibility of hydroxylapatitescavenging chloride, and the results reflected little if any scavenging ability.
121
ll®8isIIivilly (12#hm=o_)2.,g
I I I I
@ _ 10 116 IO iIF
Yi e (days)
I -d_ @@_Ir@l -_- (i).1% _ 11.0% _ I,(i)%
_80 2_ 2_ivity as a _'u_ctio_ of $odi_ Tetraborate Co_ce_t_'atio_
NOTE: _Ikoh_ - c_ = 0o3_kohm - iN
222
Resistivity (kohm-cm)2.5
m
1.5 -
0.5 -
0 I I I J
0 5 10 15 20 25
Time (days)
I t Control 0 0.22% b 0.43% 0 0.86% ]
Fig. 30 Resistivity as a Function of Zinc Borate Concentration
NOTE: 1 kohm - cm = 0.39 kohm - in
123
Resistivity (kohm-cm)2.5
D
1,5 -
0.5
0 1 I I I
0 5 10 15 20 25
Time (days)
[ Control D 2.5% 0 5.0% 0 10.0% I
Fig. 31 Resistivity as a Function of DCI Concentration
NOTE: 1 kohm - cm = 0.39 kohm - in
124
pH Measurements
The results of a pH monitoring test to detect the release of hydroxyl ions as a result ofchloride ion substitution axe presented in Table 21. Theoretically, if chloride ions substitutefor the hydroxyl ions in the apatite molecule, the release of hydroxyl ions should cause a pHincrease. Based on a 25 g sample of apatite, 97 ozs. (200 ml) of solution, and awater/apatite pH of 7.5, a 100% exchange would result in a pH of 13.40 which is anapproximate pH increase of 6 units of magnitude. However, results from pH measurementstaken at room temperature and at 150 °F (65.5 ° C) for a 5% by weight NaC1 solution with25 g of apatite showed minimal change in pH over a 24 hour period. The difference inminimum and maximum pH measured was only 0.07 pH at room temperature and 0.12 at150 °F (65.5 ° C). In addition, the minimal change was not linear with time.
If a direct substitution of chloride for hydroxyl ion was done for every hydroxyl group, the25 g of apatite would have theoretically released 0.85 grams of hydroxyl ions which shouldhave been detected with an increase in pH to 13.40. However, no pH change was detectedto support this at either room temperature or 150°F (65.5°C). In addition, the highest pHmeasurement for both tests never exceeded the pH value of 7.50 measured for hydroxylapatite in distilled water.
Specific Ion Electrode Measurements
An attempt was made to determine the extent of hydroxylapatite's chloride ion scavengingability by measuring chloride content via a specific ion probe. In order to determine abaseline value for comparison, the chloride ion concentration of untreated hydroxylapatitewas evaluated. However, the specific ion probe system is calibrated to a lower thresholdvalue of .016% CI" for a 3 g sample. All measurements of untreated hydroxylapatite andhydroxylapatite exposed to various % NaCl solutions yielded values below this threshold,therefore, the exact chloride contents could not be determined.
Since the exposed hydroxylapatite samples yielded values less than .0i6% El, it isreasonable to assume the maximum chloride concentration an exposed sample could have is.016%. If this is assumed, a 3g sample of exposed apatite would contain 0.00048 g of CI.However, if enough apatite is desired to scavenge a nominal 10 Ibs Cl/yd 3 of concrete (4536g) at a level of 0.00048g Cl/3g of hydroxylapatite, 12,859 lbs (2.83 x 10 7 g) ofhydroxylapatite/yd 3 of concrete would be needed. This unreasonable and infeasible amount istwenty times the average amount of cement put in a yd3 of concrete. Based on this analysis,hydroxylapatite is ineffective in scavenging the necessary degree of chloride ions to warrantits feasibility in concrete.
Differential Thermal Analysis
If the CI'/OH" substitution readily takes place, differential thermal analysis (DTA) coulddetect the loss of the hydroxyl groups in the apatite molecule. A DTA scan of an untreated
125
Tab]]e 2_0 Measurement of p_ as a function of t_e for_y_R'o_y_apat_te treated l_aC_ so_t_o_ (5% by
pH Measurement ITime '"
Room Temperature 150 *F
0 7.38 7.30,=
1 rain 7.42 7.35
10 rain 7.45 7.35
30 rain 7.40 7.32
I in" 7.42 7.30
2 hr 7.39 7.31
5 hr 7.42 7.39
10 hr 7.45 7.37
24 ha" 7.43 7.42
_pH measurements of:distilled water = 6.72
distilled water and apatite (R.T.) = 7.50distilled water and apatite (150"F) --- 7.445% by weight NaCI solution (R.T.) -- 7.315% by weight NaCI solution (150*F) = 7.20
Note: 150"F = 65.5"C.
1t2_
hydroxylapatite specimen is shown in Fig. 32. The initial valley at 257°F (125°C) is due tothe release of water from the specimen. The valley at 1832°F (1000°C) corresponds to adehydration of the specimen in which the hydroxyl groups are released. Studies have shownthat hydroxyapatite does not readily lose OH from its crystal lattice, which is stable up to atleast 1832°F (1000°C) [42] which correlates with the DTA scan.
If chloride ions substitute for hydroxyl groups within the hydroxylapatite molecule, themagnitude of the valley at 1832°F (1000°C) would decrease with increasing loss of OH.DTA scans of hydroxylapatite specimens exposed to varying concentrations of NaCI solutionshowed no indication of ion substitution. All DTA scans of the samples showed minimal to
no change from the reference sample scan shown in Fig. 32.
The substitution of chloride ion for hydroxyl ion in hydroxylapatite may possibly be inhibitedby the size of the chloride ion. The fluoride ion readily substitutes but has an ionic radius25 % smaller than the chloride ion. Studies have indicated that structural requirements
preclude site-by-site substitution such as C1-for 1= [37]. This may be the case in the CI/OHsubstitution as well.
Conclusions
The removal of chloride-contaminated concrete is an effective means through whichcorrosion abatement treatments can be applied. Several treatments and treatmentcombinations were found effective and are recommended for further evaluation in large-scaleand field experimentation.
When chloride-contaminated concrete is removed, the combination of DCI (calcium nitrite)
inhibitor ponded and placed in backfilling mortar proved to be the most effective corrosiontreatment under investigation. The treatment exhibited the greatest sustained reduction incorrosion rate. The effectiveness of the DCI is dependent upon an adequate nitrite-to-chloride-ion ratio. This ratio dictates the degree to which the nitrite ions can compete withthe chloride ions for the Fe 2 in solution. Higher nitrite levels result in the enhancedstability of the passive film due to the reformation of Fe203. It was also reconfirmed thatDCI acts as a set accelerator and increases the compressive strength of the mortar at least inmeasurements up to 20 days.
The experimental inhibitors sodium tetraborate and zinc borate showed adequate effectivenessin reducing corrosion when applied as both a ponding and mortar admixture. The borateion's ability to produce a protective layer on steel resulted in a effective reduction in thecorrosion activity by acting as a barrier to increased metal dissolution. However, the boratecompounds act as cement set retarders with zinc borate having a greater effect at similarconcentrations.
Commercial inhibitors Alox 901, Cortec 1337, and Cortec 1609, are potentially effectivetreatments for reinforced concrete after removal of chloride-contaminated concrete.
127
Degrees5
4
3
2
050 200 350 500 650 800 950 1100 1250 1400
Temperature (C)
Fig. 32 Differential Thermal Analysis of Hydroxylapatite
NOTE: °F = 9/5°C + 32
128
However, due to their proprietary nature, the exact mechanism of their corrosion inhibitionability is not known.
In general, it was determined that the ponding of treatment solution is more effective incorrosion abatement than solely backfilling with treated mortar. The ponding allows for thediffusion of the inhibitor not only through the concrete but also possibly through thereinforcing steel/concrete interface. However, the removal of chloride-contaminated concreteabove a reinforcing bar and subsequent replacement with fresh mortar has little effect on thecorrosion activity when the chloride ion concentration at the reinforcing steel level is high.Without the presence of a corrosion inhibiting agent, the concrete surrounding a corrodingreinforcing steel would still have a sufficient chloride concentration to spur the continuationof corrosion.
The evaluation of hydroxylapatite as a chloride ion scavenging mineral showed no indicationof chloride ion scavenging ability in aqueous tests or when placed alone in mortar.
Recommendations
Based on the limitations encountered through the course of this study, the followingrecommendations can be made for further research:
1. Long term evaluation of treated specimens should be addressed to aid inestimating treatment life-cycles in bridge deck systems.
2. Tests should be conducted to determine the optimum treatment concentration basedon the volume of chloride contaminated concrete removed.
3. In order to aid in the diffusion of treatment chemicals, the concrete should bedried prior to ponding treatment.
4. The removal of all concrete to the reinforcing steel level as opposed to solelygrooving above the reinforcing steel is an enhanced treatment.
5. Economic feasibility studies should be performed on effective treatments.
6. Surface analysis on the reinforcing steel should be conducted after the terminationof the exposure period to detect the presence of passive films or adsorbed species.
7. Evaluation of the chloride ion scavenging ability of other apatite forms should beperformed. Other minerals, such as sodalite, should also be evaluated.
129
4
Part III: Evaluation of Polyaphrons As CorrosionInhibitors
Introduction
A polyaphron is a small oil drop that has been encapsulated by a soapy aqueous film layer,in which water is the continuous phase. Polyaphrons are formed by first dissolvingsurfactants in both the separate oil and aqueous phases. Then, slowly, the oil phase is addedto the aqueous phase. The mixture must be well shaken between additions of the oil in orderto break the oil into very small drops and allow the aqueous phase to encapsulate it. Thisprocess is continued until all the oil has been added. Factors contributing to the sizedistribution of the resulting aphron include surfactant concentration and water-to-oil ratio(PVR). The resulting size distribution can vary from only a few microns up to 30 or 40microns in size. The general relationship between size distribution and PVR is the higher thePVR, the smaller the aphrons will be.
Research Objectives
The objectives of this part of the study is two-fold: 1) To investigate the feasibility ofreducing corrosion using polyaphrons of different compositions, and 2) study the movementrate of liquid core aphrons through cement paste, mortar, and concrete.
131
E×per_men_ Program
Corrosio_ _educao_ Using _o_yaFhre_s
The commercial inhibitors, primarily, sulfonated petrochemicals such as Petromix HL andCR, Petromix #9 and Arguard 2C-75 were dissolved in the oil phase. A non-ionicsurfactant, 15-A-9, which is a polyethylene glycolether of a secondary alcohol, wascommonly used as a surfactant in the aqueous. Petromix #9 and Petronate CR were alsoused as the aqueous phase surfactant. Table 22 presents aphron types used in the corrosionreduction tests.
Once a particular composition of aphron was chosen and made, corrosion reduction testswere performed on 0.25 x 1.0 x 3.0 inch, 1040 carbon steel coupons placed in varioussolutions. Prior to testing, the steel coupons were first washed in soap and water byscrubbing each sample with a soft nylon brush, then dried, and soaked in hexane to furtherremove any remaining loose rust or oil. The coupons were then weighed, submerged in anaphron solution, and placed in an oven at 95"F (35°C) to accelerate corrosion. After a givenamount of time, usually 4 to 7 days, the samples were removed from the aphron solution,cleaned using the same pre-immersion procedure, visually inspected for corrosion, andweighed. When the samples underwent general corrosion only, the corrosion rate wascalculated as:
Rate = (K x W)/(A x T x D)where (3)
K = constant (3,450,000)W = weight loss due to corrosionA ---surface area of the coupon, cm2T = immersion time, hoursD = coupon density, 8.28 g/cm3
All the solutions used in the immersion tests were based on 0.3 % NaC1 combined with a
particular polyaphron such that the resulting solution was 10 parts saline solution and 1 partpolyaphrons. The variations to the saline solution included buffering the pH from 7 to 11;introducing potassium hydroxide, (KOH); sodium hydroxide, (NaOH); and calciumhydroxide, (Ca(OH)z). Another variation on the immersion solution included adding sodiumsulfite (NaSO3)as an oxygen scavenger.
For all immersion tests performed, a representative number of coupons was always immersedin a solution with no aphrons present to provide a means of comparison to those containingaphrons. This was essential to compare weight losses due to general corrosion and washelpful in providing visual comparisons with samples treated with aphrons. The aphroncorrosion reduction results, mean and standard deviation, for the various test conditions ofsolution type, aphron composition, number of coupons, test time and solution pH arepresented in Table 23. The general results and observations are as follows:
132
Table 22. Aphron Types Used in the Corrosion Reduction Tests
Aphron Water Concentration Oil Concentration IonicType PVR Surfactant (mL/L) Surfactant (g/L) Character
A-2 10 15-S-9 5 Petronate L 1.0 Aniomc
C-1 10 15-S-9 5 Petronate CR 1.5 Amomc
C-2 10 15-S-9 10 Petronate CR 3 Aniomc
C-3 10 Petronate CR 15 Petronate CR 5 Amomc
D-1 I0 15-s-9 5 Petromix #9 1.5 Amomc
D-2 10 Petromix #9 10 Petromix #9 1.5 Amomc
D-3 10 Petromix #9 5 Petromix #9 1.5 Anlomc
D-4 10 Petromix #9 5 Petromix #9 -- Aniomc
D-6 10 15-S-9 10 Petromix #9 10 Amomc
D-7 10 15-S-9 10 Petromix #9 3 Amomc
G-1 10 15-S-9 10 Arquad 2C-75 40 Cat_omc
133
Table 23. Aphrora Cora'os_o_ _educfion _esunt.5
Weight Loss (g)Solution Aphron x n Time (h) pH
0.3 % NaC1 A-2 .0051 .0008 5 48 8
" C-1 .0168 .0012 6 96 $
" C-2 .0304 .0004 4 96 8
" C-3 .0040 .0009 10 96 8
" D-I .0147 .0020 6 96 8
" D-2 .0036 .0006 5 96 8
" D-3 .0022 .0010 4 96 8
0.3 % NaCl D-3 .0003 .0007 13 72 $
500 ppm N_2S03
" D-3 .0051 .0005 4 139 8
" D-3 .0049 .0006 7 144 10
0.3 % NaC1 D-3 .0007 .0003 4 119 11
_Pore Sol'n
500 ppm N_SO 3 D-3 .0048 .0009 4 256 13
0.3 % NaCl D-4 .0193 .0011 5 96 8
" D-6 .0134 .0010 5 96 8
" D-7 .0199 .0016 7 96 8
Pore SoFa G-1 .0106 .0012 4 173 13
* G-1 .0011 .0004 5 191 13
* G-1 .0074 .0010 4 240 13
134
• The aphrons which were made using Petromix #9 as the oil phase surfactantshowed the most promise in preventing general corrosion (D-1 through D-7).
• Pitting corrosion was a common occurrence, however, it was believed to becaused primarily due to the orientation of the steel coupon in the solutions.
• Aphrons made with the cationic surfactant, Arquad 2C-75, were by far themost stable in the heat and salt/pore solution environment. All other aphrons broke very
shortly after being added to the salt/pore solutions.
• Lower pH solutions (7-8) showed a higher tendency for general corrosion,
while higher pH solutions (13) showed a greater tendency towards scale corrosion. Solutionswith a pH in the range of 9-10 appeared to minimize both types of corrosion.
• The addition of excess amounts of sodium sulfite as an oxygen scavenger
clearly reduced the amount of general corrosion as well as pitting corrosion. However, itwas suspected that the oil/aphron layer that would form on the top of the solutions provideda barrier to prevent further oxygen from ingressing into solution.
Movement of Aphrons Through Concrete
The second aspect of the research was aimed at investigating how polyaphrons diffusethrough concrete when subjected to a potential gradient. Aphrons which showed the mostpromise for corrosion protection were predominantly used.
Three separate mixtures were used for the tests: concrete, mortar and cement paste. Allthree mixtures were cast with a water to cement ratio of 0.47 and were cured in a moist
room for 28 days prior to testing. Once the specimens had been cured, they were cut intosmall discs with dimensions of approximately 3/4 in. (1.91 cm) in diameter by 1/8 in. (0.32cm) thick. The samples were then placed in a glass cell (See Fig. 33), using a silicon rubbersealant to prevent leaks around the edges of the specimens. Once the sealant was allowedadequate time to dry, one side of the glass cell was filled with an aphron solution while theother was filled with distilled water. The electrodes were then placed in each side accordingto the ionic character of the aphron, and an electric potential of 110 volts DC was applied tothe cell.
It was usually noticed, while performing these experiments, that after some time, theelectrode on the water side of the cell would begin bubbling and the current across the cellwould often rise above the scale limits of the apparatus, (5mA). At that point, theexperiment was usually terminated, or observed for a short period of time and thenterminated. The sample was then removed from the cell and cut in half. The extent ofpenetration of the aphrons into the cell was visually determined due to the "wetting" of thecement by the aphrons. Table 24 presents the results of the aphron diffusion tests.
135
E,.
O.0
C_.
o
0
0
L
_ .t..
m 0
_'X\\\\\\\"_ _, E '-
0
C _
o_
"0o
c0
0
U
+
Table 24. Aphron Electrically Induced Diffusion Test Results
Trial # Aphron Type Mixture * Rate (in/hr)
1 D-7 F.A. 0.00179
6 D-7 F.A. 0.00610
7 D-7 C.P. 0.00205
8 D-7 C.P. 0.00540
20 D-7 C.A. 0.00120
22 G-1 C.A. 0.00164
23 G-1 C.A. 0.00246
24 G-1 F.A. 0.00239
25 G-1 F.A. 0.00492
26 G-1 F.A. 0.00328
28 G-1 C.P. 0.00514
Mixture* Mean Rate (in/Hr) Standard Deviation
C.A. 0.00179 0.00060
F.A. 0.00370 0.00179
C.P. 0.00420 0.00186
C.A. - concreteF.A. - mortar
C.P. - cement paste
137
The diffusion rates of the polyaphrons through the various types of cement mixtures werevery slow, even with the addition of the driving force provided by an electric potential. Itwas also observed that most aphrons would begin breaking down after several hours underthe effect of the electric current. Once this occurred, the water and oil separated, any saltsthat were dissolved in the water caused the water to be drawn through the cement and not theoil containing the inhibitor.
The results show that the diffusion rates of polyaphrons through the various mixtures arevery slow even with an additional electrical driving force, and the mean rate and standarddeviation significantly increased with increasing aggregate content. In addition, mostaphrons broke down after several hours under the effect of the electric current. Once theaphrons broke down, the water and oil separated and any salts dissolved in the water causedthe water to be drawn through the cement leaving the oil containing the inhibitor behind.The water being drawn through the concrete would decrease the specimen's resistance andthe current would increase under a constant potential and the water would begin to bubble atwhich time the test was stopped.
Based on the results of this study, the following findings were obtained.
o Aphrons made using Petromix #9 showed promising results in preventinggeneral corrosion.
* Aphrons made with cationic surfactant were the most stable in heat and salt.
o Solution with a pH of 9-10 minimized corrosion.
° Increasing sodium sulfite, as an oxygen scavenger, reduced corrosion.
° The diffusion rate of polyaphrons through concrete are very slow.
. Using electrical current as a driving force to increase the polyaphrons diffusionrate in concrete led to breaking the aphrons down after several hours.
This study concluded that polyaphrons are not practical inhibitors due to the fact of their verylow diffusion rate.
138
APPENDIX A
Concrete and Mortar
139
Table A=lo Gradations of coarse (CA) and fine (FA)
aggregates
Sieve Size CA _ Passing FA % Passing
I/2°_ ! 100 100
3/8_° I 93 98
NOo 4 I 17 91
_Oo8 I .9 _3NOo 16 i 52
MOo 30 I === 32
NOo 50 I === 8
NOo 100 I === 2
NOo 200 === 002
140
Table A-2. Characteristic properties of coarse (CA)and fine (FA) aggregates
Property CA FA(3/8" limestone) (natural sand)
Dry Unit Weight 89.3 Ibs/ft 3 ....
Specific Gravity 2.73 g/cc 2.66 g/cc
Absorption 1.36% 0.36%
Fineness Modulus .... 3.39
141
Table A-3o Concrete mix design for specimen set A
C0mDonent _uantity _SSD) in ib
Cement 39o04
Water 19o72
Coarse Aggregate 68°50
Fine Aggregate I07o91
AF_ (Mic_oair) 2089 _l
_TRoR 92045 ml
_otal 235017 lbs
142
Table A-4. Concrete properties for specimen set A
Property Batch 1 Batch 2 Batch 3 Batch4
Slump 2.25" 2.50" 2.50" 2.25"
Air 6% 5.7% 5.3% 6.2%
Unit Wt. (pcf) 141.4 141.8 141.9 141.6
Temperature 59 °F 61 °F 62 °F 61 "F
Strength (ksi)
7-day 4.97 5.37 5.09 4.93
28-day 6.57 5.97 6.45 6.41
143
Table A_5o Concrete mix design for specimen set B
Commonent _uantitv fSSD) in lb
Cemen% 39°04
_a%er 19o73
Coarse Aggregate 68°47
Fine AggregaZe i07o93
AEA (Mic_oair) 2043 ml
_R-R _0o89 ml
To%ai 235o17 ibs
Table A-6. Concrete properties for specimen set B
Property Batch 1 Batch 2 Batch 3 Batch4
Slump 3.5" 4.0" 3.75" 3.75"
Air 6.9% 6.6% 7.0% 6.8%
Unit Wt. (pcf) 141.4 141.8 141.9 141.6
Temperature 63 °F 60 °F 60 °F 62 "F
Strength (ksi)
7-day 5.01 4.87 5.12 5.05
28-day 6.72 6.34 6.43 6.27
145
Table A-7o Backfill mortar mix design with treatmentvariations
Basic mix used to fill two grooves:
Cement Io75 lbs
Fine Aggregate (dry) 5°28 lbsWater 0o61 lbs
List of treatments placed in mortar, amount of additional
water needed to obtain adequate workability, and resulting
w/c ratio based on 0036% FA absorption_
Treatment Additional Mater w/c Ratio
Blank (B_I_B_4_B_9 20°5% 042.
BoIB0 B-14e
B_I5)
DCI (B=2_B_3) 18o0% o41
Sodium Tetraborate 25°8% °44°
(Bo6_B_7)
Zinc Borate (B_8) 29°3% °45°
Apatite (B_5, B_I0) 30°9% 045 °
Zinc Borate/Apatite 32°5% 046 °
(B-12)
DCl/Apatite (B_ll) 29o3% 045 °
CORTEC 1609 (B-160A_15) 21o0% 042
_These water/cement ratios may be high due to the fact that
_hat apatite and both the borates are applied as powders into
the mixing water_ therefore, they may have absorbed oradsorbed some of the water, taking it away from_/%e hydration
process°
Table A-8. Mortar cube mix design with treatmentvariations
Basic mortar cube mix (9 cubes):
Cement 740 g
Fine Aggregate (dry) 2035 g.Water 369 ml
*i0 ml of additional water were needed abovethe ASTM C 109 standard (359 ml) due tothe use of the dry sand.
The following treatments required additional water or theaddition a set retarder:
Treatment Addition
DCI 5% s/s cement Set retarder 0.3% s/s cement
DCI 10% s/s cement Set retarder 0.6% s/s cement
Apatite 25% s/s cement i0 ml of water for workability
Cortec 1337 No additions
Sodium tetraborate No additions
Zinc borate No additions
147
APPENDTX B
Measurement Procedures
149
Resistivity Measurements Using a Soil Resistance Meter
The resistivity of the 2" mortar cubes was found through the use of a modified Nilsson soilresistance meter. Two metal filled copper tings secured to an imulative backing weresoldered onto the two contact cables of the resistance meter. These circular metallicsurfaces, 1 in2, served as the two contact surfaces between which current was passed.
Based on Ohm's Law,
R = V/I (9)
where,
R = resistance in t_
V ---potential in Volts
I = current in Amperes
resistance can be expressed as:
R = oL/A (10)where,
p = resistivity in n-in.
L = length in in.
A = cross sectional area in in2
From this, resistivity ran be expressed in terms of centimeters:
p = A x R/L (11)
150
-- 0.997 x R
where A and L have been converted to centimeters and the units of resistivity are ohms-era.Based on equation eleven, the resistance readings from the meter can be directly convertedto resistivity.
The resistance measurements were taken between all three opposite faces of each cube.Electroconductive gel was used to assure a conductive contact with the mortar cube surfaces.The metal contacts were clamped down over the opposite surfaces and a current wasapplied. A resistance dial was turned until the current was hulled and the dial reading wastaken as the resistance across the mortar cube. The rough surface of each mortar cube thatcorresponded to the open surface of the mortar molds appeared to affect the resistivitymeasurements. The resistivity across this surface always appeared higher than the othersurfaces. This is probably due to the rough surface affecting the contact area. As a result,only the two resistivity measurements taken across the smooth surfaces was recorded foreach cube.
Differential Thermal Analysis Procedure
The differential thermal analysis conducted on hydroxylapatite was performed using a PerkinElmer high temperature differential thermal analysis system in combination with a thermalanalysis controller and data station.
Samples were weighed and placed in a small platinum crucible which was positioned in theDTA heating chamber next to the standard reference sample. The following parameterswere used in controlling the thermal analysis:
Final temperature = I400 °CMinimum temperature = 30 °CTemperature increment = 140 *CY-range = 20Heating rate = 20 *C/rainCooling rate = 30 °C/rain
After completion of the thermal analysis, the DTA scan was plotted and evaluated for anynoticeable peaks or valleys indicating a thermally induced reaction.
Table C-6. Average mortar cube strength for treated specimens
Compressive Strength
Treatment Concentration (ksi)
( % s/s cement)Day I Day 3 Day 20
Control i. 98 3.76 5.69
0.15 % 2.03 3.43 5.59
Cortec 1609 0.30 % 1.89 3.14 5.11
0.45 % 2.02 3.38 5.86
6.25 % 2.36 3.59 5.69
Hydroxyl-
apatite 12.50 % 2.02 3.27 5.33
25.00 % 2.17 3.45 5.90
2.50 % 2.34 5.10 6.83
DCI 5.00 % 2.69 5.20 7.67
I0.00 % 3.17 5.79 7.53
0.50 % 0.50 2.80 5.56
Sodium
Borate 1.00 % 0.07 0.47 5.03
2.00 % 0.00 0.24 4.42
0.22 % 2.00 4.00 5.46
0.43 % 0.09 1.28 4.32
Zinc 0.85 % 0.00 0.51 3.95Borate
1.70 % 0.00 0.00 3.25
3.40 % 0.00 0.00 2.46
165
Table C-7. Average mortar cube resistivity for treated
specimens
Resistivity (kohm-cm)Treatment Concentration
( % s/s cement) Day Day Day Day1 3 I0 20
Control .40 .87 1.6 2.1
0.15 % .37 .90 1.5 2.2Cortec
1609 0.30 % .37 .85 1.6 2.0
0.45 % .47 .85 1.5 2.0
6.25 % .49 .87 1.6 2.2
Hydroxyl-
apatite 12.50 % .47 .84 1.4 2.3
25.00 % .52 .86 1.6 2.3
2.50 % .62 1.0 1.9 2.4
DCI 5.00 % .63 1.2 1.8 2.3
i0.00 % .62 1.3 2.2 2.5
0.50 % .17 .84 1.4 2.0
Sodium
Borate 1.00 % * .45 .88 1.7
2.00 % * .36 .69 1.5
0.22 % .38 .89 1.7 2.1
0.43 % * .61 I.i 1.9
0.85 % * .51 .92 1.8Zinc ....
Borate 1.70 % * * * .76
3.40 % * * * .68
* = insufficient set strength to test resistivity
References
1. Seventh Annual Report to Congress-Highway Bridge Replacement and Rehabilitation Pro_oram, U.S.
Department of Transportation, Federal Highway Administration, Office of Engineering, Bridge Division,1986, 00. 59.
2. "Corrosion of Metals in Concrete," Report by ACI Committee 222, Report No. ACI 222B-89, AmericanConcrete Institute, Detroit, MI, 1990, pp. 18-19.
3. Wallbank, E. J. The Performance of Concrete Bridges: A Survey of 200 Hiohway Bridges, Her Majesty's
Stationary Office, London, April 1989.
4. D.E. Tonini and S. W. Dean, Eds. Chloride Corrosion of Steel in Concrete, STP 629, ASTM, 1977.
5. D.G. Manning and J. Ryell. Durable Bridge Decks. Ontario Ministry of Transportation andCommunications, April 1976.
6. P.H. Perkins. Repair, Protection, and Waterproofing of Concrete Structures. Elsevier, Applied SciencePublishers, New York, 1986.
7. ACI Committee 515 Report "A Guide to the Use of Waterproofing, Dampproofing, Protective andDecorative Barrier Systems for Concrete. American Concrete Institute, IR-79, Revised 1985, Detroit.
8. N.E. Hammer. Inhibitors for Use on Reinforcing Steel in Concrete, Corrosion lnhibitors. Ed. C. C.
Nathan, 1973, pps. 259-260.
9. N.E. Hammer. Inhibitors in Organic Coatings, Corrosion Inhibitors. Ed. C. C. Nathan. 1973, pp. 190-195.
10. E. MeCafferty. Mechanisms of Corrosion Control by lnhibitors, Corrosion Control by Coatings. SciencePress, Princeton, 1979, pp. 279-318.
11. N.E. Hammer. Inhibitors for use on Reinforcing Steel in Concrete, Corrosion Inhibitors. Ed. C. C.
Nathan. 1973, pp. 190-195.
12. N.S. Berke. The Effects of Calcium Nitrite and Mix Desiqn on the Corrosion Resistance of Steel in
Concrete. Paper #132 presented at the Annual Meeting of the National Association of CorrosionEngineers, San Francisco, 1987.
13. Y.P. Virmani. Time-to-Corrosion of Reinforcing Steel in Concrete Slabs. Volume VI: Calcium Nitrite
167
Admixture. Publication FWHA-RD-88-165, Federal Highway Administration, McLean, Virginia, 1988.
14. Rosenberg, A. et al, "Mechanisms of Corrosion of Steel in Concrete," Materials Science of Concrete, pp.285-309.
16. Cook, H.K. and McCoy, W.J., "Influence of Chloride in Reinforced Concrete," Chloride Corrosion ofSteel in Concrete, ASTM STP 629, ASTM, Philadelphia, PA, 1977, pp. 20-29.
17. Shiessel, P. and Bakker, R., "Measures of Protection," Corrosion of Steel in Concrete, Chapman and Hill,New York, 1988, pp. 71-78.
18. Cady, P.D. and Weyers, R.E., "Chloride Penetration and Deterioration of Concrete Bridge Decks,"Cement, Concrete, and A_regat.e..s, CCAGDP, Vol. 5, No. 2, Winter 1983, pp. 81-82.
19. Verbeck, G.J., "Mechanisms of Corrosion of Steel in Concrete," Corrosion of Metals in Concrete, SP 49-
3, ACI, 1975, pp. 21-38.
20. Locke, C.E., "Corrosion of Steel in Portland Cement Concrete: Fundamental Studies," Corrosion Effects
of Stray Currents and the Techniques for Evaluating Corrosion of Rebars in Concrete, ASTM STP 906,ASTM, Philadelphia, PA, 1985, pp. 5-13.
21. Shalon, R. and Raphael, M., "influence of Seawater on Corrosion of Reinforcement," ACI Journal,Proceedings Vol. 55, No. 8, Feb 1959, pp. 1251-1268.
22. Griffin, D.F., "Corrosion Inhibitors for Reinforced Concrete," Corrosion of Metals in Concrete, SP 49-8,ACI, Detroit, MI, pp. 95-101.
23. Boyd, W.K. and Tripler, A.B., "Corrosion of Reinforcing Steel Bars in Concrete," Materials Protection,Vol. 7, No. 10, 1968, pp. 40-.47.
24. Rosenberg, A.M. et al, "A Corrosion Inhibitor Formulated with Calcium Nitrite for Use in Reinforced
Concrete," Chloride Corrosion of Steel in Concrete, ASTM STP 629, ASTM, Philadelphia, PA, 1977, pp.89-99.
25. Craig, R.J. and Wood, L.E., "Effectiveness of Corrosion Inhibitors and the Influence on the PhysicalProperties of Portland Cement Mortars," Highway Research Record, No. 328, Highway Research Board,1970, pp. 77-88.
26. A. Moragues, A. Maciss, and C. Andrade. Equilibria of the Chemical Composition of the Concrete PoreSolution. Cement and Concrete Research, Voi. 17, 1986, 00. 173-182.
27. K. Siegbahn, C. N. Nordling, A. Fahlman, R. Nordberg, K. Hamrin, J. Hedman, G. Johansson, T.Bergmark, S. E. Karlsson, L. Lindgren, and B. Lindberg. Electron Spectroscopy for Chemical Analysis(ESCA): Atomic, Molecular, and Solid State Structure Studies by Means of Electron Speetroseopy.Almqvist and WikseUs, Uppsala, 1967.
28. (a) J. G. Dillard and I. M. Spinu. An Investigation of the Effect of Plasma Treatment on the SurfaceProperties and Adhesion in Sheet Molded Composite (SMC_. J. Adhesion, Vol. 31, 1990, pp. 137-159.
168
(b) J. M. Epp, J. G. Dillard, A. Siochi, R. Zallen, S. Sen, and L. C. Burton. Effects of IonBombardment on the Chemical Reactivity of GaAs (100): Variation of Bombardin_ Ion Mass. Chem.
Materials, Vol. 2, 1990, pp. 173-180.
29. D. Briggs and M. P. Scab. Practical Surface Analysis bv Au_oerand X-ray Photoelectron Spectroscopy.Eds., John Wiley and Sons, New York, 1983.
30. "Standard Test Method for Half-Cell Potentials of Uncoated Reinforcing Steel in Concrete," C-876-87,Annual Book of ASTM Standards, Vol. 04.02, ASTM, Philadelphia, PA, pp. 563-570, 1992.
31. Standard Practice for Examination and Evaluation of Pittin_o Corrosion. ASTM Standard G46-76
(Re.approved 1986), American Society of Testing Materials, Philadelphia, PA, 1986.
32. McCutcheon's Functional Materials: Corrosion Inhibitors. The Manufacturing Confectioner Publishing
Company, Glen Rock, New Jersey, 1989.
33. J.T. Lundquist, A. M. Rosenherg, and J. M. Gaidis. Calcium Nitrite as an Inhibitor of Rebar Corrosionin Chloride Containin_ Concrete. Materials Performance, Vol. 18, 1979, pp. 36-48.
34. A.M. Rosenberg and J. M. Gaidis. The Mechanism of Nitrite Inhibition of Chloride Attack onReinforcing Steel in Alkaline Aqueous Environment. Materials Performance, Vol. 18, 1979, pp. 45-48.
35. E.W. Washburn. The Dynamics of Capillary Flow. Phys. Rev. Vol. 177, 1921, pp. 273.
36. C.D. Wagner, L. H. Gale, and R. H. Raymond. Two Dimensional Chemical State Plots: A StandardizedData Set for Use in Identifying Chemical States By X-ray Photoelectron Spectroscopy. Anal. Chem., Vol.
51, 1979, pp. 466-482.
37. Berry, L.G. et al, Mineralogy, 2nd ed., W.H. Freeman and Company, San Francisco, CA, 1983, pp. 372-376.
38. P.D. Cady, "Corrosion of Reinforcing Steel in Concrete - A General Overview of the Problem," ChlorideCorrosion of Steel in Concrete, ASTM 629, ASTM, Philadelphia, PA, 1977, pp. 7-8.
39. 3LP Corrosion Rate Meter: Test Procedures, Data Analysis, and General Information, K. C. Clear, Inc.,
Boston, VA, July 1990, Appendix, p. 9.
40. Ott, L., An Introduction to Statistical Methods and Data Analysis, 3rd ed., PWS-Kent Publishing, Boston,
MA, 1988, pp. 149-151.
41. Dodson, V.H., Concrete Admixtures, Van Nostrand Reinhold, New York, 1990, pp. 103-127.
42. Chander, S. and Fuerstenau, D.W., "Solubility and Interfacial Properties of Hydroxyapatite: A Review,"Adsorption on and Surface Chemistry of Hydroxyapatite, Plenum Press, New York, 1984, pp. 29-50.