Page 1
NSERC Research Chair in Innovative FRP Composite Materials for Infrastructures
Technical Report
Prepared by:
Ahmed Farghaly, Hanyy Tobbi, and Brahim Benmokrane, P. Eng., Ph.D.
Department of Civil Engineering, Faculty of Engineering University of Sherbrooke, Sherbrooke, Québec, Canada J1K 2R1 Tel: (819) 821-7758 Fax: (819) 821-7974 E-mail: [email protected]
Submitted to:
Pultrall Inc., Thetford Mines, Quebec
December 2009
CONCRETE COLUMNS REINFORCED LONGITUDINALLY
AND TRANSVERSALLY BY GFRP BARS
a
Page 2
2
Manuscript submitted on October 19th 2010 for review and possible publication 1
in ACI Structural Journal 2
CONCRETE COLUMNS REINFORCED LONGITUDINALLY AND 3
TRANSVERSALLY BY GFRP BARS 4
5
Ahmed Sabry Farghaly, Hany Tobbi, and Brahim Benmokrane 6
7
Biography: 8
Ahmed Sabry Farghaly is a Post-Doctoral fellow in the Department of Civil Engineering at the 9
University of Sherbrooke, Sherbrooke, QC, Canada. He received his B.Sc. from Assiut 10
University, Assiut, Egypt; M.Sc. and Ph.D. from Hokkaido University, Sapporo, Japan. His 11
research interests include nonlinear analysis of reinforced concrete structures and behavior of 12
structural concrete reinforced with fiber-reinforced polymers. 13
Hany Tobbi is a Doctoral Candidate in the Department of Civil Engineering, University of 14
Sherbrooke, Sherbrooke, QC, Canada. He received his B.Sc. from the University of Mentouri, 15
Constantine, Algeria; M.Sc. from the University of Claude Bernard, Lyon, France. His research 16
interests include structural analysis, design, and testing of fiber-reinforced polymer reinforced 17
concrete structures. 18
Brahim Benmokrane FACI, is an NSERC Research Chair Professor in FRP Reinforcement for 19
Concrete Infrastructures and Canada Research Chair in Advanced Composite Materials for Civil 20
Structures in the Department of Civil Engineering at the University of Sherbrooke, Sherbrooke, 21
QC, Canada. He is a member of ACI committee 440 FRP Reinforcement and in the Canadian 22
Page 3
3
Standard Association (CSA) committees on FRP structural reinforcing materials for buildings 1
(CSA S806), bridges (CSA S6), and specification (CSA S807). 2
ABSTRACT 3
Using fiber-reinforced polymer (FRP) reinforcing bars as the main reinforcement for concrete 4
structures in harsh environments is becoming a widely accepted solution to overcome the 5
problem of steel corrosion. Due to the relatively lower cost of glass FRP (GFRP) bars compared 6
to the other commercially available FRP bars, the use of GFRP bars in reinforced concrete (RC) 7
structures has been widely investigated. This paper presents an experimental study of the 8
behavior of 350 x 350 mm (13.78 x 13.78 in) cross-section concrete columns reinforced by 9
GFRP bars under concentric loading. Effect of key variables such as tie configuration and 10
spacing and spalling of concrete cover are studied. The columns reinforced by GFRP could 11
maintain a similar load or higher comparing to the columns reinforced with steel. The 12
mechanism of the failure could be explained. Gain in strength and ductility are recorded for the 13
concrete core of well-confined columns. 14
15
Keywords: column; compression; confinement; failure mechanism; GFRP reinforcement. 16
17
INTRODUCTION 18
The use of concrete structures reinforced with fiber-reinforced polymer (FRP) composite 19
materials has been growing to overcome the common problems caused by corrosion of steel 20
reinforcement (ACI 440, 2007). The climatic conditions where large amounts of salts are used 21
for ice removal during winter months may contribute to accelerating the corrosion process. These 22
conditions normally accelerate the need for costly repairs and may lead to catastrophic failure. 23
Page 4
4
Therefore, replacing the steel reinforcement with the noncorrosive FRP reinforcement eliminates 1
the potential of corrosion and the associated deterioration. The direct replacement of steel with 2
FRP bars, however, is not possible due to various differences in the mechanical properties of the 3
FRP materials compared to steel. 4
The response of the GFRP bars in compression is affected by the different modes of failure 5
(transverse tensile failure, buckled GFRP bar, or shear failure). Therefore, for general acceptance 6
by practitioners, however, it is necessary to establish appropriate design guidelines for the use of 7
GFRP bars in compression members. Due to the lack of experimental data, the use of GFRP bars 8
as longitudinal reinforcement in compression members is still not recommended in current ACI 9
440.1R-06 design guidelines. However, GFRP reinforcement in the compression zone (as 10
longitudinal reinforcement in columns or as compression reinforcement in flexural members) 11
shall be deemed to provide no compressive resistance in design according to the CSA S806-02 12
Code. 13
Literature review 14
In compression members reinforced with FRP bars, knowledge of FRP bar compression 15
properties is important. However, few studies were conducted to evaluate FRP bars mechanical 16
properties under compression. The compressive strength of FRP bars is relatively low compared 17
to its tensile strength (ACI 440, 2007). Compressive strength is dependent on the fibre type, the 18
fibre volume ratio, manufacturing process, etc. Higher compressive strengths are expected for 19
bars with higher tensile strength (ACI 440, 2007). The compressive modulus of elasticity of FRP 20
bars depends on length-to-diameter ratio, bar size and type, as well as on other factors, such as 21
boundary conditions. In the reported results from compression tests, it is generally agreed that 22
the compressive stiffness ranges from 77 to 97 percent of the tensile stiffness (Bedard, 1992, 23
Page 5
5
Chaallal and Benmokrane, 1993). Kobayashi and Fujisaki (1995) tested aramid, carbon and glass 1
reinforcing bars in compression. Experimental results showed that the compressive strengths of 2
the aramid, carbon and glass fiber reinforcing bars were 10, 30 and 30% of their corresponding 3
tensile strengths, respectively. Deitz et al. (2003) tested GFRP No.15 (15 mm diameter [0.59 in]) 4
under compression. It is concluded that, the ultimate compressive strength is approximately 5
equal to 50% of the ultimate tensile strength, whereas the modulus of elasticity in compression 6
could be considered approximately equal to the modulus of elasticity in tension. 7
Paramanantham (1993) tested 14 200 x 200 x 1800 mm (7.87 x 7.87 x 70.87 in) concrete beam-8
columns reinforced with glass reinforcing bars. It is reported that glass reinforcing bar would 9
only be stressed to up to 20 to 30% of its ultimate strength in compression, while up to 70% in 10
pure flexure. Kawaguchi (1993) tested 12 150 x 200 x 1400 mm (5.9 x 7.87 x 55.12 in) concrete 11
columns reinforced with aramid reinforcing bars and subjected to eccentric tension or 12
compression. It is noted that no marked difference in the analytical procedures as compared with 13
steel-RC columns. Kobayashi and Fujisaki (1995) tested a number of 200 x 200 x 650 mm (7.87 14
x 7.87 x 25.6 in) concrete columns reinforced with aramid, carbon, and glass reinforcing bars 15
under concentric loads. Three modes of failure are noted: crushing of concrete, compressive 16
rupture of FRP reinforcing bars, and tensile rupture of FRP reinforcing bars. It could be 17
concluded that ductile failure of concrete columns depends on compressive strength of FRP 18
reinforcing bar, which could be as low as 10% of its tensile strength for aramid, 30 to 40% for 19
glass, and 30 to 50% for carbon. However, the grid-type glass reinforcement has the same 20
capacity in compression as that in tension. Alsayed et al. (1999) tested 15 450 x 250 x 1200 mm 21
(17.72 x 9.84 x 47.24 in) concrete columns under concentric axial loads to investigate the effect 22
of replacing longitudinal and/or lateral steel reinforcing bars by an equal volume of glass 23
Page 6
6
reinforcing bars. The replacing longitudinal steel reinforcing bars by glass reinforcing bars 1
reduced the axial capacity of the column by 13%. Regardless of the type of longitudinal bars, 2
replacing steel ties by glass ties reduced the axial capacity of the column by only 10%. 3
Moreover, replacing steel ties by glass ties had no influence on the load-deformation of the 4
column up to approximately 80% of the ultimate capacity. De Luca et al. (2010) tested 5 610 x 5
610 x 3000 mm (24 x 24 x 120 in) concrete columns under concentric load. They concluded that 6
the GFRP bars can be used in columns; however, their contribution may be ignored when 7
evaluating the nominal capacity. In addition, they noted that the GFRP ties do not increase the 8
ultimate capacity but delaying the buckling of longitudinal bars. 9
10
RESEARCH SIGNIFICANCE 11
With the increased use of FRP reinforcement in concrete structures, it is necessary to establish 12
appropriate design guidelines for various FRP-RC members. In particular, stability of FRP-RC 13
columns and applicability of using FRP ties for the confinement. In this study, the behavior of 14
concrete columns reinforced by GFRP bars is investigated based on laboratory tests on full-scale 15
specimens. The failure mechanism is explained. The confinement effect of GFRP ties is clarified. 16
A new test data is presented to enrich the literature regarding the use of GFRP bars in reinforced 17
concrete columns. 18
19
EXPERIMENTAL INVESTIGATION 20
This paper presents an experiment study of the behavior of full-scale GFRP reinforced concrete 21
columns under concentric loading using specimens with 350 x 350 x 1400 mm (13.78 x 13.78 x 22
55.1 in) square cross section. Fig. 1 shows details of the test specimens and the four tie 23
Page 7
7
configuration used. The test specimen are identified with a letter stands for the reinforcement 1
type and two numbers corresponding to the tie configuration and spacing, respectively. The 2
investigated parameters include GFRP tie configuration and spacing. Table 1 shows the test 3
matrix. 4
Specimens 5
Eight specimens were tested: one is a plain concrete without any reinforcement, two steel RC 6
column, and five GFRP RC columns. All RC columns had similar area of longitudinal 7
reinforcement of 1.9% of the gross section area, Ag, using eight No.19 (19 mm diameter) bars or 8
twelve No.16 (15.9 mm diameter) bars. For GFRP reinforced columns, No.13 (12.7 mm 9
diameter) ties were used; spaced at 80 mm (3.15 in) and 120 mm (4.72 in). For steel reinforced 10
columns, M10 (11.3 mm diameter) ties were used; spaced at 120 mm (4.72 in) and 330 mm (13 11
in). 12
Fig. 2 shows the GFRP reinforcement layouts. The cross section layout is identical for all the 13
specimens. No.13 (12.7 mm diameter) and M10 (11.3 mm diameter) cross-ties were used to 14
provide additional lateral support for the longitudinal bars of GFRP and steel reinforced columns 15
respectively. The GFRP cross-ties were made by assembling pairs of C-shaped No.13 bars for 16
configuration 1 and were staggered to avoid having the overlapped legs on the same side for two 17
consecutive layers for configuration 1A. Closed tie No.13 bars were made for configuration 2. 18
Double pairs of C-shaped No.13 bars were used in configuration 3. 19
Column specimens were cast vertically. The curing period lasted two weeks, after which the 20
specimens were left in the laboratory at ambient temperature for two more weeks before testing. 21
Materials 22
Page 8
8
The columns were constructed using normal-weight ready-mixed concrete with an average 28-1
day concrete compressive strength of 32.6 MPa (4.73 ksi). The concrete compressive strength 2
based on the average values from tests performed on at least three 150 300 mm (6 x 12 in) 3
cylinders for each concrete batch at the day of testing the column under a standard rate of 4
loading (0.25 MPa/s [36.25 psi/s]). Grade 60 steel bars and ties were used for specimens C-S-1-5
330 and C-S-1-120. 6
Straight GFRP reinforcing bars of sizes No.16 (15.9 mm diameter; 199 mm2 cross-sectional 7
area) and No.19 (19.1 mm diameter; 284 mm2 cross-sectional area) were used as longitudinal 8
reinforcement for the GFRP reinforced columns. The tensile properties of longitudinal GFRP 9
bars were determined by performing B.2 test method according to ACI 440 (2004) and shown in 10
Table 2. On the other hand, bend GFRP bars of size No.13 (12.7 mm diameter; 129 mm2 cross-11
sectional area) were used as ties (transverse reinforcement) for the GFRP reinforced columns. 12
The tensile strength, ffu, and modulus of elasticity, Ef, for the straight portions of the ties 13
reinforcement were determined using B.2 test method. However, the strength at the bend 14
location, fbend, was determined using B.5 test method according to ACI 440 (2004). The 15
measured tensile strength and modulus of elasticity for the straight and bend portions are shown 16
in Table 3. The used GFRP bars (longitudinal and ties) were made of continuous high-strength 17
E-glass fibres impregnated in a thermosetting vinyl ester resin, additives, and fillers with a fibre 18
content of 78.8% (by weight) (Pultrall, 2009). The surface of the used longitudinal and 19
transverse GFRP bars is sanded to improve the bond with concrete (Pultrall, 2009). The tensile 20
properties of Grade 60 steel bars used as longitudinal reinforcements are listed in Table 2. 21
Instrumentation and Testing Procedures 22
Page 9
9
The reinforcement deformation was measured by electrical-resistance strain gages glued to the 1
mid height of the bars. A set of ties located at each specimen was instrumented with strain gages 2
placed on middle of the ties. The test specimens were loaded under rigid MTS high force load 3
frame (Fig. 3a) with a maximum compressive capacity of 11400 kN (2560000 Ib) having the 4
load controlled up to 2200 kN (495000 Ib) with the rate of 2.5 kN/s (562 Ib/s), thereafter, 5
displacement control was used to apply the load till failure with the rate of 0.002 mm/s (7.87x10⁻⁶
5 in/s). The axial displacement of the RC column specimens was recorded using four liner 7
variable differential transformers (LVDTs) located at the mid height of each side of the 8
specimens as shown in Fig. 3b. Thin layer of rubber was used as capping over the top and bottom 9
ends of each specimen to ensure parallelism of specimen and surfaces and uniform distribution 10
of the load during testing. To ensure that the failure would occur in the instrumented region, the 11
tapered ends of each specimen were further confined with bolted boxes made from 13 mm (0.5 12
in) thick steel plates (Fig. 3b). 13
14
EXPERIMENTAL RESULTS AND DISCUSSION 15
Strength and Failure Mode 16
Fig. 4 shows the cracking appearance of specimen C-G-3-80 at different loading stages and Fig. 17
5 depicts the cracking appearance of all the specimens after failure. Fig. 6 shows the axial stress-18
axial strain curves for tested specimens. 19
During the ascending part of loading, confinement has little or no effect and the concrete cover is 20
visually free of cracks up to the first peak. This peak corresponds to the stress σc1 when the 21
concrete cover suddenly separates (Fig. 4a and Fig. 6). At this load level, the strain in the 22
transverse reinforcement, as shown in Fig. 7, equal to 0.001 which is generally lower than 10% 23
Page 10
10
of the ultimate tensile strain of GFRP (equal to 0.0145, Table 3). After that, the concrete axial 1
strength loses 10-15% of its maximum value due to the sudden spalling of the concrete cover. At 2
this stage, lateral concrete strain increases significantly and, as a result, the passive confinement 3
becomes very significant. The concrete core gains strength, while the cover gradually disappears 4
(Fig. 4b). Generally, the stress-strain curve for the specimen shows a strength gain and reaches a 5
second peak (Fig. 6). This peak corresponds to the stress σc2 when the concrete core reaches its 6
maximum stress and the concrete crushed or the GFRP ties ruptured (Fig. 4c and Fig. 5). At this 7
stress level, a high values of strain of the transverse reinforcement equal to 0.01 is reached only 8
for well-confined columns (C-G-3-80) which is nearly 70% of ultimate tensile strain (0.0145), 9
and strains values equal to 0.006 (nearly 40% of ultimate tensile strain) were recorded for poorly 10
confined columns (C-G-1-120) as shown in Fig. 7. 11
Fig. 6 illustrates the stress calculated from the total load divided by the total concrete area versus 12
average strain obtained from the four LVDTs for all the specimens tested. The value of σc2, at the 13
second peak, may be lower or higher than the value of σc1, at the first peak, depending on the 14
confinement efficiency of the specimen as shown in Fig. 6. Very well confined specimen (C-G-15
3-80) reached a maximum stress σc2 greater than the stress σc1. On the other hand, specimen with 16
low confinement (C-G-1-120) did not show a well-defined second peak. Finally, at the end of 17
testing, longitudinal bars buckled or ruptured and inclined shear sliding surfaces separated the 18
concrete core into two wedges, causing the axial strength to drop rapidly. 19
Fig. 8 shows the curves representing the axial stress sustained by the concrete with respect to: (1) 20
the total load divided by the total concrete area; and (2) the total load divided by the confined 21
concrete area delineated by the centerline of the outer tie. The actual response of the confined 22
Page 11
11
concrete, which is represented by the bold curve, is expected to be a combination of the two 1
calculated curves. 2
The response of the confined concrete coincides with the ascending part of the lower curve (total 3
concrete area) up to point A, which corresponds to the sudden spalling of the concrete cover. 4
When the concrete cover no longer contributes to the axial strength, the response of the confined 5
concrete coincides with the part of the higher curve (confined concrete area) that follows point B, 6
when the concrete core begins to gain strength due to confinement by the transverse 7
reinforcement. The transition between points A and B of the response of the confined concrete is 8
estimated based on the stress-strain response of un-reinforced cylinder. 9
Point C corresponds to the ultimate strength of the tested columns. At this stress level the failure 10
occurs suddenly for low confined concrete core as for specimen C-G-1-120 in which the concrete 11
crushed and the longitudinal bars buckled simultaneously as shown in Fig. 9a. For the well-12
confined concrete core specimens the ties delayed the crack propagation which allowed the 13
column to fail in a consecutive behavior as a certain number of the longitudinal bars have 14
ruptured and as a final stage the concrete crushed as for specimen C-G-3-80 shown in Fig. 9b. 15
For each tested specimen, Table 4 presents a comparison of the first and second peaks reached 16
by the concrete stress, σc1 and σc2, respectively, to the cylinder concrete compressive strength, fc’. 17
The ratio, σc1/fc’, of the tested specimens has an average value of 0.98. This low value is due to 18
the early separation of the concrete cover from the concrete core at high axial loads, preventing 19
the specimens from reaching its expected maximum load. This an indication that the 20
reinforcement cage creates longitudinal weakness planes between the concrete core and the 21
concrete cover. However, for the ratio, σc2/fc’, the value reaches up to 1.68 for well-confined 22
specimen. This clearly indicates that when the concrete cover has completely spalled off, the 23
Page 12
12
maximum axial strength of the confined section can be significantly improved by lateral 1
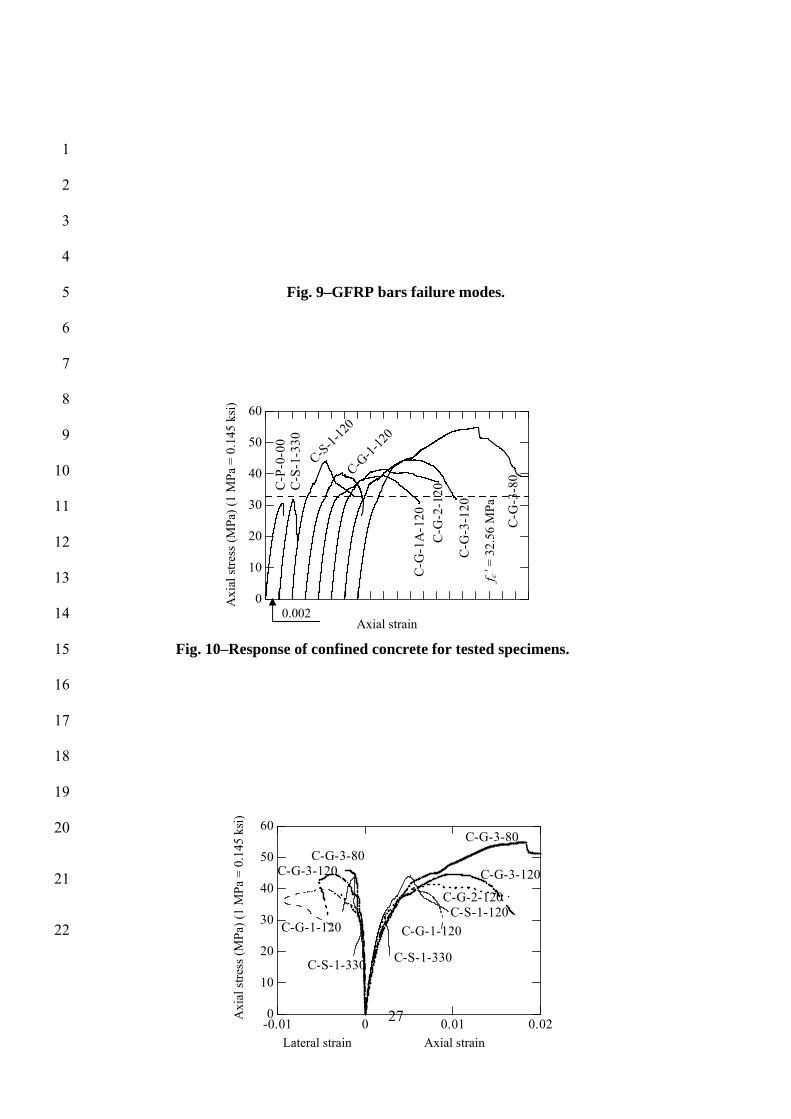
confinement. Fig. 10 shows the axial stress versus the axial strain response for the response 2
curves of the confined concrete of the tested specimens. 3
Effect of tie configuration 4
The tie configuration determines the effectively confined concrete area, which increases with a 5
better distribution of longitudinal bars around the column core concrete. The larger the 6
effectively confined concrete area, the higher would be the confinement efficiency. Fig. 10 7
compares four specimens (C-G-1-120, C-G-1A-120, C-G-2-120 and C-G-3-120) which have 8
identical tie spacing 120 mm (4.72 in) with four different configurations. The test results indicate 9
that tie configuration 3 is the most effective configuration for enhancing the strength and 10
toughness of confined concrete. 11
Effect of tie spacing 12
Comparison of the two specimens C-G-3-120 and C-G-3-80, having 120 mm (4.72 in) and 80 13
mm (3.15 in) tie spacing with identical configuration, respectively, shown in Fig. 10. It indicates 14
that smaller tie spacing increases the confinement efficiency. In addition, the tie spacing controls 15
the buckling of the longitudinal bars. The reduction of tie spacing from 120 mm to 80 mm results 16
in increases of strength gain by more than 20%. 17
Axial stress-axial and lateral strain response 18
Axial stress-axial and lateral strain response for the tested specimens is shown in Fig. 11. The 19
curves to the right represent the plots of axial stresses versus axial strains, whereas the curves to 20
the left show the plots of axial stresses versus lateral strains. It clearly shows that using GFRP 21
ties can significantly enhance the concrete performance, i.e., both strength and ductility. 22
Confinement effectiveness for strength varies between 20% to 70% depending on tie 23
Page 13
13
configuration and spacing. Confinement effectiveness is defined as the ratio of peak strength of 1
confined concrete to that of unconfined concrete (C-P-0-00). Enhancement in ductility is more 2
pronounced, as the ultimate strain of confined concrete is 4 to 8 times greater than that of 3
unconfined concrete. 4
Volumetric strain 5
The true behavior of confined concrete can be captured by examining its volumetric response. In 6
a triaxial state of stress, volumetric strain εv is defined as the volume change per unit volume as 7
follows: 8
εv = εa + 2 εl (1) 9
where, εa = axial strain and εl = lateral strain. It is assumed that a positive volumetric strain 10
indicates volume reduction, whereas a negative value indicates expansion. 11
In Fig. 12, the initial slope of all curves is close to 1 – 2 ν (where ν is the Poisson’s ratio of the 12
concrete assumed equal to 0.20), which corresponds to the perfectly elastic condition. 13
In the case of smaller tie spacing, the larger development of the post-peak branch clearly shows 14
that crack progression is more stable. The small spacing of the ties provides a lateral constraint 15
of the cracked concrete core and delays unstable crack propagation. 16
Ultimate capacity and code provision 17
The plain concrete strength of full-scale columns tested under concentric compression loading is 18
generally lower than the concrete compressive strength measured on standard 150 x 300 mm (6 x 19
12 in) cylinder test. The 0.85 reduction factor suggested by ACI Building Code (ACI 318-08) is 20
mainly attributed to the differences in size and shape of the reinforced concrete columns and the 21
concrete cylinder. 22
Page 14
14
The nominal capacity of an axially loaded RC column, Pn, was defined as the sum of the forces 1
carried by the concrete and the steel as given by the following equation: 2
sysgcn AfAAfP '85.0 (2) 3
where, Ag = the total cross section area of column, As = cross section area of longitudinal 4
reinforcement, fc’ = concrete compressive strength and fy = yielding strength of steel 5
reinforcement. 6
CSA S806-02 permits the use of FRP bars as longitudinal reinforcement in columns subjected to 7
axial load only without taking the FRP bars contribution into account for calculating the ultimate 8
capacity of the columns as shown in Eq. 3 9
sgcn AAfP '85.0 (3) 10
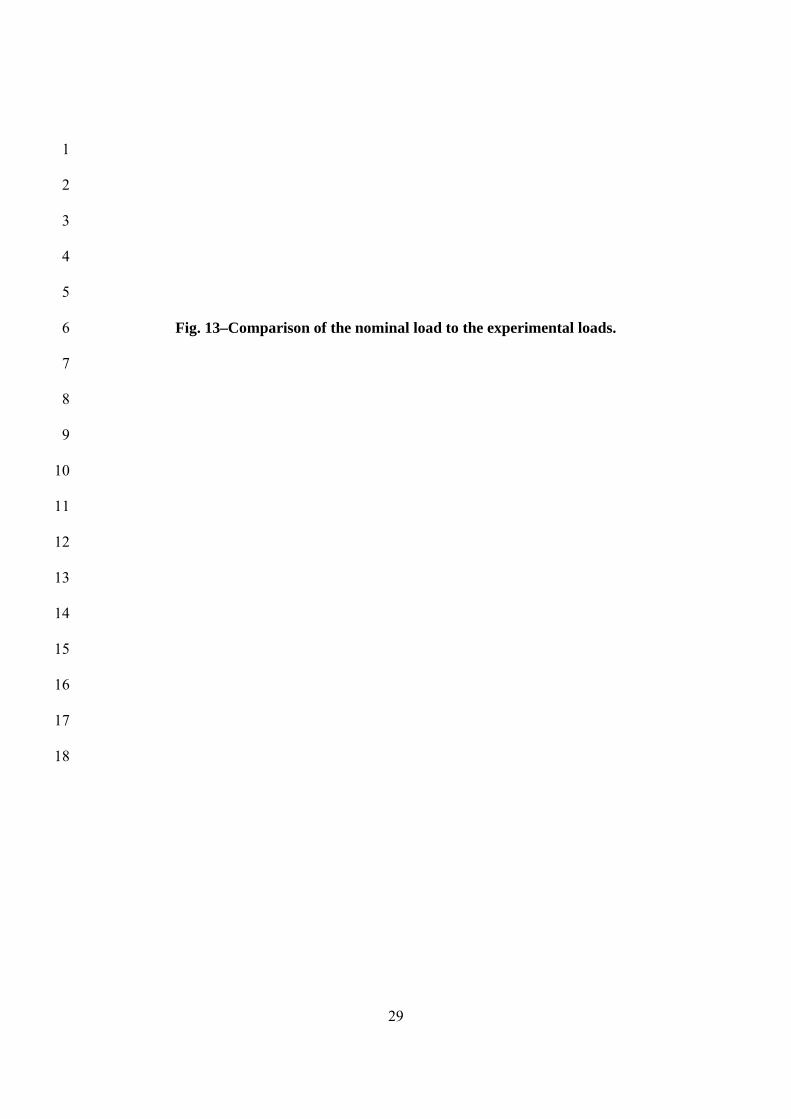
In Fig. 13, the maximum axial load, Pexp, applied on each specimen during testing are compared 11
with their corresponding axial strength computed according to the ACI Building Code (Eq. 2) 12
setting fy equal to the ultimate tensile strength of GFRP bars for comparison purpose. Moreover, 13
it is compared to the calculated Pn based on neglecting the contribution of FRP as recommended 14
by CSA S806-02 (Eq. 3). In addition to that, a comparison is made with the calculated Pn 15
considering the contribution of GFRP bars in compression equal to 35% of tensile strength of 16
GFRP (as suggested by Kobayashi and Fujisaki (1995), Mallick (1998) and Wu (1990)) (Eq. 4). 17
sysgcn AfAAfP 35.085.0 ' (4) 18
It is clearly that Eq. 2 over-estimates the columns maximum capacity by 25%. Conversely, 19
ignoring the contribution of FRP longitudinal bars would under-estimate the maximum capacity. 20
However, by setting the GFRP compressive strength equal to 35% of its tensile strength, the 21
maximum axial load could be predicted accurately as shown in Fig. 13. 22
23
Page 15
15
CONCLUSIONS 1
The experimental results concerning the behavior of concrete columns reinforced longitudinally 2
and transversely with GFRP bars are presented and discussed. The main variables were the 3
configuration and the spacing of the transverse reinforcement. The experimental results were 4
compared considering the axial compression design provisions provided by ACI Building Code 5
and CSA S806-02. The main findings of the experimental investigation can be concluded as 6
follows: 7
1. The early spalling of the concrete cover results in a loss of axial capacity before any 8
lateral confinement comes into effect. After the concrete cover has completely spalled 9
off, important gains in strength, ductility, and toughness have been recorded for the 10
concrete core of well-confined specimens. This finding suggests that only the area of the 11
concrete core could be considered in calculating the axial compressive strength of 12
columns, unless special care is taken to restrict the separation of the concrete cover. 13
2. The study of tie configuration and spacing clarified the effectiveness of GFRP as 14
transverse reinforcement is increasing the strength, toughness and ductility of the 15
confined concrete core. Further research is needed to study the limitation for the tie 16
spacing. 17
3. The strength reduction factor equal to 0.85, which is for steel case, can be adopted for the 18
case of GFRP reinforced columns. 19
4. Setting the FRP compressive strength equal to 35% of its maximum tensile strength 20
would give reasonable ultimate capacity comparing to the experimental results. However, 21
more experimental evidence is needed to well define the FRP compressive strength. 22
Page 16
16
5. The used GFRP bars contributed as 10% of the capacity of the columns which is close 1
enough to the steel contribution (12%), which proves the applicability of using GFRP 2
bars in compression member, but with well confinement to eliminate the buckling of the 3
bars. 4
ACKNOWLEDGMENTS 5
The authors would like to express their special thanks and gratitude to the Natural Science and 6
Engineering Research Council of Canada (NSERC), the Fonds quebecois de la recherche sur la 7
nature et les technologies (FQRNT), the Canadian Foundation for Innovation (FCI), Pultrall Inc. 8
(Thetford Mines, Québec), and the technical staff of the structural lab in the Department of Civil 9
Engineering at the University of Sherbrooke. 10
11
REFERENCES 12
ACI Committee 318, 2008, “Building Code Requirements for Structural Concrete (ACI 318-13
08) and Commentary,” American Concrete Institute, Farmington Hills, MI, 473 pp. 14
ACI Committee 440, 2007, “Report on Fiber-Reinforced Polymer (FRP) Reinforcement 15
Concrete Structures (ACI 440R-07),” American Concrete Institute, Farmington Hills, MI, 100 16
pp. 17
ACI Committee 440, 2004, “Guide Test Methods for Fiber-Reinforced Polymers (FRPs) for 18
Reinforcing or Strengthening Concrete Structures (ACI 440.3R-04),” American Concrete 19
Institute, Farmington Hills, MI, 40 pp. 20
ACI Committee 440, 2006, “Guide for the Design and Construction of Structural Concrete 21
Reinforced with FRP Bars (ACI 440.1R-06),” American Concrete Institute, Farmington Hills, 22
MI, 44 pp. 23
Page 17
17
Alsayed, S. H.; Al-Salloum, Y. A.; Almusallam, T. H.; and Amjad, M. A., 1999, “Concrete 1
Columns Reinforced by GFRP Rods,” Fourth International Symposium on Fiber-Reinforced 2
Polymer Reinforcement for Reinforced Concrete Structures, SP-188, C. W. Dolan, S. H. 3
Rizkalla, and A. Nanni, eds., American Concrete Institute, Farmington Hills, Mich., pp. 103-112. 4
Bedard, C., 1992, “Composite Reinforcing Bars: Assessing their Use in Construction,” ACI 5
Concrete International, January, pp. 55-59. 6
CAN/CSA S806-02, 2002, “Design and Construction of Building Components with Fiber-7
Reinforced Polymers,” Canadian Standards Association, Mississauga, Ontario, Canada, 177 pp. 8
Chaallal, O. and Benmokrane, B., 1993, “Physical and Mechanical Performance of an 9
Innovative Glass-Fibre-Reinforced Plastic Rod,” Canadian Journal of Civil Engineering, V.20, 10
No.2, pp. 254-268. 11
De Luca, A.; Matta, F.; and Nanni, A., 2010,” Behavior of Full-Scale Glass Fiber-Reinforced 12
Polymer Reinforced Concrete Columns under Axial Load,” ACI Structural Journal, V. 107, No. 13
5, Sept.-Oct. 2010, pp. 589-596. 14
Deitz, D. H.; Harik, I. E.; and Gesund, H., 2003, “Physical Properties of Glass Fiber 15
Reinforced Polymer Rebars in Compression,” Journal of Composites in Construction, ASCE, V. 16
7, No. 4, Nov., pp. 363-366. 17
Fukuyama, H.; Masuda, Y.; Sonobe, Y.; and Tanigaki, M., 1995, “Structural Performances of 18
Concrete Frames Reinforced with FRP Reinforcement,” Proceedings of the 2nd International 19
RILEM Symposium on Non- Metallic (FRP) Reinforcement for Concrete Structures, Ghent, 20
Belgium, pp. 275-286. 21
Kawaguchi, N., 1993, “Ultimate Strength and Deformation Characteristics of Concrete 22
Members Reinforced with AFRP Rods under Combined Axial Tension or Compression and 23
Page 18
18
Bending,” Fiber-Reinforced-Plastic Reinforcement for Concrete Structures, SP-138, A. Nanni 1
and C. W. Dolan, eds., American Concrete Institute, Farmington Hills, Mich., pp. 671-685. 2
Kobayashi, K., and Fujisaki, T., 1995, “Compressive Behavior of FRP Reinforcement in Non-3
Prestressed Concrete Members,” Proceedings of the 2nd International RILEM Symposium on 4
Non-Metallic (FRP) Reinforcement for Concrete Structures, Ghent, Belgium, pp. 267-274. 5
Mallick, P. K., 1988, Fiber Reinforced Composites, Materials, Manufacturing, and Design, 6
Marcell Dekker, Inc., New York, 469 pp. 7
Paramanantham, N. S., 1993, “Investigation of the Behavior of Concrete Columns Reinforced 8
with Fiber-Reinforced Plastic Re-bars,” MS thesis, Lamar University, Beaumont, Texas, 265 pp. 9
Pultrall Inc., 2009, V-ROD Composite Reinforcing Rods Technical Data Sheet, Thetford 10
Mines, Canada, www.pultrall.com. 11
Wu, W. P., 1990, “Thermomechanical Properties of Fiber Reinforced Plastic (FRP) Bars,” 12
PhD dissertation, West Virginia University, Morgantown, WV, 292 pp. 13
14
15
16
17
18
19
20
21
22
Page 19
19
1
2
3
TABLES AND FIGURES 4
List of Tables: 5
Table 1 – Test Matrix 6
Table 2 – GFRP and steel longitudinal reinforcement tensile properties 7
Table 2 – Bend GFRP No.13 tensile properties 8
Table 3 – Peak stresses 9
10
List of Figures: 11
Fig. 1 – Details of the test specimens. 12
Fig. 2 – GFRP reinforcement layout for columns. 13
Fig. 3 – Loading machine and instrumentation. 14
Fig. 4 – Cracking appearance of test specimens at different loading stages. 15
Fig. 5 – Cracking appearance of test specimens after failure. 16
Fig. 6 – Axial stress-axial strain curves for tested specimens. 17
Fig. 7 – Strain of transverse reinforcement. 18
Fig. 8 – Response of the confined concrete. 19
Fig. 9 – GFRP bars failure modes. 20
Page 20
20
Fig. 10 – Response of confined concrete for all tested specimens. 1
Fig. 11 – Stress-strain response. 2
Fig. 12 – Volumetric strain response. 3
Fig. 13 – Comparison of the nominal load to the experimental loads. 4
5
6
7
8
Table 1–Test matrix 9
Specimen Bar type Longitudinal
reinforcement
Transverse
reinforcement
Tie spacing
mm (in)
C-P-0-00 --- --- --- ---
C-S-1-330 Steel 8 M15 M10 ties 330 (13.0)
C-S-1-120 Steel 8 M15 M10 ties 120 (4.72)
C-G-1-120 GFRP 8 No.19 No.13 ties 120 (4.72)
C-G-1A-120 GFRP 8 No.19 No.13 ties 120 (4.72)
C-G-2-120 GFRP 8 No.19 No.13 ties 120 (4.72)
C-G-3-120 GFRP 12 No.16 No.13 ties 120 (4.72)
C-G-3-80 GFRP 12 No.16 No.13 ties 80 (3.15)
C = column, P = Plain concrete, S = Steel, G = GFRP, (1, 1A, 2, 3) = configuration type, (330, 10 120, 80) = tie spacing in mm. 11
12
Page 21
21
1
2
Table 2–GFRP and steel longitudinal reinforcement mechanical properties 3
Bar type db
mm (in) Af
mm² (in2) Ef
GPa (ksi) ffu
MPa (ksi) εf
(%) No.16 GFRP 15.9 (0.625) 199 (0.31) 48.2 (6989) 751 (109) 1.56 No.19 GFRP 19.1 (0.750) 284 (0.44) 47.6 (6902) 728 (106) 1.53 Steel M10 11.3 (0.375) 100 (0.16) 200 (29000) fy = 460 εy = 0.2 Steel M15 16.0 (0.63) 200 (0.31) 200 (29000) fy = 460 εy = 0.2
db = bar diameter, Af = cross section area of bar, Ef = modulus of elasticity of bar, ffu = ultimate 4 tensile strength of bar and εf = ultimate strain of bar 5
6
7
8
9
10
11
12
Table 3– Bend GFRP No.13 tensile properties 13
Bent bar portions Ef
GPa (ksi) ffu
MPa (ksi) εf
(%) Straight portion 44 (6380) 640 (93) 1.45 Bend portion --- 400 (58) ---
Ef = modulus of elasticity of bar, ffu = ultimate tensile strength of bar and εf = ultimate strain of 14 bar 15
16
17
18
Table 4–Peak stresses 19
Page 22
22
Specimen σc1 MPa (ksi) σc2 MPa (ksi) σc1/fc’ σc2/fc’
C-P-0-00 30.56 (4.43) 30.56 (4.43) 0.94 0.94
C-S-1-330 31.99 (4.64) 31.99 (4.64) 0.98 0.98
C-S-1-120 34.21 (4.96) 44.16 (6.40) 1.05 1.35
C-G-1-120 32.07 (4.65) 40.30 (5.84) 0.98 1.23
C-G-1A-120 32.58 (4.72) 39.39 (5.71) 1.00 1.21
C-G-2-120 32.70 (4.74) 41.47 (6.01) 1.00 1.27
C-G-3-120 32.15 (4.66) 44.51 (6.45) 0.98 1.36
C-G-3-80 33.20 (4.81) 54.88 (7.96) 1.02 1.68
1
2
3
4
5
6
7
8
9
10
11
12
13
14
Configuration 1 Configuration 1A
Configuration 2 Configuration 3
255
(10)
25
5 (1
0)
1400
(55
.1)
350 (13.78) Units: mm (in)
Tie
s M
10 f
or s
teel
or
No.
13 f
or G
FR
P
M15
for
ste
el
or N
o.16
or
No.
19 f
or G
FR
P
Bolted box
Page 23
23
1
2
Fig. 1–Details of the test specimens. 3
4
5
6
7
8
9
10
11
12
13
14
15
16
Fig. 2–GFRP reinforcement layout for columns 17
18
19
20
21
22
23
a
LVDTs
b
Bolted box
Page 24
24
1
2
3
4
5
Fig. 3–Loading machine and instrumentation. 6
7
8
9
10
11
12
13
14
15
16
Fig. 4–Cracking appearance of test specimens at different loading stages. 17
18
19
20
21
22
23
a b c
Page 25
25
1
Fig. 5–Cracking appearance of test specimens after failure. 2
3
4
5
6
7
8
9
10
11
12
Fig. 6–Axial stress-axial strain curves for tested specimens. 13
14
15
16
17
18
19
20
21
22
23
0 0.01 0.02 0.030
0.002
0.004
0.006
0.008
0.01
C-G-1-120
C-G-3-80
C-G-3-120
Axial strain
Str
ain
of tr
ansv
erse
rei
nfor
cem
ent
Strain correspond to stress σc1
Strain correspond to stress σc2
0
10
20
30
40
50
60
C-P
-0-0
0
C-G
-1-1
20C
-G-1
A-1
20C
-G-2
-120
C-G
-3-1
20
C-S
-1-1
20C
-S-1
-330
C-G
-3-8
0
Axial strain
fc’ = 32.56 MPa
0.002
Axi
al s
tres
s (M
Pa)
(1
MP
a =
0.1
45 k
si)
First peak Second peak
Page 26
26
1
2
3
Fig. 7–Strain of transverse reinforcement. 4
5
6
7
8
9
10
11
12
13
14
Fig. 8–Effect of concrete cover. 15
16
17
18
19
20
21
22
23
0 0.01 0.02 0.03 0.04 0.050
10
20
30
40
50
60confinedconcretearea
total concrete area
A
B
C
A: Oneset of spalling of coverB: After spalling of coverC: Crushing of core
B'
C'
Axi
al s
tres
s (M
Pa)
(1
MP
a =
0.1
45 k
si)
Axial strain
a buckled bar
b
ruptured bar
Page 27
27
1
2
3
4
Fig. 9–GFRP bars failure modes. 5
6
7
8
9
10
11
12
13
14
Fig. 10–Response of confined concrete for tested specimens. 15
16
17
18
19
20
21
22
0
10
20
30
40
50
60
C-P
-0-0
0
C-G-1
-120
C-G
-1A
-120
C-G
-2-1
20
C-G
-3-1
20C-S
-1-1
20
C-S
-1-3
30
C-G
-3-8
0
Axi
al s
tres
s (M
Pa)
(1
MP
a =
0.1
45 k
si)
Axial strain 0.002
f c’
= 3
2.56
MP
a
-0.01 0 0.01 0.020
10
20
30
40
50
60
C-G-1-120
C-G-3-80
C-G-2-120
C-G-3-120
C-S-1-120C-G-1-120
C-S-1-330
C-G-3-80C-G-3-120
C-S-1-330
Axial strain
Axi
al s
tres
s (M
Pa)
(1
MP
a =
0.1
45 k
si)
Lateral strain
Page 28
28
1
2
3
4
Fig. 11–Stress-strain response. 5
6
7
8
9
10
11
12
13
14
Fig. 12–Volumetric strain response. 15
16
17
18
19
20
21
22
0 0.01 0.02-0.01
-0.005
0
0.005
0.01
0.015
0.02
C-G-1-120
C-G-3-80
C-G-2-120
C-G-3-120C-S-1-120C-S-1-330
Axial strain
Vol
umet
ric
stra
in
1 – 2 ν
Pn
/ P ex
p
0.85
0
0.5
1
1.5
C-G
-1-1
20
C-G
-1A
-120
C-G
-2-1
20
C-G
-3-1
20
C-G
-3-8
0
Eq.2 Eq.3 Eq.4
Page 29
29
1
2
3
4
5
Fig. 13–Comparison of the nominal load to the experimental loads. 6
7
8
9
10
11
12
13
14
15
16
17
18


![GFRP [Resin Infusion]](https://static.documents.pub/doc/80x56/546e67d4af795971298b5642/gfrp-resin-infusion.jpg)
