Concurrent Modeling of Hydrodynamics and Interaction ForcesImproves Particle Deposition PredictionsChao Jin,† Carolyn L. Ren,‡ and Monica B. Emelko*,†
†Department of Civil and Environmental Engineering, University of Waterloo, 200 University Ave W., Waterloo, Ontario N2L 3G1,Canada‡Department of Mechanical and Mechatronics Engineering, University of Waterloo, 200 University Ave W., Waterloo, Ontario N2L3G1, Canada
*S Supporting Information
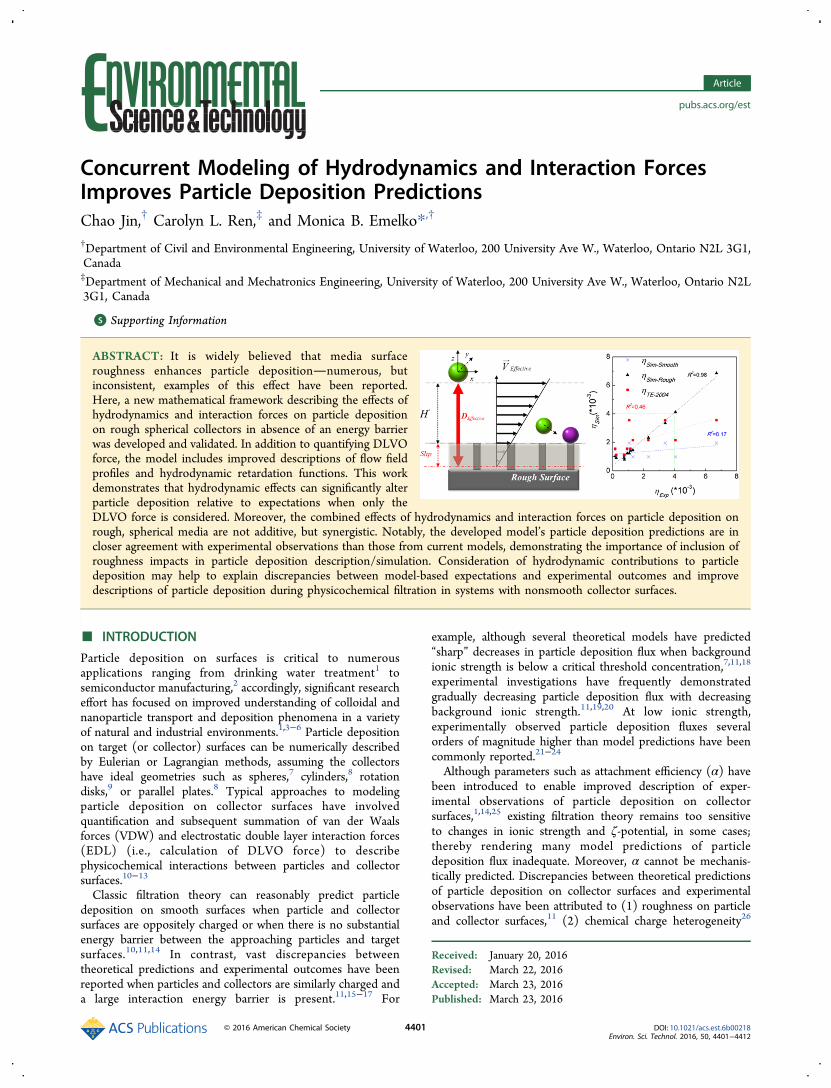
ABSTRACT: It is widely believed that media surfaceroughness enhances particle depositionnumerous, butinconsistent, examples of this effect have been reported.Here, a new mathematical framework describing the effects ofhydrodynamics and interaction forces on particle depositionon rough spherical collectors in absence of an energy barrierwas developed and validated. In addition to quantifying DLVOforce, the model includes improved descriptions of flow fieldprofiles and hydrodynamic retardation functions. This workdemonstrates that hydrodynamic effects can significantly alterparticle deposition relative to expectations when only theDLVO force is considered. Moreover, the combined effects of hydrodynamics and interaction forces on particle deposition onrough, spherical media are not additive, but synergistic. Notably, the developed model’s particle deposition predictions are incloser agreement with experimental observations than those from current models, demonstrating the importance of inclusion ofroughness impacts in particle deposition description/simulation. Consideration of hydrodynamic contributions to particledeposition may help to explain discrepancies between model-based expectations and experimental outcomes and improvedescriptions of particle deposition during physicochemical filtration in systems with nonsmooth collector surfaces.
■ INTRODUCTION
Particle deposition on surfaces is critical to numerousapplications ranging from drinking water treatment1 tosemiconductor manufacturing,2 accordingly, significant researcheffort has focused on improved understanding of colloidal andnanoparticle transport and deposition phenomena in a varietyof natural and industrial environments.1,3−6 Particle depositionon target (or collector) surfaces can be numerically describedby Eulerian or Lagrangian methods, assuming the collectorshave ideal geometries such as spheres,7 cylinders,8 rotationdisks,9 or parallel plates.8 Typical approaches to modelingparticle deposition on collector surfaces have involvedquantification and subsequent summation of van der Waalsforces (VDW) and electrostatic double layer interaction forces(EDL) (i.e., calculation of DLVO force) to describephysicochemical interactions between particles and collectorsurfaces.10−13
Classic filtration theory can reasonably predict particledeposition on smooth surfaces when particle and collectorsurfaces are oppositely charged or when there is no substantialenergy barrier between the approaching particles and targetsurfaces.10,11,14 In contrast, vast discrepancies betweentheoretical predictions and experimental outcomes have beenreported when particles and collectors are similarly charged anda large interaction energy barrier is present.11,15−17 For
example, although several theoretical models have predicted“sharp” decreases in particle deposition flux when backgroundionic strength is below a critical threshold concentration,7,11,18
experimental investigations have frequently demonstratedgradually decreasing particle deposition flux with decreasingbackground ionic strength.11,19,20 At low ionic strength,experimentally observed particle deposition fluxes severalorders of magnitude higher than model predictions have beencommonly reported.21−24
Although parameters such as attachment efficiency (α) havebeen introduced to enable improved description of exper-imental observations of particle deposition on collectorsurfaces,1,14,25 existing filtration theory remains too sensitiveto changes in ionic strength and ζ-potential, in some cases;thereby rendering many model predictions of particledeposition flux inadequate. Moreover, α cannot be mechanis-tically predicted. Discrepancies between theoretical predictionsof particle deposition on collector surfaces and experimentalobservations have been attributed to (1) roughness on particleand collector surfaces,11 (2) chemical charge heterogeneity26
Received: January 20, 2016Revised: March 22, 2016Accepted: March 23, 2016Published: March 23, 2016
and deposition due to the secondary energy minima,27 (3)hydrophobicity,25 and short-range forces,28 and (4) physicalmechanisms, such as straining,29 wedging,17 and blocking.24
Regardless of the exact factors that contribute to thesediscrepancies, it is critical to recognize that some of theoriginal assumptions on which many traditional and currentmodels of particle deposition are based (e.g., smooth collectorsurfaces) may not be reasonable for many natural andengineered particle deposition scenarios.Although enhanced particle deposition due to collector
surface roughness has been frequently reported,30−33 decreasedparticle deposition also has been reported.34,35 Recentinvestigations have suggested that collector surface roughnessaffects particle deposition in a nonlinear, nonmonotonicmanner that depends on the relative relationship betweensurface roughness, and particle and collector sizes.36 Althoughseveral studies have recently reported that collector surfaceroughness can significantly alter the shape and magnitude ofparticle-surface interaction energy profiles,28,37,38 it also affectshydrodynamic factors such as flow field and retardation, whichalso contribute to particle deposition. Despite extensiveempirical evidence of collector surface roughness impacts onparticle deposition, a mathematical framework for describingparticle deposition on rough collector surfaces in packed beds iscurrently lacking, thereby precluding reasonable application ofparticle deposition models to many natural and engineeredsystems.Here, an Eulerian approach was used to develop a new
mathematical model for describing particle deposition onspherical collectors with nanoscale surface roughness in absenceof an energy barrier. Clean bed filtration conditions wereassumed and the classic Happel sphere-in-cell model was usedto describe the flow field profile around the collector.7 Inaddition to quantification of DLVO force in the presence ofnanoscale surface roughness (i.e., without assumption ofsmooth surfaces), the model incorporates recently developednumerical approaches that provide improved description of theflow field profiles and hydrodynamic retardation.36,39−41 Thismodel was used to quantitatively evaluate each of the individualimpacts of these factors on particle deposition on sphericalcollectors with several sizes (i.e., heights) of surface roughness.To validate the developed model and underscore theimportance of inclusion of roughness impacts on particledeposition in describing and simulating these phenomena, thetheoretical solution of single collector efficiency (η) using thedeveloped model was compared to experimental and theoreticaloutcomes published by our team36,42 and others.14,43
■ MODEL DEVELOPMENTRepresentation of a Particle Approaching a Rough
Surface. Modeling particle deposition flux on sphericalcollectors with surface roughness requires description of notonly roughness size, but also its coverage (or distribution) oncollector surfaces. Detailed representation of surface roughnesstopography can be achieved with Fourier transform44 or fractalanalysis approaches;45 however, integration of these approacheswith Convective-Diffusion models becomes exceedinglycomputationally intensive. Here, a previously described,32,42
simplified geometric representation of rough surfaces that wasdeveloped and validated within a parallel plate system was used.The rough collector surface was represented as a smooth
bottom surface with protruding planar roughness asperities thatare vertically distributed as elongated filaments separated by a
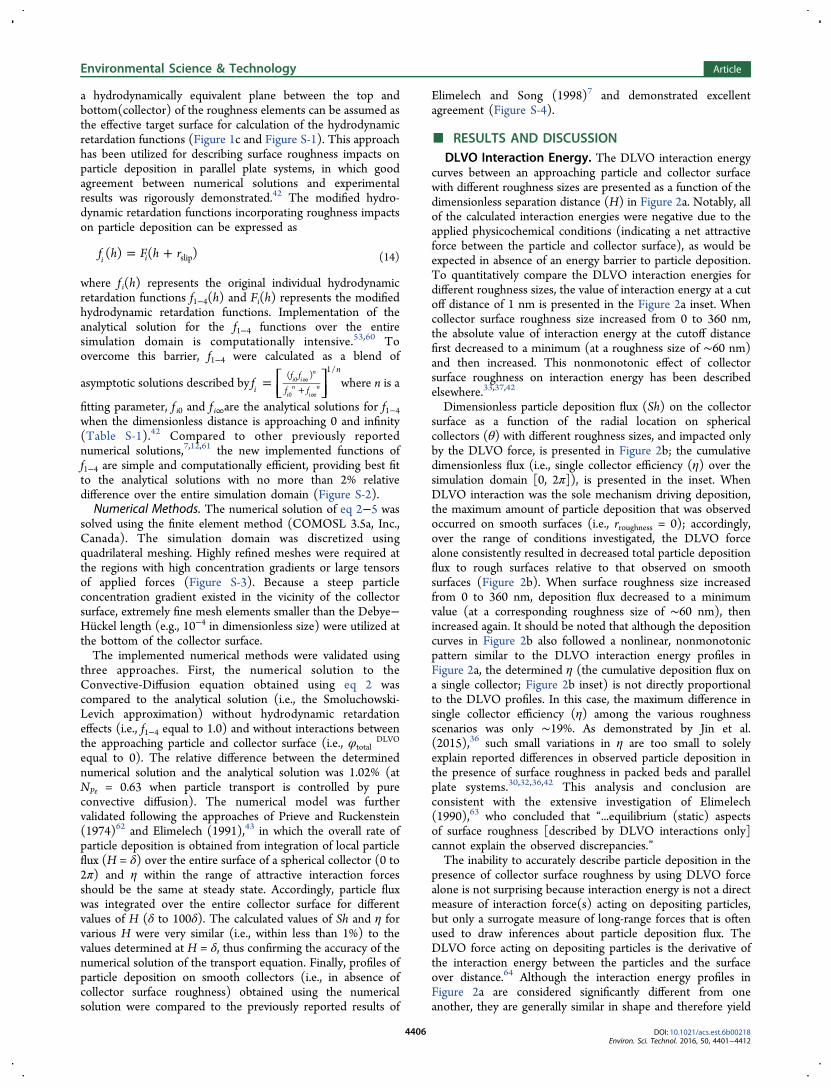
surface-to-surface distance of Si (Figure 1).32,42 Following theapproach of Kemps and Bhattacharjee(2005),46 the roughnessasperities were described by stacked spheres with radius of ar;thus, the height of the roughness asperities was equal to 2nsarwhere ns represents the number of stacked spheres. The
Figure 1. Schematic of (a) flow around a spherical collector withrough (left hemisphere) and smooth (right hemisphere) surfaces; theflow fields and diffusion coefficients for (b) smooth and (c) roughcollector surfaces.
composition of the roughness asperities was essentially identicalto that of the smooth bottom surface; therefore, the collectorsurface and roughness asperities had the same ζ-potential,Hamaker constant, and hydrophilic/hydrophobic character-istics. Given the aquatic conditions implemented herein(favorable conditions for particle deposition), the pairwisesummation method was used to evaluated the degree of DLVOinteraction energy.46,47 Other more accurate approaches such asgrid-surface integration48 and surface element integration49 fordescribing DLVO interactions are available; however, the use ofthese approaches was too computationally intensive whenincorporated into the present modeling framework for particledeposition using the finite element method. It should be notedthat this study is limited to the case that (a) the approachingparticle can only contact and attach on the tops of roughnessasperities, (b) the roughness asperities are adequately close toone another such that particle deposition on the bottomsmooth surface between them is precluded, and (c) the
roughness asperities are relatively small as compared to thebottom surface, which can be assumed as an infinite plate forDerjaguin approximation.
Mass Transfer in Spherical Geometry. At steady state and inabsence of chemical reactions, the general Convection-Diffusion equation for particle mass transfer due to diffusion,convection, and external forces can be expressed as
∇· = ∇· ·∇ − ∇· ·⎛⎝⎜
⎞⎠⎟C C
Dk T
Cu DF
( ) ( )b (1)
where u is the fluid velocity, T is the absolute temperature, kb isBoltzmann’s constant, C is the particle concentration, D is thediffusion tensor, and F represents external forces that can act assources or sinks of momentum. eq 1 can be solved numericallywhen the flow velocity field, D, and F are known. In sphericalgeometry, the full, dimensionless expression of the Convective-Diffusion equation is described as
θ θθ θ
φ θ
φ θ φ θθ
θ
∂∂
∂∂
+ − * −
+ ∂∂
∂∂
+ +∂
∂+ ∂
∂+ * −
=
+∂
∂∂∂
+ * + ∂∂
+∂ *
∂− *
− +∂
∂+
∂∂
+∂∂
+
θ
θ
⎜ ⎟
⎜ ⎟
⎪ ⎪
⎪ ⎪⎧⎨⎩
⎡⎣⎢
⎛⎝
⎞⎠
⎤⎦⎥⎫⎬⎭
⎧
⎨
⎪⎪⎪⎪
⎩
⎪⎪⎪⎪
⎡⎣⎢⎢⎛⎝⎜
⎞⎠⎟⎛⎝
⎞⎠
⎤⎦⎥⎥
⎡⎣⎢
⎤⎦⎥
⎫
⎬
⎪⎪⎪⎪
⎭
⎪⎪⎪⎪
{ }cN f H
cN f H f H F N
Nf H V N
cH
f Hc
HN f H
f H
Hf H
HF f H f H V
N
N f Hf H
H HF f H
H
f H F
Hf H N F
NN f H f H V
f H
Hf H V
f H
Hf H V f H f H
VH
N f H V
c
( ) ( )cot ( ) sin2
( )
( ) 2 ( )( )
( ) cos ( ) ( )2
2 ( )( )
cos ( )( ) cos
2 ( ) cos
22 ( ) ( )
( )( )
( )( ) ( ) ( )
2 ( )cot
R R G RPe
R
R G rPe
R GG
R G
PeR r r r
r
R
24
24 4 3
1 11
1 1 2
11
1
2
21
4
1 21
22
1 1 2
3(2)
The list of dimensionless parameters used in eq 2 is providedin Table 1. To solve eq 2 numerically, the implementedboundary conditions were
θ= =C H( 0, ) 0 (3)
θ θ π− ∂∂
= − = ≤ ≤v C DCr
UC r bcos at , 0 0.5r r 0
(4a)
π θ π∂∂
= = ≤ ≤Cr
r b0 at , 0.5(4b)
θ∂∂
=θ=
⎜ ⎟⎛⎝
⎞⎠
c0
0 (5)
Equation 3 describes the perfect sink boundary condition atthe collector surface. This applies to the clean bed period offiltration and does not account for particle to particleinteractions, rolling, shear lift, drag, and other factors thatmay be significant to particle detachment.1,7,14 To avoidoverestimated deposition at low Peclet numbers, modifiedboundary conditions at the outer shell of Happel’s sphere at r =b (eqs 4a and 4b) were implemented to describe thecontinuous net radial flux (without singularity for simulation)toward the collector surface at the outer boundary of the upperand lower half shells of the unit Happel’s sphere, respectively.
The term − UC0cos θ refers to the flux into Happel’s sphere
where the − ∂∂v C Dr rCrrefers to the particle flux within the cell
due to convection and diffusion. eq 5 arises from the symmetryaround the forward stagnation path within the Happel sphere.50
The complete form of the Convective-Diffusion equationderived from first-principles was utilized to describe particledeposition. In contrast to other versions of the equation7 thathave been commonly utilized as a foundation for modelingparticle deposition on porous media,14,51,52 eq 2 includes threeadditional terms that were previously assumed negligible:7
θ∂∂
N f H( )Rc2
4
2
2 , θθ
∂∂N f H( )cotR
c24 , and
θ∂ *
∂f H F
H
( ) cosG1 . In the present
work, these three terms were included in the simulation forcompleteness. When dimensionless particle concentration isdetermined using eqs 2−5, particle flux perpendicular tocollector surfaces J(Hδ,θ), cumulative colloid deposition flux I,local dimensionless deposition rate Sh, and single collectorefficiency η can be calculated at a cut off distance δ byimplementing the perfect sink boundary condition that hasbeen applied in classic, previously reported works focused ondescribing particle deposition in porous media at favorableconditions7(Supporting Information).
DLVO Force Modifications for Approaching Particles. Incontrast to typical approaches that assume smooth collectorsurfaces when quantifying DLVO force between approachingparticles and spherical collectors,10,14,53 in the present study,
particle-collector DLVO interaction energies in the presence ofsurface roughness were approximated by the pairwisesummation method37,54 under the assumption of constant ζ-potential. Here, the total interaction energy arising for roughsurfaces from VDW and EDL forces (φtotal
DLVO) was describedas
∑
∑
φ φ φ
φ φ φ
φ
= +
= + +
+
=
=
i
n
i
n
totalDLVO
totalVDW
totalEDL
PSVDW
1PR
VDWPS
EDL
1PR
EDL
(6)
where φPSVDW and φPS
EDL represent the VDW and EDL interactionenergies between the approaching particle and smooth surfaceof the collector. The VDW and EDL interaction energiesbetween the particle and the roughness elements on thecollector surface were described by φPR
VDW and φPRVDW,
respectively.37,38,46,55 Assuming that roughness covers a portionof the entire collector surface, the average magnitude ofparticle-collector interaction energy (φ) can be calculated fromthe weighted sum of particle-rough collector interactions
(φ |totalDLVO
rough) and particle-smooth collector interactions
(φ |totalDLVO
smooth) as
φ χφ χ φ= | + − |(1 )totalDLVO
rough totalDLVO
smooth (7)
Here, χ is the fraction of rough surface and (1 − χ) is thefraction of smooth surface over the entire collector surface.Hamaker’s approach was used to evaluate the net VDW
interaction energy (φtotalVDW) between the approaching particle
and the rough collector surface.7 eq 8 accounts for theretardation effect of VDW interaction between the approachingparticle and bottom surface. That is because the approachingparticle cannot contact/attach on the bottom surface; thus, theclosest distance between the approaching particle and bottomsurface is the height of the roughness asperities (2nsar).
φλ
= −+
⎛⎝⎜
⎞⎠⎟
Aah h6
11 14 /
PPS
VDW
(8)
Equation 9 accounts for the unretarded effect of VDWinteraction between the approaching particle and roughnessasperities, because the approaching particle can attach on thetop of roughness asperities and then be removed from the bulksuspension.
φ = −− +
+− + +
+− +
− + +
⎡⎣⎢⎢
⎛⎝⎜⎜
⎞⎠⎟⎟⎤⎦⎥⎥
A a a
R a a
a a
R a a a a
R a a
R a a a a
6
2
( )
2
( ) 4
ln( )
( ) 4
ijij i j
ij i j
i j
ij i j i j
ij i j
ij i j i j
VDW2 2
2 2
2 2
2 2(9)
where i and j represent the rough sphere and approachingparticle, Rij is the center-to-center distance between twospheres, Aij is the Hamaker constant between i and j in thebackground solution, λ is the characteristic wavelength, h and Hare the true and dimensionless surface-to-surface distances,respectively.The EDL interaction energy between the approaching
particle and the rough collector surface was assessed usingthe linear approximation of the Poisson−Boltzmann equa-tion.37,38 Accordingly, the individual EDL interaction energiesbetween the particle and bottom surface or spheres comprisingthe roughness asperities were described by
φ πεε ψ ψκκ
ψ ψ κ
=+ −− −
+ + − −
⎡⎣⎢⎢
⎛⎝⎜
⎞⎠⎟
⎤⎦⎥⎥
aHH
H
2 ln1 exp( )1 exp( )
( )ln(1 exp( 2 ))
p P S
P S
PSEDL
0
2 2
(10)
φπεε
ψψκκ
ψ ψ κ
=+
+ −− −
+ + − −
⎡⎣⎢⎢
⎛⎝⎜
⎞⎠⎟
⎤⎦⎥⎥
a a
a aHH
H
( )2 ln
1 exp( )1 exp( )
( )ln(1 exp( 2 ))
iji j
i ji j
i j
EDL 0
2 2
(11)
where ψ1 and ψi are the respective ζ-potentials of the particleand roughness asperity spheres. Consistent with previouslyreported approaches for simulating particle deposition on
Table 1. Dimensionless Groups and Parameters Used in theConvection-Diffusion Equation
spherical collectors, the approaching particle and collectorsurface ζ-potentials were assumed to be 20 mV and −20 mVrespectively.7,37The net force between the particles andcollector surfaces was attractive and without a large interactionenergy barrier in all cases. Nanoscale surface roughness sizesfrom 0 to 600 nm were evaluated.Flow Field Description. When collector surfaces are rough,
the traditional implementation of the no-slip boundarycondition at the top of the contact surfaces to describe flowfield profiles is inappropriate (Figure 1a).56,57 Slip or partial-slipboundary conditions are more appropriate in these situations,depending on the absolute height and extent of coverage of theroughness elements.39,40 Alternatively, when surface roughnesssize is less than the approaching particle radius and the extentof surface coverage with roughness features exceeds 50%, ahydrodynamically equivalent smooth plane (i.e., the “effectivetarget surface”) located between the top and bottom (i.e.,collector) surfaces of the roughness elements can be utilizedand the no-slip boundary condition can be shifted from the topof the roughness elements to the bottom (collector) surface(Figure 1b and c).41,58 Thus, the appropriately modified flowfield can be approximated using slip length (i.e., dimensionlessroughness size) (Figure 1c).41,58 This was done in the presentinvestigationthe thickness of the fluid shell around the
collector, b was scaled by the size of the roughness elements toenable the use of dimensionless slip length (rslip) to properlydescribe the modified flow field velocity; thus, the originalassumptions of the Happel’s sphere-in-cell model were notchanged (Figure 1a).42 The flow field velocity component wasdescribed as
′ = +r r rV V( ) ( )slip (12)
=r r a/slip roughness p (13)
where the V(r) and V′(r) was the smooth and modified velocityvector which can be described as V(r) = iVθ + jVr. As a result ofthis adjustment, the radial velocity was higher for roughsurfaces than for smooth ones. Notably, when rroughness is equalto zero (indicating no roughness on the collector surface), thevelocity component should be equal to that of a smooth surface(Figure 1b).
Hydrodynamic Retardation. Surface roughness reduceshydrodynamic retardation; therefore, the associated descriptivefunctions must be appropriately modified.58,59 Analogous to themodification for the flow field, slip length can also be used indescribing the influence of surface roughness on hydrodynamicretardationthis approach was utilized herein (Figure 1c).Proposed and validated by Vinogradova and Belyaev (2011),59
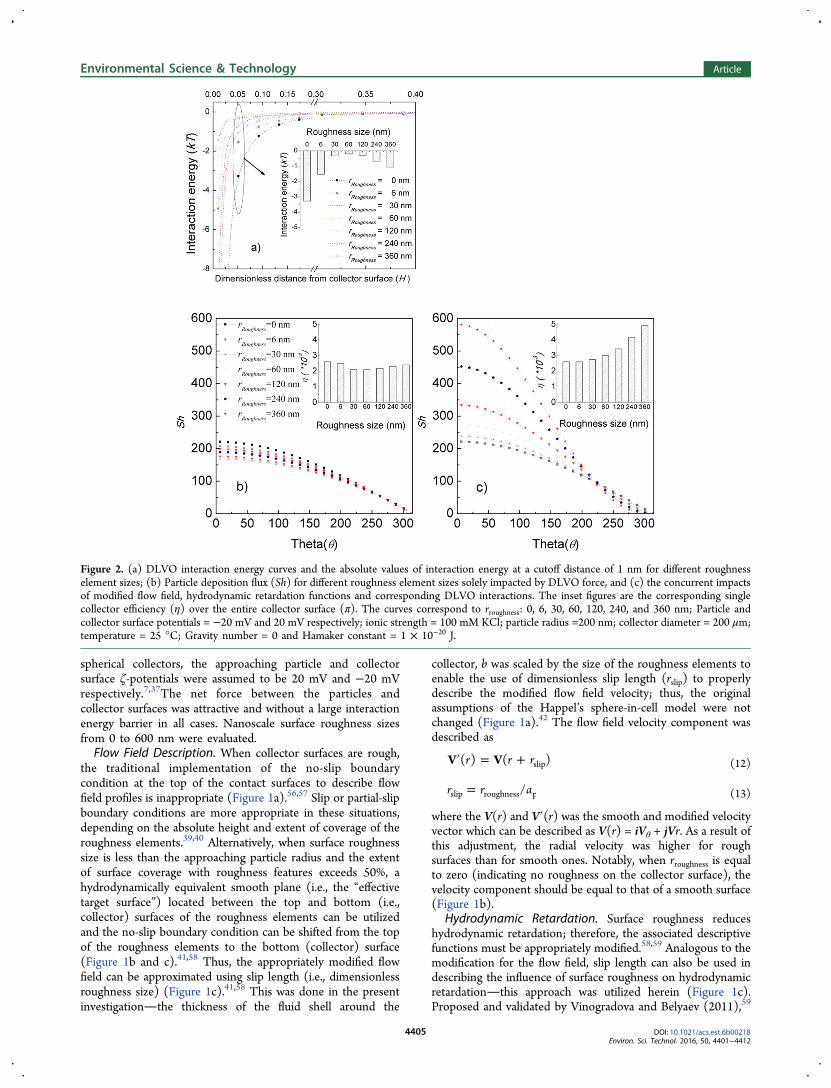
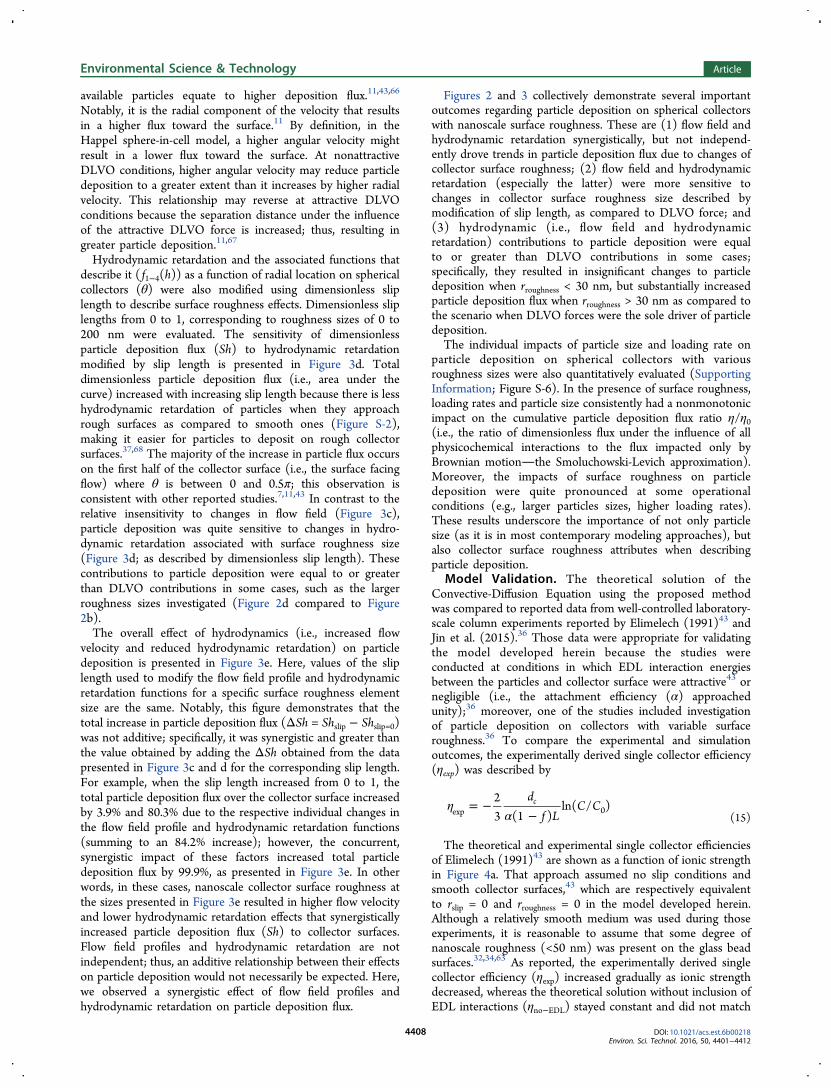
Figure 2. (a) DLVO interaction energy curves and the absolute values of interaction energy at a cutoff distance of 1 nm for different roughnesselement sizes; (b) Particle deposition flux (Sh) for different roughness element sizes solely impacted by DLVO force, and (c) the concurrent impactsof modified flow field, hydrodynamic retardation functions and corresponding DLVO interactions. The inset figures are the corresponding singlecollector efficiency (η) over the entire collector surface (π). The curves correspond to rroughness: 0, 6, 30, 60, 120, 240, and 360 nm; Particle andcollector surface potentials = −20 mV and 20 mV respectively; ionic strength = 100 mM KCl; particle radius =200 nm; collector diameter = 200 μm;temperature = 25 °C; Gravity number = 0 and Hamaker constant = 1 × 10⁻²⁰ J.
a hydrodynamically equivalent plane between the top andbottom(collector) of the roughness elements can be assumed asthe effective target surface for calculation of the hydrodynamicretardation functions (Figure 1c and Figure S-1). This approachhas been utilized for describing surface roughness impacts onparticle deposition in parallel plate systems, in which goodagreement between numerical solutions and experimentalresults was rigorously demonstrated.42 The modified hydro-dynamic retardation functions incorporating roughness impactson particle deposition can be expressed as
= +f h F h r( ) ( )i i slip (14)
where f i(h) represents the original individual hydrodynamicretardation functions f1−4(h) and Fi(h) represents the modifiedhydrodynamic retardation functions. Implementation of theanalytical solution for the f1−4 functions over the entiresimulation domain is computationally intensive.53,60 Toovercome this barrier, f1−4 were calculated as a blend of
asymptotic solutions described by = +∞
∞
⎡⎣⎢
⎤⎦⎥fi
f f
f f
n( ) 1/i i
n
in
in
0
0where n is a
fitting parameter, f i0 and f i∞are the analytical solutions for f1−4when the dimensionless distance is approaching 0 and infinity(Table S-1).42 Compared to other previously reportednumerical solutions,7,12,61 the new implemented functions off1−4 are simple and computationally efficient, providing best fitto the analytical solutions with no more than 2% relativedifference over the entire simulation domain (Figure S-2).Numerical Methods. The numerical solution of eq 2−5 was
solved using the finite element method (COMOSL 3.5a, Inc.,Canada). The simulation domain was discretized usingquadrilateral meshing. Highly refined meshes were required atthe regions with high concentration gradients or large tensorsof applied forces (Figure S-3). Because a steep particleconcentration gradient existed in the vicinity of the collectorsurface, extremely fine mesh elements smaller than the Debye−Huckel length (e.g., 10−4 in dimensionless size) were utilized atthe bottom of the collector surface.The implemented numerical methods were validated using
three approaches. First, the numerical solution to theConvective-Diffusion equation obtained using eq 2 wascompared to the analytical solution (i.e., the Smoluchowski-Levich approximation) without hydrodynamic retardationeffects (i.e., f1−4 equal to 1.0) and without interactions betweenthe approaching particle and collector surface (i.e., φtotal
DLVO
equal to 0). The relative difference between the determinednumerical solution and the analytical solution was 1.02% (atNPe = 0.63 when particle transport is controlled by pureconvective diffusion). The numerical model was furthervalidated following the approaches of Prieve and Ruckenstein(1974)62 and Elimelech (1991),43 in which the overall rate ofparticle deposition is obtained from integration of local particleflux (H = δ) over the entire surface of a spherical collector (0 to2π) and η within the range of attractive interaction forcesshould be the same at steady state. Accordingly, particle fluxwas integrated over the entire collector surface for differentvalues of H (δ to 100δ). The calculated values of Sh and η forvarious H were very similar (i.e., within less than 1%) to thevalues determined at H = δ, thus confirming the accuracy of thenumerical solution of the transport equation. Finally, profiles ofparticle deposition on smooth collectors (i.e., in absence ofcollector surface roughness) obtained using the numericalsolution were compared to the previously reported results of
Elimelech and Song (1998)7 and demonstrated excellentagreement (Figure S-4).
■ RESULTS AND DISCUSSIONDLVO Interaction Energy. The DLVO interaction energy
curves between an approaching particle and collector surfacewith different roughness sizes are presented as a function of thedimensionless separation distance (H) in Figure 2a. Notably, allof the calculated interaction energies were negative due to theapplied physicochemical conditions (indicating a net attractiveforce between the particle and collector surface), as would beexpected in absence of an energy barrier to particle deposition.To quantitatively compare the DLVO interaction energies fordifferent roughness sizes, the value of interaction energy at a cutoff distance of 1 nm is presented in the Figure 2a inset. Whencollector surface roughness size increased from 0 to 360 nm,the absolute value of interaction energy at the cutoff distancefirst decreased to a minimum (at a roughness size of ∼60 nm)and then increased. This nonmonotonic effect of collectorsurface roughness on interaction energy has been describedelsewhere.33,37,42
Dimensionless particle deposition flux (Sh) on the collectorsurface as a function of the radial location on sphericalcollectors (θ) with different roughness sizes, and impacted onlyby the DLVO force, is presented in Figure 2b; the cumulativedimensionless flux (i.e., single collector efficiency (η) over thesimulation domain [0, 2π]), is presented in the inset. WhenDLVO interaction was the sole mechanism driving deposition,the maximum amount of particle deposition that was observedoccurred on smooth surfaces (i.e., rroughness = 0); accordingly,over the range of conditions investigated, the DLVO forcealone consistently resulted in decreased total particle depositionflux to rough surfaces relative to that observed on smoothsurfaces (Figure 2b). When surface roughness size increasedfrom 0 to 360 nm, deposition flux decreased to a minimumvalue (at a corresponding roughness size of ∼60 nm), thenincreased again. It should be noted that although the depositioncurves in Figure 2b also followed a nonlinear, nonmonotonicpattern similar to the DLVO interaction energy profiles inFigure 2a, the determined η (the cumulative deposition flux ona single collector; Figure 2b inset) is not directly proportionalto the DLVO profiles. In this case, the maximum difference insingle collector efficiency (η) among the various roughnessscenarios was only ∼19%. As demonstrated by Jin et al.(2015),36 such small variations in η are too small to solelyexplain reported differences in observed particle deposition inthe presence of surface roughness in packed beds and parallelplate systems.30,32,36,42 This analysis and conclusion areconsistent with the extensive investigation of Elimelech(1990),63 who concluded that “...equilibrium (static) aspectsof surface roughness [described by DLVO interactions only]cannot explain the observed discrepancies.”The inability to accurately describe particle deposition in the
presence of collector surface roughness by using DLVO forcealone is not surprising because interaction energy is not a directmeasure of interaction force(s) acting on depositing particles,but only a surrogate measure of long-range forces that is oftenused to draw inferences about particle deposition flux. TheDLVO force acting on depositing particles is the derivative ofthe interaction energy between the particles and the surfaceover distance.64 Although the interaction energy profiles inFigure 2a are considered significantly different from oneanother, they are generally similar in shape and therefore yield
similar DLVO force. Accordingly, the particle deposition fluxprofiles obtained when only the DLVO interactions wereconsidered were also similar to one another, despite changes innanoscale surface roughness size (Figure 2b). Thus, therelatively small differential impact of changes on particledeposition due to DLVO interaction energy (i.e., VDW andEDL forces) cannot be used solely to quantitatively interpret,describe, or predict particle deposition in the presence ofsurface roughness, even at nanoscalethis has been previouslyshown both experimentally and numerically in parallel platesystems.42
Concurrent Impacts of Hydrodynamics and Inter-action Forces on Particle Deposition. Figure 2c describesthe concurrent impacts of flow field profile, hydrodynamicretardation, and DLVO interactions on particle deposition onspherical collector surfaces due to the presence of nanoscaleroughness. The dimensionless deposition rate (Sh) and singlecollector efficiency (η) changed significantly with increasingnanoscale roughness (Figure 2c); consistent with previousreports,36,42 a nonlinear impact of surface roughness on particledeposition was suggested (Figure 2c inset). When collectorsurface roughness size was smaller than ∼30 nm, η was notsubstantially enhanced by surface roughness. More substantialincreases in total particle deposition flux were observed atroughness sizes greater than 60 nm, at which changes inhydrodynamic effects on the flow field and retardation thatwere attributable to surface roughness enhanced particledeposition and overshadowed DLVO interaction impacts inmagnitude and in a manner consistent with previous work in aparallel plate system.42 Here, significantly higher (up to ∼330%more) particle deposition was observed when both factors wererepresented (Figure 2c), as compared to the scenario in whichonly the impacts of the DLVO force were considered (Figure2b). It should be noted that this simulation was conductedassuming that the slip-lengths for flow field and hydrodynamicretardation are both linearly proportional to roughness height.In other cases, depending on surface hydrophobicity, short-range forces, chemical heterogeneity, and the extent of surfacecoverage by roughness, the most appropriate slip-length(s) fordescribing the particle flow field and hydrodynamic retardationfunctions might not have the same values.40,41,56,65 Regardless,this work may shed light on the classic findings of Yao andO’Melia (1971),1,63 who concluded that the single collectorefficiency developed for smooth surfaces underestimatesparticle deposition. That and other reported work hassuggested that nanoscale roughness may explain the associatedlack of agreement between reported experimental observationsand simulation outcomes.1,18,63
Sensitivity Analysis. The relative sensitivity of particledeposition flux to DLVO energy was discussed above. Therelative contributions of the introduced non-DLVO factors (i.e.,hydrodynamics, as described by flow field and hydrodynamicretardation) to particle deposition on spherical collectors andthe sensitivity of deposition flux in response to modified flowfield and hydrodynamic retardation due to surface roughnessalso were evaluated. To illustrate the impact of changes in flowfield profile on particle deposition, slip length (used to modifyflow profile) as a function of radial location on sphericalcollectors (θ) was varied and the resulting tangential (vθ) andradial (vr) flow velocities and dimensionless particle depositionflux (Sh) were evaluated (Figure 3a−c respectively). Thetangential velocity approached zero when θ = 0 or π andachieved maximum values when θ = 0.5π in all cases.
Dimensionless slip lengths from 0 to 1, corresponding toroughness sizes of 0−200 nm were evaluated. Biggerdimensionless slip-lengths resulted in higher tangential (Figure3a) and radial (Figure 3b) flow velocities; particularly for sliplengths greater than 0.1, corresponding to roughness sizesgreater than 20 nm. Surface roughness-associated changes inthe flow fields resulted in changes in particle deposition flux,which followed patterns similar to those of the flow velocitycomponents (i.e., vθ and vr). When surface roughness size (andassociated dimensionless slip length) increased, total particledeposition flux on the spherical collector surfaces (i.e., areaunder the curve) increased (Figure 3c) due to changes in theflow velocity profile. The incremental changes in depositionflux due to flow field changes were relatively small when sliplength was less than 0.1, but became more substantial at largerslip lengths. This is because higher flow velocities (vθ and vr)resulting from collector surface roughness enable suspensionfluids to carry more particles to the vicinity of collector surfacesper unit time; thus, for a fixed attachment efficiency (α), more
Figure 3. (a) Tangential (vθ) and (b) radial (vr) flow velocitycomponents and particle deposition flux (Sh) sensitivity to slip-lengthsused to modify (c) only the flow field around a spherical collector, (d)only the hydrodynamic retardation functions, and (e) both the flowfield and hydrodynamic retardation functions as a function of the radiallocation on a spherical collector (θ) at different slip-lengths. Theparticle and collector surface potentials equal −0 mV and 0 mV,respectively. The curves correspond to the following dimensionlessslip lengths: 0, 0.0001, 0.001, 0.01, 0.1, and 1. The other parametersare same as those used in Figure 2.
available particles equate to higher deposition flux.11,43,66
Notably, it is the radial component of the velocity that resultsin a higher flux toward the surface.11 By definition, in theHappel sphere-in-cell model, a higher angular velocity mightresult in a lower flux toward the surface. At nonattractiveDLVO conditions, higher angular velocity may reduce particledeposition to a greater extent than it increases by higher radialvelocity. This relationship may reverse at attractive DLVOconditions because the separation distance under the influenceof the attractive DLVO force is increased; thus, resulting ingreater particle deposition.11,67
Hydrodynamic retardation and the associated functions thatdescribe it ( f1−4(h)) as a function of radial location on sphericalcollectors (θ) were also modified using dimensionless sliplength to describe surface roughness effects. Dimensionless sliplengths from 0 to 1, corresponding to roughness sizes of 0 to200 nm were evaluated. The sensitivity of dimensionlessparticle deposition flux (Sh) to hydrodynamic retardationmodified by slip length is presented in Figure 3d. Totaldimensionless particle deposition flux (i.e., area under thecurve) increased with increasing slip length because there is lesshydrodynamic retardation of particles when they approachrough surfaces as compared to smooth ones (Figure S-2),making it easier for particles to deposit on rough collectorsurfaces.37,68 The majority of the increase in particle flux occurson the first half of the collector surface (i.e., the surface facingflow) where θ is between 0 and 0.5π; this observation isconsistent with other reported studies.7,11,43 In contrast to therelative insensitivity to changes in flow field (Figure 3c),particle deposition was quite sensitive to changes in hydro-dynamic retardation associated with surface roughness size(Figure 3d; as described by dimensionless slip length). Thesecontributions to particle deposition were equal to or greaterthan DLVO contributions in some cases, such as the largerroughness sizes investigated (Figure 2d compared to Figure2b).The overall effect of hydrodynamics (i.e., increased flow
velocity and reduced hydrodynamic retardation) on particledeposition is presented in Figure 3e. Here, values of the sliplength used to modify the flow field profile and hydrodynamicretardation functions for a specific surface roughness elementsize are the same. Notably, this figure demonstrates that thetotal increase in particle deposition flux (ΔSh = Shslip − Shslip=0)was not additive; specifically, it was synergistic and greater thanthe value obtained by adding the ΔSh obtained from the datapresented in Figure 3c and d for the corresponding slip length.For example, when the slip length increased from 0 to 1, thetotal particle deposition flux over the collector surface increasedby 3.9% and 80.3% due to the respective individual changes inthe flow field profile and hydrodynamic retardation functions(summing to an 84.2% increase); however, the concurrent,synergistic impact of these factors increased total particledeposition flux by 99.9%, as presented in Figure 3e. In otherwords, in these cases, nanoscale collector surface roughness atthe sizes presented in Figure 3e resulted in higher flow velocityand lower hydrodynamic retardation effects that synergisticallyincreased particle deposition flux (Sh) to collector surfaces.Flow field profiles and hydrodynamic retardation are notindependent; thus, an additive relationship between their effectson particle deposition would not necessarily be expected. Here,we observed a synergistic effect of flow field profiles andhydrodynamic retardation on particle deposition flux.
Figures 2 and 3 collectively demonstrate several importantoutcomes regarding particle deposition on spherical collectorswith nanoscale surface roughness. These are (1) flow field andhydrodynamic retardation synergistically, but not independ-ently drove trends in particle deposition flux due to changes ofcollector surface roughness; (2) flow field and hydrodynamicretardation (especially the latter) were more sensitive tochanges in collector surface roughness size described bymodification of slip length, as compared to DLVO force; and(3) hydrodynamic (i.e., flow field and hydrodynamicretardation) contributions to particle deposition were equalto or greater than DLVO contributions in some cases;specifically, they resulted in insignificant changes to particledeposition when rroughness < 30 nm, but substantially increasedparticle deposition flux when rroughness > 30 nm as compared tothe scenario when DLVO forces were the sole driver of particledeposition.The individual impacts of particle size and loading rate on
particle deposition on spherical collectors with variousroughness sizes were also quantitatively evaluated (SupportingInformation; Figure S-6). In the presence of surface roughness,loading rates and particle size consistently had a nonmonotonicimpact on the cumulative particle deposition flux ratio η/η0(i.e., the ratio of dimensionless flux under the influence of allphysicochemical interactions to the flux impacted only byBrownian motionthe Smoluchowski-Levich approximation).Moreover, the impacts of surface roughness on particledeposition were quite pronounced at some operationalconditions (e.g., larger particles sizes, higher loading rates).These results underscore the importance of not only particlesize (as it is in most contemporary modeling approaches), butalso collector surface roughness attributes when describingparticle deposition.
Model Validation. The theoretical solution of theConvective-Diffusion Equation using the proposed methodwas compared to reported data from well-controlled laboratory-scale column experiments reported by Elimelech (1991)43 andJin et al. (2015).36 Those data were appropriate for validatingthe model developed herein because the studies wereconducted at conditions in which EDL interaction energiesbetween the particles and collector surface were attractive43 ornegligible (i.e., the attachment efficiency (α) approachedunity);36 moreover, one of the studies included investigationof particle deposition on collectors with variable surfaceroughness.36 To compare the experimental and simulationoutcomes, the experimentally derived single collector efficiency(ηexp) was described by
ηα
= −−d
f LC C
23 (1 )
ln( / )cexp 0
(15)
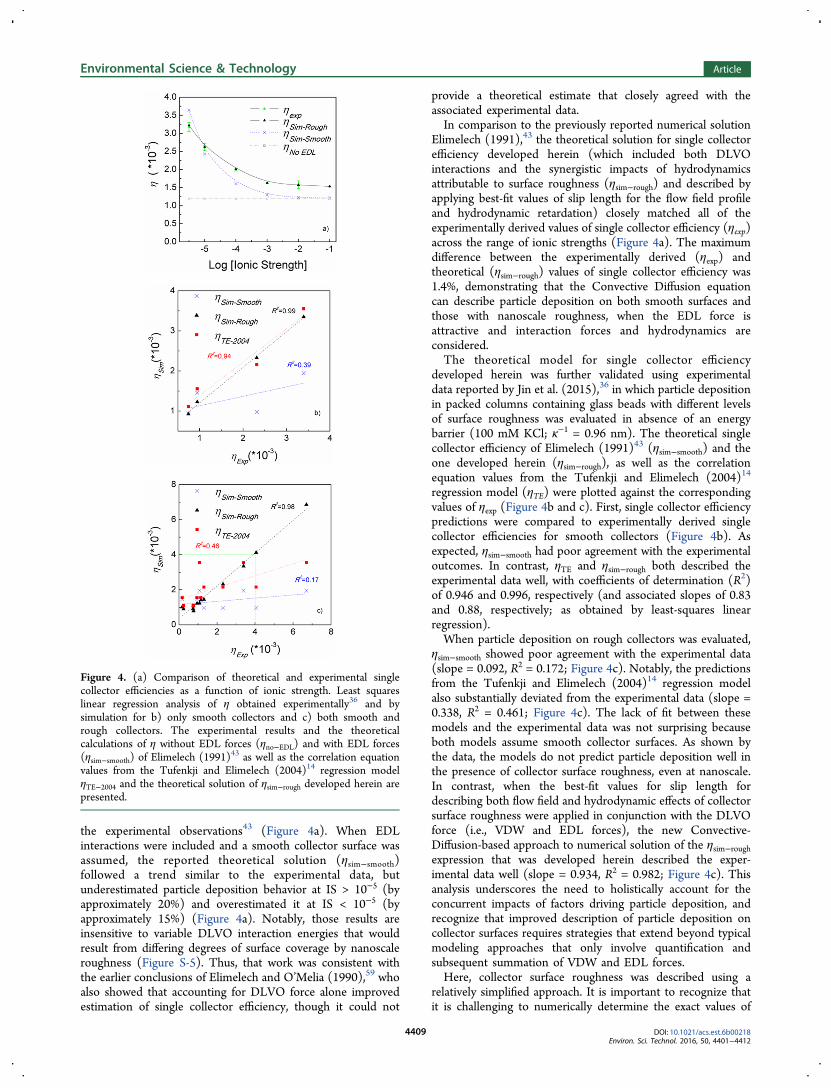
The theoretical and experimental single collector efficienciesof Elimelech (1991)43 are shown as a function of ionic strengthin Figure 4a. That approach assumed no slip conditions andsmooth collector surfaces,43 which are respectively equivalentto rslip = 0 and rroughness = 0 in the model developed herein.Although a relatively smooth medium was used during thoseexperiments, it is reasonable to assume that some degree ofnanoscale roughness (<50 nm) was present on the glass beadsurfaces.32,34,63 As reported, the experimentally derived singlecollector efficiency (ηexp) increased gradually as ionic strengthdecreased, whereas the theoretical solution without inclusion ofEDL interactions (ηno−EDL) stayed constant and did not match
the experimental observations43 (Figure 4a). When EDLinteractions were included and a smooth collector surface wasassumed, the reported theoretical solution (ηsim−smooth)followed a trend similar to the experimental data, butunderestimated particle deposition behavior at IS > 10−5 (byapproximately 20%) and overestimated it at IS < 10−5 (byapproximately 15%) (Figure 4a). Notably, those results areinsensitive to variable DLVO interaction energies that wouldresult from differing degrees of surface coverage by nanoscaleroughness (Figure S-5). Thus, that work was consistent withthe earlier conclusions of Elimelech and O’Melia (1990),59 whoalso showed that accounting for DLVO force alone improvedestimation of single collector efficiency, though it could not
provide a theoretical estimate that closely agreed with theassociated experimental data.In comparison to the previously reported numerical solution
Elimelech (1991),43 the theoretical solution for single collectorefficiency developed herein (which included both DLVOinteractions and the synergistic impacts of hydrodynamicsattributable to surface roughness (ηsim−rough) and described byapplying best-fit values of slip length for the flow field profileand hydrodynamic retardation) closely matched all of theexperimentally derived values of single collector efficiency (ηexp)across the range of ionic strengths (Figure 4a). The maximumdifference between the experimentally derived (ηexp) andtheoretical (ηsim−rough) values of single collector efficiency was1.4%, demonstrating that the Convective Diffusion equationcan describe particle deposition on both smooth surfaces andthose with nanoscale roughness, when the EDL force isattractive and interaction forces and hydrodynamics areconsidered.The theoretical model for single collector efficiency
developed herein was further validated using experimentaldata reported by Jin et al. (2015),36 in which particle depositionin packed columns containing glass beads with different levelsof surface roughness was evaluated in absence of an energybarrier (100 mM KCl; κ−1 = 0.96 nm). The theoretical singlecollector efficiency of Elimelech (1991)43 (ηsim−smooth) and theone developed herein (ηsim−rough), as well as the correlationequation values from the Tufenkji and Elimelech (2004)14
regression model (ηTE) were plotted against the correspondingvalues of ηexp (Figure 4b and c). First, single collector efficiencypredictions were compared to experimentally derived singlecollector efficiencies for smooth collectors (Figure 4b). Asexpected, ηsim−smooth had poor agreement with the experimentaloutcomes. In contrast, ηTE and ηsim−rough both described theexperimental data well, with coefficients of determination (R2)of 0.946 and 0.996, respectively (and associated slopes of 0.83and 0.88, respectively; as obtained by least-squares linearregression).When particle deposition on rough collectors was evaluated,
ηsim−smooth showed poor agreement with the experimental data(slope = 0.092, R2 = 0.172; Figure 4c). Notably, the predictionsfrom the Tufenkji and Elimelech (2004)14 regression modelalso substantially deviated from the experimental data (slope =0.338, R2 = 0.461; Figure 4c). The lack of fit between thesemodels and the experimental data was not surprising becauseboth models assume smooth collector surfaces. As shown bythe data, the models do not predict particle deposition well inthe presence of collector surface roughness, even at nanoscale.In contrast, when the best-fit values for slip length fordescribing both flow field and hydrodynamic effects of collectorsurface roughness were applied in conjunction with the DLVOforce (i.e., VDW and EDL forces), the new Convective-Diffusion-based approach to numerical solution of the ηsim−roughexpression that was developed herein described the exper-imental data well (slope = 0.934, R2 = 0.982; Figure 4c). Thisanalysis underscores the need to holistically account for theconcurrent impacts of factors driving particle deposition, andrecognize that improved description of particle deposition oncollector surfaces requires strategies that extend beyond typicalmodeling approaches that only involve quantification andsubsequent summation of VDW and EDL forces.Here, collector surface roughness was described using a
relatively simplified approach. It is important to recognize thatit is challenging to numerically determine the exact values of
Figure 4. (a) Comparison of theoretical and experimental singlecollector efficiencies as a function of ionic strength. Least squareslinear regression analysis of η obtained experimentally36 and bysimulation for b) only smooth collectors and c) both smooth andrough collectors. The experimental results and the theoreticalcalculations of η without EDL forces (ηno−EDL) and with EDL forces(ηsim−smooth) of Elimelech (1991)43 as well as the correlation equationvalues from the Tufenkji and Elimelech (2004)14 regression modelηTE−2004 and the theoretical solution of ηsim−rough developed herein arepresented.
the “effective contact surface” (rslip) because factors such ashydrophobicity,25 heterogeneity,26 short-range forces andadhesion/detachment40,69 that contribute to roughness com-plexity in real systems complicate that analysis. We stress thatour goal here was not to exactly, quantitatively describeeffective contact surfaces; rather, it was to demonstrate thatinclusion/description of hydrodynamic contributions to particledeposition can significantly improve single collector efficiencypredictions and may thus contribute to (1) helping to explaindiscrepancies between model-based expectations and exper-imental outcomes and (2) ultimately developing a filtrationmodel that is more universally relevant and predictive. Futureresearch focused on improved quantitative description of thehydrodynamic effects on particle transport in systems withmore complex geometry will contribute to a more thoroughunderstanding of particle deposition in porous media.
■ ASSOCIATED CONTENT*S Supporting InformationThe Supporting Information is available free of charge on theACS Publications website at DOI: 10.1021/acs.est.6b00218.
Schematic of roughness surface, developed f1−4(H)functions, meshed domain for numerical simulation inCOMSOL, and model validation and dimensionlessgroups used in the Convection-Diffusion Equation.(PDF)
■ AUTHOR INFORMATIONCorresponding Author*Phone: +1-519-888-4567, ×32208; e-mail: [email protected] ContributionsC.J. and M.E. envisioned the work. C.J. conducted theexperiments and modeling. C.J. and M.E. wrote the paper. Allof the authors discussed the experimental plan and numericalsimulations, contributed to reviewing the manuscript, and gaveapproval for the final version of the paper.NotesThe authors declare no competing financial interest.
■ ACKNOWLEDGMENTSWe thank the Natural Sciences and Engineering ResearchCouncil of Canada (NSERC) and the Canadian WaterNetwork for financial support. We are thankful to Dr. T.Glawdel for useful discussions on numerical simulation.
■ GREEK LETTERSψi ζ-potential of surface, iκ−1 Inverse Debye-Hυckel lengthα colloid attachment efficiencyε0 dialectic permittivity in vacuumεr relative dialectic permittivity of waterλ characteristic wavelength of electron oscillationμ absolute viscosity of bulk fluidδ dimensionless closest distanceη single collector efficiencyηexp experimental determined Single collector efficiencyηTE values of η from Tufenkji and Elimelech, 2004ηsim−rough theoretical solution of η for rough surfaceηsim−smooth theoretical solution of η for smooth surfaceηno−EDL theoretical solution of η without EDL force
forceχ fraction of roughness surface over the collectorφ weighted sum of DLVO interaction energy for
rough and smooth surfaces
Symbols and Notations Used in This WorkA Hamaker constantac collector radiusap colloid radiusb radius of the fluid thicknessC colloid concentrationC0 bulk colloid concentrationD∞ diffusion coefficient in an infinite mediumD diffusion coefficient tensore charge of an electronf porosity of packed mediaF external forces act as sourcef i(h) hydrodynamic retardation functions, i= 1 ∼ 4Fi(h) modified hydrodynamic retardation function, i= 1−4f i∞(h) analytical solution of f i(h)when h= ∞f i0(h) analytical solution of f i(h) when h = 0h true distance between surface to surfaceH dimensionless distanceI cumulative colloid deposition fluxJ local colloid deposition fluxkb Boltzmann constantL packed column lengthns number of stacked rough sphere for roughnessPe Peclet numberQ source termRij Center to center distance between sphere i and jrslip dimensionless slip lengthrroughness dimensionless roughness heightSi,j surface to surface distance between two roughness
■ REFERENCES(1) Yao, K. M.; Habibian, M. M.; O’ Melia, C. R. Water and WasteWater Filtration - Concepts and Applications. Environ. Sci. Technol.1971, 5 (11), 1105−1112.(2) Nijhawan, S.; McMurry, P. H.; Campbell, S. A. Particle transportin a parallel-plate semiconductor reactor: Chamber modification anddesign criterion for enhanced process cleanliness. J. Vac. Sci. Technol., A2000, 18 (5), 2198−2206.(3) Tufenkji, N.; Ryan, J. N.; Elimelech, M. The promise of bankfiltration. Environ. Sci. Technol. 2002, 36 (21), 422A−428A.
(4) Tien, C. Hydrosol deposition in porous media: the effect ofsurface interactions. Adv. Powder Technol. 2000, 11 (1), 9−56.(5) Schijven, J. F.; Hassanizadeh, S. M. Removal of viruses by soilpassage: Overview of modeling, processes, and parameters. Crit. Rev.Environ. Sci. Technol. 2000, 30 (1), 49−127.(6) Adamczyk, Z.; Weronski, P. Application of the DLVO theory forparticle deposition problems. Adv. Colloid Interface Sci. 1999, 83 (1−3), 137−226.(7) Elimelech, M.; Jia, X.; Gregory, J.; Williams, R. Particle Deposition& Aggregation: Measurement, Modelling and Simulation; Butterworth-Heinemann, 1998.(8) Adamczyk, Z.; Vandeven, T. G. M. Deposition of Particles UnderExternal Forces in Laminar-Flow through Parallel-Plate andCylindrical Channels. J. Colloid Interface Sci. 1981, 80 (2), 340−356.(9) Prieve, D. C.; Lin, M. M. J. Adsorption of Brownian HydrosolsOnto a Rotating-Disk Aided by a Uniform Applied Force. J. ColloidInterface Sci. 1980, 76 (1), 32−47.(10) Nelson, K. E.; Ginn, T. R. New collector efficiency equation forcolloid filtration in both natural and engineered flow conditions. WaterResour. Res. 2011, 47 (5), W05543.(11) Elimelech, M. Particle deposition on ideal collectors from diluteflowing suspensions: Mathematical formulation, numerical solution,and simulations. Sep. Technol. 1994, 4 (4), 186−212.(12) Ma, H.; Pedel, J.; Fife, P.; Johnson, W. P. Hemispheres-in-CellGeometry to Predict Colloid Deposition in Porous Media. Environ. Sci.Technol. 2009, 43 (22), 8573−8579.(13) Chrysikopoulos, C. V.; Syngouna, V. I. Effect of gravity oncolloid transport through water-saturated columns packed with glassbeads: modeling and experiments. Environ. Sci. Technol. 2014, 48 (12),6805−6813.(14) Tufenkji, N.; Elimelech, M. Correlation equation for predictingsingle-collector efficiency in physicochemical filtration in saturatedporous media. Environ. Sci. Technol. 2004, 38 (2), 529−536.(15) Jegatheesan, V.; Vigneswaran, S.; Lee, S. H. Deposition ofsubmicron particles in deep bed filtration under unfavorable surfaceconditions. Korean J. Chem. Eng. 2005, 22 (1), 142−146.(16) Hahn, M. W.; O’Melia, C. R. Deposition and reentrainment ofBrownian particles in porous media under unfavorable chemicalconditions: Some concepts and applications. Environ. Sci. Technol.2004, 38 (1), 210−220.(17) Johnson, W. P.; Tong, M.; Li, X. On colloid retention insaturated porous media in the presence of energy barriers: The failureof alpha, and opportunities to predict eta. Water Resour. Res. 2007, 43(12), W12S13.(18) Logan, B. E.; Jewett, D. G.; Arnold, R. G.; Bouwer, E. J.;O’Melia, C. R. Clarification of Clean-Bed Filtration Models. J. Environ.Eng. 1995, 121 (12), 869−873.(19) Tufenkji, N.; Elimelech, M. Breakdown of colloid filtrationtheory: Role of the secondary energy minimum and surface chargeheterogeneities. Langmuir 2005, 21 (3), 841−852.(20) Pazmino, E.; Trauscht, J.; Johnson, W. P. Release of colloidsfrom primary minimum contact under unfavorable conditions byperturbations in ionic strength and flow rate. Environ. Sci. Technol.2014, 48 (16), 9227−9235.(21) Knappett, P. S. K.; Emelko, M. B.; Zhuang, J.; McKay, L. D.Transport and retention of a bacteriophage and microspheres insaturated, angular porous media: Effects of ionic strength and grainsize. Water Res. 2008, 42 (16), 4368−4378.(22) Walshe, G. E.; Pang, L.; Flury, M.; Close, M. E.; Flintoft, M.Effects of pH, ionic strength, dissolved organic matter, and flow rateon the co-transport of MS2 bacteriophages with kaolinite in gravelaquifer media. Water Res. 2010, 44 (4), 1255−1269.(23) Jewett, D. G.; Hilbert, T. A.; LoganM, B. E.; Arnold, R. G.;Bales, R. C. Bacterial transport in laboratory columns and filters:influence of ionic strength and pH on collision efficiency. Water Res.1995, 29 (7), 1673−1680.(24) Ryan, J. N.; Elimelech, M. Colloid mobilization and transport ingroundwater. Colloids Surf., A 1996, 107, 1−56.
(25) Tang, H.; Cao, T.; Liang, X.; Wang, A.; Salley, S. O.; McAllister,James, II; Ng, K. Y. S. Influence of silicone surface roughness andhydrophobicity on adhesion and colonization of Staphylococcusepidermidis. J. Biomed. Mater. Res., Part A 2009, 88A (2), 454−463.(26) Rizwan, T.; Bhattacharjee, S. Particle Deposition onto Charge-Heterogeneous Substrates. Langmuir 2009, 25 (9), 4907−4918.(27) Hahn, M. W.; Abadzic, D.; O’Melia, C. R. Aquasols: On the roleof secondary minima. Environ. Sci. Technol. 2004, 38 (22), 5915−5924.(28) Huang, X. F.; Bhattacharjee, S.; Hoek, E. M. V. Is SurfaceRoughness a ″Scapegoat″ or a Primary Factor When Defining Particle-Substrate Interactions? Langmuir 2010, 26 (4), 2528−2537.(29) Johnson, W. P.; Ma, H. L.; Pazmino, E. Straining Credibility: AGeneral Comment Regarding Common Arguments Used to InferStraining As the Mechanism of Colloid Retention in Porous Media.Environ. Sci. Technol. 2011, 45 (9), 3831−3832.(30) Chen, G.; Bedi, R. S.; Yan, Y. S.; Walker, S. L. Initial ColloidDeposition on Bare and Zeolite-Coated Stainless Steel and Aluminum:Influence of Surface Roughness. Langmuir 2010, 26 (15), 12605−12613.(31) Darbha, G. K.; Schaefer, T.; Heberling, F.; Luettge, A.; Fischer,C. Retention of Latex Colloids on Calcite as a Function of SurfaceRoughness and Topography. Langmuir 2010, 26 (7), 4743−4752.(32) Shellenberger, K.; Logan, B. E. Effect of molecular scaleroughness of glass beads on colloidal and bacterial deposition. Environ.Sci. Technol. 2002, 36 (2), 184−189.(33) Henry, C.; Minier, J.; Lefevre, G.; Hurisse, O. Numerical Studyon the Deposition Rate of Hematite Particle on Polypropylene Walls:Role of Surface Roughness. Langmuir 2011, 27 (8), 4603−4612.(34) Morales, V. L.; Gao, B.; Steenhuis, T. S. Grain Surface-Roughness Effects on Colloidal Retention in the Vadose Zone. VadoseZone J. 2009, 8 (1), 11−20.(35) Mitik-Dineva, N.; Wang, J.; Truong, V. K.; Stoddart, P.;Malherbe, F.; Crawford, R. J.; Ivanova, E. P. Escherichia coli,Pseudomonas aeruginosa, and Staphylococcus aureus AttachmentPatterns on Glass Surfaces with Nanoscale Roughness. Curr. Microbiol.2009, 58 (3), 268−273.(36) Jin, C.; Normani, S. D.; Emelko, M. B. Surface RoughnessImpacts on Granular Media Filtration at Favorable DepositionConditions: Experiments and Modeling. Environ. Sci. Technol. 2015,49 (13), 7879−7888.(37) Henry, C.; Minier, J.; Lefevre, G. Numerical Study on theAdhesion and Reentrainment of Nondeformable Particles on Surfaces:The Role of Surface Roughness and Electrostatic Forces. Langmuir2012, 28 (1), 438−452.(38) Walz, J. Y. The effect of surface heterogeneities on colloidalforces. Adv. Colloid Interface Sci. 1998, 74, 119−168.(39) Vinogradova, O.; Yakubov, G. Surface roughness and hydro-dynamic boundary conditions. Phys. Rev. E 2006, 73 (4), 045302.(40) Lee, T.; Charrault, E.; Neto, C. Interfacial slip on rough,patterned and soft surfaces: A review of experiments and simulations.Adv. Colloid Interface Sci. 2014, 210 (0), 21−38, http://dx.doi.org/10.1016/j.cis.2014.02.015,.(41) Neto, C.; Evans, D.; Bonaccurso, E.; Butt, H.; Craig, V.Boundary slip in Newtonian liquids: a review of experimental studies.Rep. Prog. Phys. 2005, 68 (12), 2859−2897.(42) Jin, C.; Glawdel, T.; Ren, C. L.; Emelko, M. B. Non-linear, non-monotonic effect of nano-scale roughness on particle deposition inabsence of an energy barrier: Experiments and modeling. Sci. Rep.2015, 5, 17747.(43) Elimelech, M. Kinetics of Capture of Colloidal Particles inPacked-Beds Under Attractive Double-Layer Interactions. J. ColloidInterface Sci. 1991, 146 (2), 337−352.(44) Eichenlaub, S.; Gelb, A.; Beaudoin, S. Roughness models forparticle adhesion. J. Colloid Interface Sci. 2004, 280 (2), 289−298.(45) Komvopoulos, K.; Yan, W. A fractal analysis of stiction inmicroelectromechanical systems. J. Tribol. 1997, 119 (3), 391−400.(46) Kemps, J. A. L.; Bhattacharjee, S. Interactions between a solidspherical particle and a chemically heterogeneous planar substrate.Langmuir 2005, 21 (25), 11710−11721.
(47) Bhattacharjee, S.; Kim, A. S.; Elimelech, M. ConcentrationPolarization of Interacting Solute Particles in Cross-Flow MembraneFiltration. J. Colloid Interface Sci. 1999, 212 (1), 81−99, http://dx.doi.org/10.1006/jcis.1998.6045,.(48) Bendersky, M.; Davis, J. M. DLVO interaction of colloidalparticles with topographically and chemically heterogeneous surfaces.J. Colloid Interface Sci. 2011, 353 (1), 87−97.(49) Bhattacharjee, S.; Elimelech, M. Surface element integration: Anovel technique for evaluation of DLVO interaction between a particleand a flat plate. J. Colloid Interface Sci. 1997, 193 (2), 273−285.(50) Song, L.; Elimelech, M. Deposition of Brownian particles inporous media: Modified boundary conditions for the sphere-in-cellmodel. J. Colloid Interface Sci. 1992, 153 (1), 294−297, http://dx.doi.org/10.1016/0021-9797(92)90321-C,.(51) Nazemifard, N.; Masliyah, J. H.; Bhattacharjee, S. Particledeposition onto charge heterogeneous surfaces: Convection-diffusion-migration model. Langmuir 2006, 22 (24), 9879−9893.(52) Chatterjee, R.; Mitra, S. K.; Bhattacharjee, S. Particle Depositiononto Janus and Patchy Spherical Collectors. Langmuir 2011, 27 (14),8787−8797.(53) Ma, H. L.; Pedel, J.; Fife, P.; Johnson, W. P. Hemispheres-in-Cell Geometry to Predict Colloid Deposition in Porous Media (vol 43,pg 8573, 2009). Environ. Sci. Technol. 2010, 44 (11), 4383−4383.(54) Walz, J. Y.; Sun, N. Effects of surface roughness on van derWaals and electrostatic contributions to particle-particle interactionsand particle adhesion. Particles of Surfaces 7: Detection, Adhesion andRemoval 2002, 151−169.(55) Hoek, E. M. V.; Bhattacharjee, S.; Elimelech, M. Effect ofmembrane surface roughness on colloid-membrane DLVO inter-actions. Langmuir 2003, 19 (11), 4836−4847.(56) Zhu, Y. X.; Granick, S. Limits of the hydrodynamic no-slipboundary condition. Phys. Rev. Lett. 2002, 88 (10), 106102.(57) Bonaccurso, E.; Butt, H. J.; Craig, V. S. J. Surface roughness andhydrodynamic boundary slip of a newtonian fluid in a completelywetting system. Phys. Rev. Lett. 2003, 90 (14), 144501.(58) Kunert, C.; Harting, J.; Vinogradova, O. I. Random-RoughnessHydrodynamic Boundary Conditions. Phys. Rev. Lett. 2010, 105 (1),016001.(59) Vinogradova, O. I.; Belyaev, A. V. Wetting, roughness and flowboundary conditions. J. Phys.: Condens. Matter 2011, 23 (18), 184104.(60) Nelson, K. E.; Ginn, T. R. Colloid filtration theory and theHappel sphere-in-cell model revisited with direct numerical simulationof colloids. Langmuir 2005, 21 (6), 2173−2184.(61) Masliyah, J. H.; Bhattacharjee, S. Electrokinetic and ColloidTransport Phenomena.; John Wiley & Sons, 2006.(62) Prieve, D. C.; Ruckenstein, E. Effect of London forces upon therate of deposition of Brownian particles. AIChE J. 1974, 20 (6), 1178−1187.(63) Elimelech, M.; O’Melia, C. R. Effect of Particle-Size on CollisionEfficiency in the Deposition of Brownian Particles with ElectrostaticEnergy Barriers. Langmuir 1990, 6 (6), 1153−1163.(64) Hogg, R.; Healy, T. W.; Fuersten, Dw Mutual Coagulation ofColloidal Dispersions. Trans. Faraday Soc. 1966, 62 (522P), 1638−1651.(65) Vinogradova, O. Slippage of water over hydrophobic surfaces.Int. J. Miner. Process. 1999, 56 (1−4), 31−60.(66) Tien, C.; Ramarao, B. V. Granular filtration of aerosols andhydrosols. Access Online via Elsevier: 2011.(67) Elimelech, M. Effect of particle size on the kinetics of particledeposition under attractive double layer interactions. J. Colloid InterfaceSci. 1994, 164 (1), 190−199.(68) Zou, Y.; Jayasuriya, S.; Manke, C. W.; Mao, G. Influence ofNanoscale Surface Roughness on Colloidal Force Measurements.Langmuir 2015, 31 (38), 10341−10350.(69) Asmolov, E. S.; Zhou, J.; Schmid, F.; Vinogradova, O. I. Effectiveslip-length tensor for a flow over weakly slipping stripes. Phys. Rev. E2013, 88 (2), 023004.