Zenith-viewing UV–visible scattered light differen-tial optical absorption spectroscopy (DOAS) has beenused over a number of decades for the retrieval ofatmospheric concentrations of trace species includingO3, NO2, BrO, OCIO, IO, HCHO, and O4 (e.g., Refs.1–11). More recently, systems incorporating off-axis(nonzenith) measurements have been developed.12–18
Off-axis techniques exploit the improved sensitivityof nonzenith measurements to tropospheric trace-gasconcentrations owing to the enhanced troposphericpath length of scattered light collected at low eleva-tion angles. Through the incorporation of multipleoff-axis viewing geometries, information on the ver-tical profile and spatial distribution of trace gases canbe retrieved.
The application of the DOAS methodology canmeasure absorption by trace species throughout the
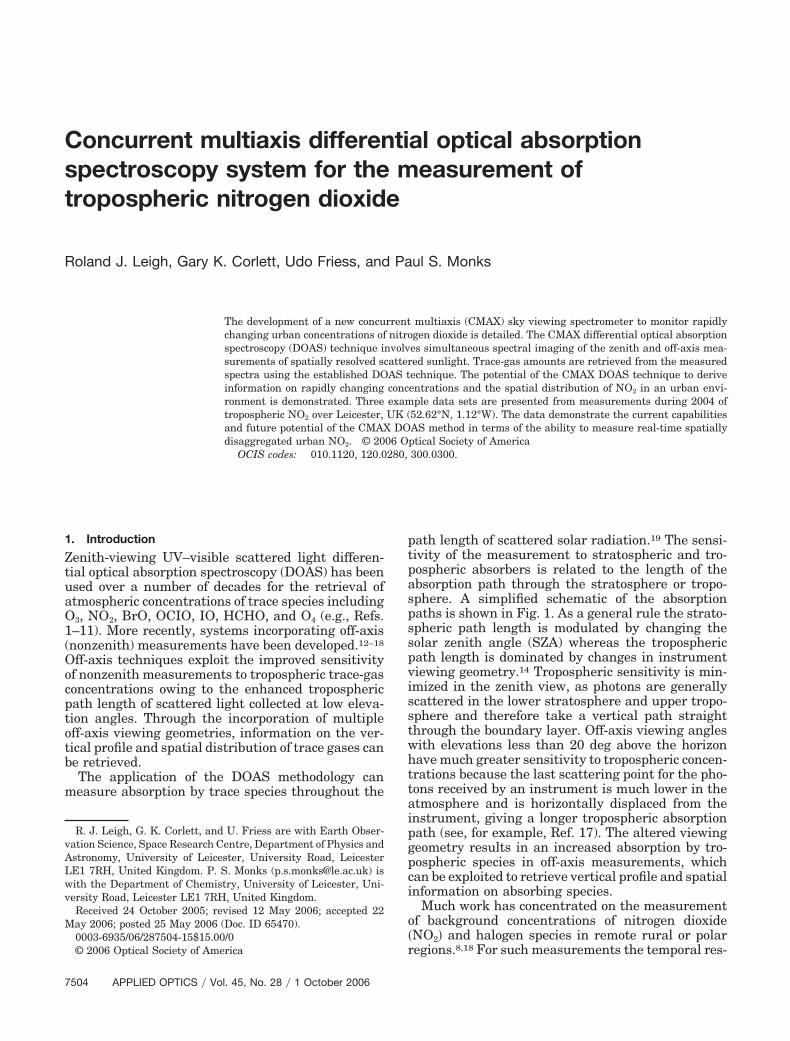
path length of scattered solar radiation.19 The sensi-tivity of the measurement to stratospheric and tro-pospheric absorbers is related to the length of theabsorption path through the stratosphere or tropo-sphere. A simplified schematic of the absorptionpaths is shown in Fig. 1. As a general rule the strato-spheric path length is modulated by changing thesolar zenith angle (SZA) whereas the troposphericpath length is dominated by changes in instrumentviewing geometry.14 Tropospheric sensitivity is min-imized in the zenith view, as photons are generallyscattered in the lower stratosphere and upper tropo-sphere and therefore take a vertical path straightthrough the boundary layer. Off-axis viewing angleswith elevations less than 20 deg above the horizonhave much greater sensitivity to tropospheric concen-trations because the last scattering point for the pho-tons received by an instrument is much lower in theatmosphere and is horizontally displaced from theinstrument, giving a longer tropospheric absorptionpath (see, for example, Ref. 17). The altered viewinggeometry results in an increased absorption by tro-pospheric species in off-axis measurements, whichcan be exploited to retrieve vertical profile and spatialinformation on absorbing species.
Much work has concentrated on the measurementof background concentrations of nitrogen dioxide�NO2� and halogen species in remote rural or polarregions.8,18 For such measurements the temporal res-
R. J. Leigh, G. K. Corlett, and U. Friess are with Earth Obser-vation Science, Space Research Centre, Department of Physics andAstronomy, University of Leicester, University Road, LeicesterLE1 7RH, United Kingdom. P. S. Monks ([email protected]) iswith the Department of Chemistry, University of Leicester, Uni-versity Road, Leicester LE1 7RH, United Kingdom.
Received 24 October 2005; revised 12 May 2006; accepted 22May 2006; posted 25 May 2006 (Doc. ID 65470).
olution of the instrument is not a primary concern asconcentrations are expected to change over timescales of hours or days rather than minutes. As such,consecutive measurements from different viewinggeometries are appropriate with a total scan of allviewing axes taking several minutes. However, foranalysis of rapidly varying and spatially inhomoge-neous concentrations of trace species in the boundarylayer, simultaneous measurement of all viewingangles is highly desirable. A concurrent multiaxis(CMAX) DOAS system has been developed in thiswork to measure five or more viewing geometriessimultaneously and has been tested in urban condi-tions to measure the concentration of boundary-layerNO2.
Elevated concentrations of NO2 have been linkedwith various adverse health effects and are thus sub-ject to a number of European Union directives andtargets.20 Analysis of the localized and varyingsources including vehicular traffic and industry re-quires relatively high time resolution to providemeaningful and useful data in such inhomogeneousair masses. Data are presented to show the poten-tial of CMAX DOAS to retrieve rapidly varyingboundary-layer concentrations of NO2. At present,monitoring of NO2 emissions and concentrations isproblematic, with point measurements includingin situ chemiluminescence detectors providing muchof the available urban data.20 The CMAX DOAStechnique demonstrates the potential to provide asignificant new tool for remote sensing of inhomo-geneous plumes in the urban environment with el-evated NOx concentrations. This paper details theexperimental setup of a CMAX DOAS instrumentand the determination of the performance character-istics.
2. Experiment
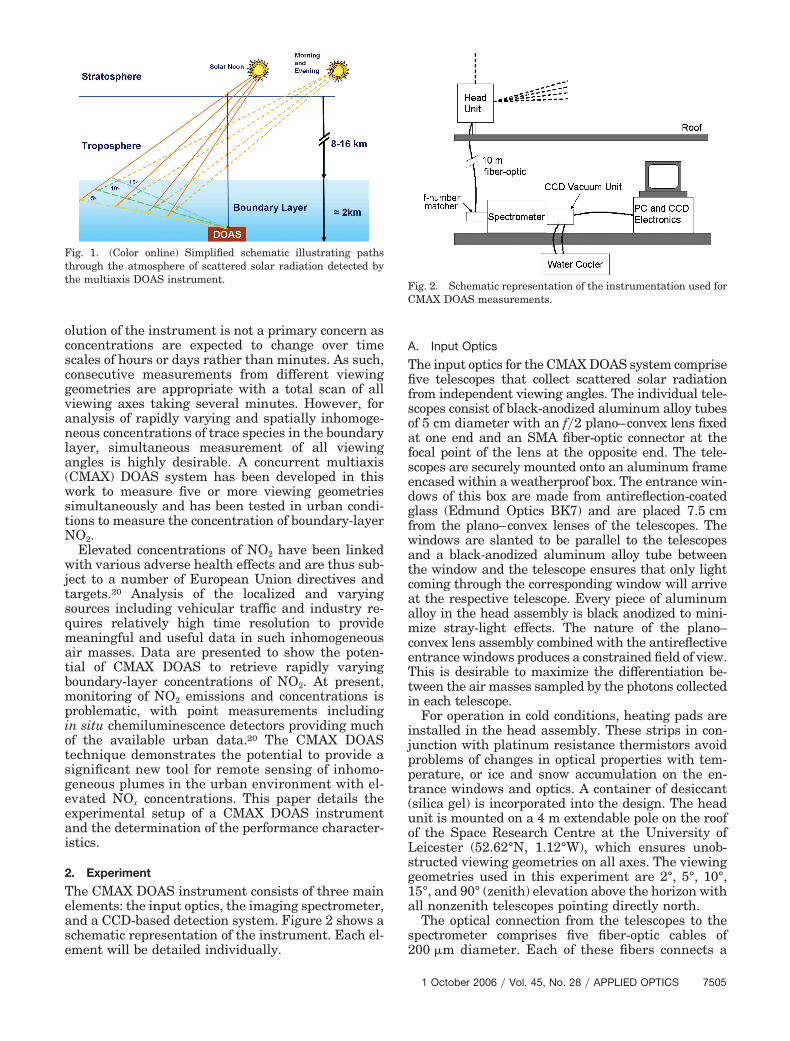
The CMAX DOAS instrument consists of three mainelements: the input optics, the imaging spectrometer,and a CCD-based detection system. Figure 2 shows aschematic representation of the instrument. Each el-ement will be detailed individually.
A. Input Optics
The input optics for the CMAX DOAS system comprisefive telescopes that collect scattered solar radiationfrom independent viewing angles. The individual tele-scopes consist of black-anodized aluminum alloy tubesof 5 cm diameter with an f�2 plano–convex lens fixedat one end and an SMA fiber-optic connector at thefocal point of the lens at the opposite end. The tele-scopes are securely mounted onto an aluminum frameencased within a weatherproof box. The entrance win-dows of this box are made from antireflection-coatedglass (Edmund Optics BK7) and are placed 7.5 cmfrom the plano–convex lenses of the telescopes. Thewindows are slanted to be parallel to the telescopesand a black-anodized aluminum alloy tube betweenthe window and the telescope ensures that only lightcoming through the corresponding window will arriveat the respective telescope. Every piece of aluminumalloy in the head assembly is black anodized to mini-mize stray-light effects. The nature of the plano–convex lens assembly combined with the antireflectiveentrance windows produces a constrained field of view.This is desirable to maximize the differentiation be-tween the air masses sampled by the photons collectedin each telescope.
For operation in cold conditions, heating pads areinstalled in the head assembly. These strips in con-junction with platinum resistance thermistors avoidproblems of changes in optical properties with tem-perature, or ice and snow accumulation on the en-trance windows and optics. A container of desiccant(silica gel) is incorporated into the design. The headunit is mounted on a 4 m extendable pole on the roofof the Space Research Centre at the University ofLeicester (52.62°N, 1.12°W), which ensures unob-structed viewing geometries on all axes. The viewinggeometries used in this experiment are 2°, 5°, 10°,15°, and 90° (zenith) elevation above the horizon withall nonzenith telescopes pointing directly north.
The optical connection from the telescopes to thespectrometer comprises five fiber-optic cables of200 �m diameter. Each of these fibers connects a
Fig. 1. (Color online) Simplified schematic illustrating pathsthrough the atmosphere of scattered solar radiation detected bythe multiaxis DOAS instrument.
Fig. 2. Schematic representation of the instrumentation used forCMAX DOAS measurements.
single telescope to the input of an Oriel multi-track fiber,21 which aligns all fibers into a verticalarray suitable for input into an imaging spectrome-ter.
The telescopes and fused-silica fiber optics used inthis experiment have an exit cone f-number of 2. TheMS257 spectrometer system used in this experimentrequires an entrance cone f-number of 3.9. To main-tain sufficient vertical separation in the imagingspectrometer and to avoid stray light, it is necessaryto adapt the exit cone of the fiber to the requiredentrance cone of the spectrometer. This is achieved bythe use of an f-number matcher21 that alters the focallength of the input cone and refocuses the image ontothe entrance aperture of the spectrometer.
B. Spectrometer and CCD Detector
The instrumental details are summarized in Table1. The Oriel MS257 imaging spectrometer is aCzerny–Turner design with corrected toroidal op-tics for multitrack spectroscopy. The spectrometersystem provides the wavelength dispersion in the xaxis while maintaining the necessary separation ofinput signals in the y axis. The corrected toroidaloptics reduce astigmatism in the focal plane in-creasing the comparability of the resulting signalsfrom different locations on the CCD chip. The grat-ing used for these experiments is an aluminumruled grating with 600 groves mm�1 and a blazewavelength of 400 nm.
The detector is a Marconi 48-20 backilluminated,frame-transfer, UV-coated CCD. The CCD chip has
1033 rows and 1072 columns of pixels each of whichis 13 �m wide by 13 �m high giving a total imagingarea of approximately 13.4 mm � 13.9 mm. The de-tector is housed inside a vacuum unit, with a two-stage Peltier cooler with additional water cooling.The CCD is kept at a constant �21.0 °C � 0.1 °C tominimize the dark-current signal and detector noise.The frame-transfer ability permits the CCD imagesto be captured without the use of a shutter mecha-nism.
The f-number matcher, spectrometer, and CCDcamera assembly are housed inside an insulatedsealed box in an air-conditioned laboratory, whichstabilizes the temperature inside the box to 19 °C� 0.2 °C.
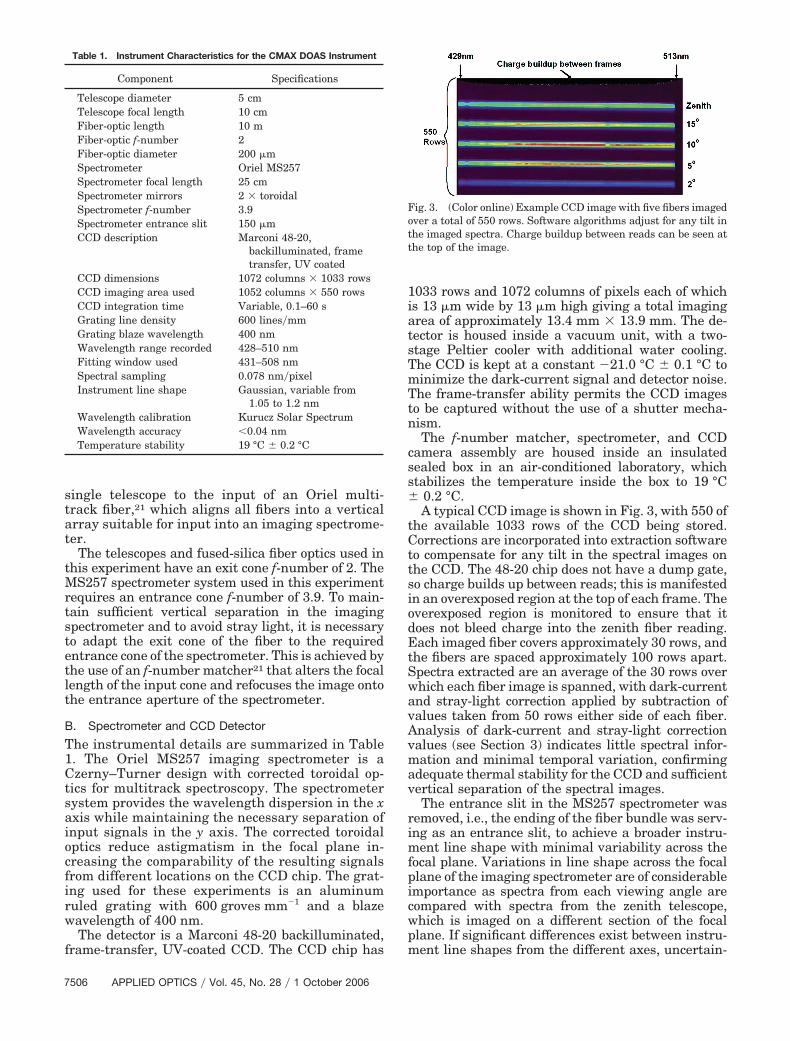
A typical CCD image is shown in Fig. 3, with 550 ofthe available 1033 rows of the CCD being stored.Corrections are incorporated into extraction softwareto compensate for any tilt in the spectral images onthe CCD. The 48-20 chip does not have a dump gate,so charge builds up between reads; this is manifestedin an overexposed region at the top of each frame. Theoverexposed region is monitored to ensure that itdoes not bleed charge into the zenith fiber reading.Each imaged fiber covers approximately 30 rows, andthe fibers are spaced approximately 100 rows apart.Spectra extracted are an average of the 30 rows overwhich each fiber image is spanned, with dark-currentand stray-light correction applied by subtraction ofvalues taken from 50 rows either side of each fiber.Analysis of dark-current and stray-light correctionvalues (see Section 3) indicates little spectral infor-mation and minimal temporal variation, confirmingadequate thermal stability for the CCD and sufficientvertical separation of the spectral images.
The entrance slit in the MS257 spectrometer wasremoved, i.e., the ending of the fiber bundle was serv-ing as an entrance slit, to achieve a broader instru-ment line shape with minimal variability across thefocal plane. Variations in line shape across the focalplane of the imaging spectrometer are of considerableimportance as spectra from each viewing angle arecompared with spectra from the zenith telescope,which is imaged on a different section of the focalplane. If significant differences exist between instru-ment line shapes from the different axes, uncertain-
Table 1. Instrument Characteristics for the CMAX DOAS Instrument
CCD dimensions 1072 columns � 1033 rowsCCD imaging area used 1052 columns � 550 rowsCCD integration time Variable, 0.1–60 sGrating line density 600 lines�mmGrating blaze wavelength 400 nmWavelength range recorded 428–510 nmFitting window used 431–508 nmSpectral sampling 0.078 nm�pixelInstrument line shape Gaussian, variable from
1.05 to 1.2 nmWavelength calibration Kurucz Solar SpectrumWavelength accuracy �0.04 nmTemperature stability 19 °C � 0.2 °C
Fig. 3. (Color online) Example CCD image with five fibers imagedover a total of 550 rows. Software algorithms adjust for any tilt inthe imaged spectra. Charge buildup between reads can be seen atthe top of the image.
ties are introduced into the DOAS retrieval. With theentrance slit removed, the end of the multitrack fiberis the effective entrance aperture of the instrument,focused at the focal point of the spectrometer by thef-number matcher.
C. Image Analysis and Spectral Fitting
The DOAS technique19 is based on the application ofthe Beer–Lambert law, which describes the absorp-tion of radiation at a given wavelength � by i gaseousspecies of concentration �i and absorption cross sec-tion of �i���:
I��� � I0���exp���i�
0
L
�i����ids� . (1)
A measure of the total absorbance along a pathlength L from i absorbers is therefore given by
ln�I0���I��� �� �
i�
0
L
�i����ids. (2)
In atmospheric DOAS, the term I0 is the intensityof the reference spectrum taken at solar noon, whichtakes the shortest path through the atmosphere. Theterm I is the intensity of a spectrum taken at anyother time (object spectrum), which takes a longerpath through the atmosphere and is therefore subjectto increased absorption throughout the extra pathlength. However, absorption by trace species is notthe only influence on solar intensity in the atmo-sphere. Scattering and absorption processes from airmolecules, cloud droplets, and aerosols also attenuateincoming radiation. The effects of most scattering canbe removed through the fitting of an appropriatepolynomial that removes the broadband structure inthe resulting differential spectrum �I0����I���.
Narrowband features are also introduced owing tochanges in the shape of Fraunhofer structures be-tween I0 and I as a result of rotational Raman scat-tering.22 Such features can be removed through theinclusion of a synthetic Ring spectrum in the fittingprocess.11 By simultaneously fitting all absorptioncross sections of known absorbers, plus the polyno-mial parameters and Ring spectrum, it is possible to
derive a differential slant column density for a givenabsorber, being the integrated concentration over theadditional photon path length through the atmo-sphere in the object spectrum relative to the referencespectrum.
Spectra are analyzed in this work with the WinDOASsoftware package.23 Instrument calibration is per-formed using WinDOAS, including the instrumentline-shape measurement and an accurate wavelengthcalibration. The measured instrument line shape isused to create the simulated Ring spectrum. All fittedcross sections are also convolved with the measuredwavelength-dependent instrument line shape usingthe WinDOAS software.
Additionally, dark-current corrections were per-formed with an independent wavelength calibrationfor each fiber through a least-squares fitting routineusing the Kurucz solar spectrum24 to compensate forwavelength shifts between spectra from differentviewing geometries.
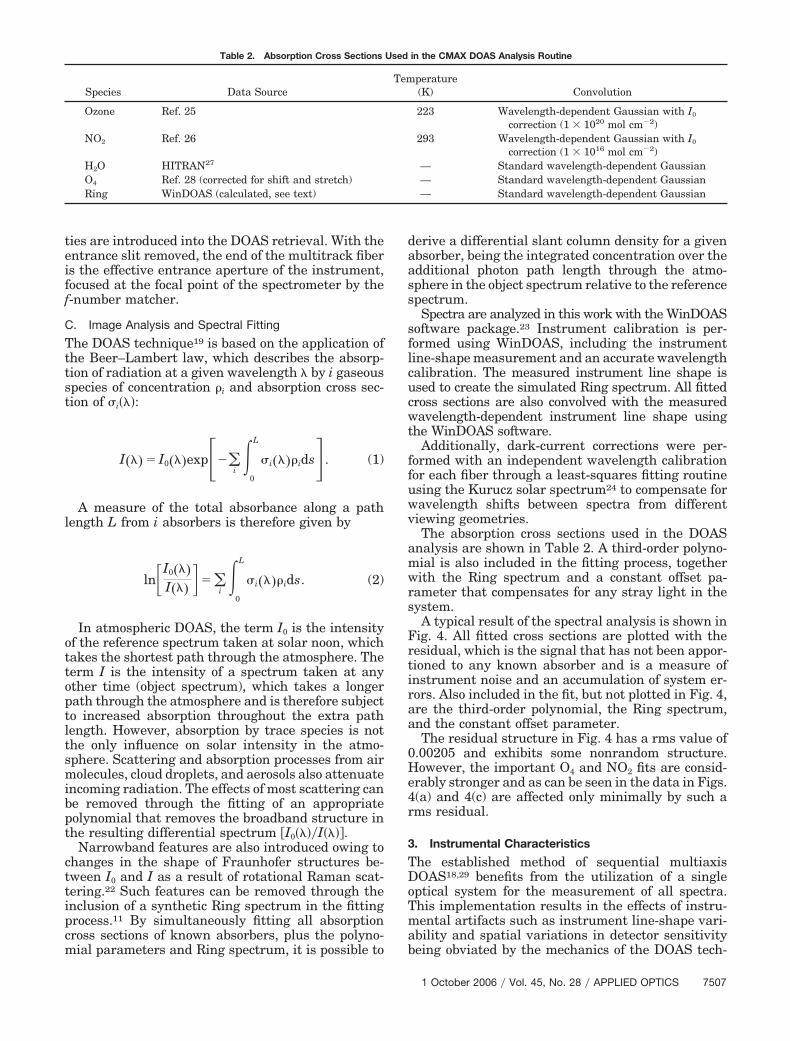
The absorption cross sections used in the DOASanalysis are shown in Table 2. A third-order polyno-mial is also included in the fitting process, togetherwith the Ring spectrum and a constant offset pa-rameter that compensates for any stray light in thesystem.
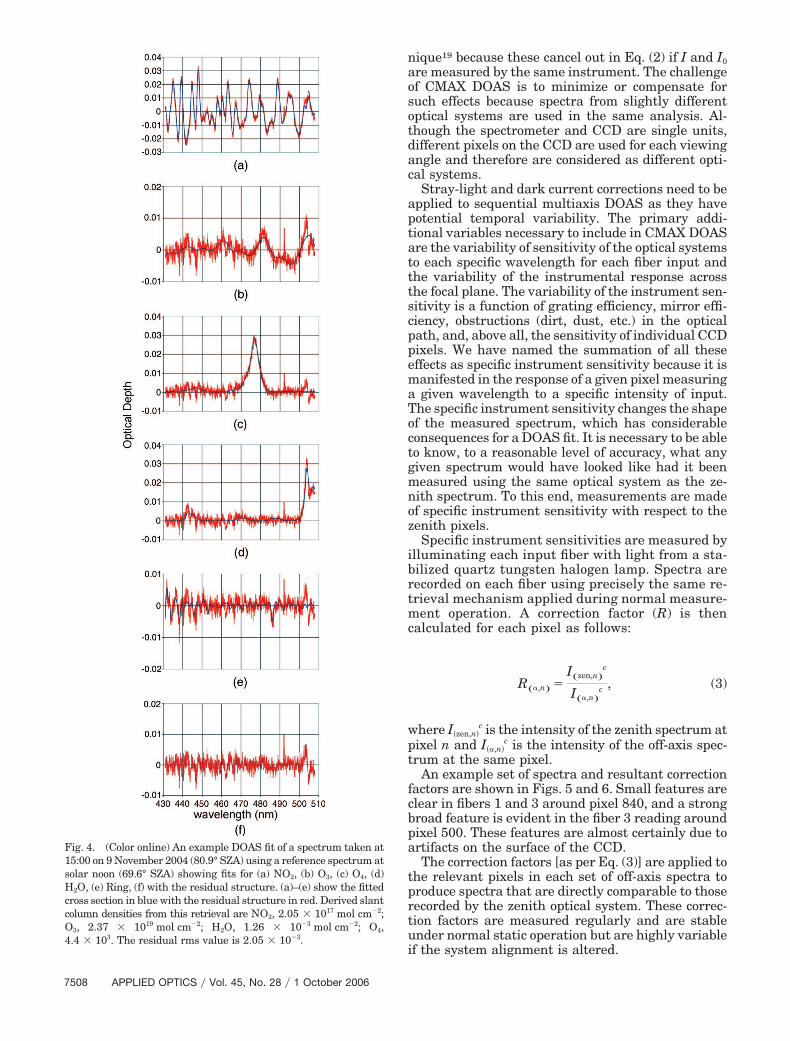
A typical result of the spectral analysis is shown inFig. 4. All fitted cross sections are plotted with theresidual, which is the signal that has not been appor-tioned to any known absorber and is a measure ofinstrument noise and an accumulation of system er-rors. Also included in the fit, but not plotted in Fig. 4,are the third-order polynomial, the Ring spectrum,and the constant offset parameter.
The residual structure in Fig. 4 has a rms value of0.00205 and exhibits some nonrandom structure.However, the important O4 and NO2 fits are consid-erably stronger and as can be seen in the data in Figs.4(a) and 4(c) are affected only minimally by such arms residual.
3. Instrumental Characteristics
The established method of sequential multiaxisDOAS18,29 benefits from the utilization of a singleoptical system for the measurement of all spectra.This implementation results in the effects of instru-mental artifacts such as instrument line-shape vari-ability and spatial variations in detector sensitivitybeing obviated by the mechanics of the DOAS tech-
Table 2. Absorption Cross Sections Used in the CMAX DOAS Analysis Routine
Species Data SourceTemperature
(K) Convolution
Ozone Ref. 25 223 Wavelength-dependent Gaussian with I0
correction (1 � 1016 mol cm�2)H2O HITRAN27 — Standard wavelength-dependent GaussianO4 Ref. 28 (corrected for shift and stretch) — Standard wavelength-dependent GaussianRing WinDOAS (calculated, see text) — Standard wavelength-dependent Gaussian
nique19 because these cancel out in Eq. (2) if I and I0are measured by the same instrument. The challengeof CMAX DOAS is to minimize or compensate forsuch effects because spectra from slightly differentoptical systems are used in the same analysis. Al-though the spectrometer and CCD are single units,different pixels on the CCD are used for each viewingangle and therefore are considered as different opti-cal systems.
Stray-light and dark current corrections need to beapplied to sequential multiaxis DOAS as they havepotential temporal variability. The primary addi-tional variables necessary to include in CMAX DOASare the variability of sensitivity of the optical systemsto each specific wavelength for each fiber input andthe variability of the instrumental response acrossthe focal plane. The variability of the instrument sen-sitivity is a function of grating efficiency, mirror effi-ciency, obstructions (dirt, dust, etc.) in the opticalpath, and, above all, the sensitivity of individual CCDpixels. We have named the summation of all theseeffects as specific instrument sensitivity because it ismanifested in the response of a given pixel measuringa given wavelength to a specific intensity of input.The specific instrument sensitivity changes the shapeof the measured spectrum, which has considerableconsequences for a DOAS fit. It is necessary to be ableto know, to a reasonable level of accuracy, what anygiven spectrum would have looked like had it beenmeasured using the same optical system as the ze-nith spectrum. To this end, measurements are madeof specific instrument sensitivity with respect to thezenith pixels.
Specific instrument sensitivities are measured byilluminating each input fiber with light from a sta-bilized quartz tungsten halogen lamp. Spectra arerecorded on each fiber using precisely the same re-trieval mechanism applied during normal measure-ment operation. A correction factor (R) is thencalculated for each pixel as follows:
R�,n� �I�zen,n�
c
I�,n�c , (3)
where I�zen,n�c is the intensity of the zenith spectrum at
pixel n and I�,n�c is the intensity of the off-axis spec-
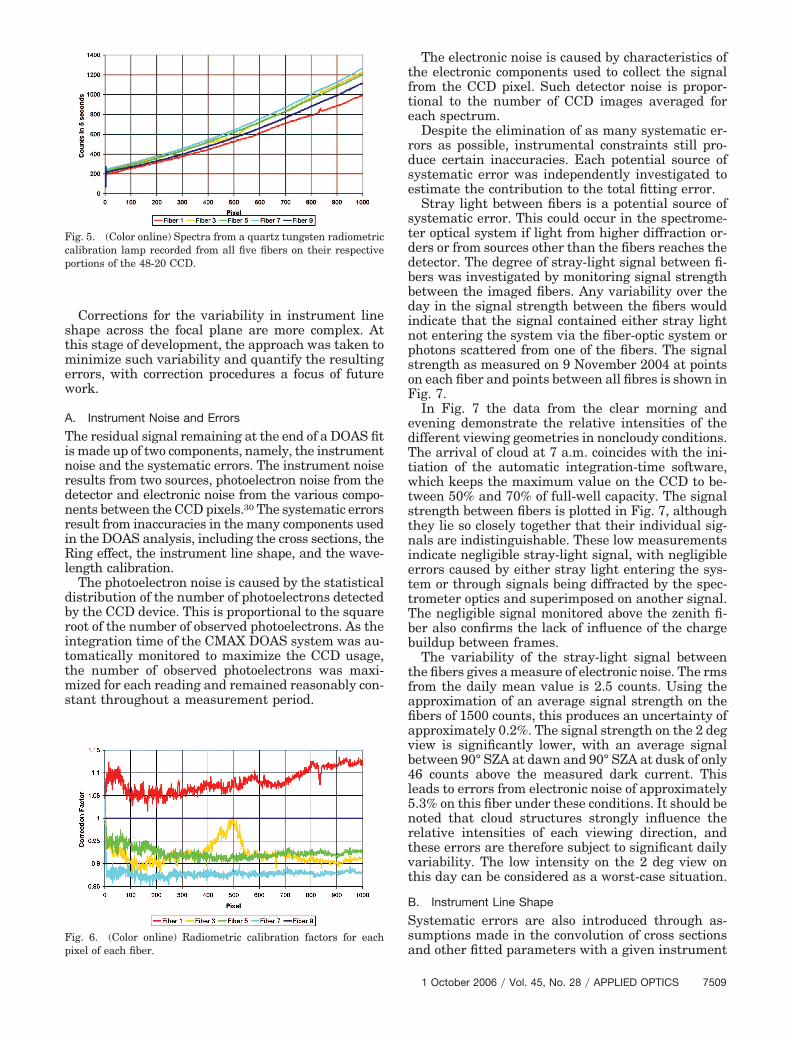
trum at the same pixel.An example set of spectra and resultant correction
factors are shown in Figs. 5 and 6. Small features areclear in fibers 1 and 3 around pixel 840, and a strongbroad feature is evident in the fiber 3 reading aroundpixel 500. These features are almost certainly due toartifacts on the surface of the CCD.
The correction factors [as per Eq. (3)] are applied tothe relevant pixels in each set of off-axis spectra toproduce spectra that are directly comparable to thoserecorded by the zenith optical system. These correc-tion factors are measured regularly and are stableunder normal static operation but are highly variableif the system alignment is altered.
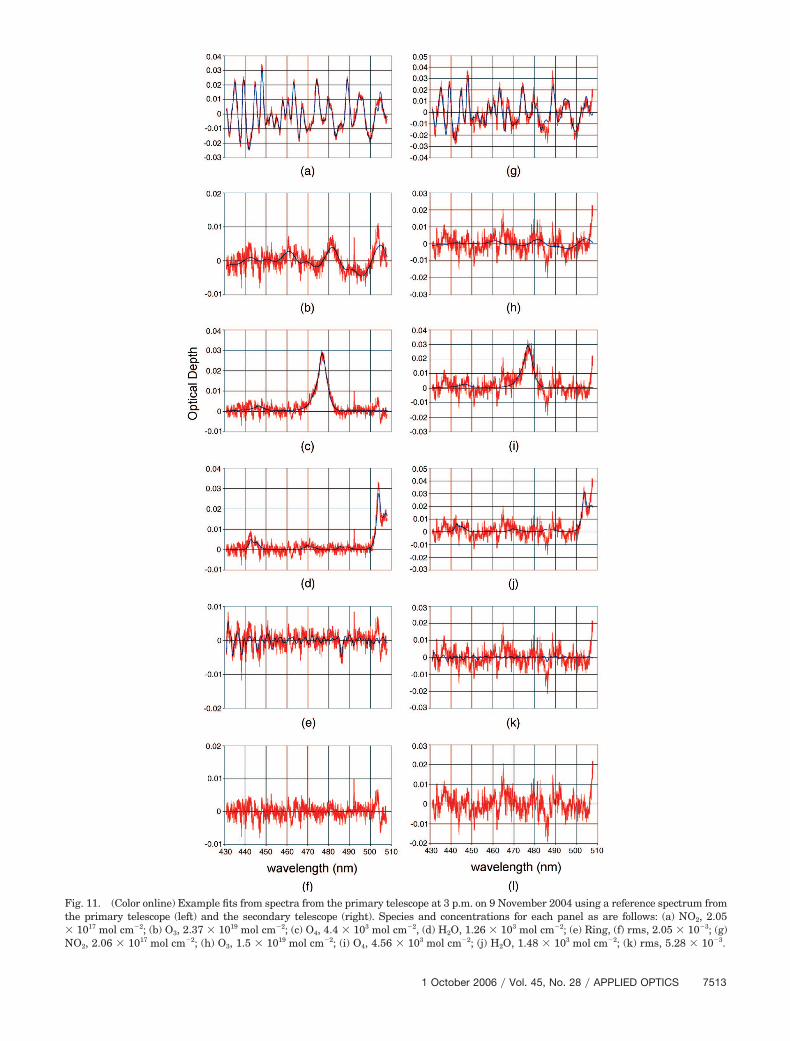
Fig. 4. (Color online) An example DOAS fit of a spectrum taken at15:00 on 9 November 2004 (80.9° SZA) using a reference spectrum atsolar noon (69.6° SZA) showing fits for (a) NO2, (b) O3, (c) O4, (d)H2O, (e) Ring, (f) with the residual structure. (a)–(e) show the fittedcross section in blue with the residual structure in red. Derived slantcolumn densities from this retrieval are NO2, 2.05 � 1017 mol cm�2;O3, 2.37 � 1019 mol cm�2; H2O, 1.26 � 10�3 mol cm�2; O4,4.4 � 103. The residual rms value is 2.05 � 10�3.
Corrections for the variability in instrument lineshape across the focal plane are more complex. Atthis stage of development, the approach was taken tominimize such variability and quantify the resultingerrors, with correction procedures a focus of futurework.
A. Instrument Noise and Errors
The residual signal remaining at the end of a DOAS fitis made up of two components, namely, the instrumentnoise and the systematic errors. The instrument noiseresults from two sources, photoelectron noise from thedetector and electronic noise from the various compo-nents between the CCD pixels.30 The systematic errorsresult from inaccuracies in the many components usedin the DOAS analysis, including the cross sections, theRing effect, the instrument line shape, and the wave-length calibration.
The photoelectron noise is caused by the statisticaldistribution of the number of photoelectrons detectedby the CCD device. This is proportional to the squareroot of the number of observed photoelectrons. As theintegration time of the CMAX DOAS system was au-tomatically monitored to maximize the CCD usage,the number of observed photoelectrons was maxi-mized for each reading and remained reasonably con-stant throughout a measurement period.
The electronic noise is caused by characteristics ofthe electronic components used to collect the signalfrom the CCD pixel. Such detector noise is propor-tional to the number of CCD images averaged foreach spectrum.
Despite the elimination of as many systematic er-rors as possible, instrumental constraints still pro-duce certain inaccuracies. Each potential source ofsystematic error was independently investigated toestimate the contribution to the total fitting error.
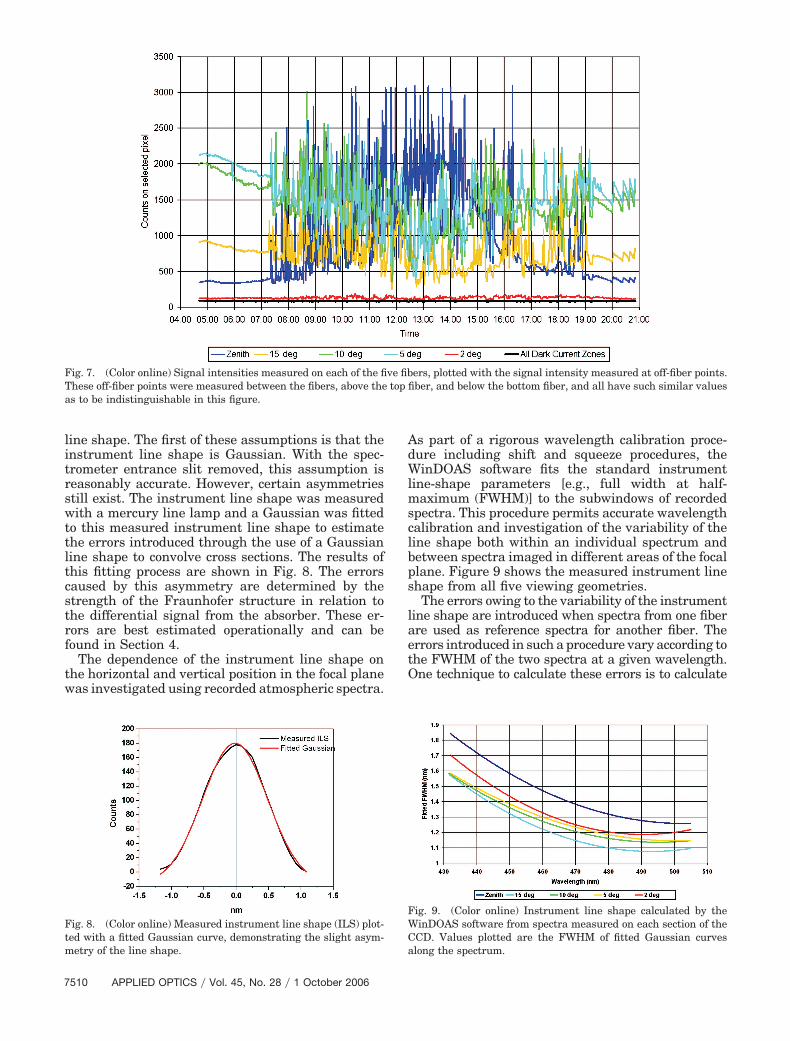
Stray light between fibers is a potential source ofsystematic error. This could occur in the spectrome-ter optical system if light from higher diffraction or-ders or from sources other than the fibers reaches thedetector. The degree of stray-light signal between fi-bers was investigated by monitoring signal strengthbetween the imaged fibers. Any variability over theday in the signal strength between the fibers wouldindicate that the signal contained either stray lightnot entering the system via the fiber-optic system orphotons scattered from one of the fibers. The signalstrength as measured on 9 November 2004 at pointson each fiber and points between all fibres is shown inFig. 7.
In Fig. 7 the data from the clear morning andevening demonstrate the relative intensities of thedifferent viewing geometries in noncloudy conditions.The arrival of cloud at 7 a.m. coincides with the ini-tiation of the automatic integration-time software,which keeps the maximum value on the CCD to be-tween 50% and 70% of full-well capacity. The signalstrength between fibers is plotted in Fig. 7, althoughthey lie so closely together that their individual sig-nals are indistinguishable. These low measurementsindicate negligible stray-light signal, with negligibleerrors caused by either stray light entering the sys-tem or through signals being diffracted by the spec-trometer optics and superimposed on another signal.The negligible signal monitored above the zenith fi-ber also confirms the lack of influence of the chargebuildup between frames.
The variability of the stray-light signal betweenthe fibers gives a measure of electronic noise. The rmsfrom the daily mean value is 2.5 counts. Using theapproximation of an average signal strength on thefibers of 1500 counts, this produces an uncertainty ofapproximately 0.2%. The signal strength on the 2 degview is significantly lower, with an average signalbetween 90° SZA at dawn and 90° SZA at dusk of only46 counts above the measured dark current. Thisleads to errors from electronic noise of approximately5.3% on this fiber under these conditions. It should benoted that cloud structures strongly influence therelative intensities of each viewing direction, andthese errors are therefore subject to significant dailyvariability. The low intensity on the 2 deg view onthis day can be considered as a worst-case situation.
B. Instrument Line Shape
Systematic errors are also introduced through as-sumptions made in the convolution of cross sectionsand other fitted parameters with a given instrument
Fig. 5. (Color online) Spectra from a quartz tungsten radiometriccalibration lamp recorded from all five fibers on their respectiveportions of the 48-20 CCD.
Fig. 6. (Color online) Radiometric calibration factors for eachpixel of each fiber.
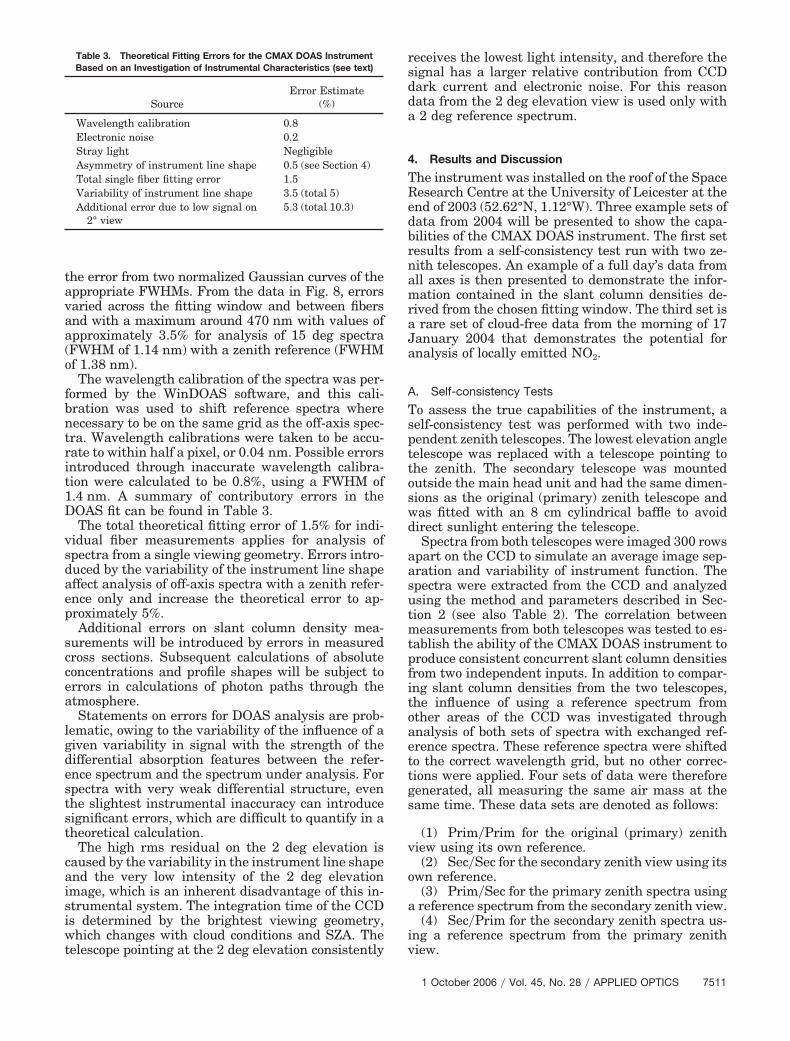
line shape. The first of these assumptions is that theinstrument line shape is Gaussian. With the spec-trometer entrance slit removed, this assumption isreasonably accurate. However, certain asymmetriesstill exist. The instrument line shape was measuredwith a mercury line lamp and a Gaussian was fittedto this measured instrument line shape to estimatethe errors introduced through the use of a Gaussianline shape to convolve cross sections. The results ofthis fitting process are shown in Fig. 8. The errorscaused by this asymmetry are determined by thestrength of the Fraunhofer structure in relation tothe differential signal from the absorber. These er-rors are best estimated operationally and can befound in Section 4.
The dependence of the instrument line shape onthe horizontal and vertical position in the focal planewas investigated using recorded atmospheric spectra.
As part of a rigorous wavelength calibration proce-dure including shift and squeeze procedures, theWinDOAS software fits the standard instrumentline-shape parameters [e.g., full width at half-maximum (FWHM)] to the subwindows of recordedspectra. This procedure permits accurate wavelengthcalibration and investigation of the variability of theline shape both within an individual spectrum andbetween spectra imaged in different areas of the focalplane. Figure 9 shows the measured instrument lineshape from all five viewing geometries.
The errors owing to the variability of the instrumentline shape are introduced when spectra from one fiberare used as reference spectra for another fiber. Theerrors introduced in such a procedure vary according tothe FWHM of the two spectra at a given wavelength.One technique to calculate these errors is to calculate
Fig. 7. (Color online) Signal intensities measured on each of the five fibers, plotted with the signal intensity measured at off-fiber points.These off-fiber points were measured between the fibers, above the top fiber, and below the bottom fiber, and all have such similar valuesas to be indistinguishable in this figure.
Fig. 8. (Color online) Measured instrument line shape (ILS) plot-ted with a fitted Gaussian curve, demonstrating the slight asym-metry of the line shape.
Fig. 9. (Color online) Instrument line shape calculated by theWinDOAS software from spectra measured on each section of theCCD. Values plotted are the FWHM of fitted Gaussian curvesalong the spectrum.
the error from two normalized Gaussian curves of theappropriate FWHMs. From the data in Fig. 8, errorsvaried across the fitting window and between fibersand with a maximum around 470 nm with values ofapproximately 3.5% for analysis of 15 deg spectra(FWHM of 1.14 nm) with a zenith reference (FWHMof 1.38 nm).
The wavelength calibration of the spectra was per-formed by the WinDOAS software, and this cali-bration was used to shift reference spectra wherenecessary to be on the same grid as the off-axis spec-tra. Wavelength calibrations were taken to be accu-rate to within half a pixel, or 0.04 nm. Possible errorsintroduced through inaccurate wavelength calibra-tion were calculated to be 0.8%, using a FWHM of1.4 nm. A summary of contributory errors in theDOAS fit can be found in Table 3.
The total theoretical fitting error of 1.5% for indi-vidual fiber measurements applies for analysis ofspectra from a single viewing geometry. Errors intro-duced by the variability of the instrument line shapeaffect analysis of off-axis spectra with a zenith refer-ence only and increase the theoretical error to ap-proximately 5%.
Additional errors on slant column density mea-surements will be introduced by errors in measuredcross sections. Subsequent calculations of absoluteconcentrations and profile shapes will be subject toerrors in calculations of photon paths through theatmosphere.
Statements on errors for DOAS analysis are prob-lematic, owing to the variability of the influence of agiven variability in signal with the strength of thedifferential absorption features between the refer-ence spectrum and the spectrum under analysis. Forspectra with very weak differential structure, eventhe slightest instrumental inaccuracy can introducesignificant errors, which are difficult to quantify in atheoretical calculation.
The high rms residual on the 2 deg elevation iscaused by the variability in the instrument line shapeand the very low intensity of the 2 deg elevationimage, which is an inherent disadvantage of this in-strumental system. The integration time of the CCDis determined by the brightest viewing geometry,which changes with cloud conditions and SZA. Thetelescope pointing at the 2 deg elevation consistently
receives the lowest light intensity, and therefore thesignal has a larger relative contribution from CCDdark current and electronic noise. For this reasondata from the 2 deg elevation view is used only witha 2 deg reference spectrum.
4. Results and Discussion
The instrument was installed on the roof of the SpaceResearch Centre at the University of Leicester at theend of 2003 (52.62°N, 1.12°W). Three example sets ofdata from 2004 will be presented to show the capa-bilities of the CMAX DOAS instrument. The first setresults from a self-consistency test run with two ze-nith telescopes. An example of a full day’s data fromall axes is then presented to demonstrate the infor-mation contained in the slant column densities de-rived from the chosen fitting window. The third set isa rare set of cloud-free data from the morning of 17January 2004 that demonstrates the potential foranalysis of locally emitted NO2.
A. Self-consistency Tests
To assess the true capabilities of the instrument, aself-consistency test was performed with two inde-pendent zenith telescopes. The lowest elevation angletelescope was replaced with a telescope pointing tothe zenith. The secondary telescope was mountedoutside the main head unit and had the same dimen-sions as the original (primary) zenith telescope andwas fitted with an 8 cm cylindrical baffle to avoiddirect sunlight entering the telescope.
Spectra from both telescopes were imaged 300 rowsapart on the CCD to simulate an average image sep-aration and variability of instrument function. Thespectra were extracted from the CCD and analyzedusing the method and parameters described in Sec-tion 2 (see also Table 2). The correlation betweenmeasurements from both telescopes was tested to es-tablish the ability of the CMAX DOAS instrument toproduce consistent concurrent slant column densitiesfrom two independent inputs. In addition to compar-ing slant column densities from the two telescopes,the influence of using a reference spectrum fromother areas of the CCD was investigated throughanalysis of both sets of spectra with exchanged ref-erence spectra. These reference spectra were shiftedto the correct wavelength grid, but no other correc-tions were applied. Four sets of data were thereforegenerated, all measuring the same air mass at thesame time. These data sets are denoted as follows:
(1) Prim�Prim for the original (primary) zenithview using its own reference.
(2) Sec�Sec for the secondary zenith view using itsown reference.
(3) Prim�Sec for the primary zenith spectra usinga reference spectrum from the secondary zenith view.
(4) Sec�Prim for the secondary zenith spectra us-ing a reference spectrum from the primary zenithview.
Table 3. Theoretical Fitting Errors for the CMAX DOAS InstrumentBased on an Investigation of Instrumental Characteristics (see text)
SourceError Estimate
(%)
Wavelength calibration 0.8Electronic noise 0.2Stray light NegligibleAsymmetry of instrument line shape 0.5 (see Section 4)Total single fiber fitting error 1.5Variability of instrument line shape 3.5 (total 5)Additional error due to low signal on
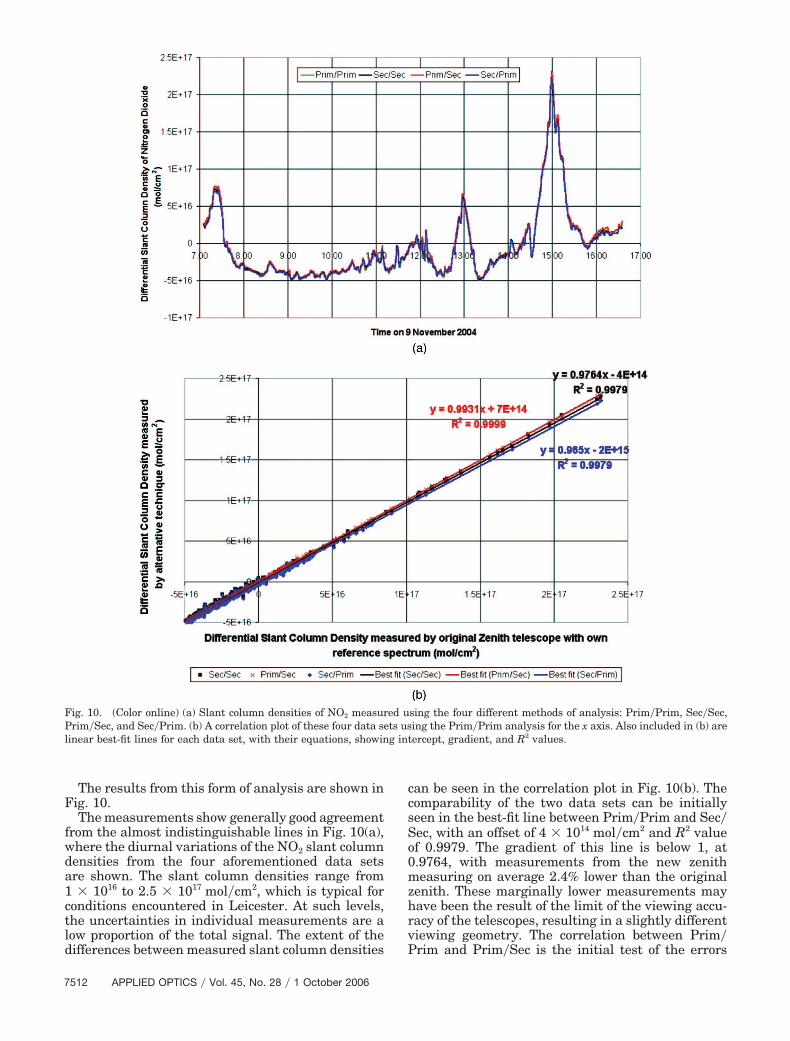
The results from this form of analysis are shown inFig. 10.
The measurements show generally good agreementfrom the almost indistinguishable lines in Fig. 10(a),where the diurnal variations of the NO2 slant columndensities from the four aforementioned data setsare shown. The slant column densities range from1 � 1016 to 2.5 � 1017 mol�cm2, which is typical forconditions encountered in Leicester. At such levels,the uncertainties in individual measurements are alow proportion of the total signal. The extent of thedifferences between measured slant column densities
can be seen in the correlation plot in Fig. 10(b). Thecomparability of the two data sets can be initiallyseen in the best-fit line between Prim�Prim and Sec�Sec, with an offset of 4 � 1014 mol�cm2 and R2 valueof 0.9979. The gradient of this line is below 1, at0.9764, with measurements from the new zenithmeasuring on average 2.4% lower than the originalzenith. These marginally lower measurements mayhave been the result of the limit of the viewing accu-racy of the telescopes, resulting in a slightly differentviewing geometry. The correlation between Prim�Prim and Prim�Sec is the initial test of the errors
Fig. 10. (Color online) (a) Slant column densities of NO2 measured using the four different methods of analysis: Prim�Prim, Sec�Sec,Prim�Sec, and Sec�Prim. (b) A correlation plot of these four data sets using the Prim�Prim analysis for the x axis. Also included in (b) arelinear best-fit lines for each data set, with their equations, showing intercept, gradient, and R2 values.
introduced through the use of an alternative refer-ence spectrum from another section of the CCD. Theagreement within less than 0.7%, with an offset of7 � 1014 mol�cm2 and an R2 value of 0.9999, indicatesthat the difference in instrument function betweenthese two fibers has introduced only very minimalerrors to the DOAS system.
An example fit from the Prim�Prim and Prim�Secanalyses is shown in Fig. 11 to demonstrate the ad-ditional residual structure introduced through suchan analysis and the robust nature of the DOAS fitting
technique to derive accurate concentrations for astrong absorber such as NO2.
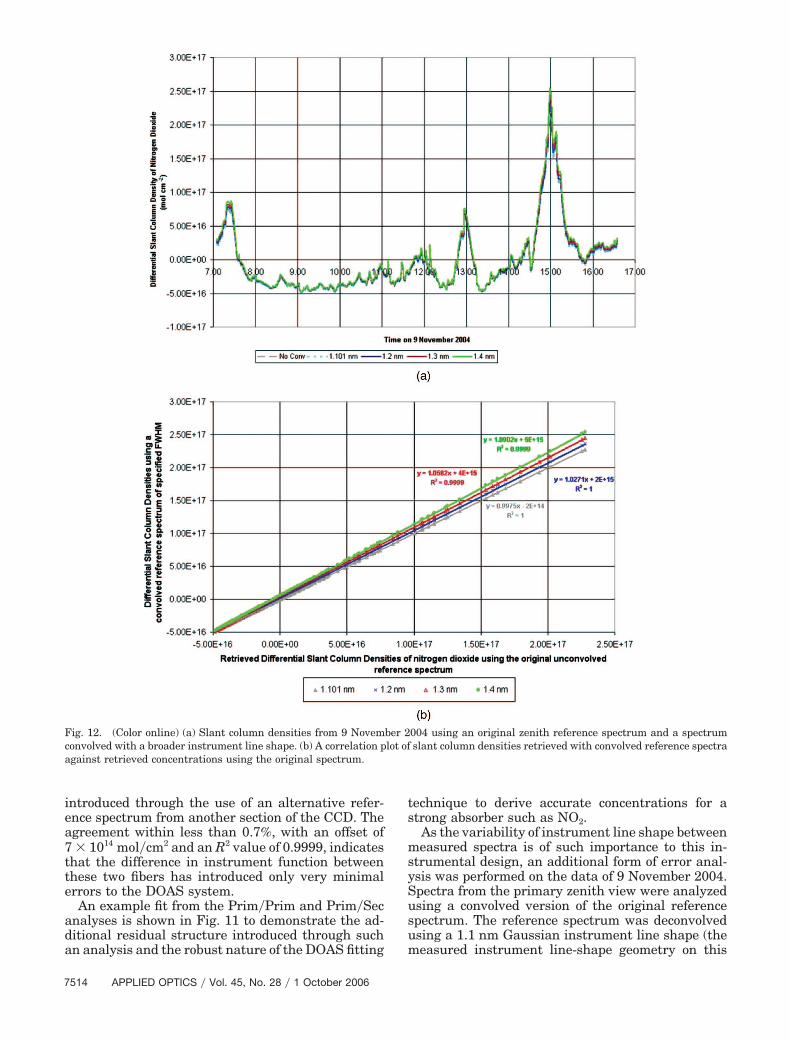
As the variability of instrument line shape betweenmeasured spectra is of such importance to this in-strumental design, an additional form of error anal-ysis was performed on the data of 9 November 2004.Spectra from the primary zenith view were analyzedusing a convolved version of the original referencespectrum. The reference spectrum was deconvolvedusing a 1.1 nm Gaussian instrument line shape (themeasured instrument line-shape geometry on this
Fig. 12. (Color online) (a) Slant column densities from 9 November 2004 using an original zenith reference spectrum and a spectrumconvolved with a broader instrument line shape. (b) A correlation plot of slant column densities retrieved with convolved reference spectraagainst retrieved concentrations using the original spectrum.
day) and was reconvolved with line shapes of 1.101,1.2, 1.3, and 1.4 nm Gaussians. The initial 1.101data set tests the accuracy of the analysis techniqueincluding the deconvolution and reconvolution rou-tines, and calculates the uncertainty due to the asym-metry of the instrument line shape. The 1.2–1.4 nmdata sets cover the range of instrument line shapespresent in the CMAX DOAS configuration. Resultsfrom this analysis are shown in Fig. 12.
The data set using a 1.101 nm Gaussian instru-ment line shape confirms the suitability of the anal-ysis, with negligible errors introduced in theadditional processing steps. The slope of 0.9975, withan offset of �2 � 1014 mol cm�2, also indicates mini-mal errors resulting from asymmetry of the instru-ment line shape of the measured spectra. Such errorsfor this instrument can be estimated at below 0.5%.The data sets for 1.2–1.4 nm instrument line shapesdisplay little additional random errors, but do havesignificant offsets and biases, evident from thebest-fit equations in the correlation plot in Fig. 12(b).Such systematic errors are likely to be due to theconvolution of fitted cross sections with the instru-ment line shape of the reference spectrum, which isthe form of analysis performed under normal operat-ing conditions. Even at extreme cases of a 1.1 nmspectrum being analyzed using a 1.4 nm referencespectrum, the error introduced is less than 10% andunder normal circumstances is nearer to 5%.
B. Example Measurements
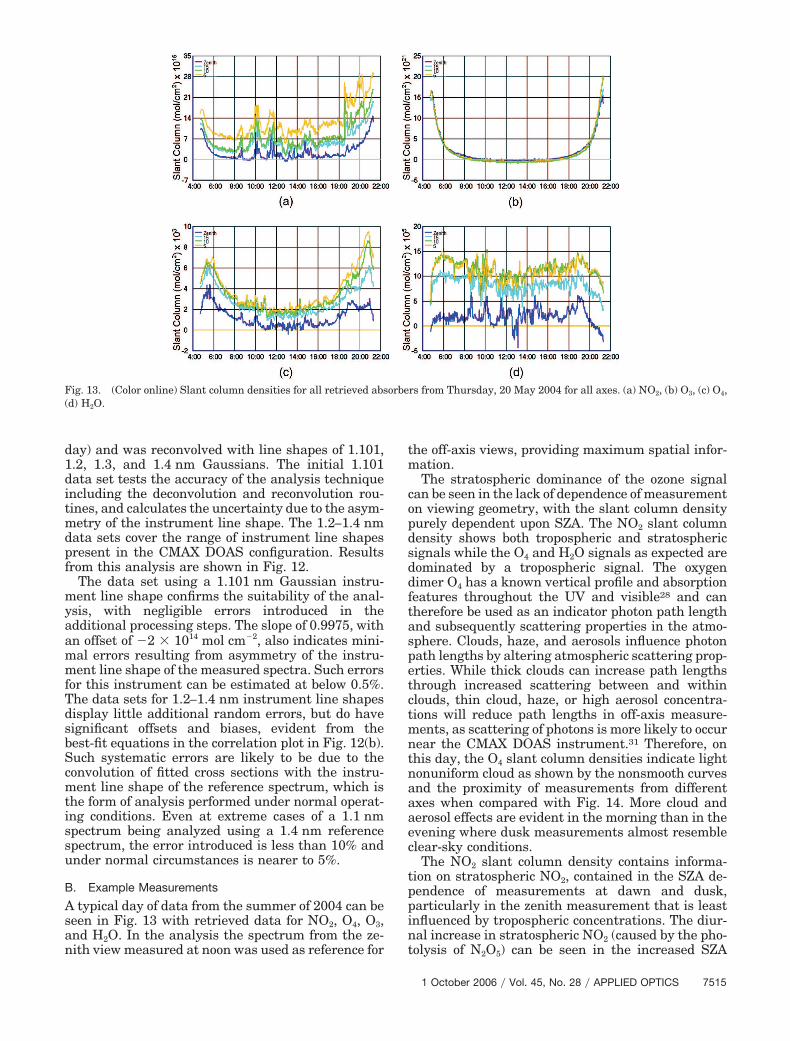
A typical day of data from the summer of 2004 can beseen in Fig. 13 with retrieved data for NO2, O4, O3,and H2O. In the analysis the spectrum from the ze-nith view measured at noon was used as reference for
the off-axis views, providing maximum spatial infor-mation.
The stratospheric dominance of the ozone signalcan be seen in the lack of dependence of measurementon viewing geometry, with the slant column densitypurely dependent upon SZA. The NO2 slant columndensity shows both tropospheric and stratosphericsignals while the O4 and H2O signals as expected aredominated by a tropospheric signal. The oxygendimer O4 has a known vertical profile and absorptionfeatures throughout the UV and visible28 and cantherefore be used as an indicator photon path lengthand subsequently scattering properties in the atmo-sphere. Clouds, haze, and aerosols influence photonpath lengths by altering atmospheric scattering prop-erties. While thick clouds can increase path lengthsthrough increased scattering between and withinclouds, thin cloud, haze, or high aerosol concentra-tions will reduce path lengths in off-axis measure-ments, as scattering of photons is more likely to occurnear the CMAX DOAS instrument.31 Therefore, onthis day, the O4 slant column densities indicate lightnonuniform cloud as shown by the nonsmooth curvesand the proximity of measurements from differentaxes when compared with Fig. 14. More cloud andaerosol effects are evident in the morning than in theevening where dusk measurements almost resembleclear-sky conditions.
The NO2 slant column density contains informa-tion on stratospheric NO2, contained in the SZA de-pendence of measurements at dawn and dusk,particularly in the zenith measurement that is leastinfluenced by tropospheric concentrations. The diur-nal increase in stratospheric NO2 (caused by the pho-tolysis of N2O5) can be seen in the increased SZA
Fig. 13. (Color online) Slant column densities for all retrieved absorbers from Thursday, 20 May 2004 for all axes. (a) NO2, (b) O3, (c) O4,(d) H2O.
dependence in the dusk measurements over dawn. Inaddition, tropospheric concentrations are clearly ev-ident in the separation of the off-axis signals andshort temporal features. The most significant fea-tures that do not coincide with cloud events are atapproximately 12 noon and 6.30 p.m. Path-lengthchanges indicated in O4 measurements will also in-fluence NO2 measurements. For example, cloudy fea-tures appearing in the O4 column densities at 10 a.m.and 3 p.m. also appear as enhancements in the NO2slant column densities.
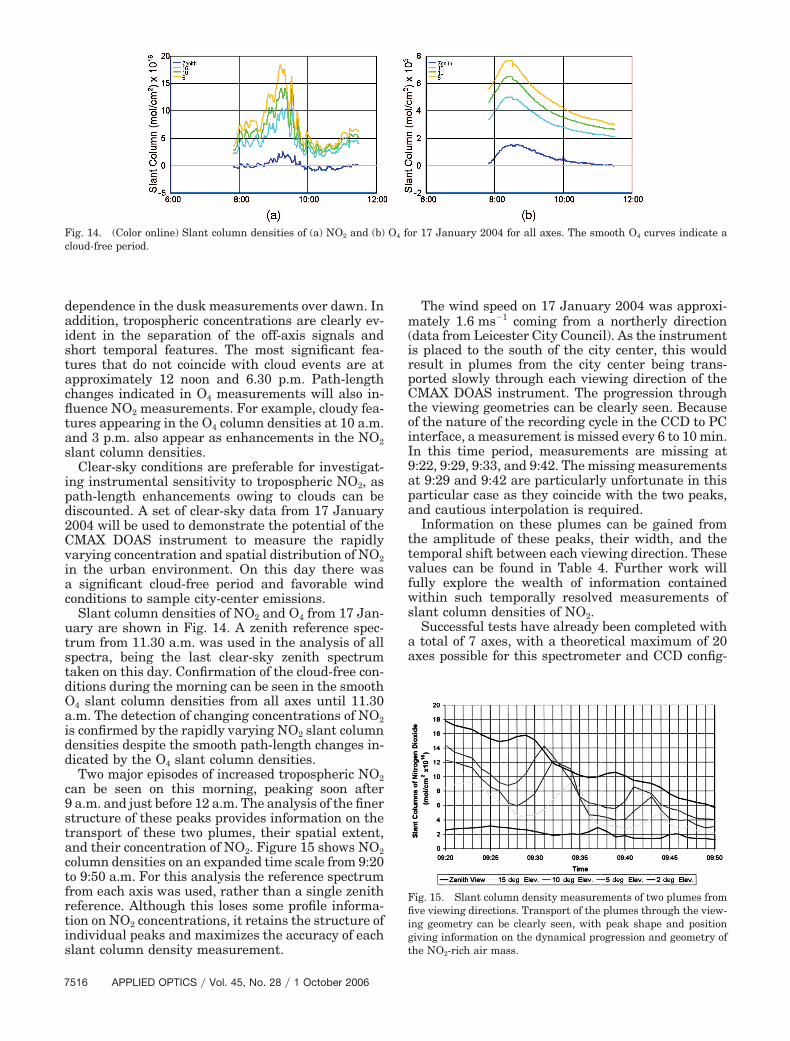
Clear-sky conditions are preferable for investigat-ing instrumental sensitivity to tropospheric NO2, aspath-length enhancements owing to clouds can bediscounted. A set of clear-sky data from 17 January2004 will be used to demonstrate the potential of theCMAX DOAS instrument to measure the rapidlyvarying concentration and spatial distribution of NO2in the urban environment. On this day there wasa significant cloud-free period and favorable windconditions to sample city-center emissions.
Slant column densities of NO2 and O4 from 17 Jan-uary are shown in Fig. 14. A zenith reference spec-trum from 11.30 a.m. was used in the analysis of allspectra, being the last clear-sky zenith spectrumtaken on this day. Confirmation of the cloud-free con-ditions during the morning can be seen in the smoothO4 slant column densities from all axes until 11.30a.m. The detection of changing concentrations of NO2is confirmed by the rapidly varying NO2 slant columndensities despite the smooth path-length changes in-dicated by the O4 slant column densities.
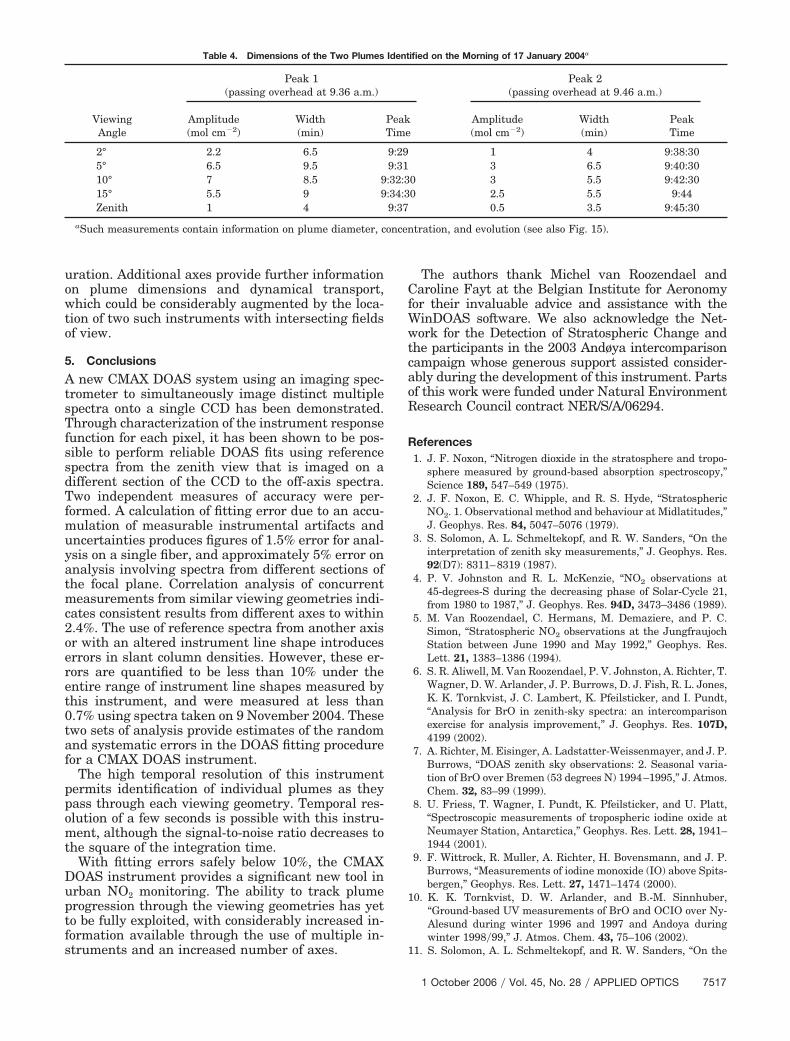
Two major episodes of increased tropospheric NO2can be seen on this morning, peaking soon after9 a.m. and just before 12 a.m. The analysis of the finerstructure of these peaks provides information on thetransport of these two plumes, their spatial extent,and their concentration of NO2. Figure 15 shows NO2column densities on an expanded time scale from 9:20to 9:50 a.m. For this analysis the reference spectrumfrom each axis was used, rather than a single zenithreference. Although this loses some profile informa-tion on NO2 concentrations, it retains the structure ofindividual peaks and maximizes the accuracy of eachslant column density measurement.
The wind speed on 17 January 2004 was approxi-mately 1.6 ms�1 coming from a northerly direction(data from Leicester City Council). As the instrumentis placed to the south of the city center, this wouldresult in plumes from the city center being trans-ported slowly through each viewing direction of theCMAX DOAS instrument. The progression throughthe viewing geometries can be clearly seen. Becauseof the nature of the recording cycle in the CCD to PCinterface, a measurement is missed every 6 to 10 min.In this time period, measurements are missing at9:22, 9:29, 9:33, and 9:42. The missing measurementsat 9:29 and 9:42 are particularly unfortunate in thisparticular case as they coincide with the two peaks,and cautious interpolation is required.
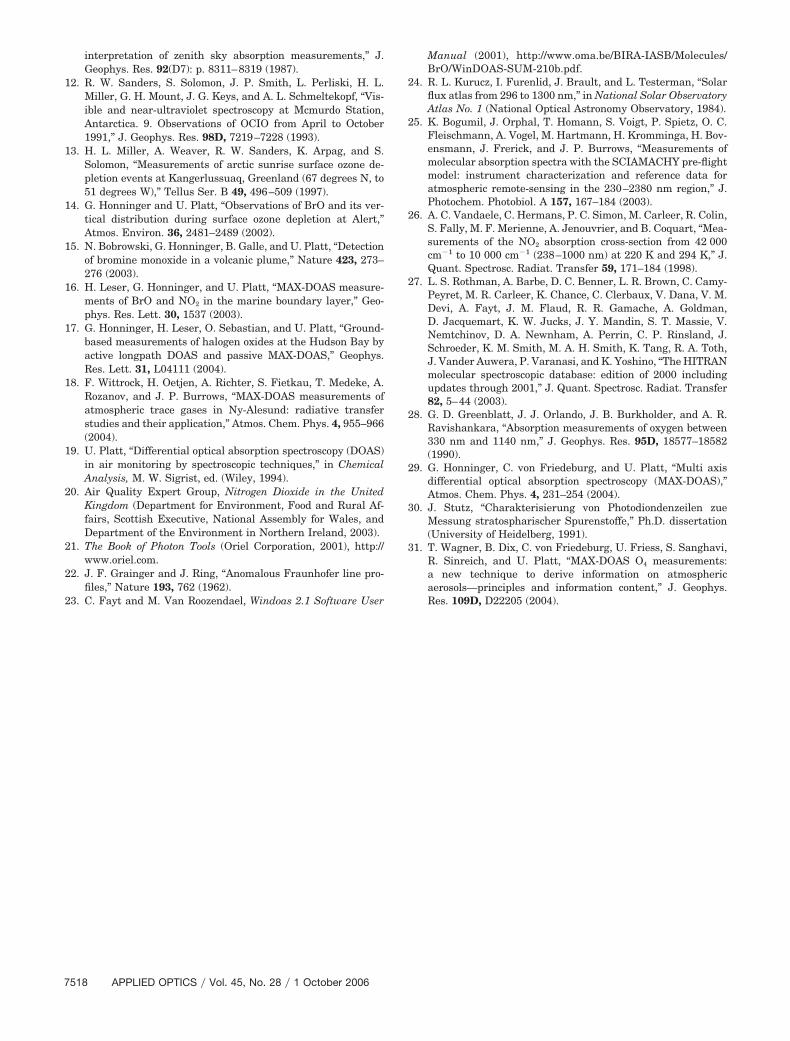
Information on these plumes can be gained fromthe amplitude of these peaks, their width, and thetemporal shift between each viewing direction. Thesevalues can be found in Table 4. Further work willfully explore the wealth of information containedwithin such temporally resolved measurements ofslant column densities of NO2.
Successful tests have already been completed witha total of 7 axes, with a theoretical maximum of 20axes possible for this spectrometer and CCD config-
Fig. 14. (Color online) Slant column densities of (a) NO2 and (b) O4 for 17 January 2004 for all axes. The smooth O4 curves indicate acloud-free period.
Fig. 15. Slant column density measurements of two plumes fromfive viewing directions. Transport of the plumes through the view-ing geometry can be clearly seen, with peak shape and positiongiving information on the dynamical progression and geometry ofthe NO2-rich air mass.
uration. Additional axes provide further informationon plume dimensions and dynamical transport,which could be considerably augmented by the loca-tion of two such instruments with intersecting fieldsof view.
5. Conclusions
A new CMAX DOAS system using an imaging spec-trometer to simultaneously image distinct multiplespectra onto a single CCD has been demonstrated.Through characterization of the instrument responsefunction for each pixel, it has been shown to be pos-sible to perform reliable DOAS fits using referencespectra from the zenith view that is imaged on adifferent section of the CCD to the off-axis spectra.Two independent measures of accuracy were per-formed. A calculation of fitting error due to an accu-mulation of measurable instrumental artifacts anduncertainties produces figures of 1.5% error for anal-ysis on a single fiber, and approximately 5% error onanalysis involving spectra from different sections ofthe focal plane. Correlation analysis of concurrentmeasurements from similar viewing geometries indi-cates consistent results from different axes to within2.4%. The use of reference spectra from another axisor with an altered instrument line shape introduceserrors in slant column densities. However, these er-rors are quantified to be less than 10% under theentire range of instrument line shapes measured bythis instrument, and were measured at less than0.7% using spectra taken on 9 November 2004. Thesetwo sets of analysis provide estimates of the randomand systematic errors in the DOAS fitting procedurefor a CMAX DOAS instrument.
The high temporal resolution of this instrumentpermits identification of individual plumes as theypass through each viewing geometry. Temporal res-olution of a few seconds is possible with this instru-ment, although the signal-to-noise ratio decreases tothe square of the integration time.
With fitting errors safely below 10%, the CMAXDOAS instrument provides a significant new tool inurban NO2 monitoring. The ability to track plumeprogression through the viewing geometries has yetto be fully exploited, with considerably increased in-formation available through the use of multiple in-struments and an increased number of axes.
The authors thank Michel van Roozendael andCaroline Fayt at the Belgian Institute for Aeronomyfor their invaluable advice and assistance with theWinDOAS software. We also acknowledge the Net-work for the Detection of Stratospheric Change andthe participants in the 2003 Andøya intercomparisoncampaign whose generous support assisted consider-ably during the development of this instrument. Partsof this work were funded under Natural EnvironmentResearch Council contract NER/S/A/06294.
References1. J. F. Noxon, “Nitrogen dioxide in the stratosphere and tropo-
sphere measured by ground-based absorption spectroscopy,”Science 189, 547–549 (1975).
2. J. F. Noxon, E. C. Whipple, and R. S. Hyde, “StratosphericNO2. 1. Observational method and behaviour at Midlatitudes,”J. Geophys. Res. 84, 5047–5076 (1979).
3. S. Solomon, A. L. Schmeltekopf, and R. W. Sanders, “On theinterpretation of zenith sky measurements,” J. Geophys. Res.92(D7): 8311–8319 (1987).
4. P. V. Johnston and R. L. McKenzie, “NO2 observations at45-degrees-S during the decreasing phase of Solar-Cycle 21,from 1980 to 1987,” J. Geophys. Res. 94D, 3473–3486 (1989).
5. M. Van Roozendael, C. Hermans, M. Demaziere, and P. C.Simon, “Stratospheric NO2 observations at the JungfraujochStation between June 1990 and May 1992,” Geophys. Res.Lett. 21, 1383–1386 (1994).
6. S. R. Aliwell, M. Van Roozendael, P. V. Johnston, A. Richter, T.Wagner, D. W. Arlander, J. P. Burrows, D. J. Fish, R. L. Jones,K. K. Tornkvist, J. C. Lambert, K. Pfeilsticker, and I. Pundt,“Analysis for BrO in zenith-sky spectra: an intercomparisonexercise for analysis improvement,” J. Geophys. Res. 107D,4199 (2002).
7. A. Richter, M. Eisinger, A. Ladstatter-Weissenmayer, and J. P.Burrows, “DOAS zenith sky observations: 2. Seasonal varia-tion of BrO over Bremen (53 degrees N) 1994–1995,” J. Atmos.Chem. 32, 83–99 (1999).
8. U. Friess, T. Wagner, I. Pundt, K. Pfeilsticker, and U. Platt,“Spectroscopic measurements of tropospheric iodine oxide atNeumayer Station, Antarctica,” Geophys. Res. Lett. 28, 1941–1944 (2001).
9. F. Wittrock, R. Muller, A. Richter, H. Bovensmann, and J. P.Burrows, “Measurements of iodine monoxide (IO) above Spits-bergen,” Geophys. Res. Lett. 27, 1471–1474 (2000).
10. K. K. Tornkvist, D. W. Arlander, and B.-M. Sinnhuber,“Ground-based UV measurements of BrO and OCIO over Ny-Alesund during winter 1996 and 1997 and Andoya duringwinter 1998�99,” J. Atmos. Chem. 43, 75–106 (2002).
11. S. Solomon, A. L. Schmeltekopf, and R. W. Sanders, “On the
Table 4. Dimensions of the Two Plumes Identified on the Morning of 17 January 2004a
interpretation of zenith sky absorption measurements,” J.Geophys. Res. 92(D7): p. 8311–8319 (1987).
12. R. W. Sanders, S. Solomon, J. P. Smith, L. Perliski, H. L.Miller, G. H. Mount, J. G. Keys, and A. L. Schmeltekopf, “Vis-ible and near-ultraviolet spectroscopy at Mcmurdo Station,Antarctica. 9. Observations of OCIO from April to October1991,” J. Geophys. Res. 98D, 7219–7228 (1993).
13. H. L. Miller, A. Weaver, R. W. Sanders, K. Arpag, and S.Solomon, “Measurements of arctic sunrise surface ozone de-pletion events at Kangerlussuaq, Greenland (67 degrees N, to51 degrees W),” Tellus Ser. B 49, 496–509 (1997).
14. G. Honninger and U. Platt, “Observations of BrO and its ver-tical distribution during surface ozone depletion at Alert,”Atmos. Environ. 36, 2481–2489 (2002).
15. N. Bobrowski, G. Honninger, B. Galle, and U. Platt, “Detectionof bromine monoxide in a volcanic plume,” Nature 423, 273–276 (2003).
16. H. Leser, G. Honninger, and U. Platt, “MAX-DOAS measure-ments of BrO and NO2 in the marine boundary layer,” Geo-phys. Res. Lett. 30, 1537 (2003).
17. G. Honninger, H. Leser, O. Sebastian, and U. Platt, “Ground-based measurements of halogen oxides at the Hudson Bay byactive longpath DOAS and passive MAX-DOAS,” Geophys.Res. Lett. 31, L04111 (2004).
18. F. Wittrock, H. Oetjen, A. Richter, S. Fietkau, T. Medeke, A.Rozanov, and J. P. Burrows, “MAX-DOAS measurements ofatmospheric trace gases in Ny-Alesund: radiative transferstudies and their application,” Atmos. Chem. Phys. 4, 955–966(2004).
19. U. Platt, “Differential optical absorption spectroscopy (DOAS)in air monitoring by spectroscopic techniques,” in ChemicalAnalysis, M. W. Sigrist, ed. (Wiley, 1994).
20. Air Quality Expert Group, Nitrogen Dioxide in the UnitedKingdom (Department for Environment, Food and Rural Af-fairs, Scottish Executive, National Assembly for Wales, andDepartment of the Environment in Northern Ireland, 2003).
21. The Book of Photon Tools (Oriel Corporation, 2001), http://www.oriel.com.
22. J. F. Grainger and J. Ring, “Anomalous Fraunhofer line pro-files,” Nature 193, 762 (1962).
23. C. Fayt and M. Van Roozendael, Windoas 2.1 Software User
24. R. L. Kurucz, I. Furenlid, J. Brault, and L. Testerman, “Solarflux atlas from 296 to 1300 nm,” in National Solar ObservatoryAtlas No. 1 (National Optical Astronomy Observatory, 1984).
25. K. Bogumil, J. Orphal, T. Homann, S. Voigt, P. Spietz, O. C.Fleischmann, A. Vogel, M. Hartmann, H. Kromminga, H. Bov-ensmann, J. Frerick, and J. P. Burrows, “Measurements ofmolecular absorption spectra with the SCIAMACHY pre-flightmodel: instrument characterization and reference data foratmospheric remote-sensing in the 230–2380 nm region,” J.Photochem. Photobiol. A 157, 167–184 (2003).
26. A. C. Vandaele, C. Hermans, P. C. Simon, M. Carleer, R. Colin,S. Fally, M. F. Merienne, A. Jenouvrier, and B. Coquart, “Mea-surements of the NO2 absorption cross-section from 42 000cm�1 to 10 000 cm�1 (238–1000 nm) at 220 K and 294 K,” J.Quant. Spectrosc. Radiat. Transfer 59, 171–184 (1998).
27. L. S. Rothman, A. Barbe, D. C. Benner, L. R. Brown, C. Camy-Peyret, M. R. Carleer, K. Chance, C. Clerbaux, V. Dana, V. M.Devi, A. Fayt, J. M. Flaud, R. R. Gamache, A. Goldman,D. Jacquemart, K. W. Jucks, J. Y. Mandin, S. T. Massie, V.Nemtchinov, D. A. Newnham, A. Perrin, C. P. Rinsland, J.Schroeder, K. M. Smith, M. A. H. Smith, K. Tang, R. A. Toth,J. Vander Auwera, P. Varanasi, and K. Yoshino, “The HITRANmolecular spectroscopic database: edition of 2000 includingupdates through 2001,” J. Quant. Spectrosc. Radiat. Transfer82, 5–44 (2003).
28. G. D. Greenblatt, J. J. Orlando, J. B. Burkholder, and A. R.Ravishankara, “Absorption measurements of oxygen between330 nm and 1140 nm,” J. Geophys. Res. 95D, 18577–18582(1990).
29. G. Honninger, C. von Friedeburg, and U. Platt, “Multi axisdifferential optical absorption spectroscopy (MAX-DOAS),”Atmos. Chem. Phys. 4, 231–254 (2004).
30. J. Stutz, “Charakterisierung von Photodiondenzeilen zueMessung stratospharischer Spurenstoffe,” Ph.D. dissertation(University of Heidelberg, 1991).
31. T. Wagner, B. Dix, C. von Friedeburg, U. Friess, S. Sanghavi,R. Sinreich, and U. Platt, “MAX-DOAS O4 measurements:a new technique to derive information on atmosphericaerosols—principles and information content,” J. Geophys.Res. 109D, D22205 (2004).