1Department of the Geophysical Sciences, The University of Chicago, 5734 South Ellis Avenue, Chicago, IL 60637, USA2Enrico Fermi Institute, The University of Chicago, 5640 South Ellis Avenue, Chicago, IL 60637, USA
(Received January11, 1999;accepted in revised form July9, 1999)
Abstract—Full equilibrium calculations of the sequence of condensation of the elements from cosmic gasesmade by total vaporization of dust-enriched systems were performed in order to investigate the oxidation stateof the resulting condensates. The computations included 23 elements and 374 gas species, and were done overa range ofPtot from 1023 to 1026 bar and for enrichments up to 10003 in dust of Cl composition relative toa system of solar composition. Because liquids are stable condensates in dust-enriched systems, the MELTSnonideal solution model for silicate liquids (Ghiorso and Sack, 1995) was incorporated into the computer code.Condensation at 1023 bar and dust enrichments of 1003, 5003, and 10003 occur at oxygen fugacities ofIW-3.1, IW-1.7, and IW-1.2, respectively, and, at the temperature of cessation of direct condensation ofolivine from the vapor, yieldsXFa of 0.019, 0.088, and 0.164, respectively. Silicate liquid is a stablecondensate at dust enrichments.;12.53 at 1023 bar and.;4253 at 1026 bar. At 5003, the liquid fieldis .1000 K wide and accounts for a maximum of 48% of the silicon at 1023 bar, and is 240 K wide andaccounts for 25% of the silicon at 1026 bar. At the temperature of disappearance of liquid,XFa of coexistingolivine is 0.025, 0.14, and 0.31 at 1003, 5003, and 10003, respectively, almost independent ofPtot. At10003, the Na2O and K2O contents of the last liquid reach 10.1 and 1.3 wt.%, respectively, at 1023 bar butare both negligible at 1026 bar. At 1023 bar, iron sulfide liquids are stable condensates at dust enrichmentsat least as low as 5003 and coexist with silicate liquid at 10003. No sulfide liquid is found at 1026 bar. At1023 bar, the predicted distribution of Fe between metal, silicate and sulfide at 1310 K and a dust enrichmentof 5603 matches that found in H-group chondrites, and at 1330 K and 6753 matches that of L-groupchondrites prior to metal loss.
Several lines of evidence suggest that most chondritesformed at oxygen fugacities significantly higher than those of asolar gas (e.g., Fegley and Palme, 1985; Rubin et al., 1988;Palme and Fegley, 1990; Weinbruch et al., 1990). The mostcompelling evidence is the high FeO content of chondriticolivine and pyroxene grains, many of which have molar FeO/(FeO 1 MgO) ratios greater than 0.15 (Wood, 1967; VanSchmus, 1969). Grossman (1972) showed that the first olivineand pyroxene to condense from a cooling solar gas contain onlytrace amounts of FeO, because iron is more stable as co-condensing metallic nickel–iron. At equilibrium, olivine willnot incorporate significant FeO until below 550 K, when iron
metal reacts with gaseous H2O to form FeO (Grossman, 1972)which must then diffuse into the crystal structure of previouslycondensed forsterite, replacing MgO. At these low tempera-tures, however, this mechanism for producing the observedFeO content of olivine in chondrites encounters two fundamen-tal problems: solid–gas equilibrium is unlikely, and diffusionin olivine is very slow. Enhancing the oxygen fugacity of thesystem in which chondritic matter formed is one way FeOcould have been stabilized at temperatures high enough that itwas incorporated into ferromagnesian silicates when, or soonafter, they first condensed.
The most reasonable mechanism proposed for producing theoxygen fugacity required to form fayalitic olivine at highertemperatures is enhancement of the dust/gas ratio (Wood, 1967;Rubin et al., 1988). In such a model, the initial nebula is a coldcloud of interstellar gas and dust, whose overall composition is*Address reprint requests to Lawrence Grossman.
solar and in which;30% of the oxygen is in the dust, andvirtually all of the H and C are in the gas. If, before nebulartemperatures reach their maximum, dust concentrates in certainregions relative to the gas compared to solar composition, thentotal vaporization of such regions will produce a gas enrichedin oxygen relative to hydrogen and carbon compared to solarcomposition. Subsequent condensation in such a region occursin a gas with a significantly higher oxygen fugacity than one ofsolar composition. Furthermore, the abundance ratios of con-densable elements such as Mg and Si to H are increased muchmore than the O/H ratio, because the dust contains nearly 100%of each of the condensable elements, compared to only 30% ofthe oxygen. The condensation temperature of any phase in-creases with increasing partial pressures of its gaseous constit-uents, which in turn increase with their abundances relative tohydrogen. Dust enrichment therefore not only increases oxygenfugacity, but also increases condensation temperatures, possi-bly to temperatures at which partial melts are stable.
Wood and Hashimoto (1993) and Yoneda and Grossman(1995) performed full equilibrium calculations of condensationin dust-enriched systems, and both studies found stability fieldsof silicate liquids at relatively low total pressure. Therefore, anaccurate thermodynamic description of silicate liquids is aprerequisite for an accurate description of condensation indust-enriched systems. Yoneda and Grossman (1995) were thefirst to assess the stability of nonideal CaO–MgO–Al2O3–SiO2
(CMAS) silicate liquid (Berman, 1983), but were unable toaddress the stability of ferromagnesian liquids due to lack of anaccurate thermodynamic model for silicate liquids containingFe, Ti, Na, and K.
The present work is the first to explore condensation in eithersolar composition or dust-enriched systems using a thermody-namic model for ferromagnesian liquids which has been testedagainst experimental data and natural assemblages. An 11-component subset of the 15-component “MELTS” silicate liq-uid model, developed by Ghiorso and Sack (1995) to modelcrystallization of natural silicate liquids of peridotite to inter-mediate compositions, has been incorporated into condensationcalculations. In addition, this liquid model is shown here todescribe accurately the crystallization of liquids in the FeO–CMAS system, similar to many of the liquids predicted in thiswork. Condensation sequences are computed at dust enrich-ments of up to 10003, and atPtot of 1023 and 1026 bar, attemperatures from 1100 to 2400 K. Results indicate the com-position changes in solid, liquid, and gas phases likely to occurduring direct condensation, partial evaporation, or preaccretionmetasomatism of matter in dust-enriched systems at these tem-peratures and pressures. The idea that ferromagnesian chon-drules formed by direct condensation in the solar nebula haspersisted since Sorby (1877) likened chondrules to solidified“drops of fiery rain”, and Wood (1967) revived it by suggestingthat liquids of forsterite composition might be stable at lowtotal pressures in gases enriched (by.50003) in precondenseddust. Therefore, in this work, specific equilibrium assemblagesare compared with specific chondrules, and the implications ofdust enrichment for chondrule stability in the protoplanetarynebula are explored. Preliminary versions of this work werepresented by Ebel and Grossman (1996, 1997a, 1997b, 1998).
2. TECHNIQUE
2.1. Bulk Composition
The nature of the condensates from dust-enriched bulk compositionsis strongly influenced by the composition assumed for the dust, and aninfinite variety of fractionated dust compositions can be imagined. Oneconstraint on dust composition, however, is that it led to condensateassemblages containing chondritic proportions of condensable ele-ments. Cl chondrites are representative of the bulk composition of thecondensable fraction of solar system matter. If the bulk of the condens-able elements was originally brought to the solar nebula in the form ofinterstellar dust, then it is reasonable to assume that the aggregatecomposition of that dust had a bulk chemical composition similar tothat of Cl chondrites. Table 1 shows the relative atomic abundances ofthe 23 elements considered in this work in solar gas (Anders andGrevesse, 1989), the Cl chondrite dust component of solar gas, andseveral dust-enriched systems. For a dust enrichment ofn, one way tocalculate the bulk composition is by adding (n 2 1) units of the Cl dustto solar composition. Enrichment factors of up to 1000 were investi-gated. Although there are as yet no astronomical observations thatconfirm, or astrophysical models that produce such enrichments, thereexists no evidence torule out such enrichments in protoplanetaryenvironments.
2.2. Method of Calculation
The condensation code described here, “VAPORS”, is describedmore completely by Ebel et al. (1999). All calculations are normalizedto a total of one mole of atoms in the system. A typical condensationrun at fixedPtot and bulk composition is begun with only the vaporphase present at 2400 K. Most solutions are obtained at 10 K intervals,using the result at the previous temperature as a first approximation. Ateach fixed pressure, temperature, and bulk composition of the system,the partial pressures of the pure monatomic gaseous elements (the basiscomponents of the gas phase) are obtained by calculating the distribu-tion of the elements among 374 species in the gas phase, using standardtechniques (Lattimer et al., 1978; Smith and Missen, 1982). The sta-bility of each potential, stoichiometrically pure, single componentcondensate phase is then evaluated from the partial pressures of theelements and the Gibbs energy for that phase, by considering theenergy balance of the formation reaction of the condensate from themonatomic gaseous elements. In the case of a liquid or solid solutionphase, the “best” composition is determined by finding that composi-tion at which the activities of the components describing the solutionphase most closely match equivalent activities in the gas, using thealgorithms of Ghiorso (1994). This composition is then tested forstability in much the same way as a stoichiometrically pure condensate,but also accounting for the thermodynamic mixing properties of thecomponents in the solution phase. In some cases where silicate liquidis present, this algorithm failed to find the “best” pyroxene solidsolution composition, and the program proceeded with a pure diopsideend-member composition instead. In such cases, the program wasrestarted with a “seed”, Ti-, Al-bearing diopsidic pyroxene substitutedfor the pure diopside at and above the temperature step at which purediopside had been found to be stable. In all such cases, a complex, Ti-,Al-bearing diopsidic pyroxene was found to be stable at the tempera-ture where pure diopside had been found, or, at most, 20 K higher. TheGibbs energy of the system was always on the order of 0.5 J lower permole of elements in the system for the assemblage with the pyroxenesolid solution than for the one with pure diopside. This problem occursonly with the pyroxene solid solution model, probably because of thedifficulty in determining both the composition and ordering state of thenear end-member pyroxene in equilibrium with a gas phase highlydepleted in some of the pyroxene-forming elements. Once a phase isdetermined to be stable, it is added to the stable assemblage in a seedamount (1027 mol), which is subtracted from the gas. The next step isto distribute mass between the phases to minimize the total free energyof this new system.
In this work, the second order technique of Ghiorso (1985), follow-ing Betts (1980), was adapted to the problem of distributing massbetween phases to minimize directly the total Gibbs free energy of asystem consisting of gas and multiple pure and solution phases, both
340 D. S. Ebel and L. Grossman
solid and liquid. The Gibbs energy of the entire system can be imaginedas a surface inm dimensions, wherem is the total number of compo-nents independently variable in each of the phases present. The com-ponents of the gas are the monatomic elements, while those of solutionphases are the end-members of these phases. Each distribution ofelements between these components at fixed temperature and pressuredefines a state of the system, and corresponds to a point on the Gibbssurface. In successive iterations, information about the local slope andcurvature of the Gibbs surface at the current state of the system is usedto determine the direction toward a minimum on this surface, alongwhich the next iterative solution must lie. Then atoms are redistributedaccordingly among the gas and condensates, that is among themcomponents, so that this minimum is approached as closely as possible.From the perspective of this new state of the system, the Gibbs surface“looks” different, so a new minimum must be sought in a furtheriteration. Convergence is declared when the vector norm of all thechanges in composition in them directions does not change by.10212
between iterations. The VAPORS program usually converges in lessthan 10 iterations in this part of the algorithm.
Upon convergence to a free energy minimum, the stabilities ofnoncondensed phases are assessed as described above, and if additionalphases are found to be stable relative to the gas, they are added asdescribed above and the minimization algorithm is repeated. Even tracephases such as perovskite are typically present at levels.1026 mol permole of elements in the complete system. If the amount of a phasedrops below a minimum value, set at 10210 mol, that phase is removedfrom the condensate assemblage, and the minimization algorithm isrepeated. If no phase must be added or removed after the minimization,the system is considered solved for that temperature, pressure, and bulkcomposition, and a new temperature step is initiated.
Convergence of each solution is assessed independently by calcula-tion of the difference in the chemical potential of each condensedcomponent between the gas and condensates. For temperatures.1400K, these differences for each component are always,1027 of thechemical potential in the gas, and usually very much better (e.g.,;10212). At lower temperatures, particularly in dust-enriched systems,these differences in some cases increase for components containing theelements Ca, Al, and Ti, and no results are reported here for anytemperature step in which the difference exceeds 1024 for any conden-sate component. Even in an example where these differences are;3 31024, they would record uncertainties corresponding to a shift of only;10210 of the total Ca in the system between the gas and the conden-
sate assemblage. These reaction imbalances occur because the algo-rithms call for numerical approximation of the first and second deriv-atives of the Gibbs energy of the gas with respect to the concentrationof each of the condensing elements in it, and this approximationbecomes increasingly sensitive to machine numerical precision at verylow concentrations of elements in the gas (e.g., 10220 mol per mole ofelements in the system). Mass balance is preserved to within,10227
of the moles of atoms present throughout all calculations.
2.3. Thermodynamic Data for Elements and Gas Species
In each calculation, 23 elements were included: H, He, C, N, O, F,Ne, Na, Mg, Al, Si, P, S, Cl, Ar, K, Ca, Ti, Cr, Mn, Fe, Co, and Ni. Thegas species considered in every calculation include all species consid-ered by Grossman (1972) and Yoneda and Grossman (1995), as well asthose listed in Table 2. TheDfH8 (298.15 K),S8 (298.15 K), andCp8(T) data for gas species and elements in their standard states were takenwherever possible from the JANAF tables (Chase et al., 1985), ob-tained in machine readable form from the National Institute of Stan-dards and Technology in 1995. For a few gas species not present in theJANAF database, data from Knacke et al. (1991) or Pedley and Mar-shall (1983) were used. During calculation, apparent Gibbs energies offormation (Anderson and Crerar, 1993), and hence the equilibriumconstants of reactions, were calculated by integration of polynomial fitsto tabulatedCp8 (T) data. Errors were found in the JANAF tabulations(Chase et al., 1985) of the Gibbs energy of formation (DfG8) andequilibrium constant (ln Kf) for the gas species C2N2, C2H2, CN, andHS. The error in HS was also present in the electronic version, and hadnot been previously reported (M. Chase, personal communication;1996). Although it does not occur in the tabulations of Stull andProphet (1970), Barin (1989), or Knacke et al. (1991), the HS( g) errorhas been propagated through the work of Yoneda and Grossman(1995), and probably also Sharp and Wasserburg (1995) and others.The effect of this error is to overestimate the stability of HS( g), andcause SiS( g) to sequester slightly less Si than it should.
2.4. Thermodynamic Data and Models for Solids
The internally consistent thermodynamic database of Berman(1988), or a combination of the internally consistent databases of
Table 1. Relative atomic abundances in solar composition and the Cl component of solar composition, both normalized to 106 atoms Si, andcompositions of systems enriched in dust of Cl composition relative to solar.
Berman and Brown (1985) and Berman (1983) were used whereverpossible for all potential condensates in Table 3 and for most end-member components of the solid solution series in Table 4, except forthe metal alloy. This means that Berman (1988) was the source ofend-member data for the melilite and feldspar solid solutions, not thereferences cited for the solution models for these phases. The JANAFdata (Chase et al., 1985) for pyrrhotite, Fe0.877S, are based on estima-tion of heat capacities from 600 to 1475 K. Recent work below 1000 Kby Grønvold and Stølen (1992) indicates that these data cause oversta-bilization of pyrrhotite by;5 kJ at 1000 K. Therefore, Gibbs energiesof formation of pyrrhotite from the JANAF tables were revised upwardby this amount in the calculation. This revision lowers the appearancetemperature of pyrrhotite by;50 K, compared to the JANAF data.
The solid solution models implemented in the MELTS program(circa 1993; Table 4) were used in all calculations, except that Ca-pyroxenes (Sack and Ghiorso, 1994a; 1994b; 1994c) were constrainedto have one total atom of Ca1 Na per six oxygen atoms. Theserepresent the most comprehensive treatments of the anhydrous igneousrock-forming minerals presently available, and are the solid solutionmodels against which the MELTS silicate liquid model is calibrated. Inaddition, solid Fe–Ni–Si–Cr–Co alloy was modeled using JANAF data(Chase et al., 1985) for pure metal end-members, and an asymmetricbinary solution model calibrated against activity data for the binarysystems of Chuang et al. (1986b) for Fe–Ni, Sakao and Elliott (1975)for Fe–Si, and Normanton et al. (1976) for Fe–Cr, with Fe–Co treated
as ideal. Such a calibration is justifiable for the dilute alloys found athigh temperature in this work.
Some cations of great interest in condensation are not contained insome of the liquid or solid solution models used here. These are the firstcondensation calculations in which the TiO2 content of spinel is mod-eled, and extraordinarily high TiO2 contents are predicted at very hightemperatures. In all such cases, however, spinel coexists with a CMASliquid into which TiO2 is artificially prevented from dissolving. Parti-tioning experiments (Connolly and Burnett, 1999) suggest that thesehigh TiO2 contents may be spurious. Insufficient experimental workexists to justify inclusion of Ti31 or Cr31 in the pyroxene model. Nosolution model is used for Mn, S, P, or C in the metal alloy, and thiscould artificially enhance the stabilities of troilite, pyrrhotite, andwhitlockite. Similarly, our inability to account for Ni or Co in troiliteor pyrrhotite, nor for Cr, Ti, or Al in olivine, may artificially destabilizethese phases slightly. Although Hirschmann (1991) has modeled Ni,Co, and Mn in olivine, these elements are not addressed by thepyroxene model, nor are Ni and Co included in the spinel modelemployed here. Because inclusion of Ni, Co, or Mn in only one of thesephases would artificially stabilize that phase and cause it to containexcessive amounts of these cations, these cations were not includedin the olivine model. This omission, however, artificially stabilizesMnTiO3-rich rhombohedral oxide solid solutions and crystallineMnO.
Table 2. Gas species and thermodynamic data sources, included in the calculation, in addition to species used by Grossman (1972) and/or Yonedaand Grossman (1995).
Chase et al. (1985) Other sources
Ne CHClF2 NiCl CoF2 F3NO Knacke et al. (1991)Ar CHCl2F ClO CrN PF3O CrCl2O2
2.5. Thermodynamic Data and Models for Silicate Liquids
A major innovation in the work presented here is the inclusion of the“MELTS” model for silicate liquids (Ghiorso, 1985; Ghiorso and Sack,1995), which describes the thermodynamic properties of silicate liquidsusing a regular (symmetric) binary solution model in the componentsSiO2–TiO2–Al2O3–Fe2O3–Fe2SiO4–Mg2SiO4–MgCr2O4–CaSiO3–Na2SiO3–KAlSiO4–Ca3(PO4)2–H2O, in addition to MnSi0.5O2–NiSi0.5O2–CoSi0.5O2 which have been omitted in the present study.Crystallization calculations with MELTS have been found to yieldremarkable agreement between calculated and observed amounts andcompositions of phases in liquid-crystal equilibrium experiments at 1bar (Ghiorso and Carmichael, 1985) and at 10 kbar (Baker et al., 1995;Hirschmann et al., 1998). Ghiorso and Sack (1995) caution againstusing their model: (a) in systems containing only a small subset (,7)of the components, or (b) far outside the temperature–pressure–composition range of its calibration. Both of thesecaveatsare ad-dressed below.
2.5.1. Test of MELTS: Peridotite KLB-1
Anticipating that condensate liquids will be poor in non-CMAScomponents and will thus violatecaveat(a), we tested MELTS calcu-lations against quenched partial melting experiments of peridotiteKLB-1, whose non-CMAS components consist of only 8.1 wt.% FeO,and#0.3% of all other oxides. Takahashi (1986) and Takahashi et al.(1993) reported the temperature intervals between the observed ab-sence and presence of phases, as well as phase compositions and meltfractions for KLB-1 at 1 bar at the Ni–NiO oxygen buffer. Note thatonly one of their seven data points used here is used in the MELTScalibration database. It can be seen in Figure 1 that the MELTS modelreproduces the observed volume fractions of liquids well, except at lowmelt fractions where there may be significant measurement error in theexperiments. The solidus temperature and appearance temperatures ofolivine, Ca–pyroxene, and feldspar agree nearly within experimentalerror, but the model underpredicts the crystallization temperature oforthopyroxene and overpredicts that of spinel (Table 5). Hirschmann et
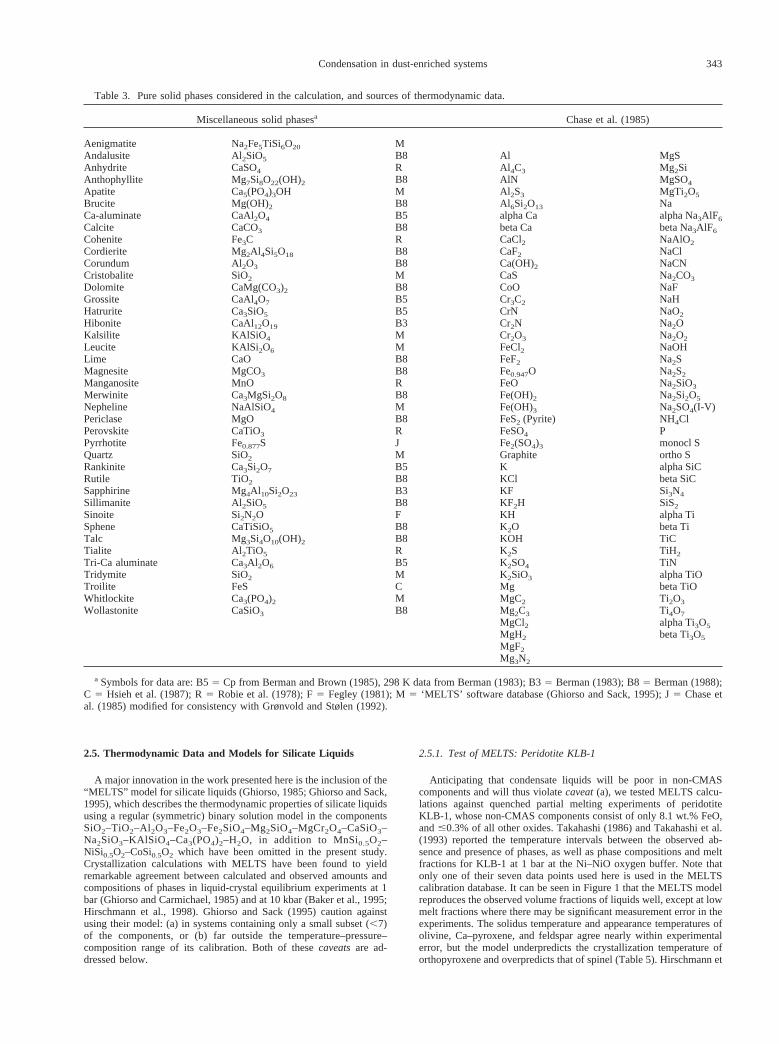
Table 3. Pure solid phases considered in the calculation, and sources of thermodynamic data.
Miscellaneous solid phasesa Chase et al. (1985)
Aenigmatite Na2Fe5TiSi6O20 MAndalusite Al2SiO5 B8 Al MgSAnhydrite CaSO4 R Al4C3 Mg2SiAnthophyllite Mg7Si8O22(OH)2 B8 AlN MgSO4
Hibonite CaAl12O19 B3 Cr2N Na2OKalsilite KAlSiO4 M Cr2O3 Na2O2
Leucite KAlSi2O6 M FeCl2 NaOHLime CaO B8 FeF2 Na2SMagnesite MgCO3 B8 Fe0.947O Na2S2
Manganosite MnO R FeO Na2SiO3
Merwinite Ca3MgSi2O8 B8 Fe(OH)2 Na2Si2O5
Nepheline NaAlSiO4 M Fe(OH)3 Na2SO4(I-V)Periclase MgO B8 FeS2 (Pyrite) NH4ClPerovskite CaTiO3 R FeSO4 PPyrrhotite Fe0.877S J Fe2(SO4)3 monocl SQuartz SiO2 M Graphite ortho SRankinite Ca3Si2O7 B5 K alpha SiCRutile TiO2 B8 KCl beta SiCSapphirine Mg4Al10Si2O23 B3 KF Si3N4
Sillimanite Al2SiO5 B8 KF2H SiS2
Sinoite Si2N2O F KH alpha TiSphene CaTiSiO5 B8 K2O beta TiTalc Mg3Si4O10(OH)2 B8 KOH TiCTialite Al2TiO5 R K2S TiH2
Tri-Ca aluminate Ca3Al2O6 B5 K2SO4 TiNTridymite SiO2 M K2SiO3 alpha TiOTroilite FeS C Mg beta TiOWhitlockite Ca3(PO4)2 M MgC2 Ti2O3
Wollastonite CaSiO3 B8 Mg2C3 Ti4O7
MgCl2 alpha Ti3O5
MgH2 beta Ti3O5
MgF2
Mg3N2
a Symbols for data are: B55 Cp from Berman and Brown (1985), 298 K data from Berman (1983); B35 Berman (1983); B85 Berman (1988);C 5 Hsieh et al. (1987); R5 Robie et al. (1978); F5 Fegley (1981); M5 ‘MELTS’ software database (Ghiorso and Sack, 1995); J5 Chase etal. (1985) modified for consistency with Grønvold and Stølen (1992).
343Condensation in dust-enriched systems
al. (1998) observed that the MELTS modeloverpredicted the crystal-lization temperature of orthopyroxene at 10 kbar. These differencesreflect compromises made by Sack and Ghiorso (1994c) to best satisfyboth high- and low-pressure pyroxene–liquid phase relations. In Figure2, the 1 bar liquid compositions are compared with MELTS results,with all Fe2O3 recalculated to FeO. The good agreement of the resultsfor melt fraction and composition suggests that the MELTS model willyield reasonably accurate results in the condensation calculation, par-ticularly because olivine dominates the distribution of mass in conden-sation sequences. Because spinel is a minor phase, overstabilization ofspinel will not have a significant effect on liquid stability. The under-stabilization of orthopyroxene, relative to liquid, suggests that liquidstability might be slightly overpredicted when orthopyroxene con-denses with it, and that the temperature of appearance of the latterphase in the condensation calculation may be too low.
In addition to MELTS, Berman’s (1983) model for CMAS liquids isincluded in the present work. Yoneda and Grossman (1995) used thismodel, and explained in detail its advantages and drawbacks. TheCMAS liquid model works well at high temperatures, where these fouroxides are the only major ones condensed, but it is inadequate underconditions where FeO, Na2O, and other non-CMAS components con-dense in appreciable quantities. Therefore, the MELTS model must be
used at lower temperatures where non-CMAS oxides are importantconstituents of the liquid. The purely CMAS liquid region is very faroutside the composition range over which MELTS is calibrated, andcontains too few components for reliable application of the MELTSliquid model. Furthermore, because the MELTS liquid uses mostlysilicate components, not pure oxides as end-members, it cannot beapplied to some especially Ca- and Al-rich regions of compositionspace that are treated adequately by the CMAS liquid model. Forexample, CaSiO3 is the major Ca-containing component employed byMELTS; yet, early high temperature condensate liquids never containas much SiO2 as CaO. For these reasons, both models are required tocompletely describe condensation of silicate liquids over the tempera-ture ranges where liquids may be stable.
2.5.2. Transition between liquid models
A decision must be made as to when to switch from one model to theother. In order to model non-CMAS oxides in the liquid, it would bebest to switch to the MELTS model at the highest feasible temperature.For the case of 1003 dust enrichment atPtot 5 1023 bar, the curves inFigure 3 illustrate the major oxide compositions of the two liquids,calculated at 2 K intervals, near the appearance temperature of olivine,indicated by the vertical line at 1782 K. The CMAS liquid is CaO- andAl2O3-rich at high temperatures, but SiO2 and MgO increase rapidlywith decreasing temperature. By contrast, although a MELTS liquidbecomes stable well above 1782 K, it is CaO-deficient and SiO2-enriched, relative to the CMAS liquid, because the only liquid theMELTS model can determine to be stable must have sufficient SiO2 tosupply the required CaSiO3 component. That is, in the temperaturerange above at least 1790 K, the most stable liquid possible in theMELTS composition range is not the liquid whichshouldbe stable.When the temperature of olivine appearance is reached, however, theMELTS liquid has gained sufficient SiO2 and MgO to have a compo-sition very similar to the CMAS liquid at the same temperature. Oncesufficient SiO2 has condensed, the MELTS model closely tracks theBerman (1983) model liquid, but also accounts for increasing FeO andTiO2 contents.
It was determined by performing condensation calculations witheach liquid separately that the CMAS liquid and the MELTS liquidhave nearly identical compositions at the temperature where olivinebecomes stable with CMAS liquid for 1026 # Ptot # 1023, and 153# dust enrichment# 10003. The criterion of olivine stability is,therefore, used to trigger a switch from the CMAS liquid model to theMELTS silicate liquid model in the calculations. The similarity inoxide concentrations below the olivine stability temperature (Fig. 3)could be expected from the similarity of the Berman (1983) database,against which the CMAS model was calibrated, and the Berman (1988)database, upon which the MELTS model relies. These comparisonsstrongly suggest that thecaveatscited by Ghiorso and Sack (1995)regarding use of the MELTS liquid model are not egregiously violatedin its use below the condensation temperature of olivine.
3. RESULTS
3.1. Vapor of Solar Composition
Different thermodynamic data are employed for some crys-talline phases, many more chemical species are included, and avery different computational procedure was used in the presentstudy than in our previous work on condensation (Yoneda andGrossman, 1995). It is therefore important to compare resultsfrom the two studies, and this is done for the case of a solar gasat Ptot 5 1023 bar in Table 6.Appearance temperatures ofphases refer to the highest temperature step at which a phase ispart of the condensate assemblage in the 2 K steps of thecalculations. Our results are quite similar, but not identical, tothose of Yoneda and Grossman (1995), referred to as theprevious work in the following explanation of the differenceswhich, in all cases, are due to differences in thermodynamicdata. Note that, although some of the data used in our previous
Table 4. Solid solutions considered in the calculation, and sources ofsolution models.
Metal alloy (this work)Iron FeNickel NiSilicon SiChromium CrCobalt Co
Olivine (Sack and Ghiorso, 1989; 1994b)
Fayalite Fe2SiO4
Forsterite Mg2SiO4
Monticellite CaMgSiO4
Melilite (Charlu et al., 1981)
Åkermanite Ca2MgSi2O7
Gehlenite Ca2Al2SiO7
Orthopyroxene (Sack and Ghiorso, 1989; 1994b)
Enstatite Mg2Si2O6
Ferrosilite Fe2Si2O6
Ca-pyroxene (Sack and Ghiorso, 1994a; 1994b; 1994c)
Diopside CaMgSi2O6
Hedenbergite CaFeSi2O6
Alumino-buffonite CaTi0.5Mg0.5AlSiO6
Buffonite CaTi0.5Mg0.5FeSiO6
Essenite CaFeAlSiO6Jadeite NaAlSi2O6
Feldspar (Elkins and Grove, 1990)
Albite NaAlSi3O8
Anorthite CaAl2Si2O8
Sanidine KAlSi3O8
Spinel (Sack and Ghiorso, 1991a; 1991b)
Chromite FeCr2O4
Hercynite FeAl2O4
Magnetite Fe3O4
Spinel MgAl2O4
Ulvospinel Fe2TiO4
Rhombohedral oxide (Ghiorso, 1990)
Geikielite MgTiO3
Hematite Fe2O3
Ilmenite FeTiO3
Pyrophanite MnTiO3
344 D. S. Ebel and L. Grossman
work may be more accurate, e.g., those for hibonite and gros-site, we use those in Table 3 in the present study because thelatter are more consistent with the MELTS liquid model. Hi-bonite forms from corundum 15 K lower in the present calcu-lations than in the previous work because hibonite is 2.5 kJ lessstable and corundum is 0.3 kJ more stable at 1700 K in thepresent work. The lesser stability of hibonite in the presentwork allows it to be replaced by grossite and CaAl2O4, whichare 16.7 and 8.7 kJ more stable, respectively, at 1700 K in thepresent work. Here the gehlenite end-member of the melilitesolid solution series is 10.1 kJ less stable at 1600 K than it waspreviously, and it forms from CaAl2O4, a phase more stablethan hibonite in the present calculations. This causes the ap-pearance temperature of melilite to be suppressed by nearly 50K and allows grossite and hibonite to partially replace it atlower temperature. Spinel condenses 13 K lower in the presentwork than it did previously, primarily because the MgAl2O4
end-member is now 3.5 kJ less stable at 1500 K. Plagioclaseforms from spinel;10 K lower in the present work because theCaAl2Si2O8 end-member is 6.5 kJ less stable at 1400 K than itwas previously. In the present work, Ti3O5 forms from Ti-
bearing clinopyroxene 18 K lower and Ti4O7 does not form atall because of gross differences in the way the Ti-bearingend-member components are treated in the two calculations. Inthe previous work, literature data were used for the Ti31-
Fig. 1. Comparison of melt fractions measured in peridotite melting experiments of Takahashi (1986) and Takahashi etal. (1993) with those calculated at 1 bar using MELTS.
Fig. 2. Comparison of measured compositions of KLB-1 liquids(Takahashi, 1986; Takahashi et al., 1993) with those calculated fromMELTS, all at 1 bar. Asterisks indicate starting compositions in theexperiments.
Table 5. Comparison of experimental phase appearance temperatures(Takahashi, 1986, run 4) with MELTS calculation for KLB-1, all at 1bar.
bearing component CaTiAlSiO6 and estimated for the Ti41-bearing component CaTiAl2O6 while, in the present work, onlydata for the Ti41-bearing components CaTi0.5Mg0.5AlSiO6 andCaTi0.5Mg0.5FeSiO6 are used. Cordierite replaces plagioclasein the present work because it is 12.8 kJ/mol more stable, andplagioclase is 7.2 kJ less stable, at 1300 K relative to theprevious work. Sphene does not form above 1200 K in thepresent work because it is 5.5 kJ/mol less stable than it waspreviously. No liquids were found to be stable in solar gas atPtot 5 1023 bar by us or any previous workers, e.g., Wagner
(1979), Wood and Hashimoto (1993), and Yoneda and Gross-man (1995), despite a contrary claim by Wark (1987).
3.2. General Effects of Dust Enrichment andPtot
Complete condensation calculations were performed from2400 K down to the last temperature step where our criteria foradequate convergence could be met, usually between 1100 and1300 K, and up to dust/gas enrichment factors of 10003relative to solar composition, hereinafter abbreviated as “dust
Fig. 3. Compositions of CMAS and MELTS liquids near the olivine appearance temperature (vertical line at 1782 K) atthe stated conditions. In this temperature range, the MELTS liquid also contains;1 wt.% of other oxides, which are notshown.
Table 6. Temperatures (K) of appearance and disappearance of condensates from a gas of solar composition atPtot 5 1023 bar, compared withearlier results.
enrichments of 10003”. The extremes of 1023 and 1026 barwere chosen to bracket the generally accepted range ofPtot inthe inner solar nebula (Wood and Morfill, 1988). Results areshown at four different dust enrichments at 1026 bar in Table7 and at 1023 bar in Table 8.In these tables, appearance anddisappearance temperatures are defined as the highest temper-ature steps at which a phase is either part of or becomes absentfrom the stable condensate assemblage. In figures showing
elemental distributions among coexisting phases, the fraction ofan element present in a phase at its appearance temperature isextrapolated to zero in the next highest temperature step.
3.2.1. Oxygen fugacity
Shown in Figure 4 is the temperature dependence of theoxygen fugacity of the gas in equilibrium with condensate
Table 7. Temperatures (K) of appearance and disappearance of condensates atPtot 5 1026 bar as a function of dust/gas enrichment.
assemblages computed at dust enrichments of 1003, 5003,and 10003 at Ptot 5 1023 bar, and at dust enrichments of1003 and 10003 at 1026 bar, along with that of the iron–wustite buffer (log fO2
5 IW) and that of a gas of solarcomposition at 1023 bar (log fO2
; IW-6) for reference. Thecurves for Ptot 5 1023 bar are nearly concentric with oneanother and show the expected increase offO2
with increasingdust enrichment. The curves for dust enrichments of 1003,5003, and 10003 lie at about IW-3.1, IW-1.7, and IW-1.2,respectively. Exceptions to this concentric behavior are seen assubtle changes in curvature, particularly noticeable at high dustenrichments where the onset of olivine condensation removessignificant fractions of the oxygen from the vapor. Comparisonof the two curves for a constant dust enrichment of 1003shows a slight increase infO2
by as much as 0.4 log units asPtot
drops from 1023 to 1026 bar below 2000 K. The smallness ofthe variation withPtot is due to the fact thatfO2
in oxygen-richcosmic gases is largely controlled by the equilibrium H2 11⁄2O2 5 H2O, and therefore depends on thePH2O
/PH2ratio
which is almost independent ofPtot at a given temperature, asdiscussed by Yoneda and Grossman (1995). Above 2000 K,however, Fig. 4 shows that, at dust enrichments of 1003 and10003, the fO2
values at 1026 bar drop below their respectivevalues at 1023 bar and the difference infO2
between the twototal pressures at constant dust enrichment increases with in-creasing temperature, reaching nearly 4 log units at 2400 K.This exceptionally large variation infO2
with Ptot is due to thefact that, at 1026 bar, almost all of the H2 and H2O aredissociated into monatomic species at these high temperatures,making the above equilibrium irrelevant to thefO2
while, at1023 bar, this dissociation occurs above 2400 K because thehigher pressure favors polyatomic over monatomic species.
3.2.2. Condensation temperatures and stability of liquid
The progressive increase in condensation temperatures of allphases with increasing dust enrichment at constantPtot, as seen
by Yoneda and Grossman (1995), is illustrated in Tables 7 and8. At 1026 bar, condensation temperatures are still low enoughat a dust enrichment of 1003 that no liquid phase is stable.However, at thisPtot and above a dust enrichment between4003 and 4503, the oxide1 silicate fraction of the assem-blage that condenses in certain temperature intervals, does so ata temperature above the solidus temperature for its bulk chem-ical composition, causing liquid to be a stable condensate.Upon cooling a system at 1026 bar and a dust enrichment of5003, liquid first appears at 1740 K, where melilite andCaAl2O4 react with the gas to form grossite and a CMASliquid. This liquid field persists for only 10 K, at which point itcrystallizes into melilite and grossite. A liquid field reappears at1630 K by reaction of melilite with the gas, and persists to 1390K. At 1026 bar and a dust enrichment of 10003, condensationof all phases occurs at even higher temperatures such that amuch greater range of bulk condensate compositions formsabove solidus temperatures, causing the liquid stability field toextend to higher temperature, 1880 K, and to persist withoutinterruption to 1370 K, replacing the stability fields ofCaAl2O4, melilite, and grossite.
At constant dust enrichment, condensation temperatures ofall phases are higher at 1023 bar than at 1026 bar becausepartial pressures of most condensable elements increase withPtot. As a result, the minimum dust enrichment necessary tocondense partial melts at 1023 bar is considerably lower than at1026 bar, and lies between 123 and 133. At 1023 bar, there is,at a dust enrichment of only 1003, an extensive and uninter-rupted stability field of liquid extending up to 2200 K andreplacing the stability fields of corundum, hibonite, grossite,CaAl2O4, and melilite. At higher dust enrichments at thisPtot,the liquid stability field extends to even higher temperatures.
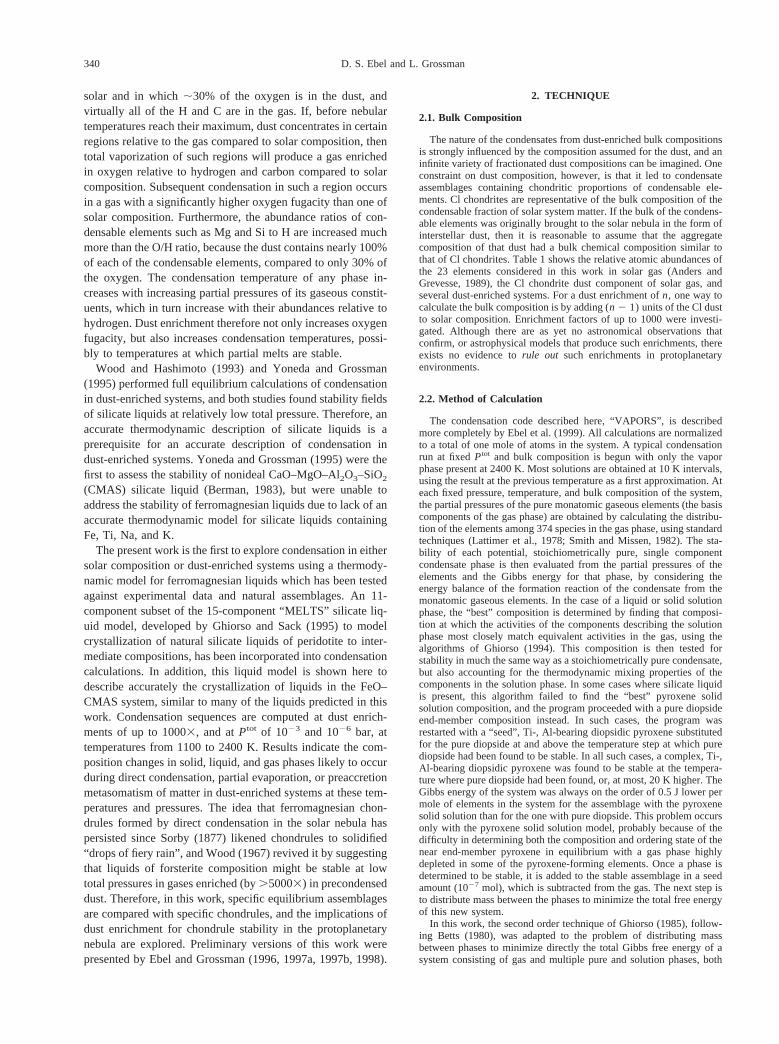
One way of viewing trends in the size of the liquid stabilityfield as a function ofPtot and dust enrichment is by comparisonof graphs of the distribution of silicon between condensedphases and vapor vs. temperature. Such diagrams are presented
Fig. 4. Variation of oxygen fugacity with temperature for gas in equilibrium with condensates at the stated conditions oftotal pressure and dust enrichment, with the iron–wu¨stite buffer curve (dash-dot pattern) shown for reference.
348 D. S. Ebel and L. Grossman
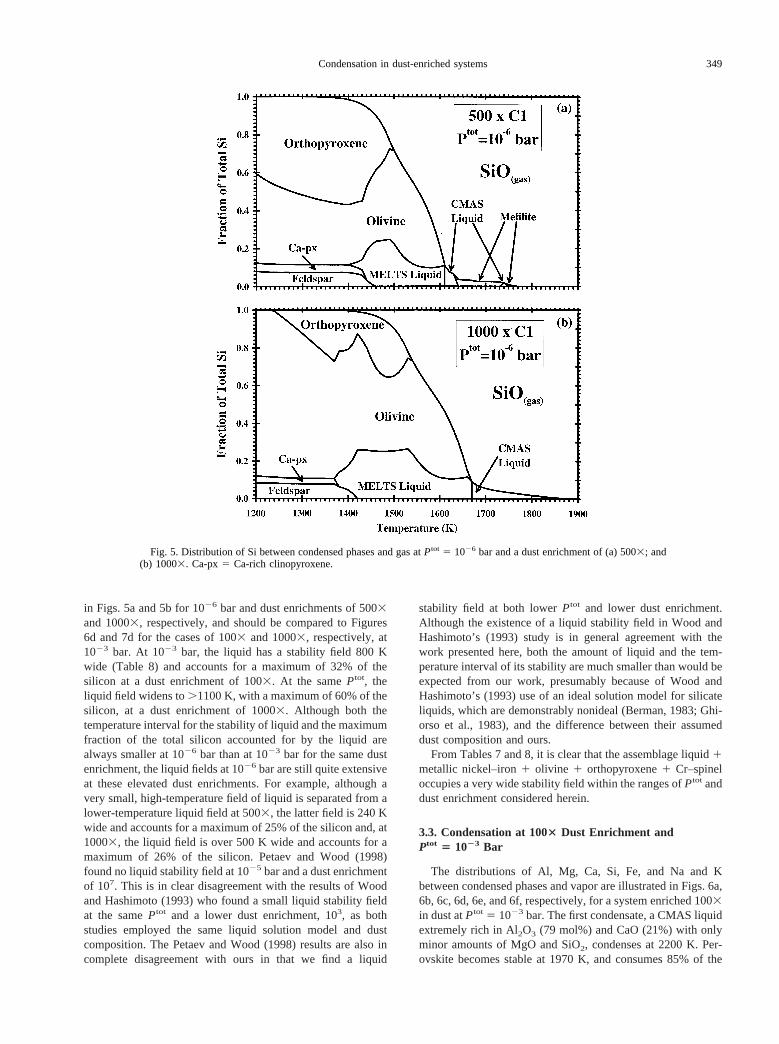
in Figs. 5a and 5b for 1026 bar and dust enrichments of 5003and 10003, respectively, and should be compared to Figures6d and 7d for the cases of 1003 and 10003, respectively, at1023 bar. At 1023 bar, the liquid has a stability field 800 Kwide (Table 8) and accounts for a maximum of 32% of thesilicon at a dust enrichment of 1003. At the samePtot, theliquid field widens to.1100 K, with a maximum of 60% of thesilicon, at a dust enrichment of 10003. Although both thetemperature interval for the stability of liquid and the maximumfraction of the total silicon accounted for by the liquid arealways smaller at 1026 bar than at 1023 bar for the same dustenrichment, the liquid fields at 1026 bar are still quite extensiveat these elevated dust enrichments. For example, although avery small, high-temperature field of liquid is separated from alower-temperature liquid field at 5003, the latter field is 240 Kwide and accounts for a maximum of 25% of the silicon and, at10003, the liquid field is over 500 K wide and accounts for amaximum of 26% of the silicon. Petaev and Wood (1998)found no liquid stability field at 1025 bar and a dust enrichmentof 107. This is in clear disagreement with the results of Woodand Hashimoto (1993) who found a small liquid stability fieldat the samePtot and a lower dust enrichment, 103, as bothstudies employed the same liquid solution model and dustcomposition. The Petaev and Wood (1998) results are also incomplete disagreement with ours in that we find a liquid
stability field at both lowerPtot and lower dust enrichment.Although the existence of a liquid stability field in Wood andHashimoto’s (1993) study is in general agreement with thework presented here, both the amount of liquid and the tem-perature interval of its stability are much smaller than would beexpected from our work, presumably because of Wood andHashimoto’s (1993) use of an ideal solution model for silicateliquids, which are demonstrably nonideal (Berman, 1983; Ghi-orso et al., 1983), and the difference between their assumeddust composition and ours.
From Tables 7 and 8, it is clear that the assemblage liquid1metallic nickel–iron1 olivine 1 orthopyroxene1 Cr–spineloccupies a very wide stability field within the ranges ofPtot anddust enrichment considered herein.
3.3. Condensation at 1003 Dust Enrichment andPtot 5 1023 Bar
The distributions of Al, Mg, Ca, Si, Fe, and Na and Kbetween condensed phases and vapor are illustrated in Figs. 6a,6b, 6c, 6d, 6e, and 6f, respectively, for a system enriched 1003in dust atPtot 5 1023 bar. The first condensate, a CMAS liquidextremely rich in Al2O3 (79 mol%) and CaO (21%) with onlyminor amounts of MgO and SiO2, condenses at 2200 K. Per-ovskite becomes stable at 1970 K, and consumes 85% of the
Fig. 5. Distribution of Si between condensed phases and gas atPtot 5 1026 bar and a dust enrichment of (a) 5003; and(b) 10003. Ca-px5 Ca-rich clinopyroxene.
349Condensation in dust-enriched systems
total Ti in the system by 1850 K. At 1830 K, gaseous Mg, Fe,and Cr begin to react with the liquid and perovskite to form anMg-, Al-rich spinel with minor amounts of Cr, Fe, and Ti. By1810 K, this spinel has molar Fe/Mg and Cr/Al ratios of 3.431023 and 1.33 1022, respectively, and a TiO2 content of 9.1wt.%, so much Ti that perovskite disappears at this tempera-ture. With falling temperature, Ti and Mg continue to condenseinto spinel, and Si and Mg into the liquid. The SiO2 and MgOcontents of the liquid increase, and the MgAl2O4 component ofthe spinel dissolves into the liquid. By 1780 K, the liquidreaches;40 wt.% SiO2 and;26% MgO, olivine (0.25 wt.%
FeO, 0.73% CaO) becomes stable and, as discussed above, thistriggers the switchover from the CMAS to the MELTS liquidmodel. At this point, the spinel has molar Fe/Mg and Cr/Alratios of 3.03 1023 and 2.33 1022, respectively and, becauseTi can now be accommodated by the liquid model, the TiO2
content of the liquid is 0.8 wt.% and Ti drops to only 0.44 wt.%in the spinel. With falling temperature, most olivine forms bywholesale condensation of Mg and Si from the gas but some bycrystallization of the liquid. With the total amount of liquiddecreasing slightly, the MgAl2O4 component of spinel contin-ues to dissolve into it, causing the molar Fe/Mg and Cr/Al
Fig. 6. Distribution of: (a) Al, (b) Mg, (c) Ca, (d) Si, (e) Fe, and (f) Na and K between condensed phases and vapor ata dust enrichment of 1003 at Ptot 5 1023 bar. Note vertical scale change in (e). Al–spinel5 spinel with#1 wt.% Cr2O3;Cr–spinel5 spinel with.1 wt.% Cr2O3. Other abbreviations as used previously.
350 D. S. Ebel and L. Grossman
ratios in spinel to rise to 9.03 1023 and 6.23 1022, respec-tively, just before spinel dissolves completely into the liquid at1710 K. With falling temperature, the FeO content of olivineincreases and its CaO decreases, reaching 0.89 and 0.48%,respectively, at the point where spinel disappears and 1.29%and 0.42%, respectively, at 1690 K, the initial condensationtemperature of metallic NiFe. This alloy contains 13.6 wt.% Ni,0.48% Co, and 0.24% Cr. As the temperature falls, olivine ofincreasing FeO and decreasing CaO content continues to con-dense from the gas, Si and Fe continue to condense into theliquid, diluting its MgO, Al2O3, and CaO contents, and metal of
decreasing Ni and Co and increasing Cr content continues tocondense. At 1620 K, when nearly all the Mg and 80% of theSi are condensed, gaseous SiO begins to react with olivine andliquid to form orthopyroxene, whose initial FeO content is 1.1wt.%. At this point, olivine contains 1.9 wt.% FeO and 0.23%CaO and the liquid contains 0.59 wt.% TiO2, 0.23% Cr2O3, and0.30% FeO. At 1600 K, gaseous Cr begins to react with theliquid to form a small amount of Cr–spinel, having molarFe/Mg and Cr/Al ratios of 0.049 and 2.1, respectively, and aTiO2 content of 0.26 wt.%. With falling temperature, orthopy-roxene of increasing FeO content continues to form by reaction
Fig. 7. Distribution of: (a) Al, (b) Mg, (c) Ca, (d) Si, (e) Fe, and (f) Na and K between condensed phases and vapor ata dust enrichment of 10003 at Ptot 5 1023 bar. Abbreviations as used previously.
351Condensation in dust-enriched systems
of gaseous SiO with liquid and with olivine of increasing FeOand CaO contents; all components of the metal alloy continueto condense, resulting in decreasing Ni, Co, and Cr contents;the amount of Cr–spinel continues to increase at the expense ofAl2O3 in the liquid and gaseous Cr; and the CaO and TiO2
contents of the liquid increase while its FeO and Cr2O3 con-tents decrease. By 1550 K, 1.8% of the K has condensed intothe liquid which contains 0.01 wt.% K2O. At 1450 K, 99% ofthe Fe is condensed, and gaseous Na begins to react with theliquid to form plagioclase feldspar containing 1.6 mol% albite.At this point, olivine contains 2.30 wt.% FeO and 0.34% CaO,Cr–spinel has molar Fe/Mg and Cr/Al ratios of 0.053 and 1.43,respectively, and 0.34 wt.% TiO2, and liquid contains 0.93wt.% TiO2, 0.20% Cr2O3, 0.19% FeO, 0.06% K2O, and 0.01%Na2O. At 1440 K, a diopsidic clinopyroxene begins to cocrys-tallize with feldspar from the remaining liquid, which reaches0.15 wt.% K2O and 0.03% Na2O before disappearing at 1390K. With continued cooling, gaseous Na and K react withanorthitic feldspar, increasing its albite and orthoclase contentsand displacing Ca which, in turn, reacts with orthopyroxene toform clinopyroxene and olivine. The FeO contents of olivine,orthopyroxene, clinopyroxene, and spinel all increase as me-tallic Fe becomes oxidized, causing the Ni and Co contents ofthe alloy to increase even as its Cr content decreases due toreaction with spinel. At 1350 K, gaseous Mn reacts with Ti inthe spinel and clinopyroxene to form an oxide solid solutionconsisting of pyrophanite [MnTiO3] with 9.4 wt.% MgO and2.6% FeO. At 1300 K, the remaining gaseous Mn begins tocondense as MnO. By 1200 K, olivine contains 3.6 wt.% FeOand 0.10% CaO; clinopyroxene contains 1.4% Al2O3, 0.62%FeO, 0.25% TiO2, and 0.27% Na2O; spinel has molar Fe/Mgand Cr/Al ratios of 0.13 and 5.1, respectively, and a TiO2
content of 0.59%; and the oxide solid solution contains only1.3% MgO and 1.6% FeO. At this temperature, Na, K, and Mnare only partially condensed, with 15%, 43%, and 3.5%, re-spectively, remaining in the vapor.
3.4. Condensation at 10003 and Ptot 5 1023 Bar
The distributions of Al, Mg, Ca, Si, Fe, and Na and Kbetween condensed phases and vapor are illustrated in Figs. 7a,7b, 7c, 7d, 7e, and 7f, respectively, for a system enriched10003 in dust atPtot 5 1023 bar. At a dust enrichment of10003, a CMAS liquid is already present at 2400 K, into which75% of the Al and 27% of the Ca have condensed. At 2050 K,gaseous Ti, Mg, Cr, and Fe begin to react with Al2O3 in theliquid to form a spinel containing 44.8 wt.% MgO, 39.5% TiO2,12.7% Al2O3, 1.8% Cr2O3, 1.1% FeO, and 0.12% Fe2O3. At1990 K, olivine begins to form primarily by condensation fromthe gas but some also by crystallization from the liquid, and theswitch is made from the CMAS to the MELTS liquid modelwhich, because the latter can accommodate TiO2, causes thetitanian spinel to dissolve into the liquid. The initial olivinecontains 0.92 wt.% FeO and 0.23% CaO but, as Fe and Mgcondense into it, reaches 10.8% FeO and 0.13% CaO by 1800K. Over the same temperature range, as Fe and Cr condenseinto the liquid, the composition of the latter evolves from 0.73wt.% FeO, 0.39% TiO2, 0.02% Cr2O3, and,0.01% Fe2O3 to24.2% FeO, 0.23% TiO2, 0.90% Cr2O3, and 0.19% Fe2O3.Metal alloy containing 20.0 wt.% Ni, 0.70% Co, and 0.09% Cr
begins to condense at 1800 K, and reaches 11.7% Ni, 0.52%Co, and 0.06% Cr by 1720 K. In this temperature range, olivinecontinues to form at the expense of liquid and reaches 14.3wt.% FeO and 0.13% CaO, while the liquid compositionevolves to 25.9 wt.% FeO, 0.25% TiO2, 1.22% Cr2O3, and0.16% Fe2O3. At 1710 K, a small amount of Cr–spinel beginsto form by drawing Al and most of its Cr from the liquid butsome of its Cr also from the gas and the metal. Initially, it hasmolar Fe/Mg and Cr/Al ratios of 0.62 and 3.79, respectively,and contains 1.10 wt.% Fe2O3 and 0.27% TiO2, but varies incomposition as it continues to crystallize from the liquid withfalling temperature, reaching molar Fe/Mg and Cr/Al ratios of1.34 and 2.29, respectively, with 1.42 wt.% Fe2O3 and 1.07%TiO2 at 1440 K. Over the same temperature range, the amountof olivine continues to increase with falling temperature, draw-ing its MgO, SiO2, and CaO from the liquid. From 1710 to1560 K the FeO consumed by olivine comes from both liquidand gas but, at 1560 K (the temperature below which,1% ofthe Fe remains in the gas) oxidation of the metal alloy joins theliquid as a source of the FeO for continued production ofolivine. The amount of metal alloy increases with falling tem-perature from 1710 to 1560 K, as gaseous Fe continues tocondense into it, diluting its Ni, Co, and Cr concentrations to9.3 wt.% Ni, 0.43% Co, and 0.01% Cr at 1560 K. Below 1560K, however, oxidation of Fe causes the amount of metal todecrease with falling temperature, increasing its Ni and Cocontents to 10.0 and 0.46 wt.%, respectively, by 1440 K. Its Crcontent continues to decrease due to formation of increasingamounts of Cr–spinel with falling temperature. Olivine con-tains 21.1 wt.% FeO and 0.24% CaO at 1560 K, and 24.6%FeO and 0.45% CaO at 1440 K. As the amount of liquiddecreases with falling temperature, its FeO, Cr2O3, and Fe2O3
contents progressively decrease, reaching 17.6 wt.%, 0.45%and 0.02%, respectively, at 1560 K and 10.8%, 0.12%, and0.01% at 1440 K; and its TiO2, Na2O, K2O, and P2O5 contentsprogressively increase, reaching 0.43 wt.%, 0.29%, 0.10%, and,0.01%, respectively, at 1560 K and 0.56%, 2.79%, 0.35%,and 0.20% at 1440 K. At 1480 K, MnO condenses and, at 1430K, plagioclase containing 34.4 mol% albite and 0.35% ortho-clase begins to crystallize from the liquid. As the amount ofplagioclase increases with falling temperature, its albite andorthoclase contents also increase. Although the Na required forthis is supplied by both gas and liquid, the K is derived onlyfrom the liquid, with the proportion of K residing in the vaporactually increasing initially with falling temperature. At 1390K, a diopside-rich clinopyroxene, containing 4.7 wt.% FeO,2.3% Al2O3, 0.18% Na2O, 0.36% TiO2, and 0.09% Fe2O3,crystallizes from the liquid. At 1380 K, a pyrophanite-richoxide solid solution, containing 9.53 wt.% FeO, 1.02% MgO,and 0.52% Fe2O3, forms by reaction of gaseous Mn with TiO2
in the liquid; and gaseous sulfur begins to react with metallic Feto form pyrrhotite, Fe0.877S. The concentrations of Ni and Co inthe residual alloy are 11.5 wt.% and 0.53%, respectively, butincrease sharply as more pyrrhotite forms with falling temper-ature, reaching 21.4% and 0.98%, respectively, at 1310 K. At1350 K, gaseous P reacts with the liquid to form whitlockite. At1320 K, just before disappearing, the liquid contains 10.1 wt.%Na2O, 4.52% FeO, 1.34% K2O, 0.77% P2O5, 0.41% TiO2 and0.02% Cr2O3. At 1260 K, olivine contains 27.3 wt.% FeO and0.31% CaO; clinopyroxene contains 4.5 wt.% FeO, 1.6%
352 D. S. Ebel and L. Grossman
Al2O3, 0.33% Na2O, 0.33% TiO2, and 0.07% Fe2O3; Cr–spinelhas molar Fe/Mg and Cr/Al ratios of 2.9 and 7.5, respectively,and contains 2.8 wt.% TiO2 and 1.5% Fe2O3; the pyrophanite-rich solid solution contains 9.2 wt.% FeO, 0.86% MgO, and0.45% Fe2O3; and the metal alloy contains 27.5 wt.% Ni and1.3% Co. At this point, 97.8% of the P is condensed aswhitlockite, 65.1% of the sulfur as pyrrhotite, and 90.0% of theNa and 65.5% of the K as feldspar. The ratio of the proportionof Fe in sulfide to that in metal is 2.2.
3.5. Direct Condensation of Oxidized Iron at HighTemperature
The historical motivation behind studying dust enrichment inthe solar nebula was to increase the oxygen fugacity so as toproduce condensates that are more oxidized than is possible ina gas of solar composition. For example, one of the mostperplexing problems for condensation theory is how to producethe observed molar Fe/Fe1 Mg ratios that range from 0.2 inolivine and pyroxene in H-group ordinary chondrites, to 0.3 inthe LL group, to 0.5 or above in the matrices of some CV3chondrites. Solar gas is so reducing that all Fe condensesinitially as metal. In order to produce FeO-rich silicates, oxi-dation of this metal, which occurs only at or below;500 K,
must be followed by diffusion of Fe21 through the crystalstructures of pre-existing silicates. This requires equilibrationbetween solids and a low-density gas and efficient diffusionthrough nearly close-packed silicate structures at temperatureswhere the rates of these processes are so low that most workersdoubt chondritic matter obtained its oxidation state in this way.
The extent to which this problem is alleviated here is illus-trated by the fayalite content of olivine and ferrosilite contentof orthopyroxene, which are plotted as functions of temperatureat various dust enrichments at 1023 bar in Figs. 8a and b and at1026 bar in Figs. 8c and 8d. In the dust-enriched systemsconsidered in these calculations, the oxygen fugacity is so highthat significant amounts of FeO are stable in olivine and py-roxene at very high temperatures, where gas–solid equilibrationis much more likely and diffusion rates are expected to be muchhigher than at the low temperatures where FeO would becomestable in a solar gas. In dust-enriched systems, not only does thefirst-condensing olivine contain significant quantities of FeO,but also, as the temperature falls below the initial condensationtemperature of olivine, the equilibrium fayalite content is pre-dicted to increase while additional olivine condenses from thegas. In this temperature interval of direct olivine condensation,Fe21 is incorporated into each olivine grain as it grows directly
Fig. 8. Mole fraction of iron end-member at 1023 bar in: (a) olivine and (b) orthopyroxene and at 1026 bar in (c) olivineand (d) orthopyroxene as a function of temperature and at dust enrichment factors with integral multiples of 100.Trajectories of the condensation temperature of metallic nickel–iron alloy, the temperature at which direct condensation ofolivine ceases, the temperature at which.98% of the total iron is condensed, and the temperature of disappearance ofsilicate liquid are indicated.
353Condensation in dust-enriched systems
from the vapor phase. The assumption of thermodynamic equi-librium requires that all olivine at a given temperature have thesame fayalite content, and that is the value computed here. Thisrequires that the relatively fayalite-poor olivine condensed athigh temperature must become as fayalite-rich as newly con-densing olivine at a lower temperature. If, even at the hightemperatures being discussed here, the Fe21 contents of theinteriors of the previously formed olivine crystals cannot in-crease fast enough to maintain equilibrium, the newly condens-ing olivine at any temperature will have even higher fayalitecontents than calculated here. For all dust enrichments consid-ered here at 1026 bar, and for dust enrichments,8003 at 1023
bar, we can consider this stage, olivine formation by directcondensation from the gas, to end at the temperature whereolivine begins to react with the gas to form orthopyroxene. Fordust enrichments$8003 at 1023 bar, however, direct conden-sation of olivine ceases at a higher temperature than that fororthopyroxene formation because the fraction of the total Siremaining in the gas becomes very small,,1%. The trajectoryof the temperature of cessation of direct olivine condensation ismarked on Figs. 8a and 8c. At both values ofPtot, a liquid ispresent which persists to temperatures well below that whereorthopyroxene begins forming. The FeO contents of olivine andorthopyroxene continue to rise with falling temperature and,with liquid present, this can occur by equilibration of olivineand orthopyroxene with the liquid. This is a much more kinet-ically favorable process for forming FeO-rich silicates thanequilibration with a low-density gas.
At 1023 bar, XFa for the first-condensing olivine is only2.5 3 1023, 5.1 3 1023, and 9.13 1023 at dust enrichmentsof 1003, 5003, and 10003, respectively. At the temperaturewhere olivine condensation ends, however,XFa has increasedto 0.019, 0.088, and 0.164 at dust enrichments of 1003, 5003,and 10003, respectively, and, at the temperature of disappear-ance of liquid,XFa is 0.025, 0.14, and 0.31. At 1026 bar,XFa islower in the first-condensing and last-condensing olivine thanat 1023 bar and the same dust enrichment, and almost the sameat the temperature where the liquid disappears. Below thesolidus, continued increase in the FeO content of olivine withdecreasing temperature is governed by multiphase equilibrium,which would be impeded not only by slow diffusion of Fe21
into silicates but also by slow solid-state reaction rates betweenolivine, orthopyroxene, clinopyroxene, and plagioclase, and byslow reaction between gaseous oxidizing agents and metalliciron. If the arbitrary assumption is made that multiphase equi-librium can be maintained to temperatures as low as 1200 K,nebular olivine can be expected to haveXFa of 0.036 and 0.21at dust enrichments of 1003 and 5003, respectively, at 1023
bar, and 0.036, 0.23, and 0.40 at dust enrichments of 1003,5003, and 10003, respectively, at 1026 bar. Higher FeOcontents require equilibration to lower temperatures underthese conditions or condensation at higher dust enrichments.
At a givenPtot, the temperature at which gaseous SiO beginsto react with olivine to form orthopyroxene increases, reachesa maximum, and finally decreases with progressively increas-ing dust enrichment. At a dust enrichment of 10003, there is noorthopyroxene stability field at all at 1023 bar. At relatively lowdust enrichments, the orthopyroxene condensation temperatureincreases with increasing dust enrichment due to the attendantincrease in the partial pressure of SiO. Accompanying this,
however, is an increase in the (FeO1 MgO)/SiO2 ratio of thesilicate fraction of the condensate due to the increase in oxygenfugacity with increasing dust enrichment. This tends to stabilizeolivine at the expense of orthopyroxene. A dust/gas ratio isreached beyond which the stabilizing effect on orthopyroxeneof the increasing partial pressure of SiO is outweighed by thestabilizing effect on olivine of the increasing (FeO1 MgO)/SiO2 ratio. This causes the orthopyroxene field to shrink at theexpense of the olivine field with increasing dust/gas ratio, andeventually disappear altogether.
3.6. Bulk Chemical Composition of Condensates
In Figures 9a and 9b, the bulk chemical composition of thetotal condensate is plotted as a function of temperature at aPtot
of 1023 bar and a dust enrichment of 5603. Features of thisdiagram which are common to condensation at all dust enrich-ments are the early entry of Al, Ca, and Ti relative to Mg andSi, as well as the relatively late entry of Na, K, and Mn into thecondensates. Features specific to condensation at this dustenrichment are the relative proportions of metal, FeO, andsulfide as a function of temperature. This particular dust en-richment was chosen because it yields a single temperature atwhich the distribution of Fe between metal, sulfide, and silicatematches closely the distribution found in H-group ordinarychondrites and results in a bulk chemical composition veryclose to the average of those meteorites. For example, at 1310K the total condensate and, for comparison (brackets), theaverage H-group chondrite fall from Jarosewich (1990) contain18.8 (17.8) wt.% Fe1 Ni 1 Co metal, 10.2 (10.3)% FeO, 5.9(5.4)% FeS, 34.2 (36.6)% SiO2, and 24.6 (23.3)% MgO. Sim-ilarly, at the samePtot and a slightly higher dust enrichment of
Fig. 9. Concentrations of: (a) major and (b) minor components of thetotal condensate as a function of temperature at the stated conditions.Filled circles indicate average composition of H-group chondrites.
354 D. S. Ebel and L. Grossman
6753, a temperature can be found at which the bulk chemicalcomposition of the condensate comes very close to the averagecomposition of L-group chondrite falls from Jarosewich(1990). In the following comparison, sufficient metal of thesame composition as that in Jarosewich’s average L-groupchondrite has been added to his average L-group chondrite bulkcomposition to yield the same atomic Fe/Si ratio as in H-groupchondrites. At 1330 K, the condensate contains 16.8 (16.1)wt.% metal, 12.9 (13.2)% FeO, 5.5 (5.3)% FeS, 34.0 (36.3)%SiO2, and 24.5 (22.6)% MgO. In both cases, the MgO/SiO2
ratio of the condensate is higher than in the chondrite due to thefact that the relative abundances of nonvolatile elements in themodel system are those of Cl chondrites, which are known tohave a higher atomic Mg/Si ratio than ordinary chondrites.Nevertheless, the close correspondence in composition betweenthe predicted condensates and the chondrite averages serves toemphasize the point that the distribution of iron between metal,
silicate, and sulfide in ordinary chondrites could have beenestablished during high-temperature condensation in a dust-enriched system.
3.7. Composition of Silicate Liquid
The temperature variation of the composition of the silicatemelt is shown for the cases of 1023 bar and a dust enrichmentof 1003 in Figures 10a and 10b, 1023 bar and a dust enrich-ment of 10003 in Figures 10c and 10d, and for 1026 bar anda dust enrichment of 10003 in Figures 10e and 10f. Theevolution of the liquid composition is similar in all cases, butsome exceptions are noteworthy. Because Al is more refractorythan Ca, the Al2O3 content of the initial liquid is very high butfalls with decreasing temperature due to dilution by CaO whichcondenses more gradually with falling temperature. Similarly,at lower temperatures, incipient condensation of more volatile
Fig. 10. Compositions of condensate liquids at: (a), (b) 1023 bar and a dust enrichment of 1003; (c), (d) 1023 bar anda dust enrichment of 10003; and (e), (f) 1026 bar and a dust enrichment of 10003. In all cases, the vertical line marks thecondensation temperature of olivine, where the transition between CMAS and MELTS liquid models is made. In (e) and(f), Na2O # 0.01 wt.%. Inflection points are due to the onset of crystallization or disappearance of a coexisting phase, andare labelled as follows: a, spinel in; d, metal in; e, orthopyroxene in; f, Cr–spinel in; g, feldspar in; h, clinopyroxene in; k,rhombohedral oxide in; p, perovskite in; q, clinopyroxene in and liquid out.
355Condensation in dust-enriched systems
Si and Mg into the liquid causes the concentrations of SiO2 andMgO to increase, diluting both Al2O3 and CaO. ComparingFigs. 10a and 10c it is seen that for liquids that form at highertemperatures than olivine, similar liquid compositions are sta-ble at temperatures 300 K higher when the dust enrichment isincreased by a factor of 10 at 1023 bar. Similarly, comparingFigs. 10c and 10e reveals that liquids of similar compositionform about 400 K higher whenPtot is increased by a factor of1000 at a dust enrichment of 10003. Note however that at thecondensation temperatures of olivine, liquid compositions arequite different from one another at different combinations ofPtot and dust enrichment. For example, the concentrations ofMgO and SiO2 in the liquid at a dust enrichment of 10003 arealmost the same where olivine condenses at 1023 bar (Fig. 10c)but the SiO2 content is more than double that of MgO at 1026
bar (Fig. 10e). One way of understanding this is by consideringthe fact that the solubility of olivine in a melt of a givencomposition is quite different at temperatures hundreds ofdegrees apart.
Below the condensation temperature of olivine, the maindifference in major element trends of the liquid at differentcombinations ofPtot and dust enrichment, aside from those of
FeO and alkalis, is the failure of the SiO2 concentration to leveloff with falling temperature at a dust enrichment of 10003 at1023 bar (Fig. 10c) as it does at a dust enrichment of 1003 at1023 bar (Fig. 10a) and 10003 at 1026 bar (Fig. 10e). This isentirely due to the absence of orthopyroxene from the crystal-line assemblage in equilibrium with the liquid at a dust enrich-ment of 10003 at 1023 bar. It is the condensation of this phasethat triggers the flattening of the SiO2 curve under the other setsof conditions. Of the three cases shown, it is at a dust enrich-ment of 10003 and 1023 bar where the Cr2O3 content of theliquid is highest, climbing to 1.2 wt.% with falling temperature,and then declining after Cr–spinel becomes stable at 1710 K(Fig. 10d). At a dust enrichment of 1003 at 1023 bar, thisphase becomes stable at 1600 K, before the Cr2O3 content ofthe liquid reaches 0.36 wt.% (Fig. 10b). At a dust enrichment of10003 at 1026 bar, Cr–spinel coexists with the MELTS liquidover its entire stability range, preventing its Cr2O3 content fromexceeding 0.28 wt.% (Fig. 10f). As the amount of liquid be-comes vanishingly small during near-solidus crystallization ofclinopyroxene and plagioclase, concentrations of TiO2 are seento build up in the last dregs of liquid. Only at a dust enrichmentof 10003 at 1023 bar does this trend reverse itself. This is due
Fig. 10 (Continued)
356 D. S. Ebel and L. Grossman
to stabilization of a pyrophanite-rich solid solution at a tem-perature above that for the disappearance of liquid. As seen bycomparing Figs. 10b, 10d, and 10f, alkali contents of the liquidincrease both with increasingPtot and with increasing dustenrichment because the partial pressures of sodium and potas-sium increase with both parameters. As a result, Na2O and K2Oconcentrations in the liquid are negligible at 1026 bar, even ata dust enrichment of 10003. In the other cases shown, Na2Oand K2O concentrations rise above negligible levels onlywithin 100 to 200 K of the temperature of disappearance ofliquid, reaching maxima of 10.1 and 1.3 wt.%, respectively, at1023 bar and a dust enrichment of 10003. At a dust enrichmentof 10003, the FeO content of the liquid at 1023 bar is higherthan at 1026 bar at most temperatures (Figs. 10c and 10e),considerably so at some temperatures. BecausefO2
is onlyweakly dependent onPtot at 1500 to 1600 K, the higher FeOcontent of the liquid is due simply to the higherPFe at higherPtot, which causes a greater proportion of the iron to be con-densed at any given temperature.
In most cases, the liquid disappears in the temperature inter-val 1370 to 1400 K, the approximate location of the peridotitesolidus at 1 bar (see Table 5). An exception to this general rule
is found in Table 8 for the case of a dust enrichment of 10003at 1023 bar, where the liquid persists to 1310 K. At the samePtot and a dust enrichment of 5003, the liquid disappears at asignificantly higher temperature, 1400 K. Similarly, at the samedust enrichment (10003) and lowerPtot (1026 bar) the liquidalso disappears at a much higher temperature (1370 K). At1023 bar, the reason for the different solidification tempera-tures at the different dust enrichments is evident from a com-parison of the liquid compositions in the two cases at 1410 K,the last temperature step before the liquid disappears at a dustenrichment of 5003. At this temperature, the liquid at thelower dust enrichment contains slightly less Na2O (2.67 wt.%)and much less FeO (3.26%) than the liquid at the higher dustenrichment (3.81% and 9.46%, respectively) and high concen-trations of both of these oxides are known to depress solidustemperatures. At a dust enrichment of 10003, the reason forthe different solidification temperatures at the different totalpressures is found in the different liquid compositions at 1380K, the last temperature step before the liquid disappears at 1026
bar. Although the FeO content of the liquid is slightly lower at1023 than at 1026 bar, 7.54 vs. 9.51 wt.%, the Na2O concen-tration is much higher at 1023 than at 1026 bar, 5.89 vs.,0.01
Fig. 10. (Continued)
357Condensation in dust-enriched systems
wt.%. This is because the partial pressure of Na is more than afactor of 200 higher at 1380 K at 1023 bar than at 1026 bar.Furthermore, because Na continues to condense into the liquidin this temperature range, the lower the temperature to whichthe liquid persists, the higher its Na2O content becomes, andthis further lowers the ultimate temperature of its disappear-ance.
3.8. Composition of Spinel
The numbers of cations in spinel per four oxygen atoms areplotted as a function of temperature at dust enrichments of1003 and 10003 at 1023 bar in Figures 11aand 11b, respec-tively, and 10003 at 1026 bar in Figure 11c. In all cases, thehighest temperature spinel forms by reaction of gaseous Mgwith TiO2 in perovskite and Al2O3 in the CMAS liquid, exceptat 10003 and 1023 bar, where all Ti is from the gas. In thisspinel, the Ti cations first increase with falling temperature asperovskite and/or gaseous Ti are consumed and then decreasesharply when the MELTS liquid, which can accommodate Ti,becomes stable. Both stages proceed in accordance with thecoupled substitution of Mg21 1 Ti41 5 2Al31, and are ac-companied by steadily rising numbers of Fe and Cr cationswhich are condensing from the gas. As discussed previously,the high Ti contents of these spinels and possibly even their
existence, may be artifacts of the inability of the CMAS liquidto accommodate Ti. The incoming of the MELTS liquid causesthe very Ti-rich spinel at 10003 and 1023 bar to dissolvesuddenly, and the less Ti-rich spinel at 1003 and 1023 bar todissolve gradually before disappearing. The even lower Tispinel at 10003 and 1026 bar continues to crystallize withfalling temperature, gradually becoming first more Cr-rich andthen more Fe-rich. As shown in Fig. 11c, the Cr/Al ratio levelsoff below 1390 K, as formation of spinel continues by reactionof gaseous Cr with Al2O3 in the liquid. When spinel re-formsin the two cases at 1023 bar, its Cr/Al ratio falls, as the spineldraws down Al2O3 from the liquid while deriving its Cr fromthe metal alloy and the gas at 1003, and from the metal alloyand the liquid at 10003. In all three cases, these trends areinterrupted by plagioclase formation, which draws Al2O3 fromthe MgAl2O4 component of the spinel, increasing the Cr/Alratio and decreasing the amount of spinel. Plagioclase forma-tion also causes an increase in the rate of increase of thenumber of Ti cations in the spinel with decreasing temperature,accompanied by an increase in the number of Mg and/or Feions in accordance with the above coupled substitution. Atlower temperature, the number of Ti ions in the spinel begins todecrease with decreasing temperature due to extraction of Tiinto pyrophanite or, at 1003 and 1023 bar, clinopyroxene.
3.9. Composition of Clinopyroxene
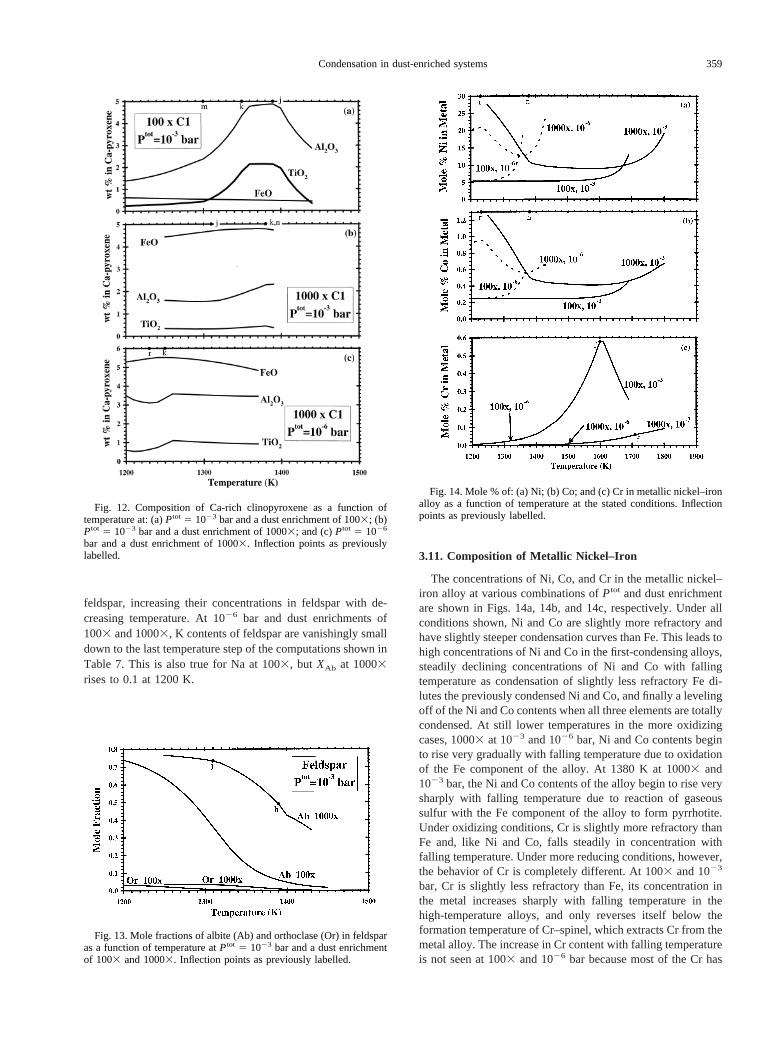
The concentrations of FeO, Al2O3, and TiO2 in clinopyrox-ene are plotted as a function of temperature at 1023 bar anddust enrichments of 1003 and 10003, and at 1026 bar and10003 in Figures 12a, 12b, and 12c, respectively. The amountof clinopyroxene increases with falling temperature in all threecases due either to crystallization from the liquid or, after liquidis exhausted, to reactions among plagioclase, orthopyroxene,and olivine, as can be seen in Figs. 6 and 7 for the cases at 1023
bar. The proportion of the total Fe accounted for by clinopy-roxene increases with falling temperature as metal is oxidized,but the concentration of FeO may rise or fall depending on therelative rates of formation of Mg and Fe end-members. Simi-larly, the proportions of the total Al and Ti accounted for byclinopyroxene increase with falling temperature as this phasecrystallizes from the liquid in the cases at 1023 bar, but theconcentrations of Al2O3 and TiO2 may increase or decreasewith falling temperature due to the relative formation rates ofthe different pyroxene end-members. At 1023 bar and 1003and at 1026 bar and 10003, a temperature is reached belowwhich the Al2O3 and TiO2 concentrations begin to fall withdecreasing temperature, as plagioclase begins to draw itsAl2O3, and pyrophanite its TiO2, from clinopyroxene.
3.10. Composition of Feldspar
The mole fractions of albite and orthoclase in feldspar areplotted as functions of temperature at 1023 bar and dust en-richments of 1003 and 10003 in Figure 13. The amount offeldspar and its albite and orthoclase contents increase steadilywith decreasing temperature in both cases. Above the temper-ature of disappearance of liquid, feldspar draws its Na fromboth liquid and gas, but its K from the liquid only. Below thistemperature, Na and K continue to condense from the gas into
Fig. 11. Composition of spinel as a function of temperature at: (a)Ptot 5 1023 bar and a dust enrichment of 1003; (b) Ptot 5 1023 barand a dust enrichment of 10003; and (c)Ptot 5 1026 bar and a dustenrichment of 10003. Inflection points labelled as in Fig. 10, plus: b,perovskite out; c, olivine in; j, liquid out; m, MnO in; n, pyrrhotite in;r, orthopyroxene out.
358 D. S. Ebel and L. Grossman
feldspar, increasing their concentrations in feldspar with de-creasing temperature. At 1026 bar and dust enrichments of1003 and 10003, K contents of feldspar are vanishingly smalldown to the last temperature step of the computations shown inTable 7. This is also true for Na at 1003, but XAb at 10003rises to 0.1 at 1200 K.
3.11. Composition of Metallic Nickel–Iron
The concentrations of Ni, Co, and Cr in the metallic nickel–iron alloy at various combinations ofPtot and dust enrichmentare shown in Figs. 14a, 14b, and 14c, respectively. Under allconditions shown, Ni and Co are slightly more refractory andhave slightly steeper condensation curves than Fe. This leads tohigh concentrations of Ni and Co in the first-condensing alloys,steadily declining concentrations of Ni and Co with fallingtemperature as condensation of slightly less refractory Fe di-lutes the previously condensed Ni and Co, and finally a levelingoff of the Ni and Co contents when all three elements are totallycondensed. At still lower temperatures in the more oxidizingcases, 10003 at 1023 and 1026 bar, Ni and Co contents beginto rise very gradually with falling temperature due to oxidationof the Fe component of the alloy. At 1380 K at 10003 and1023 bar, the Ni and Co contents of the alloy begin to rise verysharply with falling temperature due to reaction of gaseoussulfur with the Fe component of the alloy to form pyrrhotite.Under oxidizing conditions, Cr is slightly more refractory thanFe and, like Ni and Co, falls steadily in concentration withfalling temperature. Under more reducing conditions, however,the behavior of Cr is completely different. At 1003 and 1023
bar, Cr is slightly less refractory than Fe, its concentration inthe metal increases sharply with falling temperature in thehigh-temperature alloys, and only reverses itself below theformation temperature of Cr–spinel, which extracts Cr from themetal alloy. The increase in Cr content with falling temperatureis not seen at 1003 and 1026 bar because most of the Cr has
Fig. 12. Composition of Ca-rich clinopyroxene as a function oftemperature at: (a)Ptot 5 1023 bar and a dust enrichment of 1003; (b)Ptot 5 1023 bar and a dust enrichment of 10003; and (c)Ptot 5 1026
bar and a dust enrichment of 10003. Inflection points as previouslylabelled.
Fig. 13. Mole fractions of albite (Ab) and orthoclase (Or) in feldsparas a function of temperature atPtot 5 1023 bar and a dust enrichmentof 1003 and 10003. Inflection points as previously labelled.
Fig. 14. Mole % of: (a) Ni; (b) Co; and (c) Cr in metallic nickel–ironalloy as a function of temperature at the stated conditions. Inflectionpoints as previously labelled.
359Condensation in dust-enriched systems
already condensed as Cr–spinel at a higher temperature thanthat where the metal alloy begins to condense. While high Siconcentrations in metallic nickel–iron alloys can result fromcondensation from gases more reducing than a gas of solarcomposition,XSi is always,1024 in the systems considered inthis work.
3.12. Metal–Sulfide Condensate Assemblages
Because of the high concentration of sulfur in dust of Clcomposition, enrichment in such dust leads to much higherfS2
and permits sulfide phases to condense at higher temperaturesat a givenPtot than in a gas of solar composition. Inspection ofTable 7 reveals that no sulfide phase becomes stable above thelast temperature step of the calculations at any of the dustenrichments shown at 1026 bar, but that at 1023 bar pyrrhotite(Fe0.877S) joins metallic nickel–iron as a stable condensate at1330 and 1380 K at dust enrichments of 5003 and 10003,respectively. These temperatures are higher than minimummelting temperatures in the Ni-poor part of the Fe–Ni–S systembut, since our computer program does not contain a thermody-namic model for Fe–Ni–S liquids, it would be unable to predicttheir existence even if they were more stable than the metal1pyrrhotite assemblages that are predicted. In order to see ifsulfide liquids are more stable than the predicted assemblages,the relative atom proportions of Fe and S were calculated forthe metallic nickel–iron1 pyrrhotite assemblage predicted ateach temperature step for dust enrichments of 5003, 8003,and 10003 at 1023 bar, and are plotted on a portion of theliquid-crystal phase relations in the Fe–S binary (Chuang et al.,1986a) in Figure 15. The dashed curves in this figure are thephase boundaries that result from addition of 7% Ni to thesystem, taken from the work of Hsieh et al. (1982), projectedonto the Fe–S plane. Under all conditions, the trajectory of thecondensate compositions initially falls vertically along the leftmargin of the diagram until the temperature of pyrrhotite for-mation is reached. Below this, the trajectories extend to theright and downward, well above the eutectic temperature of
1262 K and well within the field ofg–iron 1 Fe–S liquid. Thesolid assemblage of metallic nickel–iron1 pyrrhotite predictedby our thermodynamic model to condense under these condi-tions is thus seen to form at temperatures where it is actuallymetastable relative to metallic iron1 Fe–S liquid. Nickel,cobalt, and chromium are also predicted to condense into themetal alloy, but the amounts of Co and Cr are quite small andthe phase relations are seen to change very little with theaddition of 7% Ni, a fairly representative concentration in thesecondensate assemblages. We conclude that, at these relativelyhigh total pressures and dust enrichments, direct condensationof iron–sulfide liquids will occur. Furthermore, because theliquid-bearing assemblage obviously has a lower Gibbs freeenergy than the predicted assemblage, the temperature of ap-pearance of sulfide liquid will actually be higher than thecondensation temperature of pyrrhotite. Recall that the silicateliquid in the 5003 case solidifies at 1400 K, which is wellabove the minimum condensation temperature of sulfide liquid,but that the silicate liquid at 10003 does not solidify until 1310K, almost 100 K below the minimum condensation temperatureof sulfide liquid in this case. This means that, at the highest dustenrichment factors at highPtot, condensation of coexistingsilicate and sulfide liquids occurs, assuming they are not mis-cible.
4. DISCUSSION
4.1. Stability of Silicate Liquid in Solar Gas
The calculations show that no liquids are stable in a gas ofsolar composition, even at a total pressure as high as 1023 bar.Any liquids formed by the partial or complete melting ofagglomerated solids (Whipple, 1966; Lofgren, 1996) wouldtherefore be highly unstable with respect to partial evaporationin a solar nebula of canonical composition, and would becomeeven more unstable with decreasing pressure. Such liquidswould lose FeO and alkali metals most readily, followed by Mgand Si, then Ca and Al with increasing temperature.
Experimentally determined evaporation rates of Na2O fromliquids of chondrule composition (Radomsky and Hewins,1990; Tsuchiyama et al., 1981; Yu and Hewins, 1998) showthat Na loss is faster at lower total pressures and lowerfO2
.However, Lewis et al. (1993) showed that sodium loss in alkaliolivine basalt melt droplets (3.05 wt.% Na2O) was nearlyattenuated upon heating above 1600 K atPtot 5 1 bar, at theiron–wustite buffer in a CO/CO2 1 NaCl vapor withPNa .4 3 1026 atm. The present calculations show that these con-ditions are roughly equivalent to a Cl dust enrichment factorwell in excess of 10003 at 1023 bar. Lewis et al. (1993), basedon their experiments and following Wood (1984), suggestedchondrule formation in ‘clumps’ where the local partial pres-sures of condensable elements and oxygen were enhanced byvolatilization of chondrule precursor material. The phase dia-grams presented above provide the rigorous thermochemicalbasis for concluding that such a mechanism would indeedstabilize liquids in the solar nebula and reduce or eliminate thedriving force for volatilization of Na and other elements fromchondrule-like liquids.
Fig. 15. Bulk chemical compositions of metallic nickel–iron1pyrrhotite condensate assemblages predicted atPtot 5 1023 bar and thestated dust enrichments, projected onto the liquid-crystal phase rela-tions of the Fe-rich portion of the Fe–S binary system. Dashed curvesshow projections of phase boundaries when 7 mol % Ni is present.
360 D. S. Ebel and L. Grossman
4.2. Chondrules in Dust-enriched Systems
Is there some pressure and dust enrichment at which thetemperature variation of the bulk composition of the condensedmatter, exclusive of metal, resembles the composition range ofchondrules? For example, are chondrules the quenched dropletsof the solid1 liquid assemblages that formed by equilibriumcondensation at various temperatures? In Figure 16, chondrulecompositions spanning the common composition range areplotted in the forsterite-rich corner of the ternary (CaO1Al2O3)–(MgO 1 SiO2)–(FeO1 Na2O 1 K2O). This perspec-tive is useful because the apices correspond to groups of oxideswhich condense in distinct temperature ranges, and these sevenoxides constitute the bulk of chondritic material. Superposed onthese chondrule compositions are paths representative of thetrajectories of bulk oxide condensates, exclusive of metal, withdecreasing temperature. Each of the condensation paths sweepsdown from the CaO1 Al2O3 apex toward the field occupied bytype IA chondrules (Jones and Scott, 1989), close to theMgO 1 SiO2 corner. Note that no single path for a particularcombination ofPtot and dust enrichment will be able to accountfor all of the chondrule compositions plotted. Of the casesshown, only the one at the highest dust enrichment, 8003, isoxidizing enough to make sufficient FeO at high temperaturethat the condensation trajectory passes through the field of typeIIA (Jones, 1990) chondrules at temperatures above that wheredust and gas could be expected to equilibrate, i.e.,;1200 K.This case is so oxidizing, however, that significant FeO con-denses before complete condensation of MgO and SiO2, caus-ing the trajectory to peel away from the (CaO1 Al2O3)–
(MgO 1 SiO2) join before reaching the MgO1 SiO2 cornerand thus only to graze the top of the field of type IA chondrules.The condensation paths at lower dust enrichments (1003 and3003) are seen to penetrate the type IA field only slightlymore, missing the vast majority of the data points in it as wellas the type IIA field. Similar composition trajectories to theseare obtained atPtot , 1023 bar but, at a given dust enrichment,the temperatures at which the trajectories reach high FeO1alkali contents become progressively lower with decreasingPtot. Sequestration of high-temperature, Ca-, Al-rich conden-sates could cause the condensation path of the remaining sys-tem at a particularPtot and dust enrichment to pass through themiddle of the field of type IA chondrules, but such a path wouldthen graze only the bottom of the field of type IIA chondrules.An example of such a path is shown in Fig. 16 for the case ofcondensation of a system having a dust enrichment of 8003 butfrom which 72% of the Al2O3 and CaO have been removed.Given the wide range of CaO1 Al2O3 contents of the chon-drules in Fig. 16, it is conceivable that a family of condensationcurves corresponding to a singlePtot and a high dust enrich-ment but variable amounts of sequestration of high-temperaturecondensates could account for the observed data. Althoughsuch an appeal to a multitude of adjustable parameters appearsto satisfy the data, the separate roles of FeO and alkalies are notaddressed in Figure 16.
The FeO and Na2O contents of the same chondrules shownin Figure 16 are illustrated in Figure 17. Representative oxidebulk compositions for condensation paths at 1003, 3003,5003, and 8003 dust enrichment (the latter with and without
Fig. 16. Bulk compositions of chondrules, and bulk compositions of condensed oxides at 1023 bar. Data: filled squares5type IA (Jones and Scott, 1989); filled diamonds5 type IB (Jones, 1994); filled circles5 type IAB (Jones, 1994); filledtriangles5 type IIA (Jones, 1990); open squares5 type IIB (Jones, 1996); open circles5 H3 (Lux et al., 1981); opentriangles5 CM and CO (Rubin and Wasson, 1986); open diamonds5 Manych L3 (Dodd, 1978). Circles on each pathcorrespond to compositions at 1800, 1700, 1600, 1500, 1400, and 1300 K with increasing FeO1 Na2O. Dashed extensionsof paths are subsolidus compositions to 1200 K for 1003 and 3003 and to 1250 K for 8003. Star represents the bulkcomposition of peridotite KLB-1 (Takahashi, 1986).
361Condensation in dust-enriched systems
removal of 72% of the Al2O3 and CaO) at 1023 bar aresuperposed on Fig. 17, with the subsolidus portions dashed.The FeO contents of the calculated condensate assemblages athigh dust enrichments reach the levels found in chondrules athigh temperatures, but Na2O contents only approach the levelsfound in Na-rich chondrules near the solidus of silicate liquid.The compositions of the chondrules richest in both Na2O andFeO, which include the type IIA and IIB chondrules of Jones(1990; 1996) and many of those reported by Dodd (1978), aremore Na2O-rich than compositions on any of the equilibriumcondensation paths calculated under the conditions investigatedhere. This result precludes formation of these particular chon-drules by representative sampling of equilibrium condensateassemblages from dust-enriched systems at specific tempera-tures, either by quenching and isolating primary condensates orby isochemical melting and quenching of such samples atPtot # 1023 bar and dust enrichments#10003. Dust enrich-ment factors of.8003 are not required, however, to producethe iron contents observed in most chondrules. If the FeOcontents of chondrulesdid result from the formation and iso-lation of their precursors in a dust-enriched environment, theirNa contents may have resulted from some secondary, as yetunspecified process.
Evidence for only limited intracrystal and liquid-crystalequilibrium in chondrules includes the presence of grains in-terpreted to be relict olivine and/or pyroxene (Steele, 1986) andchemical zoning in phenocrysts of porphyritic chondrules (Si-mon and Haggerty, 1979; Jones and Scott, 1989). Becausediffusion of major elements in silicate liquids is generally muchfaster than through crystals, the liquid is likely to have been thelast phase to have even partially equilibrated with ambientvapor, and the glass is thus the most likely phase to havepreserved a record of the temperature, pressure, and composi-tion of the vapor. In fact, radial chemical zonation in mesostasisof unequilibrated chondrules, particularly with respect to Na2O
(Ikeda and Kimura, 1985; DeHart et al., 1988; Grossman et al.,1997) suggests that some chondrules underwent only partialequilibration at a late stage in their formation, possibly withsurrounding gas. Are there conditions for which the liquids inequilibrium with dust-enriched vapor have the same composi-tions as the glass found in chondrules? Plotted in Figure 18 arethe compositions of the mesostasis from most of the chondruleswhose bulk compositions are illustrated in the previous twofigures. The axes of Fig. 18 are the same as those of Figure 16,and the composition trajectories for the liquid fraction of thecondensates at two dust enrichments are superposed on Figure18, starting at the temperature where olivine first condenses,and the transition from CMAS to MELTS liquid models occurs.The calculated liquids move away from forsterite toward theCaO 1 Al2O3 apex, then begin to become enriched in iron.Once past the peak in iron content, the paths differ in trajectory,due to differences in the proportions of crystallizing olivine andorthopyroxene, and liquid. Continuing olivine and pyroxenecrystallization drives the liquid trajectory steeply away fromthe MgO 1 SiO2 corner, causing CaO and Al2O3 concentra-tions to rise in the liquid until feldspar and pyroxene crystallize,very near the solidus, driving CaO and Al2O3 downward again.
The liquid paths in Figure 18 suggest that chondrule glasseswith high FeO1 alkali oxide contents could have equilibratedwith a highly dust-enriched gas at 1023 bar. The glass compo-sitions observed in type IA chondrules, however, contain muchless MgO1 SiO2 than any FeO- or alkali-bearing liquids inequilibrium with dust-enriched vapor. In these particular chon-drules, it is mostly Na2O content which pulls the liquid com-position off the CMAS join, into the interior of the triangle.This can be seen in Figure 19, which shows glass compositionsof the same chondrules, with paths of liquid composition forfour dust enrichment factors superposed. Type IA chondrulesfall closest to the y-axis. In the case of 10003 enrichment at1023 bar, the FeO contents of calculated liquids increase to
Fig. 17. Sodium and iron oxide contents of the chondrules of Fig. 16 and of KLB-1, with representative paths of bulkoxide condensates. Compositions reported as#0.03% Na2O are plotted at 0.03%.
362 D. S. Ebel and L. Grossman
.25 wt.% while Na2O , 0.1 wt.%, then decrease with de-creasing temperature. Past the peak in FeO content, Na beginsto condense into liquids, and Na2O concentrations increasesteeply near the solidus, at which points the curves in Fig. 19terminate. Prior to Na condensation,PNa is ;2.73 1026 bar ata dust enrichment of 10003, almost three times higher than thatat 3003. Because of this and the slightly higherfO2
in the most
dust-enriched systems (8003 and 10003) a significant fractionof the Na condenses into the liquid above 1400 K. As a result,below 1400 K, Na2O contents of the calculated liquids at dustenrichments of 8003 and 10003 are in the range of those ofmany of the chondrules shown, and the calculatedPNa is verysimilar for all dust enrichments, varying from;3.23 1027 barat a dust enrichment of 8003 to ;4.83 1027 bar at 10003 at
Fig. 18. Glass compositions in chondrules, with paths of condensate liquids for 500 and 8003 Cl dust enrichment, frombelow the appearance temperatures of olivine to their solidi. Symbols for chondrule data as in Fig. 16. Grey circles on eachpath mark 100° decrements starting at 1700 K.
Fig. 19. Glass compositions in chondrules, with paths of condensate liquids for 300, 500, 800, and 10003 Cl dustenrichment, which terminate at their solidi. Data as in Fig. 18.
363Condensation in dust-enriched systems
1350 K. The most important reason why the Na2O contents ofthe liquids at the highest dust enrichments reach the levelsfound in chondrules, while those at the lowest dust enrichments(3003 and 5003) do not is the persistence of the former tolower solidus temperatures,;1300 K vs.;1400 K (Fig. 8). Asdiscussed above, this is due to higher FeO and Na2O contentsof the liquids in the more dust-enriched systems at 1400 K. Atconstant dust enrichment, our calculations show that maximumalkali contents of the liquids decrease substantially with de-creasingPtot. Even atPtot as high as 1024 bar and a dustenrichment of 10003, for example, the maximum Na2O con-tent of the liquid is at least a factor of 5 smaller than at 1023 barand the same dust enrichment. Except for the type I chondruleglasses with Na2O/FeO wt. ratios. 2.0, and type II chondruleglasses with very high FeOand Na2O contents, all the chon-drule glass compositions examined here could represent silicateliquids in equilibrium with dust-enriched vapor within 200° oftheir solidus temperatures atPtot . 1024 bar. Even if theprecursors of the most FeO- and Na2O-rich chondrules weremelted in a gas enriched 10003 by dust, their liquids wouldhave lost sodium by evaporation or FeO by reduction, assumingthat they were hot for a long enough time to have equilibratedwith the gas.
5. CONCLUSIONS
Condensation of systems sufficiently enriched in dust of Clcomposition to yield ferromagnesian silicates with molar FeO/(FeO1 MgO) ratios of 0.1 to 0.4 at temperatures above 1200K also produces copious molten silicate. The distribution of Febetween metal, silicate, and sulfide in specific classes of ordi-nary chondrites can be produced by high-temperature conden-sation at specific dust enrichments. While a rigorous thermo-dynamic model at last shows how direct condensation ofsilicate liquid can occur within the range ofPtot thought to haveexisted in the inner part of the solar nebula, the compositions ofthe partially molten condensates so formed do not match thecompositions of types I and II chondrules in important ways.Such chondrules are thus secondary objects that did not formby direct condensation. Nevertheless, if chondritic matter owesits oxidation state to condensation of dust-enriched systems, thepresent work shows the sequence of condensation, details of thecondensation reactions, and the evolution of the compositionsof solid and liquid solution phases that may be relevant to theformation of chondrites and the precursors to chondrules. Thepresent work also gives physico-chemical conditions capable ofstabilizing against evaporation silicate liquids of specific com-positions, some of which are similar to the compositions ofsome chondrule glasses, in cosmic gases at low nebular pres-sures.
Acknowledgments—The authors extend thanks to J. Valdes, S. Cham-pion, D. Archer, and G. Miller for technical assistance, and to M. S.Ghiorso and R. O. Sack for providing advice and the MELTS code.Critical reviews by J. R. Beckett and an anonymous reviewer were veryhelpful. Material support for this project was through NASA grantsNAGW-3340 and NAG5-4476.
REFERENCES
Anders E. and Grevesse N. (1989) Abundances of the elements: Me-teoritic and solar.Geochim. Cosmochim. Acta53, 197–214.
Anderson G. M. and Crerar D. (1993)Thermodynamics in Geochem-istry. Oxford U. Press.
Baker M. B., Hirschmann M. M., Ghiorso M. S., and Stolper E. M.(1995) Compositions of near-solidus peridotite melts from experi-ments and thermodynamic calculations.Nature375,308–311.
Barin I. (1989)Thermochemical data of pure substances. VCH.Berman R. G. (1983) A thermodynamic model for multicomponent
melts, with application to the system CaO–MgO–Al2O3–SiO2.Ph.D., Univ. British Columbia.
Berman R. G. (1988) Internally-consistent thermodynamic data forminerals in the system Na2O–K2O–CaO–MgO–FeO–Fe2O3–Al2O3–SiO2–TiO2–H2O–CO2. J. Petrol.29, 445–522.
Berman R. G. and Brown T. H. (1985) Heat capacity of minerals in thesystem Na2O–K2O–CaO–MgO–FeO–Fe2O3–Al2O3–SiO2–TiO2–H2O–CO2. Contrib. Mineral. Petrol.89, 168–183.
Betts J. T. (1980) A compact algorithm for computing the stationarypoint of a quadratic function subject to linear constraints.ACM(Association for Computing Machinery) Trans. Mathematical Soft-ware 6, 391–397.
Charlu T. V., Newton R. C., and Kleppa O. J. (1981) Thermochemistryof synthetic Ca2Al2SiO7 (gehlenite)–Ca2MgSi2O7 (åkermanite) me-lilites. Geochim. Cosmochim. Acta45, 1609–1617.
Chase M. W., Jr., Davies C. A., Downey J. R., Frurip D. J., McDonaldR. A., and Syverud A. N. (1985)JANAF Thermochemical Tables,3rd ed.J. Phys. Chem. Ref. Data14, Suppl. 1.
Chuang Y.-Y., Hsieh K.-C., and Chang Y. A. (1986a) Thermodynam-ics and phase relationships of transition metal-sulfur systems: Part V.A reevaluation of the Fe–S system using an associated solutionmodel for the liquid phase.Metall. Trans.16B, 277–285.
Chuang Y.-Y., Hsieh K.-C., and Chang Y. A. (1986b) A thermody-namic analysis of the phase equilibria of the Fe–Ni system above1200 K.Metall. Trans.17A, 1373–1380.
Connolly H. C., Jr. and Burnett D. S. (1999) Minor element distribu-tions in spinels from Type B CAI: An experimental study.LunarPlanet. Sci.XXX , Abstract #1459 (CD-ROM).
DeHart J. M., Sears D. W. G., and Lofgren G. E. (1988) Sodiumenriched luminescent chondrule mesostasis rims in the unequili-brated ordinary chondrites.Meteoritics23, 265 (abstr.).
Dodd R. T. (1978) The composition and origin of large microporphy-ritic chondrules in the Manych (L-3) chondrite.Earth Planet. Sci.Lett. 39, 52–66.
Ebel D. S. and Grossman L. (1996) Limiting conditions for silicateliquid stability in cosmic gases.Meteoritics Planet. Sci. Suppl.31,A40–A41 (abstr.).
Ebel D. S. and Grossman L. (1997a) Direct condensation of ferromag-nesian liquids from cosmic gases.Lunar Planet. Sci.XXVIII, 317–318 (abstr.).
Ebel D. S. and Grossman L. (1997b) Stability of alkali and iron oxidesin condensate liquids.Meteoritics Planet. Sci. Suppl.32, A37 (ab-str.).
Ebel D. S. and Grossman L. (1998) Effect of dust enrichment on solidand liquid compositions in equilibrium with cosmic gases.LunarPlanet. Sci.XXIX, Abstract #1421 (CD-ROM).
Ebel D. S., Ghiorso M. S., Sack R. O., and Grossman L. (1999) Gibbsenergy minimization in gas1 liquid 1 solid systems. Submitted toJ. Computational Chem.
Elkins L. T. and Grove T. L. (1990) Ternary feldspar experiments andthermodynamic models.Am. Mineral.75, 544–559.
Fegley B. J., Jr. (1981) The thermodynamic properties of siliconoxynitride.J. Am. Ceram. Soc.64, C-124–C-126.
Fegley B. J., Jr. and Palme H. (1985) Evidence for oxidizing conditionsin the solar nebula from Mo and W depletions in refractory inclu-sions in carbonaceous chondrites.Earth Planet. Sci. Lett.72, 311–326.
Ghiorso M. S. (1985) Chemical mass transfer in magmatic processes I.Thermodynamic relations and numerical algorithms.Contrib. Min-eral. Petrol.90, 107–120.
Ghiorso M. S. (1990) Thermodynamic properties of hematite–ilmen-ite–geikielite solid solutions.Contrib. Mineral. Petrol.104, 645–667.
Ghiorso M. S. (1994) Algorithms for the estimation of phase stabilityin heterogeneous thermodynamic systems.Geochim. Cosmochim.Acta 58, 5489–5501.
364 D. S. Ebel and L. Grossman
Ghiorso M. S. and Carmichael I. S. E. (1985) Chemical mass transferin magmatic processes II. Applications in equilibrium crystallization,fractionation and assimilation.Contrib. Mineral. Petrol.90, 121–141.
Ghiorso M. S. and Sack R. O. (1995) Chemical mass transfer inmagmatic processes IV. A revised and internally consistent thermo-dynamic model for the interpolation and extrapolation of liquid–solid equilibria in magmatic systems at elevated temperatures andpressures.Contrib. Mineral. Petrol.119,197–212.
Ghiorso M. S., Carmichael I. S. E., Rivers M. L., and Sack R. O. (1983)The Gibbs free energy of mixing of natural silicate liquids; anexpanded regular solution approximation for the calculation of mag-matic intensive variables.Contrib. Mineral. Petrol.84, 107–145.
Grønvold F. and Stølen S. (1992) Thermodynamics of iron sulfides II.Heat capacity and thermodynamic properties of FeS and of Fe0.875Sat temperatures from 298.15 K to 1000 K, of Fe0.98S from 298.15 Kto 800 K, and of Fe0.89S from 298.15 K to about 650 K. Thermo-dynamics of formation.J. Chem. Thermodyn.24, 913–936.
Grossman J. N., Alexander C. M. O’D., and Wang J. (1997) Zoning oftrace elements and deuterium in the mesostasis of low-FeO chon-drules in Semarkona.Lunar Planet. Sci.XXVIII, 481–482 (abstr.).
Grossman L. (1972) Condensation in the primitive solar nebula.Geochim. Cosmochim. Acta36, 597–619.
Hirschmann M. (1991) Thermodynamics of multicomponent olivinesand the solution properties of (Ni, Mg, Fe)2SiO4 and (Ca, Mg,Fe)2SiO4 olivines.Am. Mineral.76, 1232–1248.
Hirschmann M. M., Ghiorso M. S., Wasylenki L. E., Asimow P. D.,and Stolper E. M. (1998) Calculation of peridotite partial meltingfrom thermodynamic models of minerals and melts I: Methods andcomparison with experiments.J. Petrol.39, 1091–1115.
Hsieh K.-C., Chang Y. A., and Zhong T. (1982) The Fe–Ni–S systemabove 700°C (iron–nickel–sulfur).Bull. Alloy Phase Diagrams3,165–172.
Hsieh K.-C., Vlach K. C., and Chang Y. A. (1987) The Fe–Ni–Ssystem I. A thermodynamic analysis of the phase equilibria andcalculation of the phase diagram from 1173 to 1623 K.High Temp.Sci.23, 17–37.
Ikeda Y. and Kimura M. (1985) Na–Ca zoning of chondrules inAllende and ALHA-77003 carbonaceous chondrites.Meteoritics20,670–671 (abstr.).
Jarosewich E. (1990) Chemical analyses of meteorites: A compilationof stony and iron meteorite analyses.Meteoritics25, 323–337.
Jones R. H. (1990) Petrology and mineralogy of type II, FeO-richchondrules in Semarkona LL3.0: Origin by closed-system fractionalcrystallization, with evidence for supercooling.Geochim. Cosmo-chim. Acta54, 1795–1802.
Jones R. H. (1994) Petrology of FeO-poor, porphyritic pyroxene chon-drules in the Semarkona chondrite.Geochim. Cosmochim. Acta58,5325–5340.
Jones R. H. (1996) FeO-rich, porphyritic pyroxene chondrules in un-equilibrated chondrites.Geochim. Cosmochim. Acta16,3115–3138.
Jones R. H. and Scott E. R. D. (1989) Petrology and thermal history oftype IA chondrules in the Semarkona (LL3.0) chondrite.Proc. 19thLunar Planet. Sci. Conf., 523–536.
Knacke O., Kubaschewski O., and Hesselmann K. (1991)Thermo-chemical Properties of Inorganic Substances. Springer-Verlag.
Lattimer J. M., Schramm D. N., and Grossman L. (1978) Condensationin supernova ejecta and isotopic anomalies in meteorites.Astrophys.J. 219,230–249.
Lewis R. D., Lofgren G. E., Franzen H. F., and Windom K. E. (1993)The effect of Na vapors on the Na content of chondrules.Meteoritics28, 622–628.
Lofgren G. E. (1996) A dynamic crystallization model for chondrulemelting. In Chondrules and the Protoplanetary Disk(eds. R. H.Hewinset al.), pp. 187–196. Cambridge U. Press.
Lux G., Keil K., and Taylor G. J. (1981) Chondrules in H3 chondrites:Textures, compositions and origins.Geochim. Cosmochim. Acta45,675–685.
Normanton A. S., Moore R. H., and Argent B. B. (1976) A calorimetricand mass-spectrometric study of solid iron–chromium alloys.MetalSci.10, 207–213.
Palme H. and Fegley B. J., Jr. (1990) High-temperature condensation of
iron-rich olivine in the solar nebula.Earth Planet. Sci. Lett.101,180–195.
Pedley J. B. and Marshall E. M. (1983) Thermochemical data forgaseous monoxides.J. Phys. Chem. Ref. Data12, 967–981.
Petaev M. I. and Wood J. A. (1998) Mineral equilibrium in fractionatednebular systems. II. A new code embracing 18 elements.LunarPlanet. Sci.XXIX , Abstract #1474 (CD-ROM).
Radomsky P. M. and Hewins R. H. (1990) Formation conditions ofpyroxene–olivine and magnesian olivine chondrules.Geochim. Cos-mochim. Acta54, 3475–3490.
Robie R. A., Hemingway B. S., and Fisher J. R. (1978) Thermody-namic properties of minerals and related substances at 298.15 K and1 bar (105 Pascals) pressure and at higher temperatures. USGS Bull.1452.
Rubin A. and Wasson J. T. (1986) Chondrules in the Murray CM2meteorite and compositional differences between CM–CO and ordi-nary chondrite chondrules.Geochim. Cosmochim. Acta50,307–315.
Rubin A., Fegley B. J., Jr., and Brett R. (1988) Oxidation state inchondrites. InMeteorites and the Early Solar System(eds. J. F.Kerridge and M. S. Matthews), pp. 488–511. U. Arizona Press.
Sack R. O. and Ghiorso M. S. (1989) Importance of considerations ofmixing properties in establishing an internally consistent thermody-namic database: Thermochemistry of minerals in the systemMg2SiO4–Fe2SiO4–SiO2. Contrib. Mineral. Petrol.102,41–68.
Sack R. O. and Ghiorso M. S. (1991a) An internally consistent modelfor the thermodynamic properties of Fe–Mg–titanomagnetite–alumi-nate spinels.Contrib. Mineral. Petrol.106,474–505.
Sack R. O. and Ghiorso M. S. (1991b) Chromian spinels as petroge-netic indicators: Thermodynamic and petrological applications.Am.Mineral. 76, 827–847.
Sack R. O. and Ghiorso M. S. (1994a) Thermodynamics of multicom-ponent pyroxenes: I. Formulation of a general model.Contrib. Min-eral. Petrol.116,277–286.
Sack R. O. and Ghiorso M. S. (1994b) Thermodynamics of multicom-ponent pyroxenes: II. Phase relations in the quadrilateral.Contrib.Mineral. Petrol.116,287–300.
Sack R. O. and Ghiorso M. S. (1994c) Thermodynamics of multicom-ponent pyroxenes: III. Calibration of Fe21(Mg)21, TiAl 2(MgSi2)21,TiFe31
and Ca(Mg)21 exchange reactions between pyroxenes and silicatemelts.Contrib. Mineral. Petrol.118,271–296.
Sakao H. and Elliott J. F. (1975) Thermodynamics of dilute bcc Fe–Sialloys.Metal. Trans.6A, 1849–1851.
Sharp C. M. and Wasserburg G. J. (1995) Molecular equilibria andcondensation temperatures in carbon-rich gases.Geochim. Cosmo-chim. Acta59, 1633–1652.
Simon S. B. and Haggerty S. E. (1979) Petrography and olivine mineralchemistry of chondrules and inclusions in the Allende meteorite.Proc. 10th Lunar Planet. Sci. Conf., 871–883.
Smith W. R. and Missen R. W. (1982)Chemical Reaction EquilibriumAnalysis: Theory and Algorithms. Wiley.
Sorby H. C. (1877) On the structure and origin of meteorites.Nature15, 495–498.
Steele I. M. (1986) Compositions and textures of relic forsterite incarbonaceous and unequilibrated ordinary chondrites.Geochim.Cosmochim. Acta50, 1379–1395.
Stull D. R. and Prophet H. (1970)JANAF Thermochemical Tables, 2nded. U.S. National Bureau of Standards.
Takahashi E. (1986) Melting of a dry peridotite KLB-1 up to 14 GPa:Implications on the origin of peridotitic upper mantle.J. Geophys.Res.91, 9367–9382.
Takahashi E., Shimazaki T., Tsuzaki Y., and Yoshida H. (1993) Melt-ing study of a peridotite KLB-1 to 6.5 GPa, and the origin of basalticmagmas.Philos. Trans. R. Soc. London A342,105–120.
Tsuchiyama A., Nagahara H., and Kushiro I. (1981) Volatilization ofsodium from silicate melt spheres and its application to the formationof chondrules.Geochim. Cosmochim. Acta45, 1357–1367.
Van Schmus W. R. (1969) The mineralogy and petrology of chondriticmeteorites.Earth-Science Rev.5, 145–184.
Wagner R. D. (1979) The condensation and stability of chemicallyheterogeneous systems, M.S. thesis. Arizona State University.
Wark D. A. (1987) Plagioclase-rich inclusions in carbonaceous chon-
Weinbruch S., Palme H., Mu¨ller W. F., and El Goresy A. (1990) FeO-richrims and veins in Allende forsterite: Evidence for high temperaturecondensation at oxidizing conditions.Meteoritics25, 115–125.
Whipple F. L. (1966) Chondrules: Suggestion concerning the origin.Science153,54–56.
Wood J. A. (1967) Olivine and pyroxene compositions in type IIcarbonaceous chondrites.Geochim. Cosmochim. Acta31, 2095–2108.
Wood J. A. (1984) On the formation of meteoritic chondrules byaerodynamic drag heating in the solar nebula.Earth Planet. Sci. Lett.70, 11–26.
Wood J. A. and Hashimoto A. (1993) Mineral equilibrium in frac-tionated nebular systems.Geochim. Cosmochim. Acta57, 2377–2388.
Wood J. A. and Morfill G. E. (1988) Solar nebula models. InMeteoritesand the Early Solar System(eds. J. F. Kerridge and M. S. Matthews),pp. 329–347. Univ. Arizona Press.
Yoneda S. and Grossman L. (1995) Condensation of CaO–MgO–Al2O3–SiO2 liquids from cosmic gases.Geochim. Cosmochim. Acta59, 3413–3444.
Yu Y. and Hewins R. (1998) Transient heating and chondrule forma-tion: Evidence from sodium loss in flash heating simulation exper-iments.Geochim. Cosmochim. Acta62, 159–172.