35
FEROZSONS LABORATORIES LIMITED Condensed Interim Financial Information for the Three Month Ended 30 September 2018

F E R O Z S O N S L A B O R A T O R I E S L I M I T E D
Condensed Interim Financial Information
for the Three Month Ended
30 September 2018

CONTENTS
Corporate Information 3
Dirrector's Review Report 4
Condensed Interim Statement of Financial Poistion 6
Condensed Interim Statement of Profit or Loss 7
Condensed Interim Statement of Comprihensive Income 8
Condensed Interim Statement of Changes in Equity 9
Condensed Interim Statement of Cash Flows 10
Notes to the Condensed Interim Financial Information 11
Consolidated Accounts
Condensed Interim Consolidated Statement of Financial Poistion 17
Condensed Interim Consolidated Statement of Profit or Loss 18
Condensed Interim Consolidated Statement of Comprihensive Income 19
Condensed Interim Consolidated Statement of Changes in Equity 20
Condensed Interim Consolidated Statement of Cash Flows 21
Notes to the Condensed Interim Consolidated Financial Information 22

CORPORATE INFORMATION
Board of Directors
Mrs. Akhter Khalid Waheed Chairperson Non-Executive Director
Mr. Osman Khalid Waheed Chief Executive Executive Director
Mrs. Amna Piracha Khan Non-Executive Director
Ms. Munize Azhar Peracha Non-Executive DirectorMr. Nihal Cassim Non-Executive Director
Mr. Shahid Anwar Non-Executive Director
Mr. Arshad Saeed Husain Independent Director
Audit Committee
Mr. Arshad Saeed Husain Chairman
Mrs. Amna Piracha Khan Member
Mr. Nihal Cassim Member
Mr. Shahid Anwar Member
Investment Committee
Mr. Nihal Cassim Chairman
Mr. Osman Khalid Waheed Member
Mr. Shahid Anwar Member
HR & Remuneration Committee
Mr. Arshad Saeed Husain Chairman
Mr. Osman Khalid Waheed Member
Mr. Nihal Cassim Member
Mr. Shahid Anwar Member
Company Secretary / Chief Financial Officer Share Registrar
Syed Ghausuddin Saif CorpTec Associates (Pvt.) Limited
503-E, Johar Town
Head of Internal Audit Lahore, Pakistan
Mr. Rizwan Hameed Butt Telephone: +92-42-35170336-37
Fax: +92-42-35170338
External Auditors
KPMG Taseer Hadi & Co. Factory
Chartered Accountants P.O. FerozsonsAmangarh
Internal Auditors Nowshehra (KPK), Pakistan
EY Ford Rhodes Telephone: +92-923-614295, 610159
Chartered Accountants Fax: +92-923-611302
Bankers Head Office
Habib Bank Limited 5.K.M - Sunder Raiwind Road
Bank Al-Habib Limited Lahore, Pakistan
Bank Alfalah Limited Telephone: +92-42-36026700
Habib Metropolitan Bank Limited Fax: +92-42-36026701
Meezan Bank Limited
MCB Bank Limited Sales Office Lahore
Allied Bank Limited 43-Al Noor Building
Bank Square, The Mall
Legal Advisors Lahore, Pakistan
Khan & Piracha Telephone: +92-42-37358194
Fax: +92-42-37313680
Registered Office
Ferozsons Laboratories Limited Sales Office Karachi
197-A, The Mall House No. 9, Block 7/8,
Rawalpindi-46000, Pakistan Maqbool Cooperative Housing Society,
Telephone: +92-51-4252155-57 Shahrah-e-Faisal, Karachi, Pakistan
Fax: +92-51-4252153 Telephone: +92-21-34386852
Email: [email protected] Fax: +92-21-34386754
(The quarterly accounts can be downloaded from Company's Website: www.ferozsons-labs.com)

DIRECTORS’ REVIEW OF
CONDENSED INTERIM FINANCIAL INFORMATION
FOR THE THREE MONTHS ENDED 30 SEPTEMBER 2018
We are pleased to present a brief review of your Company’s un-audited Standalone and Consolidated condensed interim financial information for the three months ended 30 September 2018. The consolidated condensed interim financial information incorporates the Company’s 98% owned venture Farmacia and 80% owned subsidiary BF Biosciences Limited.
Operational and Financial Performance
A summary of operating results for the period is given below:
Individual Consolidated
3 Months 3 Months 3 Months 3 Months
30-Sep-18 30-Sep-17 30-Sep-18 30-Sep-17
(Rupees in thousand)
Sales (net) 1,051,835 905,296 1,219,320 1,039,325
Gross Profit 453,074 363,433 469,658 381,475
Profit before tax 95,828 94,212 92,608 80,810
Taxation (31,210) (33,506) (20,158) (19,779)
Profit after tax 64,617 60,706 72,451 61,031
Standalone Net Sales of your Company increased by 16% during the 1st Quarter under review over same corresponding period last year. At the group level, Net Sales increased by 17% during the 1st Quarter under review over same period last year. Apart from our imported line of products, our promoted generic product portfolio in the private market grew by 24% over the same period last year, whereas our generic products sales to institutions have grown by 242% over the same period last year.
The Gross Profit (GP) margin of your Company stands at 43% for the quarter under review. In absolute terms, the GP grew by 25%. The primary reason being no further diminution in net realizable value of stock of Sovaldi® has been made as compared to last period in which Rs. 50 million was recorded. The management feels confident that the existing carrying value is adequate at the balance sheet date.
The selling and distribution expenses have been increased by 34% during the quarter under review over the same corresponding period last year. The increase mainly represents expenses related to increase in field force.
The 49% increase in other expenses over the same period last year represents the exchange loss due to devaluation of PKR.
Your Company reported Net Profit after Tax (NPAT) of Rs. 64.6 million for the for the three months period ended 30 September 2018, depicting a 6% growth as compared to same period last year.
Based on the Net Profit for the three months ended 30 September 2018, the Earnings per Share (EPS), both basic and diluted, stand at Rs. 2.14 as compared to EPS of Rs. 2.01 of same period last year.

BF Biosciences Limited Operational Status
The Company’s subsidiary BF Biosciences Limited closed its Net Sales at Rs. 122.7 million for the quarter ended 30 September 2018, with an increase of 5% in comparison with the same period last year on account of Institutional order of Pegelated Interferon supplied during the quarter amounting to Rs. 52 million. Net Profit after Tax (NPAT) for the quarter under review stood at Rs. 12.7 million as compared to Net Loss after Tax (NLAT) of Rs. 0.4 million for the same period last year.
Future Outlook
As discussed in our Annual Report 2018, your Company has high expectations of growth potential from new range of products recently registered. The management is committed to enhance long term shareholders’ wealth; however there are various challenges associated with regard to external environment. These include but are not limited to foreign exchange rates adverse movements, hike in monetary policy rates and delays faced in registrations by DRAP. The new Drug Pricing Policy 2018 is a great initiative; however the pricing formula lacks to take impact of devaluation of currency which will erode future margins of your Company if more adverse foreign exchange movements are witnessed. We hope that these issues will be resolved by mutual consensus of industry and DRAP.
Acknowledgments
We thank our customers, vendors, distributors, business partners and bankers for their continued support during the year. We place on record our appreciation of the contribution made by employees at all levels. For and on behalf of the Board of Directors
Mr. Osman Khalid Waheed Mrs. Akhter Khalid Waheed Chief Executive Officer Chairperson

Ferozsons Laboratories Limited
Condensed Interim Unconsolidated Statement of Financial Position
As at 30 September 2018
Un-audited Audited Un-audited Audited
30 Sep
2018
30 Jun
2018
30 Sep
2018
30 Jun
2018
Note
EQUITY AND LIABILITIES ASSETS Note
Share capital and reserves Non-current assets
Authorized share capital Property, plant and equipment 6 2,815,028,357 2,649,216,106
50,000,000 (30 June 2018: 50,000,000) ordinary Intangibles 1,514,118 2,016,272
shares of Rs. 10 each 500,000,000 500,000,000 Long term investments - related parties 7 302,759,342 297,798,460
Long term deposits and prepayments 7,086,325 7,066,325
Issued, subscribed and paid up capital 3 301,868,410 301,868,410 3,126,388,142 2,956,097,163
Capital reserve 321,843 321,843
Accumulated profit 3,806,468,171 3,735,100,328
Revaluation surplus on property, Current assets
plant and equipment 782,899,607 789,650,185
4,891,558,031 4,826,940,766 Stores, spare parts and loose tools 33,506,246 46,218,187
Stock in trade 1,184,743,846 1,219,853,920
Trade debts - considered good 597,124,712 536,412,764
Non current liabilities Loans and advances - considered good 76,447,755 43,976,934
Deposits and prepayments 207,113,471 174,960,635
Deferred taxation 161,273,232 165,760,483 Other receivables 93,653,870 92,465,979
Income tax - net 182,473,948 170,398,448
Current liabilities Short term investments 8 529,676,991 527,343,533
Cash and bank balances 9 89,675,537 197,179,290
Trade and other payables 710,851,039 792,675,804 2,994,416,376 3,008,809,690
Short term borrowings - secured 4 272,098,363 96,852,363
Unclaimed dividend 82,143,383 82,143,724
Accrued mark-up 2,880,470 533,713
1,067,973,255 972,205,604
Contingencies and commitments 5
6,120,804,518 5,964,906,853 6,120,804,518 5,964,906,853
The annexed notes from 1 to 17 form an integral part of this condensed interim unconsolidated financial information.
_________________________ _________________________ _________________________
Chief Executive Officer Chief Financial Officer Director
------------------- Rupees ------------------- ------------------- Rupees -------------------

Ferozsons Laboratories LimitedCondensed Interim Unconsolidated Statement of Profit or Loss (Un-audited)
For the three months period ended 30 September 2018
30 Sep 30 Sep
2018 2017Note
Revenue - net 10 1,051,834,583 905,295,863
Cost of sales 11 (598,760,825) (541,862,998)
Gross profit 453,073,758 363,432,865
Administrative expenses (82,452,182) (71,400,034)
Selling and distribution expenses (271,912,282) (202,595,992)
Other expenses (15,155,360) (10,179,953)
Other income 16,482,740 16,943,138
Profit from operations 100,036,674 96,200,024
Finance costs (4,208,994) (1,988,223)
Profit before taxation 95,827,680 94,211,801
Taxation 12 (31,210,415) (33,505,795)
Profit after taxation 64,617,265 60,706,006
Earnings per share - basic and diluted 2.14 2.01
The annexed notes from 1 to 17 form an integral part of this condensed interim unconsolidated financial information.
______________________ ___________________
Chief Executive Officer Chief Financial Officer Director
Quarter ended
----------------------------------------------------- Rupees -----------------------------------------------------

Ferozsons Laboratories LimitedCondensed Interim Unconsolidated Statement of Comprehensive Income (Un-audited)For the three months period ended 30 September 2018
30 Sep 30 Sep
2018 2017
Profit after taxation 64,617,265 60,706,006
Items that will not be reclassified to profit and loss account:
Other comprehensive income for the period - -
Total comprehensive income for the period 64,617,265 60,706,006
The annexed notes from 1 to 17 form an integral part of this condensed interim unconsolidated financial information.
___________________
Chief Executive Officer Chief Financial Officer
Quarter ended
----------------------------------------------------- Rupees -----------------------------------------------------
________________________
Director

Ferozsons Laboratories LimitedCondensed Interim Unconsolidated Statement of Changes in Equity (Un-audited)For the three months period ended 30 September 2018
Revenue reserve
Capital reserve
Revaluation
surplus on
Property, plant
and equipment
Accumulated
profit
Balance as at 01 July 2017 301,868,410 321,843 807,524,953 3,733,431,676 4,843,146,882
Total comprehensive income for the period - - - 60,706,006 60,706,006
Surplus transferred to accumulated profit:
-on account of incremental depreciation charged during
the period - net of tax - - (5,278,227) 5,278,227 -
Balance as at 30 September 2017 - unaudited 301,868,410 321,843 802,246,726 3,799,415,909 4,903,852,888
Balance as at 01 July 2018 301,868,410 321,843 789,650,185 3,735,100,328 4,826,940,766
Total comprehensive income for the period - - - 64,617,265 64,617,265
Surplus transferred to accumulated profit:
-on account of incremental depreciation charged during - - (6,750,578) 6,750,578 -
the period - net of tax
Balance as at 30 September 2018 - unaudited 301,868,410 321,843 782,899,607 3,806,468,171 4,891,558,031
The annexed notes from 1 to 17 form an integral part of this condensed interim unconsolidated financial information.
___________________ ____________________
Chief Executive Officer Chief Financial Officer
Share capital
Capital reserve
Total
----------------------------------Rupees----------------------------------
Director

Ferozsons Laboratories LimitedCondensed Interim Unconsolidated Statement of Cash Flows (Un-audited)
For the three months period ended 30 September 2018
30 Sep
2018
30 Sep
2017
Cash flow from operating activities
Profit before taxation 95,827,680 94,211,801
Adjustments for:
Depreciation on property, plant and equipment 70,253,447 59,319,943
Amortisation 502,154 354,682
Provision for slow moving stock in trade - 50,000,000
Gain on disposal of property, plant and equipment (6,079,046) (430,737)
Finance costs 4,208,994 1,988,223
Dividend income (2,529,947) -
Profit on bank deposits (254,525) (635,925)
Gain on re-measurement of short term investments to fair value (2,333,458) (5,245,797)
Gain on sale of short term investments - (778,932)
Share in profit of Farmacia (4,960,882) (4,824,237)
Workers' Profit Participation Fund 5,171,320 5,210,818
Central Research Fund 1,044,711 1,052,691
Workers' Welfare Fund 2,427,400 2,805,521
67,450,168 108,816,250
Cash generated from operations before working capital changes 163,277,848 203,028,051
Effect on cash flow due to working capital changes
(Increase) / decrease in current assets
Stores, spare parts and loose tools 12,711,941 (3,337,046)
Advances, deposits, prepayments and other receivables (65,811,548) (20,581,259)
Stock in trade 35,110,074 (219,430,383)
Trade debts - considered good (60,711,948) (50,816,253)
(78,701,481) (294,164,941)
Increase / (decrease) in current liabilities
Trade and other payables (90,468,195) 134,617,852
Cash generated from operations (5,891,828) 43,480,962
Taxes paid (47,773,167) (42,746,395)
Worker's Profit Participation Fund paid - -
Worker's Welfare Fund paid - -
Central Research Fund paid - -
Long term deposits (20,000) -
Net cash generated from operating activities (53,684,995) 734,567
Cash flow from investing activities
Acquisition of property, plant and equipment (240,575,452) (120,608,917)
Acquisition of intangibles - (787,330)
Proceeds from sale of property, plant and equipment 10,588,800 958,700
Dividend income 2,529,947 -
Profit on bank deposits 254,525 635,925
Redemption of short term investments - net - 80,000,000
Net cash used in investing activities (227,202,180) (39,801,622)
Cash flow from financing activities
Finance cost paid (1,862,237) (3,409,049)
Dividend paid (341) (2,005,106)
Net cash used in financing activities (1,862,578) (5,414,155)
Net decrease in cash and cash equivalents (282,749,753) (44,481,209)
Cash and cash equivalents at the beginning of the period 100,326,927 133,178,894
Cash and cash equivalents at the end of the period (182,422,826) 88,697,685
Cash and cash equivalents comprise of the following:
Cash and bank balances 89,675,537 103,402,398
Running finance (272,098,363) (14,704,713)
(182,422,826) 88,697,685
The annexed notes from 1 to 17 form an integral part of this condensed interim unconsolidated financial information.
________________________
Chief Executive Officer Chief Financial Officer
Quarter ended
------------------- Rupees -------------------
__________________________
Director

Ferozsons Laboratories LimitedNotes to the Condensed Interim Unconsolidated Financial Information (Un-audited)For the three months period ended 30 September 2018
1 Reporting entity
2 Basis of preparation
2.1 Statement of compliance
-
- Provisions of and directives issued under the Companies Act, 2017.
2.2 Basis of accounting
2.2.1
2.2.2
2.2.3
2.2.4
2.3
Comparative unconsolidated balance sheet numbers are extracted from the annual audited
unconsolidated financial statements of the Company for the year ended 30 June 2018, whereas
comparative unconsolidated profit and loss, statement of comprehensive income, cash flow statement
and statement of changes in equity are stated from unaudited condensed interim unconsolidated
financial information of the Company for the three months period ended 31 September 2017.
This condensed interim unconsolidated financial information is unaudited and being submitted to the
shareholders as required under Section 237 of the Companies Act, 2017 and the Listing Regulations of
the Pakistan Stock Exchange Limited.
Judgements and estimates
This condensed interim unconsolidated financial information does not include all of the information
required for full annual financial statements and should be read in conjunction with the annual
unconsolidated financial statements for the year ended 30 June 2018.
Ferozsons Laboratories Limited (“the Company”) was incorporated as a private limited company on 28 January
1954 and was converted into a public limited company on 08 September 1960. The Company is listed on Pakistan
Stock Exchange and is primarily engaged in the imports, manufacture and sale of pharmaceutical products and
medical devices. Its registered office is situated at 197-A, The Mall, Rawalpindi and the manufacturing facility is
located at Amangarh, Nowshera, Khyber Pakhtun Khwa.
These condensed interim unconsolidated financial statements have been prepared in accordance with
the accounting and reporting standards as applicable in Pakistan. The accounting and reporting
standards applicable in Pakistan comprise of:
International Financial Reporting Standards (IFRS Standards) issued by the International
Accounting Standards Board (IASB) as notified under the Companies Act, 2017; and
Where provisions of and directives issued under the Companies Act, 2017 differ from the IFRS
Standards, the provisions of and directives issued under the Companies Act, 2017 have been followed.
This condensed interim unconsolidated financial information comprises the condensed interim
unconsolidated statement of financial position of the Company, as at 30 September 2018 and the related
condensed interim unconsolidated statement of profit or loss, condensed interim unconsolidated
statement of comprehensive income, condensed interim unconsolidated statement of changes in equity
and condensed interim unconsolidated statement of cash flows together with the notes forming part
thereof.
2.4 Statement of consistency in accounting policies
2.4.1
2.4.2
Un-audited Audited
30 Sep
2018
30 Jun
2018
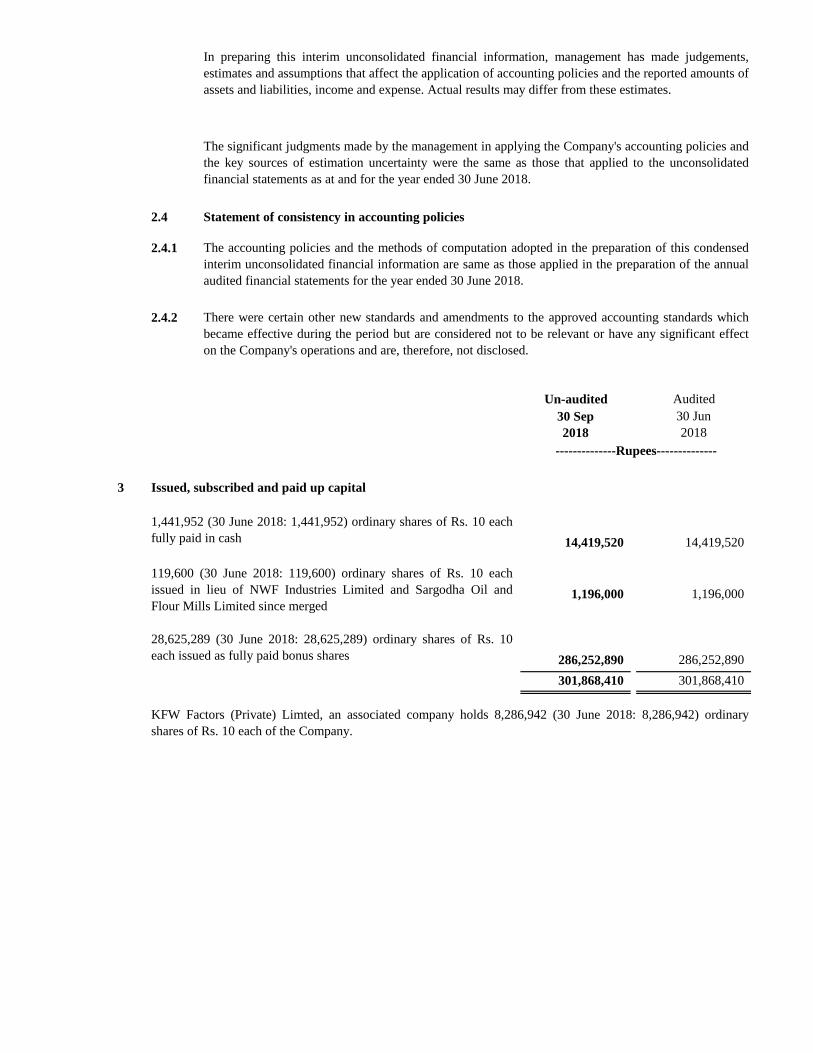
3 Issued, subscribed and paid up capital
14,419,520 14,419,520
1,196,000 1,196,000
286,252,890 286,252,890
301,868,410 301,868,410
KFW Factors (Private) Limted, an associated company holds 8,286,942 (30 June 2018: 8,286,942) ordinary
shares of Rs. 10 each of the Company.
28,625,289 (30 June 2018: 28,625,289) ordinary shares of Rs. 10
each issued as fully paid bonus shares
In preparing this interim unconsolidated financial information, management has made judgements,
estimates and assumptions that affect the application of accounting policies and the reported amounts of
assets and liabilities, income and expense. Actual results may differ from these estimates.
The significant judgments made by the management in applying the Company's accounting policies and
the key sources of estimation uncertainty were the same as those that applied to the unconsolidated
financial statements as at and for the year ended 30 June 2018.
The accounting policies and the methods of computation adopted in the preparation of this condensed
interim unconsolidated financial information are same as those applied in the preparation of the annual
audited financial statements for the year ended 30 June 2018.
There were certain other new standards and amendments to the approved accounting standards which
became effective during the period but are considered not to be relevant or have any significant effect
on the Company's operations and are, therefore, not disclosed.
--------------Rupees--------------
1,441,952 (30 June 2018: 1,441,952) ordinary shares of Rs. 10 each
fully paid in cash
119,600 (30 June 2018: 119,600) ordinary shares of Rs. 10 each
issued in lieu of NWF Industries Limited and Sargodha Oil and
Flour Mills Limited since merged

4 Short term borrowings - secured
With conventional financial institutions
With shariah compliant financial institutions
5 Contingencies and commitments
5.1 Contingencies
5.2 Commitments
5.2.1 Letter of credits
5.2.1.1 With conventional financial institutions
5.2.1.2 With shariah compliant financial institutions
Out of the aggregate facility of Rs. 600 million (2018: Rs. 600 million) for opening letters of credit, the
amount utilized as at 30 Sep 2018 for capital expenditure was Rs. 104.19 million (2018: Rs. 192.52
million) and for other than capital expenditure was Rs. 170.92 million (2018: Rs. 151.99 million). Out
of these facilities, Rs. 300 million can interchangeably be utilized as running finance. These facilities
are secured by first pari passu charge of Rs. 1,000 million over all present and future assets (excluding
land & building) of the Company and lien over import documents.
The Company has facility i.e. letters of credit of Rs. 75 million (2018: Rs. 75 million) available from
Islamic bank. The amount utilized as at 30 Sep 2018 for capital expenditure was Rs. Nil (2018: Rs. 1.64
million) and for other than capital expenditure was Rs. 60.20 million (2018: Rs. 54.87 million). Lien is
also marked over import documents.
The Company has short term running finance facilities available from various commercial banks under mark up
arrangements having aggregate sanctioned limit of Rs. 750 million (2018: Rs. 750 million). These facilities carry
mark-up at the rates ranging from three months KIBOR plus 0.3% to 0.9% (2018: three months KIBOR plus
0.3% to 0.9%) per annum on the outstanding balances. Running finance facilities amounting to Rs. 450 million
can interchangeably be utilized as non-funded facilities. Out of the aggregate facilities, Rs. 450 million (2018: Rs.
450 million) are secured by first pari passu charge of Rs. 1,000 million over all present and future assets (current
and fixed assets) of the Company (excluding land and building) and remaining Rs. 300 million (2018: Rs. 300
million) facility is secured by lien on Company's short term investments (money market/income fund) which
should be 110% of the maximum limit allowed for utilization. Under this arrangement, short term investment of
Rs. 333.33 million (2018: Rs. 333.33 million) in HBL funds is marked under lien. These facilities are renewable
on annual basis latest by 31 December 2018.
The Company has short term borrowing facility i.e. Running Musharakah available from Islamic bank under
profit arrangements having sanctioned limit of Rs. 200 million (2018: Rs. 200 million). This facility carries profit
rate of three months KIBOR plus 0.3% (2018: three months KIBOR plus 0.3% ) per annum on the outstanding
balance. This facility can interchangeably be utilized as non-funded. This facility is secured by first pari passu
charge over current assets of the Company. This facility is renewable on annual basis latest by 31 October 2018.
There is no significant change in contingencies already disclosed in preceding annual published
financial statement of the Company for the year ended 30 June 2018.
Un-audited Audited
30 Sep
2018
30 Jun
2018
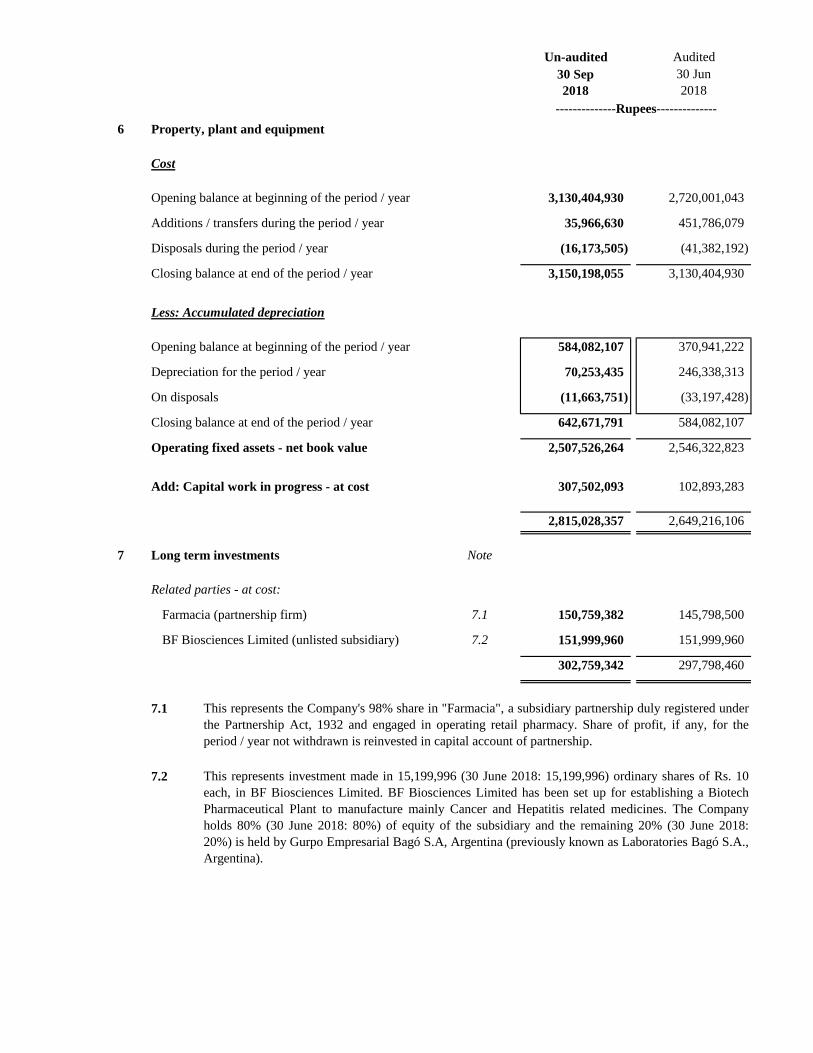
6 Property, plant and equipment
Cost
Opening balance at beginning of the period / year 3,130,404,930 2,720,001,043
Additions / transfers during the period / year 35,966,630 451,786,079
Disposals during the period / year (16,173,505) (41,382,192)
Closing balance at end of the period / year 3,150,198,055 3,130,404,930
Less: Accumulated depreciation
Opening balance at beginning of the period / year 584,082,107 370,941,222
Depreciation for the period / year 70,253,435 246,338,313
On disposals (11,663,751) (33,197,428)
Closing balance at end of the period / year 642,671,791 584,082,107
Operating fixed assets - net book value 2,507,526,264 2,546,322,823
Add: Capital work in progress - at cost 307,502,093 102,893,283
2,815,028,357 2,649,216,106
7 Long term investments Note
Related parties - at cost:
Farmacia (partnership firm) 7.1 150,759,382 145,798,500
BF Biosciences Limited (unlisted subsidiary) 7.2 151,999,960 151,999,960
302,759,342 297,798,460
7.1
7.2 This represents investment made in 15,199,996 (30 June 2018: 15,199,996) ordinary shares of Rs. 10
each, in BF Biosciences Limited. BF Biosciences Limited has been set up for establishing a Biotech
Pharmaceutical Plant to manufacture mainly Cancer and Hepatitis related medicines. The Company
holds 80% (30 June 2018: 80%) of equity of the subsidiary and the remaining 20% (30 June 2018:
20%) is held by Gurpo Empresarial Bagó S.A, Argentina (previously known as Laboratories Bagó S.A.,
Argentina).
--------------Rupees--------------
This represents the Company's 98% share in "Farmacia", a subsidiary partnership duly registered under
the Partnership Act, 1932 and engaged in operating retail pharmacy. Share of profit, if any, for the
period / year not withdrawn is reinvested in capital account of partnership.

Un-audited Audited
30 Sep
2018
30 Jun
2018
Note
8 Short term investments
Investments at fair value through profit or loss - listed securities
Held for trading 8.1 529,676,991 527,343,533
529,676,991 527,343,533
8.1 These investments are 'held for trading'
Carrying value at 01 July 527,343,533 487,884,889
Acquisition during the period/year - 175,000,000
Redemption during the period/year - (156,626,731)
Realized gain on sale of investments during the period / year - 1,947,077
Unrealized gain on re-measurement of investment - during the period/year 2,333,458 19,138,298
Carrying and fair value of short term investments at 30 Sep / 30 Jun 8.1.1 529,676,991 527,343,533
Un-audited Audited Un-audited Audited
30 Jun
2018
30 Sep
2018
30 Jun
2018
8.1.1 Mutual fund wise detail is as follows:
HBL Money Market Fund 2,041,354 220,800,368 218,732,153
MCB Cash Management Optimizer Fund 1,664,517 175,138,814 176,329,065
HBL Cash Fund 1,248,377 133,737,809 132,282,315
529,676,991 527,343,533
8.2
8.3
9 Cash and bank balances
9.1
9.2
These also include deposit account of Rs. 3.70 million (30 June 2018: Rs. 0.001 million ) under Shariah compliant arrangements,
which carries profit rate of 2.40% (30 June 2016: 2.40%) per annum.
...…………….Number……………… ...…………….Rupees………………
2,128,931
1,740,539
1,305,178
Changes in fair values of financial assets at fair value through profit or loss are recorded in profit and loss account. Realized gain of
Rs. Nil (30 Sep 2017: Rs.0.78 million) has been recorded in the current period in "other income". These investments comprise of
mutual funds (money market / income fund).
Realized gain on redemption of short term investments is earned under mark up arrangements.
These include current account of Rs. 0.67 million (30 June 2018: Rs. 0.67 million) maintained under Shariah compliant arrangements.
These include deposit accounts of Rs. 16.82 million (30 June 2018: Rs. 14.63 million) under mark up arrangements, which carry
interest rate of 4.5% (30 June 2018: 3.5% - 4.25%) per annum.
30 Sep
2018
--------------- Rupees ---------------
Units Fair value
30 Sep
2018
30 Sep
2017
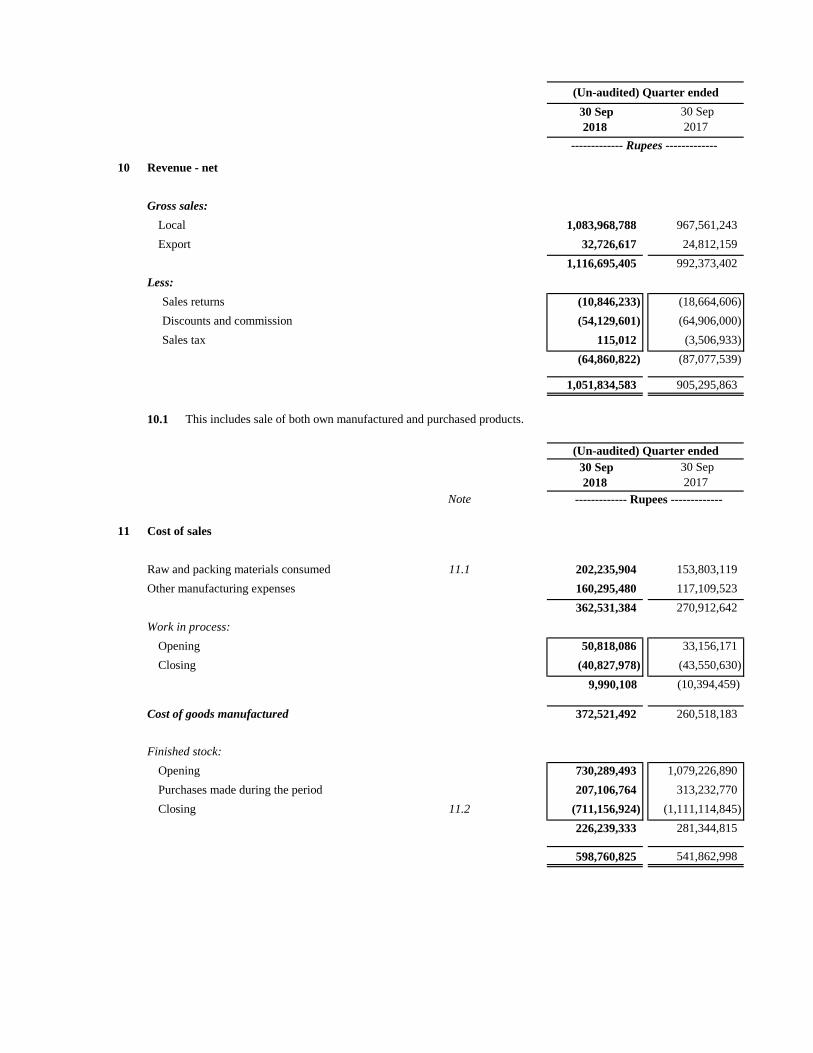
10 Revenue - net
Gross sales:
Local 1,083,968,788 967,561,243
Export 32,726,617 24,812,159
1,116,695,405 992,373,402
Less:
Sales returns (10,846,233) (18,664,606)
Discounts and commission (54,129,601) (64,906,000)
Sales tax 115,012 (3,506,933)
(64,860,822) (87,077,539)
1,051,834,583 905,295,863
10.1 This includes sale of both own manufactured and purchased products.
30 Sep
2018
30 Sep
2017
Note
11 Cost of sales
Raw and packing materials consumed 11.1 202,235,904 153,803,119
Other manufacturing expenses 160,295,480 117,109,523
362,531,384 270,912,642
Work in process:
Opening 50,818,086 33,156,171
Closing (40,827,978) (43,550,630)
9,990,108 (10,394,459)
Cost of goods manufactured 372,521,492 260,518,183
Finished stock:
Opening 730,289,493 1,079,226,890
Purchases made during the period 207,106,764 313,232,770
Closing 11.2 (711,156,924) (1,111,114,845)
226,239,333 281,344,815
598,760,825 541,862,998
(Un-audited) Quarter ended
------------- Rupees -------------
(Un-audited) Quarter ended
------------- Rupees -------------

11.1 Raw and packing materials
consumed
Opening 338,718,490 378,989,330
Purchases made during the period 200,513,089 174,694,141
539,231,579 553,683,471
Closing (336,995,675) (399,880,352)
202,235,904 153,803,119
11.2
30 Sep
2018
30 Sep
2017
12 Taxation
Current
- For the year 35,697,667 46,335,335
Deferred
- For the year (4,487,252) (12,829,540)
31,210,415 33,505,795
--------------Rupees--------------
The Board of Directors of the Company intends to distribute sufficient cash dividend for the year ended 30 June 2019 to
comply with the section 5A of the Income Tax Ordinance 2001. Accordingly, no provision for tax on undistributed reserves
has been recognized in this condensed unconsolidated interim financial information.
The amount charged to profit and loss account on account of write down of finished goods to net realizable value
amounts to Rs. Nil (Sep 2017: Rs. 50 million).
(Un-audited) Quarter ended

13 Transactions with related parties
30 Sep
2018
30 Sep
2017
Farmacia - 98% owned subsidiary partnership firm
Sale of medicines 8,142,842 8,756,053
Payment received against sale of finished goods 8,142,842 4,423,890
Share of profit reinvested 4,960,882 4,824,237
Rentals 964,615 876,924
BF Biosciences Limited - 80% owned subsidiary company
Sale of finished goods 4,950,771 28,338,494
Payment received against sale of finished goods 4,950,771 28,338,494
Sales return of medicines 946,457 -
Receipts against return of medicine 946,457 -
Marketing fee - 1,104,238
Expenses incurred 19,019,446 2,977,805
Payment made against marketing fee and expenses re-imbursement 19,019,446 4,082,043
Other related parties
Contribution towards employees' provident fund 8,428,529 7,239,607
Remuneration including benefits and
perquisites of key management personnel 32,008,122 26,098,981
14 Reconciliation of movement of liabilities to cash flows arising from financing activities
Dividend
Payable
Accrued
mark-upTotal
As at 30 June 2018 82,143,724 533,713 82,677,437
Changes from financing cash flows
Dividend paid (341) - (341)
Financial charges paid - (1,862,237) (1,862,237)
Total changes from financing cash flows (341) (1,862,237) (1,862,578)
Other changes
Dividend approved - - -
Interest / markup expense - 4,208,994 4,208,994
Total liability related other changes - 4,208,994 4,208,994
As at 30 September 2018 82,143,383 2,880,470 85,023,853
15 Financial risk management and financial instruments - fair value
15.1
The Company's related parties include subsidiaries, associated company, entities over which directors are able to
exercise influence, staff retirement fund, directors and key management personnel. Balances with the related parties are
shown in respective notes in the condensed interim unconsolidated financial information. Transactions with related
parties during the period are as follows:
(Un-audited) Quarter ended
------------------- Rupees -------------------
- - - - - - - - - - - - Rupees - - - - - - - - - - - -
The Company's financial risk management objective and policies are consistent with that disclosed in the
annual unconsolidated financial statements of the Company for the year ended 30 June 2018.
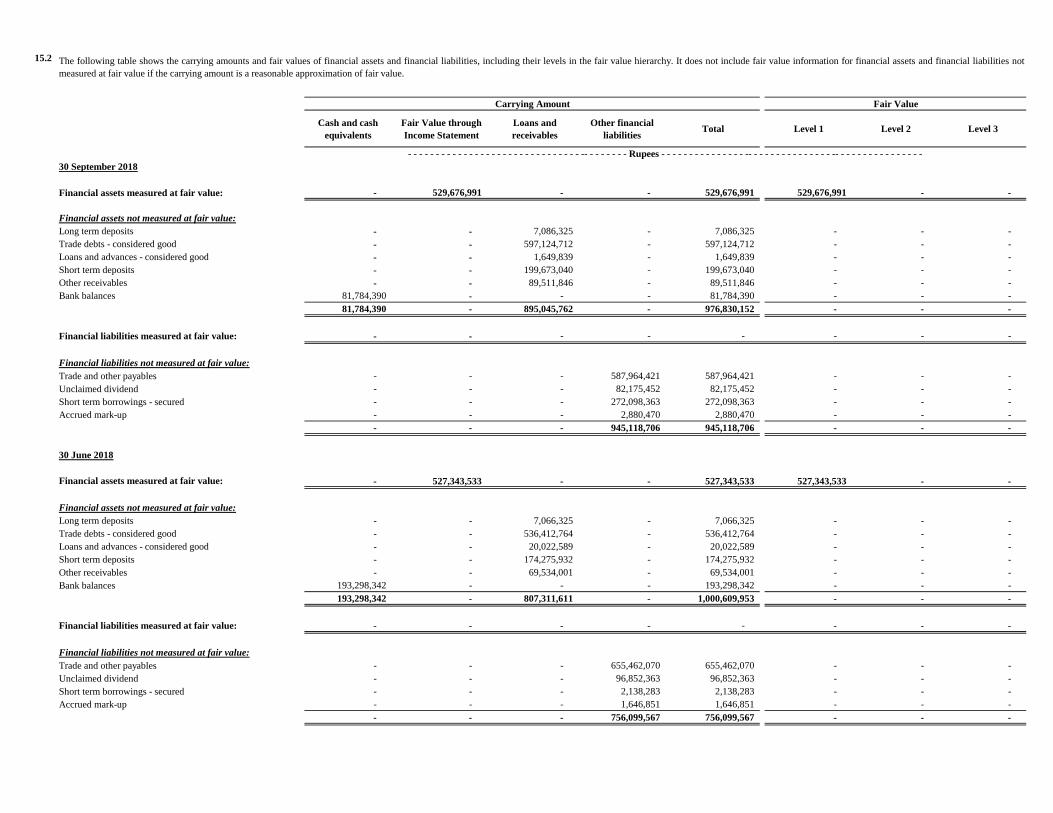
15.2
Cash and cash
equivalents
Fair Value through
Income Statement
Loans and
receivables
Other financial
liabilitiesTotal Level 1 Level 2 Level 3
30 September 2018
Financial assets measured at fair value: - 529,676,991 - - 529,676,991 529,676,991 - -
Financial assets not measured at fair value:
Long term deposits - - 7,086,325 - 7,086,325 - - -
Trade debts - considered good - - 597,124,712 - 597,124,712 - - -
Loans and advances - considered good - - 1,649,839 - 1,649,839 - - -
Short term deposits - - 199,673,040 - 199,673,040 - - -
Other receivables - - 89,511,846 - 89,511,846 - - -
Bank balances 81,784,390 - - - 81,784,390 - - -
81,784,390 - 895,045,762 - 976,830,152 - - -
Financial liabilities measured at fair value: - - - - - - - -
Financial liabilities not measured at fair value:
Trade and other payables - - - 587,964,421 587,964,421 - - -
Unclaimed dividend - - - 82,175,452 82,175,452 - - -
Short term borrowings - secured - - - 272,098,363 272,098,363 - - -
Accrued mark-up - - - 2,880,470 2,880,470 - - -
- - - 945,118,706 945,118,706 - - -
30 June 2018
Financial assets measured at fair value: - 527,343,533 - - 527,343,533 527,343,533 - -
Financial assets not measured at fair value:
Long term deposits - - 7,066,325 - 7,066,325 - - -
Trade debts - considered good - - 536,412,764 - 536,412,764 - - -
Loans and advances - considered good - - 20,022,589 - 20,022,589 - - -
Short term deposits - - 174,275,932 - 174,275,932 - - -
Other receivables - - 69,534,001 - 69,534,001 - - -
Bank balances 193,298,342 - - - 193,298,342 - - -
193,298,342 - 807,311,611 - 1,000,609,953 - - -
Financial liabilities measured at fair value: - - - - - - - -
Financial liabilities not measured at fair value:
Trade and other payables - - - 655,462,070 655,462,070 - - -
Unclaimed dividend - - - 96,852,363 96,852,363 - - -
Short term borrowings - secured - - - 2,138,283 2,138,283 - - -
Accrued mark-up - - - 1,646,851 1,646,851 - - -
- - - 756,099,567 756,099,567 - - -
The following table shows the carrying amounts and fair values of financial assets and financial liabilities, including their levels in the fair value hierarchy. It does not include fair value information for financial assets and financial liabilities not
measured at fair value if the carrying amount is a reasonable approximation of fair value.
Carrying Amount Fair Value
- - - - - - - - - - - - - - - - - - - - - - - - - - - - - - - -- - - - - - - - Rupees - - - - - - - - - - - - - - - -- - - - - - - - - - - - - - - -- - - - - - - - - - - - - - - -

16 Subsequent event and date of authorization for issue
17 Corresponding figures
________________________ ______________________
Chief Executive Officer Chief Financial Officer
Corresponding figures have been re-arranged, wherever necessary, for the purpose of comparison and better
presentation as per reporting framework.
Director
The Board of Directors of the Company in its meeting held on 27 October 2018 has authorized to issue these
condensed interim unconsolidated financial statements and has approved interim cash dividend of Rs. Nil per
share (30 September 2017: Rs. Nil per share) amounting to Rs. Nil (30 September 2017: Rs. Nil) for the year
ending 30 June 2019 in the same meeting.

F E R O Z S O N S L A B O R A T O R I E S L I M I T E D
Condensed Interim Consolidated
Financial Information
for the Three Month Ended
30 September 2018

Ferozsons Laboratories LimitedCondensed Interim Consolidated Statement of Financial Position
As at 30 September 2018
Un-audited Audited Un-audited Audited
30 Sep
2018
30 Jun
2018
30 Sep
2018
30 Jun
2018
Note Note
EQUITY AND LIABILITIES ASSETS
Share capital and reserves Non-current assets
Authorized share capital Property, plant and equipment 7 3,198,571,545 3,075,164,414
50,000,000 (30 June 2018: 50,000,000) ordinary 500,000,000 500,000,000 Investment property 79,371,992 78,545,641
shares of Rs. 10 each Intangibles 1,684,978 2,357,632
Long term deposits and prepayments 11,633,325 11,613,325
Issued, subscribed and paid up capital 4 301,868,410 301,868,410 3,291,261,840 3,167,681,012
Accumulated profit 4,276,620,168 4,194,798,630
Capital reserve 321,843 321,843
Revaluation surplus on property, plant and equipment 910,341,703 921,179,842 Current assets
Equity attributable to owners of the Company 5,489,152,124 5,418,168,725
Stores, spare parts and loose tools 59,875,625 71,802,216
Non-controlling interests 185,827,811 184,360,696 Stock in trade 1,357,899,514 1,346,996,263
5,674,979,935 5,602,529,421 Trade debts - considered good 655,509,038 604,467,682
Loans and advances - considered good 80,392,352 48,225,856
Non current liabilities Deposits and prepayments 247,504,367 191,428,941
Other receivables 93,533,207 92,304,228
Deferred taxation 202,735,309 222,502,168 Income tax - net 230,341,224 212,899,309
Short term investments 8 912,507,126 941,746,224
Current liabilities Cash and bank balances 9 127,487,902 290,867,439
3,765,050,355 3,800,738,158
Trade and other payables 804,198,731 960,178,380
Short term borrowings - secured 5 289,254,450 100,525,853
Unclaimed dividend 82,143,383 82,143,724
Accrued mark-up 3,000,387 539,624
1,178,596,951 1,143,387,581
Contingencies and commitments 6
7,056,312,195 6,968,419,170 7,056,312,195 6,968,419,170
The annexed notes from 1 to 17 form an integral part of these condensed interim consolidated financial statements.
________________________ _______________________ _______________________
Chief Executive Officer Chief Financial Officer Director
------------------- Rupees ------------------- ------------------- Rupees -------------------

Ferozsons Laboratories LimitedCondensed Interim Consolidated Statement of Profit or Loss (Un-audited)For the three months period ended 30 September 2018
30 Sep 30 Sep
2018 2017
Note
Revenue - net 10 1,219,319,760 1,039,324,599
Cost of sales 11 (749,661,716) (657,849,899)
Gross profit 469,658,044 381,474,700
Administrative expenses (93,313,684) (81,443,944)
Selling and distribution expenses (281,138,563) (222,105,855)
Other expenses (31,316,692) (10,532,555)
Other income 33,221,244 15,709,130
Profit from operations 97,110,349 83,101,476
Finance costs (4,501,944) (2,291,281)
Profit before taxation 92,608,405 80,810,195
Taxation 12 (20,157,891) (19,778,854)
Profit after taxation 72,450,514 61,031,341
Attributable to:
Owners of the Company 70,983,399 62,459,163
Non-controlling interests 1,467,115 (1,427,822)
Profit after taxation 72,450,514 61,031,341
Earnings per share - basic and diluted 2.35 2.07
The annexed notes from 1 to 17 form an integral part of these condensed interim consolidated financial statements.
________________________ _______________________ _______________________
Chief Executive Officer Chief Financial Officer Director
Quarter ended
----------------------------------------------------- Rupees -----------------------------------------------------

Ferozsons Laboratories LimitedCondensed Interim Consolidated Statement of Comprehensive Income (Un-audited)For the three months period ended 30 September 2018
30 Sep 30 Sep
2018 2017
Profit after taxation 72,450,514 61,031,341
Items that will not be reclassified to profit and loss account:
Other comprehensive income for the period - -
Total comprehensive income for the period 72,450,514 61,031,341
Attributable to:
Owners of the Company 70,983,399 62,459,163
Non-controlling interests 1,467,115 (1,427,822)
72,450,514 61,031,341
The annexed notes from 1 to 17 form an integral part of these condensed interim consolidated financial statements.
________________________ _______________________ _______________________
Chief Executive Officer Chief Financial Officer Director
Quarter ended
----------------------------------------------------- Rupees -----------------------------------------------------

Ferozsons Laboratories LimitedCondensed Interim Consolidated Statement of Changes in Equity (Un-audited)For the three months period ended 30 September 2018
Revenue reserve
Capital
reserve
Revaluation
surplus on
property, plant
and equipment
Accumulated
profits
Balance as at 01 July 2017 301,868,410 321,843 944,836,904 4,265,339,789 5,512,366,946 205,863,948 5,718,230,894
Total comprehensive income for the period - - - 62,459,163 62,459,163 (1,427,822) 61,031,341
Surplus transferred to accumulated profit:
-on account of incremental depreciation charged
during the period - net of tax - - (8,703,763) 8,703,763 - - -
Balance as at 30 September 2017 - un-audited 301,868,410 321,843 936,133,141 4,336,502,715 5,574,826,109 204,436,126 5,779,262,235
Balance as at 01 July 2018 301,868,410 321,843 921,179,842 4,194,798,630 5,418,168,725 184,360,696 5,602,529,421
Total comprehensive income for the period - - - 70,983,399 70,983,399 1,467,115 72,450,514
Surplus transferred to accumulated profit:
-on account of incremental depreciation charged
during the period - net of tax - - (10,838,139) 10,838,139 - - -
Balance as at 30 September 2018 - un-audited 301,868,410 321,843 910,341,703 4,276,620,168 5,489,152,124 185,827,811 5,674,979,935
The annexed notes from 1 to 17 form an integral part of these condensed interim consolidated financial statements.
_______________________________________________ _______________________ __________________
Chief Executive Officer Chief Financial Offier
- - - - - - - - - - - - - - - - - - - - - - - - - - - - - - - - - - - - - - - - - - - - - Rupees - - - - - - - - - - - - - - - - - - - - - - - - - - - - - - - - - - - - - - - - - - - - -
Director
Attributable to Owners of the Company
TotalNon-controlling
interestsTotalShare
capital
Capital reserve

Ferozsons Laboratories LimitedCondensed Interim Consolidated Statement of Cash Flows (Un-audited)For the three months period ended 30 September 2018
30 Sep 30 Sep
2018 2017
Cash flow from operating activities
Profit before taxation 92,608,405 80,810,195
Adjustments for:
Depreciation 97,820,994 86,732,576
Amortisation 672,654 525,233
Gain on disposal of property, plant and equipment (6,207,186) (787,388)
Finance costs 4,501,944 2,291,280
Dividend income (25,934,871) -
Un-realised loss/(gain) on re-measurement of short term investments to fair value 12,074,358 (7,733,563)
Loss/(gain) on sale of short term investments 3,038,993 (805,806)
Profit on bank deposits (754,305) (72,548)
Workers' Profit Participation Fund 5,371,939 5,210,818
Workers' Welfare Fund 2,536,300 2,858,314
Central Research Fund 1,085,240 1,052,691
This condensed interim consolidated financial information comprises the condensed interim consolidated balance sheet of the Holding Company, as at 31 December 2016 and the related condensed interim consolidated profit and loss account, condensed interim consolidated statement of comprehensive income, condensed interim consolidated statement of changes in equity and condensed interim consolidated cash flow statement together with the notes forming part thereof.94,206,060 89,271,607
Cash generated from operations before working capital changes 186,814,465 170,081,802
Effect on cash flow due to working capital changes
(Increase) / decrease in current assets
Stores, spare parts and loose tools 11,926,591 (3,136,834)
Loans, advances, deposits and prepayments (89,441,103) (27,421,240)
Stock in trade (10,903,251) (180,586,946)
Trade debts - considered good (51,041,356) (54,165,643)
(139,459,119) (265,310,663)
Increase / (decrease) in current liabilities
Trade and other payables (165,002,925) 157,040,964
Cash generated from operations (117,647,579) 61,812,103
Taxes paid (57,366,609) (48,780,121)
Workers' Profit Participation Fund paid - (1,364,220)
Workers' Welfare Fund paid - (1,572,982)
Central Research Fund paid - -
Long term deposits (20,000) -
Net cash generated from operating activities (175,034,188) 10,094,780
Cash flow from investing activities
Acquisition of property, plant and equipment (240,862,406) (125,937,917)
Acquisition of intangibles - (787,330)
Proceeds from sale of property, plant and equipment 25,015,059 1,604,067
Dividend income 25,934,871 -
Profit on bank deposits 754,305 72,548
Redemption of short term investments - net 14,125,747 95,000,000
Net cash used in investing activities (175,032,424) (30,048,632)
Finance cost paid (2,041,181) (3,687,288)
Dividend paid (341) (2,005,106)
Net cash used in financing activities (2,041,522) (5,692,394)
Net decrease in cash and cash equivalents (352,108,134) (25,646,246)
Cash and cash equivalents at the beginning of the period 190,341,586 219,477,900
Cash and cash equivalents at the end of the period (161,766,548) 193,831,654
Cash and cash equivalents comprise of the following:
Cash and bank balances 127,487,902 217,900,639
Running finance (289,254,450) (24,068,985)
(161,766,548) 193,831,654
The annexed notes from 1 to 17 form an integral part of these condensed interim consolidated financial statements.
_____________________ _____________________ _____________________
Chief Executive Officer Chief Financial Officer
Quarter ended
------------------- Rupees -------------------
Director

Ferozsons Laboratories LimitedNotes to the Condensed Interim Consolidated Financial Information (Un-audited)For the three months period ended 30 September 2018
1 The Group and its operation
Sep-18 Jun-18
BF Biosciences
Limited
Farmacia
2 Basis of consolidation
3 Basis of preparation
3.1 Statement of compliance
-
- Provisions of and directives issued under the Companies Act, 2017.
3.2 Basis of accounting
3.2.1
Where provisions of and directives issued under the Companies Act, 2017 differ from the IFRS Standards,
the provisions of and directives issued under the Companies Act, 2017 have been followed.
This condensed interim consolidated financial information comprises the condensed interim consolidated
statement of financial position of the Holding Company, as at 30 September 2018 and the related
condensed interim consolidated statement of profit or loss, condensed interim consolidated statement of
comprehensive income, condensed interim consolidated statement of changes in equity and condensed
interim consolidated statement of cash flows together with the notes forming part thereof.
International Financial Reporting Standards (IFRS Standards) issued by the International
Accounting Standards Board (IASB) as notified under the Companies Act, 2017; and
Pakistan Import, manufacturing
and sale of pharmaceu-
tical products
80 80
Pakistan Sale and distribution of
medicines and other
related products
98 98
The Holding Company has 98% holding in Farmacia. Farmacia is a partnership duly registered under Partnership
Act, 1932. Farmacia is engaged in the retail trading of pharmaceutical products.
These consolidated financial information includes the financial statements of Ferozsons Laboratories Limited and its
subsidiaries – BF Biosciences Limited and Farmacia (“hereinafter referred as the Group”).
Subsidiaries are those entities, including an unincorporated entities such as a partnership that are controlled by
another entity (known as the parent). The financial statements of the subsidiaries are included in the consolidated
financial information from the date the control commences, until the date when that control ceases. The financial
statements of the subsidiaries have been consolidated on line by line basis. Details of the subsidiaries are given in
note 1.
All material inter-organization balances, transactions and resulting unrealized profits / losses have been eliminated.
These condensed interim consolidated financial statements have been prepared in accordance with the
accounting and reporting standards as applicable in Pakistan. The accounting and reporting standards
applicable in Pakistan comprise of:
Ferozsons Laboratories Limited (“the Holding Company”) was incorporated as a private limited company on 28
January 1954 and was converted into a public limited company on 08 September 1960. The Holding Company is
listed on the Pakistan Stock Exchange Limited and is primarily engaged in the imports, manufacture and sale of
pharmaceuticals products and medical devices. Its registered office is situated at 197-A, The Mall, Rawalpindi and
the manufacturing facility is located at Amangarh, Nowshera, Khyber Pakhtoon Khwa.
"The Group" consists of the following subsidiaries:
Company / Entity County of incorporation Nature of businessEffective holding %
3.2.2
3.2.3
3.2.4
3.3
3.4 Statement of consistency in accounting policies
3.4.1
3.4.2
Un-audited Audited
30 Sep
2018
30 Jun
2018
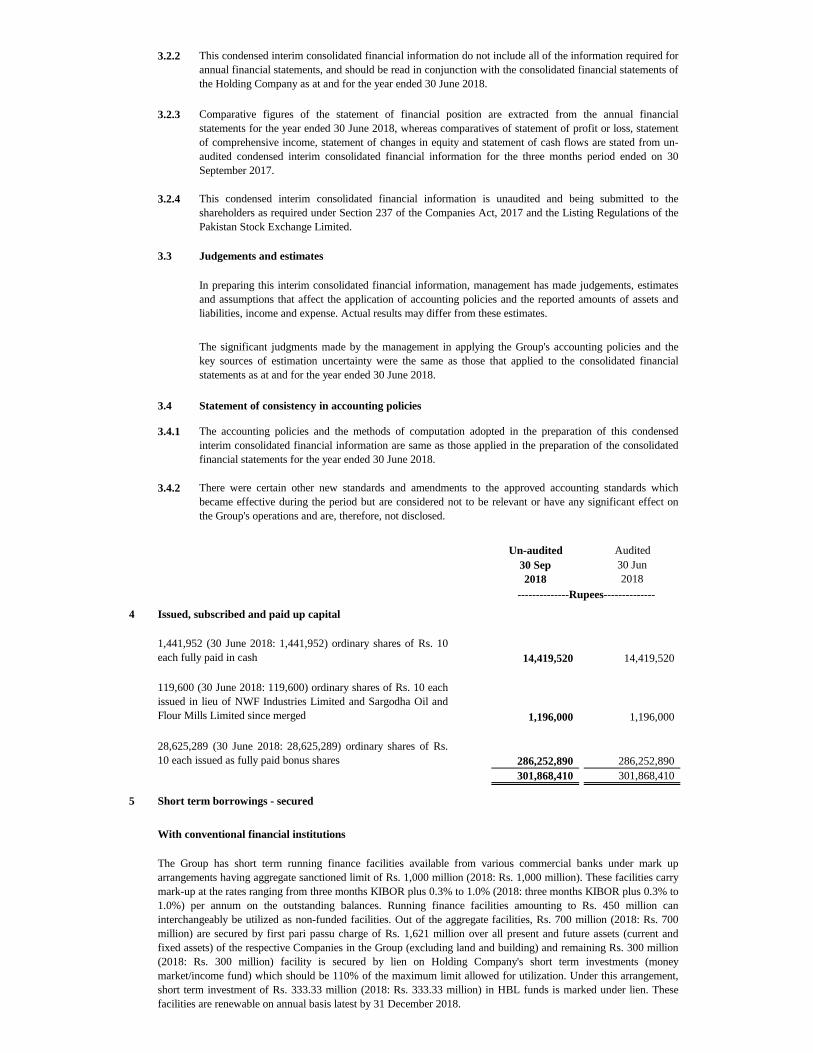
4 Issued, subscribed and paid up capital
14,419,520 14,419,520
1,196,000 1,196,000
286,252,890 286,252,890
301,868,410 301,868,410
5 Short term borrowings - secured
With conventional financial institutions
--------------Rupees--------------
1,441,952 (30 June 2018: 1,441,952) ordinary shares of Rs. 10
each fully paid in cash
119,600 (30 June 2018: 119,600) ordinary shares of Rs. 10 each
issued in lieu of NWF Industries Limited and Sargodha Oil and
Flour Mills Limited since merged
28,625,289 (30 June 2018: 28,625,289) ordinary shares of Rs.
10 each issued as fully paid bonus shares
The Group has short term running finance facilities available from various commercial banks under mark up
arrangements having aggregate sanctioned limit of Rs. 1,000 million (2018: Rs. 1,000 million). These facilities carry
mark-up at the rates ranging from three months KIBOR plus 0.3% to 1.0% (2018: three months KIBOR plus 0.3% to
1.0%) per annum on the outstanding balances. Running finance facilities amounting to Rs. 450 million can
interchangeably be utilized as non-funded facilities. Out of the aggregate facilities, Rs. 700 million (2018: Rs. 700
million) are secured by first pari passu charge of Rs. 1,621 million over all present and future assets (current and
fixed assets) of the respective Companies in the Group (excluding land and building) and remaining Rs. 300 million
(2018: Rs. 300 million) facility is secured by lien on Holding Company's short term investments (money
market/income fund) which should be 110% of the maximum limit allowed for utilization. Under this arrangement,
short term investment of Rs. 333.33 million (2018: Rs. 333.33 million) in HBL funds is marked under lien. These
facilities are renewable on annual basis latest by 31 December 2018.
This condensed interim consolidated financial information do not include all of the information required for
annual financial statements, and should be read in conjunction with the consolidated financial statements of
the Holding Company as at and for the year ended 30 June 2018.
Comparative figures of the statement of financial position are extracted from the annual financial
statements for the year ended 30 June 2018, whereas comparatives of statement of profit or loss, statement
of comprehensive income, statement of changes in equity and statement of cash flows are stated from un-
audited condensed interim consolidated financial information for the three months period ended on 30
September 2017.
This condensed interim consolidated financial information is unaudited and being submitted to the
shareholders as required under Section 237 of the Companies Act, 2017 and the Listing Regulations of the
Pakistan Stock Exchange Limited.
Judgements and estimates
In preparing this interim consolidated financial information, management has made judgements, estimates
and assumptions that affect the application of accounting policies and the reported amounts of assets and
liabilities, income and expense. Actual results may differ from these estimates.
The significant judgments made by the management in applying the Group's accounting policies and the
key sources of estimation uncertainty were the same as those that applied to the consolidated financial
statements as at and for the year ended 30 June 2018.
The accounting policies and the methods of computation adopted in the preparation of this condensed
interim consolidated financial information are same as those applied in the preparation of the consolidated
financial statements for the year ended 30 June 2018.
There were certain other new standards and amendments to the approved accounting standards which
became effective during the period but are considered not to be relevant or have any significant effect on
the Group's operations and are, therefore, not disclosed.

With shariah compliant financial institutions
6 Contingencies and commitments
6.1 Contingencies:
6.2 Commitments
6.2.1 Letter of credits
6.2.1.1 With conventional financial institutions
6.2.1.2 With shariah compliant financial institutions
Un-audited Audited
30 Sep
2018
30 Jun
2018
7 Property, plant and equipment
Cost
Opening balance 3,825,479,179 3,407,528,666
Additions during the period / year 36,830,225 477,306,255
Disposals during the period / year (42,352,434) (59,355,742)
Closing balance 3,819,956,970 3,825,479,179
Accumulated depreciation
Opening balance 855,451,002 544,758,302
Depreciation for the period / year 97,821,039 360,840,669
Relating to disposals (23,544,561) (50,147,969)
Closing balance 929,727,480 855,451,002
Operating assets-net book value 2,890,229,490 2,970,028,177
Capital work in progress 308,342,055 105,136,237
Net book value 3,198,571,545 3,075,164,414
The Holding Company has facility i.e. letters of credit of Rs. 75 million (2018: Rs. 75 million) availed from
Islamic bank. The amount utilized as at 30 June 2018 for capital expenditure was Rs. Nil (2018: Rs. 1.64
million) and for other than capital expenditure was Rs. 60.20 million (2018: Rs. 54.87 million). Lien is also
marked over import documents.
--------------Rupees--------------
The Holding Company has short term borrowing facility i.e. Running Musharakah available from Islamic bank under
profit arrangements having sanctioned limit of Rs. 200 million (2018: Rs. 200 million). This facility carries profit
rate of three months KIBOR plus 0.3% (2018: three months KIBOR plus 0.3%) per annum on the outstanding
balance. This facility can interchangeably be utilized as non-funded. This facility is secured by first pari passu charge
over current assets of the Holding Company. This facility is renewable on annual basis latest by 31 October 2018.
There is no significant change in contingencies already disclosed in preceding annual published financial
statement of the Holding Company for the year ended 30 June 2018.
Out of the aggregate facility of Rs. 850 million (2018: Rs. 850 million) for opening letters of credit, the
amount utilized by the Group as at 30 September 2018 for capital expenditure was Rs. 104.19 million
(2018: 192.52) and for other than capital expenditure was Rs. 190.74 (2018: Rs. 151.99 million). These
facilities are secured by first pari passu charge of Rs. 1,621 million over all present and future assets
(excluding land and building) of the respective Companies in the Group and lien over import documents.

Un-audited Audited
30 Sep
2018
30 Jun
2018
Note
8 Short term investments
Investments at fair value through profit or loss - Mutual Funds
Held for trading 8.1 912,507,126 941,746,224
912,507,126 941,746,224
8.1 These investments are 'held for trading'
Carrying value at 01 July 941,746,224 855,943,421
Acquisition during the period/year 59,306,530 317,010,000
Redemption during the period/year (73,432,277) (268,427,399)
Realized (loss)/gain on sale of investment - during the period/year (3,038,993) 6,158,532
Unrealized (loss)/gain on re-measurement of investment - during the period/year (12,074,358) 31,061,670
Carrying and fair value of short term investments at 30 Sep / 30 Jun 8.1.1 912,507,126 941,746,224
Audited Un-audited Audited
30 Jun
2018
30 Jun
2018
8.1.1 Mutual fund wise detail is as follows:
HBL Money Market Fund 2,042,626 220,938,008 218,868,503
MCB Cash Management Optimizer Fund 3,693,953 356,289,718 391,315,609
HBL Cash Fund 1,550,552 166,309,698 164,301,807
NAFA Money Market Fund 10,641,065 112,454,904 110,720,285
ABL Government Securities Fund 3,371,142 - 35,481,940
ABL Cash Fund - 35,705,759 -
MCB Pakistan Stock Market Fund 206,559 19,325,851 19,584,236
Faysal Savings Growth Fund 7,425 797,601 794,481
Faysal MTS Fund 6,414 685,587 679,363
912,507,126 941,746,224
8.2
8.3
9 Cash and bank balances
9.1
9.2 These include deposit accounts of Rs. 34.76 million (30 June 2018: Rs. 7.94 million) under mark up arrangements, which carry interest rate
ranging from 4.5% to 5.55% (30 June 2018: 3.5% - 4.57%) per annum.
These also include deposit account of Rs. 3.70 million (30 June 2018: Rs. 0.001 million ) under Shariah compliant arrangements, which
carries profit rate of 2.40% (30 June 2016: 2.40%) per annum.
These include bank accounts of Rs. 0.67 million (2018: Rs. 0.67 million) maintained under Shariah compliant arrangements.
1,623,054
11,227,638
-
34,960,589
206,559
7,718
6,705
Changes in fair values of financial assets at fair value through profit or loss are recorded in profit and loss account. Realized loss of Rs. 3.04
million (30 Sep 2017: Realized gain of Rs. 0.82 million) has been recorded in the current period in "other expenses". These investments
comprise of mutual funds (money market / income fund).
Realized gain on redemption of short term investments is earned under mark up arrangements.
...…………….Number……………… ...…………….Rupees………………
2,130,258
30 Sep
2018
3,540,827
Un-audited
30 Sep
2018
--------------- Rupees ---------------
Units Fair value

30 Sep
2018
30 Sep
2017
Note
10 Revenue - net
Gross sales:
Local 1,267,633,774 1,130,797,260
Export 33,181,496 24,812,159
1,300,815,270 1,155,609,419
Less:
Sales returns (17,619,924) (22,746,882)
Discounts and commission (62,905,344) (89,040,388)
Sales tax (970,242) (4,497,550)
(81,495,510) (116,284,820)
1,219,319,760 1,039,324,599
10.1 This includes sale of both own manufactured and purchased products.
30 Sep
2018
30 Sep
2017
11 Cost of sales
Raw and packing materials consumed 11.1 263,356,225 168,049,554
Other manufacturing expenses 225,616,954 174,735,018
488,973,179 342,784,572
Work in process:
Opening 71,287,001 76,419,116
Closing (80,355,570) (96,843,251)
(9,068,569) (20,424,135)
Cost of goods manufactured 479,904,610 322,360,437
Finished stock:
Opening 773,414,598 1,169,457,116
Purchases made during the period 256,406,738 359,341,527
Closing (760,064,230) (1,193,309,181)
269,757,106 335,489,462
749,661,716 657,849,899
11.1 Raw and packing materials
consumed
Opening 392,398,201 472,681,955
Purchases made during the period 274,953,687 191,863,934
667,351,888 664,545,889
Closing (403,995,663) (496,496,334)
263,356,225 168,049,555
11.2 The amount charged to profit and loss account on account of write down of finished goods to net realizable
value amounts to Rs. Nil (Sep 2017: Rs. 55.17 million).
--------------- Rupees ---------------
(Un-audited) Quarter ended
(Un-audited) Quarter ended
--------------- Rupees ---------------

30 Sep
2018
30 Sep
2017
12 Taxation
Current
- For the year 39,924,750 47,633,993
Deferred
- For the year - (27,855,139)
39,924,750 19,778,854
13 Transactions with related parties
30 Sep
2018
30 Sep
2017
Other related parties
Contribution towards employees' provident fund 9,771,850 8,552,715
Remuneration including benefits and
perquisites of key management personnel 39,655,876 33,073,057
The Board of Directors of the Holding Company intends to distribute sufficient cash dividend for the year ended 30 June
2019 to comply with the section 5A of the Income Tax Ordinance 2001. Accordingly, no provision for tax on undistributed
reserves has been recognized in this condensed consolidated interim financial information.
The related parties include associated companies, contributory provident fund, major shareholders, directors and key
management personnel. Balances with the related parties are shown elsewhere in the accounts. Transactions with related
parties during the period are as follows:
(Un-audited) Quarter ended
------------------- Rupees -------------------
(Un-audited) Quarter ended
--------------Rupees--------------

14 Reconciliation of movement of liabilities to cash flows arising from financing activities
Unclaimed
dividend
Accrued
mark-upTotal
As at 30 June 2018 82,143,724 539,624 82,683,348
Changes from financing cash flows
Dividend paid (341) - (341)
Financial charges paid - (2,041,181) (2,041,181)
Total changes from financing cash flows (341) (2,041,181) (2,041,522)
Other changes
Dividend approved - - -
Interest / markup expense - 4,501,944 4,501,944
Total liability related other changes - 4,501,944 4,501,944
As at 30 September 2018 82,143,383 3,000,387 85,143,770
15 Financial risk management and financial instruments - fair value
15.1 The Group's financial risk management objective and policies are consistent with that disclosed in the annual
consolidated financial statements of the Holding Company for the year ended 30 June 2018.
- - - - - - - - - - - - - Rupees - - - - - - - - - - - - -

15.2
Cash and cash
equivalents
Fair Value through
Income Statement
Loans and
receivables
Other financial
liabilities
Total Level 1 Level 2 Level 3
30 September 2018
Financial assets measured at fair value:
Short term investments - 912,507,126 - - 912,507,126 912,507,126 - -
Financial assets not measured at fair value:
Long term deposits - - 11,633,325 - 11,633,325 - - -
Trade debts - considered good - - 655,509,038 - 655,509,038 - - -
Loans and advances - considered good - - 1,649,839 - 1,649,839 - - -
Short term deposits - - 216,098,017 - 216,098,017 - - -
Other receivables - - 89,511,846 - 89,511,846 - - -
Bank balances 114,808,070 - - - 114,808,070 - - -
114,808,070 - 974,402,065 - 1,089,210,135 - - -
Financial liabilities measured at fair value: - - - - - - - -
Financial liabilities not measured at fair value:
Trade and other payables - - - 648,717,388 648,717,388 - - -
Unclaimed dividend - - - 82,143,383 82,143,383 - - -
Short term borrowing - - - 289,254,450 289,254,450 - - -
Accrued mark-up - - - 3,000,387 3,000,387 - - -
- - - 1,023,115,608 1,023,115,608 - - -
30 June 2018
Financial assets measured at fair value:
Short term investments - 941,746,224 - - 941,746,224 941,746,224 - -
Financial assets not measured at fair value:
Long term deposits - - 11,613,325 - 11,613,325 - - -
Trade debts - considered good - - 604,467,682 - 604,467,682 - -
Loans and advances - considered good - - 21,906,685 - 21,906,685 - - -
Short term deposits - - 190,727,754 - 190,727,754 - - -
Other receivables - - 69,534,001 - 69,534,001 - - -
Bank balances 280,188,463 - - - 280,188,463 - - -
280,188,463 - 898,249,447 - 1,178,437,910 - - -
Financial liabilities measured at fair value: - - - - - - - -
Financial liabilities not measured at fair value:
Trade and other payables - - - 717,349,450 717,349,450 - - -
Unclaimed dividend - - - 82,143,724 82,143,724 - - -
Short term borrowing - - - 100,525,853 100,525,853 - - -
Accrued mark-up - - - 539,624 539,624 - - -
- - - 900,558,651 900,558,651 - - -
The following table shows the carrying amounts and fair values of financial assets and financial liabilities, including their levels in the fair value hierarchy. It does not include fair value information for financial assets and financial
liabilities not measured at fair value if the carrying amount is a reasonable approximation of fair value.
Carrying Amount Fair Value
- - - - - - - - - - - - - - - - - - - - - - - - - - - - - - - -- - - - - - - - Rupees - - - - - - - - - - - - - - - -- - - - - - - - - - - - - - - -- - - - - - - - - - - - - - - -
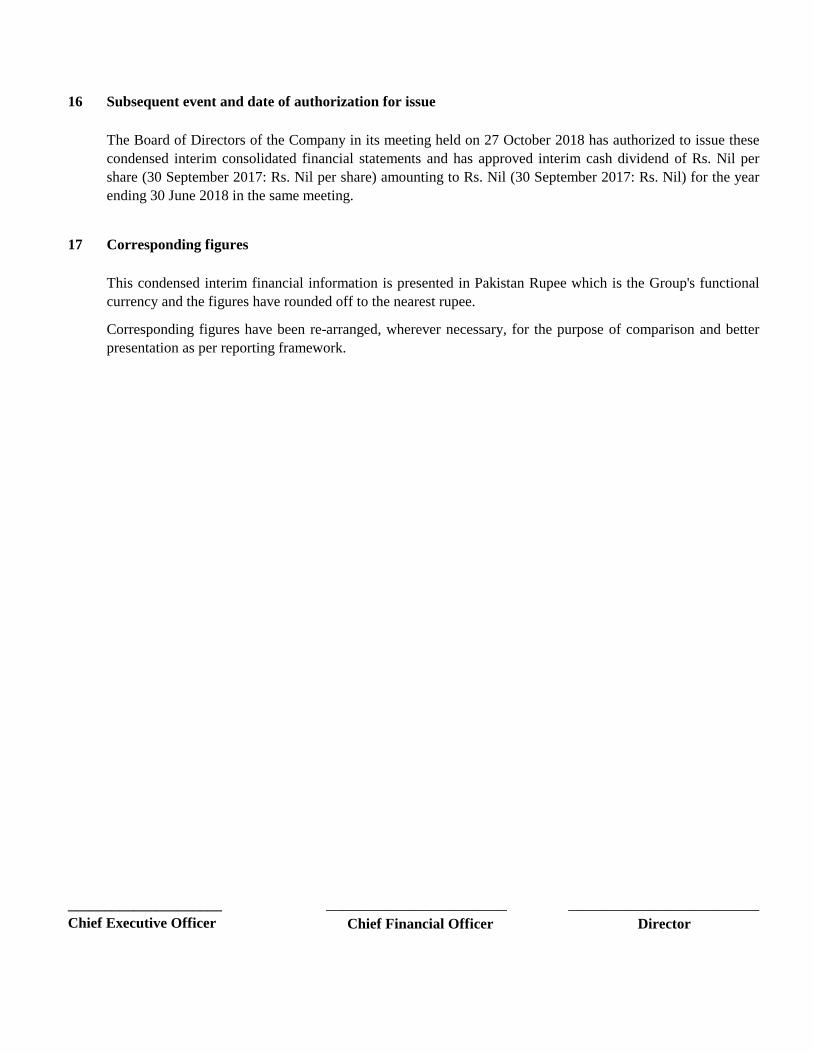
16 Subsequent event and date of authorization for issue
17 Corresponding figures
_____________________
Chief Executive Officer Chief Financial Officer Director
__________________________
The Board of Directors of the Company in its meeting held on 27 October 2018 has authorized to issue these
condensed interim consolidated financial statements and has approved interim cash dividend of Rs. Nil per
share (30 September 2017: Rs. Nil per share) amounting to Rs. Nil (30 September 2017: Rs. Nil) for the year
ending 30 June 2018 in the same meeting.
This condensed interim financial information is presented in Pakistan Rupee which is the Group's functional
currency and the figures have rounded off to the nearest rupee.
Corresponding figures have been re-arranged, wherever necessary, for the purpose of comparison and better
presentation as per reporting framework.
__________________________


