39
Conditions Leading to Anomalously Early Loran-C Signal Skywave
| Date post: | 17-Dec-2015 |
| Category: |
Documents |
| Upload: | elfrieda-warner |
| View: | 220 times |
| Download: | 2 times |

Conditions Leading to Anomalously Early Loran-C
Signal Skywave

Components of the Transmitted Loran-C Signal
Loran-C Transmitter
• Normally, the skywave pulse is well-separated in time from the groundwave
• For longer ranges and lower ionospheres, however, the skywave is nearly aligned with the groundwave
• If, under these conditions, skywave signal strength groundwave signal strength, correct cycle identification becomes a major problem

Outline• Calculation of ionospheric height profiles• Profiles under day, night, and anomalous
conditions• Skywave signal group delay and amplitude relative
to groundwave• Anomalous Conditions: Origins and their Footprint
on the Ionosphere• Effects on Loran
– Integrity vs. Availability– Strategies to avoid/minimize effects

Groundwave/Skywave Geometry
h
RE
RE + h
R/2 (arc length)
/ 2
= R / RE
Skywave
Groundwave
TP
IP
= incidence angle
gaNDNDEENDND vRnv/ h+RR+h t //)]4(sin)(4[2 ,2/12
,2
,,
Group delay between groundwave and skywave components:

Effective Ionospheric Heights
• The ionospheric height depends not only on solar zenith angle (which includes day and night as extremes), but also on incidence angle
• Consider a height profile over path length that yields greater heights for low incidence angles (short path lengths/ranges) and smaller heights for higher incidence angles (greater ranges), viz.
where h = ionospheric height and = incidence angle
sincos h

• Although the greatest ionospheric height would be expected at range R = 0 (where = 0), Loran transmitting antennas have an effective dipole pattern, with a null vertically upward
• The peak ionospheric height thus occurs at a non-zero range (typically 50 – 100 km)
• The functional form for h follows this expected behavior for a dipole-pattern type antenna
Effective Ionospheric Heights (Cont’d)

Profile Calibration Procedure
• Pick the extreme effective ionospheric reflection heights at– a short range (maximum height)
– the maximum range: 90° (grazing) launch angle for a one-hop skywave (minimum height)
or
– pick one of the extreme heights and assume the other extreme differs from it by: 12 km for day and 10 km for night
• Solve for and • Solve the implicit equation for ionospheric height, i.e.,
sincos h
at each point along the path

Profile Calibration Procedure (Cont’d)
• Since skywave delay depends on mid-path ionospheric height, incidence angle, and range, one can fit a profile to existing skywave delay data* at several ranges along a given great-circle path
• At this time, we have not included the variable daytime solar zenith angle over the path but that will be included in our final product
* Last, J., R. Farnworth, M. Searle, Effect of Skywave Interference on the Coverage of Loran-C, IEE Proceedings-F, Vol. 139, No. 4, August 1992 (data taken from DMA groundwave/skywave correction tables that are purportedly based on measurement data

Skywave Delay Relative to Groundwave
DOTDMA Data

Ionospheric Height and Incidence Angle Profiles
DayNight

Polar Ionosphere
• Polar Cap Disturbances (PCDs) are caused by solar proton events
• The effective height for the ionosphere during a polar cap disturbance event can be as low as 50 km (Davies, Ionospheric Radio)
• Using the model described earlier, we assign a maximum ionospheric height of 56 km and a minimum ionospheric height of 44 km

Skywave Amplitude
The skywave amplitude for a ground-based vertical E-field receiver antenna is
2300 cos /z t t rE P R DF F s
where
Pt = transmitting station power
= launch/receive elevation angle
R =parallel-to-parallel reflection coefficient
D = ionospheric convergence factor
Ft , Fr = transmit/receive antenna factors
s = signal path length

Skywave Amplitude (cont’d)
• The reflection coefficients are a key part of the skywave amplitude calculation – all other parts of the expression depend on geometry and antenna configuration/type.
• Reflection coefficients for PCD ionospheres were extrapolated from values measured during “normal” ionospheric conditions
• Reflection coefficients are complex and therefore introduce a phase shift as well as reduction in amplitude

Reflection Coefficients
Assumed
Magnitude only – based on measurements
Loran propagation is within this region
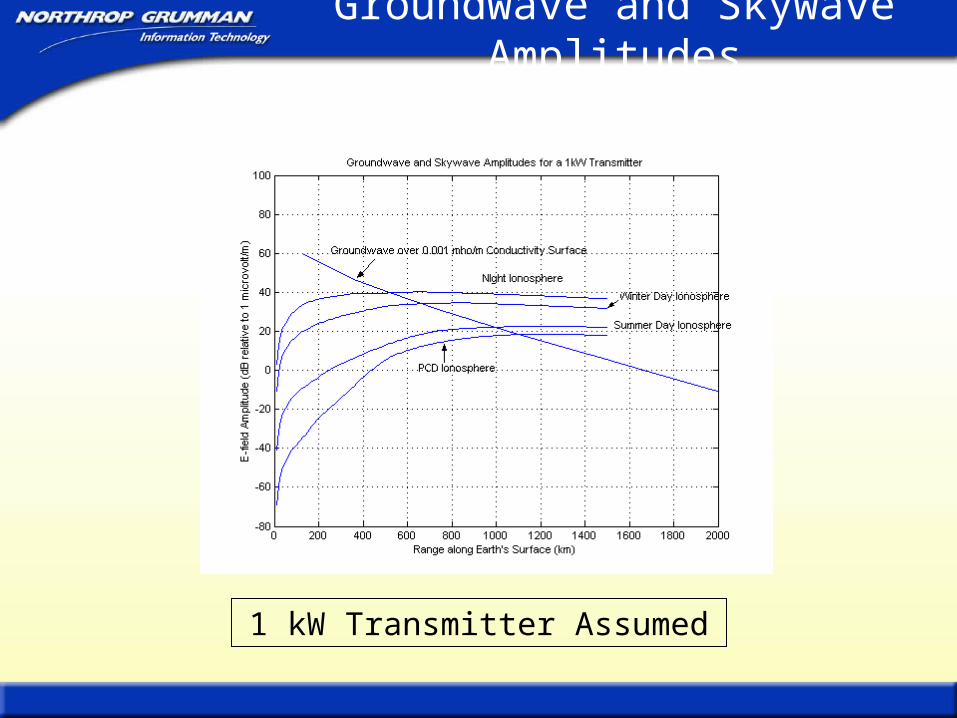
Groundwave and Skywave Amplitudes
1 kW Transmitter Assumed

Skywave Group Delay
Skywave group delay relative to Groundwave pulse onset is calculated for
– the skywave interacting with the PCD ionosphere described earlier
– groundwave propagating over 10-3 mho/m earth– group delay introduced by dispersive
ionosphere (reflection coefficient)

Skywave Delay relative to Groundwave

Skywave Group Delay and SGR
• Both skywave group delay and signal level relative to groundwave are important in calculating the probability of incorrect cycle identification
• In developing strategies to maximize cycle detection probability, we must determine “worst-case” combinations of these parameters

Challenging Cycle Identification Region
Challenging Cycle Identification Region

Origin of PCDs
• Solar Proton Events occur as the result of complex plasma processes on the sun that cause excessive fluxes of protons traveling outward from the sun along interplanetary magnetic field (IMF) lines, some of which hit the earth’s magnetosphere
• The earth’s high-latitude geomagnetic field lines parallel the IMF so the protons are less deflected from this region
Protons cause Polar Cap Disturbances (PCDs) that result from excess ionization in the ionospheric D-regions poleward of the auroral zones

Origin of PCDs (Cont’d)
• The same processes leading to SPEs also cause shock waves to propagate along the IMF and eventually hit the geomagnetic field causing– geomagnetic storms
– the auroral zone to move equatorward
• This latter phenomenon causes the continuing proton flux to excessively ionize lower-latitude ionospheres

POLAR IONOSPHERICDISTURBANCES
GPS
EQUATORIAL IONOSPHERICDISTURBANCES
UFO & FLTSATCOMMAGNETICEQUATOR
SPACE BASEDRADAR
Active sun is source of excessive radiation and particles that disturb Earth’s “geospace”
Solar-induced geomagnetic storms lead to disturbances in the polar and equatorial ionosphere
Anomalous Solar Events Affect the Earth

Solar ProtonEvent Determination
• Obtain solar proton event (SPE) data from Space Environment Lab (SEL) for 1976-2002
• Determine the position of the Auroral Zone (AZ) boundary for each of major SPE events

Effect of Accompanying Geomagnetic Storm
• The position of the AZ boundary is very sensitive to geomagnetic storms and is measured by the ring current index, Dst
• In a recent paper*, a relationship between the plasmapause L-shell and Dst was derived:
[ = geomagnetic latitude of AZ ; Dst has units of nT]
6 3 4cos 5.3409 10 4.5455 10 Dst
*Yokoyama, N., Y. Kamide, and H. Miyaoka, The size of the auroral belt during magnetic storms, Ann. Geophysicae 16: 566-573 (1998)

Event Characteristics
• Dst data is compiled by the World Data Center (C2) at Kyoto University (web-accessible)
• For each SPE event, Dst data was analyzed for the corresponding date and time– for nearly every event, a precipitous drop in Dst
occurred 2 – 4 days after the event onset time – the duration of the anomalously low Dst
condition was typically 2 hours

Examples of SPE-associated Dst Excursions
SPE OnsetMax
Dst drop
SPE Onset Dst drop

Temporal/Spatial Effects on the Loran User
For user-station paths having mid-points:• Poleward of the “nominal” AZ boundary (~60°
Geomagnetic North), the SPE effect persists for 2 – 4 days, depending on the event and the local geospace conditions
• Equatorward of the AZ boundary, the SPE effect lasts only a few hours, near the end of the event, and only then if the geomagnetic storm drives the AZ boundary sufficiently far south

Impact on Loran
Conditions for anomalous skywave propagation occur when
1. Groundwave Path Length > 800 - 1000 km2. Groundwave Path Length < 2Re arc cos ((Re /(Re + h))
3. Ionospheric Height : 44 -56 km
How often and where do these conditions occur in the U.S.?

Anomalous Region for a Single Station
Auroral Zone Boundary
Loran Station
800 km
1600 km
Anomalous Region for a User Receiver
The Anomalous Region includes those receiver locations whose path mid-points are poleward of the AZ boundary

Affected CONUS Area vs. AZ Boundary GM Lat

Solar Proton Event Histogram - 2001

Event Probability Calculation
Find the probability that any eLoran user, with a receiver located anywhere in the contiguous 48 states will use a Loran station with a range between 800 and 1600 km and having a path mid-point that is poleward of the AZ boundary at any time during a year at the peak of the solar cycle

Individual Station Results - 2001
Station Name Latitude (degrees) Longitude (degrees)Geomagnetic Latitude(degrees)
Probability of Anomalous Condition (2001)
Caribou 46.8075850 -67.9269890 57.9982 0.00090802Nantucket 41.2533460 -69.9773710 52.4533 0.0008505Cape Race 46.7756350 -53.1743350 57.3655 0.00035746Fox Harbor 52.3764590 -55.7077390 63.1078 0.00033691Williams L 51.9663540 -122.3671400 57.7492 0.00083818Shoal Cove 55.4391500 -131.2553000 59.4098 0.00039444George 47.0633600 -119.7441600 53.4814 0.0010272Port Hardy 50.6082860 -127.3579100 55.5474 0.00073135Malone 30.9941310 -85.1690980 41.7471 0.001208Grangevlle 30.7258750 -90.8286240 41.091 0.001171Raymondvll 26.5319840 -97.8332050 36.2894 0.00076422Jupiter 27.0329240 -80.1146880 38.0371 0.0008012Carolina B 34.0628360 -77.9128060 45.1383 0.0012285Havre 48.7440530 -109.9815600 56.6781 0.0015038Baudette 48.6138740 -94.5549760 58.5157 0.0017092Boise City 36.5057730 -102.8998600 45.6153 0.0016188Gillette 44.0031400 -105.6233000 52.6586 0.0016517Dana 39.8521270 -87.4865520 50.4282 0.0016517Wildwood 38.9495380 -74.8669770 50.1009 0.00097787Fallon 39.5518720 -118.8321700 46.3221 0.00089981Middletown 38.7825310 -122.4955500 44.9606 0.00087105Searchlght 35.3217510 -114.8046900 42.8124 0.0012203Las Cruces 32.0717030 -106.8678900 40.7337 0.0013066Seneca 42.7140880 -76.8259190 53.8158 0.00106

Station Event Probabilities

Discussion
• Probabilities of the anomalously early skywave delay condition are between 2x10⁻⁴
and 2x10⁻³
• Probabilities are certainly higher in Alaska and Canada

Methods to alleviate early skywave problems:– Shape pulse for earlier rise time– Receiver techniques
• identify/remove through prediction and correlation
• antenna polarization techniques
– Warning systems• endemic monitors
• external monitors
Discussion (Cont’d)

Implications of these Results
• If warnings are issued prior to, or at the onset of, these events, the resulting lack of coverage reduces the availability of the signal
• Warning systems must be designed so that the overall level of integrity < 10-7 / hour

• SEL provides probabilities for occurrence of high activity, e.g., solar proton events (SPE)
• SEL also provides notices of these events essentially at onset
• Mechanisms that lead to equatorward movement of the auroral zone (AZ) boundary follow the SPE by a few hours to ~ 5 days
Implications of these Results (Cont’d)

Implications of these Results (Cont’d)
• The AZ boundary movement eventually occurs following the SPE, but the exact time cannot be forecast precisely
• Thus, advance warnings in the uncertain range of ~ 10 hours - 5days can be given regarding the occurrence of these events in the contiguous 48 states
• Monitor sites can detect these events by monitoring stations at ranges between ~ 1000 and 1500 km whose path mid-points have geomagnetic latitudes between 40° and 60°


