CONDITIONS OF COMPETITION IN U. S. MARKETS BETWEEN DOMESTIC AND FOREIGN LIVE CATTLE AND CATTLE MEAT FIT FOR HUMAN CONSUMPTION USITC Publication 8 4 2 United States International Trade Commission I Washington, D.C. 20436
Transcript
CONDITIONS OF COMPETITION IN U. S. MARKETS BETWEEN DOMESTIC AND FOREIGN LIVE CATTLE
AND CATTLE MEAT FIT FOR HUMAN CONSUMPTION
USITC Publication 8 4 2
United States International Trade Commission I Washington, D.C. 20436
UNITED STATES INTERNATIONAL TRADE COMMISSION
COMMISSIONERS
Daniel Minchew, Chairman Joseph 0. Parker, Vice Chairman George M. Moore
Catherine Bedell ltalo H. Ablondi Bill A lberger
Kenneth R. Mason, Secretary to the Commission
Office of Industries
This report was prepared principally by
The Agriculture, Fisheries, and Forest Products Division
Edward P. Furlow, Chief J. Fred Warren David E. Ludwick Robert T. Roeder
Assisted by
The Office of Economic Research
Wayne M. Simon Magdolna Kornis
and
The Office of the General Counsel
William W. Gearhart
Address all communications to Office of the Secretary
United States International Trade Commission Washington, D. C. 20436
UNITED STATES INTERNATIONAL TRADE COMMISSION
CONDITIONS OF COMPETITION IN U.S. MARKETS BETWEEN DOMESTIC AND FOREIGN LIVE CATTLE AND CATTLE MEAT FIT FOR HUMAN CONSUMPTION
Report on Investigation No. 332-85 Under Section 332 of the Tariff
Act of 1930
Washington, D.C. November 1977
C 0 N T E N T S
Summary--------------------------------------------------------- viii Introduction---------------------------------------------------- 1 Description and uses-------------------------------------------- 3
Live cattle-------------------------------------------------- 3 Meat of cattle----------------------------------------------- 5
U.S. consumption------------------------------------------------ 10 Total and per capita consumption----------------------------- 10 Factors affecting consumption-------------------------------- 11
Hamburger and other processed beef------------------------ 12 Competing meats, fish, and.poultry------------------------ 13 The role of imports--------------------------------------- 14 Disposable income----------------------------------------- 14
U.S. industry: Characteristics of the U.S. industry------------------------- 16
Cow-calf operations--------------------------------------- 16 Feedlot operations---------------------------------------- 19 U.S. meatpackers (slaughterers and processors)------------ 20
Production--------------------------------------------------- 23 Live cattle----------------------------------------------- 23
Trends in major cost elements of cattle production----- 25 Cattle slaughtered------------------------------------- 26
Meat of cattle: Beef and veal------------------------------------------ 27 Movement of cattle and beef and veal into the
U.S. market------------------------------------------ 29 U.S. exports of cattle and products of cattle---------------- 31
Live cattle----------------------------------------------- 31 Beef and veal and edible offal---------------------------- 32 Packinghouse byproducts----------------------------------- 35
Inventories: Live cattle, the cattle cycle----------------------------- 36 Inventories of beef and veal------------------------------ 38
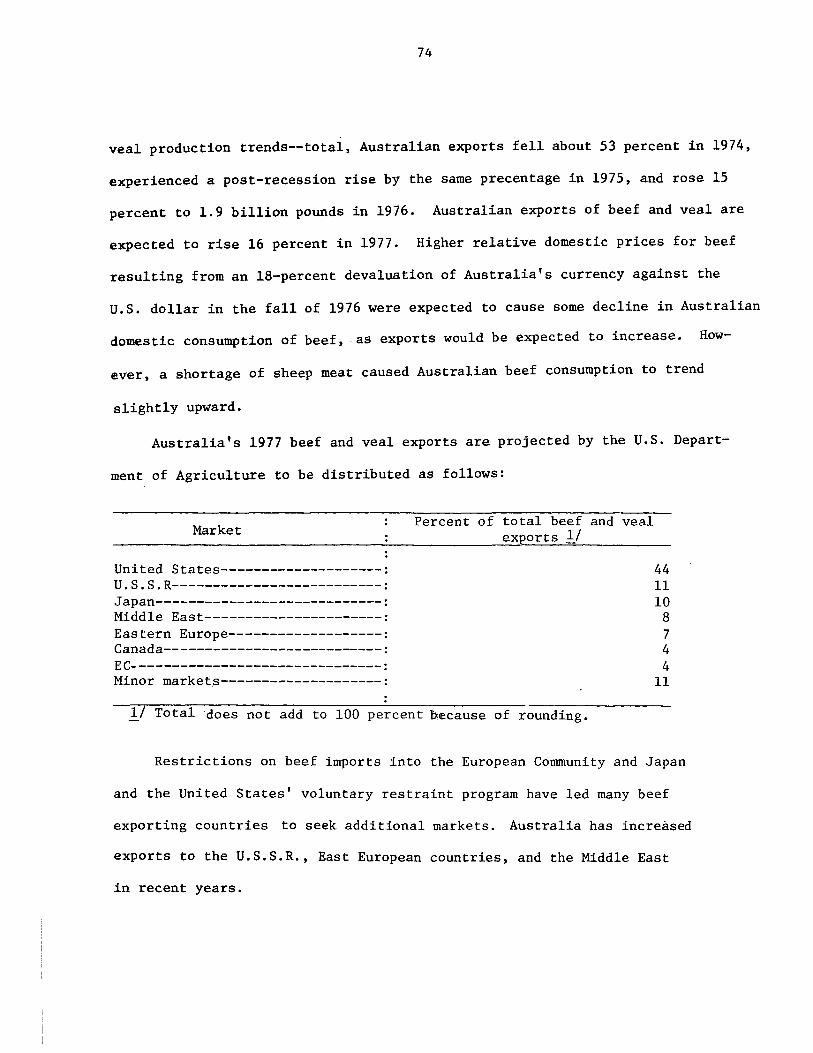
Foreign industry; Live cattle trade--------------------------------------------- 69 Beef and veal trade,..------------------------------------------ 71
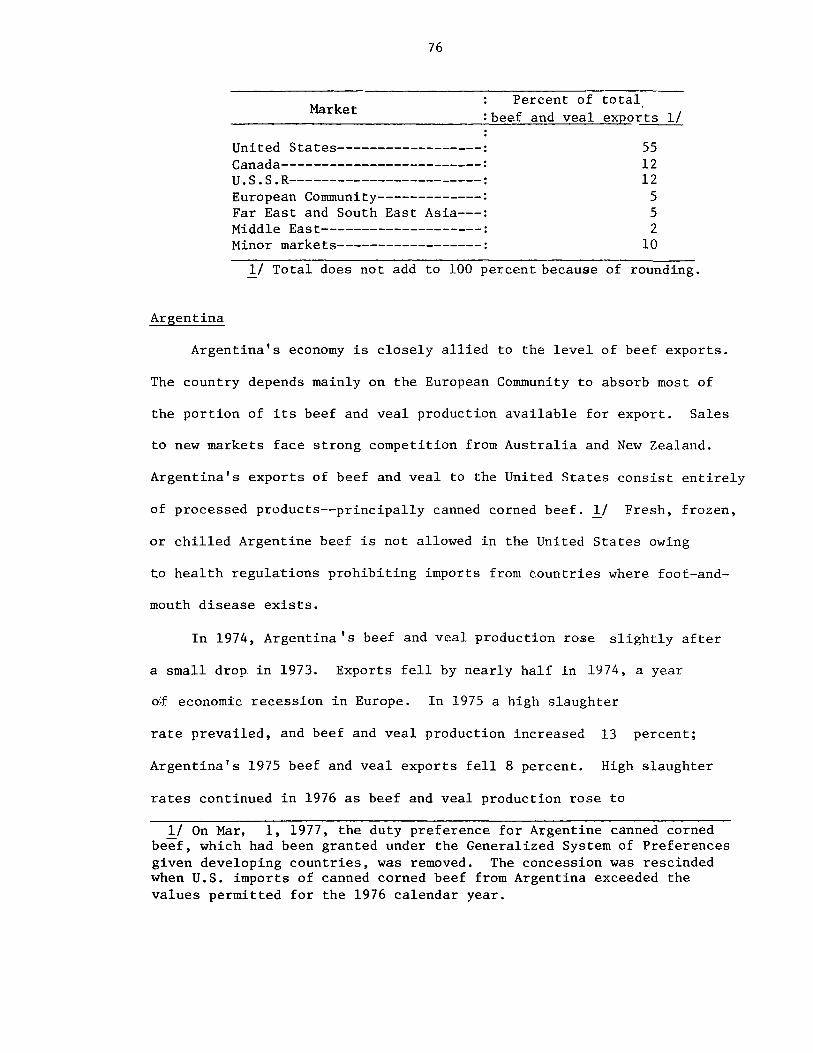
Australia------------------------------------------------- 73 New Zealand----------------------------------------------- 75 Argentina------------------------------------------------- 76 Other meat exporting countries---------------------------- 77
U.S. imports: Live cattle-~------------------------------------------------ 79 Meat of cattle:
Volume and trend-----------------------------~------------ 82 The principal supplying countries------------------------- 83 U.S. entry ports--~--------------------------------------- 87
The condition of competition from imports of beef and veal in the period preceding the Meat Import Act of 1964 and those of the current period------------------------ 87
U.S. customs treatment-------------------------------------------- 89 Tariff treatment for live cattle------------------------------ 91 Tariff treatment for meat of cattle--------------------------- 93
Meat (except meat offal) of cattle, fresh, chilled, or frozen-------------------------------------------------- 93
Edible meat offal----------------------------------------- 93 Sausages-------------------------------------------------- 94 Beef and veal, prepared or preserved (except sausages)---- 94 Mixtures of beef and other meats-------------------------- 95
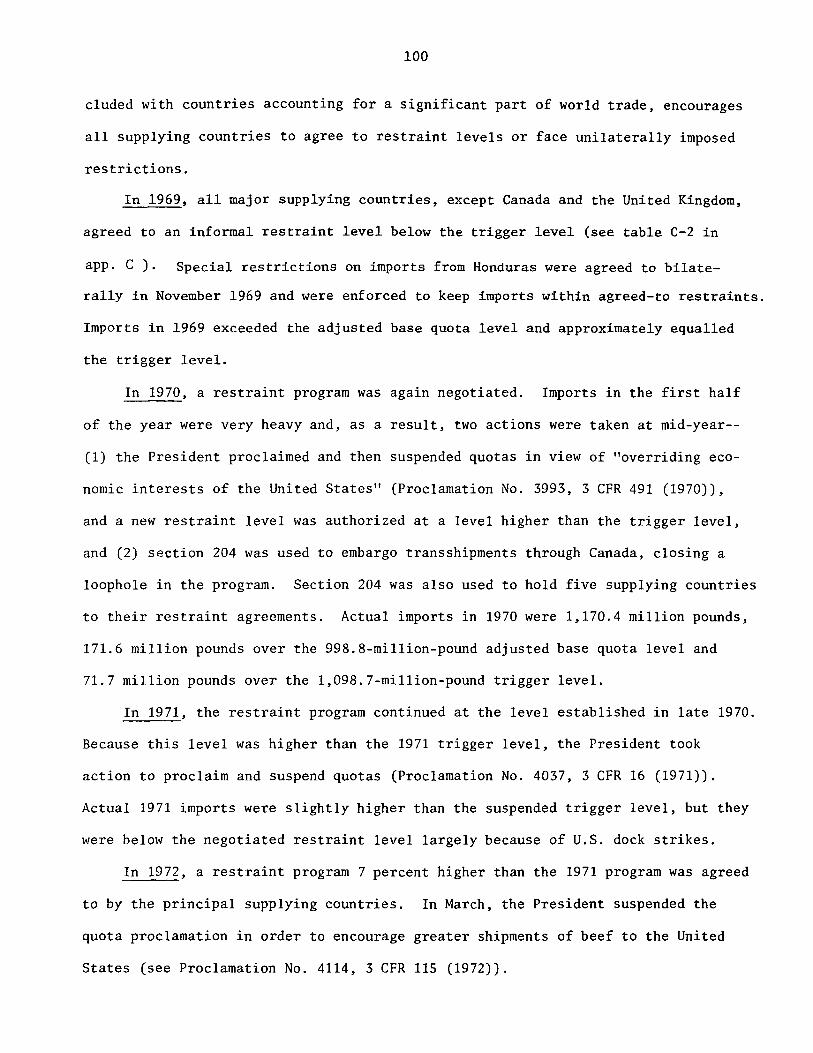
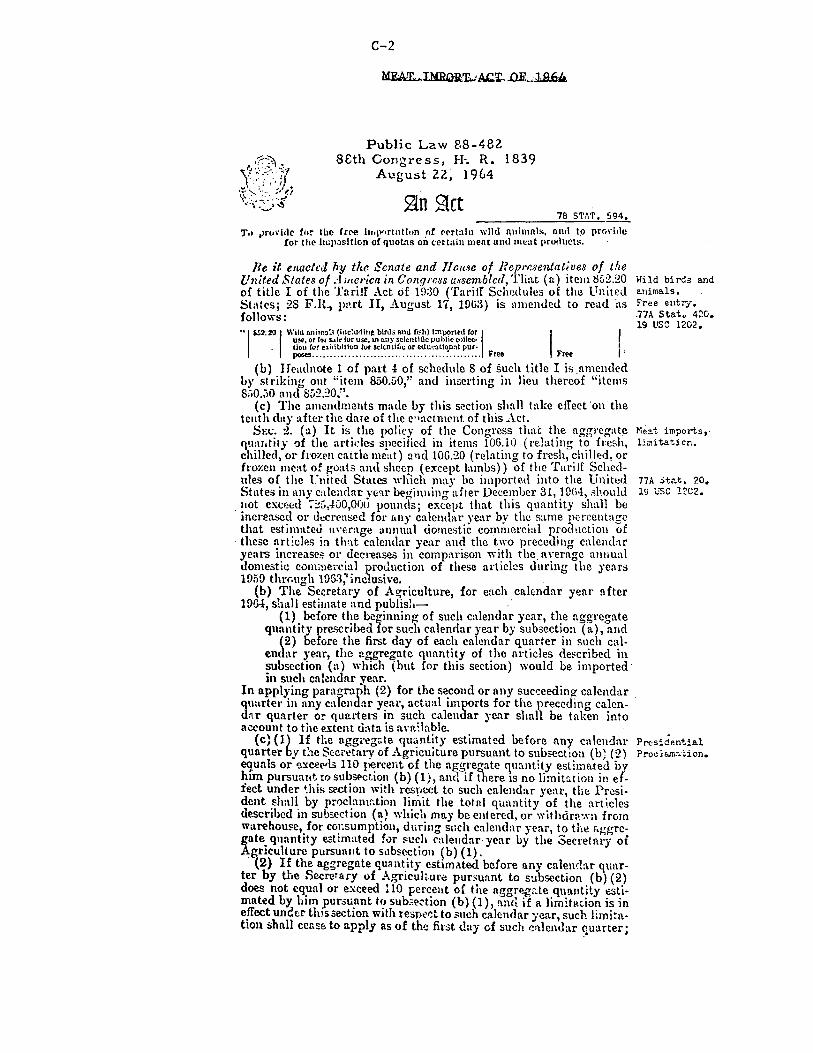
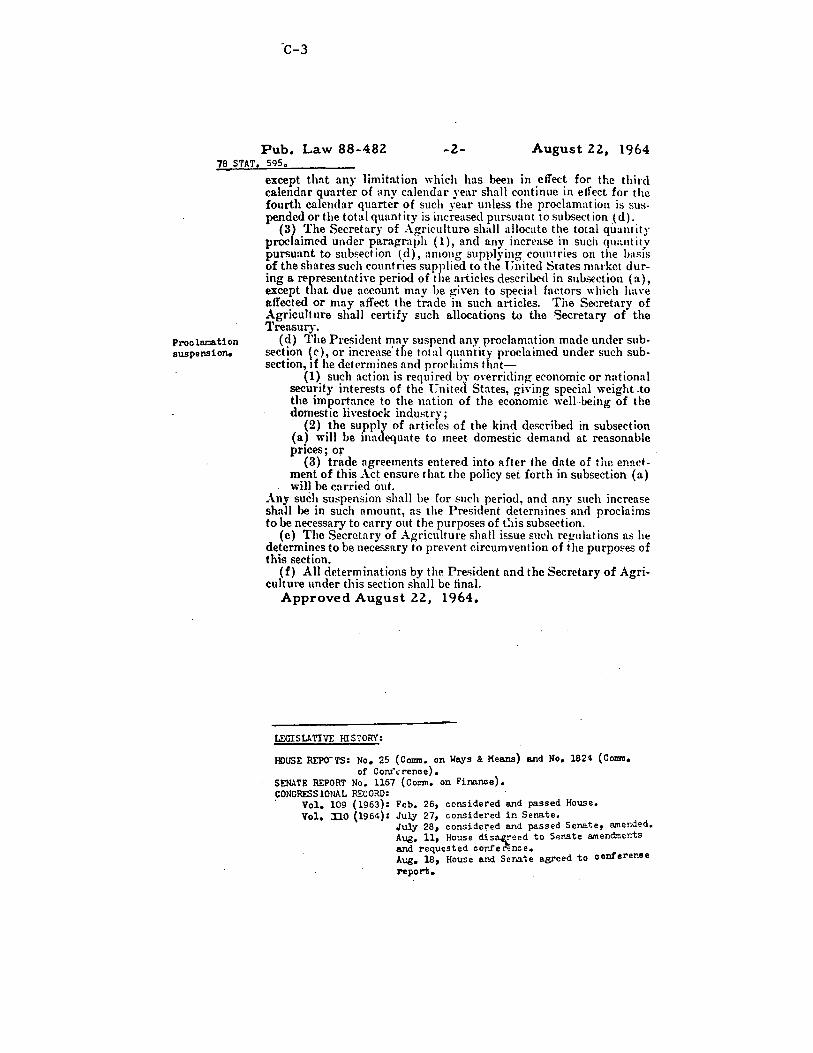
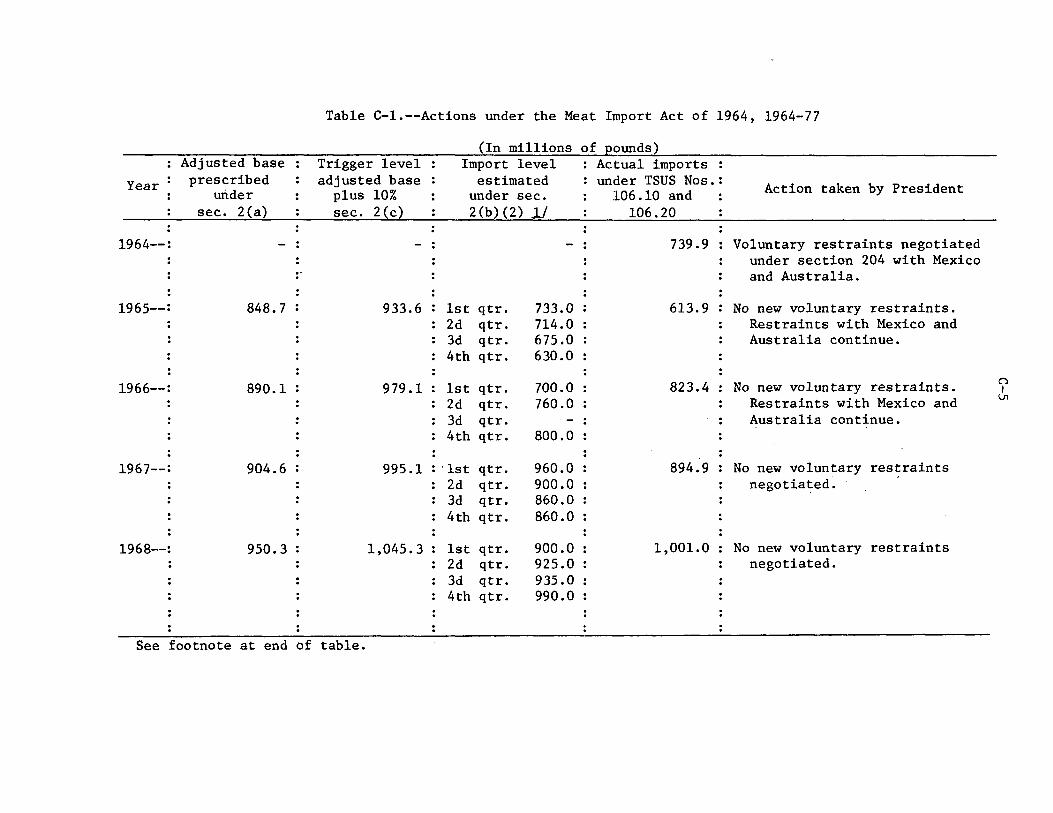
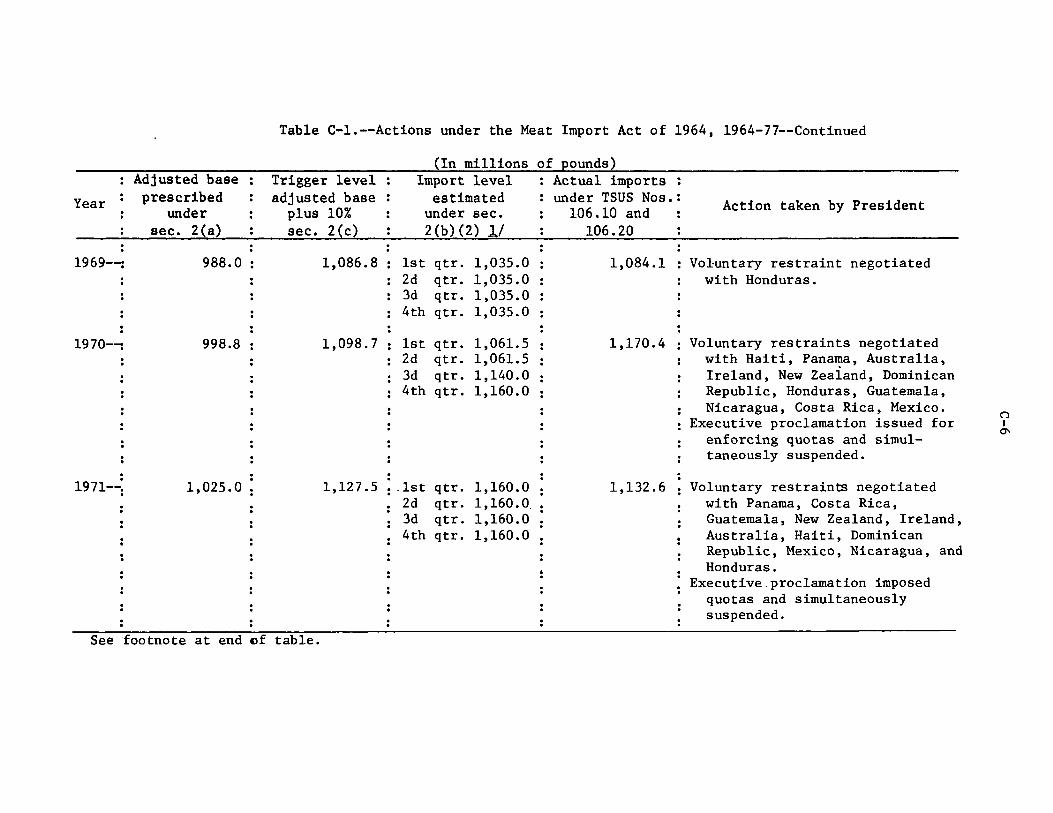
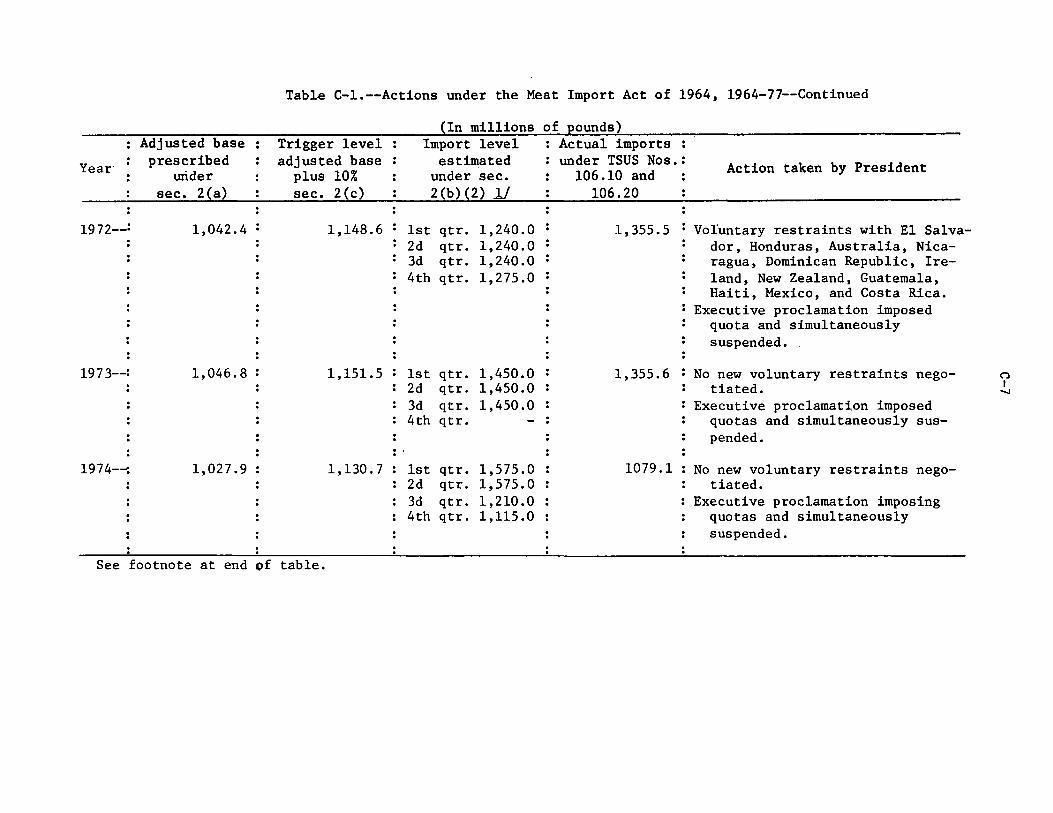
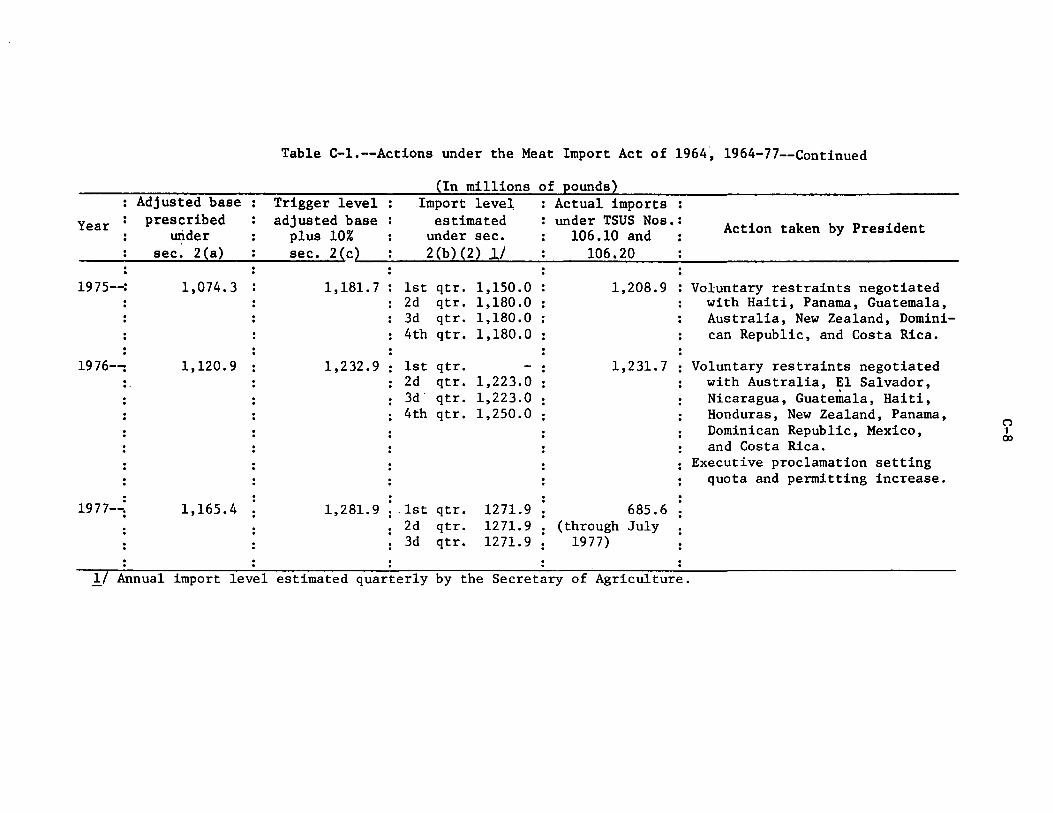
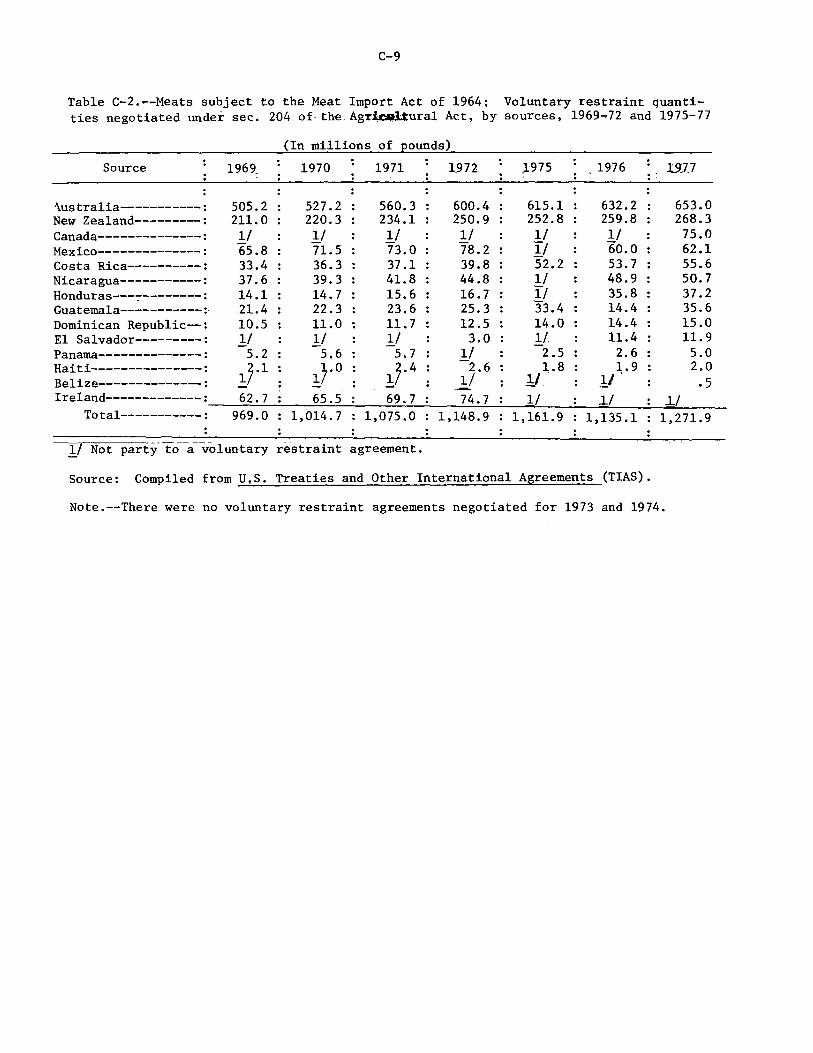
Other Government regulations affecting imports: The Meat Import Act of 1964------------------------------- 96 Section 204 of the Agricultural Act----------------------- 98 History of meat imports under the Meat Import Act and
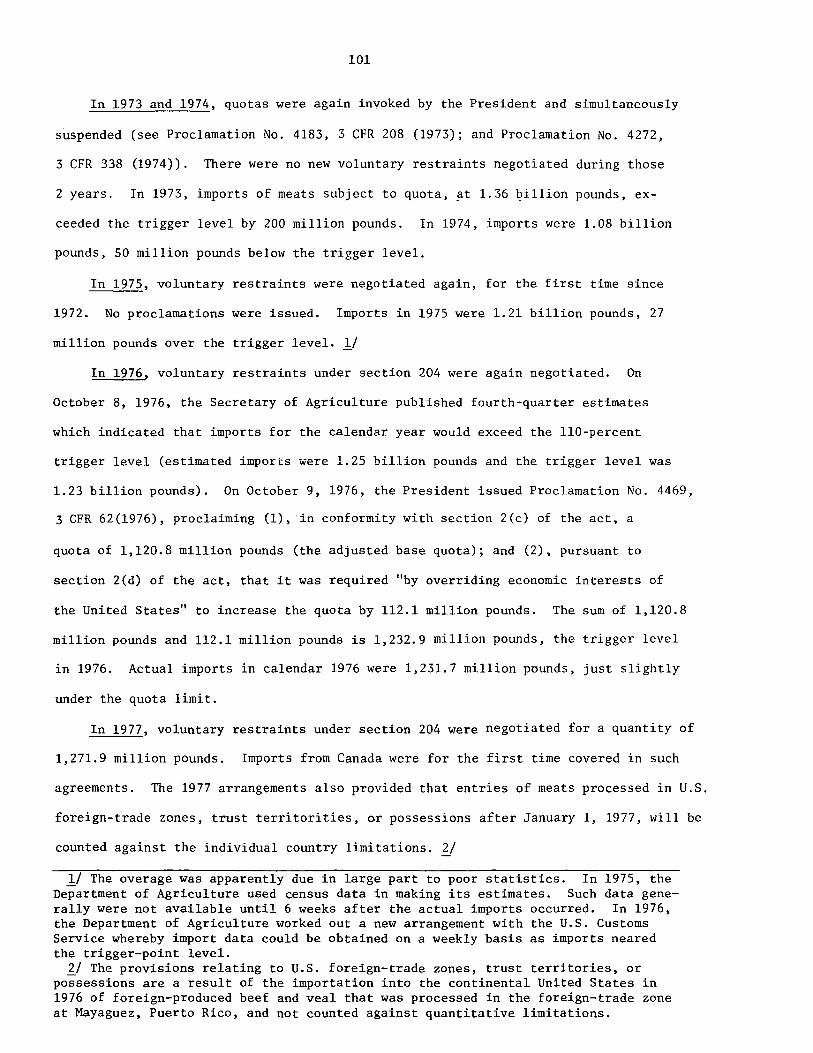
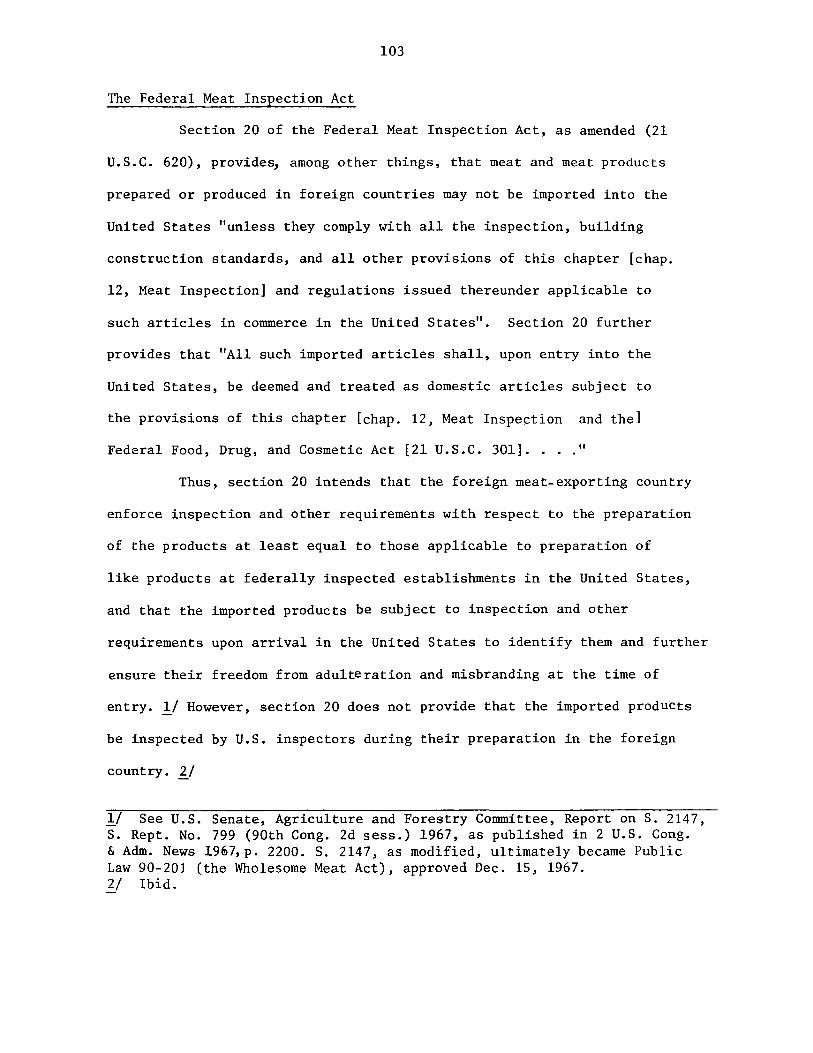
section 204 of the Agricultural Act--------------------- 99 The Federal Meat Inspection Act--------------------------- 103
Provisions of existing law that may provide opportunities for relief to cattlemen--------------------------------------------- 107
Section 22 import restrictions-----------~-------------------- 107 Countervailing duty------------------------------------------- 108 Antidumping Act----------------------------------------------- 109 Unfair import practices--------------------------------------- 110 Other avenues of relief--------------------------------------- 110
Workers--------------------------------------------------- 111 Firms----------------------------------------------------- 111 Communities----------------------------------------------- 112 Public Law 83-480 (food aid to developing countries)------ 113 Public Law 94-35 (loan guarantees)------------------------ 113 Public Law 99-68 (disaster aid)--------------------------- 113 National School Lunch Act--------------------------------- 113 Drought and Flood Conservation Program-------------------- 114 Other U.S. governmental programs through which beef
and veal may be purchased------------------------------- 115
iii
CONTENTS
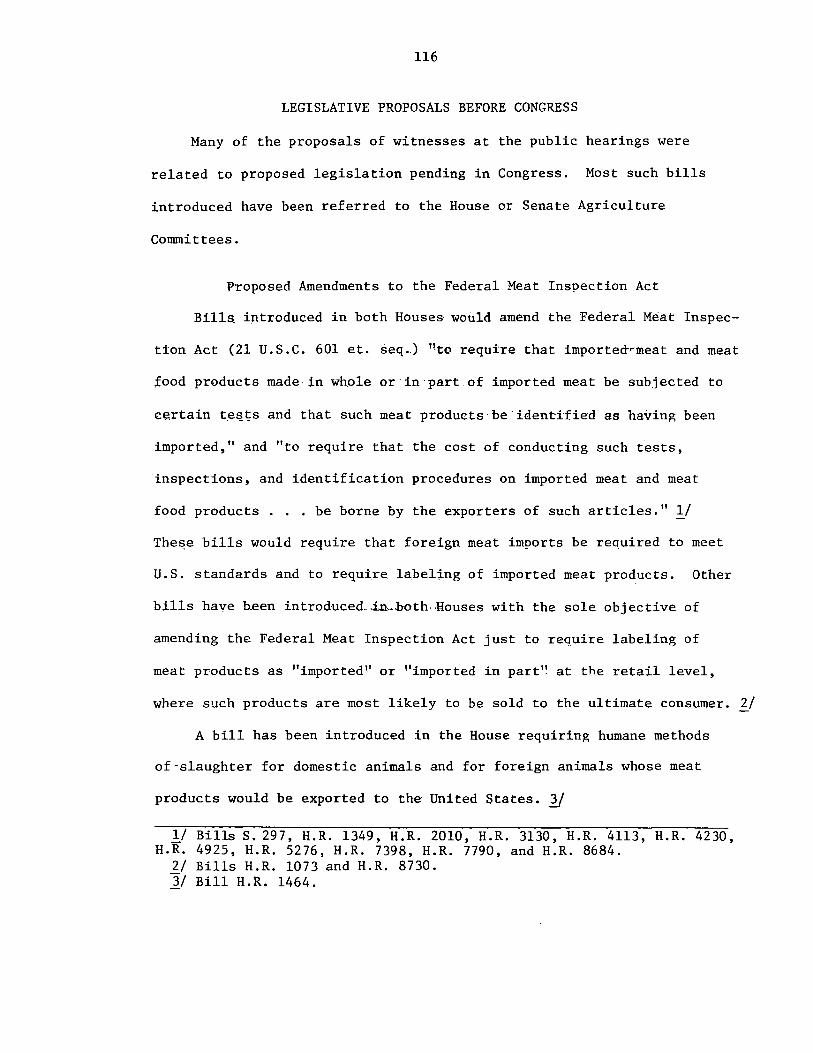
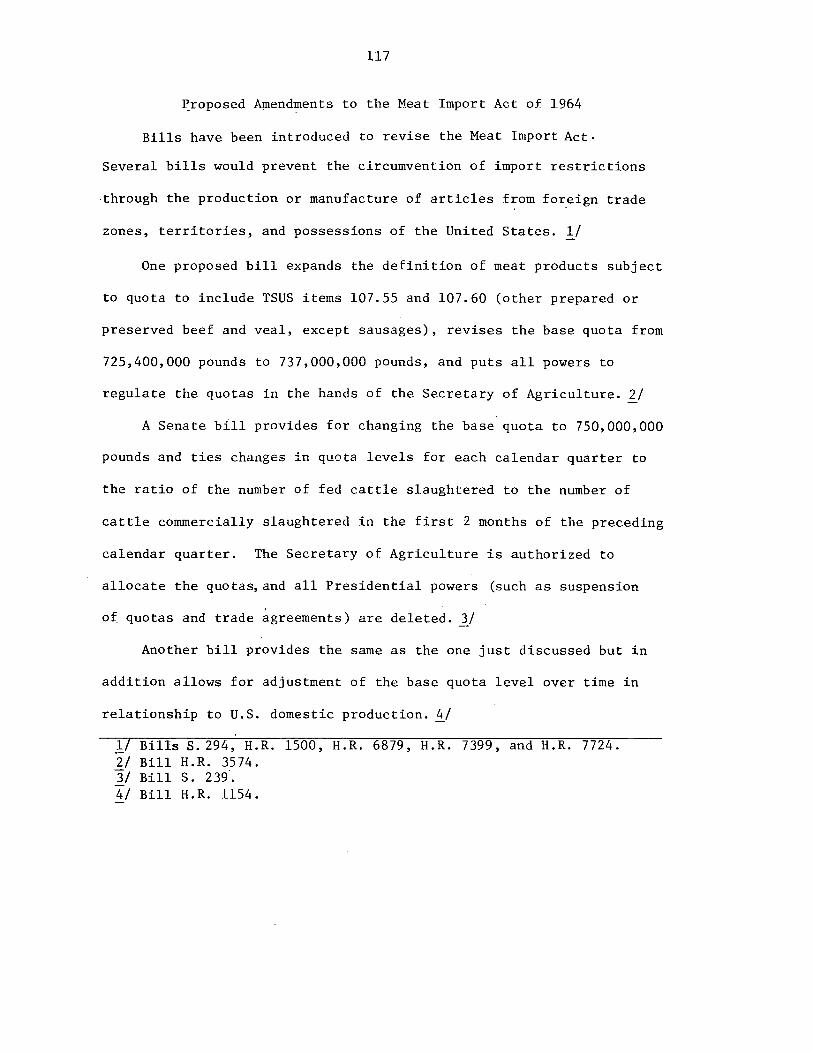
Legislative proposals before Congress------------------------------- 116 Proposed amendments to the Federal Meat Inspection Act---------- 116 Proposed amendments to the Meat Import Act of 1964-------------- 117
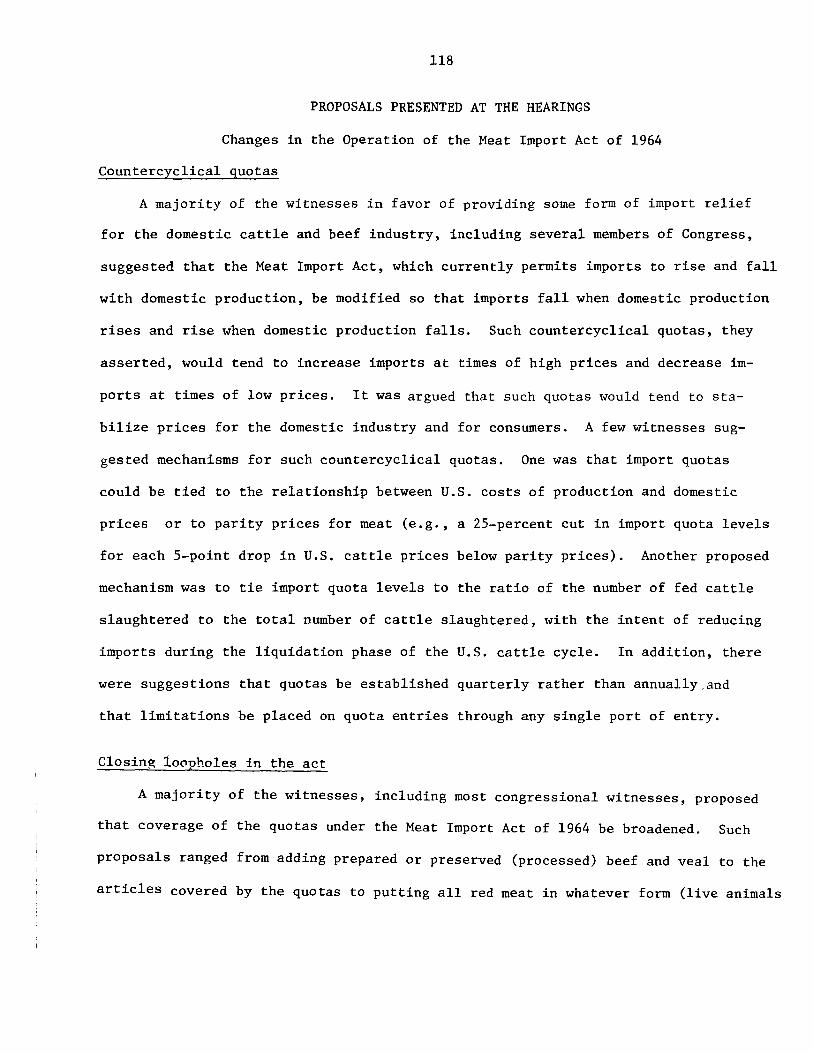
Proposals presented at the hearings: Changes in the operation of the Meat Import Act of 1964:
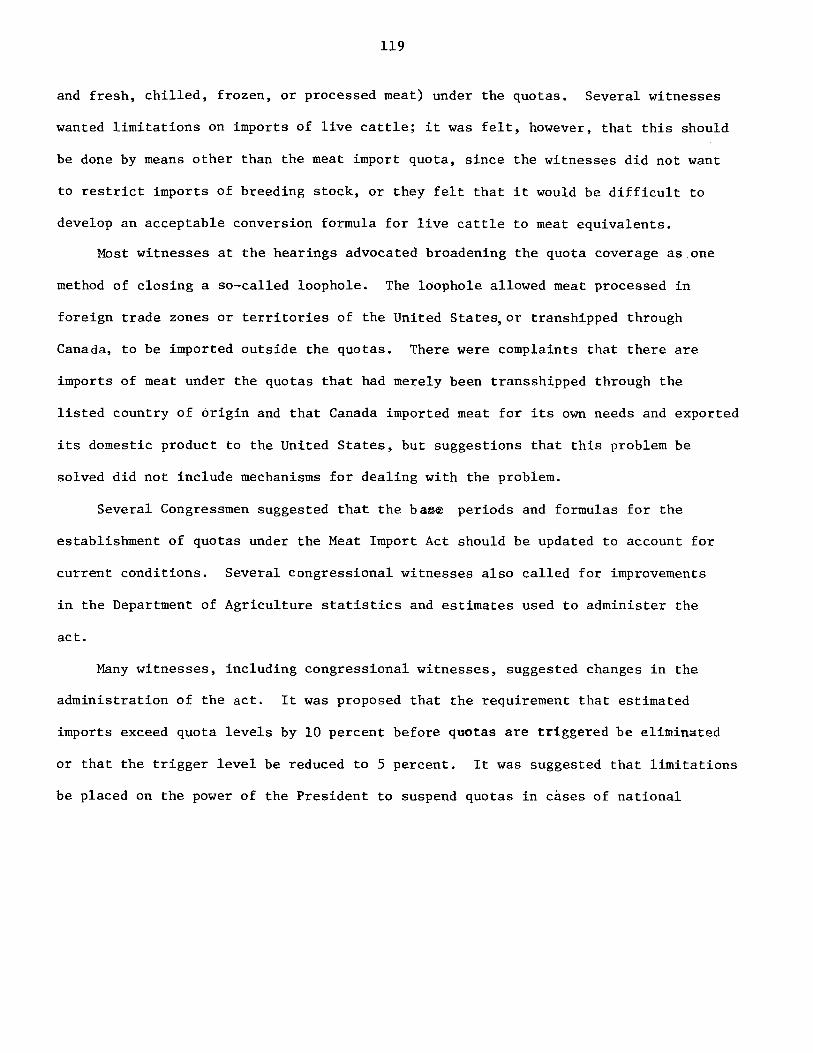
Countercyclical quotas-------------------------------------- 118 Closing loopholes in the act-------------------------------- 118
Changes in the tariff------------------------------------------- 120 Other suggested congressional actions--------------------------- 121 Import interests------------------------------------------------ 122 Major proposals of domestic producers and importers------------- 122
Appendix A. ~lotices of Investigation No. TA-201-25 and hearings, three congressional letters requesting a 332 investigation of U.S. imports of live cattle and beef, and Notice of the Insti-tution of Investigation No. 332-85 and Hearings------------------- A-1
Appendix B. Statistical tables------------------------------------- B-1 Appendix C. The Meat Import Act of 1964, Section 204 of the
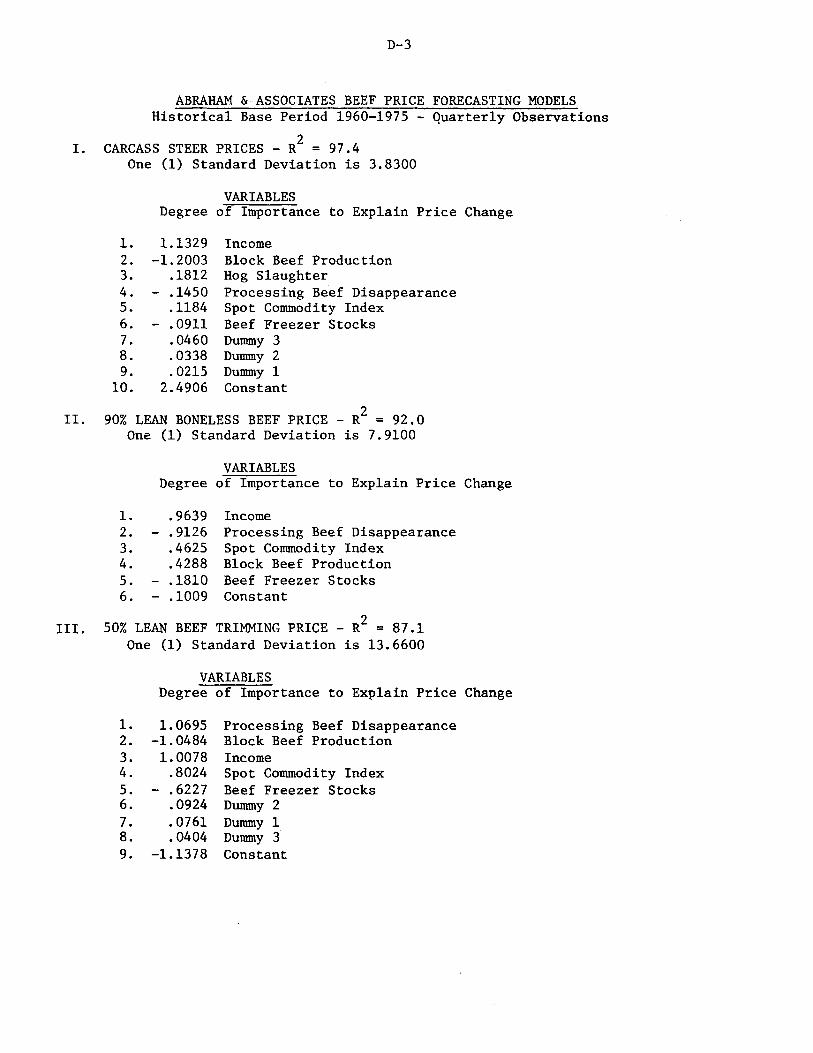
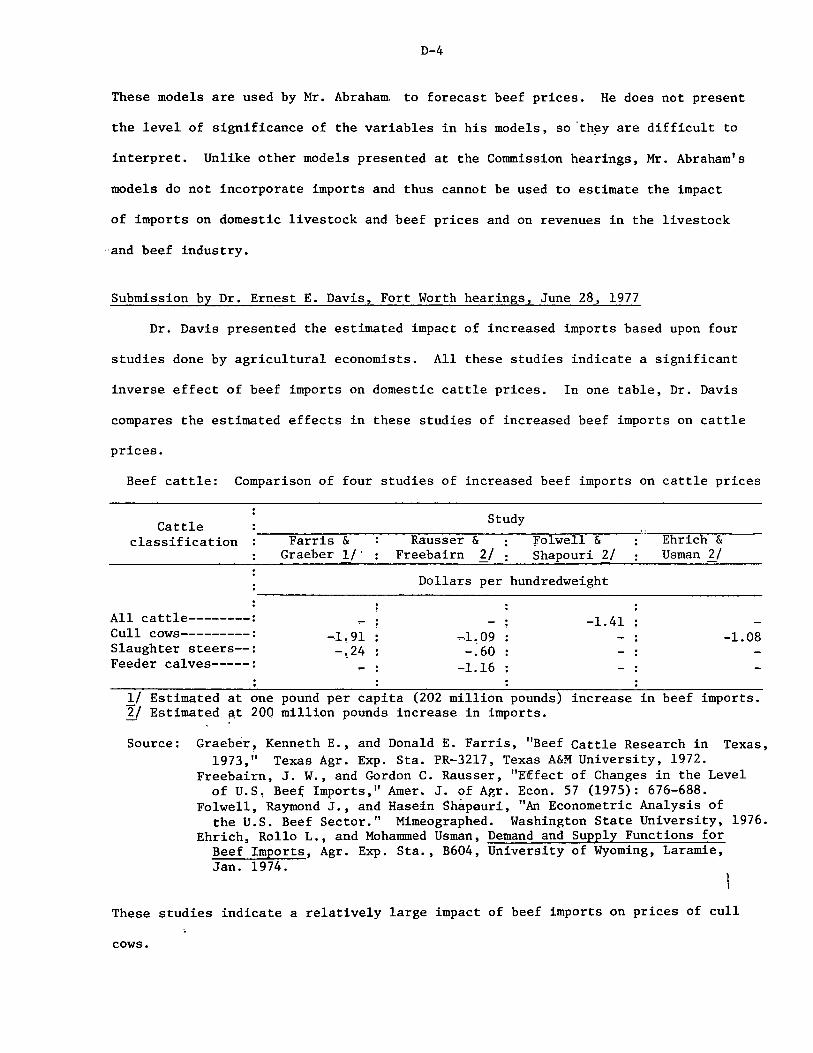
Agricultural Act of 1956, and actions thereunder------------------ C-1 Appendix D. Econometric models presented at Commission hearings---- D-1 Appendix E. The impact of United States beef imports: A
report prepared by Dr. Andrew Schmitz and Mr. Ray Nelson for the U.S. International Trade Commission----------------------- E-1
iv
Figures
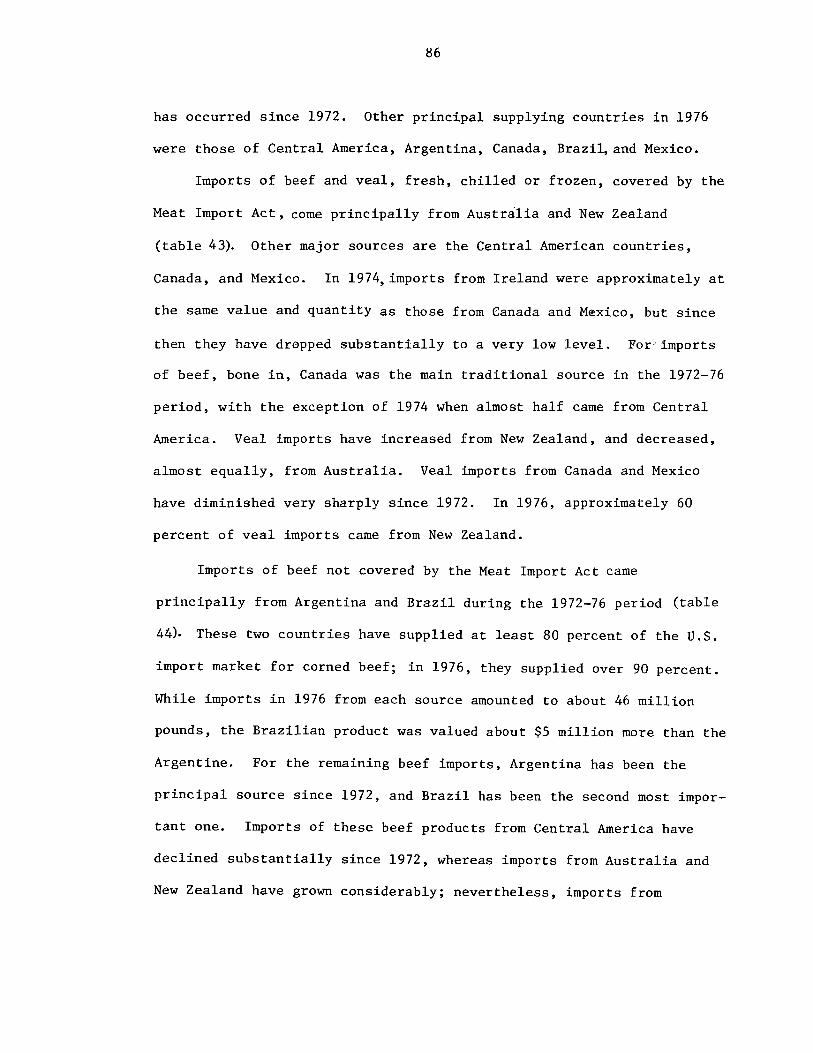
1. Distribution of cow-calf operations in the United States, January 1, 1977--------------------------------------------- 17
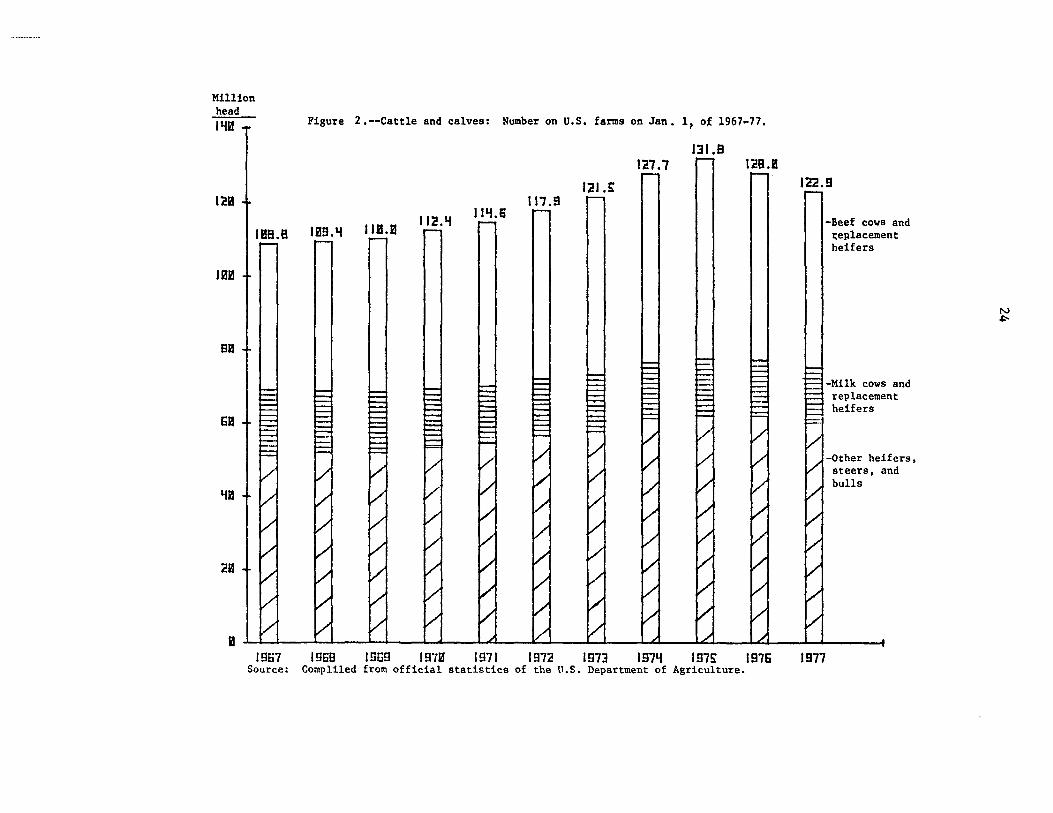
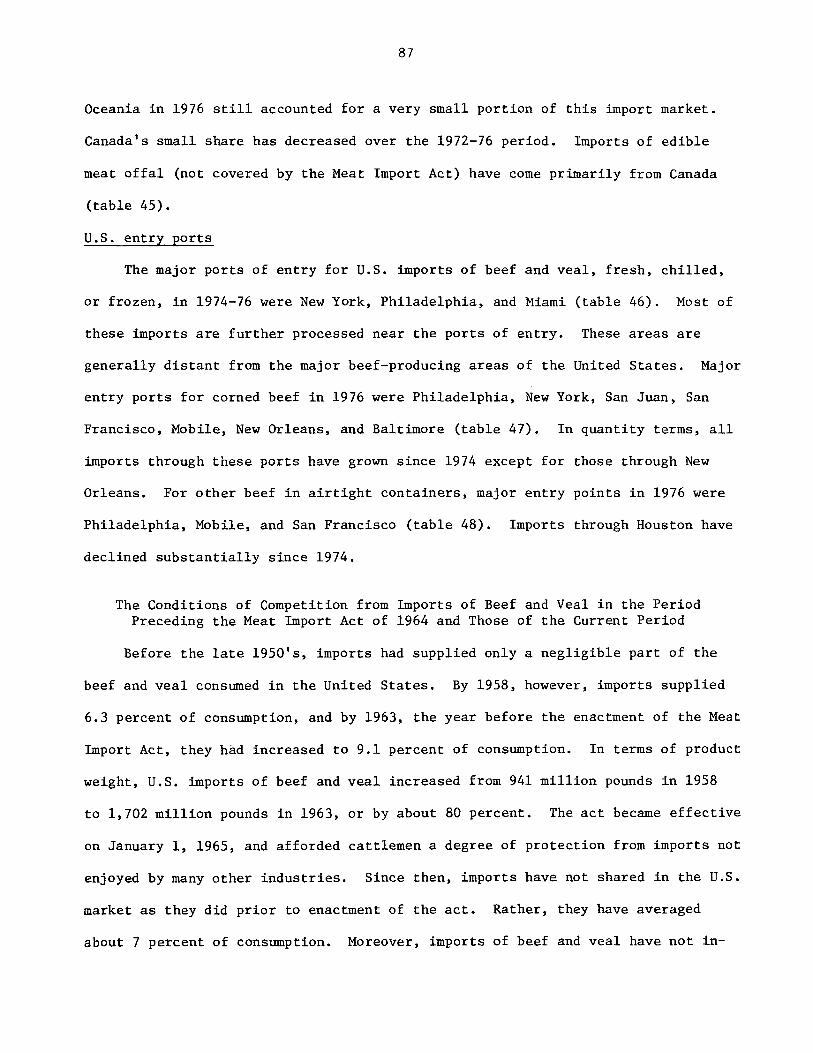
2. Cattle and calves: Number on U.S. farms on January 1, of 1967-77-------------------------------------------------- 24
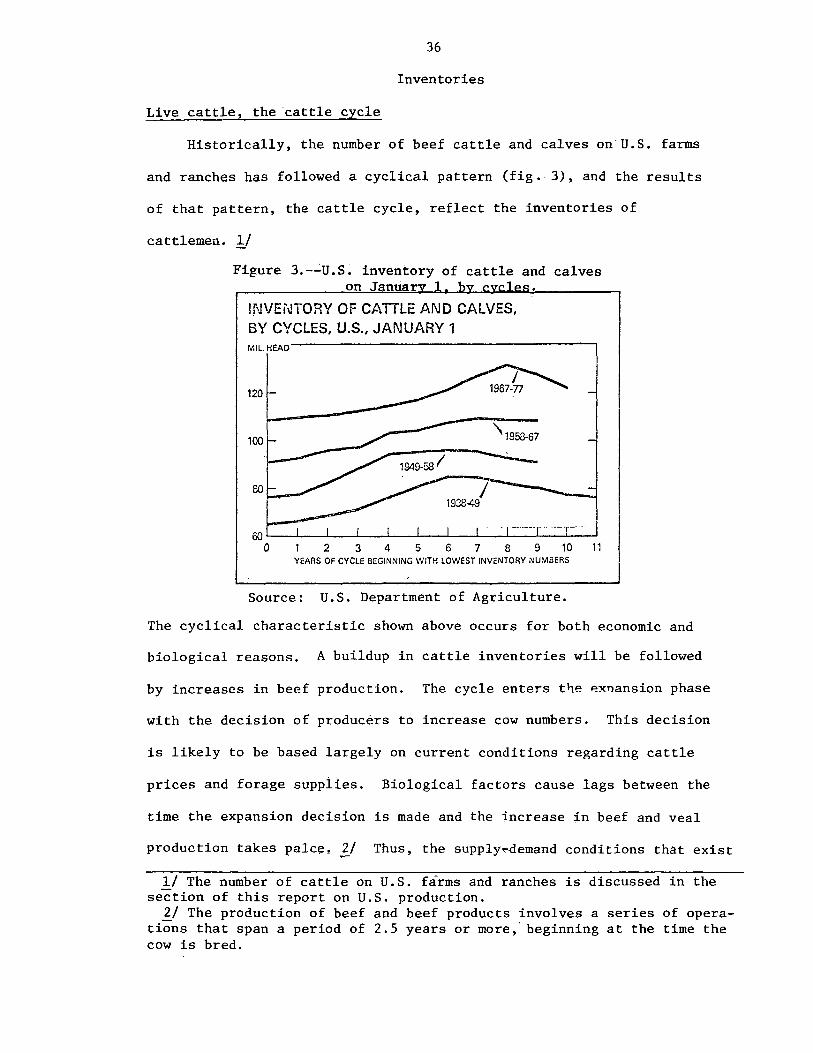
3. U.S. inventory of cattle and calves on January 1, by cycles--------------------------------------------------- 36
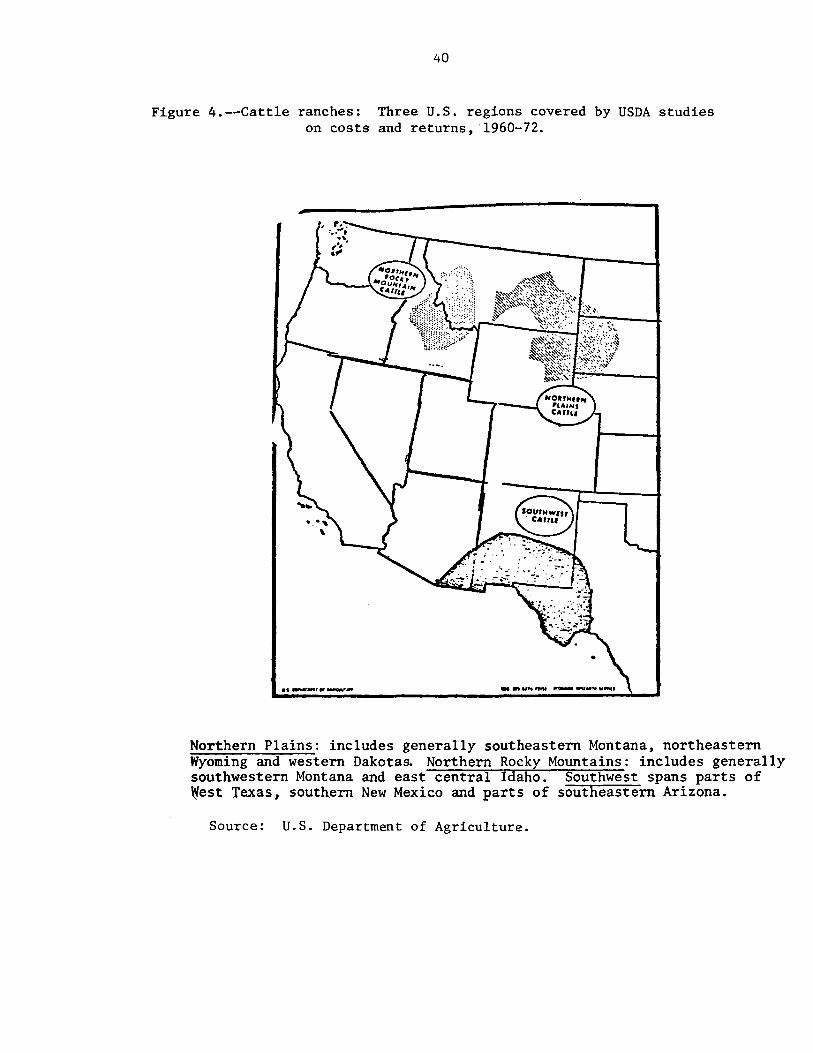
4. Cattle ranches: Three U.S. regions covered by USDA studies on costs and returns, 1960-72----------------------- 40
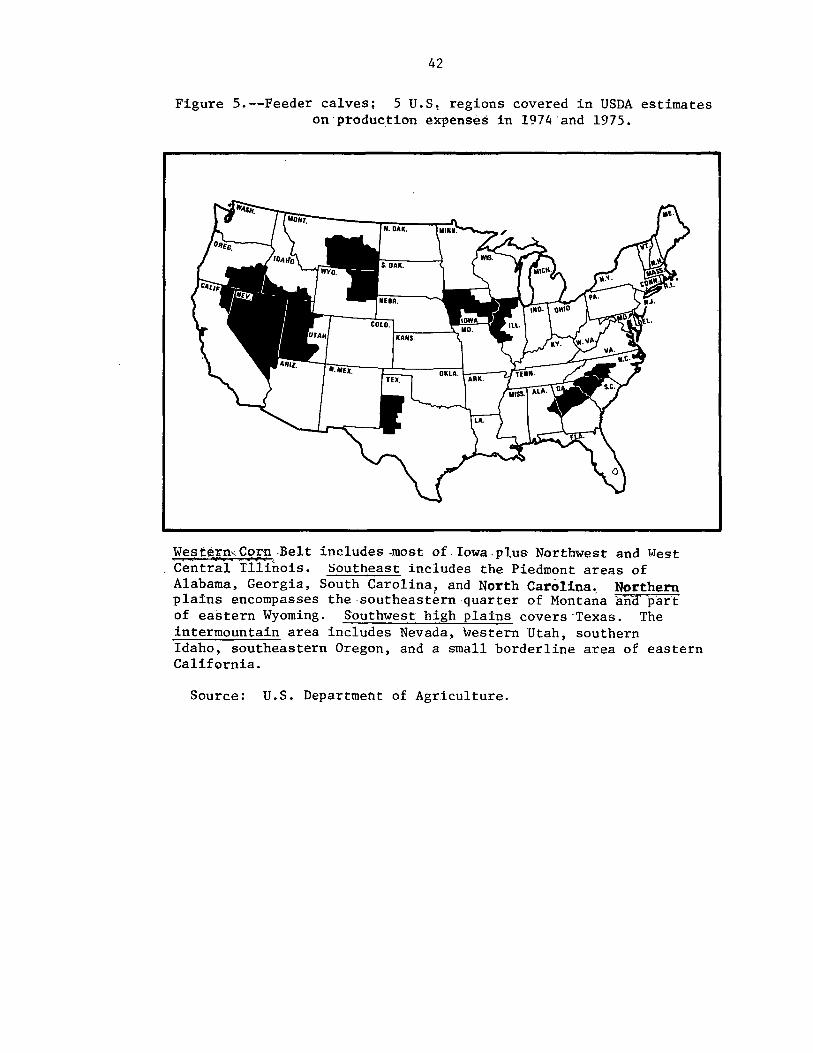
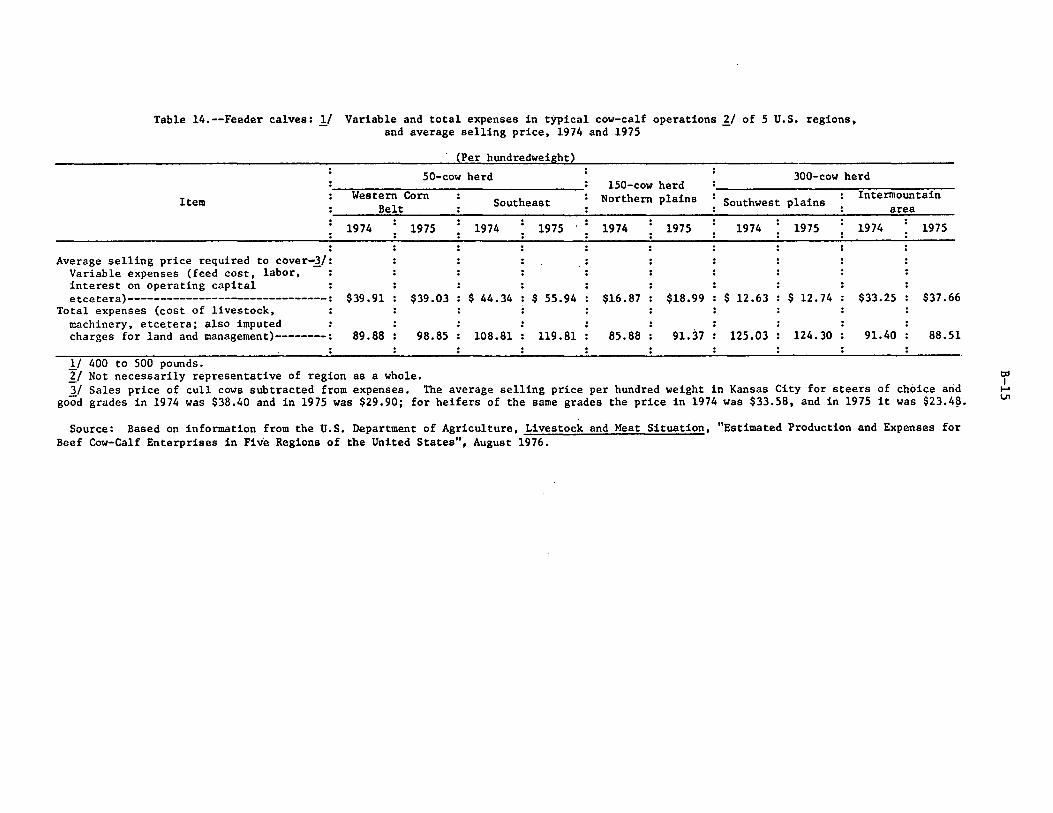
5. Feeder calves: 5 U.S. regions covered in USDA estimates on production expenses in 1974 and 1975---------------------- 42
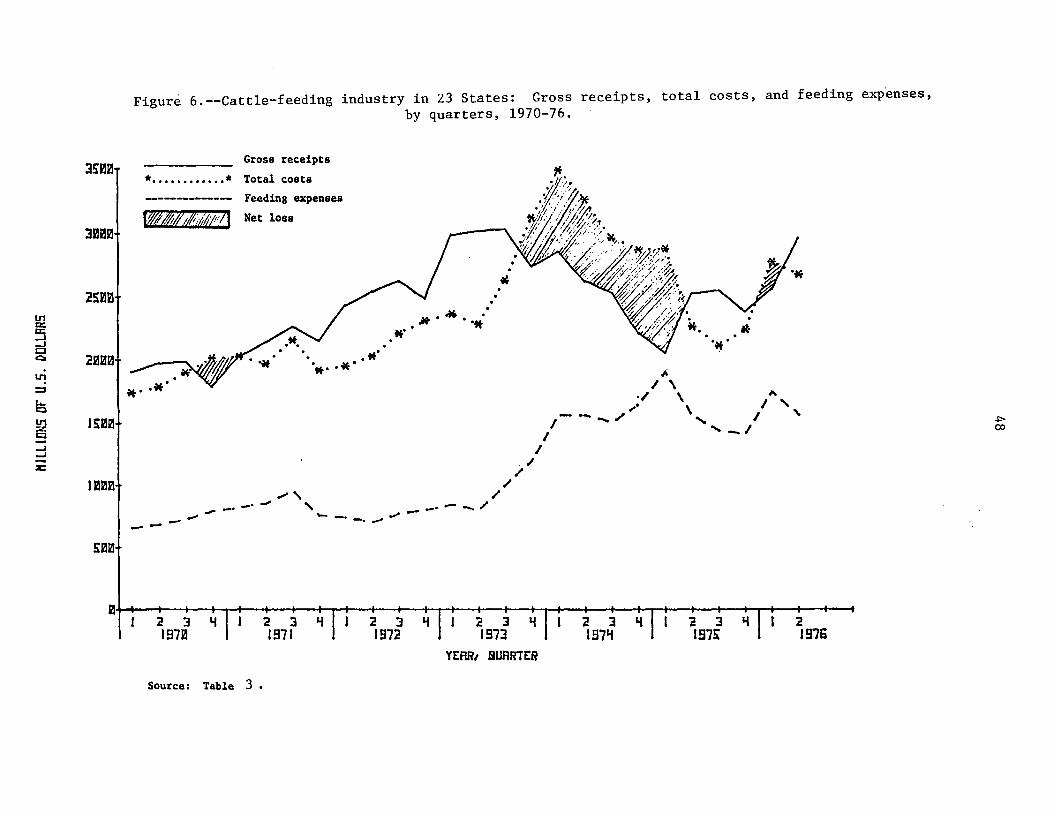
6. Cattle-feeding industry in 23 States: Gross receipts, total costs, and feeding expenses, by quarters, 1970-76------------ 48
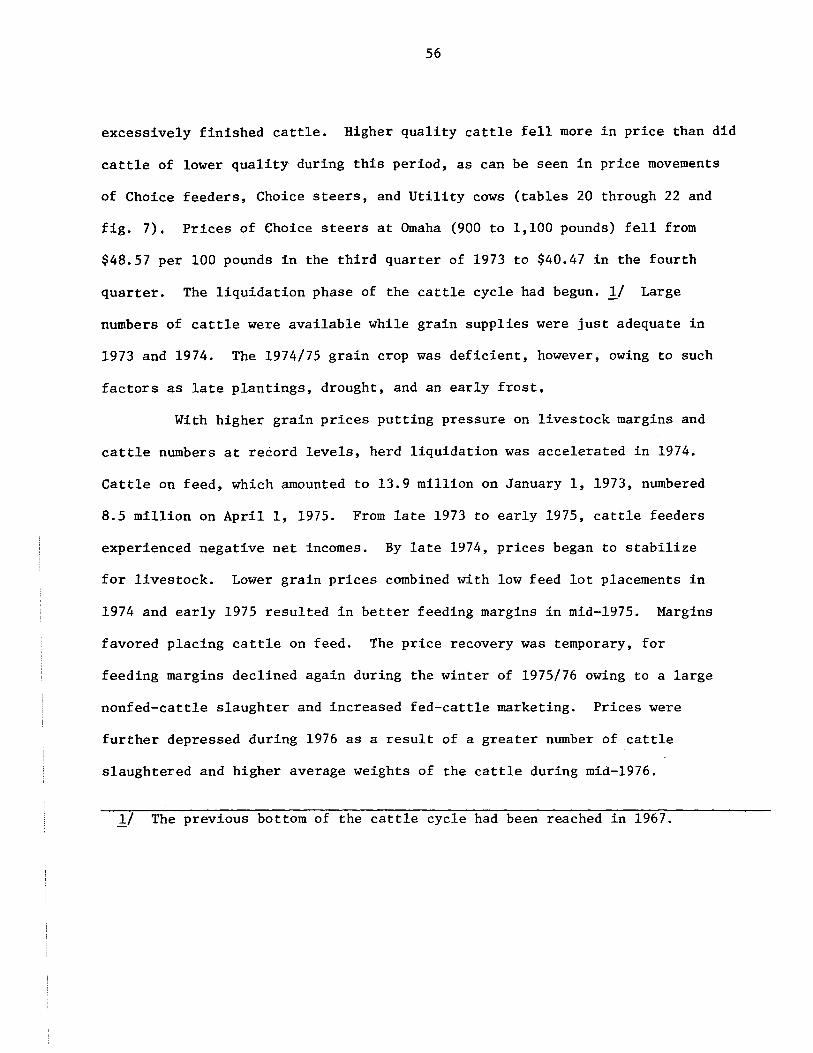
7. Live cattle: Prices paid at specified markets, by quarters, January 1967-June 1977--------------------------------------- 57
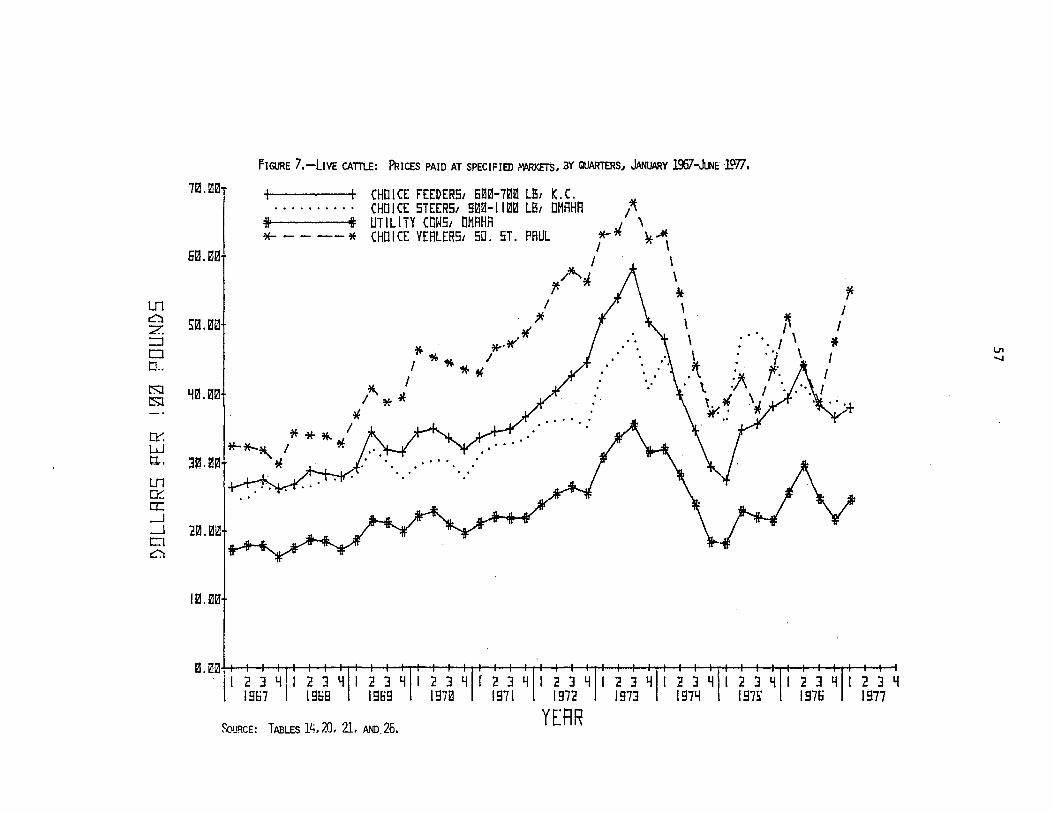
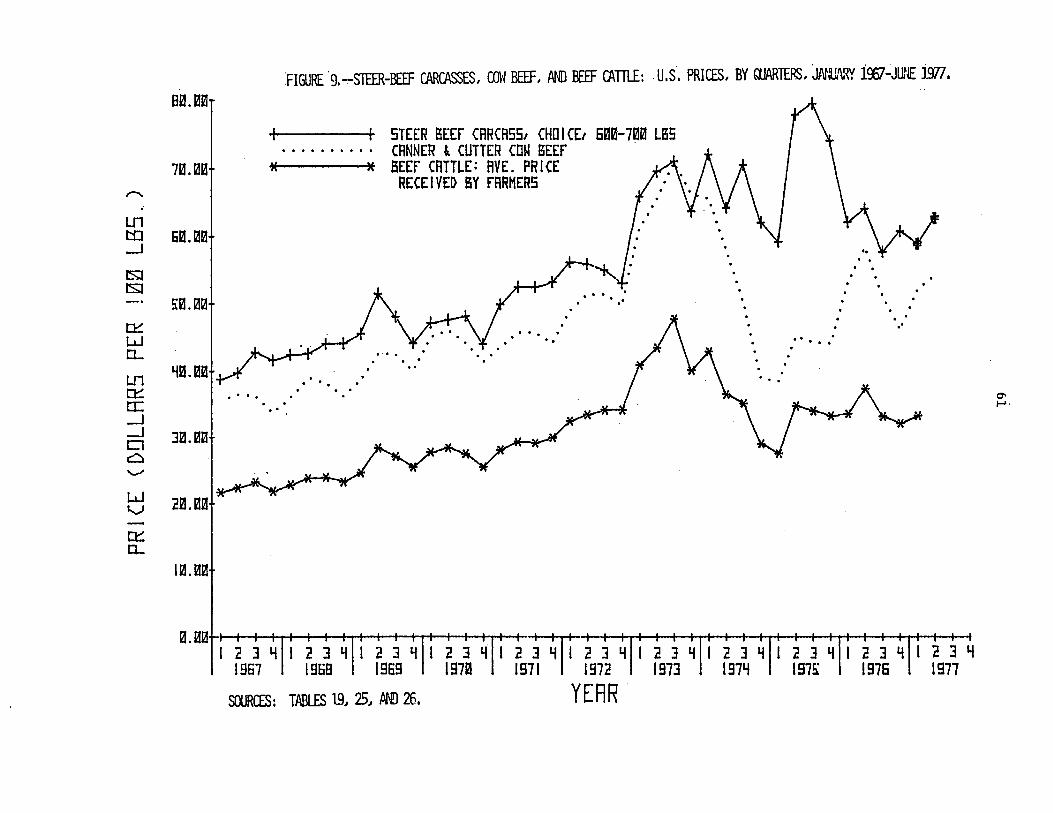
8. Choice grade beef, and hamburger: Average U.S. retail prices, by quarters, January 1967-June 1977------------------ 59
9. Steer-beef carcasses, cow beef, and beef cattle: U.S. prices, by quarters, January 1967-June 1977------------------ 61
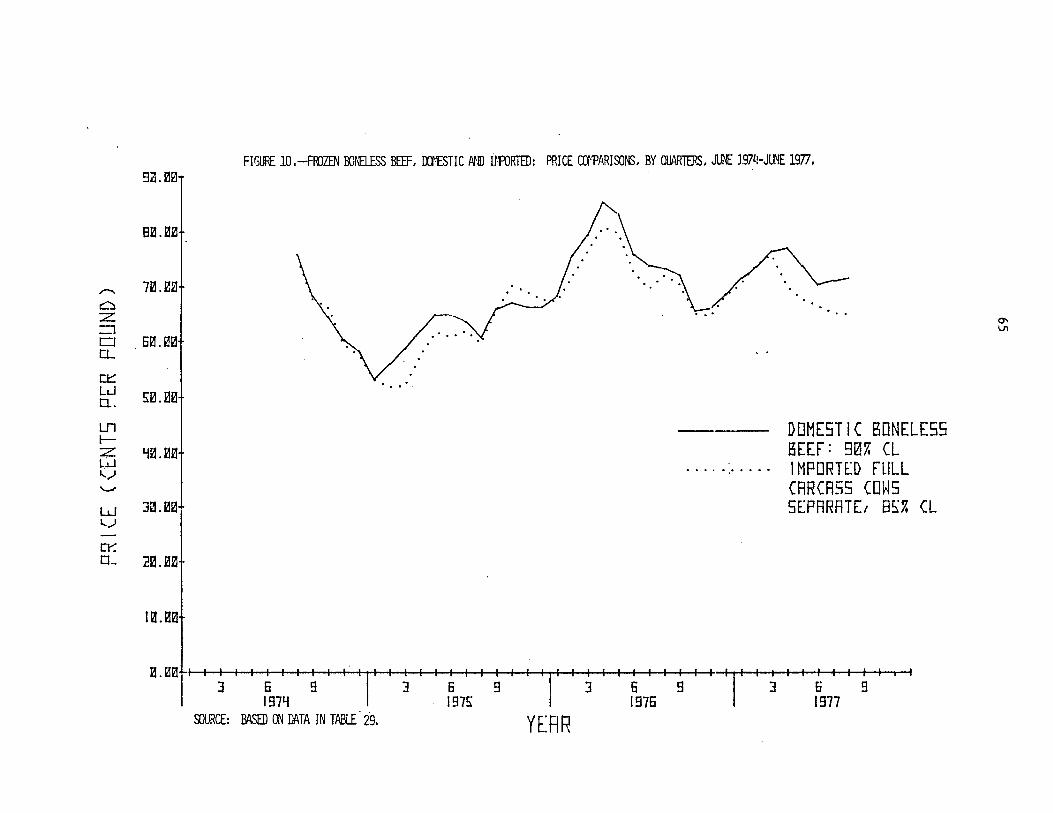
10. Frozen boneless beef, domestic and imported: Price comparisons, by quarters, June 1974-June 1977---------------- 65
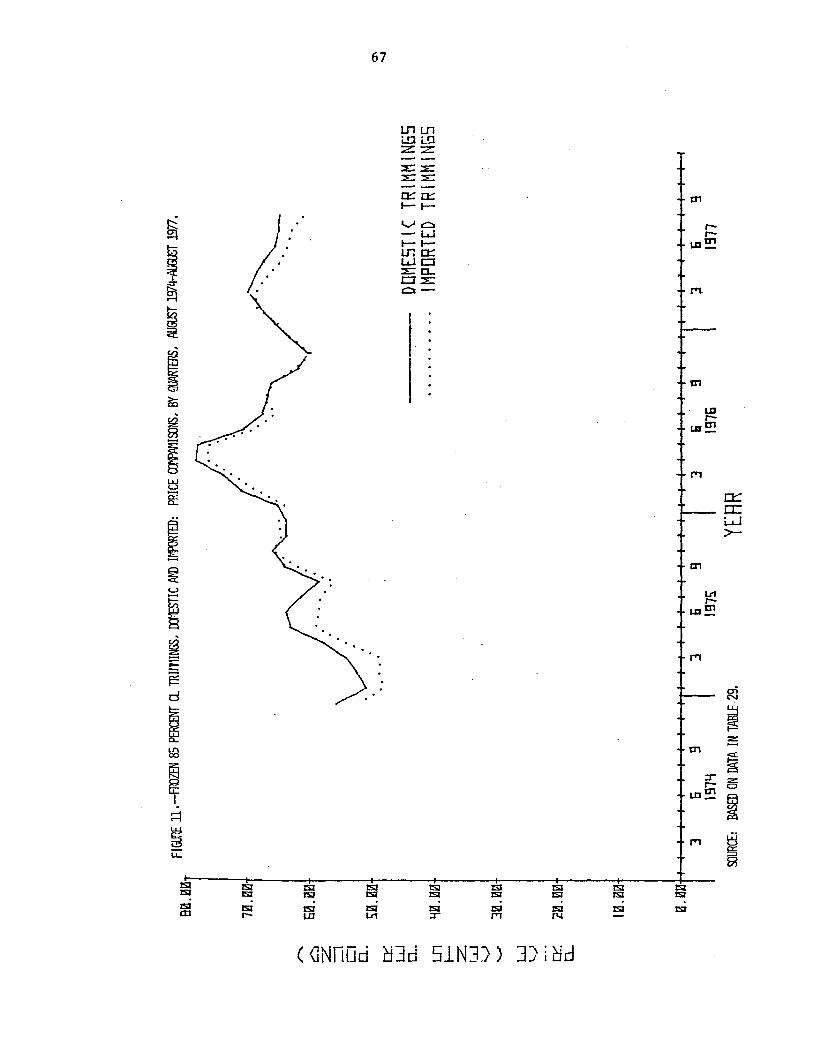
11. Frozen 85 percent CL trimmings, domestic and imported: Price comparisons, by quarters, August 1974-August 1977------ 67
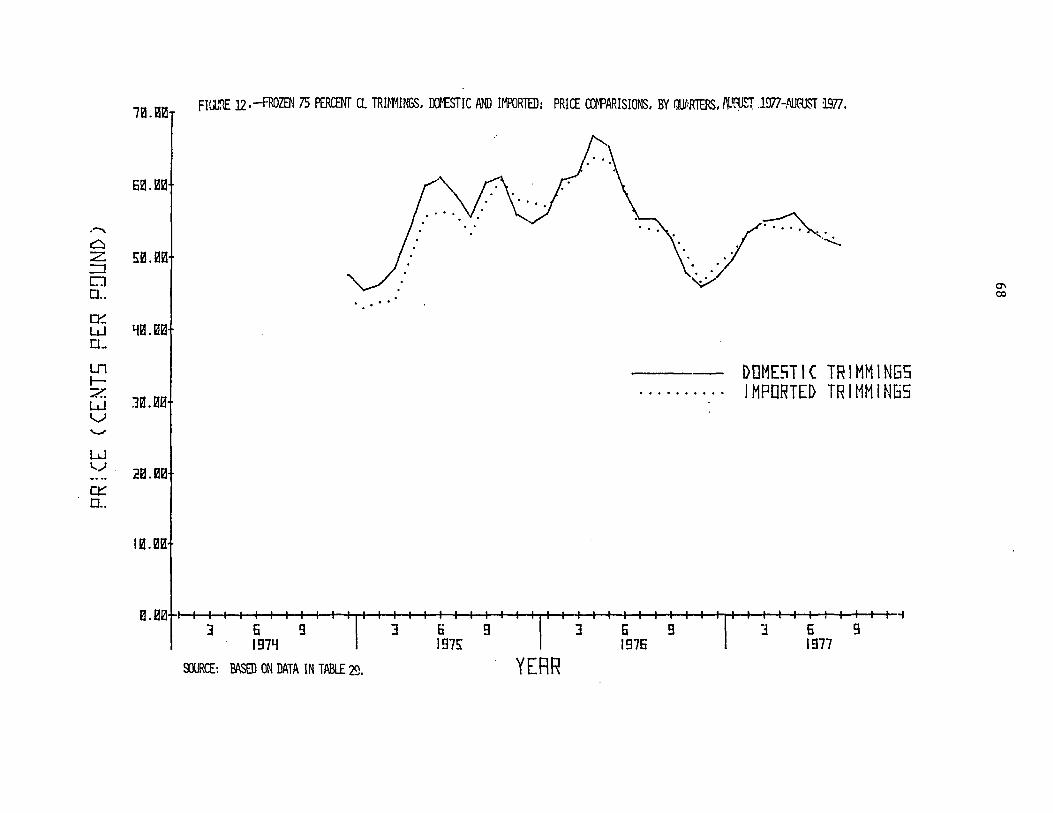
12. Frozen 85 percent CL trimmings, domestic and imported: Price comparisons, by quarters, August 1967-August 1977------ 68
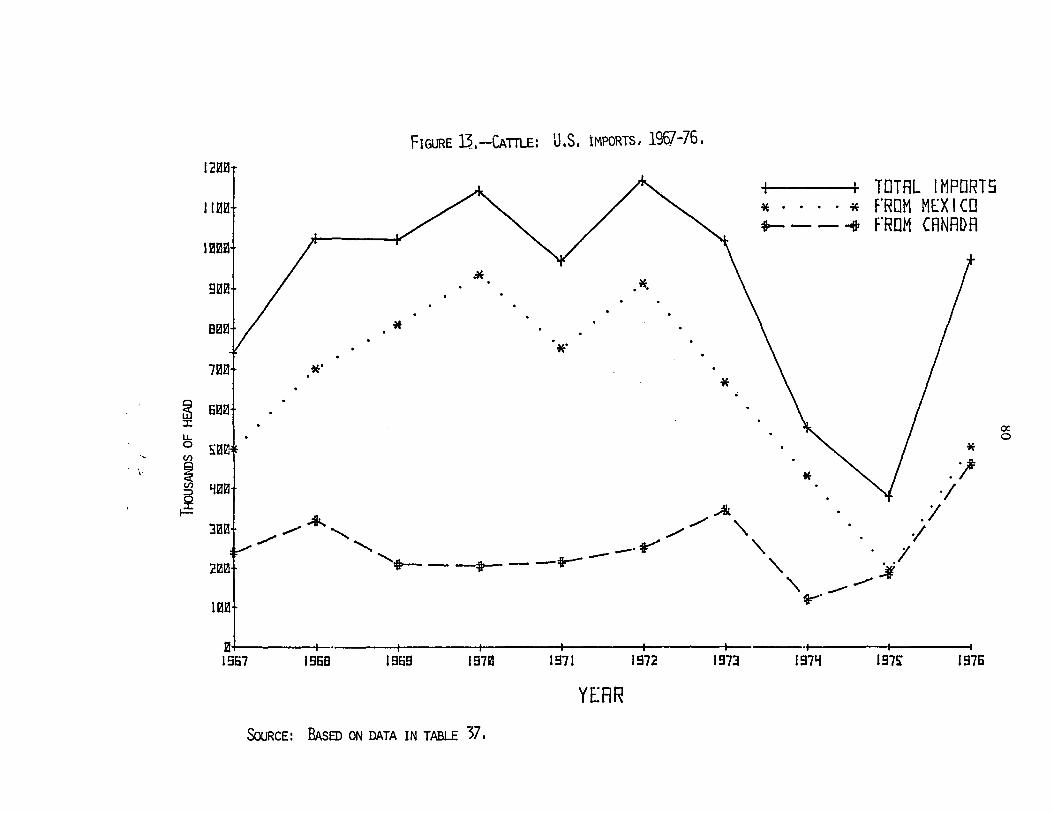
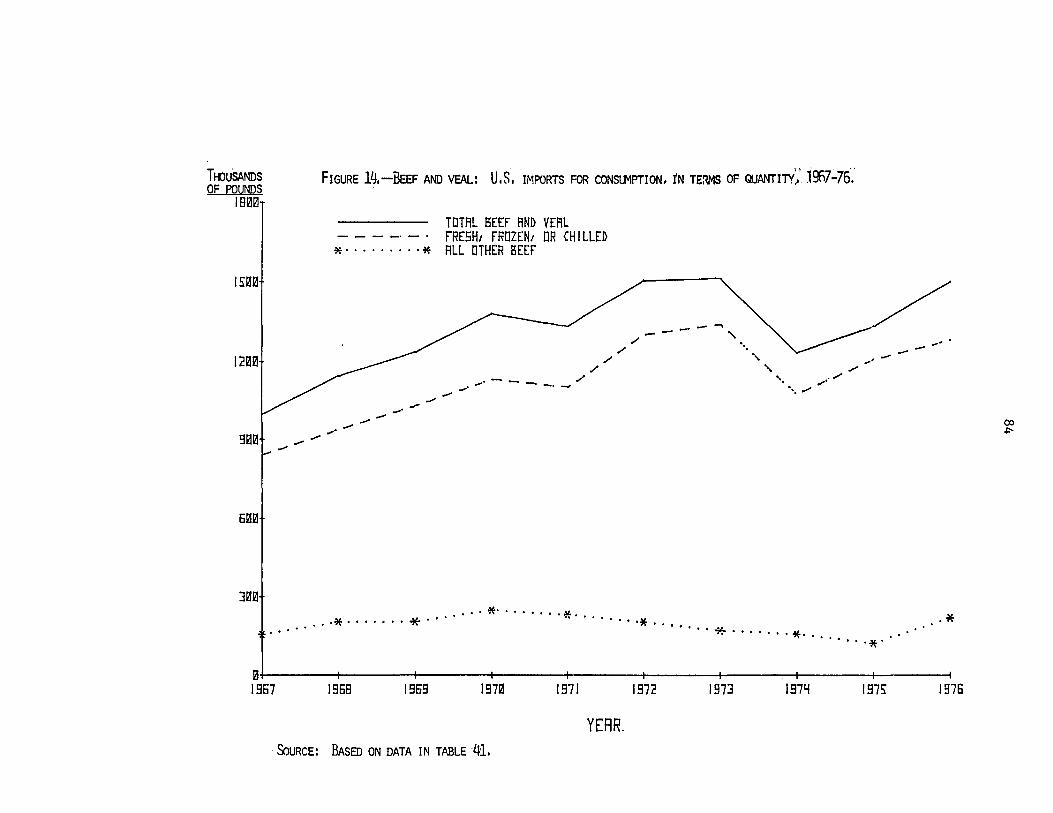
13. Cattle: U.S. imports, 1967-76--------------------------------- 80 14. Beef and veal: U.S. imports for consumption, in terms of
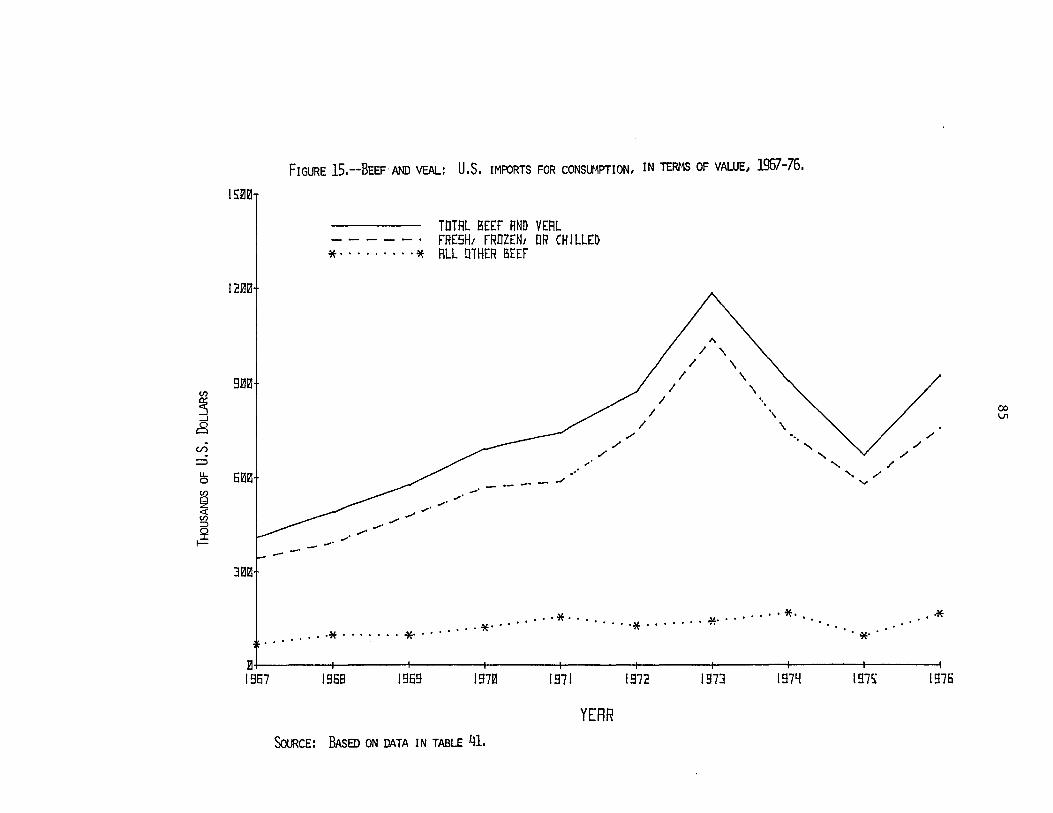
quantity, 1967-76-------------------------------------------- 84 15. Beef and veal: U.S. imports for consumption, in terms of
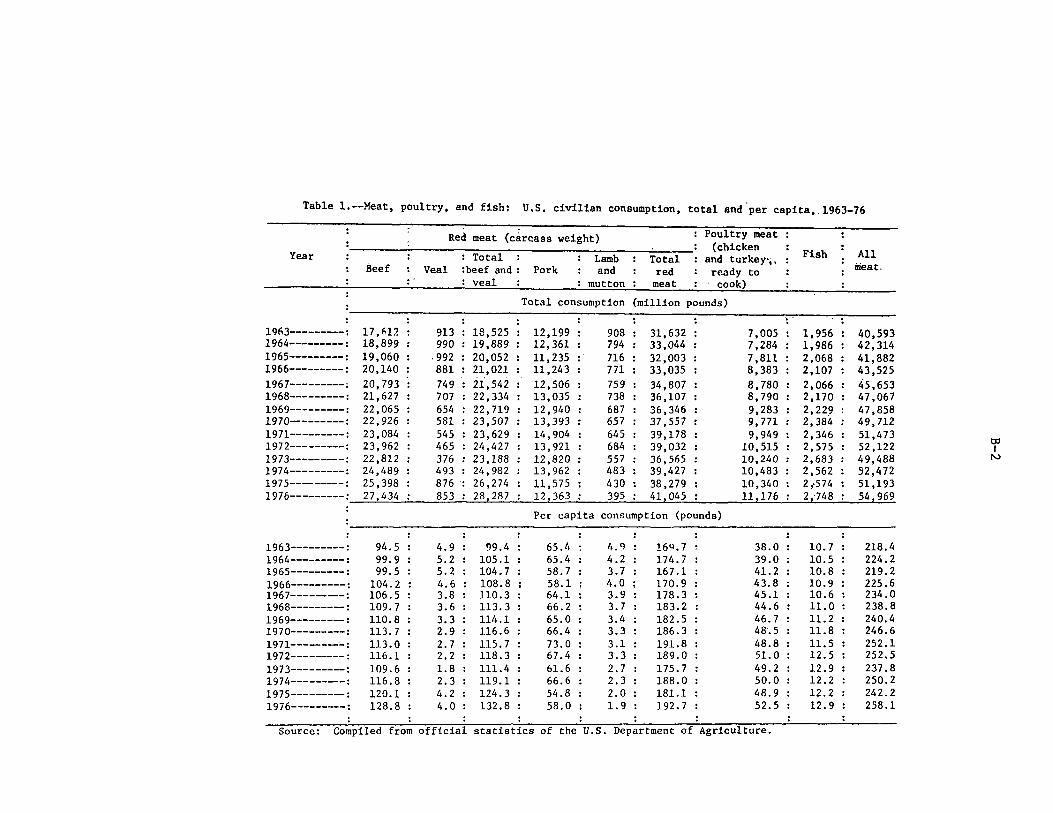
1. Meat, poultry, and fish: U.S. civilian consumption, total and per capita, 1963-76------------------------------------ B-2
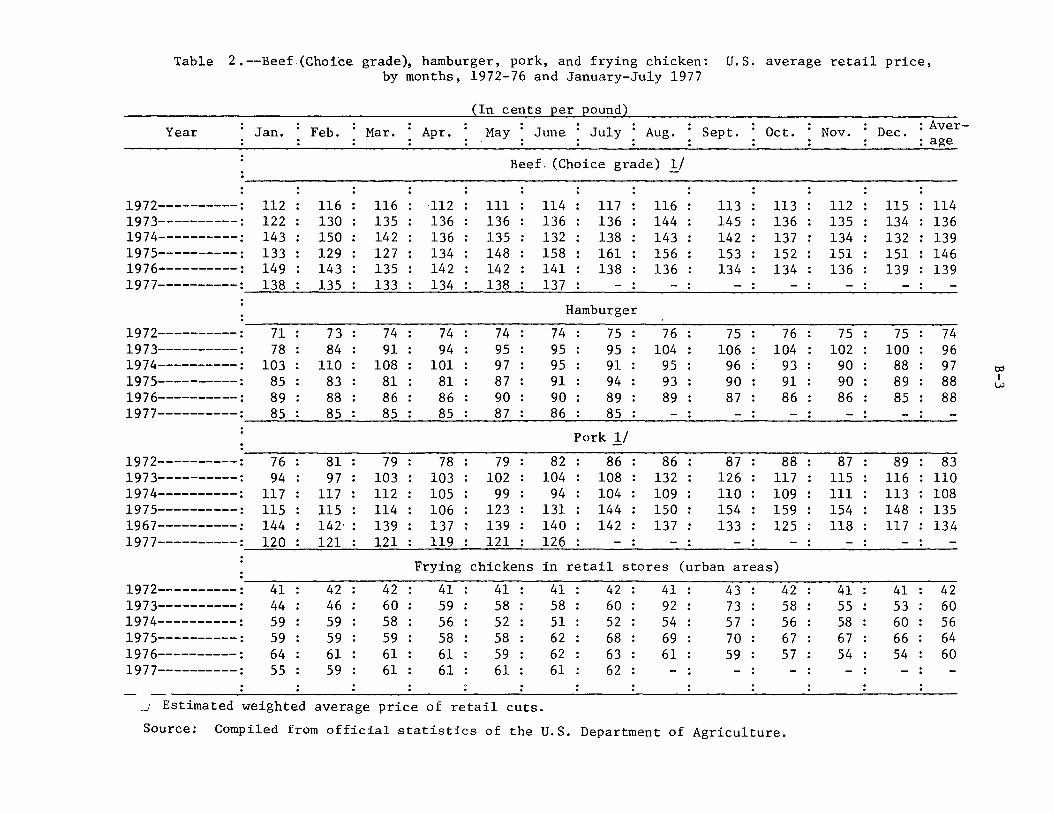
2. Beef (Choice grade), hamburger, pork, and frying chicken: U.S. average retail price, by months, 1972-76 and January-July 1977------------------------------------------ B-3
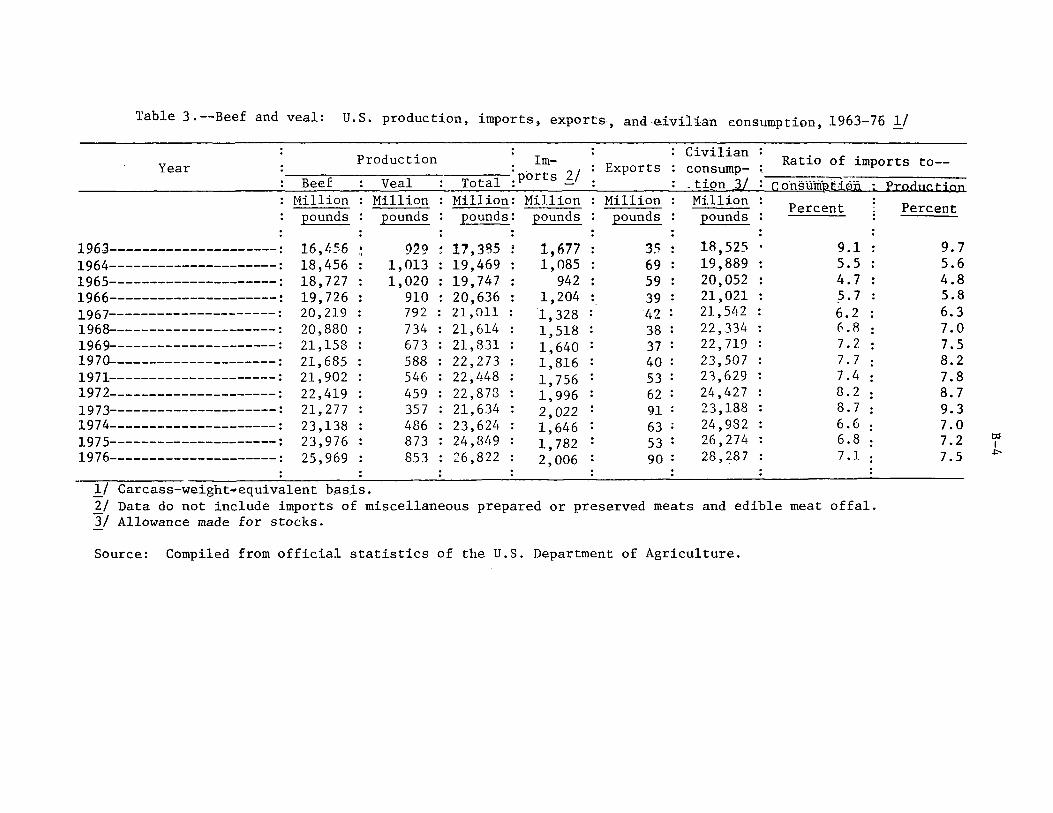
3. Beef and veal: U.S. production, imports, exports, and civilian consumption, 1963-76---------------------------~-- B-4
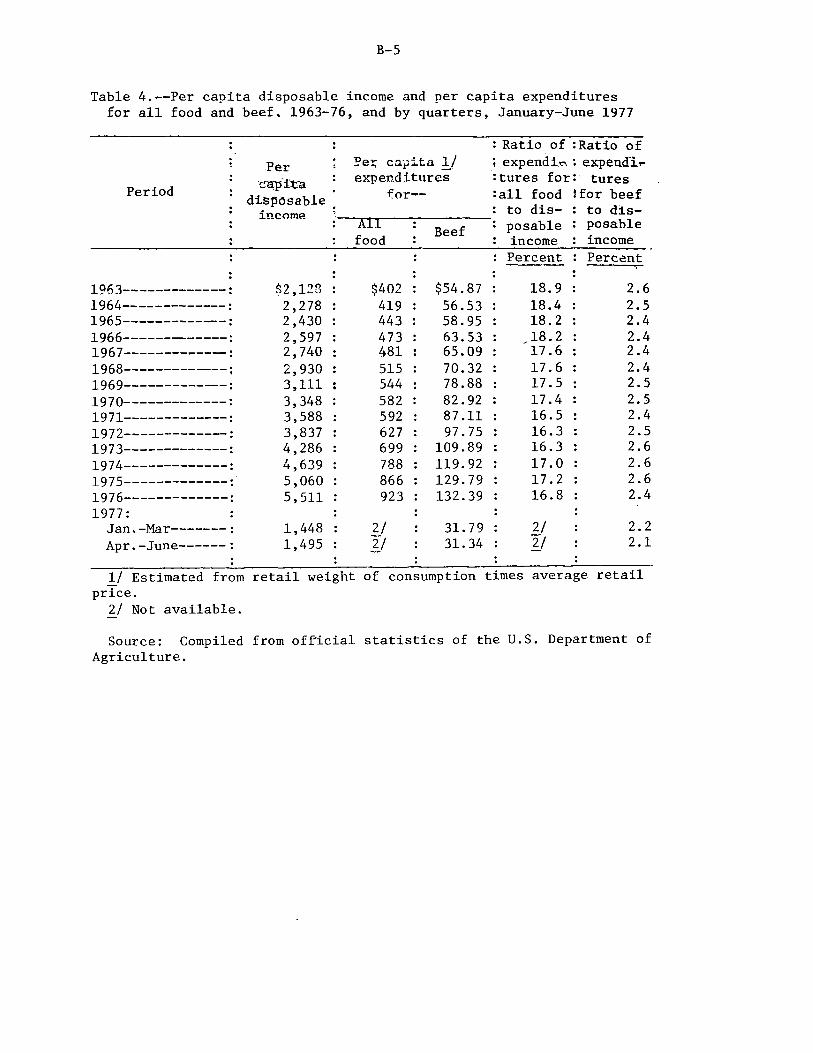
4. Per capita disposable income and per capita expenditures for all food and beef, 1963-76, and by quarters, January-June 1977------------------------------------------ B-5
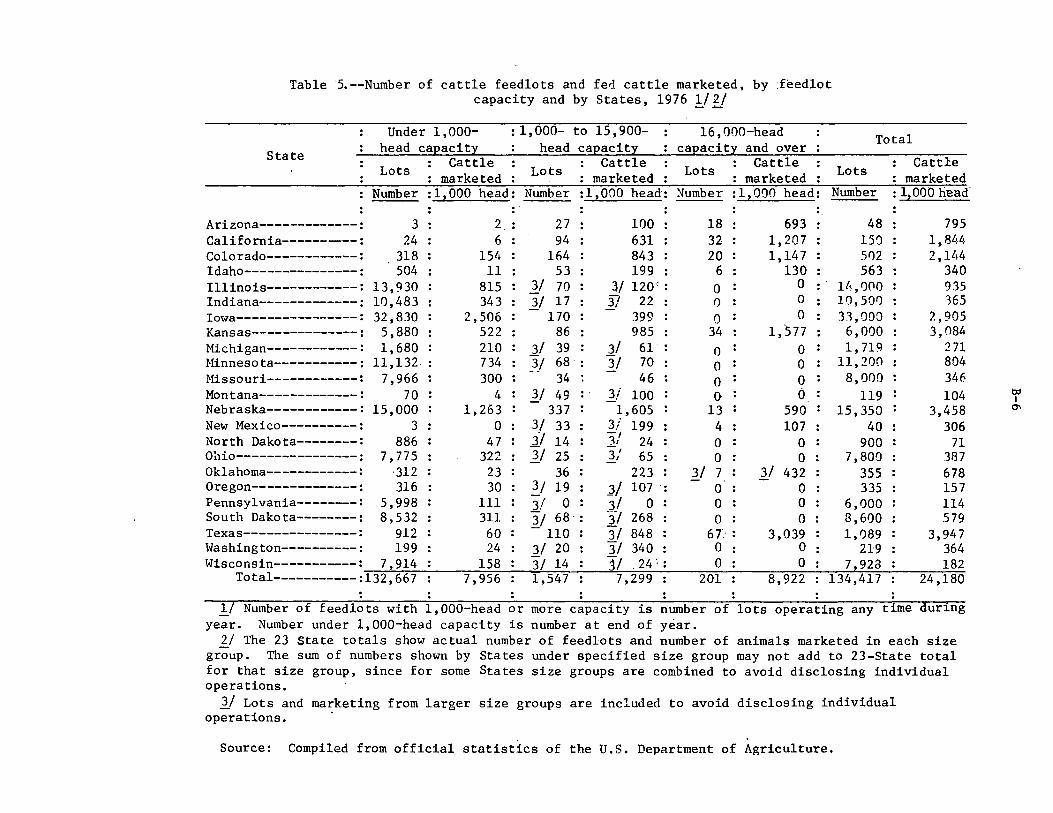
5. Number of cattle feedlots and fed cattle marketed, by feedlot capacity and by States, 1976----------------------- B-6
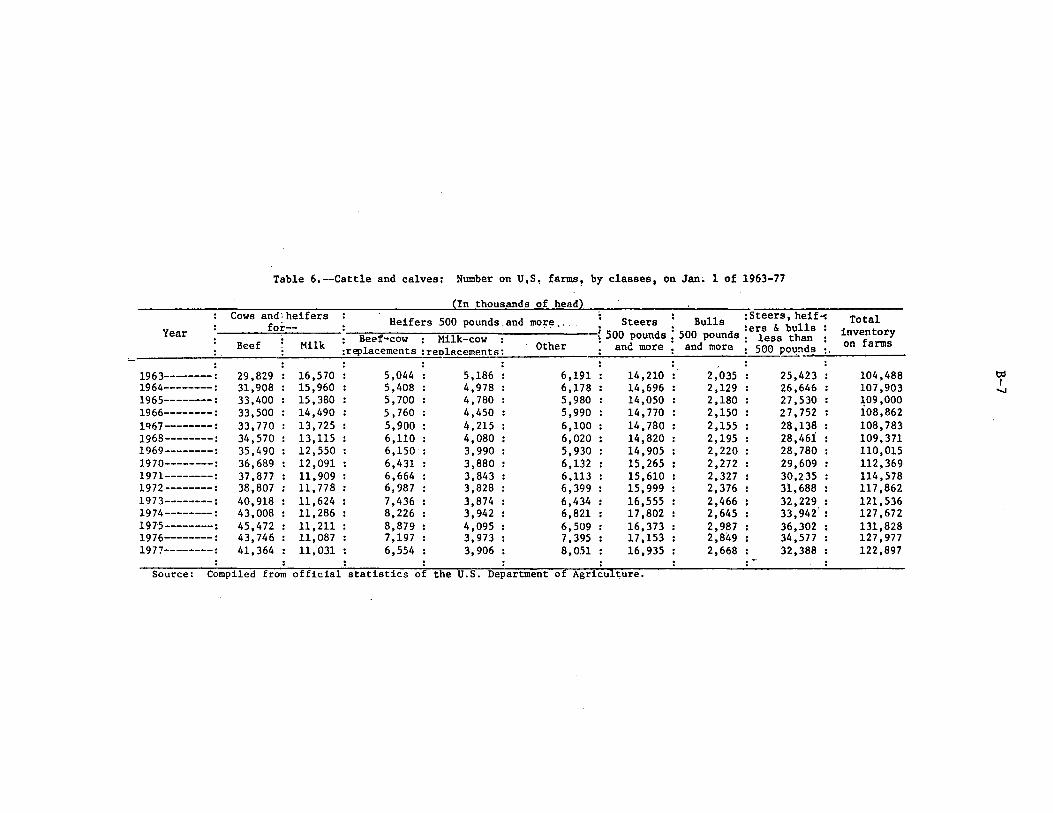
6. Cattle and calves: Number on U.S. farms, by classes, on Jan. 1 of 1963-77------------------------------------------ B-7
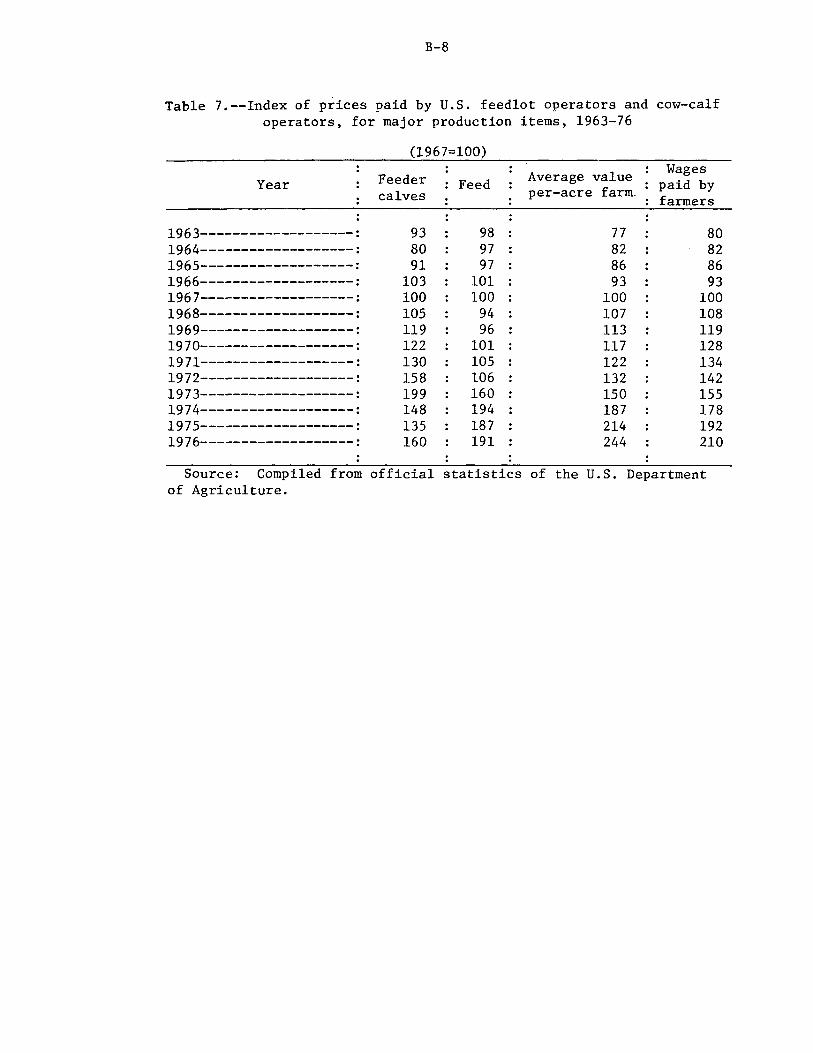
7. Index of prices paid by U.S. feedlot operators and cow-calf operators, for major production items, 1963-76-------- B-8
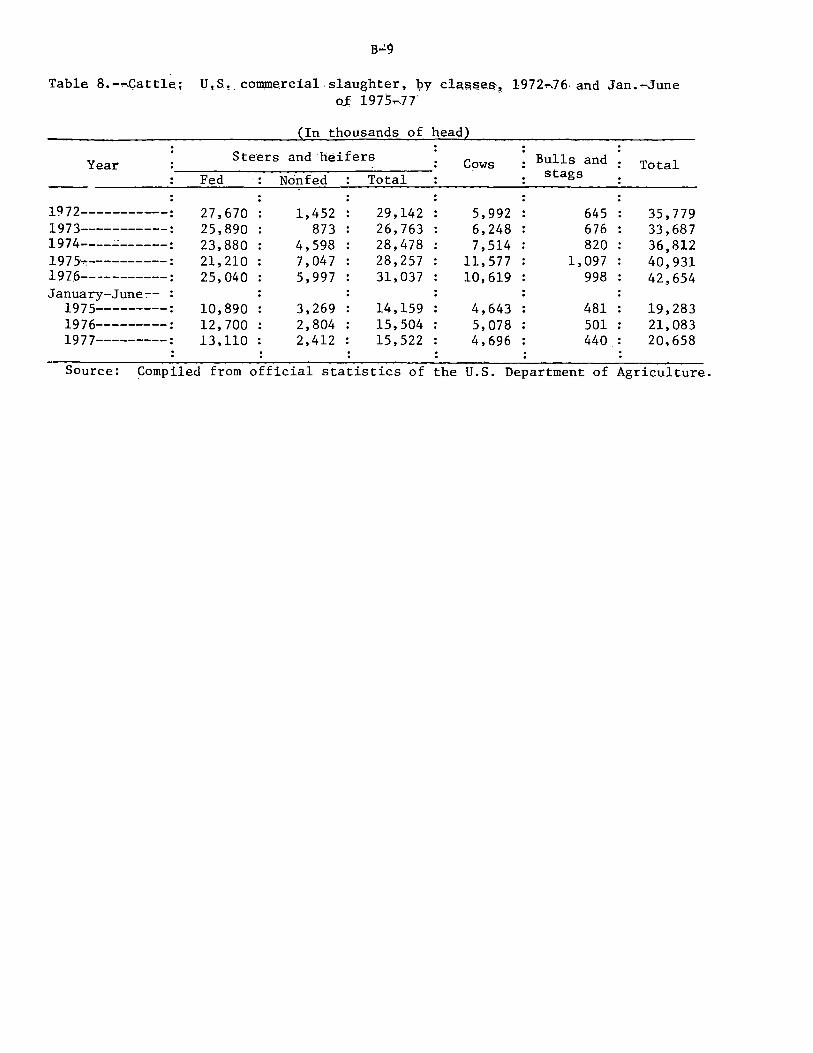
8. Cattle: U.S. commercial slaughter, by classes, 1972-76 and January-June of 1975-77-------------------------------- B-9
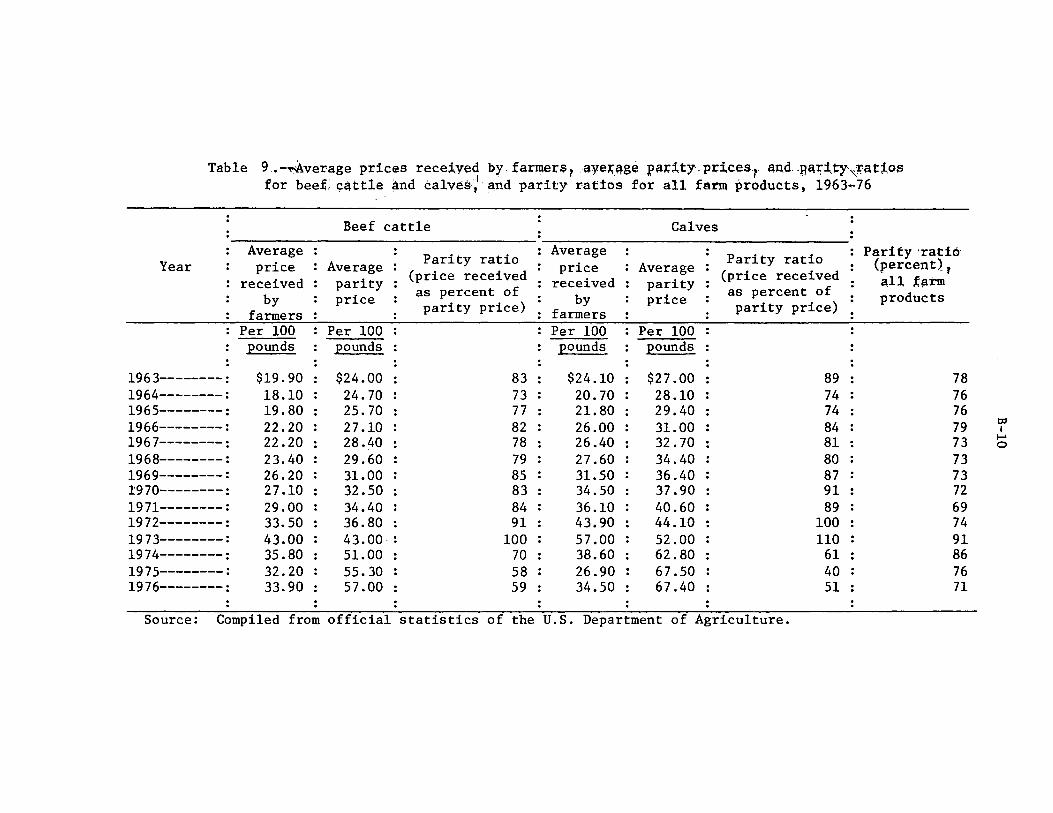
9. Average prices received by farmers, average parity prices, and parity ratios for beef cattle and calves, and parity ratios for all farm products, 1963-76---------------------- B-10
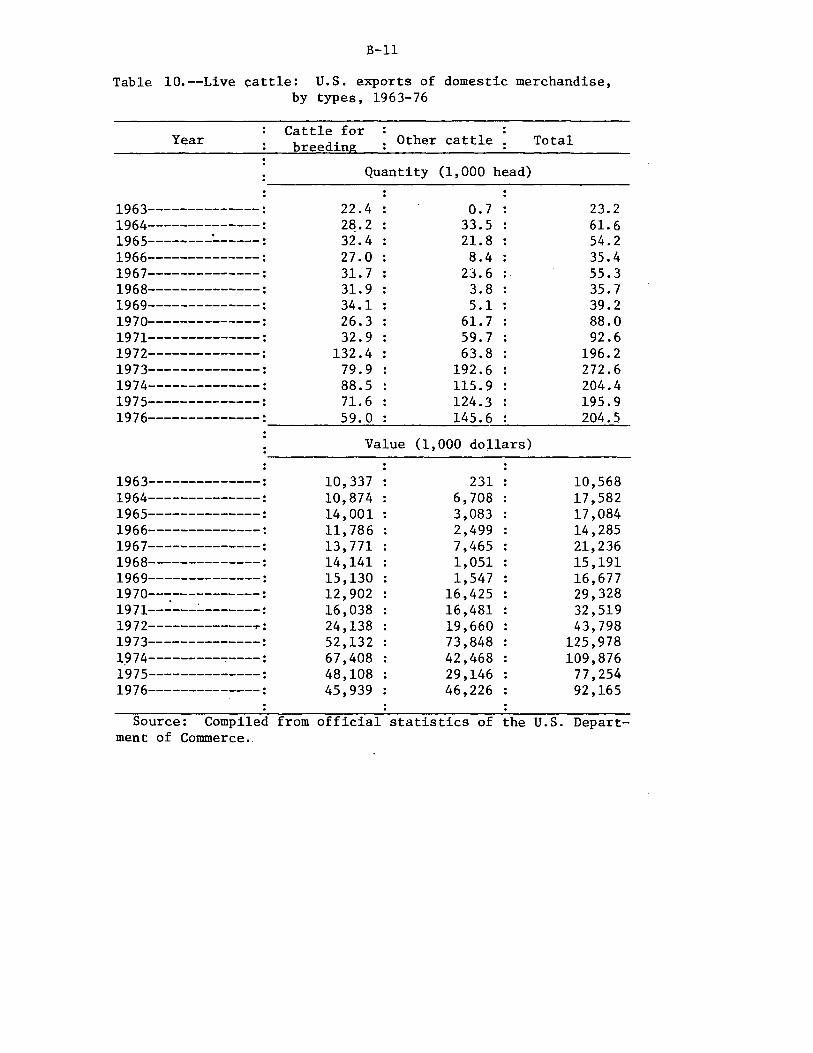
10. Live cattle: U.S. exports of domestic merchandise, by types, 1963-76--------------------------------------------- B-11
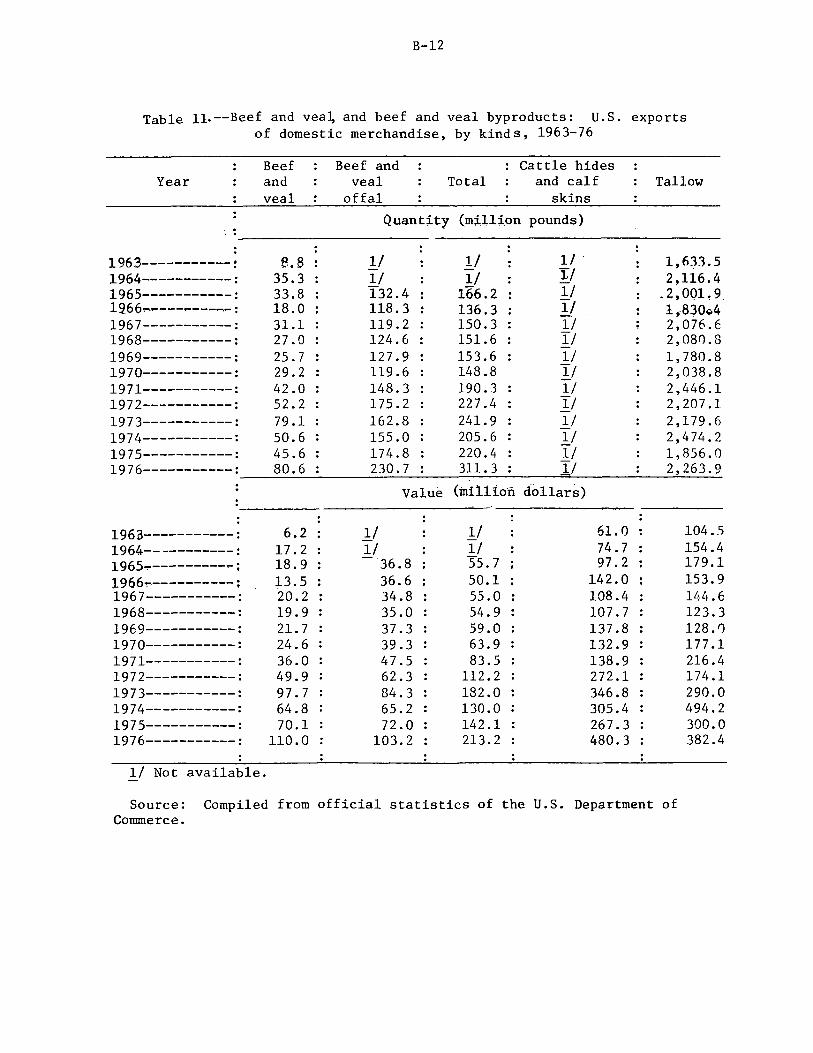
11. Beef and veal, and beef and veal byproducts: U.S. exports of domestic merchandise, by kinds, 1963-76----------------- B-12
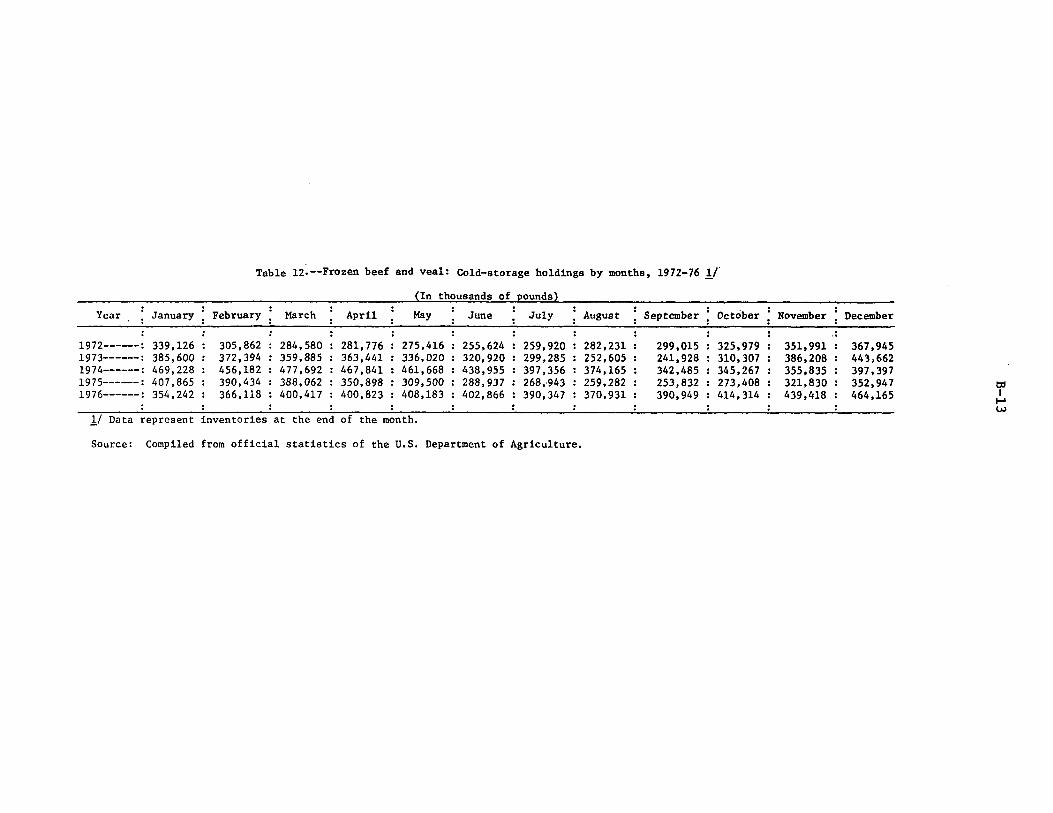
12. Frozen beef and veal: Cold-storage holdings, by months, 1972-76---------------------------------------------------- B-13
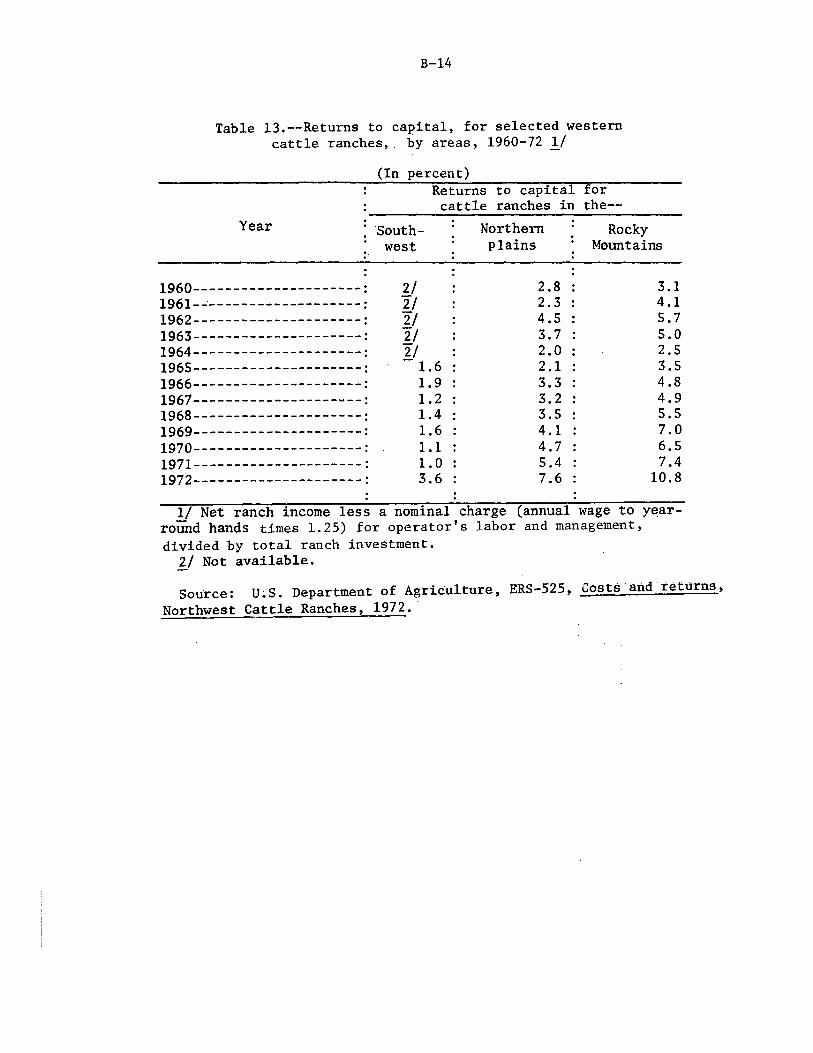
13. Returns to capital, for selected western cattle ranches, by areas, 1960-72------------------------------------------ B-14
14. Feeder calves: Variable and total expenses in typical cow-calf operations of 5 U.S. regions, and average selling price, 1974 and 1975--------------------------------------- B-15
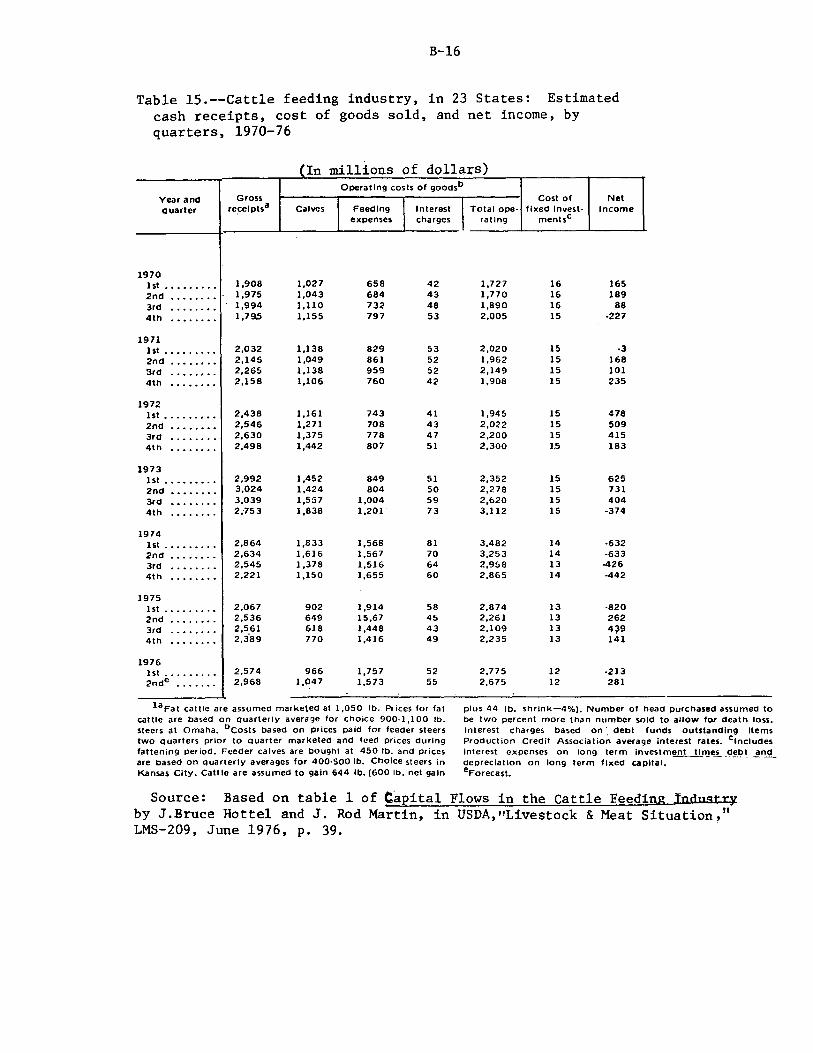
15. Cattle feeding industry, in 23 States: Estimated cash receipts, cost of goods sold, and net income, by quarters, 1970-76------------------------------------------ B-16
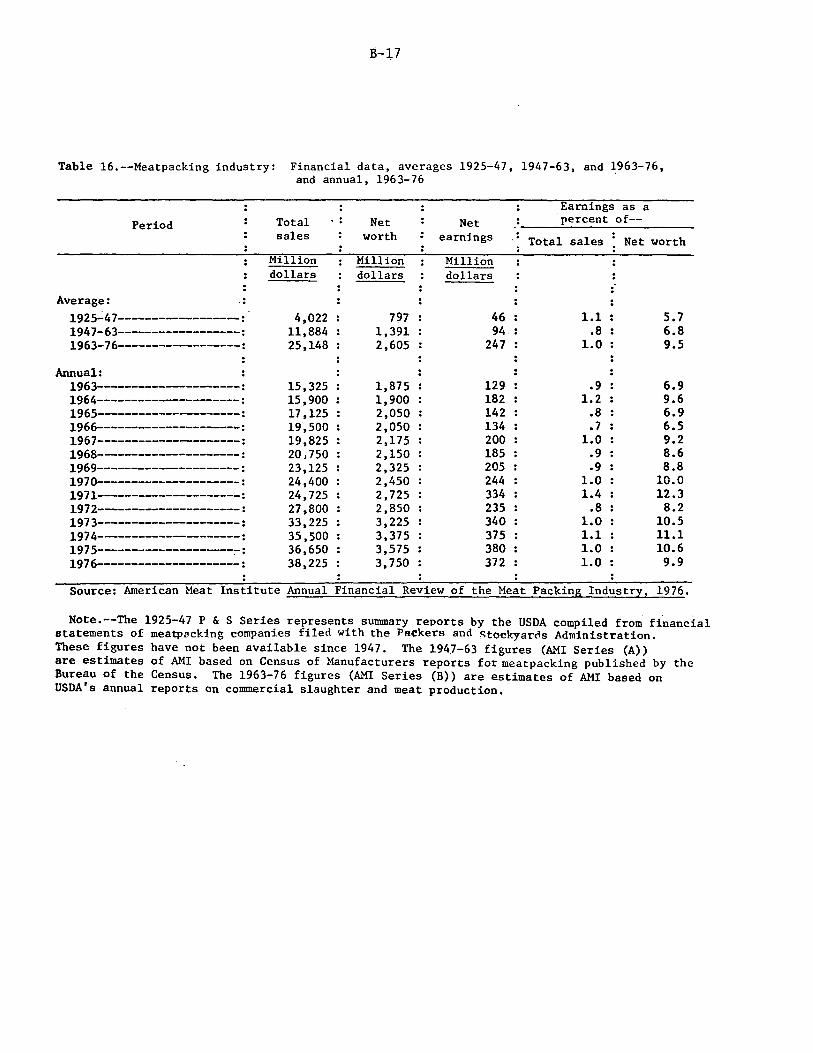
16. Meatpacking industry: Financial data, averages 1925-47, 1947-63, and 1963-76, and annual, 1963-76------------------ B-17
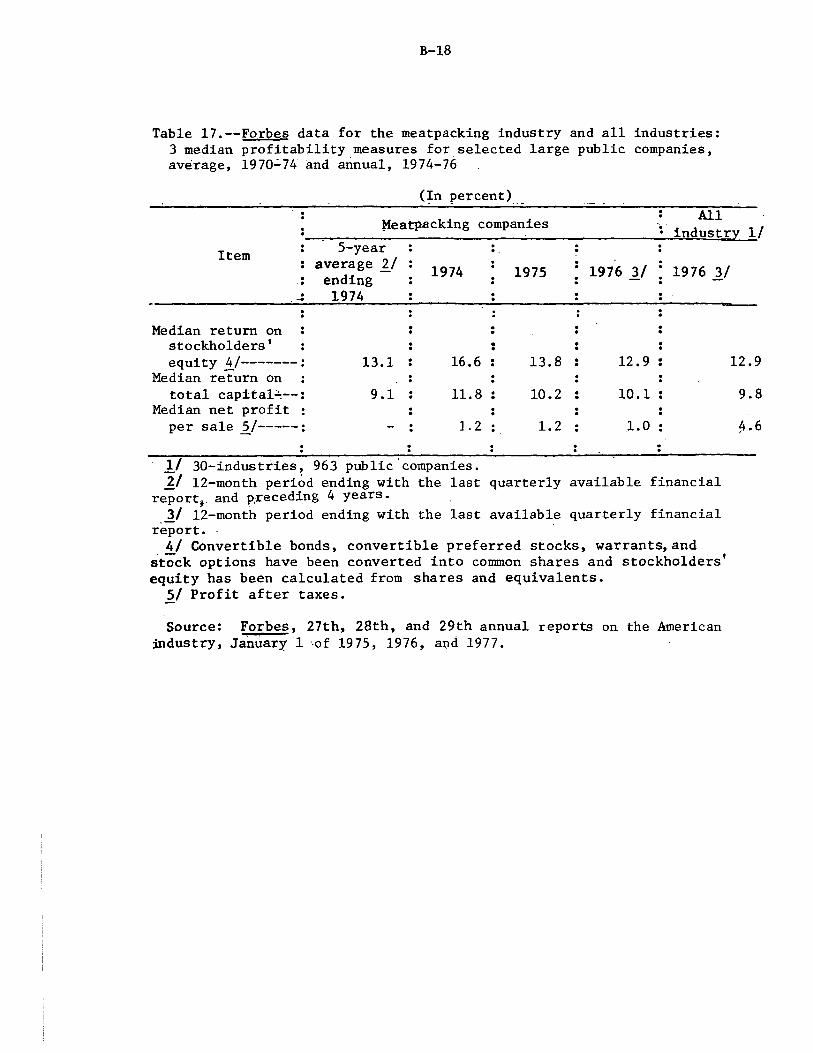
17. Forbes data for the meatpacking industry and all industries: 3 median profitability measures for selected large public companies, average, 1970-74 and annual, 1974-76------------ B-18
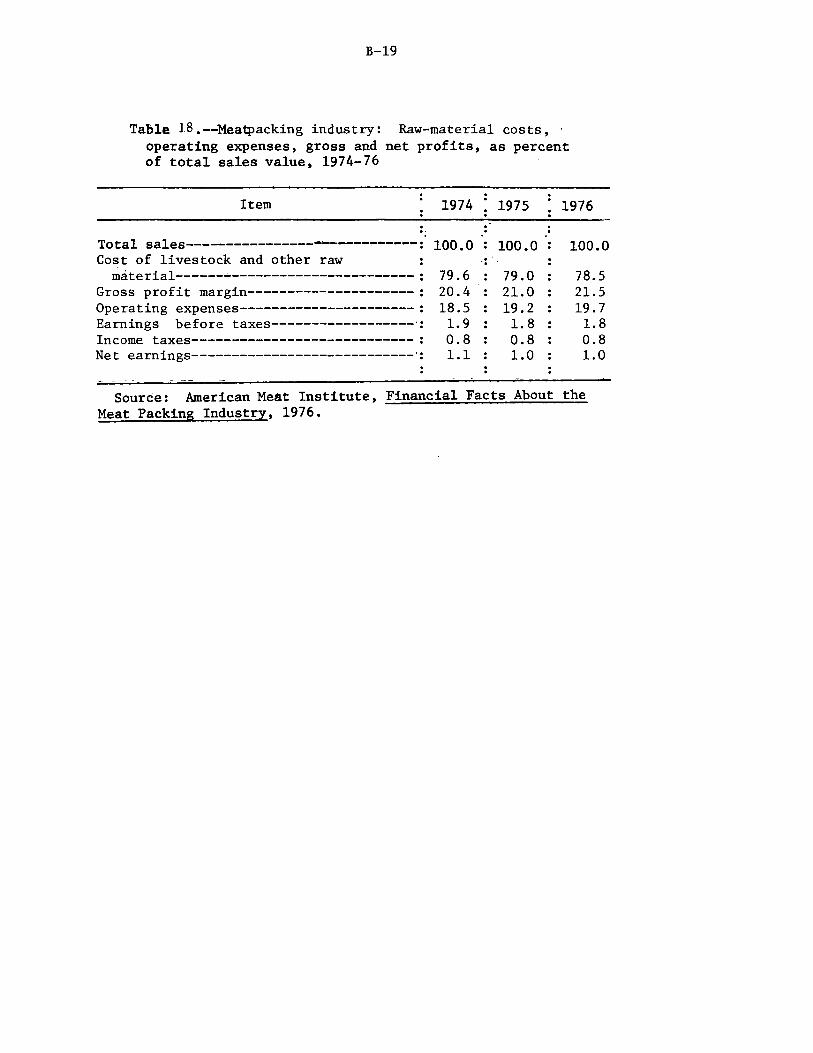
18. Meatpacking industry: Raw-material costs, operating expenses, gross and net profits, as percent of total sales value, 1974-76--------------------------------------- B-19
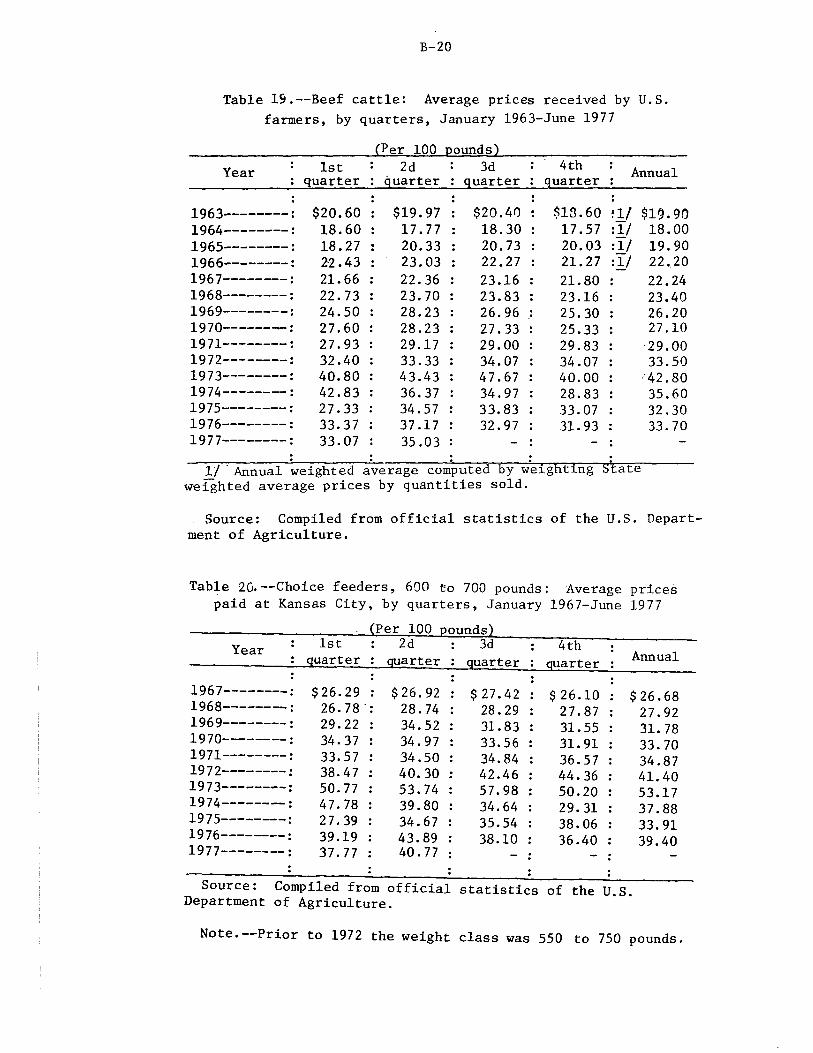
19. Beef cattle: Average prices received by U.S. farmers, by quarters, January 1963-June 1977--------------------------- B-20
20. Choice feeders, 600 to 700 pounds: Average prices paid at Kansas City, by quarters, January 1967-June 1977----------- B-20
vi
Tables
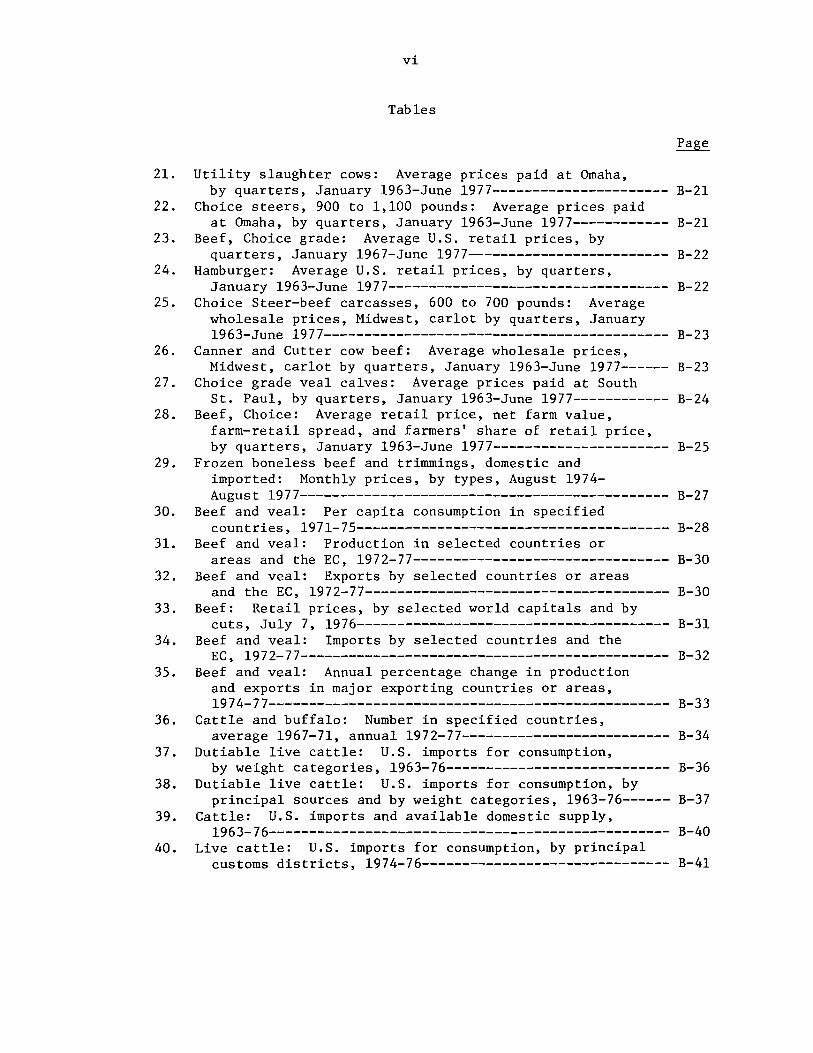
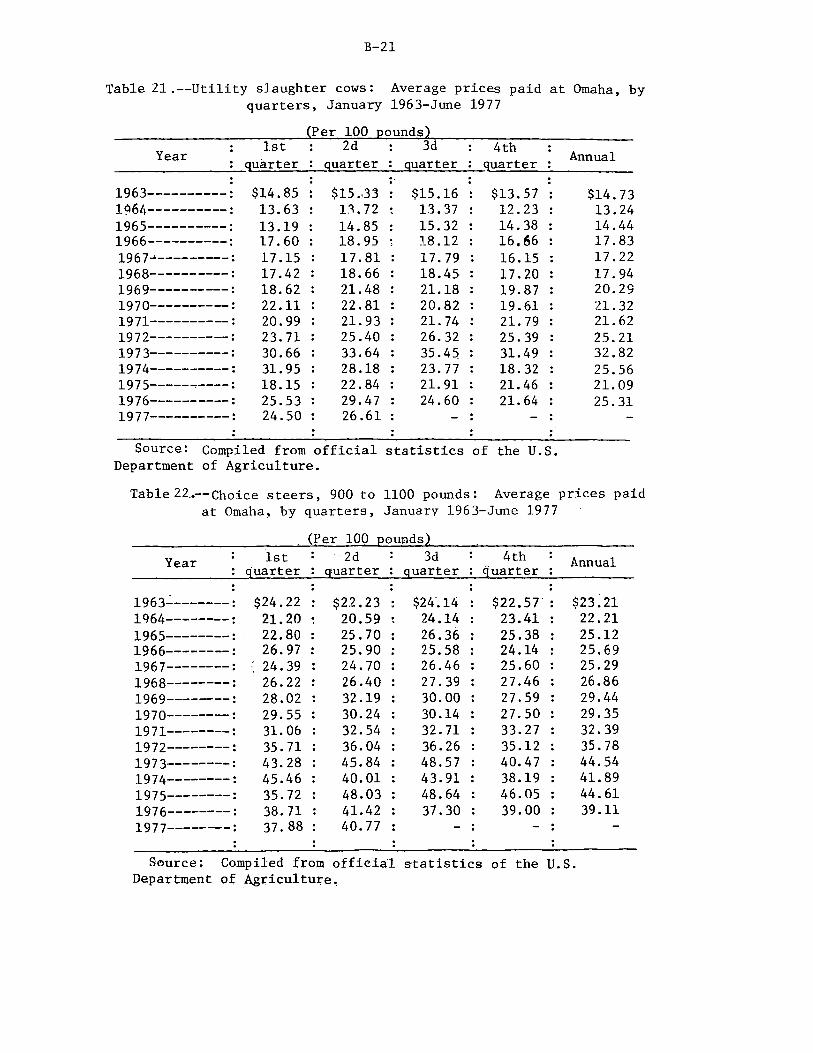
21. Utility slaughter cows: Average prices paid at Omaha, by quarters, January 1963-June 1977---------------------- B-21
22. Choice steers, 900 to 1,100 pounds: Average prices paid at Omaha, by quarters, January 1963-June 1977------------ B-21
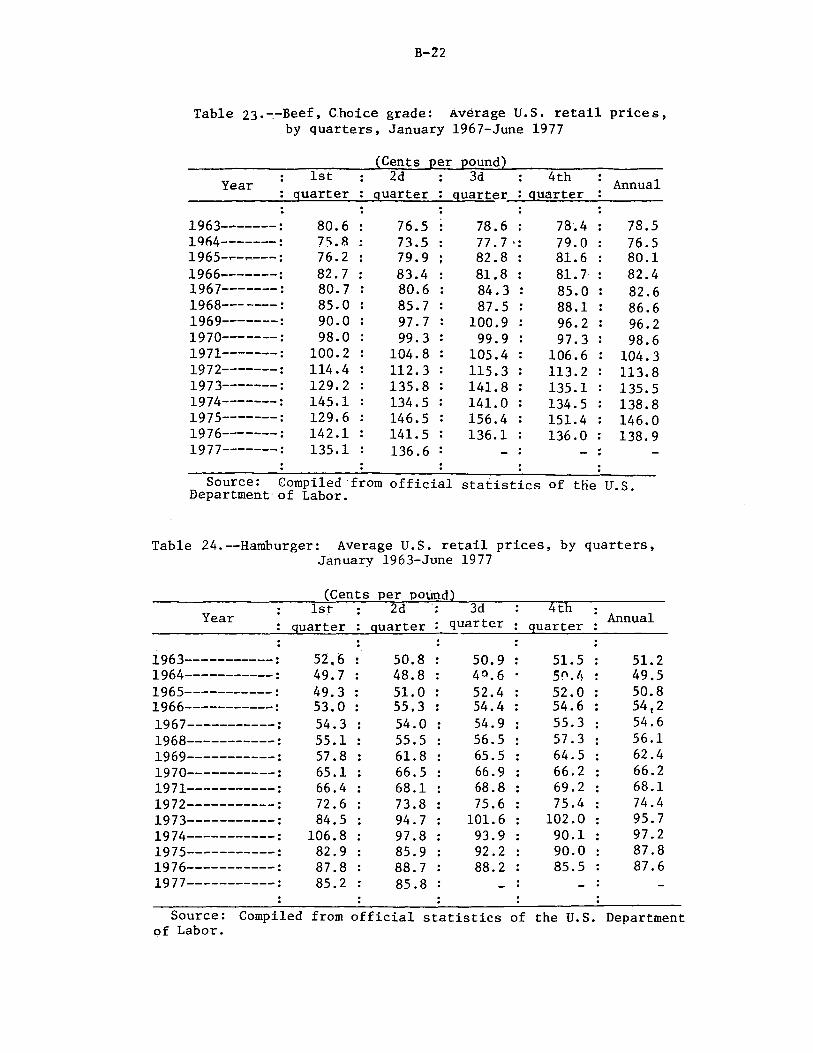
23. Beef, Choice grade: Average U.S. retail prices, by quarters, January 1967-June 1977------------------------- B-22
24. Hamburger: Average U.S. retail prices, by quarters, January 1963-June 1977----------------------------------- B-22
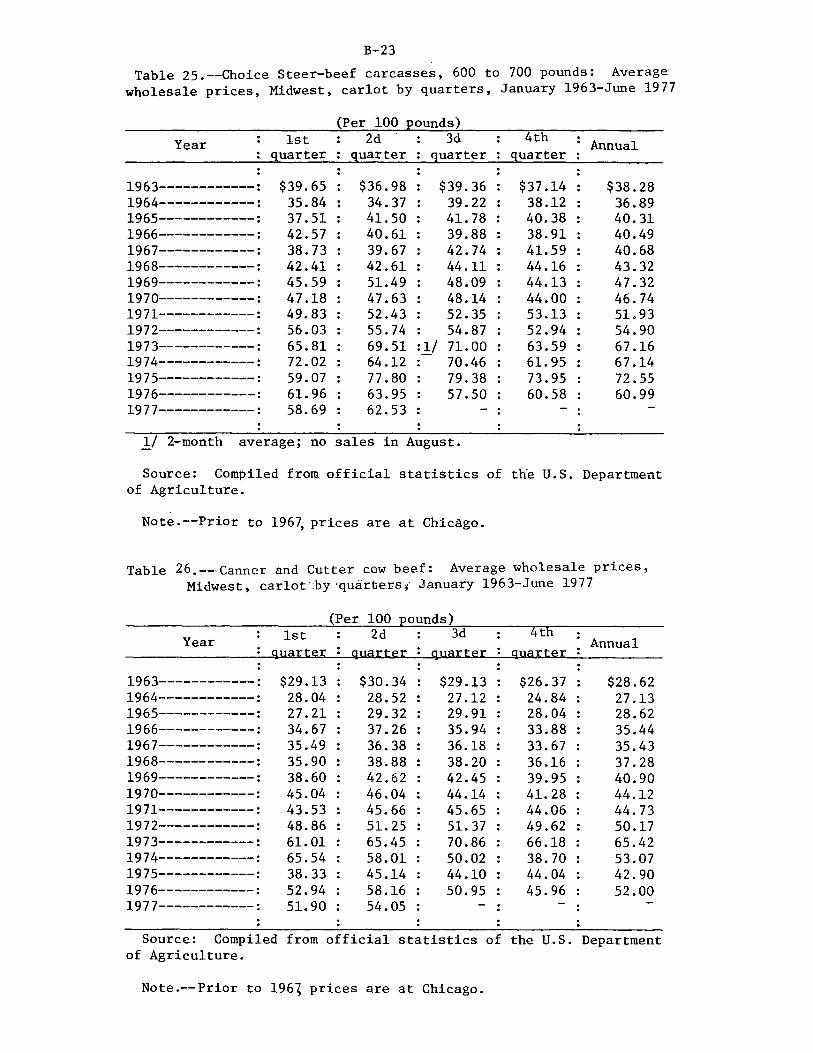
25. Choice Steer-beef carcasses, 600 to 700 pounds: Average wholesale prices, Midwest, carlot by quarters, January 1963-June 1977------------------------------------------- B-23
26. Canner and Cutter cow beef: Average wholesale prices, Midwest, carlot by quarters, January 1963-June 1977------ B-23
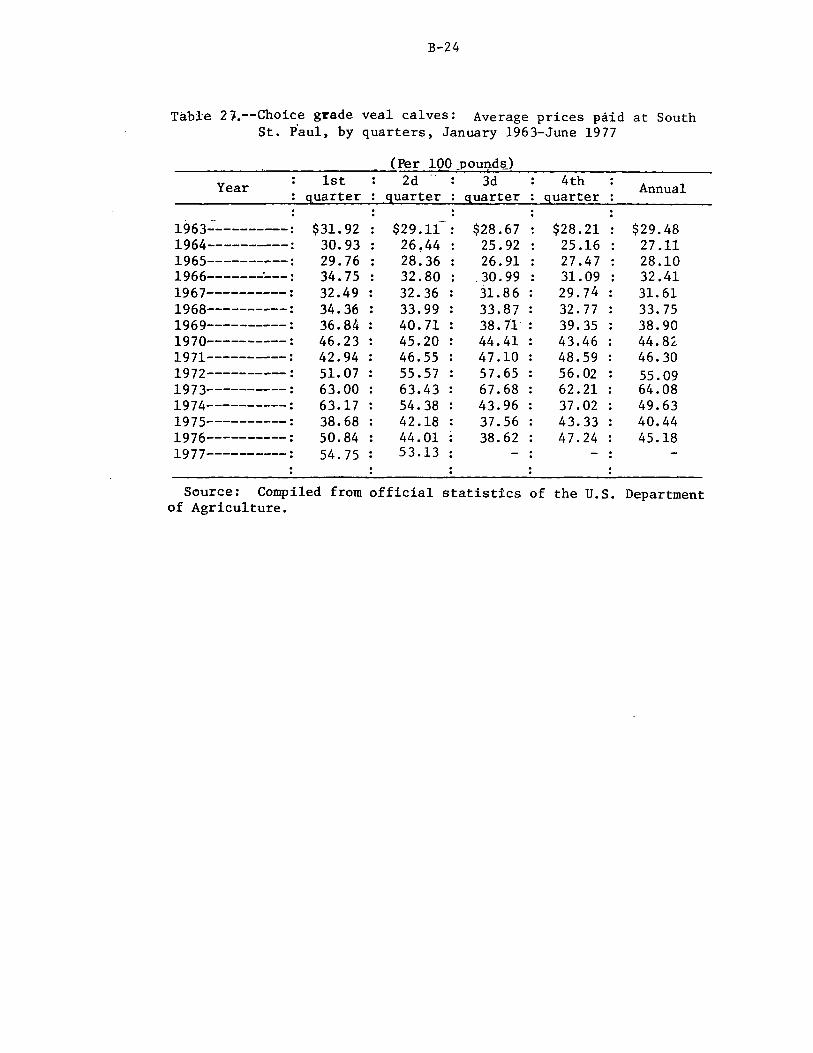
27. Choice grade veal calves: Average prices paid at South St. Paul, by quarters, January 1963-June 1977------------ B-24
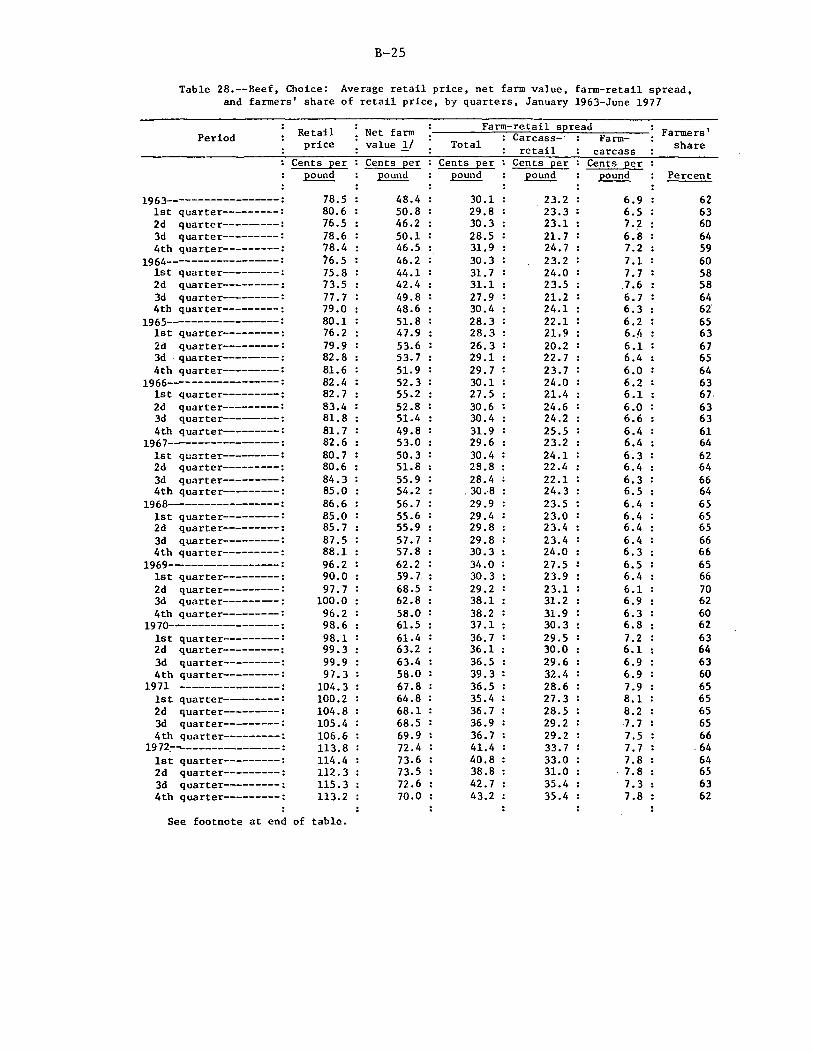
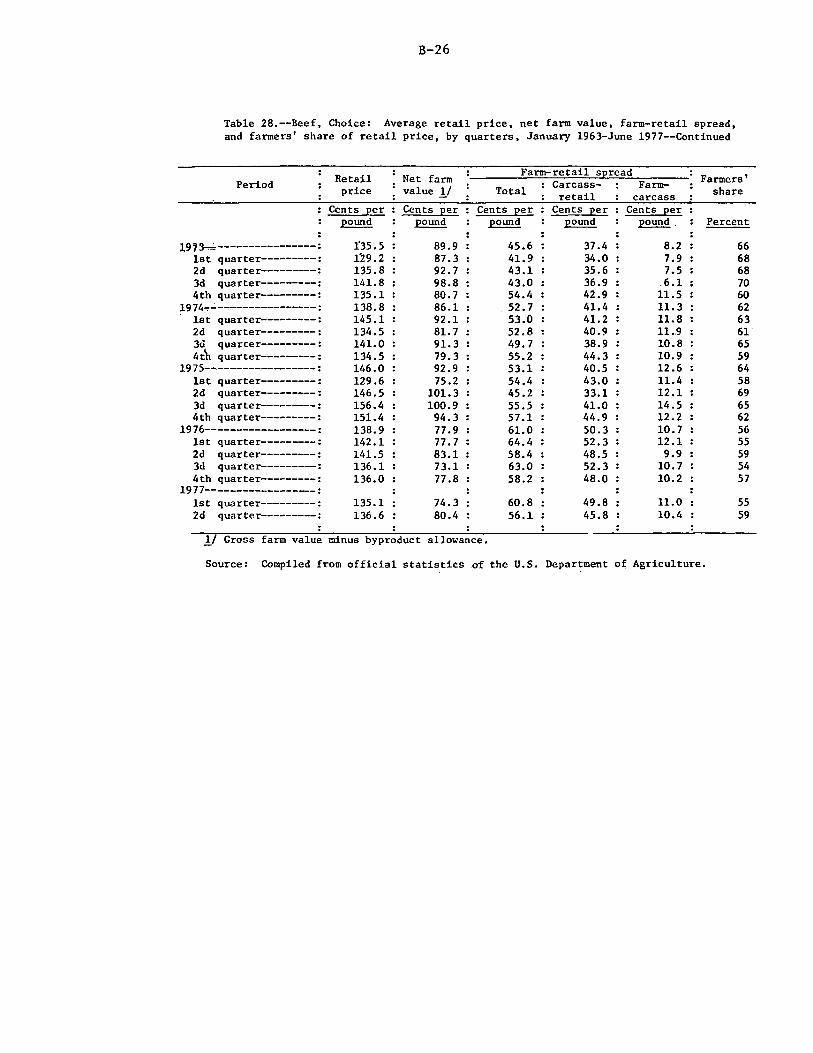
28. Beef, Choice: Average retail price, net farm value, farm-retail spread, and farmers' share of retail price, by quarters, January 1963-June 1977---------------------- B-25
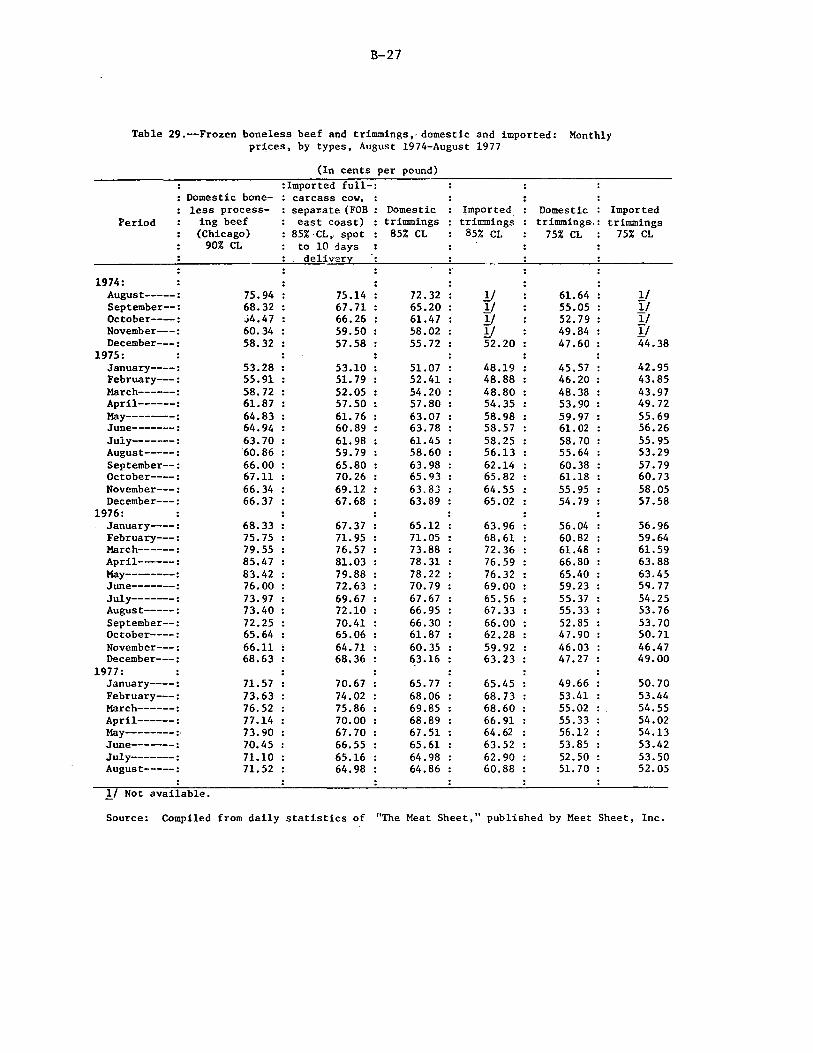
29. Frozen boneless beef and trimmings, domestic and imported: Monthly prices, by types, August 1974-August 1977---------------------------------------------- B-27
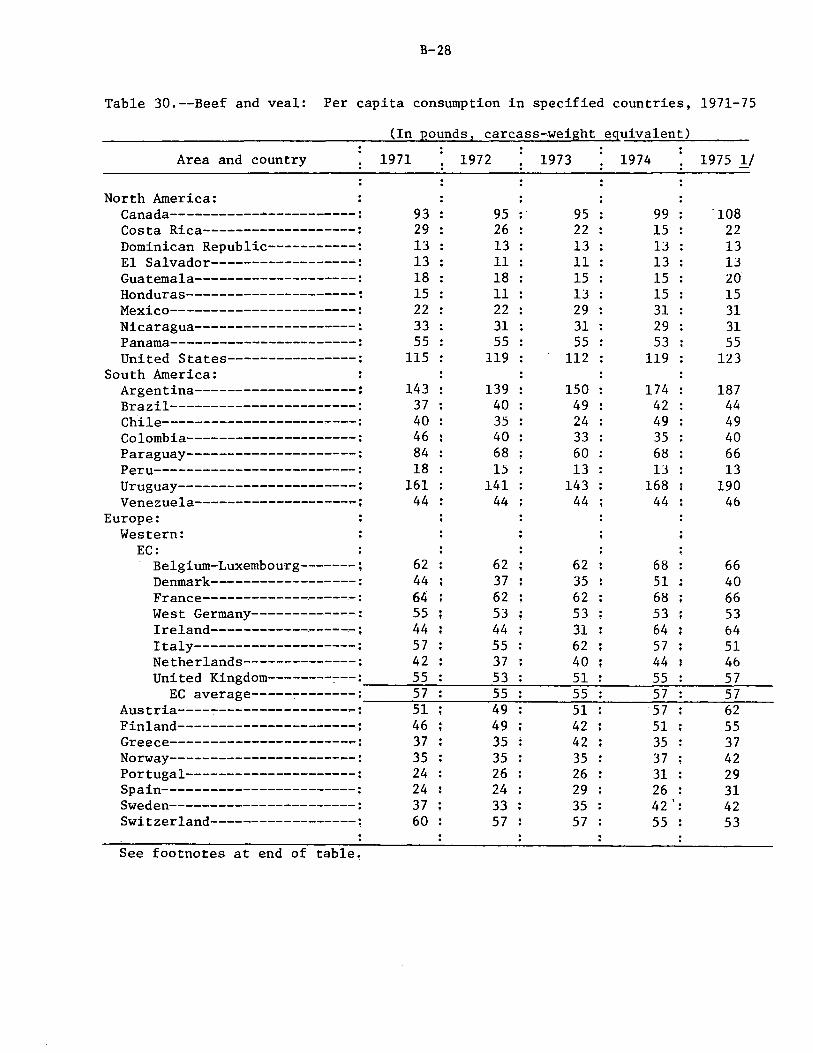
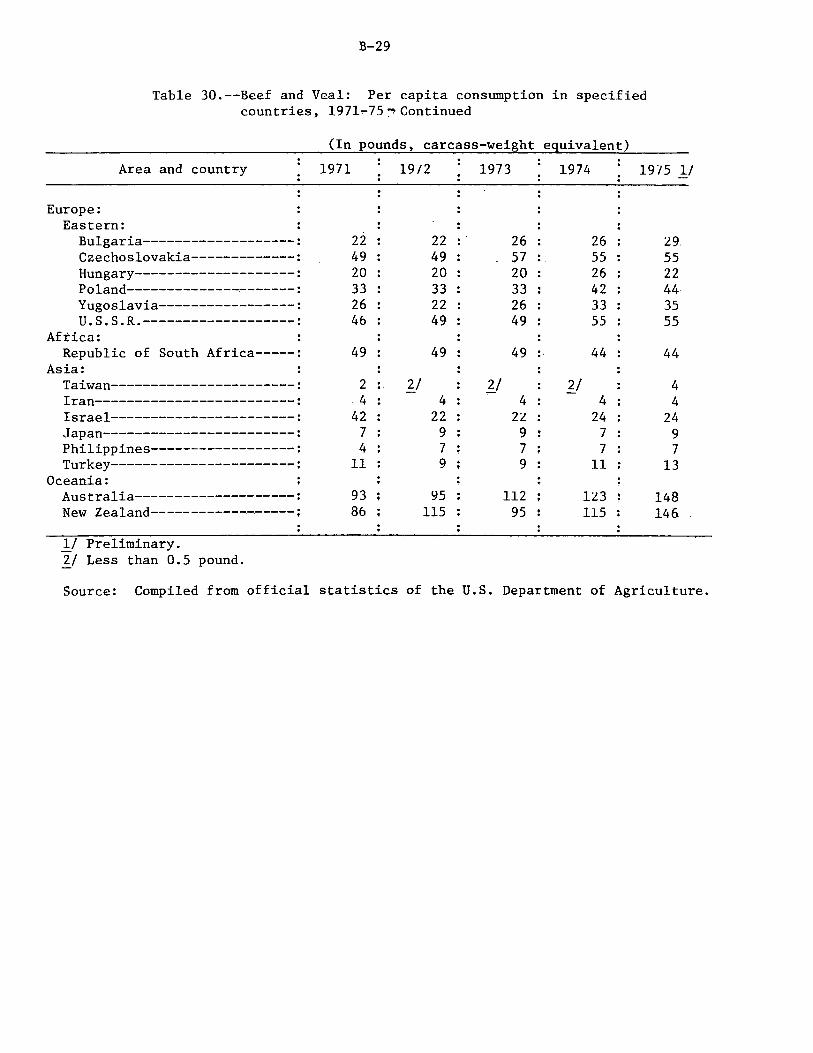
30. Beef and veal: Per capita consumption in specified countries, 1971-75--------------------------------------- B-28
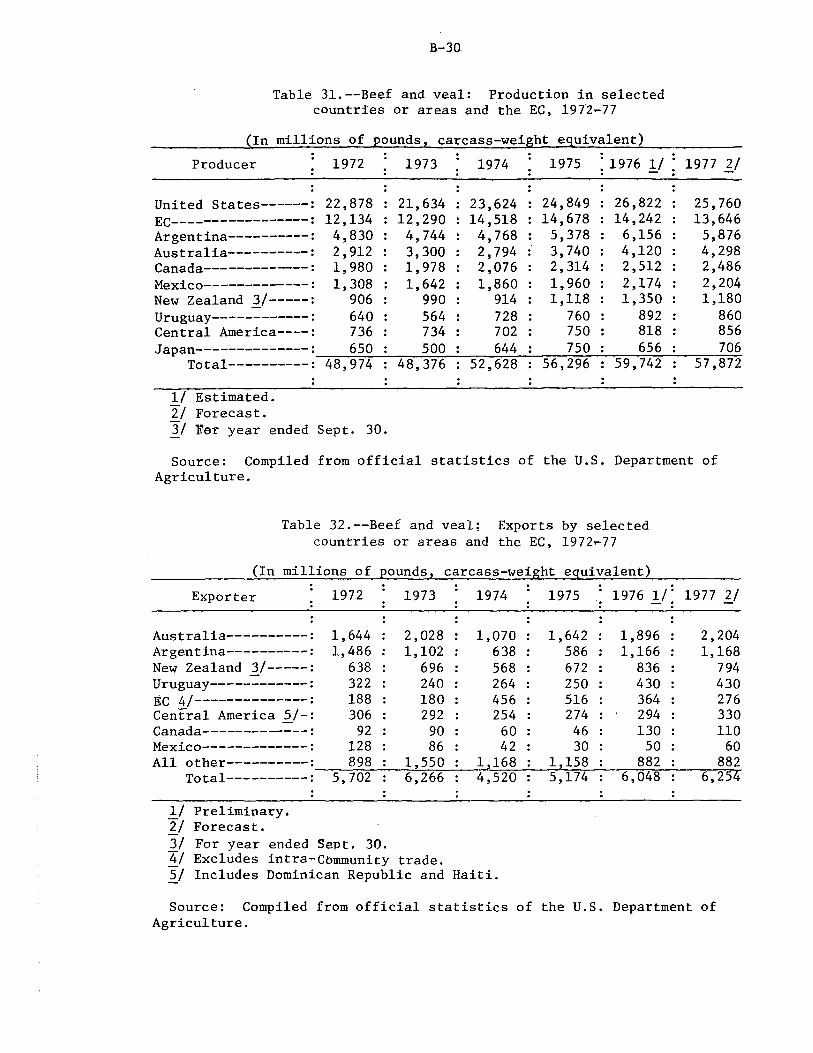
31. Beef and veal: Production in selected countries or areas and the EC, 1972-77-------------------------------- B-30
32. Beef and veal: Exports by selected countries or areas and the EC, 1972-77-------------------------------------- B-30
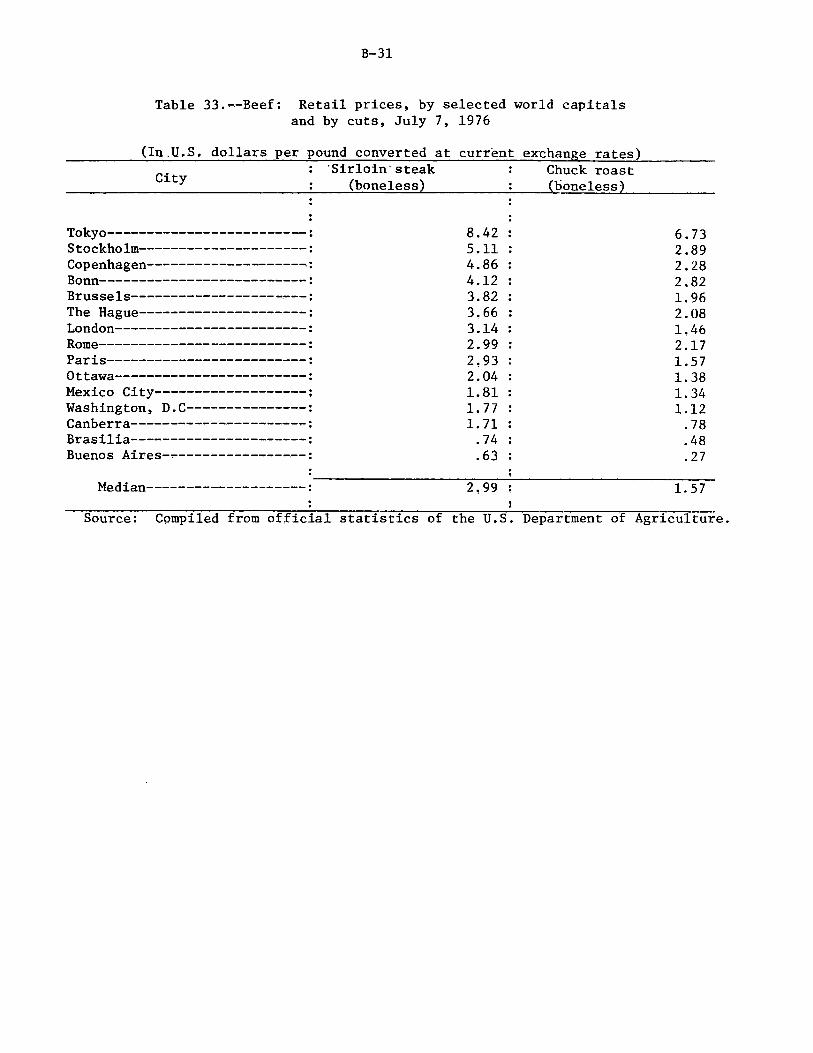
33. Beef: Retail prices, by selected world capitals and by cuts, July 7, 1976--------------------------------------- B-31
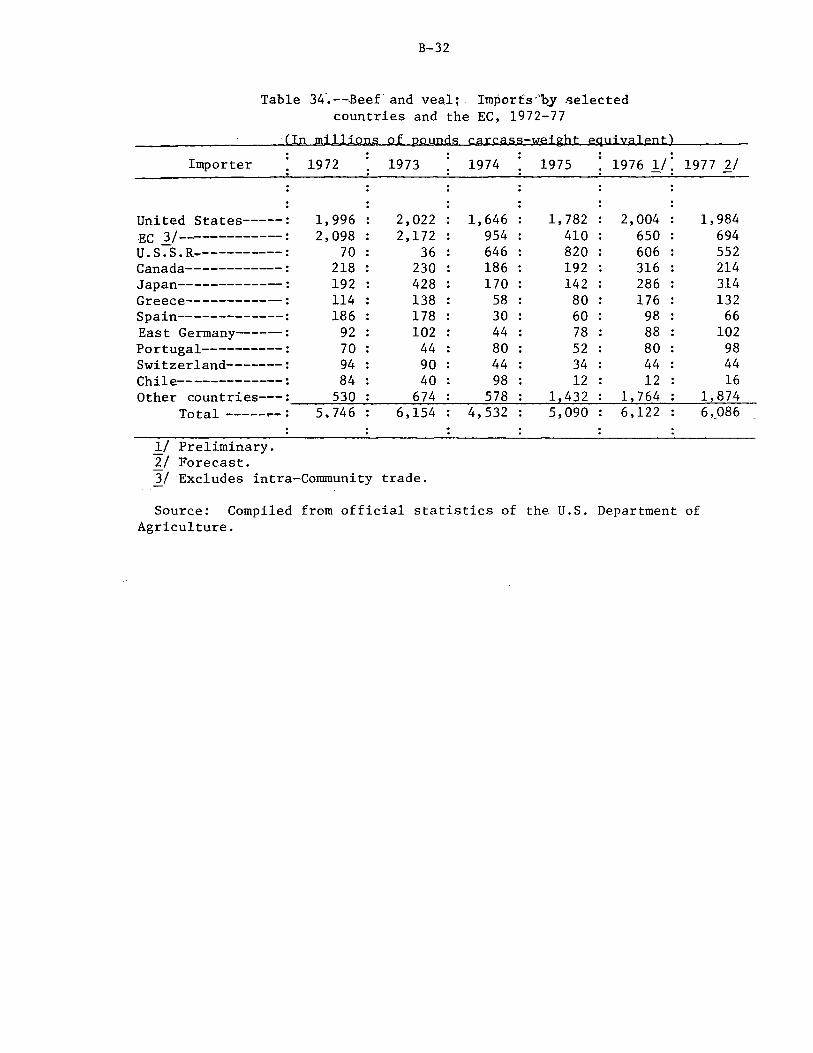
34. Beef and veal: Imports by selected countries and the EC, 1972-77---------------------------------------------- B-32
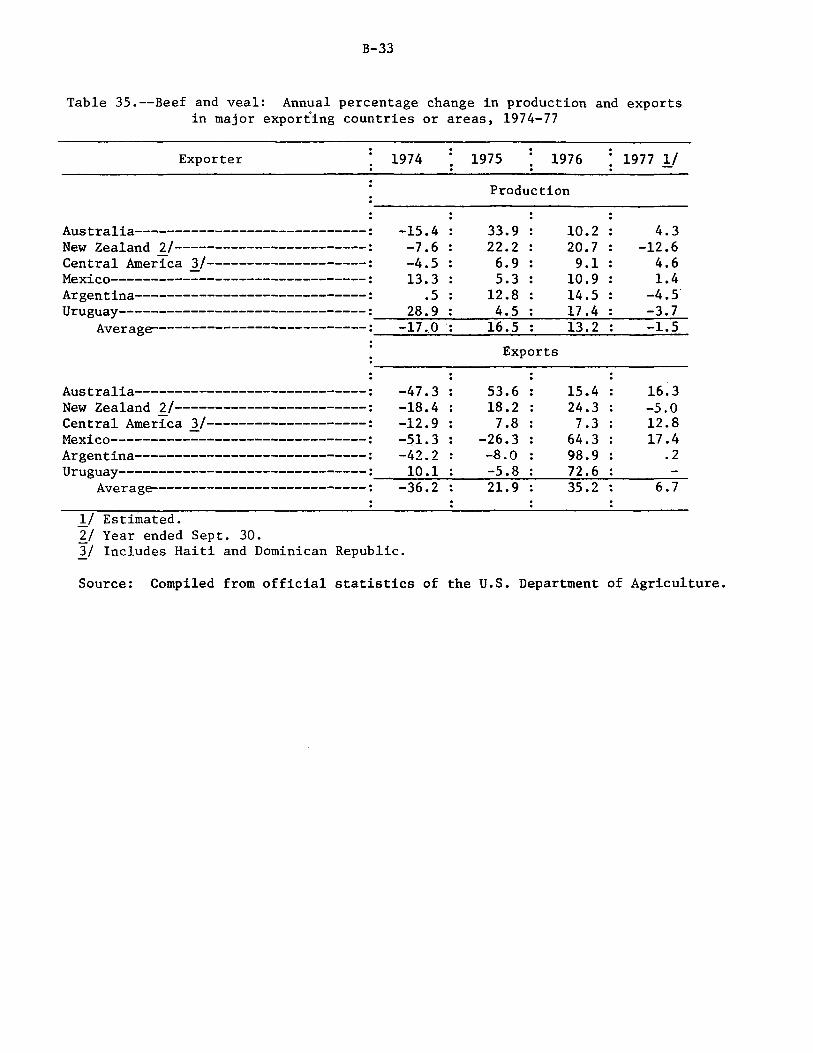
35. Beef and veal: Annual percentage change in production and exports in major exporting countries or areas, 1974-77-------------------------------------------------- B-33
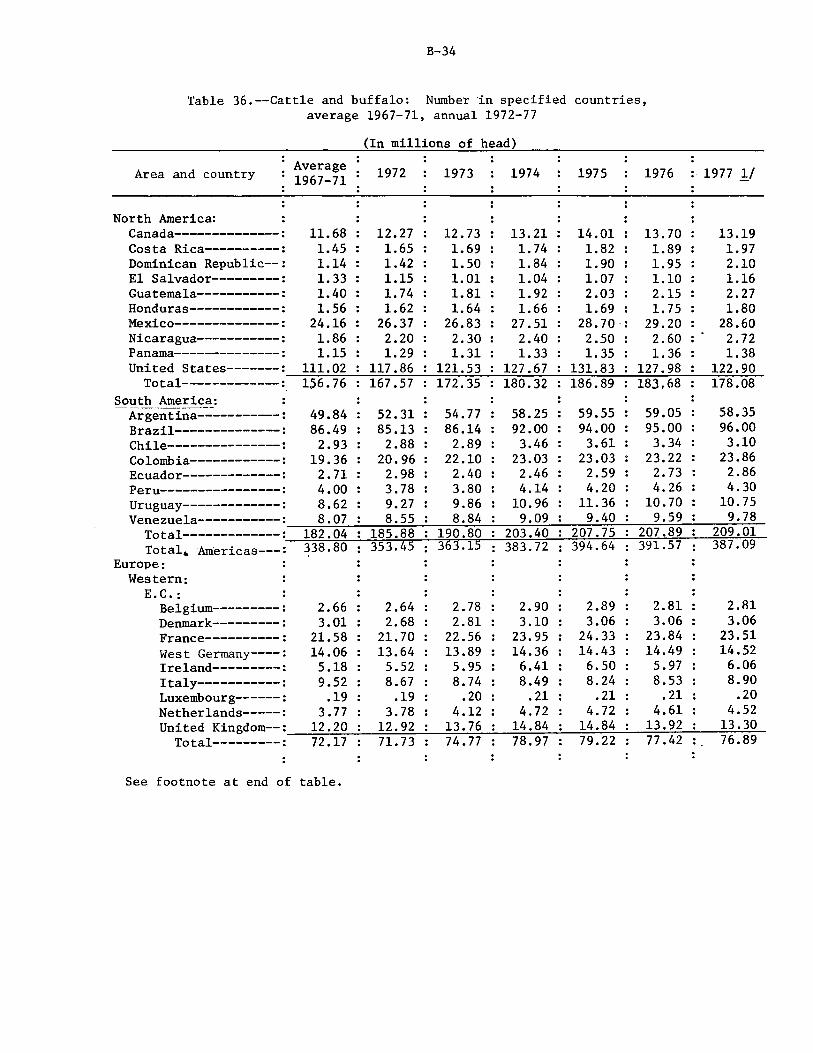
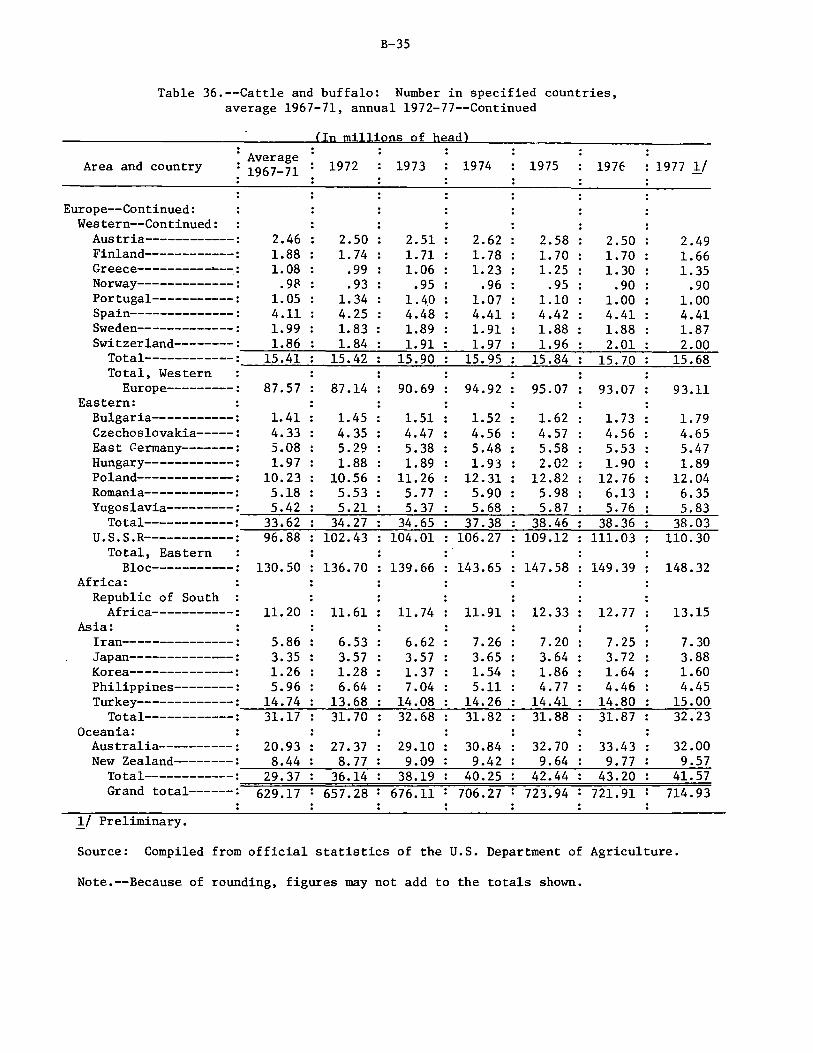
36. Cattle and buffalo: Number in specified countries, average 1967-71, annual 1972-77-------------------------- B-34
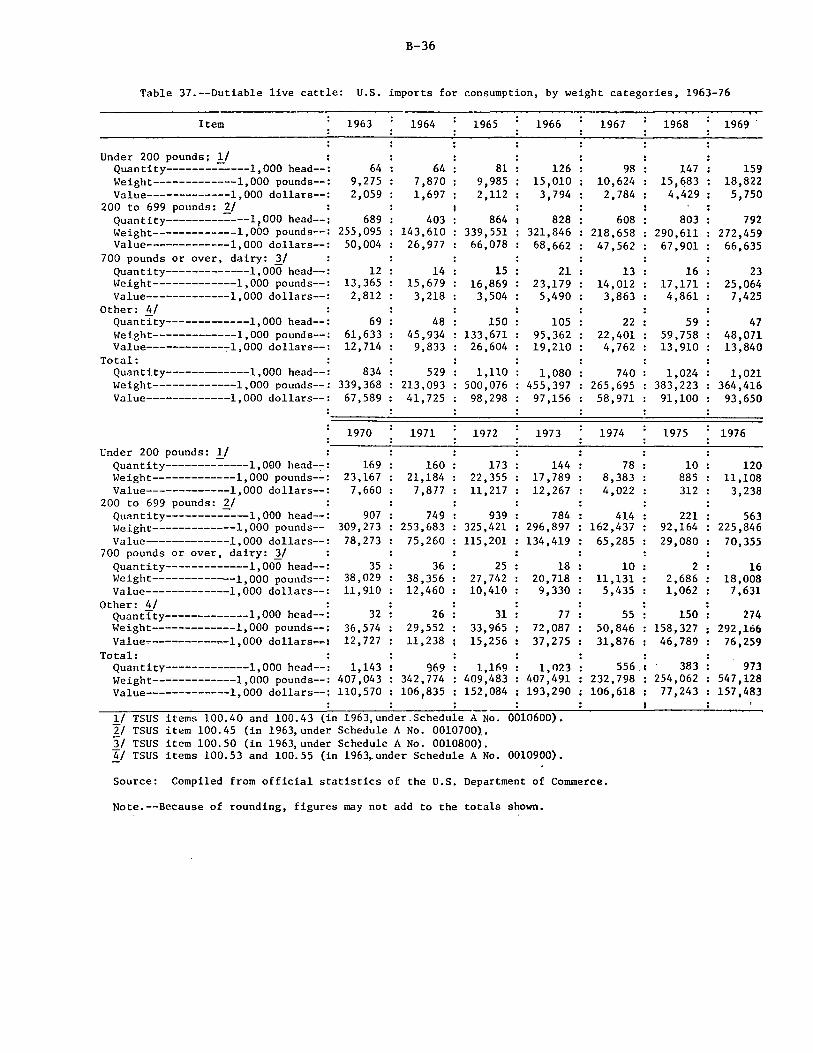
37. Dutiable live cattle: U.S. imports for consumption, by weight categories, 1963-76---------------------------- B-36
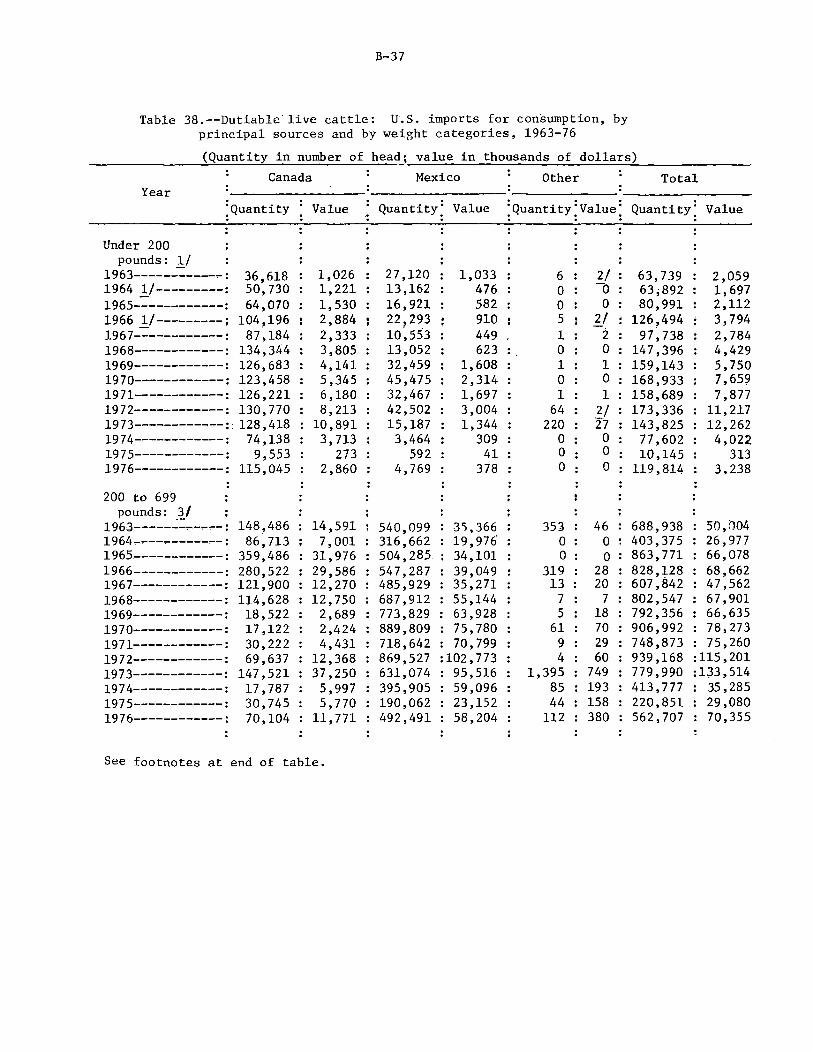
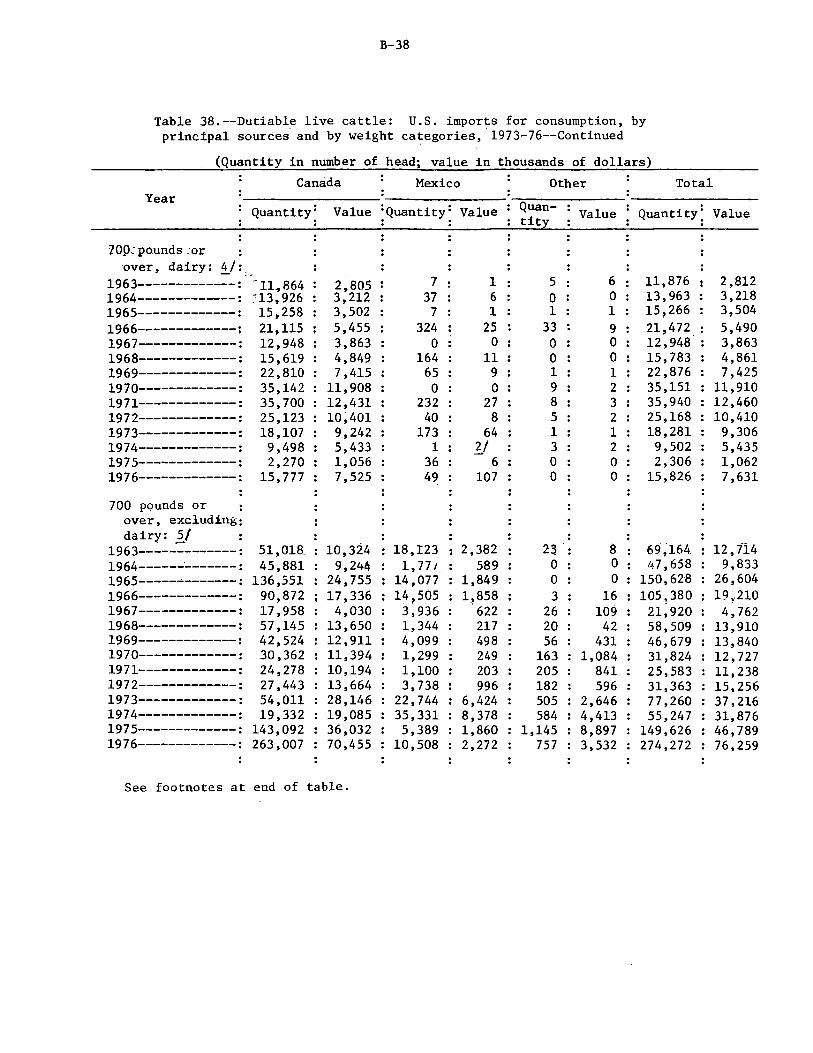
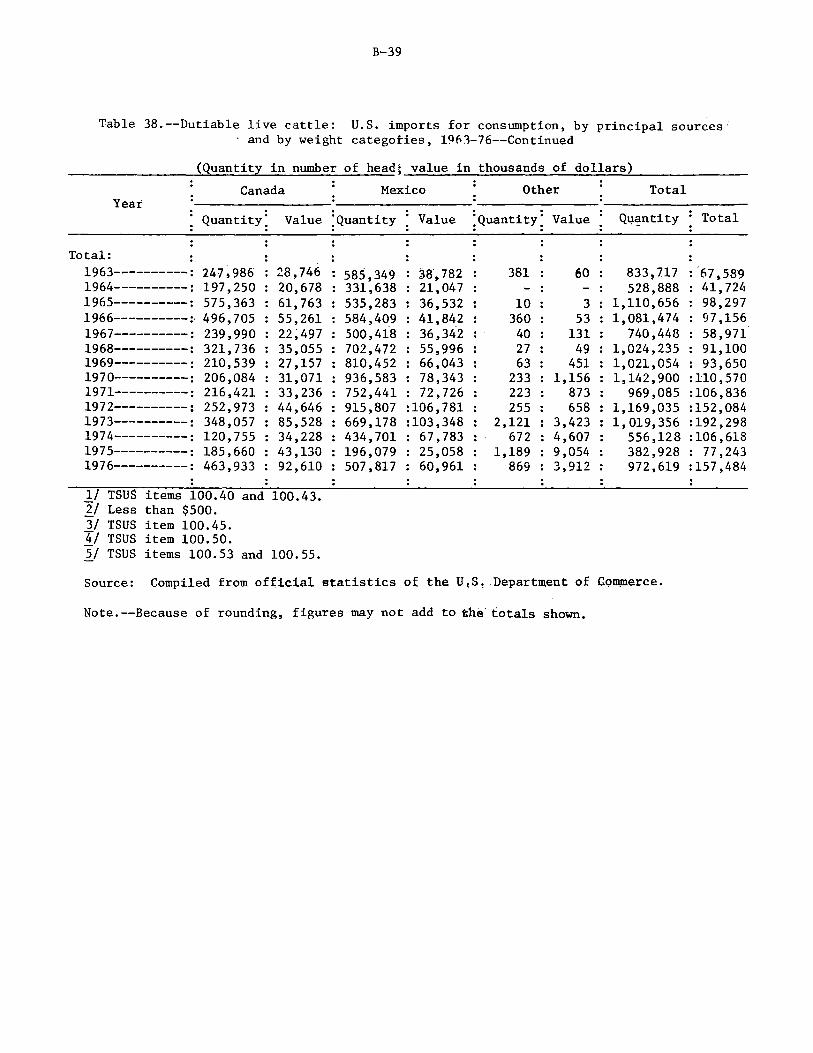
38. Dutiable live cattle: U.S. imports for consumption, by principal sources and by weight categories, 1963-76------ B-37
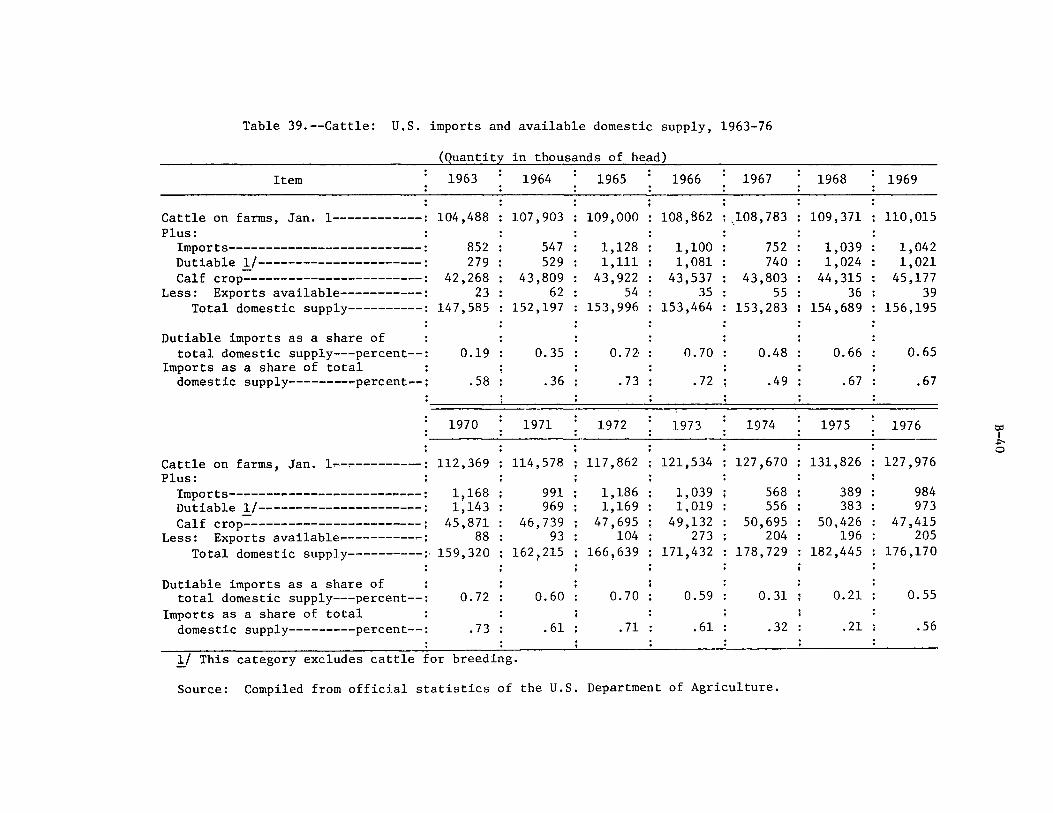
39. Cattle: U.S. imports and available domestic supply, 1963-76-------------------------------------------------- B-40
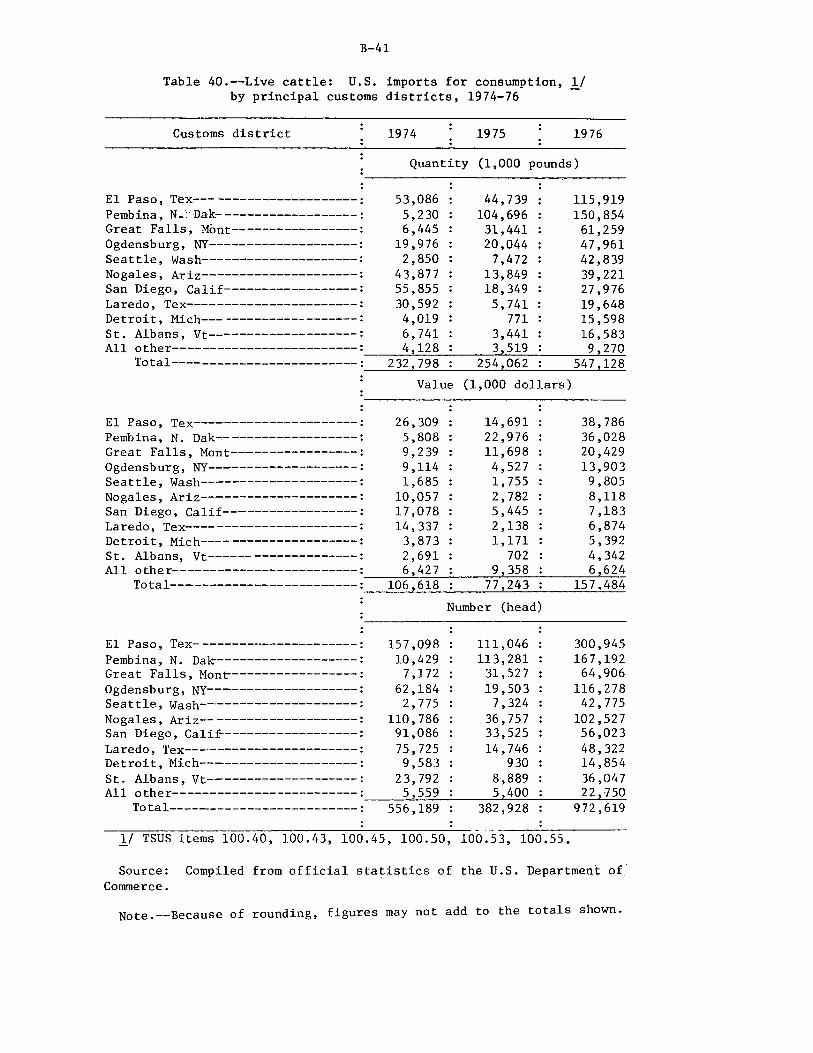
40. Live cattle: U.S. imports for consumption, by principal customs districts, 1974-76------------------------------- B-41
vii
Tables
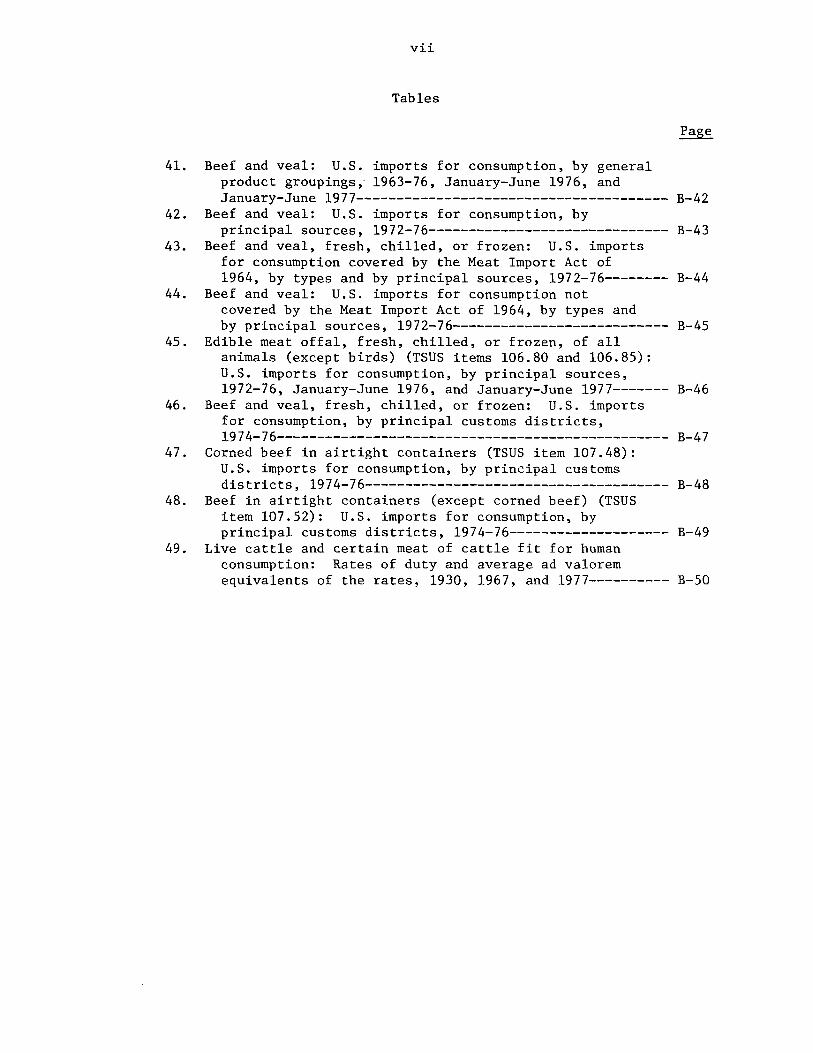
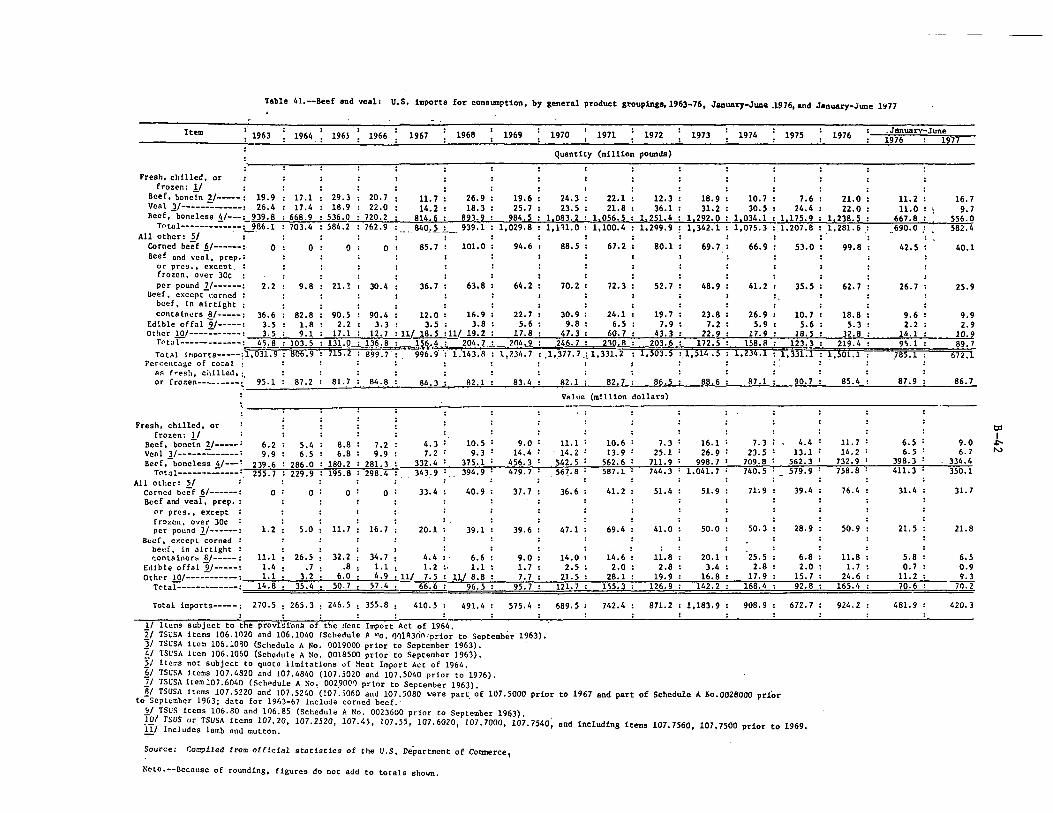
41. Beef and veal: U.S. imports for consumption, by general product groupings; 1963-76, January-June 1976, and January-June 1977--------------------------------------- B-42
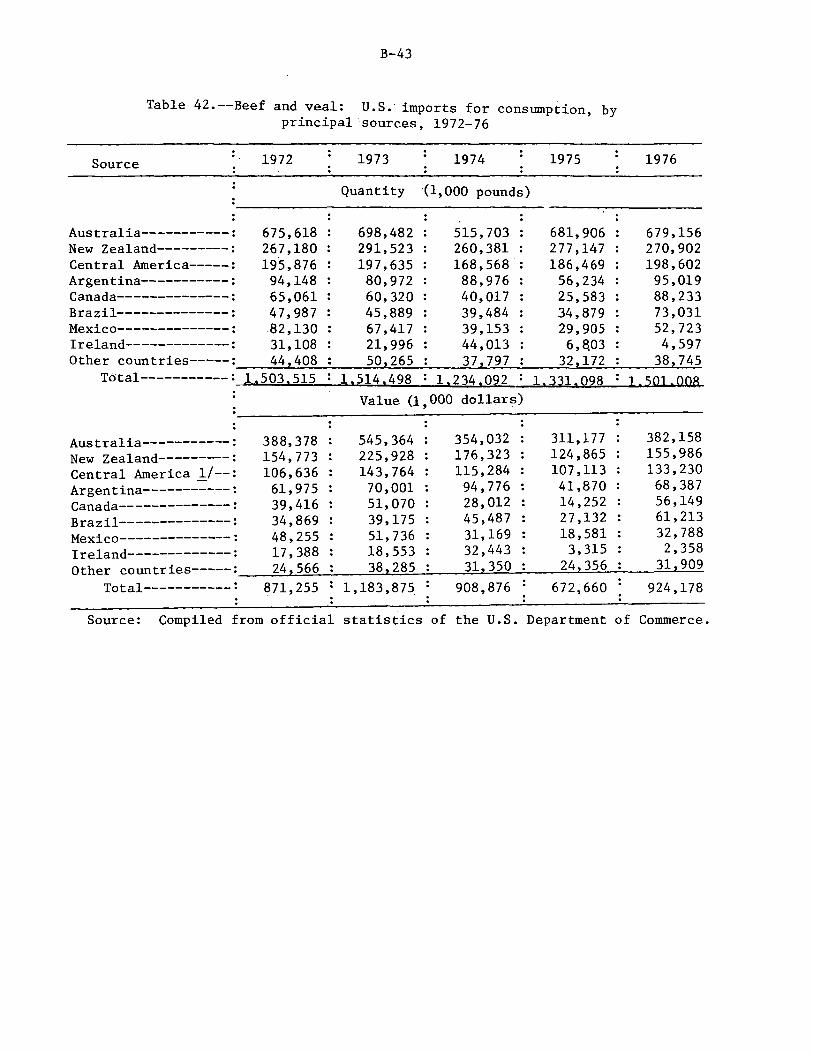
42. Beef and veal: U.S. imports for consumption, by principal sources, 1972-76------------------------------ B-43
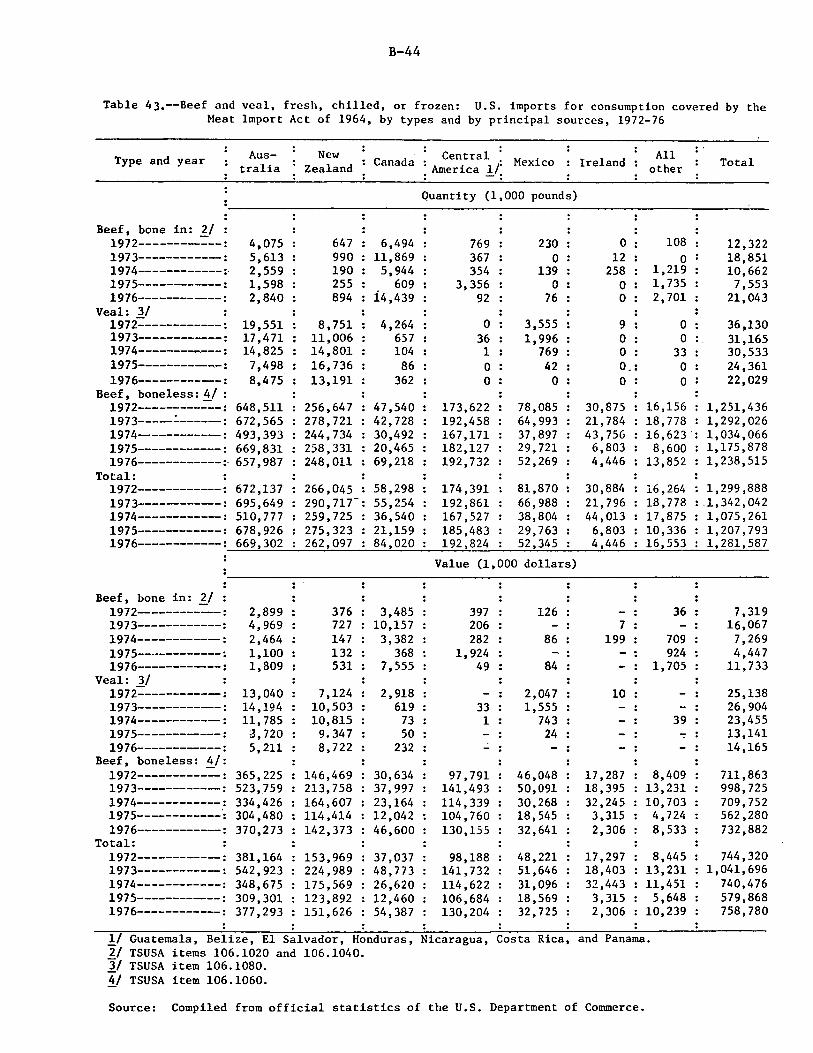
43. Beef and veal, fresh, chilled, or frozen: U.S. imports for consumption covered by the Meat Import Act of 1964, by types and by principal sources, 1972-76-------- B-44
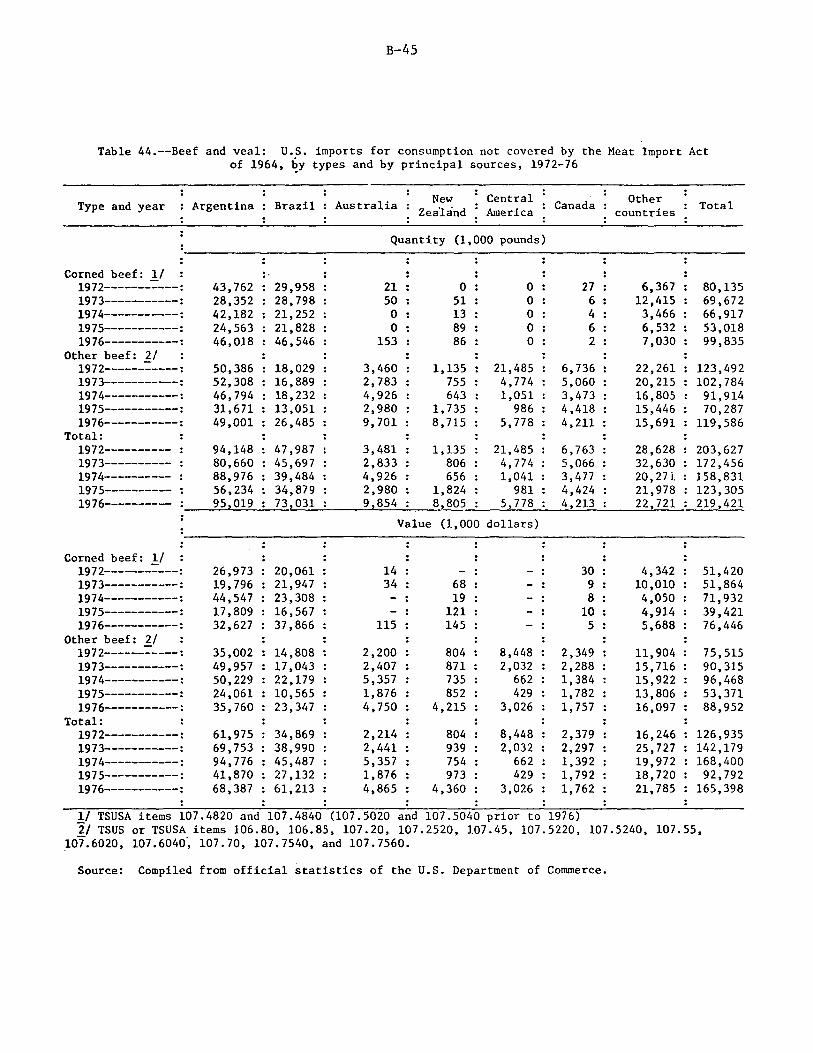
44. Beef and veal: U.S. imports for consumption not covered by the Meat Import Act of 1964, by types and by principal sources, 1972-76--------------------------- B-45
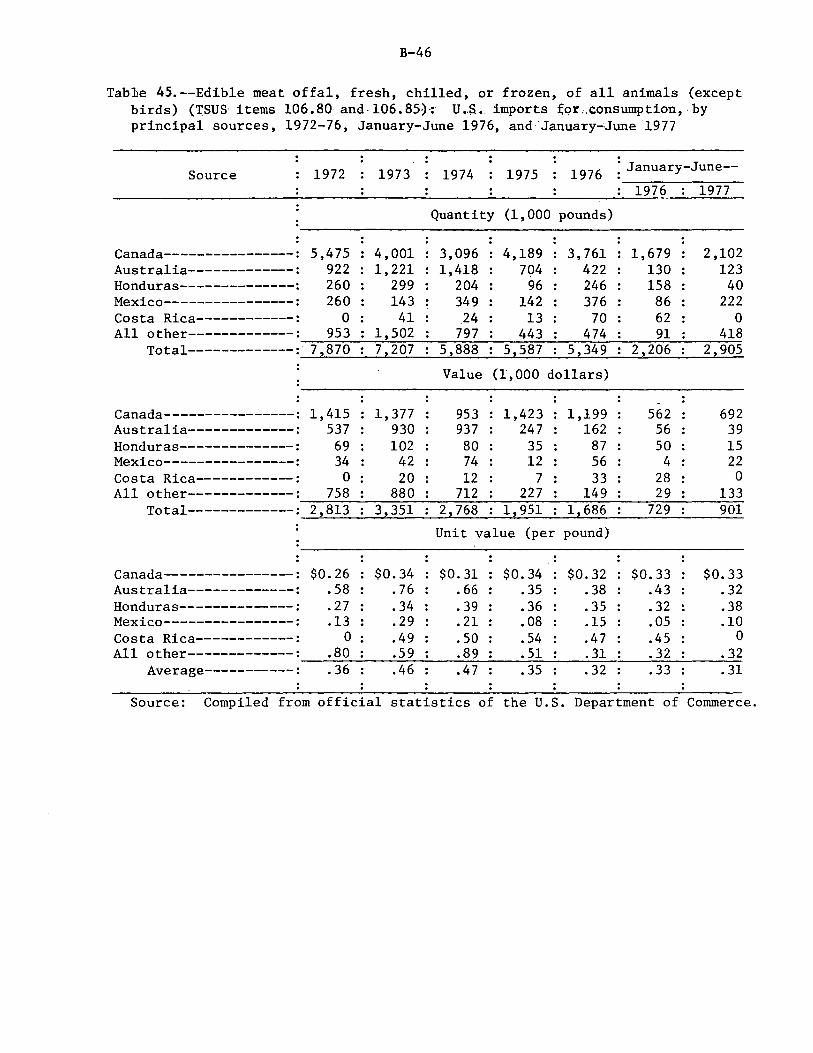
45. Edible meat offal, fresh, chilled, or frozen, of all animals (except birds) (TSUS items 106.80 and 106.85): U.S. imports for consumption, by principal sources, 1972-76, January-June 1976, and January-June 1977------- B-46
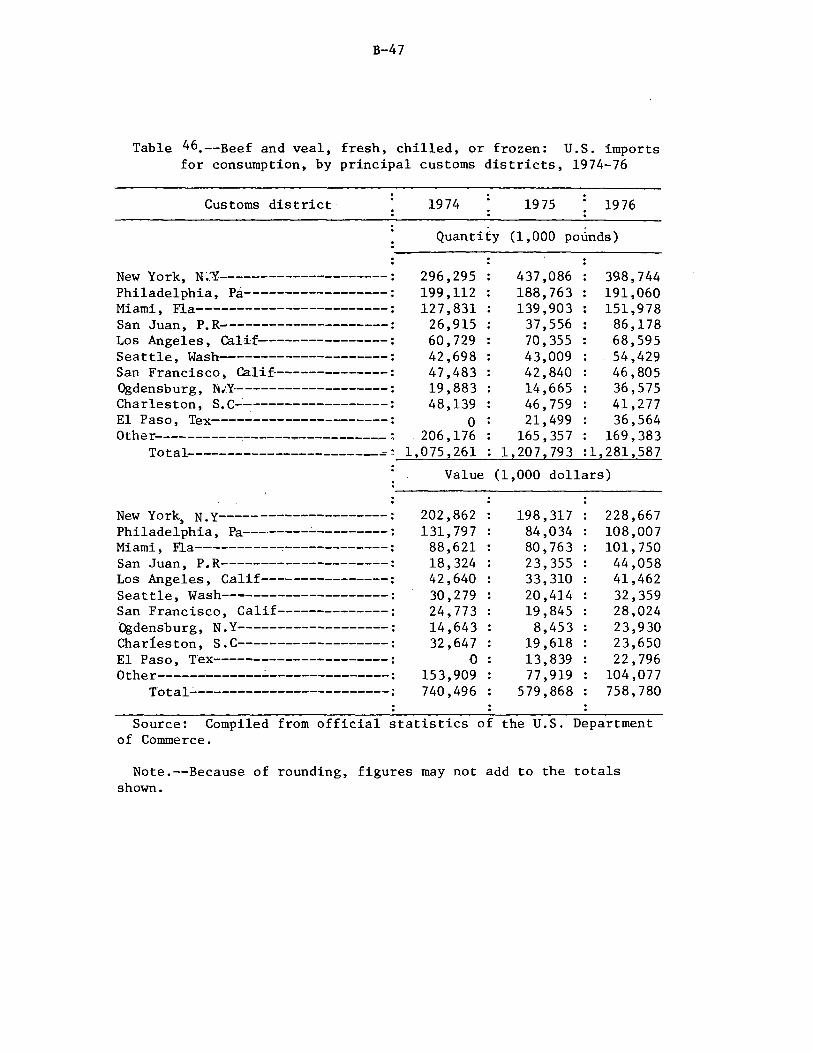
46. Beef and veal, fresh, chilled, or frozen: U.S. imports for consumption, by principal customs districts, 1974-76------------------------------------------------- B-47
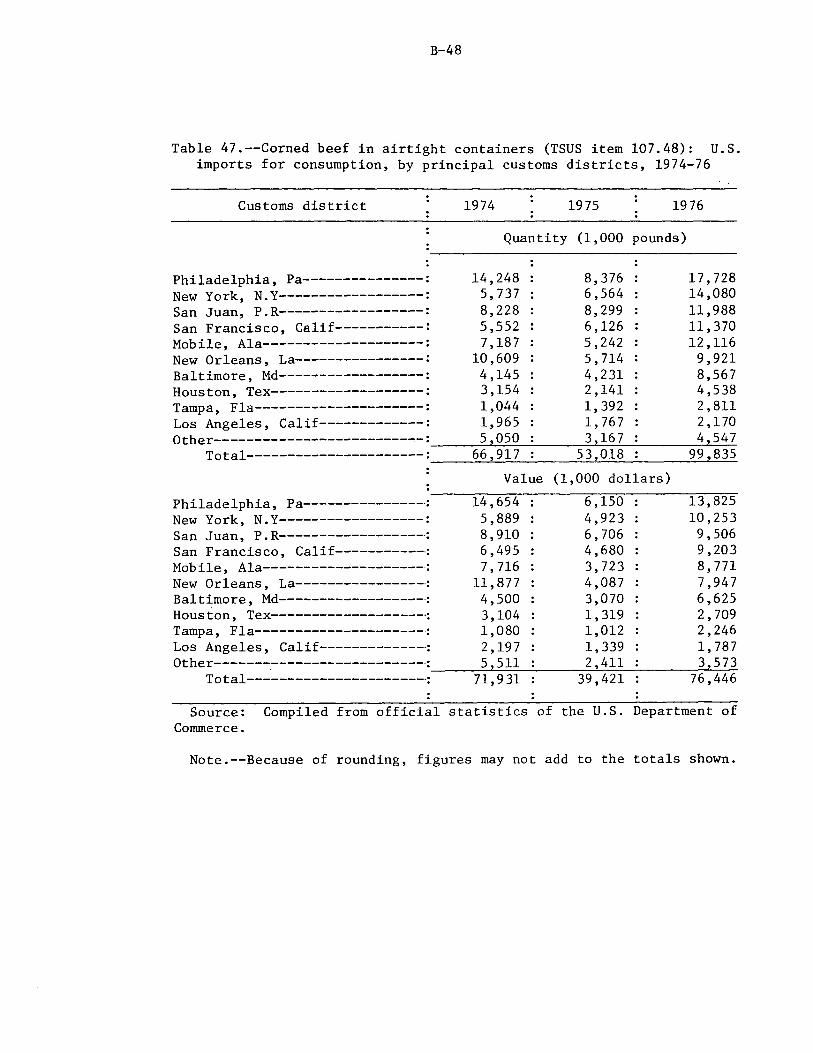
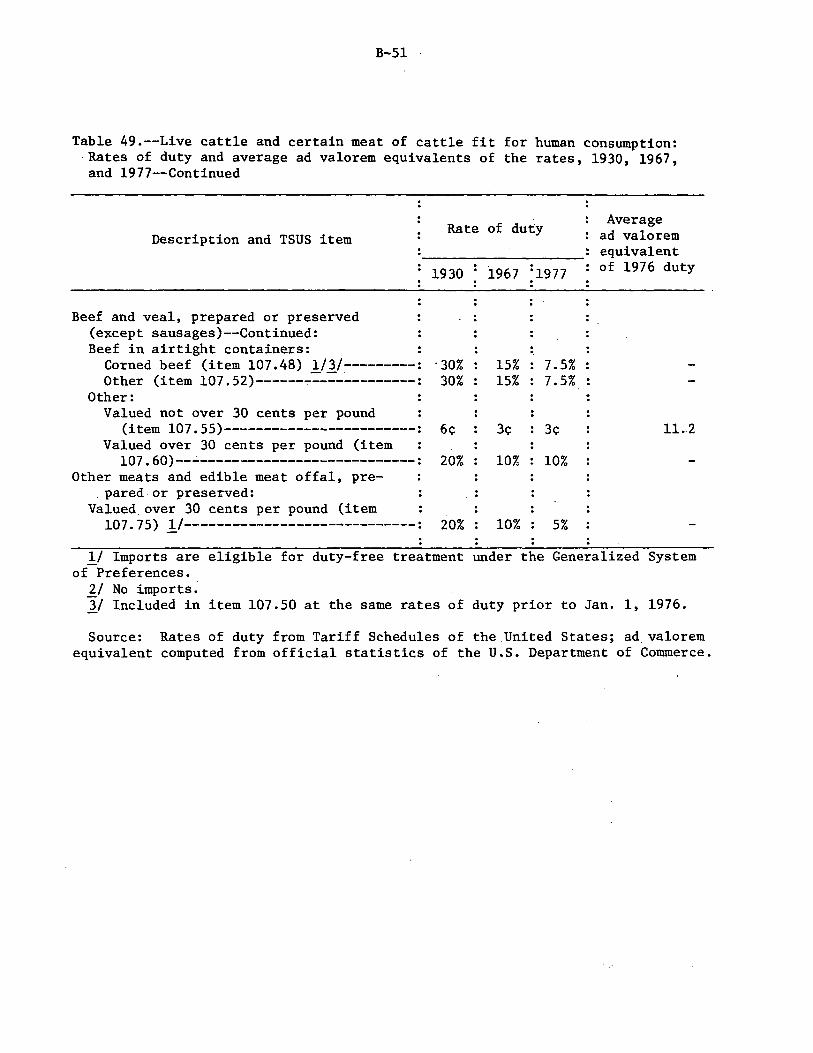
47. Corned beef in airtight containers (TSUS item 107.48): U.S. imports for consumption, by principal customs districts, 1974-76-------------------------------------- B-48
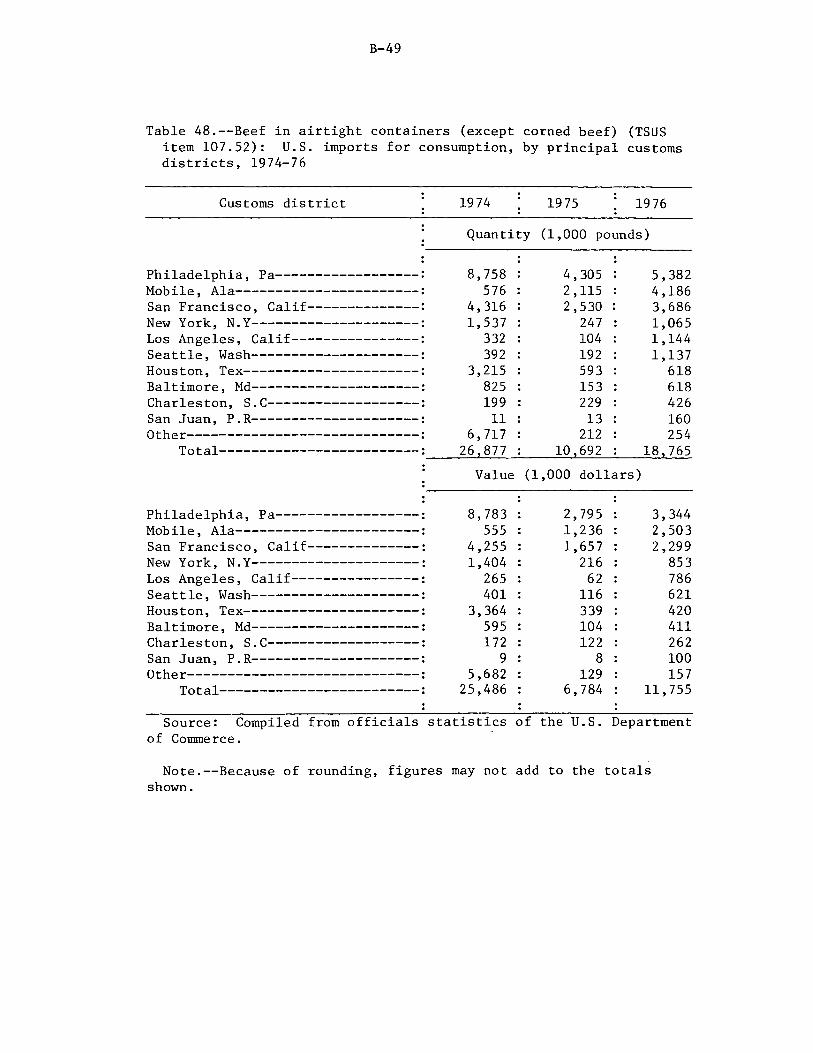
48. Beef in airtight containers (except corned beef) (TSUS item 107.52): U.S. imports for consumption, by principal customs districts, 1974-76-------------------- B-49
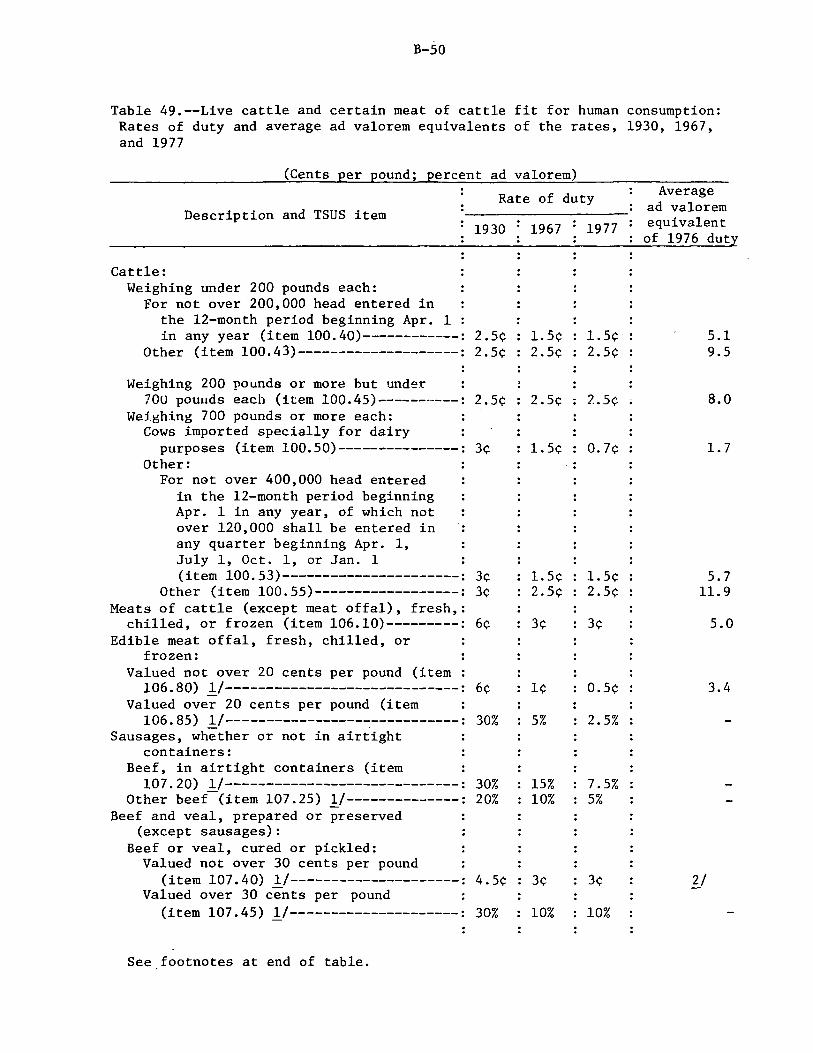
49. Live cattle and certain meat of cattle fit for human consumption: Rates of duty and average ad valorem equivalents of the rates, 1930, 1967, and 1977---------- B-50
SUMMARY
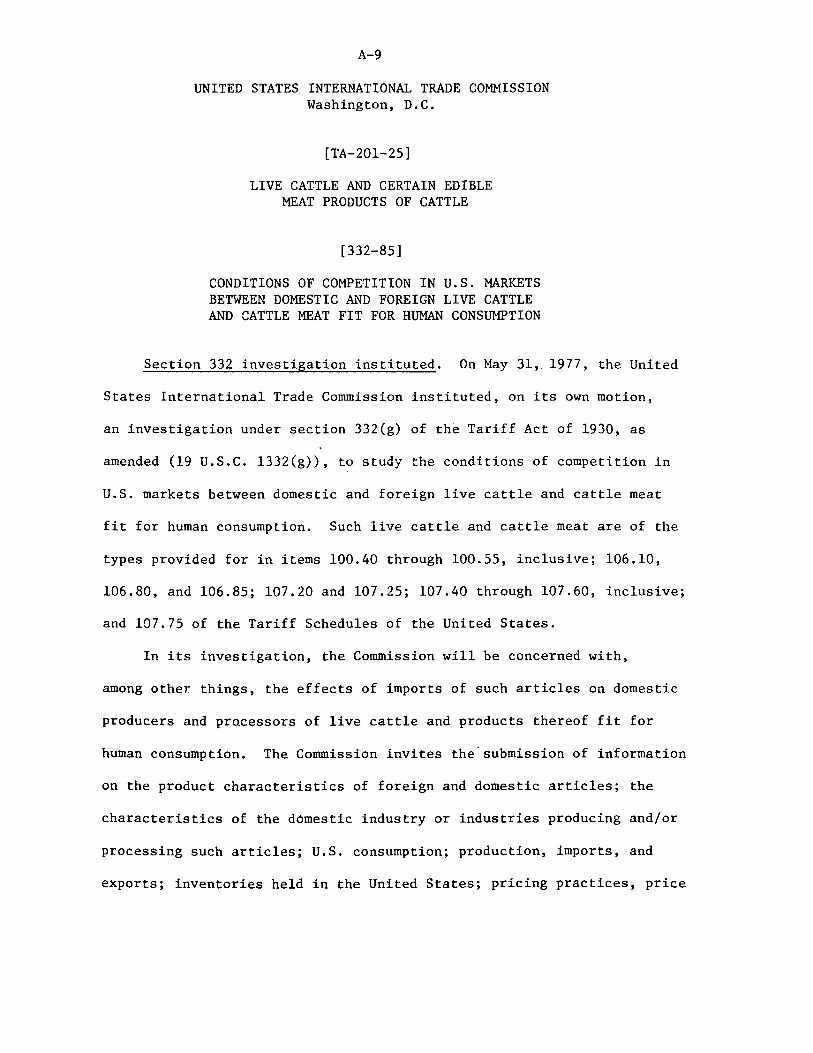
On May 31, 1977, the U.. S. International Trade Commission'·on its
own motion, instituted an investigation (investigation No. 332-85)
to study the conditions of competition in U.S. markets between domestic
and foreign live cattle and meat of cattle fit for human consumption.
The institution of this investigation followed requests from several
members of Congress that the then existing investigation No. TA-201-25
be broadened so as to permit parties interested in legislative relief
from imported cattle and meat of cattle to appear and be heard pursuant
to the provisions of section 332 of the Tariff Act of 1930, as amended. !J
The Commission's previous report on "Beef and Beef Products " (TC Publication
128) was issued in June of 1964, prior to the passage of the so-called
Meat Import Act of 1964 (Public Law 88-482). This report contains data
developed on live cattle and meat of cattle_since the last report was issued.
In the late 1960's and early 1970's the growing U.S. demand for
beef, reflected in rising cattle prices, was conducive to expansion of
the national herd; pasture was abundant and supplies of feed grain, at
favorable prices, were ample. Cattlemen were optimistic and the indus-
try producing beef and veal (the cow-calf operations, the feedlot opera-
tors, and the slaughterers and processors), for which U.S. consumers cur-
rently expend some $20 billion to $30 billion annually, was prosperous.
Consumer incomes were increasing and consumption of beef continually rose,
despite rising prices and competition from other meats, fish, and poultry.
By 1973, average cattle prices received by farmers had reached record
levels of 43 cents per pound (100 percent of parity). In that year,
1/ On Sept. 17, 1977, the Commission (Chairman Minchew not participating) reported to the President that the imports subject to investigation No. TA-201-25 were not a substantial cause of serious injury, or the threat thereof, to the domestic industry within the meaning of section 201 of the Trade Act of 1974 (USITC Publication No. 834).
ix
however, per capita consumption of beef declined about 5 percent. In
the fourth quarter of the year cattle prices fell, and, for the most
part, they have not recovered as the overproduction of beef has continued.
In the first three quarters of 1977, cattle prices averaged 34 cents per
pound, about 59 percent of parity.
Notwithstanding the fall in cattle prices in late 1973, cattlemen
continued herd expansion. By January 1, 1975, the number of cattle on
the Nation's 1.8 million cattle farms and ranches was at a record level
of 132 million head. During that year, the effects of the increased
costs of production that had been burdening U.S. cattlemen since the
late 1960's, but well contained through late 1973, were exacting their
toll and causing great distress among cattle producers. 1/ The prices
received for cattle after the price-fall of 1973 were only 50 percent
higher than those received at the outset of the period of herd expansion;
the cost of production such as feed, labor, and land, had nearly doubled,
however, and those costs generally did not subside. Herd liquidation began
to increase at an accelerating rate in 1975.
In 1976 the slaughter of cattle (49 million head) and the resulting
production of beef and veal (27 billion pounds in carcass-weight equiva-
lent) reached an alltime high. These high levels of production have
continued into 1977. The recent declines in feed grain prices and the
indicated decline in cattle numbers appear to be reinforcing the con-
fidence of feedlot operaters and thus upward pressure is being exerted
on feeder cattle prices which were up about 5 cents per pound in early
ll During the investigation, many cattlemen reported losses on their operations. A number of factors have kept them in business; these include rising land values, coupled with increased borrowing power, income from farm operations other than cattle, and, in some cases, minimal cash outlays.
x
November 1977 from· a year· ago. These events could prolong
the U.S. overproduction of beef. As production of beef has increased,
adding to the already large supplies of pork and poultry, fed cattle
prices have remained low, although they were up several cents a pound in
November. 1/
During this period of herd liquidation the financial position of
the meatpackers appeared generally stable, as measured against the
longrun experience of the industry. Meatpackers apparently have offset
some of their increased costs through lower prices paid for cattle and
increased productivity; thus, they have managed a sustained level of
profits. As measured by the farm-retail price spread, the farmers'
share of the 1976 retail beef prices declined by about 8 percentage
points from the average prevailing in the 1967-75 period. In 1976
the farmers' share was 56 percent.
Virtually all parties to the investigation agreed that cattlemen
have been in financial difficulty in recent years as costs have increased,
herds have been liquidated, and beef and veal have been in oversupply.
Some cattlemen contended that imports of beef and veal and of live
cattle were primarily responsible for the distressed conditions of
cattle growers and pointed out that in 1976 imports were at a near
record high while production was at a record level; hence, the imports
were having a price-depressing effect. Other cattlemen stated their
belief that imports were not an important cause of their difficulties
and that overproduction and increasing costs were the principal factors
causing the problems of the industry. 1/ After 1973, consumption of beef continued its long-term increase, owing,
in part, to a moderate decline in retail prices. In 1976, per ~apita consumption of beef averaged 129 pounds, a record high.
xi
For a number of years, U.S. imports of live cattle have been equiva-
lent to less than 1 percent of the U.S. available supply. Imported feeder
calves (largely from Mexico) become products of the United States in
a sense, inasmuch as the bulk of their slaughter weight is added in
this country. Imports from Canada, the other important source, have
been feeder cattle," dairy cattle, and, more recently, slaughter calves
and cows.
Beginning January 1, 1965, U.S. imports of fresh, chilled, or
frozen beef have been subject to the Meat Import Act. Accordingly, about
80 to 90 percent of the imports of meat of cattle have been subject to the
provisio.ns of the act. The remainder of the imports, mostly canned
corned beef (a product not produced commercially in the United States),
or frozen, cooked beef of South American origin, and imports of live
cattle are not subject to the provisions of the act. Imports of beef and
veal, about 1.6 billion to 2.0 billion pounds in recent years, mostly
boneless beef from Australia and New Zealand, have been equivalent to about
7 percent of consumption; before the Meat Import Act went into effect,
imports had been equivalent to about 9 percent of consumption .. 1/ Pro""'
duction of beef and veal was about 6 billion pounds greater in 1976 than
in 1967; imports, in contrast, were 700 million pounds greater.
Under the provisions of the act, imports may increase, or decrease,
in accordance with changes in domestic production. In most years since
the Meat Import Act has been in effect, the President, acting under the
authority of section 204 of the Agricultural Act of 1956, has had the
Secretary of State negotiate bilateral agreements with countries supplying
l/ U.S. exports of live cattle and of beef and veal havenot exceeded $225 million in recent years or have accounted for less than 1 percent of the respective production; however, exports of beef and veal offal and packinghouse byproducts have been valued at about $650. million to $S50 million in recent years.
xii
fresh, chilled,or frozen beef and veal to the United States so that
their U.S. exports would be at or below the levels which would trigger
quotas under the act. For practical purposes, therefore, the bilateral
agreements, working as an adjunct to the Meat Import Act, have restrained
imports of beef and veal so that such imports have not changed significantly
relative to U.S. production and consumption since the act went into effect.
In this connection, the Department of Agriculture estimates that imports
of beef and veal in recent years would have been about 25 percent larger
in the absence of the restraints that existed.
Most of the beef and veal imported into the United States is of a
quality and type used for manufacturing, principally for making ground beef,
including hamburger. !/ Much evidence submitted during the investigation
suggested that the demand for hamburger in the United States is strong and
has been growing for a number of years. Hamburger is produced largely'
from the meat from cull cows and bulls (the type of beef with which the
bulk of the imports compete) and the tr5mmings from fed cattle. U.S.
prices of cull cows, like those of all cattle, have declined in recent
years. However, as steer prices declined from 1975 to 1976, cull cow
prices rose. This firmness of cow prices obviously reflects the growing
demand for beef for hamburger. The firm cow prices have persisted
despite increased supplies resulting from herd culling and liquidation
and imports of manufacturing type. beef. Imports appear to have composed
about 18 percent of the U.S. supply of beef used for manufacturing in
1975 and 1976. Indeed, at the hearings on this investigation,
}:./ Hamburger is ground beef to which beef fat may be added; in this report the terms are used interchangeably.
xiii
much virtually undisputed information was presented that the imported
lean beef is often mixed with trimmings from domestic fed cattle and
the fat from such cattle, which otherwise would be used as tallow. In
this use, the value of the domestic trimmings is enhanced to the extent
they are mixed with the imports for the production of ground beef instead
of being used as tallow.
Several members of Congress requested the Commission to address
itself in the course of this investigation to specific legislative
changes which may be needed, and to administrative actions which may
be justified, in arriving at solutions of the beef import problem. A
number of suggestions applicable to various aspects of the beef import
problem were received from interested parties; these were directed
primarily towards the modification of the Meat Import Act of 1964 and the
adoption of more stringent sanitary and health as well as labeling
regulations. These and other recommendations are briefly discussed in
the paragraphs that follow as well in considerable detail in the body
of the report.
Many views were expressed concerning the existing regulations on
imports of live cattle and meat. Those most frequently echoed by the
domestic interests concerned modifying the Meat Import Act and a
tightening of the U.S. health and sanitary and labeling regulations
affecting imports of beef and veal. The advocates of modifying the
Meat Import Act contend that permissible imports under the act
should fluctuate inversely with domestic production rather than
directly as is currently the case. Contrary to the conditions that
existed in 1976, this system of countercyclical regulation would have
xiv
lowered imports at a time when production increased. On the other hand,
it would allow greater imports at a time when production decreased.
While a number of formulas for the operation of countercyclical regula
tions were presented during the investigation, no concensus was agreed
upon by the representatives of the cattlemen.
U.S. imports of beef and veal are permitted only from countries
which have meat inspection systems wlith standards that have been
certified by the U.S. Secretary of Agriculture as being at least
equal to U.S. Federal inspection standards. Officials of the Food
Safety and Quality Service (FSQS) of the U.S. Department of Agricul~
ture conduct periodic announced examinations of inspection pro-
cedures and plants in foreign countries to assure that comparable standards
are being enforced. During this investigation, many cattlemen and con
sumer groups called for foreign produced meat to be exported to the
United States to be subjected to the same rigorous health and sanitary
requirements that are applicable to domestically produced meat.
With respect to labeling, some cattle producers contend that the
containers in which meat is currently imported are required by Federal
regulations to be labeled to show country of origin, but that after entry,
most of the imports are removed from the original containers and ground
with domestic beef to make hamburger. Hence, the imported beef loses
its identity and the ultimate consumer does not know whether the ham
burger purchased at retail contains imported beef. It is also contended
that consumers have a right to this information and that the labeling
regulations should be changed so as to require imported meat to be
labeled through all channels of distribution, including the retail level.
xv
During the investigation, a number of import interests indicated
that they prefer to eliminate all restrictions on imports of beef
and veal. Second to that, they would like no changes in the existing
Meat Import Act. Spokesmen for the importers contend th~t some of the
processed beef and veal products not presently covered by the Meat
Import Act are either not produced or not produced in sigificant com
mercial quantities in the United States. Some submitted that the
Commission's report on this investigation should only expound the facts
and that under the statute (19 U.S.C. 1332(g)) the Commission is neither
directed nor empowered to make policy recommendations to improve the
position of domestic industries.
With regard to the countercyclical proposals presented--some of which
involved limiting imports on a quarterly basis--importers expressed their
view that such proposals would be unworkable because they would create a
situation whereby the foreign source could not react to the demands of
the U.S. market in an orderly fashion. During the investigation, importers
testified that any quota formulation that would not allow for the partici
pation of imports in an expanded U.S. market would be patently unfair.
The import interests testified that imports of beef and ·veal already
comply with U.S. health, sanitary, and labeling laws and regulations.
They point out that imported beef and veal is subject to mandatory health
and inspection requirements which they allege are at least equal to
those imposed upon meat produced in the United States; these requirements
are imposed by the "Wholesome Meat Act" (21 U.S.C. 601, et seq.). In
connection therewith, the import interests pointed out that U.S. officials
are permanently stationed abroad, and they regularly visit and approve
the plants which ship meat to the United States--a prerequisite under
xvi
U.S. law. Also, details of this inspection program are regularly
reported to Congress. Further, the imported meat is screened to detect
residues of substances such as pesticides and hormones in the exporting
countries as well as at U.S. ports of entry. If these residues should
exceed allowable limits, such imports are not permitted entry into the
United States.
With regard to labeling, the importers contend that the domestic
interests have implied throughout the investigation that meat products
alone enjoy an exemption from being labeled that is not enjoyed by other
products. The importers pointed out that the containers of imported
beef are labeled with country of origin, pursuant to statutory require
ments (19 U.S.C. 1304). Under the law, the importers point
out, the "ultimate purchaser" is the manufacturer who uses the beef
for making products such as hamburger and not the housewife who buys
hamburger at retail. Imported beef is essentially a raw material used for
manufacturing, such as any other raw material which is transformed into a
new and different article before reaching the retail purchaser. The
importers assert that labeling requirements have long been a favorite
proposal of those trying to devise obstructions to import trade; such
attempts, when made at the State level, have been struck down by
Federal district courts as unconstitutional impairments to trade. Also,
bills attempting to impose a Federal repackaging law were vetoed in 1960
and in 1963. When these bi"lls were vetoed by the President, it was
pointed out that such legislation would raise new barriers to foreign
trade, invite retaliation, and impose added costs upon U.S. manufacturers
and consumers.
INTRODUCTION
On March 17, 1977, the National Association of American Meat Promoters, the
Meat Promoters of South Dakota, the Meat Promoters of North Dakota, the Meat
Promoters of Montana, and the Meat Promoters of Wyoming, filed a petition with
the United States International Trade Commission seeking relief from imports
under the provisions of section 20l(a)(l) of the Trade Act of 1974 for an investi-
gation to determine whether live cattle and certain meat products of cattle fit
for human consumption are being imported into the United States in such increased
quantities as to be a substantial cause of serious injury, or the threat thereof,
to the domestic industry producing articles like or directly competitive with the
imported articles. The Commission instituted investigation No. TA-201-25 on this
matter on March 26, 1977. 1/ Copies of the Commission's notices of investigation
and date of public hearings are presented in appendix A.
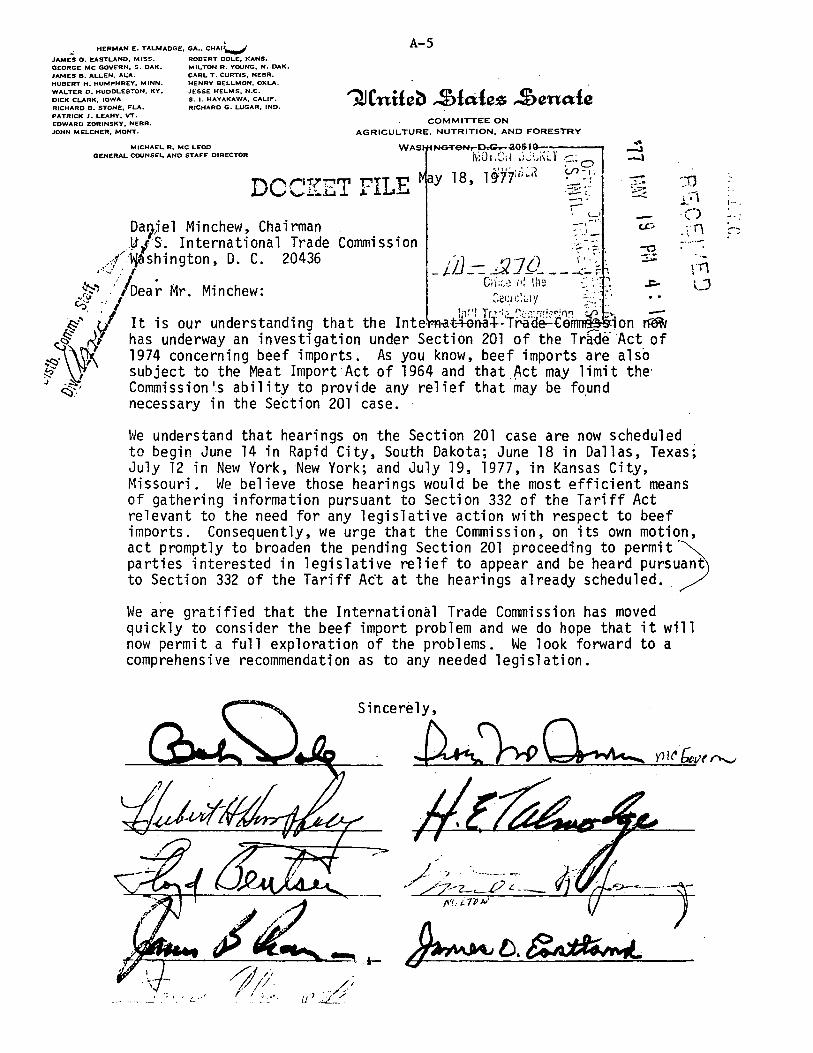
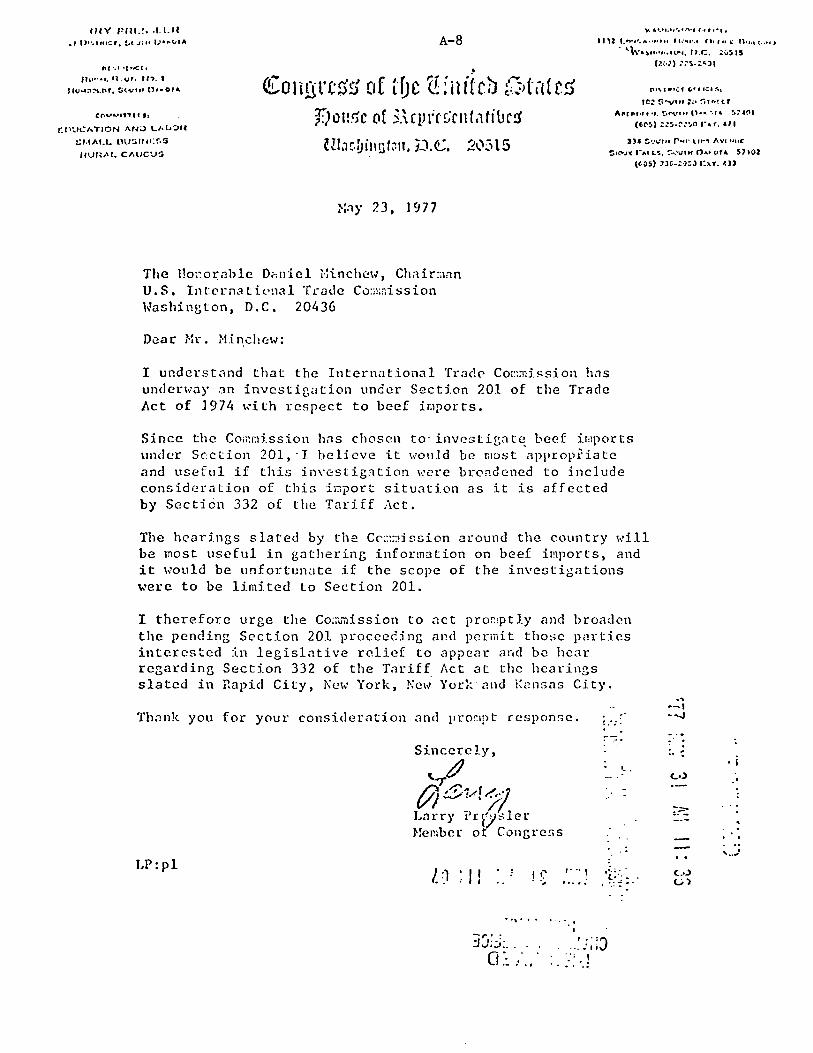
Subsequent to the institution of investigation No. TA-201-25, the Commission
received from several member of Congress written request, co~ies of which are
contained in appendix A, to broaden the investigation so as to permit parties
interested in legislative relief to appear and be heard pursuant to the provisions
of section 332 of the Tariff Act of 1930, as amended. In accordance therewith, the
Commission, on its own motion, instituted this investigation (No. 332~85) on May
31, 1977, to study the conditions of competition in U.S. markets between domestic
and foreign live cattle and cattle meat fit for human consumption. The same items
in the TSUS are included in both of the investigations. Copies of the Commission's
notices of investigation and dates of public hearings for investigation No. 332-85
are also presented in appendix A. The first four of the hearings were held in
Rapid City, S. Dak., on June 14 and 15, 1977; Fort·Worth, Tex., on June 28 anci 29,
");/ The live cattle and certain ·meat :i,:>roducts· of cattle.! ~hich are the subjects. of the investigation, are provided for in items 100.40 ·through 100,55, j.nclusive; 106.10, 106,80~ and 106,85; 107!20 and 107.25i 107.40.through 107.60, inclusive; and 107.75 of the Tariff Schedules of the United States (TSUS)~
1
2
1977; New York, N. Y., on July 12, 1977; and Kansas City, Mo., on July 19 and.20,
1977, in conjunction with investigation No. TA-201-25. 1/ The 5th of the hearings,
which concerned investigation No. 332-85 only, was held in Washington, D.C., on
September 20 through 22, 1977.
1_/ On the basis of investigation No. TA-201-25, the Commission (Chairman Minchew not participating) reported to the President on September 17, 1977, that the live cattle and meat products of cattle subject to the investigation were not being imported into the United States in such increased quantities as to be a substantial cause of serious injury, or the threat thereof, to the domestic industry producing articles like or directly competitive with the imported articles within the meaning of section 201 of· the Trade Act of 1974 (USITC Publication 834).
3
DESCRIPTION AND USES
This investigation covers all live cattle, except the types gener-
ally imported free of duty (e.g., purebred cattle for breeding).
Also included in the investigation is all meat of cattle fit for human
consumption (including meat offal) whether fresh, chilled, or frozen, or
prepared or preserved; 1/ beef extract is not included.
Live Cattle
In general usage, the term cattle refers to mature animals; the pro-
visions for cattle in the TSUS (items 100.40 through 100.55) apply to all
such animals regardless of age, sex, or size. Cattle are raised and
maintained in the United States for the production of meat and milk.
Beef cattle, which compose about 86 percent of the national herd
traditionally have been short legged, thick bodied, and blocky. In recent
years, however, beef cattle have been bred to be more heavily muscled,
leaner, longer legged, and longer bodied. Such cattle tend to yield a
higher percentage of high-value meat cuts such as roasts and steaks.
Beef cattle are grown and bred for the production of calves by so-called
cow-calf farmers and ranchers. The calves produced by such cattlemen
are generally regarded as the crop harvested from the herd. '.!:._/ A beef
cow will sometimes produce as many as 10 calves during her life span.
In contrast to beef cattle, dairy cattle are angular in conformation
and have less flesh. Dairy cattle, which constitute about 14 percent
1/ The terms "fresh, chilled, or frozen" and "prepared or preserved" are defined in headnote 1, to subpart B of part 2 to schedule i of the TSUS.
'.!:_/ Cow-calf operators generally keep 1 bull for each 20 to 30 cows.
4
of the national herd, are grown and bred for the production of milk.
Most of the female calves from the dairy herd are raised for replacement
stock. Most male calves and some of·the less desirable female calves
are sold for veal, although there has been an increase in recent years
in fattening dairy-type steers (castrated males).
A few of the calves from beef cattle herds are slaughtered for
veal when they weigh 180 to 250 pounds; veal calves are primarily milk
fed. Some bull and some heifer calves are kept for herd replacements.
Most bull calves are castrated, and such steers, as well as heifers
not kept for herd replacements, are eventually shipped to the feedlots
for several months of intensive feeding and finishing on grain,
primarily corn, before they are slaughtered. These animals, when
initially placed in the feedlots, weigh 500 to 700 pounds and are
generally called "feeders." When they are ready for slaughter, at
weights generally averaging from 1,000 to 1,200 pounds, they are called
"fed cattle." Sometimes, particularly when feed costs are abnormally
high, feeder cattle are grown-out on grass or a combination of grass,
other roughages, and limited amounts of grain before slaughtering.
Such cattle are often called "nonfed cattle." In recent years, about
60 percent of the cattle slaughtered in the United States have consisted
of fed cattle, 25 percent have consisted of culled dairy and beef cows
and bulls,and 15 percent have consisted of nonfed steers and heifers.
Virtually all of the imported live cattle come from Canada and
Mexico. Transportation costs and animal health regulations generally
limit Mexico and Canada as being the only practical U.S. sources of
5
supply of live cattle. 1/ The cattle from Canada are mostly cows and
calves for iilllllediate slaughter, cows for dairy purposes, and feeder
cattle. Those from Mexico are mostly lean and lanky feeder cattle that
weigh about 400 pounds. They are ultimately fed and finished in the
United States to weights of about 1,000 pounds before slaughter.
Meat of Cattle
Beef that is ready for cooking and consumption without further
processing is often referred to as "table beef.~· Table beef~ which
consists of cuts of meat such as steaks and roasts commonly found in
grocery stores, constitutes a large part of the beef consumed
in the United States. Veal, the meat of calves, also is consumed
mostly in the form of; table cuts. The table beef consumed in the
United States is primarily from domestic grain-fed steers and heifers,
although a large part of the meat from the nonfed cattle is also
used as table beef. Beef sold for table use is generally graded
Choice, or better, by the U.S. Department of Agriculture. ];_/
17 The quanmtine and sanitary regulations administered by the U.S. Department of Agriculture prohibit, for example, all imports of cattle and fresh beef, veal, and beef products from countries not declared to be free of rinderpest and foot~and-mouth diseases. Because many of the important meat-producing countries of South America have not been desig-nated as free of such diseases, meat imports from those countries are limited to cooked, canned, or cured meats. In view of such regulations, cattle and fresh beef and veal can come only from Australia, New Zealand, Central America, North America, and small areas of Europe and Asia.
2/ The official USDA grades for cattle and for beef (in descending suitability for table use) are Prime, Choice, Good, Standard, Commercial, Utility, Cutter, and Canner. In February 1976, revisions in the USDA beef carcass grading standards became effective. The most significant revision reduced the intramuscular fat content (marbling) required for a carcass to be graded "Choice." This change increased slightly the share of the carcasses graded "Choice" and reduced somewhat the share of carcasses graded "Good," the next lower grade.
6
Beef and veal to be further processed (ground, chopped, diced,
cooked, or canned, etc) .so as to alter the taste, consistency, or
appearance of the meat, or to preserve the meat in some fashion (other
than by chilling or freezing), is generally called "meat for manufac
turing." At the hearings on this investigation, much testimony was presented
that the use of beef for manufacturing in the United States is increasing
rapidly, particularly for making ground beef, including hamburger.
Manufacturing beef is primarily from cull dairy and beef cows, as
indicated above, and the trinnnings from fed and nonf ed steers and
heifers as well as some meat from nonfed steers and heifers. The
quantities of beef used for the various types of manufacturing depend
upon a number of factors including the price for manufactured meat
products and the availability of meat for manufacturing.
In the United States, manufacturing beef is usually made into
foods such as sausages, and prepared and preserved into food products
such as ground beef and hamburger (by far the largest of these products
in volume), beef stew, corned beef, and beef used in precooked dinners
and soups. Beef sausages (TSUS items 107.20 and 107.25) include
cornrninuted seasoned products frequently put in casings, such as frank
furters, bologna, salami, and pepperoni. The imported sausages are
generally more highly seasoned and higher in price than the domestic
sausages.
7
Cured or pickled beef (TSUS items 107.40 and 107.45) is not a
major article of commerce. Corned beef, which is prepared and seasoned
in a salt brine, is produced in substantial quantities in the United
States. The imported product, called canned corned beef (TSUS item
107.48) is a chopped, canned meat that is produced in the United States
only for military purposes under Government contract; such U.S.
produced beef is not marketed commercially. In the United States,
the imported product is commonly used in making corned beef hash, but
it is sometimes also chilled and sliced for making sandwiches. TSUS
item 107.52 provides for canned beef, other than corned beef, such as
canned, cooked beef and gravy. U.S. production and imports of such
products are small. The domestic product, which is not chopped or
canned, is the beef commonly used in corned beef sandwiches.
TSUS items 107.55, 107.60, and. 107,75 cover other prepared or preserved
beef products included in this investigation such as ground beef, stew
beef, cooked beef used in precooked dinners and soups,and mixtures
principally of beef and other meats. Most of the imports consist of
frozen cooked beef, which is produced in notable quantities in the
United States. In 1976, however, some of the imports consisted of
frozen beef that normally would have been classifiable in TSUS item
106.10 and subject to the provisions of the Meat Import Act,
except for the fact that it had been cubed in the free-trade zone
of Mayaguez, Puerto Rico.
8
Beef and veal offal (brains, hearts, kidneys, livers, tongues, and
the like),,TSUS items 106.80 and 106.85, are also covered by this investi
gation. Off al are both cooked and consumed in the form in which they
are removed from the carcass and are used as well for manufacturing.
Imports of offal consist mostly of calves' livers. Offal have been one
of the major exports of the livestock and meat segment of the U.S.
economy for the past two decades.
About 7 percent of the beef and veal consumed in the United
States is imported. Most of the imported beef is in the
fresh, chilled,.or frozen condition (TSUS.item 106.10) and.is used for
manufacturing. 1./ The bulk of the remainder of the imports consi.sts
of canned corned beef and cooked frozen beef; imports of beef sausages
and offal are small.
The imported beef used for manufacturing is mostly boneless beef.
At the hearings on this investigation a number of witnesses testified
that the imported beef was frozen, rather than fresh or chilled, and
thereby less subject to bacterial development ]:_/ than the domestic
(mostly fresh) beef; also, the imported, frozen beef rapidly chills the
fresh (unfrozen) domestic meat when the two are mixed for uses such as
making hamburger, ·thus slowing the growth of bacteria. Some contended
1/ A study issued by the Commission in 1971 concerning the uses of imported beef showed that in the period 1969-70 about 8 percent of the U.S. imports of beef and veal, classifiable in item 106.10 of the TSUS, was used as table beef and 92 percent was used for manufacturing; the uses of imported beef and veal during that period generally paralleled those in 1963, as reported by the Commission in 1964 (TC Publication 128).
]:_/ Salmonella in meat, as well as in other foods, has become a problem of health concern in the United States.
9
that the imported product was more uniform with regard to leanness.
Because of its lean content, domesti.c p.cocessors· often mix the fat
trimmings from domestic beef with imported beef and thereby lower
their costs of production by utilizing larger quantities of less
expensive domestic trimmings in their production of hamburger.
10
U.S. CONSUMPTION
Beef and veal combined· account for about half of the red meat, fish,
and poultry consumed in the United States; about 97 percent of the con-
sumption of beef and veal consists of beef. In 1976, U.S. consumers
spent about $30 billion for beef and veal, equivalent as in most recent
years to about 60 percent of their expenditures for red meats and about
20 percent of their total expenditures for food, For practical purposes,
consumption of beef and veal reflects consumption of live cattle, and
therefore, this discussion is limited to beef and veal.
Total and Per Capita Consumption
Annual civilian consumption of beef, which has risen rapidly in
the past several decades, reached an alltime high of 27.4 billion
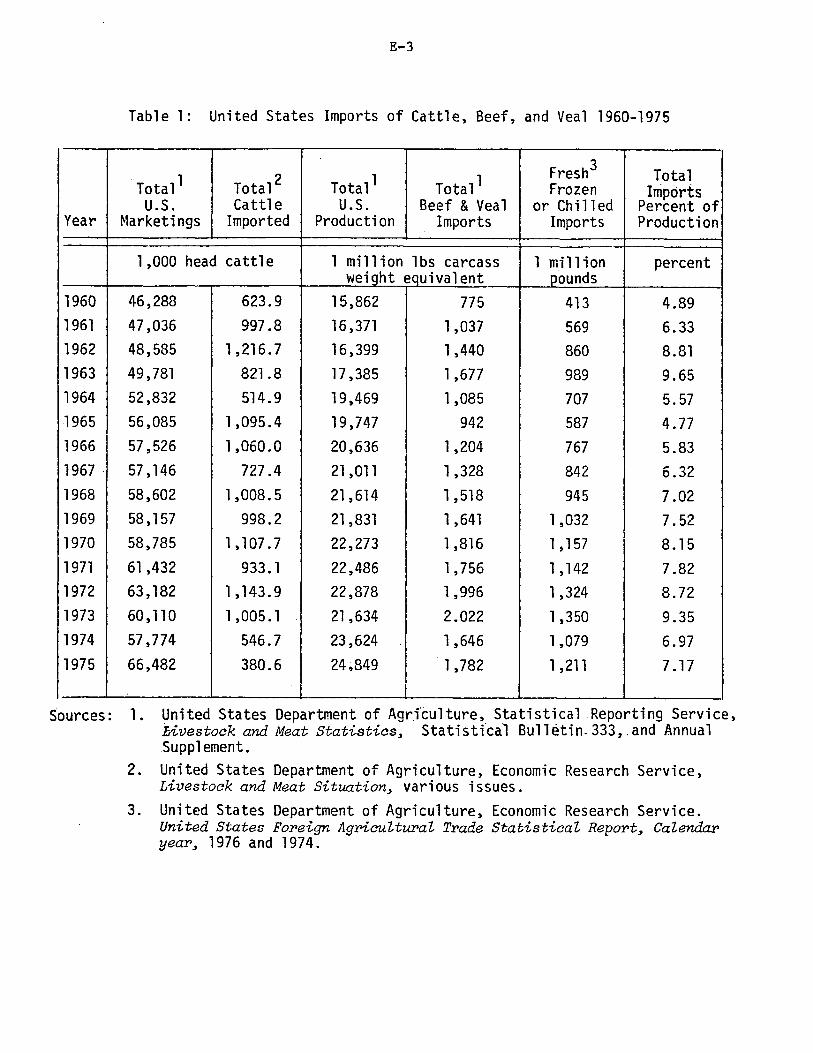
pounds in 1976 (table 1, app, B), During the past decade, per capita
consumption of beef has generally followed the trend set by aggregate
consumption; in 1976, per capita consumption of beef reached a high of
about 129 pounds. For a number of years, the rise in beef consumption
was uninterrupted, except for a 5-percent decline in 1973. In that
year, cattle prices reached the then record levels; cattlemen held
back cattle for herd expansion, 1/ retail beef prices rose about
20 percent, and consumers boycotted beef. Although the effects of these
factors on consumption of beef cannot be individually appraised, many or
all of them undoubtedly had a bearing on the decline that occurred in
the consumption of beef as well as of other meats, fish, and poultry
in 1973.
1/ The price controls applicable to beef for about 6 months of the year under the Economic Stabilization Program are discussed in the section of this report on U.S. production,
11
The·consumption of veal in the United States has always been much
smaller than the consumption of beef, and retail prices of veal have been
higher than those of beef. Unlike beef, however, the consumption of veal
has trended downward over the long term, notwithstanding an increase in
1974-76--the years in which cattlemen marketed young calves for slaugh-
ter in response to sluggish cattle prices. The long-term decline in
the consumption of veal reflects, in part, the growing practice of
cattlemen to raise calves to maturity and hence maximize profits,
rather than to market them for slaughter as veal.
Factors Affecting Consumption
For a number of years, .U.S. consumers have demonstrated a strong
preference for beef over other meats. In addition to the increase in
population, factors such as rising consumer incomes, changing food
habits and tastes, preferences for convenience foods, increased fre-
quency of "eating out," improvements in the quality of the product, and
aggressive marketing have contributed to the rise in consumption of
beef. Also, the food stamp program of the Department of Agriculture
and direct purchases of beef by the Department for school lunch and
needy-family programs have boosted beef consumption. !/
!/ During the past decade, except in 1973, purchases of beef (mostly frozen ground beef, but in some years canned beef and more recently frozen beef roasts and frozen beef patties) by the U.S. Department of Agriculture, mostly under the National School Lunch Act~ ranged from 42 million pounds (1967 and 1968) to 200 million pounds (1977); the Department of Agriculture did not purchase any beef in 1973, This subject is discussed in further detail in the section of this report entitled "Provisions of Existing Law that May Provi.de Opportunities of Relief to Cattlemen."
12
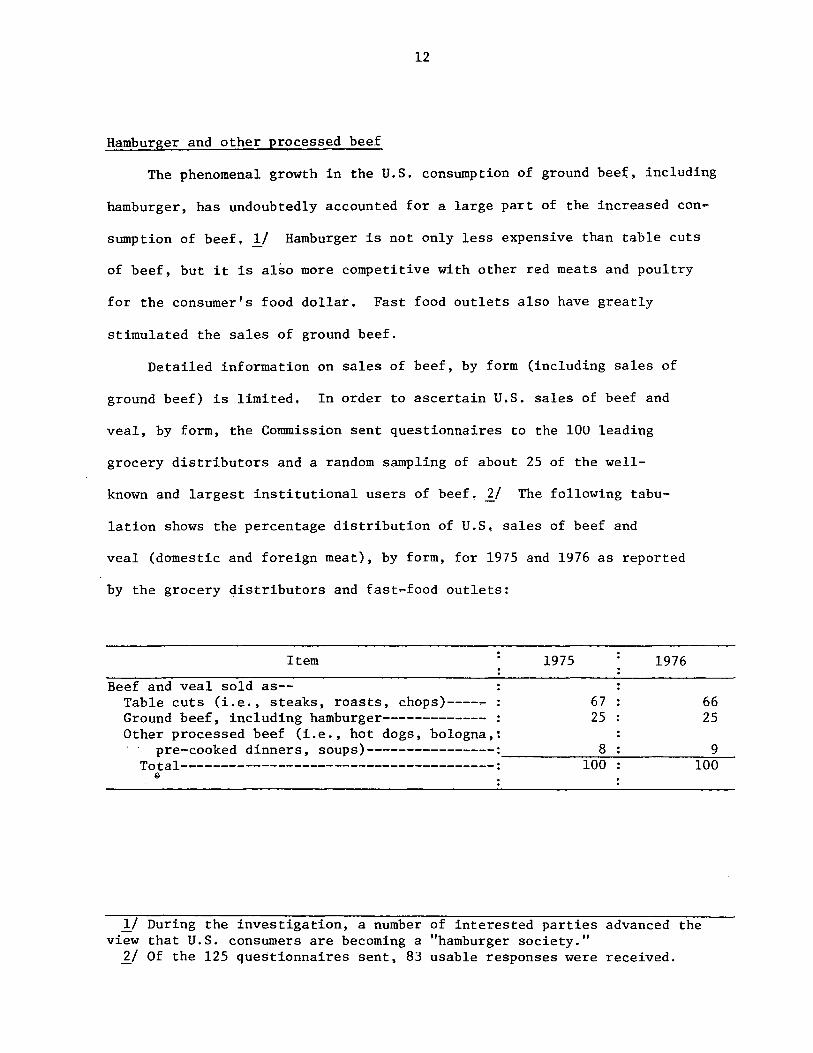
Hamburger and other processed beef
The phenomenal growth in the U.S. consumption of ground bee~. including
hamburger, has undoubtedly accounted for a large part of the increased con~
sumption of beef, 1/ Hamburger is not only less expensive than table cuts
of beef, but it is also more competitive with other red meats and poultry
for the consumer's food dollar. Fast food outlets also have greatly
stimulated the sales of ground beef.
Detailed information on sales of beef, by form (including sales of
ground beef) is limited. In order to ascertain U.S. sales of beef and
veal, by form, the Connnission sent questionnaires to the 100 leading
grocery distributors and a random sampling of about 25 of the well-
known and largest institutional users of beef. ±_/ The following tabu-
lation shows the percentage distribution of U.S, sales of beef and
veal (domestic and foreign meat), by form, for 1975 and 1976 as reported
by the grocery distributors and fast-food outlets:
Item
Beef and veal sold as--Table cuts (i.e., steaks, roasts, chops)----Ground beef, including hamburger------------Other processed beef (i.e., hot dogs, bologna,:
1/ During the investigation, a number of interested parties advanced the view that U.S. constnners are becoming a "hamburger society."
]:_/ Of the 125 questionnaires sent, 83 usable responses were received.
13
The respondents that supplied the data on which the above information
was based sold 3.3 billion pounds of beef and veal in 1975 and 3,6 billion
pounds in 1976 (about 18 percent of the total U.S. sales in each year).
Some of the respondents reported that they did not know whether the
beef they sold was of domestic or foreign origin, Of those that knew
the origin of the beef they sold, only a few reported that the imported
beef they sold was for table cuts (less than 6 percent of imports),
but rather it was ground beef or other processed beef. Of the U,S,-.
produced beef and veal sold by the respondents in 1975, 69 percent
of the total consisted of table cuts and 31 percent was used for manu-
facturing (ground beef and other processed foods), In 1976, 68 per-
cent was table cuts and 32 percent was for manufacturing. Based on
these data, about 18 percent of the beef and veal used for manufac-·
turing in 1975 and 1976'"was imported.
Competing meats, fish, and poultry
Nothwithstanding the strong preference of U.S. consumers for beef,
the competition between beef, other red meats, fish, and poultry for
the consumer's expenditures for food has been strong, For example,
when per capita consumption of all meat, fish, and poultry declined by
15 pounds from 1972 to 1973 as prices rose, beef consumption dropped by
about 6 pounds and pc:irk consumption dropped 5 pc:iunds.. Consumption of poultry
the other major meat expe~iencing long-term consumption growth comparable
with that of beef, declined only 2 pounds reflecting, in part, a pro-
portionately smaller rise in poultry prices than in red meat prices~ l./
l/ Cattle, hogs~ and poultry (chickens and turkeys) supply about 90 percent of the U.S. annual consumption of red meat, fish, and poultry, Over the 14 year period, 1963-76, the share of annual consumption of all meats supplied by poultry increased from 17 percent to 20 percent; the share of consumption of all meats supplied by beef and veal increased from 46 percent to 51 percent,
14
Poultry are far more economical in the conversion of feed grains into meat
than are cattle and hogs. l/ This phenomenon is largely reflected in the fact
that retail prices of frying chickens have been less than half that of beef and
pork in recent years, as shown in table 2.
The role of imports
Annual U,S. imports of beef and veal have not varied greatly since the
late 1960's. Since 1967, they have ranged between 1.3 billion and 2,0 billion
pounds annually (table 3) and supplied from 6 to 9 percent of domestic con-
sumption of all beef and veal, Inasmuch as the imports of beef move largely
into manufacturing in the United States, imports compete primarily with the
meat for cull cows and bulls which are the primary domestic sources of such
meat. Nonetheless, as the demand for meat for manufacturing has expanded
over the years--as evidenced largely by the growing demand for hamburger
--prices for cull cows have held more firmly than have those for fed steers.
In addition, the imported lean beef is often mixed with the fat trimmings
from domestic fed cattle, thus enhancing the value of the trimmings from
domestic sources.
Disposable income ..
Rising disposable personal income has been an important factor in the
increased demand for beef. Increased income may be spent in a number of
ways, and the percent of disposable income spent for beef is decreasing,
In 1976, a year of record high per capita beef consumption, the percent of
disposable income spent on beef declined 0.2 percentage points from the
previous year and that decline has continued into January-June 1977 (table 4).
1/ The feed conversion rate for poultry is about 2.1 pounds of feed grains per pound of meat, whereas the rate for cattle is about 10 to 1, and for hogs, 3.5 to 1.
15
This decline reflects the fact that suppl:i.es of beef have recently
increased and consumers have used more of the product, but because of
relatively weak retail beef prices, proportionately less of consumers'
incomes have been required for their pµ~chases. Herd liquidation has
caused this relatively weak pricing situation--a situation resulting
in consumer beef expenditures rising less rapidly than total income,
During the investigation, information was presented that if U,S. consumers
had spent an additional 0.2 percent of their disposable income for beef in
1976, and assuming no change in supplies and distribution costs, the addi-
tional consumer expenditures on beef would have added an extra $30 to the
price of every animal slaughtered or an additional $1,3 billion for the
U.S. cattle industry in that year, ]:./
Jj Guidelines, Cattle Economics Report, the American National Cattlemen~s Association and Cattle Fax, Denver, Colo,
16
U.S. INDUSTRY
Characteristics of the U.S. Industry
The production of beef and beef products may be divided into three
major categories: cow-calf operations, feedlot activities, and meat-
packing operations including both slaughtering and processing. Although
a single business enterprise may handle nearly all or various combi-
nations of the operations listed above, the individuals that grow the
live animals generally are not involved in the meatpacking operations.
The production of these three operations combined averaged about $25
billion in 1976.
Cow-calf operations
In 1976, some 1.8 million U.S. farms and ranches handled cattle,
compared with 2.2 million in 1967. Most of those farms and ranches
keep breeding herds for producing beef calves. Breeding herds are
often maintained on grass and receive little or no supplemental feed.
When the cows and bulls from such herds are slaughtered their carcasses
yield a lower grade of beef than the carcasses of grain fed animals. 1./
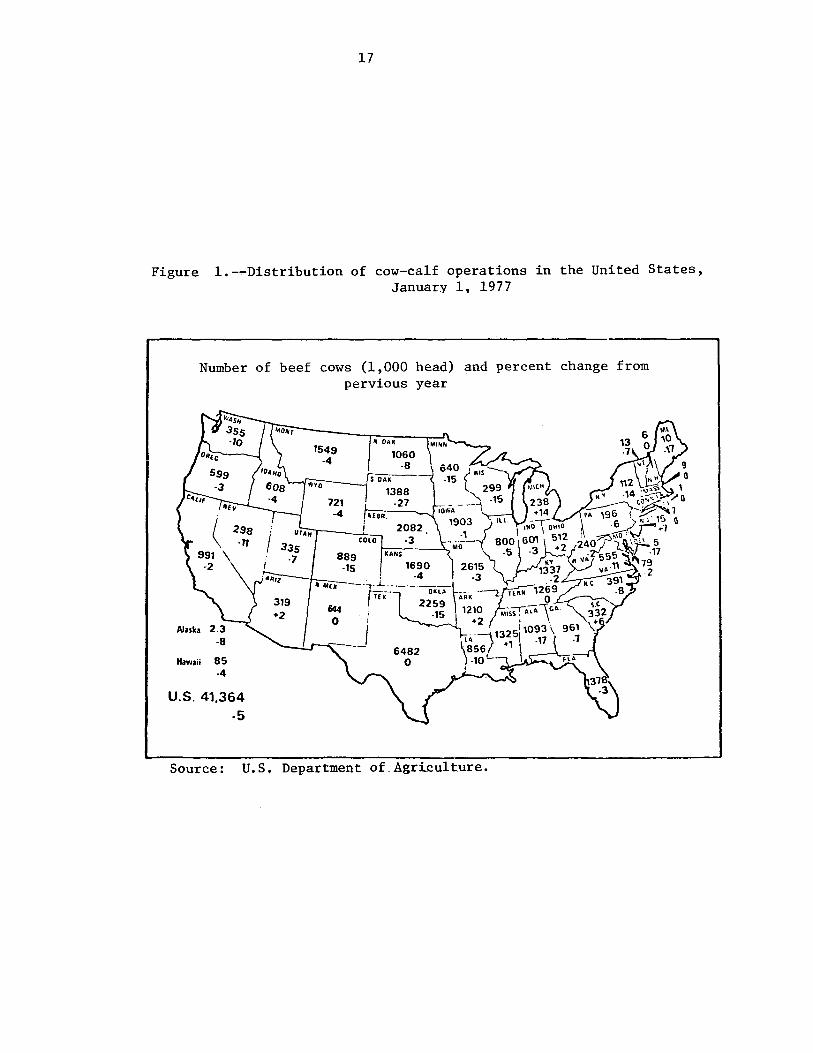
Cow-calf operations are located in all 50 States, but <111ost
are found in the western range lands]:/, the Corn Belt 1/, and the
Southeastern States 4/ (see fig. 1).
];_/ Purebred beef cattle, raised primarily to be bred with other cattle to maintain and improve the beef characteristics of the domestic herd, are also eventually slaughtered.
J:../ The range lands are located in 15 States: Arizona, California, Colorado, Idaho, Montana, Nevada, New Mexico, North Dakota, Oklahoma, Oregon, South Dakota, Texas, Utah, Washington, and Wyoming.
11 The following States compose the Corn Belt: Illinois, Indiana, Iowa, Kansas, Michigan, Minnesota, Missouri, Nebraska, Ohio, and Wisconsin.
!±_/ The Southeastern States include Alabama, Arkansas, Florida, Georgia, Kentucky, Louisiana, Mississippi, North Carolina, South Carolina, Tennessee, and Virginia.
17
Figure !.-.,...Distribution of cow-calf operations in the United States, January 1. 1977
Number of beef cows (1,000 head) and percent change from pervious year
Alaska
Hawaii 85 .4
U.S. 41.364 -5
1388 -27
, NEBR.
,r;;;,-~~_:_i_ 2082 COLO .J
889 KANS
1690
Source: U.S, Department of_Agri_culture.
18
Cow-calf operations are generally the most profitable agricultural
use for range lands, which characteristically are rough in topography and
have low rainfall, thus resulting in low levels of forage production.
The ranches, therefore, are usually large in area to compensate for the
lack of moisture and forage and may be 100,000 acres or more in size.
Although the typical cow-calf operation in the range lands often consists
of 150 to 300 cow-calf units, some operations reach several thousand
units. In 1977, about 45 percent of the U.S. beef-cow herd was located
in the rangelands, approximately the same percentage as in the early 1960's.
Cattle herds are generally smaller in the Corn Belt than in the
range lands; 50- to lOO~cow herds are common. Corn Belt farms are highly
productive and generally cover several hundred acres. One acre usually
can support a cow-calf unit. Beef production is frequently only one
part of a diversified farm operation which often includes growing grain,
primarily corn, and raising hogs. In 1977, about 28 percent of the U.S.
beef-cow herd was located in the Corn Belt, slightly less than in the
early 1960's.
Cow herds are relatively small in the Southeastern States; 50-cow
herds are typical, although there are also a few large herds. Rainfall
is higher than in the range lands and the growing season is longer than
in the Corn Belt, but the soil is less naturally fertile and forage
production is lower. In early 1977, about one-fourth of the U.S. beef
cow herd was located in the Southeastern States, compared with one~fifth
in the early 1960's. Improved grasslands have stimulated cattle farming
in this area. A substantial part of the calves produced in this area
are shipped to other areas, particularly Texas, for fattening.
19
Feedlot operations
Some 190,000 cattle feedlots were located in 23 major cattle-
feeding States in 1969; in 1976,there were 134,000 feedlots (table 5) • 1./
This decrease in the number of feedlots, in recent years, is due in large
measure to rapidly rising costs of operation, particularly costs of feed
grains, coupled with a downward trend in the market price of fed cattle.2/
A relatively few feedlots account for the bulk of the U.S. output
of fed cattle and their share of the total output has increased over the
years. Many of these feedlots are known to be part of large multi-establish-
ment enterprises that encompass other farming operations, manufacturing, 1and
trucking operations, as well as wholesale and retail activities. On the
other hand, many of the feedlot operations include both lar.ge and small
independent firms that concentrate primarily on cattle feeding. ]_/
About two-thirds of the cattle marketed in the United States in
1976 came from 2 percent of the country's feedlots. These feedlots--
with a capacity of 1,000 head or more--were mostly located in the areas
of large feed-grain production west of the Missouri River. !/ In 1976,
about 98 percent of the U.S. feedlots had an annual capacity of fewer
than 1,000 animals, and most of these were located east of the Missouri
River. In the United States, small-scale feedlots (fewer than 1,000
head each) are mostly owned and operated by individual farmers; such
farmers accounted for about a third of the fed cattle marketed in 1976.
1/ The 23 States account for about 95 percent of the fed cattle marketed in the United States.
]:./ Data obtained in the course of the investigation indicate considerable turnover in the feedlot industry; about 40 percent of the independent feedlots have started since 1970 and about 75 percent have started since 1960.
]_/ Available data indicate that about one-fourth of the feedlot operations employ no more than 2 workers and three-fourths have 10 or fewer. Limited data concerning sales volume tend to confirm the observation that most of the operations are relatively small; over one-half of the firms reporting sales volume showed sales of fewer than $1 million annually,and about 85 percent had sales volume of fewer than $5 million annually .. The size of the average feedlot is believed to be increasing.
4/ The influx of capital from various sources into many large-scale feedlot operations may have been largely because of tax advantages.
20
Despite transportation charges, feeder cattle are often moved
relatively long distances and sometimes through several marketing
channels for feeding. In recent years a pattern following a clockwise
direction has developed for shipping feeder calves to feedlots. For
example, feeder calves from the Southeast tend to move to the Southwest;
those from Texas and Oklahoma move in a northward direction; and those
from the intermount~tn area and northern plains follow the traditional
movement into the Corn Belt. California and Arizona take feeder cattle
from various areas of the country.
U.S. meatpackers (slaughterers and processors)
In the slaughtering operation, live cattle are killed, bled,
eviscerated, decapitated,and skinned. The animal's carcass is then
generally split in half along the spinal column and chilled. In the
case of veal calves, the carcass is usually not skinned or split
until the final stages of processing.
Most domestic slaughterers also manufacture beef and veal products
from the carcasses; parts of the carcass are cut-up to yield steaks
and roasts, and other parts, including trimmings, are used in
preparing products such as ground beef, sausages, and cooked beef.
The use of beef for the various products depends, in large part, on
the quality of the meat and the demands of the market.
Domestic slaughterers and processors dealing in the interstate
commerce of meat are subject to the regulations of the U.S. Department
21
of Agriculture. Most other meat plants are subject to State inspection regula-
tions that have been certified by U.S. Department of Agriculture's Food.Safety
and Quality Service (FSQS). !/ About 6,000 domestic meat slaughtering and
processing plants are federally inspected for health and sanitation reasons. The
majority of these plants probably handle beef. In 1976 there were about 1,660
federally inspected cattle-slaughtering plants and 900 such calf-slaughtering
plants in the United States. 2/ In recent years, federally inspected plants have
accounted for 90 percent of the United States cattle slaughter.
The commercial slaughtering of cattle and the processing of the meat has
tended to move from central markets to within 50 to 100 miles of where the animals
are fed; only a few States have accounted for the bulk of U.S. slaughter of
cattle in recent years. In 1976, Texas, Nebraska, and Iowa accounted for nearly
two-fifths of the total slaughter of cattle, and Kansas, California, and
Colorado, for another fifth. The principal calf-slaughtering States that year
were New York (with about 20 percent of the total), Texas (with 10 percent),
Wisconsin and Iowa (with 9 percent each), and Pennsylvania (with 8 percent).
The carcass may be partially or fully processed at the meatpacking plant~
or it may be shipped for-processing to another meat plant or to a retail outlet.
In recent years, there has been a trend toward more processing being done at
the plant level. Meat packers have been using so-called boxed beef to market
!f The primary objective of FSQS inspection of livestock and meat processing is to assure that the meat distributed to consumers is wholesome, not adulterated, and properly marked, labeled, and packaged.
!:__/ These data include duplication inasmuch as some plants handle both cattle and calves.
22
an increasing share of their output. !/ Preparing boxed beef involves the
division of the carcass into primal or subprimal cuts at the meatpacking plant
and packaging these cuts into plastic-lined cardboard boxes. These boxes of
cuts of beef and coarse ground hamburger are then shipped to retail and insti-
tutional outlets. Marketing beef as boxed beef, including coarse ground beef,
offers several advantages: improved worker productivity at the processing plant,
reduced transportation costs because excess bone and fat are removed before
shipment, weight loss of the meat is reduced owing to improved packaging,
and semiskilled labor can handle the meat at the retail outlet.
Concentration in the meatpacking industry is much greater than in the live
cattle industry. According to the 1972 Census of Manufactures (the most recent
data available), the four largest companies operating meatpacking plants produc-
ing beef accounted for about one-fourth of the total value of U.S. shipments in
1972; the 20 largest accounted for about one-half, and the 50 largest accounted
for two-thirds. Concentration in the production of veal is greater than that
of beef. In 1972 the 20 largest companies accounted for 70 percent of the
total value of veal shipments, the 50 largest companies, 91 percent. Concentra-
tion is also high in the canned-meat industry; in 1972, the 4 largest companies
supplied two-thirds of the value of shipments and the 20 largest accounted for
virtually all of the shipments.
!/ During the investigation, information was received that currently about 60 percent of the U.S. production of beef is marketed as boxed beef.
23
Production
The production of beef and veal involves growing, feeding, and
slaughtering the cattle, as well as processing meat.
Live cattle
The latest expansion of numbers of cattle commenced during 1967,
with all cattle on farms totaling 109.4 million head on January 1,
1968. The expansion lasted until 1975 when cattle numbers peaked at
a record of 131.8 million head (table 6 and fig. 2). !./ From January 1,
1975, to January 1, 1977~ all cattle on farms declined to 122.9 million
head, or about 7 percent.
During the past decade, the share of the national cattle herd
composed of milk cows and milk replacement heifers declined from 18
to 14 percent, reflecting a long-term downtrend in the-number of milk
cows.; the. share of the national herd composed of beef cattle has
correspondingly increased. Per capita consumption of milk and dairy
products has declined over the years and output per cow has increased.
Accordingly, the number of cows kept for milking has dropped, although
the decline appears to have halted in the past several years.
Culled cows from dairy herds are an important source of meat for
manufacturing.
1/ The cattle cycle is discussed in the following section of the report on inventories.
Million head 1Yli1
12B
1ma
Bl'J
2a
Figure 2.--Cattle and calves: Number on U.S. farms on Jan. 1, ot 1967-77.
131.B 127.7 128.B
121 .~ 1 li.9
tee.a U19. 't I ULEI 112. Lf 111.f.6
122.9
-Beef cows and i;eplacement heifers
-Milk cows and replacement heifers
-Other heifers, steers, and bulls
1967 1968 1969 197"1 1971 1972 1973 1971.f 197~ 1976 1977 Source: Compliled from official statistics of the U.S. Department of Agriculture.
25
Trends in major cost elements of cattle production •. !/--The impor
tance of the various elements of costs differs between feedlot opera
tions and cow-calf operations. Feeder calves are the major cost
factor in feedlot operations; for example, during the first half of
1977, the purchase of calves accounted for about 45 percent of all
costs incurred by feedlots. Feed, such as corn silage, protein supple
ment, and hay, is the other major cost factor in feedlot operations;
it accounted for about 40 percent of total costs during the first half
of 1977. Labor, transportation, interest on purchases, and equipment
accounted for the remainder of the costs. Land costs are minor in
feedlot operations because of the small area required to maintain a
feedlot.
For cow-calf operations, on the other hand, land is a maior cost
of production; it accounts for about 40 percent of total costs owing
in large measure to the large amount of land generally needed in cow~
calf operations. Feed costs account for about 25 percent of all costs
in cow-calf operations, labor for about another 10 percent, and
machinery, equipment, transportation, taxes, interest, veterinary and
medicine and other miscellaneous charges account for the remainder.
The index of feeder-calf prices paid by feedlot operators rose from
100 in 1967 to 199 in 1973; it then declined to 135 in 1975 before
advancing to 160 in 1976 (table 7). The increase observed from 1967 to
1973 ~eflects the profitability that took place in both feeding cattle
and in cow-calf operations during the period. Similarly, the declines
in 1974 and 1975 reflect low profits, or losses, experienced by cattle
"J:./ Based on material published by the U.S. Department of Agriculture.
26
feeders and the contraction of their operations,and declining receipts
to cow-calf operators.
After staying about level for several years, the feed price index
(1967=100) climbed to 160 in 1973 and peaked at 194 in 1974. The rise
in 1973 and 1974 reflected the competition from the strong export demand
for U.S. grains, a factor not prevalent in other cattle cycles, and un-
favorable climatic conditions that limited domestic feed production.
The moderation in the index to 187 in 1975 and to 191 in 1976 reflected
increased domestic feed grain production and reduced export demand. l/
The annual increases in land costs were relatively moderate during
1967-71 (1967=100) but they rose sharply during 1972-76 and averaged 244
in 1976. The index of labor costs incurred by farmers (1967=100) stood
at 210 in 1976. During the 1967-76 period, land and labor costs increased
the most among the major cost elements experienced by farmers, followed
by feed costs and feeder calf costs. Although the major costs of cattle
production generally doubled from 1967 to 1976 {table 7), the pr~ce
received for cattle in 1976 was only 50 percent highex• than in 1967.
Cattle slaughtered.--The long-term trend in the number of cattle
slaughtered has been upward. In 1976~ the commercial slaughter of cattle
1./ In 1967-73, the beef-steer corn ratio (the bushels of No. 2 yellow corn equivalent in value to 100 pounds of slaughter steers weighing 900 to 1,100 pounds, at Omaha) was favorable to beef production; it ranged from 20.3 in 1967 to 28.0 in 1972. The ratio declined abruptly to 13.7 in 1974 and remained at low levels through.the spring of 1977. In the summer of 1977, the ratio began to rise as grain prices moderated; in August, it averaged 24.0. This development might result in increased U.S. beef production in the foreseeable future and thus further increase the already large production of beef.
27
reached a record high of 42.7 million head (table 8), as herds were culled heavily,
or liquidated, in response to drought conditions and low prices. During January-
June 1977, slaughter amounted to 20.7 million head, compared with 19.3 million and
21.1 million head slaughtered in correspondinp, 6-month periods in 1975 and 1976,
respectively. The bulk of the commercial slaughter is made up of fed steers and
heifers. Most of the remainder consists of cows and nonfed steers and heifers.
During 1967-76, commercial cattle slaughter declined appreciably in only one
year, 1973. In March through September 10 of that year price controls were in
effect on beef and veal as well as on other meats under the Economic Stabilization
Program. During that period, it appeared that cattlemen withheld their animals
from the market in anticipation of higher prices and increased profits when the
controls were removed. However, when the controls were lifted, increased supplies
of cattle were marketed and prices dropped; they have .not since attained the record
level reached in 1973.
During 1967-72, the price of beef cattle ranged from 78 percent (1967) to 91
percent (1972) of parity; in 1973, it averaged 100 percent (table 9). 1/ Since
then, it has declined as cattle prices have dropped and costs of production have
increased. In 1976, the price of beef cattle averaged 59 percent of parity and the
price of beef calves averaged even lower at 51 percent. The parity ratio of all
farm products averaged 71 percent in that year. Indeed, during the 1974-76,period,
the parity ratio for beef cattle averaged some 12 to 18 percentage points below the
ratio for all farm products (calves averaged even lower at 20 to 36 percentage
points), indicating that cattlemen on the basis of parity have not fared as.well
as other farmers in recent years.
Meat of cattle
Beef and veal.--Like the slaughter of cattle, production of beef has followed
a long-term upward tren~; production reached a record high of 26.0 billion pounds
1/ The parity ratio is a measure of the average per unit purchasing power of all farm products in terms of goods and services farmers buy in relation to that in a statutory base period.
28
(carcass-weight equivalent) in 1976 (table 3). During January-June 1977, beef
production amounted to 13.0 billion pounds, about 2 percent above the output during
the corresponding period in 1976. In 1976, and thus far in 1977, cattlemen were
continuing to liquidate and reduce the sizes of their herds. The increase in
beef production resulted not only from increased numbers slaughtered, but also from
the increased average weight of cattle slaughtered.
U.S. production of v~al has trended downward over the long term, notwith
standing an increase in 1974-76, owing to both the practice of farmers to market
grain through fattening more calves and to the decline in the national dairy herd.
The commercial production of veal declined from 792 million pounds (carcass-weight
equivalent) in 1967 to 357 million pounds in 1973; it then rose and averaged some
860 million pounds in 1975 and 1976 (table 3). The increased output of veal in
recent years reflects, in part, the cattlemen's decisions to liquidate and reduce
their herds in response to depress~d cattle prices.
Categorized in tenns of the nomenclature of the TSUS, domestic production of
beef and veal can only be broadly estimated. These estimates can be based on data
on the output of federally inspected meat. The hamburger ground at the retail
level--which is believed to.account for most of the hamburger produced in the
United States--is generally not federally inspected after grinding. If the U.S.
production of federally inspected beef and veal had been classified for identifica
tion purposes according to the provisions of the TSUS, about three-fifths of the
total produced in 1976 would have been classified under item 106.10, the category
for fresh, chilled, or frozen meat. About one-fifth of the total would have been
classified as prepared or preserved beef and veal under TSUS items 107.52 and
107.60, and the remaining one-fifth would have been sausages (TSUS items 107.20 and
107.25). !/
There is also a substantial domestic output of edible beef and veal offal
which is not accounted for in the estimates above. In 1976, U.S. production of
such offal (TSUS items 106.80 and 106.85) amounted to about 1.8 billion pounds
(product-weight basis).
Movement of cattle and beef and veal into the U.S. market.--There has been
a long-term decline in the number of cattle sold at the large terminal markets,
from about 50 percent of the total in 1960 to 10 percent of the total in recent
years. Conversely, there has been an increase in the direct marketing of cattle
by farmers and ranchers and by feedlot operators to meatpackers from about 40
percent of the total in 1960 to 75 percent in recent years. The remainder of the
sales are accounted for by auction markets. The decline of the terminal markets
occurred as the large central slaughtering facilities were moved to the areas of
cattle production. The bulk of the beef and veal produced in the United States
is distributed through wholesaling branches of slaughterers and processors. The
farm slaughter of cattl~ for home consumption and vertical integration by retailers
is believed to be minimal, although the~e are several large operations in the
United States that feed and slaughter cattle and wholesale beef. A number of
small-scale, independent wholesalers market beef and veal, generally in less than
carlot quantities.
1_/ These data do not account for the hamburger ground at the retail level.
30
Importers sell the bulk of their fresh, chilled, or frozen beef and
veal to wholesalers and to packers or processors. In 1976, nearly two
fifths of their sales were to wholesalers,and a third were to packers
or processors. Most of the remainder of their beef and veal went to re
tail stores and mass feeding establishments.
Retail food stores are the major outlet for beef and veal. For a
number of years, less processing of beef and veal has been done at the
individual stores and more .has taken place at the retailer's central
processing plants and the packers processing plants. There has also
been an increase in the use of private label products that have been
processed, packed, and then shipped to the retailer ready for sale to
the ultimate consumer.
31
U.S. Exports of Cattle and Products of Cattle
U.S. exports of live cattle as well as beef and veal are rela-
tively- small~ however, the United States is the world's largest ex-
porter of packinghouse byproducts of cattle (such as hides and tallow)
and a substantial exporter of edible beef and veal offal.
Live cattle
Annual U.S. exports of live cattle are equivalent to less than
1 percent of the U.S. cattle population. During the period 1972-76,
exports averaged 215,000 head annually, compared with only 62,000
head during 1967-71 (table 10).
The principal factors affecting the increase in exports of live
cattle during 1972-76 included: (1) agreements between Mexico and
the United States (the "Maquila beef" program) that provide for the
export of live cattle to Mexico and the return to the United States
of the beef that results from their slaughter; 1_/ (2) the development
of practical air transport for live cattle, especially high-valued
cattle for breeding purposes; and (3) the opening of markets in the
Communist countries of Eastern Europe to U.S. cattle.
U.S. exports of live cattle have consisted primarily of cattle
for breeding and cattle for slaughter. Exports of cattle for breeding
1/ The U.S. had an unfavorable balance of trade with Mexico in live cattle and beef during 1974-76.
32
have generally declined in recent years--from about two-thirds of the total number
in 1972 to less than one-third in 1976, Mexico and Canada have been the principal
export markets; other important markets include countries in South and Central
America and South Africa and Japan,
U,S, exports of c~ttle for sl~ughter during 1972-.76 also went mostly to
Canada and Mexico. Many of the live cattle exported to Mexico are part of the
Maquila beef program, The high cost of transporting live cattle is probably the
most limiting factor in shipping cattle to countries other than Canada and Mexico.
Canadian health and sanitary regulations apparently limit U.S. exports of cattle to
Canada. For example, Canada requires that live cattle be tested to verify the
absence of blue-tongue disease, it require certification by U.S. veterinarians that
live cattle have not received DES (diethylstibestrol, a growth stimulant) and that
the meat of cattle offered for importation comes from animals that have not
received DES. If live cattle are to be imported into Canada from Michigan, the
animals must be tested by Canadian Government officials to verify the absence of
PBB (polybrominatedbip.henyl, a feed contaminant); meat of cattle is also spot
checked by the officials for PBB residue.
In August 1974, Canada unilaterally imposed quotas on its imports of certain
live cattle and beef from the United States. These quotas were in effect until
early August 1975. 1./ Mexico also has health and sanitary requirements and admin-
istrative regulations concerning imports of cattle.
Beef and veal and edible off al 'J:.../
U.S. exports of beef and veal and edible beef and veal offal amounted to 311
million pounds in 1976, up about one-third from the 1972-75 annual average of 228
l/ In November 1974 the United States imposed quotas on its imports of certain Canadian livestock and meat products in response to the Canadian action earlier in the year; U.S, quotas were lifted at the same time the Canadian quotas were lifted.
J:../ All weights are on a product-weight basis.
33
million pounds and almost double the 158 million pound annual average of 1967-71.
Table 11 shows U.S. exports of beef and veal and beef and veal byproducts during
the period 1967-76. During 1972-76, offal accounted for about three-fourths of
the quantity of exports, but, because of their low unit value, they accounted for
only ~bout one-half of the value. Exports of offal equaled about 13 percent of
U.S. production in 1976, up from 10 percent annually during 1972-75. The .Eu-:c9pe.an
Community (EC) was by far the largest market for such exports, accounting for about
two-thirds of the total; other markets included Israel (beef livers), Mexico, and
Japan.
During the period 1967-76, U.S. exports of beef and veal ranged from 2.6
million pounds (in 1969) to 81 million pounds (in 1976). Exports of beef and veal
have been equivalent to less than 1 percent of U.S. production. U.S. exports have
consisted almost entirely of fresh, chilled, or frozen beef,and a large part has
been high-valued cuts of beef used in restaurants. Japan took about one-third of
the exports in 1976 and Canada, a traditional market, one-fifth of the total;
markets in the Caribbean area accounted for another fourth of the total.
Japanese imports of beef and veal from the United States are subject to a.
tariff of 25 percent ad valorem and a variable levy, and, depending on the cut of
beef, a surcharge. Imports are also subject to an annually determined global quota.
Quotas reflect the price received by Japanese beef producers. Thus, when the
wholesale price of beef in Japan exceeds the Government-determined "ceiling'~ price 1
imports are permitted, reportedly to bring 1own the price in Japan; conversely,
when the !?rice :;in .;r~p?n :;i..,$. bel9w the ceping pf;l.ce~ ;1..mp9rti:; ?re severel:y re!?t:ri.cted.
On May 2, 1977, the Japanese Government announced the general beef import quota for
the first half of the fiscal year 1977 /78 at 70 _;m:;i..llion pounds--the same amount
allowed in the"previous 6 months, but 20 million pounds less than that allowed·in
the semi.,...annual quota announced a year earlier. Well-over half of the quota was
allocated to Australia.
34
Canadian imports. p,f b~e.f and veal are subject to quantitative limitations
admininstered on a country-by-country basis. For 1977, Canada is limiting its
imports qt; bee~ and 'Veal from the United States to 26 million pounds. Canadian
impot:ts _ of f_resh, chilled, and frozen beef and veal from the ·united States receive
most-favored-nation rates of duty as do those from Australia and New Zealand, the
other principal suppliers to the Canadian market. The rate of duty on beef and
veal from these sources is 3 cents per pound (Canadian). There is evidence that
Canada's health and sanitation requirements have inhibited U.S. live cattle exports
to this market in recent times. According to testimony by Congressman Marlenee at
the hearings in Washington, D.C., on September 20, 1977, the blue-tongue testing
requirements of the Canadian Government have posed a serious bottleneck to these
exports since 1973. 1_/ EC imports of beef and veal from the United States are subject to tariffs,
variable levies, and other administrative limitations, including licenses. In
1974, the EC experienced a build-up of stocks of meat and imports of cattle meat
were banned, except for those articles negotiated under General Agreement on
Tariffs and Trade agreements. The Export-Import plan (Exim) in force during the
last half of 1975 permitted limited imports of beef only when an equal amount of
the meat from domestic sources was exported, This plan was replaced by the time
lag scheme, in force from January 1976 to April 1977, which linked imports with
purchases of equal amounts from EC surplus stocks, Since April 1977, variable
levies ranging from zero to 114 percent ad valorem have been imposed. The basic
levy is the difference between the EC price and the world price.
]:_/ Transcript of hearings, pp. 51 and 52,
35
Packinghouse byproducts
The principal packinghouse byproducts exported from the United
States are hides and tallow, the rendered fat of cattle. Exports of
the byproducts contribute more to the economic well-being of U.S.
meatpackers than exports of the other products of cattle. During
1967-76, the value of u.s~ exports of cattle hides and calf skins
increased from $108 million to $480 million,and their share of the
total exports of beef and veal and their byproducts increased from
30 :to 37 percent .(table 11). Most of the exports consisted
of cattle hides and were equivalent to about one-half of domestic
production. The increase in value of exports reflects, in part, a
growing demand abroad for U.S. hides that can be converted into leather
and leather products. Japan has been the principal export market,
by far, for U.S. cattle hides and calf skins. In 1976, that country
accounted for about two-fifths of the total; other important markets
included the Republic of Korea, Mexico, Italy, and Romania.
During 1967-76, U.S. exports of tallow, in terms of quantity,
showed no discernible upward or downward trend, averaging about 2.1
billion pounds annually. In terms of value, however, exports of
tallow as a share of the total exports of beef and veal and their
byproducts dropped from 40 percent in 1967 to 30 percent in 1976.
Most of the U.S. exports consist of inedible tallow which may be
rendered edible abroad. U.S. exports go to many countries; in
1976, the European Community, Egypt, Japan, and South Korea were
the principal markets for U.S. inedible tallow.
36
Inventories
Live cattle, the cattle cycle
Historically, the number of beef cattle and calves on·u.s. farms
and ranches has followed a cyclical pattern (fig. 3), and the results
of that pattern, the cattle cycle, reflect the inventories of
cattlemen. 1/
Figure 3.-~U.S. inventory of cattle and calves on Januar
INVEf~TORY OF CATILE AND CALVES, BY CYCLES, U.S., JANUARY 1 MIL.HEAD
0 2 3 4 5 6 7 8 9 10 11 YEARS OF CYCLE BEGINNING WITH LOWEST INVENTORY NUMBERS
Source: U.S. Department of Agriculture.
The cyclical characteristic shown above occurs for both economic and
biological reasons. A buildup in cattle inventories will be followed
by increases in beef production. The cycle enters t~e ~xryansion phase
with the decision of producers to increase cow numbers. This decision
is likely to be based largely on current conditions regarding cattle
prices and forage suppiies. Biological factors cause lags between the
time the expansion decision is made and the increase in beef and veal
production takes pale~. 2/ Thus, the supply~demand conditions that exist
);_/ The number of cattle on U.S. farms and ranches is discussed in the section of this report on U.S. production.
]:_/ The production of beef and beef products involves a series of operations that span a period of 2.5 years or more," beginning at the time the cow is bred.
37
when the increase.in beef output finally occurs may be quite different
than those prevailing when the :ln;J;.tj.g.l expansion decision was made.
The build-up of the breeding herd during the expansion phase is
accomplished by holding back heifers that would normally go to feedlots,
in addition to retaining cows. The retention of cows and holding back
of heifers f~rther reduces supplies of beef available for slaughter, and
higher prices follow. Producers typically respond to the higher prices
by saving even more breeding stock.
At some point either feed conditions become unfavorable (causing
producers to sell their cattle), or the supplies of beef and veal become
too large to clear the market at the prevailing prices. In·either event,
the production of beef ultimately outruns demand at the prevailing
prices, and prices begin to decline. Falling prices result in reduced
profits, and producers begin. to cull br.eeding stock, The culled breeding
stock adds to the already substantial meat production,:further depressing
prices and profits. Young animals that would normally go to feedlots
or breeding herds are also sold for slaughter, resulting in additional
supplies of meat. !/
This liquidation (sell-off) phase of the cycle continues until
conditions (largely cattle prices and forage supplies) are such that
producers once again decide to expand their herds because of anticipated
._profits, and a new cycle begins. The expansion phase of the latest cattle
.. 1/ Ronald. A, eustafso_nf i'·L;ivestock~Grain· .. rliterdependeni±e: Implicati6ns for Policy," Agricultural Food Policy Review, USDA, January 1977, p. 122.
38
cycle got underway in 1967, with all cattle on farms at 109.4 million head on
January 1, 1968, and lasted until 1975, when January l cattle numbers peaked at a
record 131.8 million head. As a result of the liquidation phase of the cycle which
began in 1975, January 1 inventories during the last 2 years have been successive, .....
ly lower, falling to 122.9 million head on January 1, 1977.
Herd reduction has continued through the first three quarters of 1977 and U,S ..
Department of Agriculture economists predict that it will continue through the
fourth quarter and possibly into 1978. Their estimate of cattle on farms for January
1, 1978, is 117 million to 118 million head, Beyond early 1978, the Department of
Agriculture economists estimate that the movement of the cattle cycle will depend
largely on forage supplies and feed grain prices. Assu~ing favorable conditions,
herd slaughter should moderate and cattle numbers will stabilize at about 116
million head; if forage and grain conditions are unfavorable in 1978, herd
liquidation will continue.
Inventories of beef and veal
Cold-storage holdings of beef and veal do not change much from month-to-month
(table 12). Monthly cold-storage holdings have averaged about 322 million pounds
in recent years, generally equivalent to about 15 to 20 percent of the monthly output
In May 1977, stocks amounted to 457 million pounds, about a tenth more than in May
1976. Meatpackers prefer to market beef and veal in the fresh form, rather than
pay the costs associated with storage. Consequently, there has been little
relation between the increased beef and veal production in recent years and year
end inventories.
39
Financial Conditions
Cow-calf operations
The following discussion cover the financial conditions of cow-calf
operators from 1960 to 1976.
1960-72.--u.s. Department oi Agriculture studies on costs and returns
of commerical cattle ranches in selected U.S. areas show that the rise in
the ranches' income was greater than the rise in ~heir production outlays.
This reflected a combination of factors, such as: high prices of beef
livestock (especially of feeder calves), increased calving rates, lower
death losses, good range conditions, and concomitant heavier market
weights for calves. The U.S. Department of Agriculture studied com
mercial ranches averaging about 300 head of brood cows in three import
ant western producing areas: the northern plains, the northern Rocky
Mountains, and the Southwest (fig. 4). Table 13 shows percentage
returns to total capital (equity plus borrowed capital) invested. Ranch returns,
on the whole, were well above average returns on common stock in this period.
Even the least profitable Southwest ranches had positive, if low, returns. Their
low profitability was caused by factors such as: low carrying capacity of their
ranges, droughts, relatively limited use of public grazing land, and comparatively
high land values which increased the investment required per animal unit.
1973.--In this peak year of cattle prices, no comprehensive information
was available from the U.S. Department of Agriculture on costs and profitability.
40
Figure 4.--Cattle ranches: Three U.S. regions covered by USDA studies on costs and returns, 1960-72.
Northern Plains: includes generally southeastern Montana, northeastern Wyoming and western Dakota~ Northern Rocky Mountains: includes generally southwestern Montana and east central Idaho. Southwest spans parts of West Texas, southern New Mexico and parts of southeastern Arizona.
Source: U.S. Department of Agriculture.
41
1974-75.--For 1974 and 1975 the U.S. Department of Agriculture prepare(
detailed cost estimates for cow-calf operations considered common or
"typical" in five regions of the United States. The regions selected are
shown and defined in figure 5. From these itemized cost estimates the U.S.
Department of Agriculture calculated the average selling price that would
have been re9uired both years to cover the variable costs and total costs
of feeder calves sold by these operations. As no estimates were made on
returns, a comparison of prevailing livestock prices in these years with
the expense of raising feeder calves can serve as a crude indicator ·of
profitability.
Table 14 shows herd sizes considered common or typical'for
operations in each of the regions and variable and total expenses per
hundredweight of feeder calves produced by these enterprises. Data
indicate that variable expenses differed significantly among the five
regions. In the northern plains and southwest plains they were low,
hence, returns to variable costs were probably positive, taking Kansas
City prices as a basis of comparison. By contrast, in the western Corn
Belt and especially in-the southeast area, variable costs exceeded even
the higher 1974 livestock prices, resulting in actual losses for the
operator. The U.S. Department of Agriculture analyzed the reasons why
a large majority of producers, which apparently were unable to cover
variable expenses~ continued to stay in business (in the short run,
positive returns to variable costs justify continued operations). ·The
U.S. Department of Agriculture explains that, among other reasons, the
variable costs estimated were not entirely cash outlays, hence negative
42
Figure 5.--Feeder calves; 5 U.S~ regions covered in USDA estimates on ·produc_tion expenses in 1974 ·and 1975.
Western-Com Belt includes .most of.Iowa.plus.Northwest and West Central Illinois. Southeast includes the Piedmont areas of Alabama, Georgia, South Carolina, and ~orth Carolina. Northern plains encompasses the southeastern-quarter of Montana ano'part of eastern Wyoming. Southwest high plains covers·Texas. The intermountain area includes Nevada, \.Jestern Utah, southern Idaho, southeastern Oregon, and a small borderline area of eastern California.
Source: U.S. Departmeftt of Agriculture.
43
returns did '.not necessarily mean cash losses for the operator. Most
importantly, estimates on variable costs included charges for the
labor of family members, which did not involve cash payments. Nega-
tive returnsto variable costs were found mostly in those regions
(western Corn Belt and southeast) where the cow herd was supple-
mentary to crop operations and was maintained for returns (however
low) to otherwise unutilized labor.
Table 14 shows different variations amon,g the five r~gions for•the total
costs than for variable costs of raising feeder calves, For example, in the
southwest high plains cow-calf units had the lowest variable, but the highest
total, expenses, owing especially to the high cost of land in this area.
U.S. Department of Agriculture estimates in all five regions showed total
expenses per hundredweight of feeder calves above the actual price, Kansas
City basis. This indicates that in both 1974 and 1975 cattle raising must
have seemed an unprofitable enterprise to the potential entrant into t:1e
field, considering the investment in land~ equipment, and facilities at
the prevailing rates. In contrast, those operators that had their land
and other capital assets already paid for did not incur actual costs
associated with these assets on a year-to~year basis. Hence. if their
total costs had been computed on their original investment on these
resources, they would have been cons1derably lower than those presented
Capital appreciation~--Net asset apprec;iation~ especially land
appreciation, has long been considered a very important element of the
cattle raising enterprise. Even in good years, capital appreciation
sometimes exceeded net operating returns, l/
1976.--A study, -."Cost of Producing Feeder Cattle in the United
States 1976," has been completed but not yet released by the U.S. Depart-
.ment of Agriculture. This new study discontinued the geographic classi-
fication used in earlier studies and defined five principal pr?duction
areas in the United States with sufficiently homogeneous climatic, topo-
graphic, and agronomic conditions within each region to allow regional
cost studies. These regions are: (1) Southeast, (2) Southwest, (3) West,
(4) Great Plains, and (5) North Central.
The new U.S. Department of Agriculture study compared the average
regional prices of feeder calves with their average regional production
costs and found that total costs invariably exceeded prices. However,
except in the Southeast, prices in these regions covered returns to
fixed costs. Under 1976 cost-price relationships, therefore, cattle
raisers may be expected to continue in business over the useful life of
their capital facilities. Negative returns to total cost cannot be
maintained indefinitely, however.
_y Dr. Richard Shunway, .a ·Witness at the USITC hearings on the current investigation, testified that, in Texas~ the gain in land values (coupled with tax incentives) had probably been the principal cause of the industry's long-term post-war growth despite low operating returns and frequent losses. He pointed out that the low returns were augmented, and losses apparently offset, by rapid capital gains. (Official report of the proceedings, Vol, III, pp. 651-57),
45
Cattle feeding industry
The profitability of cattle-feeding operations is determined
predominantly by the price of fed livestock (the output) and of
feeder cattle and grain (the principal inputs). The uncertainties and
fluctuations in the prices of these three items, which occur for a
variety of reasons, make cattle feeding a high-risk enterprise.
It is also difficult for the industry to adjust its scale of opera
tions according to unpredictable cost-price squeezes, as there is a
time-lag of about'4 months between placing cattle on feed and marketing
the finished livestock. By the time the threat of reduced earnings or
outright losses becomes obvious, decisions on investment capital (and
to a large extent also on operating capital) already have been made.
During the herd-expansion phase·of the most recent cattle cycle
the profitability of feeding operations fluctuated principally with
grain prices~ as the prices of feeder- cattle and fed cattle were on a
fairly predictable long-range upward course. The corn blight of 1976
and resulting higher feed prices apparently caused short-run·losses to the
industry. However_, until the last quarter of 1973-, returns to feeding enter
prises were generally positive. Although feed prices rose rapidly in
response to increased U.S. grain exports in 1973, the price of finished
cattle increased also and allowed sufficiently attractive (even if reduced)
mar gins . ]:_/
]:_/ See price section.
46
In 1973, the retail price ceiling imposed in March and the subsequent
consumer boycott of meat pruchases broke the generally upward trend of
livestock prices. Although the meat price ceiling was lifted in the fall,
the previously withheld cattle inundated the market, causing livestock
prices to fall precipitously instead of rising as cattlemen· had expected.
Prices continued to decline through the first quarter of 1975. The ratio
between cattle prices (which were falling) and grain prices (which remained
The impact of losses suffered by the industry varied among individual
cattle feeders. Those that did not accumulate sufficient earnings from
prior profitable years were faced with high losses of equity and
inadequate reserves to support additional debt, especially as equity
requirements also increased. Apparently, large commercial feedlots
managed to operate at times at 50 to 60-.percent capacity utilization, and
relatively few feeders have been forced to liquidate their holdings through
foreclosure. The industry is seen to adjust to unfavorable financial
developments by making some changes in common ownership and/or business
arrangements with suppliers (feeder producers, feed companies) or pur-
chasers (meat packers).
The meatpacking industry
The financial picture of the meatpacking industry from 1925 through
1976 is summarized in table 16._!/ American Meat Institute (AMI) data
show a continuous increa~e in the value of sales and net worth for meat
packers since 1968. They also reveal fluctuations in year-to-year profit-
ability, measured in earnings sales, since 1963, reflecting the
volatility of prices and production in the livestock economy.
Various median earnings ratios calculated by Forbes for the largest
16 public meatpacking companies are shown in table 17 for 1970-74, and
annually for fiscal years covering largely 1974, 1975, and 1976.
!/ Note that AMI data also include operations relating to hogs. By contrast they exclude the meat processors that conduct no slaughtering operations. The annual data for 1963-76 are estimates of the AMI based on commercial livestock slaughter, as reported by the U.S. Department of Agriculture.
so
According the these data sources (AMI and Forbes), the profitability of
the meatpacking industry in terms of sales did not.change meaningfully in
1974-76. Forbes and AMI data indicate a slight decline in net profits on
sales in 1976, compared with 1974. Concerning long-range developments,
the ratio of net earnings to total sales of the meatpacking industry
was about the same, or better, in this period (1974-76) than in prior
years and decades. According to the AMI, earnings on net worth did decline
somewhat in 1976, but they have increased significantly in the long run
(table 16). Forbes data also shows a decline in median returns on stock
holders' equity for 1976, but a better performance in 1974 through 1976
than in the preceding years of the seventies (table 16).
It should be noted that the financial performance of the meatpacking
industry in 1974 through 1976 is different from the poor financial condi
tions of cow-calf operations and cattle feeders in these years. Table 18
shows that the gross profit margin of meatpackers ranged from 20.4 percent
in 1974 to 21.5 percent in 1976. The gains from declining raw-material
costs were off set by rising operating expenses in the meatpacking
The principal meat price reporting services in the United States
are the "Yellow Sheet," published by the National Provisioner, "The Meat
Sheet," which is a Fairchild Publication, and the "Market News;" a
free weekly publication of the U.S. Department of Agriculture. "The
Yellow Sheet" reports prices for a variety of items, but it does not
show sales volume or whether the sale was from packer to packer or
packer to processor. The quoted prices are based on open-market
sales which are identified by the National Provisioner through
telephone calls to and from sellers, buyers, and brokers. Estimates
by industry sources and other price reporting services indicate
that "The Yellow Sheet" daily price quotations are based on approxi-.
mately 5 percent of all daily wholesale meat transactions. The
National Provisioner has been reporting meat prices since 1927 and
has an estimated circulation of 15,000.
"The Meat Sheet" reports daily high, low, and closing prices
along with daily volume. It distinguishes between packer-to-packer
and packer-to~processor sales of beef carcasses. It reports prices
for imported frozen meats f.o.b. east coast, as well as for imported
Central American boneless beef. "The Meat Sheet" has been published
since 1974 and has a circulation of a little more than 700.
USDA's weekly publication, "Market News," quotes prices of
livestock and meat on a weekly basis. It is primarily used by cattle
producers.
52
It should be noted that a number of suits ·charging monopolistic practices
have been filed against several national food chains, the National Provisioner,
and the National Association of Food Chains. The suits have been ·file<i by
cattlemen in California, Nebraska, Texas, and Oklahoma. The California case
involving Safeway, A &-P, and Kroger, ended with an out-of-court settlement
by Safeway and Kroger; A & P was ordered by a jury to pay $35.8 million, later
reduced to $9 million. In another development, the Meat Price Investigators
Association, formed to represent a group of midwestern cattle feeders, filed
a civil·suit (in August 1976) against four slaughterhouses, charging them with
conspiracy to fix live-cattle and carcass-beef prices. "};/ In this suit the
companies allegedly agreed to quote substantially identical bids for live cattle,
allocated territories, boycotted certain live cattle markets, purchased busi-
nesses of potential competitors, bought production of beef of potential competi-
tors, and gained and used inside information from major buyers.
A recent report by the Comptroller General of the United States discusses
whether there are free-trade impediments in the marketing of meat. !:._/ The
report concluded that the use of union/management agreements, which restricted
the form or hours in which certain meats could be marketed in some cities,
appeared to be declining. However, it ·called for more effective actions in
dealing with commercial bribery in the meat industry which, according to the
!./The 4 are Iowa Beef Processors, Inc,, Flavorland Industries, Inc., MBPXL Corp., and Spencer Foods, Inc.
2/ "Marketing Meat: Are There Any Impediments to Free Trade?'' Report of the Comptroller General of the United States, June 6, 1977 (CED-77-81).
53
Department of Agriculture, is longstanding and widespread. According to the
report, "competition is limited and consumers are likely to pay higher prices
for meatN l./ when commercial bribery occurs in the meat industry.
Despite the information presented above, only limited data exist concerning
the impact of the large~scale purchasing power of major retailers in the pricing
of beef in the United States. In the hearing on the California cattle industry,
conducted by the California Legislature, Senate Subcommittee on California's
Food and Agricultural Economy, on June 27, 1977, Chairman Garamendi stated on
page 6 of the transcript:
•.. There is no doubt that large retailers, working in conjunction, have in the past artificially depressed beef prices. According to a Ninth Circuit Court of Appeals decision, major retailers conspired and in fact managed to depress the wholesale price of beef by 20 cents a pound. This practice is clearly illegal as it gouges ranchers out of a fair return for their. labor,
On October 20, 1977, the office of Chairman Garamendi reported that no summary
or conclusions of the hearing has yet been published and additional hearings.
are planned for December 1977.
In connection with the concentration of purchasing power by the major
retailers, reportedly about 70 percent of all fresh beef sold in the United
States is handled by grocery stores, According to Progressive Grocers'
Marketing Guidebook, total sales by grocery stores in the United States amounted
to $131 billion in 1974, and the 10 top chains accounted for about $34 billion
of that total, or 26 percent.
Assuming that U.S. sales of beef by the top 10 chains paralleled their share
of U.S. sales of groceries in 1976, about 18 billion pounds (70 percent of the
beef produced in the United States) were sold by grocery stores, and, of that
amount, the top 10 chains pu~chased about one-fifth of the beef produced in the
United States in 1976. - '};./ Ibid. p. 3.
54
Economic Background
The beef industry experienced slow growth from 1967 to 1970 within
the general environment of an expanding U.S. economy with a fairly
moderate rate of inflation. Feedlot operators had the incentive of
positive feeding ~argins, ample grain supplies,and a growing demand
for beef. The optimism of ranchers was reflected in longer holding
periods for cows and for replacement heifers. While this would mean
greater future beef supplies, the effect duringJ:his period was to
reduce current supplies and thus to increase meat prices. Prices rose
at all levels, from the farm level to the retail. Farmers receiving
an average price of $22.24 per 100 pounds for beef cattle in 1967
were receiving $27.10 in 1970 (table 19)~ Price increases were experienced
for Choice feeders, Choice steers, ··utility cows, vealers, and for carcasses.
In the 1970's the beef industry has been strongly influenced by
events affecting the price of grains and by Government economic
policies. Because of a corn blight, the 1970/71 corn crop 1./ was
smaller than in the previous year, and corn prices rose. The-. U.S.
Department of Agriculture estimated that cattle feeders suffered losses
in the fourth quarter of 1970 and first quarter of 1971. In the
following year (1971/72), the grain crop set a new production record
and grain prices began to fall, thus resulting in attractive feeding
margins in the livestock sector. In late 1971, meat prices began
rising owing to the growth in consumer incomes and demand for beef,
the reduction in beef supplies resulting from the 1970 corn blight,
and the diversion of heifers from slaughter to the breeding herds.
Herd expansion became attractive as feeding margins expanded.
1./ Year beginning October 1.
55
Although the 1972/73 corn crop was large, feed prices began in-
creasing in response to a growing export demand. Thus, feeding margins
narrowed in mid~l972, yet not so much as to prevent a continuation of
the increase in cattle numbers. From late 1972 to mid-1973, cattle
prices rose sharply owing to a combination of increasing consumer incomes,
a demand for beef, ?Ud a reductiQn ±n the supply of beef resulting from
the severe winter of 1972-73 in the plains and north central cattle
feeding areas. Price ceilings were imposed in March 1973.
The following month saw the beginning of a consumer boycott of meat
purchases. The response of cattle feeders was to reduce marketings,
and beef cattle prices continued to increase.
Rapidly rising grain prices in early 1973 resulted in the livestock
sector being caught in a cost-price squeeze by mid-1973. Beef vrices stayed
strong and breeding herds continued to be enlarged. Despite retail
price ceilings, feeder cattle prices climbed, reaching record highs in
the third quarter of 1973. Because of the retail price ceilin~s ~ .
reduced marketings, and rising live-cattle prices, packers and
retailers curtailed their beef operations. Assuming that cattle prices
would rise even further, feeders withheld cattle from the market until
price ceilings were to be lifted.
Price ceilings were lifted for beef on September 10, 1973. Feeder
cattle inventories were very large~and an excessive number of well-fed
cattle came on the market after that date. Prices of cattle fell strongly
for the remainder of 1973 and through 1974, particularly for the
56
excessively finished cattle. Higher quality cattle fell more in price than did
cattle of lower quality during this period, as can be seen in price movements
of Choice feeders, Choice steers, and Utility cows (tables 20 through 22 and
fig. 7). Prices of Choice steers at Omaha (900 to 1,100 pounds) fell from
$48.57 per 100 pounds in the third quarter of 1973 to $40.47 in the fourth
quarter. The liquidation phase of the cattle cycle had begun. 1/ Large
numbers of cattle were available while grain supplies were just adequate in
1973 and 1974. The 1974/75 grain crop was deficient, however, owing to such
factors as late plantings, drought, and an early frost,
With higher grain prices putting pressure on livestock margins and
cattle numbers at record levels, herd liquidation was accelerated in 1974.
Cattle on feed, which amounted to 13.9 million on January 1, 1973, numbered
8.5 million on April 1, 1975. From late 1973 to early 1975, cattle feeders
experienced negative net incomes. By late 1974, prices began to stabilize
for livestock. Lower grain prices combined with low feed lot placements in
1974 and early 1975 resulted in better feeding margins in mid-1975. Margins
favored placing cattle on feed. The price recovery was temporary, for
feeding margins declined again during the winter of 1975/76 owing to a large
nonfed-cattle slaughter and increased fed-cattle marketing. Prices were
further depressed during 1976 as a result of a greater number of cattle
slaughtered and higher average weights of the cattle during mid-1976.
1/ The previous bottom of the cattle cycle had been reached in 1967.
Lf1 a :z: =i D o .. Kl l'Sl
O:': w tl..
Lfl ct: 0: _J
60.00
L!0.m'.1
_1 21!Ul0 t::"I ~
10.00
0Jl01
rIGJRE 7.-lIVE CATTLE: f'RICES PAID AT SPECIFIED "1ARKET$, aY QUARTERS, JANUARY 1957-Jl.tlc J2'77.
CHOICE FEE~ERS1 600-700 LS1 K.C. · • • · • · • • · • CHO I CE STEERS1 9~0-1100 LS1 OMAHA * i UT 1 L I TY caws, OMAHA ~ - - -- * CHOICE VERLERS1 SO. ST. PAUL
I 2 3 LI 1 2 3 LI I 2 3 LI 2 3 LI 2 3 LI I 2 3 LI 2 3 LI 2 3 LI 2 3 Lj 2 3 Lj 2 3 Lj 1957 1958 1969 1970 1971 1 972 1973 I 97Y I 97!i 1976 I 977
SOURCE: TABLES 14. 20. 21. AND. 26. YEAR
58
For 1977, beef production is expected to be relatively large, with fed~
cattle slaughter estimated to be greater than that in 1976 by up to 3 percent, !/
The price of Choice 900 to 1,000 pound slaughter steers at Omaha is expected to
average approximately $40 for 1977, while the 1977 retail price per pound of
Choic~ grade beef is estimated to be 3 to 5 cents above 1976's $1.39 per pound.
Supplies of pork and poultry are expected to be large this year and thus should
tend to restrict potential increases in beef prices. Feeder-cattle prices for
the remainder of 197.7'will be influenced by weather conditions and the prospects
for the new corn crop. If grazing conditions are good and the corn crop is
large, feeder-cattle prices are likely to rise.
Individual Price Series
Retail
Retail prices of Choice grade beef and of hamburger rose in similar pattern
almost continuously from 1967 to early 1974 (tables 23 and 24, fig. 8), but
since then their price movements have diverged. From 1974 to 1977, the price of
Choice grade beef has been both below and above the early 1974 peak, In the first
quarter of 1977 the average price of Choice grade beef was 10 cents per pound
less than that in the first quarter of 1974. The price of hamburger, however,
has not surpassed its early 1974 high due to liquidation and increased supplies
and was 21.6 cents per pound lower in the first quarter of 1977. The retail
price difference between these two types of beef has risen from 28 cents per
pound in 1967 to 51.3 cents per pound in 1976. The corresponding percentage
increases in price, however, are similar--68 percent for Choice grade beef and
61 percent for hamburger.
l/ Estimates as of June 1977 by the U.S. Department of Agriculture, Because of reduced cow slaughter, total connnerical cattle slaughter for 1977 is expected to decline 4 to 6 percent from the 1976 levels,
160.00
,,....... ea 121!Ul'3 :z =1 D n. a::: w u. Lf1 1-z w v ~
w v
60.0'3
a::: 'i0 . 0.0 CI...
FIGURE 8,--(i{)JCE GRADE BEEF.AND HAMBURGER: AVERAGE U.S. RETAIL PRICE~, BY QIJARTERS,"J11NiiAAY 1~-:JUNE 1977,
ISi lS1 lS1 ISi ISi zsr ESI lS1 r- LD Lt1 :r M N JSI m
CQNnDd ~3d 51N3)) 3)i~d
70.00 FH1':l.E 12 .-FROZEN 75 PERCENT Q TR!n1INGS, IXJ'ESTIC AND IMPORTED: PRICE CXH'ARISIONS, BY 00/1JntRS, N.'RlvC:: .1977-,L\URJST i9Tl.
60.00
.--. /~-a ·-..:..... z S0.00 ::1 . .. D 'V °' 0.. 00
0::: w 'iH.00 ti-
U1 DOMESTIC TRIMMINGS I-:z .......... IMPORTED TRIMMINGS w 10.00 v ~
Lu l...) 20.00 a::: tJ ..
10.00
0.00 I I I I I I I I I I I
'I' I I I I I I I I I I
'I' I I I I I I I I I I 'I' I I I I I I I I I I -f
3 6 9 3 ll 9 3 6 9 3 6 9 197Y 197!\ 1976 1977
&JURCE: FASED ON DATA IN TABLE 29. YEAR
69
FOREIGN INDUSTRY
Live Cattle Trade
The major beef exporting countries are not major exporters of
live cattle. Australia, New Zealand, and Argentina, countries which
account for the bulk of beef exports, are not adjacent to major live
cattle importing countries, a prerequisite for substantial participa
tion in live cattle trade.
Live cattle are purchased for breeding, feeding or slaughter. Breeding
cattle, used to upgrade both dairy and beef herds, are relatively
expensive, and the volume of trade is much smaller than the volume of
the feeder,_and slaughter l!'attle ,trade; Markets for these cattle are in
both developed and developing countries. ~he United States, the European
Community, and Canada are the most important breeding cattle
exporters.
The major markets for slaughter cattle.and·feeder,cattle are the
United Sta_tes and the European Community. Canada and Mexico supply the
U.S. market and Eastern Europe supplies the EC countries. During
1973, trade in these two markets reached about 2 million head of
slaughter cattle and feeder calves. In 1974, U.S. and EG
cattle production increased, and live cattle trade declined sharply;
imports of live slaughter cattle by the United States and the EC
were 50 percent below 1973 levels. In 1975, EC imports of live
cattle rose about 53 percent over 1974 levels, while U.S. imports
were 31 percent lower. High slaughter rates due to drought in the
EC countries led to decreased .tmpor-ts- of ·1±ve slaughter cattle j:_n
1976. -Several factors, including droup,ht in western Canada, led to a
rise in U.S. imports of live cattle from Canada in 1976. ,At the hearings
70
on this investigation, a number of witnesses testified that increased
imports of meat into Canad~ from Australia also led to increased
Canadian cattle marketing in the United States. An enlarged export
quota on Mexican cattle to the United States in 1976-77 was announced
by the Mexican Government, which, perhaps, combined with devaluation of
the peso, stimulated increased exports from Mexico to the United
States.
71
Beef and Veal Trade
The major beef and veal consuming nations are the United States,
the nine EC countries, the S~oy:;i:et ·union,. Ca.nada, and Japa,n. The
leading exporters are Australia, New Zealand, Argentina, Uruguay,
Mexico, and the Central American countries.
Per capita consumption of beef and veal among the main consuming
nations and for other selected countries for 1971-75 is shown in
table 30. As the table indicates, per capita consumption in the
United States was more than twice as high as it was in the RC and in
the Soviet Union in 1975, and more than 12 times as high·as in Japan
in that year. This may indicate potential for significant growth
in future consumption in the major foreign markets. Per capita con-
sumption in three of the exporting nations--Australia, New Zealand,
and Argentina--was significantly higher than in the United States
in 1975. However, because of the relatively small populations in
these countries, their total consumption was fairly small.
Some of the major exporting nations rank among the world's lead-
ing beef and veal producers (table 0D. In 1976, beef and veal output
in Argentina, the largest producer among the major exporting nations,
amoUT1.tec:1. to !'!ore. than 6.2 billion pounds; in Australia production was
4 .1 billion pounds. 1/ Total non'""·Connnunis t world exports of beef
and veal in 1976 were about 6.0 billion pounds (table 32)--amounting
1../ Data in this section on output and trade are in carcass-weight eq ui valen ts.
72
to about 10 percent of the production of free-market economies. Australia
supplied approximately 31 percent of these exports while Argentina and New
Zealand provided 19 percent and 14 percent, respectively.
International trade in beef and veal is heavily influenced by trade restrictions.
The EC, Japan, and Canada, for instance, maintain quotas, and U.S. imports are related
to U.S. production levels in accordance with the Meat Import Act. In addition,
Japan and the EC both impose high tariffs on beef and veal imports, and the EC
also applies a variable levy to these imports. The chief exporting nations-
Australia, Argentina, and New Zealand--have the abundant grazing lands needed to
produce beef at a low cost and, thus, are generally able to export beef at a lower
price than other nations. As a result, these countries maintain a dominant
share of '.tne: world export market in spite of the many obstacles to trade. However,
trade restrictions imposed by the major consuming nations do distort trade patterns.
Partly as a result of these distortions, retail oeef prices vary widely from
country to country (table 33). Japan, which frequently has imposed the severest
import restrictions in recent years, has the highest prices.
Following the onset of the worldwide recession in 1974, exports of the major
supplying countries dropped sharply from 1973 levels (table 32). Although much of
the decline in trade was a result of decreased consumer purchasing power in the
major importing nations, the harsh import restrictions employed in the European
Community and Japan to protect the falling prices were a factor in reduced world
beef trade. European Community imports fell from 2.2 billion pounds in 1973 to
410 million pounds in 1975, while Japanese imports decreased from 428 million pounds
in 1973 to only 142 million pounds in 1975 (table 34). Although total trade in
beef and veal has recovered steadily since 1974, exports of the major supplying
countries were still below 1973 levels in 1976 and are expected to increase only
moderately in 1977--back to the 197J level.
73
In the remainder of this section the leading beef and veal
exporters and their major markets are considered in greater detail.
As a point of reference, actual and expected production and export
trends in the major exporting countries from 1974 to 1977 are shown
in table 35.
Australia
Australia, with a land area about the same size as the United
States but with a population only 6 percent as large, is well endowed
with the grazing lands needed to produce the cattle necessary for a
large, export-oriented beef industry. Australian cattle numbers
rose from 29.l million head in 1973 to 33.4 million in 1976,'but if
the current high rate of slaughter continues as expected, cattle
numbers in 1977 are projected to decline to 32.0 million head (table 36).
Australian beef and veal production declined 15 percent in 1974.
following the worldwide recession, but increased 34 percent the follow
ing year as beef that was held off the market during 1974, when low prices
prevailed, began to be offered for sale. In 1976, Australian beef and
veal output increased 10 percent to 4.1 billion pounds as economic pres
sures and lack of producer confidence in the industry resulted in the
continued liquidation of herds; Australian output of beef and veal is
expected to increase about 4 percent in 19v7.
In 1976, Australia exported 44 percent of ~he total beef and veal
exported by the major beef exporters. 1/ For the most part, trends
in export growt:h paralleled· and amplii'ied Australian beef· and
1/ Australia. New Zealand, Argentina, Central America, Mexico, Uruguay.
74
veal production trends--total, Australian exports fell about 53 percent in 1974,
experienced a post-recession rise by the same precentage in 1975, and rose 15
percent to 1.9 billion pounds in 1976. Australian exports of beef and veal are
expected to rise 16 percent in 1977. Higher relative domestic prices for beef
resulting from an 18-percent devaluation of Australia's currency against the
U.S. dollar in the fall of 1976 were expected to cause some decline in Australian
domestic consumption of beef, as exports would be expected to increase. How-
ever, a shortage of sheep meat caused Australian beef consumption to trend
slightly upward.
Australia's 1977 beef and veal exports are projected by the U.S. Depart-
ment of Agriculture to be distributed as follows:
Market
United States--------------------: U.S.S.R--------------------------: Japan----------------------------: Middle East----------------------: Eastern Europe-------------------: Canada---------------------------: EC-------------------------------: Minor markets--------------------:
Percent of total beef and veal exports 1/
1/ Total does not add to 100 percent because of rounding.
44 11 10
8 7 4 4
11
Restrictions on beef imports into the European Conununity and Japan
and the United States' voluntary restraint program have led many beef
exporting countries to seek additional markets. Australia has increased
exports to the U.S.S.R., East European countries, and the Middle East
in recent years.
75
New Zealand
Although New Zealand accounts for only a small part of world out
put of beef and veal, it produces about 8 percent of total beef and veal
produced by major beef exporters and has long been a leading exporter
of these prodtiets. In 1974, faeed w:lth unatt:t,active ·prices and
favorable grazing conditions, New Zealand producers held cattle off
slaughter markets, cutting back production of beef and veal.
In 1975, a substantial domestic supply of cattle on the hoof gave rise
to a large number of cattle slaughtered, and New Zealand's output of beef
and veal increased. High slau~hter rates continued. throughoutl976,
and beef and·veal o~tput increased further to 1.4 billion pounds. High
slaughter rates.have reduced New Zealand's potential suunly of beef and
veal for- 197~ and production is forecast to decrease 13.percent.
New Zealand's exports of beef and veal declined in 1974 and then
rose in 1975 as New Zealand increased exports to the United States, the
Soviet Union, and Canada and expanded to new markets in the Middle and
Far East. New Zealand's 1976 beef and veal exports increased substantially,
reaching 836 million pounds, as high slaughter rates and low domestic prices
prevailed. In 1977, New Zealand's exports of beef and veal are projected
to decrease slightly owing to decreased production and continued import
restrictions in major markets.
New Zealand's 1977 beef and veal exports are projected by the U.S.
Department of Agriculture to be distributed as follows:
76
Market Percent of total
:beef and· veal exports 1/
United States------------------: Canada-------------------------: u.s.s.R------------------------: European Community-------------: Far East and South East Asia---: Middle East--------------------: Minor markets------------------:
55 12 12
5 5 2
10
1/ Total does not add to 100 percent because of rounding.
Argentina
Argentina's economy is closely allied to the level of beef exports.
The country depends mainly on the European Community to absorb most of
the portion of its beef and veal production available for export. Sales
to new markets face strong competition from Australia and New Zealand.
Argentina's exports of beef and veal to the United States consist entirely
of processed products--principally canned corned beef. !/ Fresh, frozen,
or chilled Argentine beef is not allowed in the United States owing
to health regulations prohibiting imports from countries where foot-and-
mouth disease exists.
In 1974, Argentina's beef and veal production rose slightly after
a small drop. in 1973. Exports fell by nearly half in 1974, a year
o::f economic recession in Europe. In 1975 a high slaughter
rate prevailed, and beef and veal production increased 13 percent;
Argentina's 1975 beef and veal exports fell 8 percent. High slaughter
rates continued in 1976 as beef and veal production rose to
1/ On Mar~ 1, 1977, the duty preference for Argentine canned corned beef, which had been granted under the Generalized System of Preferences given developing countries, was removed. The concession was rescinded when U.S. imports of canned corned beef from Argentina exceeded the values permitted for the 1976 calendar year.
77
6.2 billion pounds, and Argentina's 1976 beef and veal exports nearly
doubled to 1.2 billion pounds. Argentina's 1977 exports are £r9jected
to remain ;:it <ibQut 1976 levels~
Other meat exporting countries
Uruguay, Central America, 1/ and Mexico accounted, respectively,
for 9, 6, and 1 percent of total 1976 exports of beef and veal by
major beef exporting countries. Uruguay, like Argentina, exports much
of ils beef and veal to European Community countries; exports of
Uruguayan fresh, frozen, or chilled beef to the United States are pro
hibited by the same U.S. health regulations that affect Argentina.
Central America and Mexico send most of their exported beef and veal to
the United States. However, several Central American countries are
attempting to diversify their markets (some have made increased sales
to Venezuela and sales to Israel), and Mexico has sold approximately 0.5
percent of its projected 1977 beef and veal exports to Japan.
Uruguayan beef and veal exports increased. in 1974 and then decreased
'S.Omewhat in 1975 subsequent to the imposition of EC import restric-
tions on meat products. Uruguayan beef and veal exports increased 73
percent in 1976 as EC beef and veal imports increased nearly 60 percent
over 1975 levels; however, projections of Uruguayan beef and veal exports
indicate no rise in 1977.
"};./ Including Caribbean countries.
78
In Central America, beef and veal production dropped slightly in
1974 but rose in 1975 and 1976 as slaughter rates were increased above
1975 levels. A small increase in beef and veal production is projected
in 1977. Central American beef and veal exports have paralleled production
trends, falling in 1974 and rising in 1975 and 1976. Central American beef
and veal export volume is currently more or less determined by the level
of imports into the United States permitted under the U.S. Meat Import
Act. In 1977, Central American beef and veal exports are projected to
increase 13 percent.
Mexico is gradually becoming less of a major exporter of beef and
veal as domestic demand for these products steadily grows. Although
its production level in recent years has averaged about 14 percent of
all beef and veal produced by the major beef and veal exporting countries,
Mexico exports only about 1 percent of all the beef and veal exported by
those countries. Mexican exports trended sharply down in 1974 and 1975,
sharply up in 1976, and are projected to increase less sharply in 1977.
79
U.S. IMPORTS
Live Cattle
From 1967 to 1976, U.S. imports of live cattle, excluding cattle ,for
breeding, fluctuated considerably (table 37, fig. 13). Imports in 1967
amounted to about 740, 000 head o-f cattle; from 1968 to 1973, about 1 million
head a year entered the U.S. market. Imports dropped sharply in 1974
and 1975, a period of sharply declining cattle prices in the United
States. By 197~ approximately one-third as many head of cattle were
imported as in 1972. In 1976,imports rose to almost 973,000 head, a
level comparable with that of the late 1960's and early 1970's. J:../
From 1967 to 1974,approximately 80 percent of the number of cattle
were in the 200 to 699-pound category. In 1975 and 1976, there occurred a
significant increase in the importation of live cattle weighing 700
pounds or more. In value terms, this category was the most important
one for these 2 years.
Mexico and Canada are the two principal supplying countries of
livestock to the United States (table 38). Except for 1975 and 1976,
Mexico has consistently provided a much larger number of live cattle
to the United States than has Canada. Almost all the imports from
Mexico have been feeder cattle weighing from 200 to 699 pounds. In
the other weight categories, i.e., under 200 pounds and 700 pounds and
over, most of the imports have come from Canada. In recent years, most
of the cattle from Canada have consisted of veal calves and cows for
innnediate slaughter.
Imports of live cattle are a very small addition to the U.S. domestic
supply of cattle each year. From 1967 to 1976 the number of dutiable
1/ Of the value of imports of live cattle in 1976, only 2 percent of the total involved related-party transactions: virtually all the transactions were at arm's length.
FIGURE 13..-CAmE: U.S. iMPORTs, 1967-76. 1200
1100
rn~m
900 . *· 800 * ·*. 700
~ 600 :::c u.. 0 si.:rn C/)
. \· ~ C/) "ilim
~ 300
/
'20111
10111
0 1967 1968 19Ei9 197f4 1971 1972
YEAR SouRcE: BAsED ON DATA IN TABLE 37.
*
1973
TOTAL IMPORTS * · · · · * FROM MtX I CD t- - - -;i: FROM CANADA
* *
197~ 197S 1976
ex: 0
81
live cattle imported (i.e., all cattle imported except those for breed-
ing purposes) was less than 1 percent of the annual available domestic ·
supply of live cattle (table 39J.
The two major ports of entry for cattle in 1976 were El Paso,
Tex., and Pembina, N. Dak. (table 40). The inereased ·flow of imports from
Canada compared with imports from Mexico helps expla·in the shift in the
pattern of entry of live cattle imports by customs districts since 1974,
when the top four districts were all on the U.S.-Mexican border.
Questions were raised by domestic producers as to the impact that
U.S. imports of live cattle from Canada and Mexico have on the price of
cattle in U.S. regional markets near the U.S. borders with these two
countries. Recently a high percentage of U.S. imports from Canada
have been slaughter cows weighing over 700 pounds. To see whether these
imports were having an impact on cow prices at u~s .. markets near the Canadian
border vis-a-vis those further inland, weekly prices of Utility cows at
South St. Paul, Minn., and at Omaha, Neb., were compared with western
Canadian exports to the U.S. of cattle for slaughter weighing over 700
pounds. Four different 10-week periods during 1976 and 1977 were used.
The price differential between South St. Paul and Omaha was used on the
theory that when imports from Canada rise, the price at South St. Paul
should fall relative to that in Omaha and the differential should diminish. :!_/
l_/ Utility cow prices at South St. Paul are generally higher than those at Omaha. More Canadian imports should reduce demand at South St. Paul relative to Omaha owing to the farmer's much closer proximity to Canada.
82
Hence, one expects an inverse relationship between the price differences
and imports. A correlation analysis of the data results in a correlation
coefficient of -0.22, which indicates that there was not a significant price
impact. 1_/
U.S. live cattle imports from Mexico consist principally of feeder calves
weighing between 200 and 700 pounds. To ascertain whether these imports
were affecting prices at U.S. markets near the Mexican border, prices of
Choice feeder calves (steers) at Alice, Tex., close to the Mexican border,
were compared with those at Amarillo, Tex., located much further inland.
Weekly import flows through the Laredo customs district were compared with
the Alice-Amarillo price differential. If imports increase, one expects
this differential to diminish or become more negative. Thus, a negative
relationship would be expected if Mexican imports have a greater price
impact on regional markets near the border than on markets further inland.
The correlation coefficient between imports and the price differentials
was -0.066, which indicates almost no relationship between these two
variables and that, therefore, there was no significant price impact.
Both the Canadian and Mexican data used here indicate no significant
regional price impact of live cattle imports.
Meat of Cattle
Volume and trend
In terms of product weight, U.S. imports of beef and veal (includ-
ing edible offal and processed products) in 1976 amounted to 1.5 bil-
lion pounds, valued at $924 million (table 41). Imports rose from
±../ The correlation coefficient is a measure of linear association. It enables one to determine whether the hypothesis that the level of imports and the price differential are related is a tenable one.
83
approximately 1 billion pounds to just over 1.5 billion pounds during
the 1967-73 period, a time of herd expansion and rising cattle and
beef prices in the United States (figs. 14 and 15). From late 1973 through
early 1975, cattle and beef prices in the United .. States were relatively
low. As expected, imports fell from their 1973 peak, with the values
dropping to a-greater extent than the quantities owing to price declines
(see section on import prices). U.S. prices for cattle and beef have
recovered somewhat since early 1975, and the same is true for beef imports.
While the 1976 import quantity is approximately the same level as the
1973 quantity, it was valued at about $250 million less. 1/
The most important import item is fresh, chilled, or frozen bone--
less beef, of which over 1.2 billion pounds, valued at over $730 million,
cent chemical lean beef. Only two other· import items were valued at
over $50 million in 1976--corned beef and beef and veal, prepared, pre-
served, valued over 30 cents per pound (also known as frozen, "cooked
beef"). Imports of corned beef have shown some growth since 1967. Other
items of beef and veal have been imported in small quantities in recent
years.
The principal supplying countries
In 1976 the major sources of beef and veal imports into the United
States were Australia and New Zealand, which together accounted for over
60 percent of the quantity of imports and almost 60 percent of the
import value (table 42). No growth in imports from these two countries
!_/ Of the value of imports of meat of. cattle in 1976, about 20 percent of the total involved related-party transactions; virtually all the transactions were at arm's length.
Tl-OUSANDS OF POUNDS
1800
1?00
900
300
---
...
FIGURE 14.-BEEF AND VEAL: U.S. IMPORTS FOR CONSl."1PTION, IN TE:lMS OF QUANTITY'.,' J967-76·.·
TOTAL 5EEf AND VEAL - - - -· - · FRE5H1 FROZEN1 OR CH I LLED * · · · · · · · · · * RLL OTHER BEEF
has occurred since 1972. Other principal supplying countries in 1976
were those of Central America, Argentina, Canada, Brazil, and Mexico.
Imports of beef and veal, fresh, chilled or frozen, covered by the
Meat Import Act, come principally from Australia and New Zealand
(table 43). Other major sources are the Central American countries,
Canada, and Mexico. In 1974,imports from Ireland were approximately at
the same value and quantity as those from Canada and Mexico, but since
then they have dropped substantially to a very low level. For' imports
of beef, bone in, Canada was the main traditional source in the 1972-76
period, with the exception of 1974 when almost half came from Central
America. Veal imports have increased from New Zealand, and decreased,
almost equally, from Australia. Veal imports from Canada and Mexico
have diminished very sharply since 1972. In 1976, approximately 60
percent of veal imports came from New Zealand.
Imports of beef not covered by the Meat Import Act came
principally from Argentina and Brazil during the 1972-76 period (table
44). These two countries have supplied at least 80 percent of the U.S.
import market for corned beef; in 1976, they supplied over 90 percent.
While imports in 1976 from each source amounted to about 46 million
pounds, the Brazilian product was valued about $5 million more than the
Argentine. For the remaining beef imports, Argentina has been the
principal source since 1972, and Brazil has been the second most impor
tant one. Imports of these beef products from Central America have
declined substantially since 1972, whereas imports from Australia and
New Zealand have grown considerably; nevertheless, imports from
87
Oceania in 1976 still accounted for a very small portion of this import market.
Canada's small share has decreased over the 1972-76 period. Imports of edible
meat offal (not covered by the Meat Import Act) have come primarily from Canada
(table 45).
U.S. entry ports
The major ports of entry for U.S. imports of beef and veal, fresh, chilled,
or frozen, in 1974-76 were New York, Philadelphia, and Miami (table 46). Most of
these imports are further processed near the ports of entry. These areas are
generally distant from the major beef-producing areas of the United States. Major
entry ports for corned beef in 1976 were Philadelphia, New York, San Juan, San
Francisco, Mobile, New Orleans, and Baltimore (table 47). In quantity terms, all
imports through these ports have grown since 1974 except for those through New
Orleans. For other beef in airtight containers, major entry points in 1976 were
Philadelphia, Mobile, and San Francisco (table 48). Imports through Houston have
declined substantially since 1974.
The Conditions of Competition from Imports of Beef and Veal in the Period Preceding the Meat Import Act of 1964 and Those of the Current Period
Before the late 1950's, imports had supplied only a negligible part of the
beef and veal constuned in the United States. By 1958, however, imports supplied
6.3 percent of consumption, and by 1963, the year before the enactment of the Meat
Import Act, they had increased to 9.1 percent of consumption. In terms of product
weight, U.S. imports of beef and veal increased from 941 million pounds in 1958
to 1,702 million pounds in 1963, or by about 80 percent. The act became effective
on January 1, 1965, and afforded cattlemen a degree of protection from imports not
enjoyed by many other industries. Since then, imports have not shared in the U.S.
market as they did prior to enactment of the act. Rather, they have averaged
about 7 percent of consumption. Moreover, imports of beef and veal have not in-
88
creased as dramatically in recent years as they did during the 1958-63 period. In
1971, for example, imports of beef and veal amounted to 1,756 million pounds and
in 1976, they amounted to 2,006 million pounds, for an increase of 14 percent.
With regard to the restrictiveness of the act, the U.S. Department of Agriculture
has estimated that imports of beef and veal in 1976 would have been 307 million
pounds greater (an increase of 25 percent) in the absence of the restraints in effect
in that year and in 1977, they would have been 300 million to 350 million pounds
greater (an increase of 27 percent). 1/
Although imports have been a known factor in the marketplace·since enactment
of the Meat Import Act and their share of consumption has remained relatively
stable, cattlemen have not fared as well in recent years as they did before the
act. In recent years, production costs rose rapidly,and, concurrently, cattle
prices did not keep pace with costs. In the 1958-63 period, for example, the parity
ratio for beef cattle averaged about 90 percent. In 1971-76, however, it averaged
77 percen4 and in 1975 and 1976, it was only 58 percent and 59 percent, respectively.
All farm products in 1975 and 1976 averaged 76 percent and 71 pereent of party,
respectively.
The Meat Import Act has held beef and veal imports quite stable relative to
consumption. At times when domestic supplies have been limited, such as in 1973,
the act has been administered so as to allow unlimited imports, thus stabilizing
prices and assuring consumers of adequate supplies. On the other hand, when sup-
plies have been plentiful (e.g., 1975 and 1976) the act has been administered so
as to provide for voluntary restraints on exports to the United States, or, as in
October 1976, to implement an actual import quota, Thus, the act has provided a
degree of stability for consumers and, at the same time, has maintained imports at
levels lower than otherwise might have occurred.
1/ U.S. Department of Agriculture, "Meat Import Options for 1976" and "Meat Import Options for 1977." No date.
89
U.S. CUSTOMS TREATMENT
Live cattle and meat of cattle fit for human consumption are
provided for in parts 1 and 2 of schedule 1 of the Tariff Schedules
of the United States which became effective on August 31, 1963. From
June l~. 1930, to August 30, 1963, inclusive, these articles were
classified under paragraphs 701, 706, and 1606 of the Tariff Act of
1930, as amended. Table 49 shows the statutory rates of duty and the
rates applying to imports from most-favored nations (MFN) (a) in effect
in 1967 prior to the implementation of certain reductions ne~otiated
during the Kennedy round and (b) presently in effect. 1/
1/ The term "statutory rates" refers to the rates of duty set by Co;-gress in the Tariff Act of 1930, the so-called Smoot-Hawley tariff. The rates of duty applicable to most articles imported from our trading partners have been negotiated downward, and sometimes eliminated, since 1930 as a result of various bilateral and multilateral trade agreements between the United States arid other countries. The most recent comprehensive multilateral agreement was concluded in 1967 as a result of the Kennedy round negotiations. As a result of those negotiations, rates of duty on numerous articles were reduced or eliminated, generally in stages beginning Jan. 1, 1968, with final implementation on Jan. 1, 1972. These negotiated rates are applicable only to goods imported from most-favored nations. Rates of duty applicable to MFN countries are set forth in colUJiln 1 of the TSUS. Rates of duty applicable to non-MFN countries--all Communist countries, with the exception of Poland, Yugoslavia, and Romania, which have been granted MFN status--are set forth in column 2 of the TSUS. The column 2 rates are all statutory rates. The column 1 MFN rates are primarily negotiated rates and thus lower than the statutory rates. The same statutory rates appear in both columns 1 and 2 on articles for which there has been no negotiated reduction in rates of duty.
90
By virtue of the so-called Meat Import Act of 1964(Public Law
88-482, approved Aug. 22, 1964; 19 U.S.C. 1202), further discussed
elsewhere, meat of cattle provided for in item 106.10 of the TSUS may be
made subject to an absolute quota by Presidential proclamation should the
annual ratio of imports to domestic commercial production increase over
the analogous weighted average annual ratio for the period 1959 'through
1963, inclusive.
The quarantine and sanitary regulations administered by the U.S.
Department of Agriculture operate to restrict and even prohibit imports
of cattle, beef, veal, and beef products from certain areas. 1_/ For
example, imports of cattle and fresh, chilled, or frozen beef, veal,
and beef products are limited to those countries that have been
declared free of rinderpest and foot-and-mouth diseases by the U.S.
Secretary of Agriculture. Because of the existence of such diseases
in many of the important meat-producing countries of South America,
meat imports from those countries, in recent years, have virtually all
been in the form of cooked, canned, or cured meats. The general effect
of such prohibitions has been to limit imports of fresh beef to those
from Australia, New Zealand, Central America, North America, and small
areas of Europe and Asia.
1/ Pursuant to sec. 306 of the Tariff Act of 1930, as amended (19 u.s.c. 1306).
91
Tariff Treatment for Live Cattle
Imports of live cattle, other than purebred animals for breeding
purposes, 1./ are provided for in items 100.40 through 100.55, inclusive,
of the TSUS. For purposes of the TSUS, the term cattle includes all
such animals, including calves and dairy cows, regardless of sex, size,
or age.
The TSUS breaks such live cattle imports into 3 basic weight cate-
gories--under 200 pounds each, 200 pounds or more but under 700 pounds
each, and 700 pounds or more each. Subcategories within the under 200
pound and 700 pounds and over categories set tariff-rate quotas on
certain live cattle imports. Dairy cows weighing over 700 pounds each
are also specially provided for in a subcategory.
Cattle weighing under 200 pounds each are provided for in TSUS
items 100.40 and 100.43. Item 100.40 provides for the entry of a
quota of not more than 200,000 head in a 12-month period beginning
April 1 in any year at a tariff rate of 1.5 cents per pound from MFN
countries. All overquota imports enter under item 100.43 at the rate
of 2.5 cents per pound. The average ad valorem equivalent of the rate
of duty on the cattle entered under item 100.40 in 1976 was 5.1 percent;
for item 100.43, the average ad valorem equivalent was 9.5 percent.
Cattle weighing 200 pounds or more but under 700 pounds each are
provided for in item 100.45 of the TSUS. The statutory rate of 2.5
cents per pound applies to all such imports; the rate has not been
reduced as a result of post-1930 trade agreements. The ad valorem
equivalent of the duty on such imports averaged 8.0 percent in 1976.
1/ Such purebred animals enter under TSUS item 100.01 and are free of duty.
92
Cattle weighing 700 pounds or more each, if cows imported specially
for dairy purposes, enter under TSUS item 100.50; otherwise, such cattle
are subject to a tariff quota and enter under item 100.53. Those cattle
imported in excess of the quota provision of item 100.53are entered under
item 100.55 of the TSUS. The MFN rate of duty for the dairy cows
entered under TSUS item 100.50 is 0.7 cent per pound. The rate had
been 1.5 cents per pound prior to the Kennedy round tariff reductions.
This rate of duty was the only one of the six TSUS item rates covering
imports of live cattle that was reduced as a result of the Kennedy
round agreement. The ad valorem equivalent of the MFN rate of duty
averaged 1.7 percent in 1976.
The MFN rates of duty for the other cattle weighing 700 pounds
or more each, provided for in items 100.53 and 100.55 of the TSUS,
are 1.5 and 2.5 cents per pound, respectively. Item 100.53
provides for the entry of not over 400,000 head in the 12-month period
beginning April 1, in any year, of which not over 120,000 may be
entered in any quarter beginning April 1, July 1, October 1, or January
1. Overquota imports enter under item 100.55 at the higher duty of
2.5 cents per pound. In 1976 the ad valorem equivalent of the 1.5-
cents-per-pound rate of duty averaged 5.~ percent and that of the
2.5-cents-per-pound rate averaged 11.9 percent.
93
Tariff Treatment for Meat of Cattle
Meat of cattle of the types covered in this investigation is
provided for in items 106.10, 106.80, 106.85, 107.20, 107.25, 107.40,
107.45, 107.48, 107.52, 107.55, 107.60, and 107.75 of the TSUS. Such
meat of cattle includes beef and veal and the edible meat offal of
cattle, whether or not such meat is fresh, chilled, or frozen, or
prepared or preserved, and whether or not it is in the form of sausages
or mixed with other kinds of meat.
Heat (excent meat offal) o~ cattle, fresh, chilled, or frozen
The bulk of the imported meat of cattle enters under TSUS item
106.10, which provides for meat (except meat offal) of cattle (i.e.,
both beef and veal), fresh, chilled, or frozen. All such imports under
item 106.10 may be made subject ~o an absolute quota pursuant to the
Meat Import Act. Meat entering under item 106.10, if from an MFN
country, is dutiable at a rate of 3 cents per pound. This trade-agree
ment rate has been in effect since 1948. The average ad valorem
equivalent of the MFN rate of duty was 5 percent in 1976.
Edible meat offal
Edible meat offal~ fresh, chilled, or frozen~ of all animals .......
including cattle, but excluding birds--enters under item 106.80, if
valued not over 20 cents per pound or item 106.85, if valued over 20
cents per pound. Such offal, if valued not over 20 cents per pound,
is dutiable at a rate of 0.5 cent per pound if from an MFN country. The
average ad valorem equivalent of the MFN rate of duty for such offal
was 3.4 percent in 1976. Offal valued over 20 cents per pound is
dutiable at a rate of 2.5 percent ad valorem if from an MFN country.
Rates of duty on offal imported from MFN countries were reduced by
94
50 percent as a result of the Kennedy round tra~~ agreements. Further,
offal, if imported from designated developing country, has been
eligible since January 1, 1976, for duty-fre~ treatment under the
Generalized Sy$tem of Preferences (GSP). }:_/
Sausages
Beef sausages in airtight containers enter under TSUS item 107.20
and "other" beef sausages enter under TSUS item 107.25. Beef sausages
in airtight containers entering under TSUS item 107.20 are dutiable at
a rate of 7.5 percent ad valorem if from MFN countries, and "other"
beef sausages entering under TSUS item 107.25 are dutiable at a rate
of 5 percent ad valorem if from MFN countries. The MFN rates for both
items were reduced by SO percent as a result of the Kennedy round
agreements. Beef sausages entering under TSUS items 107.20 and 107.25
are eligible for duty-free treatment under the GSP.
Beef and veal, prepared or preserved (except sausages)
Beef or veal, cured or pickled, valued not over 30 cents per pound,
enters under TSUS item 107.40 at a rate of 3 cents per pound if from an
MFN country, and such beef and veal valued over 30 cents per pound enters
under TSUS item 107.45 at a rate of 10 percent ad valorem, if from
an MFN source. Such beef or veal has been designated as eligible for
duty-free treatment under the GSP. There have been no known imports
entered under TSUS item 107.40 since 1971.
Beef, prepared or preserved, in airtight containers, enters under
TSUS item 107.48, if corned beef, and under TSUS item 107.52, if other
such beef. Such beef is generally canned, but it may also be in sealed
1/ The Generalized Syst~m of Preferences is provided for in title V of the Trade Act of 1974 (19 U.S.C. 2461 et seq.).
95
plastic packages. The MFN rate of duty for both items is 7.5 percent
ad valorem. Both rates were reduced by 50 percent as a result of the
Kennedy round agreements.
Other types of beef and veal, prepared or preserved--that is,
other than sausages, beef, or veal, cured or pickled, or beef in air
tight containers--enters under TSUS item 107.55, if valued not over
30 cents per pound, and under TSUS item 107.60, if valued over 30
cents per pound. The MFN rates of duty on TSUS items 107.55 and
107.60 are 3 cents per pound and 10 percent ad valorem, respectively~
Both rates were last reduced in 1948. The ad valorem equivalent of
the 3-cents-per-pound rate of duty was 11.2 percent in 1976.
Mixtures of beef and other meats
Products containing mixtures of beef and other meats, such as
certain types of salami, enter under TSUS items 107.70 or 107.75,
which provide for "other meats and edible meat offal. " The MFN
rate of duty on such imports is 5 percent ad valorem. The pre-Kennedy
round rate was 10 percent.
96
Other Government Regulations Affecting Imports
The Meat Import Act of 1964 1/
The Meat Import Act was passed, among other reasons, to protect
the domestic cattle industry. In the view of the Committee on
Finance of the U.S. Senate, the industry was "caught in the crossfire
of rising production cos ts and decreased product prices. " ]:./ The
Committee concluded, on the basis of price data provided as a
result of a Commission study, ]._/ "that imported meat has played an
important part in creating the distressed market conditions" in the
industry. !±_/ The Committee noted that imports of beef accounted
for one-half of the total increased domestic use of beef over the
8-year period 1956-63. ii
Under section 2(a) of the Meat Import Act, the aggregate quantity
of fresh, chilled_, or frozen beef and veal (TSUS' item 106 .10) and meat
of mutton and goats (except lambs) (TSUS item 106.20) which may be
imported into the United States in any calendar year beginning after
December 31, 1964, should not exceed an adjusted base quantity. !!_/
Provision is made that this base quantity (725,400,000 pounds) shall
be. increased or decreased for any calendar year by the same percentage
that estimated average annual domestic commercial production of these
1/ Reproduced as app. C. ""'jj S. Rept. No. 1167, 88th Cong., 2d sess. 2, reprinted in /l964/
U.S. Code Con_g_. and Ad. News 3070, 3071 Lhereinafter cited as-Meat Import Report/.
]_/ Report -;n Investigation No. 332-44 (Beef and Beef Products) Under Section 332 of the Tariff Act of 1930 Pursuant to a Resolution of the Committee on Finance of the United States Senate Adopted November 20, 1963, TC Publication 128, June 1964.
4/ Meat Import Report, note 3, page 1 at 3074. i/ Ibid at 3071 !!._/ For practical purposes, imports of beef and veal (TSUS item 106.10)
are the significant imports.
97
articles in that calendar year and the 2 preceding calendar years
increases or decreases in comparison with the average annual domestic
production of these articles during the years 1959 through 1963,
inclusive.
A 10-percent overage is allowed, so that only when imports are
expected to exceed the adjusted base quota level by 10 percent are
those quotas triggered. Each year the Secretary of Agriculture is
required to publish in the Federal Register the estimated quantity that
would trigger the imposition of quotas under the law, and quarterly, the
quantity of meat that, but for the la~, would enter the United States in
such calendar year.
If the Secretary's estimate of imports exceeds the trigger level,
the President is required by law to proclaim quotas on imports of meats
subject to the law. The quota proclamation may be suspended or the
total quota quantity increased, if the President determines and proclaims
pursuant to section 2(d) that--
(1) such action is required by overriding economic or national security interests of the United States, giving special weight to the importance to the nation of the economic well-being of the domestic livestock industry;
(2) the supply of articles of the kind described . . . will be inadequate to meet domestic demand at reasonable prices; or
(3) trade agreements entered into after the date of the enactment of this act ensure t~at policy set forth will be carried out.
Section 2(d) further provides that any such suspension shall be for such
period, and any such increase shall be in such amount, as the President
determines and proclaims to be necessary to carry out the purposes of
section 2(d).
98
Section 204 of the Agricultural Act J../
Section 204 of the Agricultural Act of 1956 (7 U.S.C. 1854) authorizes the
President to negotiate agreements with foreign governments to limit the export from
such countries and the importation into the United States of any agricultural com-
modity or product manufactured therefrom. Section 204 also provides that when a
bilateral agreement has been concluded under section 204 among countries accounting
for a significant part of world trade in the articles with respect to which the
agreement was concluded, and remains in effect, the President may also issue regu-
lations governing the entry or withdrawal from warehouse of the same articles which
are products of countries not parties to the agreement.
The President has used this authority from time to time since 1964 as an adjunct
to the Meat Import Act. He has had the Secretary of State negotiate numerous bilat-
eral agreements with countries supplying beef and veal to limit their exports below
the respective calendar-year trigger levels established under the Meat Import Act.
All of the bilateral agreements negotiated have been substantively the same,
except that shares of the adjusted aggregate import quota for each calendar year
are allocated (pursuant to section 2(c) (3) of the Meat Act)--
. . . among supplying countries on the basis of the shares such countries supplied to the United States market during a representative period of the articles described ... , except that due account may be given to special factors which may have affected or may affect the trade in such articles.
Each agreement sets forth the rights and obligations of each party. The
agreements do not purport to be comprehensive in the sense of providing enforce-
ments, compensation, or penalty provisions.. A typical agreement states the· total
amount of imports the United States will permit into the country from participants
in the voluntary restraint program and the portion of that quantity which the
signatory will receive. Additionally, there is usually a provision permitting the
United States to limit imports to that level by the issuance of regulations
governing entry or withdrawal from warehouse, along with a provision permitting the
l_/ Reproduced in app. C.
99
United States to increase the total amount imported under the program and allocate
shortfall resulting from some countries being incapable of filling their negotiated
levels. Finally, the agreements almost always contain provisions stipulating the
representative period for computation of possible quotas, and calling for consulta-
tion on interpretative questions and questions on total import increases.
History of meat imports under the Meat Import Act and Section 204 of the Agricultural Act
During the first 3 years that the Meat Import Act was in effect (i.e., 1965-67),
meat imports were below the adjusted base quotas and the trigger levels (see tables
in app. C).
In mid-1968, it became apparent for the first time that imports might exceed
the trigger level. Accordingly, in August 1968, Australia and New Zealand were
asked to restrain shipments voluntarily in order to avoid quotas. Imports in 1968
were ultimately above the base quota level but below the trigger level.
When imports reached levels that threatened to trigger the quotas under the
Meat Import Act, that act and section 204 of the Agricultural Act were used in
conjunction with each other to forestall the imposition of quotas. The Meat Import
Act quotas come into effect when imports are estimated to exceed the adjusted base
quota by 10 percent~ however, the President may suspend such quotas. When such
quotas come into effect they can restrict imports to the adjusted base quota amounts.
Since it is advantageous to the exporting countries to ship quantities approaching
the trigger levels for the Meat Import Act quotas and at the same time not exceed
the trigger levels lest quotas be imposed reducing the shipments to the adjusted
base quota, exporting countries were receptive to negotiating voluntary restraint
levels under section 204 which would not exceed the trigger levels under the Meat
Import Act. No country wanted another country to take unfair advantage and have ~
disproportionate share of the total quota, and each country might prefer to fill a
known quota in the way it finds most advantageous to itself. The provision of
section 204 allowing the President to impose regulations_governing imports from
countries not a party to the agreement, when bilateral agreements have been con-
100
eluded with countries accounting for a significant part of world trade, encourages
all supplying countries to agree to restraint levels or face unilaterally imposed
restrictions.
In 1969_, all major supplying countries, except Canada and the United Kingdom,
agreed to an informal restraint level below the trigger level (see table C-2 in
app. C ). Special restrictions on imports from Honduras were agreed to bilate
rally in November 1969 and were enforced to keep imports within agreed-to restraints.
Imports in 1969 exceeded the adjusted base quota level and approximately equalled
the trigger level.
In 1970, a restraint program was again negotiated. Imports in the first half
of the year were very heavy and, as a result, two actions were taken at mid-year-
(1) the President proclaimed and then suspended quotas in view of "overriding eco
nomic interests of the United States" (Proclamation No. 3993, 3 CFR 491 (1970)),
and a new restraint level was authorized at a level higher than the trigger level,
and (2) section 204 was used to embargo transshipments through Canada, closing a
loophole in the program. Section 204 was also used to hold five supplying countries
to their restraint agreements. Actual imports in 1970 were 1,170.4 million pounds,
171.6 million pounds over the 998.8-million-pound adjusted base quota level and
71.7 million pounds over the 1,098.7-million-pound trigger level.
In 1971, the restraint program continued at the level established in late 1970.
Because this level was higher than the 1971 trigger level, the President took
action to proclaim and suspend quotas (Proclamation No. 4037, 3 CFR 16 (1971)).
Actual 1971 imports were slightly higher than the suspended trigger level, but they
were below the negotiated restraint level largely because of U.S. dock strikes.
In 1972, a restraint program 7 percent higher than the 1971 program was agreed
to by the principal supplying countries. In March, the President suspended the
quota proclamation in order to encourage greater shipments of beef to the United
States (see Proclamation No. 4114, 3 CFR 115 (1972)).
101
In 1973 and 1974, quotas were again invoked by the President and simultaneously
suspended (see Proclamation No. 4183, 3 CFR 208 (1973); and Proclamation No. 4272,
3 CFR 338 (1974)). There were no new voluntary restraints negotiated during those
2 years. In 1973, imports of meats subject to quota, ~t 1.36 ~illion pounds, ex-
ceeded the trigger level by 200 million pounds. In 1974, imports were 1.08 billion
pounds, 50 million pounds below the trigger level.
In 1975, voluntary restraints were negotiated again, for the first time since
1972. No proclamations were issued. Imports in 1975 were 1.21 billion pounds, 27
million pounds over the trigger level. 1/
In 1976, voluntary restraints under section 204 were again negotiated. On
October 8, 1976, the Secretary of Agriculture published fourth-quarter estimates
which indicated that imports for the calendar year would exceed the 110-percent
trigger level (estimated imports were 1.25 billion pounds and the trigger level was
1.23 billion pounds). On October 9, 1976, the President issued Proclamation No. 4469,
3 CFR 62(1976), proclaiming (1), ·in conformity with section 2(c) of the act, a
quota of 1,120.8 million pounds (the adjusted base quota); and (2), pursuant to
section 2(d) of the act, that it was required "by overriding economic interests of
the United States" to increase the quota by 112.1 million pounds. The sum of 1,120.8
million pounds and 112.1 million pounds is 1,232.9 million pounds, the trigger level
in 1976. Actual imports in calendar 1976 were 1,231.7 million pounds, just slightly
under the quota limit.
In 1977, voluntary restraints under section 204 were negotiated for a quantity of
1,271.9 million pounds. Imports from Canada were for the first time covered in such
agreements. The 1977 arrangements also provided that entries of meats processed in U.S.
foreign-trade zones, trust territorities, or possessions after January 1, 1977, will be
counted against the individual country limitations. ~
]:_/ The overage was apparently due in large part to poor statistics. In 1975, the Department of Agriculture used census data in making its estimates. Such data generally were not available until 6 weeks after the actual imports occurred. In 1976, the Department of Agriculture worked out a new arrangement with the U.S. Customs Service whereby import data could be obtained on a weekly basis as imports neared the trigger-point level.
]:_/ The provisions relating to U.S. foreign-trade zones, trust territories, or possessions are a result of the importation into the continental United States in 1976 of foreign-produced beef and veal that was processed in the foreign-trade zone at Mayaguez, Puerto Rico, and not counted against quantitative limitations.
102
In summary, in the 12 full years that the Meat Import Act has been in effect,
meat imports have exceeded the base quota nine times and have exceeded the trigger
level five times (but only barely in three of these five instances). In six in
stances the President proclaimed the required base quotas, but in five of those in
stances (in the years 1970-74) he simultaneously suspended them in view of "over
riding economic interest", and in the sixth instance (1976) he increased the quota
level, again in view of "overriding economic interests", to a level equal to the
trigger level. Voluntary restraints were negotiated with most of the major export
ing countries in 5 of these years (1970, 1971, 1972, 1975, and 1976) .•
103
The Federal Meat Inspection Act
Section 20 of the Federal Meat Inspection Act, as amended (21
U.S.C. 620), provides, among other things, that meat and meat products
prepared or produced in foreign countries may not be imported into the
United States "unless they comply with all the inspection, building
construction standards, and all other provisions of this chapter [chap.
12, Meat Inspection] and regulations issued thereunder applicable to
such articles in commerce in the United States". Section 20 further
provides that "All such imported articles shall, upon entry into the
United States, be deemed and treated as domestic articles subject to
the provisions of this chapter [chap. 12, Meat Inspection and the]
Federal Food, Drug, and Cosmetic Act [21 U.S.C. 301] .•. II
Thus, section 20 intends that the foreign meat-exporting country
enforce inspection and other requirements with respect to the preparation
of the products at least equal to those applicable to preparation of
like products at federally inspected establishments in the United States,
and that the imported products be subject to inspection and other
requirements upon arrival in the United States to identify them and further
ensure their freedom from adulteration and misbranding at the time of
entry. 1./ However, section 20 does not provide that the imported products
be inspected by U.S. inspectors during their preparation in the foreign
country. J:../
l./ See U.S. Senate, Agriculture and Forestry Committee, Report on S. 2147, S. Rept. No. 799 (90th Cong. 2d sess.) 1967, as published in 2 U.S. Cong. & Adm. News 19~7,p. 2200. S. 2147, as modified, ultimately became Public Law 90-201 (the Wholesome Meat Act), approved Dec. 15, 1967. '!:../ Ibid.
lOli
The Secretary of Agriculture has assigned responsibility for the
administration of the department's section 20 functions to th~ Foreign
Programs Staff of the Federal Meat and Poultry Inspection Program of
its Food Safety and Quality Service. lf By 1976, FSQS had certified
46 countries as having meat inspection systems with standards at least
equal to those of the U.S. program. At the beginning- of· 1976, ·there
were 1 084 approved foreign plants. 'l:.f
In 1976, :FSQS had· 20 veterinarians· assi,gned to review ;foreign
meat plant operations. Twelve of these 20 were stationed outside the
United States. FSQS had an additional 100 inspectors assigned to the
inspection of meat at the point of entry into the United States. }/
Plants exporting large volumes and other plants having minor problems
or past difficulties in meeting U.S. standards were visited at least
four times annually; all other certified plants are visited at least
twice a year.
All imported meat being offered for entry into the United States
must be accompanied by a meat.inspection certificate issued by the
responsible official of the exporting country. The certificate must
identify the product by origin, destination, shipping marks, and amounts.
It certifies that the meat comes from animals that received veterinary
ante-mortem and post-mortem inspections; that it is wholesome, not
adulterated or misbranded; and that it is otherwise in compliance
with U.S. requirements. ~/
1/ The Foreign Programs Staff of the Federal Meat and Poultry Inspection Program recently was reorganized under FSQS; formerly they had been part of the Animal and Plant Health Inspection Service.
2/ The numbers of certifications refer to all meat, including beef, veal, and poultry. See U.S. Department of Agriculture Foreign Meat Inspection 1976: Report of the Secretary of Agriculture to the Committee on Agriculture and Forestry, U.S. Senate Committee on Agriculture, House of Representatives, March 1977, pp. 1 and 5 (hereinafter cited as Foreign Meat Inspection 1976).
~/ See Foreign Meat Inspection 1976, p. 2 4/ Ibid at p. 6; and 327.2 of the Meat and Poultry Regulations
(9 CFR 327.2).
105
U.S. inspectors at the port of entry inspect part of each shipment.
Statistical sampling plans similar to those used in inspecting domestic meat
are applied to each lot of product inspected in order to ensure that a
representative sample is selected. Samples of frozen products are defrosted
prior to inspection. Canned meat containers are inspected for condition,
and sample cans are opened for inspection of contents. Labels are verified
for prior U.S. approval and the accuracy of stated net weights is checked.
Specimens are routinely submitted to meat inspection laboratories to check
compliance with compositional standards. Sample cans are also subjected
to periods of incubation for signs of spoilage. 1/
Me~t imports are monitored for residues, such as pesticides,
hormones, heavy metals, and antibiotics, by selection of representative
samples for analysis by U.S. laboratories. Special control measures are
in effect for handling of meat from countries when excessive amounts of
residues are detected. The procedures consist of refusing or withholding
entry of the product until results of laboratory analyses are received.
The reconditioning or reworking of unsatisfactory products or
defective lots is not generally permitted in the United States. Exceptions
are made for damaged or dented canned products which may be sorted and
reoffered for entry, and for correction of slight irregularities in labeling.
Not until all examinations and tests show full conformity with U.S. standards
are products allowed to enter U.S. commerce. Products that fail to qualify
are held under U.S. Customs bond until they are reexported, made unusable
for human food purposes, or destroyed. Some refused products may be
permitted entry solely for use in pet food. '5:.1
1/ See Foreign Meat Inspection 1976, at p. 6. I/ Ibid.
106
During. calendar year 1976, approximately 9.3 million pounds of
beef and veal--less than 1 percent of total imports--were refused entry.
No more than 2 percent of beef and veal imports from any major meat
exporting country were refused entry.
107
PROVISIONS OF EXISTING LAW THAT MAY PROVIDE OPPORTUNITIES FOR RELIEF TO CATTLEMEN
Relief from imports may be available to domestic cattlemen under one or more
of the following statutory provisions.
Section 22 Import Restrictions
For many years it has been the policy of the U.S. Government through the U.S.
Department of Agriculture (USDA) to assist the agricultural sector of the economy
by supporting prices of specified agricultural products. From time to time programs
of the USDA have resulted in prices of some products being supported at levels
higher than world prices. It was recognized, therefore, that limitations on imports
were necessary to prevent material interference with the Government programs.
Section 22 of the Agricultural Adjustment Act, as amended (7 U.S.C. 624),
requires the Secretary of Agriculture to advise the President whenever any article
is being or is likely to be imported under such conditions and in such quantities
as to materially interfere with a price-support or other program undertaken by
the USDA. If the President agrees with this advice, 1../ he directs the U.S.
International Trade Commission to conduct an investigation to determine import
interference with price-support programs, and to report to him the Commission's
finding and recommendations. Following receipt of the report, the President, if he
agrees therewith, is required to impose such fees or quotas, within certain
statutory limitations, on the importation of the articles involved as he deems
necessary. For a condition that requires emergency treatment, the President may
take action under section 22 pending the report and recommendations of the Commission.
In a similar manner, the Secretary of Agriculture may advise the President that
conditions have changed and the existing section 22 restrictions may be relaxed.
The President, following advice by the Commission, may liberalize or terminate the
existing import controls on the articles concerned.
1/ The President has the option of doing nothing.
108
Since section 22 was enacted in 1935, import quotas have been imposed on the
following: certain dairy products; cotton, certain cotton waste, and certain cotton
products; wheat and wheat flour; peanuts; rye, rye flour, and rye meal; barley and
barley malt; oats and ground oats; shelled filberts; and tung nuts and tung oil.
Section 22 import fees have been imposed on the following: shelled or blanched
products, barley, molasses, spirits, and bottled olives, have been made subject to
countervailing duties. Most of these duties are still in effect.
1/ The quotas on wheat and wheat flour have been suspended since Jan. 26, 1974, pursuant to Presidential Proclamation No. 4298.
109
Antidumping Act
Under the Antidumping Act, 1921, as amended, special duties may be imposed
on imported merchandise, whether dutiable or free, on wh~ch a dumping finding
has been made. Generally, the dumping duty is imposed on imported merchandise
if the U.S. market price is less than the foreign market price. The duty
collectible is an amount equal to the difference between the U.S. price and the
foreign market price. The foreign market price contemplates the price of goods
purchased in usual wholesale quantities.
Dumping investigations are conducted by the U.S. Customs Service. When the
Secretary of the Treasury advises the International Trade Commission that
merchandise is being sold at less than fair value, i.e., dumped,');_/ the Commission
institutes an investigation to determine whether an .industry in the United States
is being or is likely to be injured. After completion of its investigation, the
Commission notifies the Secretary of the Treasury as to its determination. If
the determination is in the affirmative, the Secretary of the Treasury proceeds
to effect the collection of the dumping duty.
All imports of agricultural products are potentially subject to the impo-
sition of dumping duties. At the present time dumping duties are in effect on
the following agricultural imports: whole dried eggs from Holland, instant
potato granules from Canada, canned Bartlett pears from Australia, and ice cream
sandwich wafers from Canada.
!/ If the Secretary of the Treasury concludes that there is substantial doubt that a U.S. industry is being injured by sales at less than fair value, he refers his findings to the Commission, which then has 30 days to determine whether or not there is reasonable indication that the injury provision has been met. If the Commission reports to the Secretary that there is no reasonable indication of injury, Treasury's investigation is terminated.
110
Unfair Import Practices
Section 337 of the Tariff Act of 1930, as amended (19 U.S.C. 1337), declares
unlawful "unfair methods of competition and unfair acts in the importation of
articles into the United States, or in their sale by the owner, importer, consignee,
or agent of either, the effect or tendency of which is to destory or substantially
injure an industry, efficiently and economically operated, in the United States,
or to prevent the establishment of such an industry, or to restrain or monopolize
trade and cornmer·ce in the United States •. ·. . " When the International Trade
Commission determines a violation of section 337 to exist, it may issue an exclu
sion or a cease-and-desist order. Recently, two agricultural products, chicory and
coffee, were the subiect of investigations under section 337. Both investigations
were terminated by the Commission without a finding of a violation.
Other Avenues of Relief
Under section 301 of the Trade Act of 1974, the President may, in the case
of a subsidized import which is substantially reducing sales of the competitive
U.S. product, impose duties or other import restrictions on the products of the
exporting country, after investigation by the Secretary of the Treasury and the
International Trade Commission.
Section 301 authority may be used only if the President finds that the anit
durnping ~~d the countervailing statutes are inadequate to deter the practices.
The Trade Act of 1974 also provides for adjustment assistance for workers,
firms, and communities as a means of relief from injury caused by import
compeition.
lll
Workers
A group of workers or their certified or recognized union or other duly
authorized representative may file a petition for adjustment assistance with the
Secretary of Labor under section 221 of the Trade Act.
Under the worker adjustment-assistance provisions, workers in a firm qualify
for trade-adjustment benefits if the Secretary of Labor, within 60 days after the
filing of a petition, finds that an absolute or relative increase in imports con-
tributed importantly to the workers' unemployment and to a decrease in sales or
production of the firm from which they have become unemployed.
The Trade Act provides for direct readjustment allowances to workers certified
as eligible for trade adjustment assistance as well as for measures aimed at helping
adversely affected workers to find new employment, including job search, training,
and relocation allowances. Only two agricultural worker petitions have been accepted
by the Secretary of Labor. However, neither of these firms were certified as
eligible for adjustment assistance. 1/
Firms
Firms may file petitions for adjustment assistance with the Secretary of Com-
merce under section 2Sl(a) of the Trade Act. Firms which are found eligible for
assistance are entitled to technical assistance and/or financial assistance in the
form of loans and loan guarantees. The Secretary of Commerce is required to reach
his decision on a firm's adjustment-assistance proposal no later than 60 days after
receiving the firm's application.
1/ The firms and their lines of business were Mid-American Dairymen, Inc. (dairy products) and Kenneth Canning Co. (mushroom canning).
112
The Secretary shall certify a firm as eligible to apply for adjustment assist-
ance if he determines that increases in imports have contributed importantly to the
separation or threat of separation of a significant number of workers in the firm
and that sales or production, or both, of such firms have decreased absolutely.
The Secretary of Commerce has accepted nine petitions from agricultural firms for
adjustment assistance. ll Two of those firms were not certified as eligible for
adjustment assistance. ll
Communities
Communities may file petitions for adjustment assistance with the Secretary of
Commerce under section 27l(a) of the Trade Act. Communities will be certified as
eligible to apply for adjustment assistance if the Secretary determines that a
significant n1mber or proportion of the workers employed within the "trade impacted
area" defined by the Secretary of Commerce have been or are threatened to become
totally or partially separated, that sale_s or production of a firm or firms within
the area have decreased absolutely, and that increased imports or the transfer of
productive facilities to a foreign nation have contributed importantly to the
unemployment or decline in sales or production. Eligible communities could receive
a variety of developmental assistance including technical assistance and direct
grants for the acquisition and development of land imp~ovements of public works
and public services.
The bill also contains several provisions designed to attract new investment
to trade impacted areas. The Secretary of Commerce is authorized to make loans and
loan guarantees to qualified applicants to acquire, construct, or modernize plant
facilities or for such other purposes as the Secretary determines are likely to
attract new investment and to create new, long-term employment opportunities with
the area.
1/ The firms and their lines of business were Smithfield. Sugar cooperative (sugar), Fantessa Enterprises, Ltd. (mushroom growing and processing), P. Mastrippolito & Sons, Inc. (mushroom growing and processing), Losito Mushroom Corp. (mushroom growing and processing), Mortensen Enterprises, Inc. (cattle raising), Utica Farms Mushrooms, Inc. (mushroom growing), La Peer Mushrooms (mushroom growing), flarzzetti Bros., Inc. (mushroom growing), and Great Lakes Mushroom Farms, Inc. (mushroom processing).
2/ Fantessa Enterprises, Ltd. ,and Mortensen Enterprises, Inc.
113
Public Law 83-480 (food aid to developing countri~s)
This statute provides assistance to developing nations by means of U.S. food
aid to alleviate hunger and promote economic progress. Most of the assistance has
been in the form of grain shipments because grain is relatively low in cost and it
is often in surplus, is storable, fits into the normal diets of the receiving
countries, and is conducive to shipping. However, cattle and beef are subject to
provisions of that law. Since July 1, 1954, 0.1 percent of Public Law 83-480 ship-
ments (in terms of value) have been beef. Increased shipments of beef under that
law could be a means of reducing the domestic supply.
Public Law.194-35 (loan guarantees)
This provision of law is a loan guaraa1Ze~ pi~~ibrafll ~hat provides loan guarantees
for farmers who would not otherwise qualify for loans to purchase livestock, feP.d . -~ -
grains, equipment, and/or to refinance livestock·~~~ations.
Public Law 99-68 (_disaster aid}
This statute provides loans in counties designated as "Natural Disaster Areas."
About 2,324 counties in the United States, Puerto Rico, and the Virgin Islands are
so designated. The program provides for loans to producers who are unable to obtain
sufficient credit elsewhere to finance their needs at reasonable rates and terms.
National School Lunch Act
The Food and Nutrition Service of USDA is responsible for distributing beef,
as well as other food items, under authority of the National School Lunch Act. In
recent years, the agency has annually purchased and distributed over 100 million
pounds of beef (primarily frozen ground beef). The program has ·no statutory limit
on the amount of beef that can be purchased. However, the prices ,at which the USDA
offers to purchase beef are often below market prices and purchases under this
program have been limited.
114
Drought and Flood Conservation Program
The USDA, under authority of the Soil Conservation and Domestic Allotment Act
of 1936, as amended, operates the Drought and Flood Conservation Program. The
program provides for cost sharing for certain practices (e.g., purchasing irriga
tion equipment) that could be beneficial to cattlemen. The program is available
to farmers in over 2,000 U.S. counties designated as "Emergency Drought Impact Areas."
115
Other u.s; governmental programs through which beef and veal may be purcnased
Department of Defense officials report that there is no statutory limi
tation on the amount of heef and veal which may be purchased but that as a
practical matter, the number of military personnel limit such purchases.
U.S. military consumption of beef and veal amounted to about 255 million
pounds in 1976, about 1 percent of total consumption. The Veterans
Administration states that the purchases of beef and veal for use in its
hospitals are made by the individual hospitals. The total purchases are
limited by the number of eligible participants in VA programs.
Indirect governmental purchases of beef and veal occur through the food
stamp program (Public Law 95~113). Officials of the U.S. Department of
Agriculture estimate that approximately 30 percent of the total value of
purchases with food stamps consists of red meat. Based on total purchases
under the food stamp program in fiscal year 1976, purchases of red meat by
program recipients are estimated at ~1.5 billion. Individual fooa stamp
recipients determine the share of their food stamps that they use for beer ana veal.
Other governmental purchases of beef and veal, both direct and indirect,
occur under section 4(a) of the Agriculture and Consumer Protection Act of 1973,
as amended (Public Law 93-86). These purchases have been small, but according
to an official of the RS. Department of Agriculture they could become
larger if funded. Programs operating under this authority include "Aid
to Needy Families" (certain American Indians and families in U.S. trust
territories) and the "Supplemental Food Program" (for certain infants, young
people, and pregnant women). Limited quantities of beef and veal also are
purchased under authority of the Older American's Act of 1965, a·s. amended
(Public Law 95-65).
116
LEGISLATIVE PROPOSALS BEFORE CONGRESS
Many of the proposals of witnesses at the public hearings were
related to proposed legislation pending in Congress. Most such bills
introduced have been referred to the House or Senate Agriculture
Committees.
Proposed Amendments to the Federal Meat Inspection Act
Bill& introduced in both Houses would amend the Federal Meat Inspec-
tion Act (21 U.S.C. 601 et. seq .. ) "to require that importedrmeat and meat
,food products madein whole or·in part of' imported meat be subjected to
c~rtain t.e!?ts and that such meat products· be· identi·fied a·s having been
imported," and "to require that the cost of conducting such tests,
inspections, and identification procedures on imported meat and meat
food products .•. be borne by the exporters of such articles." 1/
The~e bills would require that foreign meat imports be required to meet
U.S. standards and to req;ui.re labeling of imported meat products. Other
bills have b.een introduced .. in,.hoth· Houses with the sole objective of
amending the Federal Meat Inspection Act just to require labeling of
meat products as ''imported 1' or "imported in part" at the retail level,
where such products are most likely to be sold to the ultimate consumer. !:_/
A bill has been introduced in the House requiring humane methods
of-slaughter for domestic animals and for foreign animals whose meat
products would be exported to the United States. 1J
2/ Bills H.R. 1073 and H.R. 8730. ]j Bill H.R. 1464.
117
~roposed Amendments to the Meat Import Act of 1964
Bills have been introduced to revise the Meat Import Act·
Several bills would prevent the circumvention of import restrictions
through the production or manufacture of articles from for_eign trade
zones, territories, and possessions of the United States. !_/
One proposed bill expands the definition of meat products subject
to quota to include TSUS items 107.55 and 107.60 (other prepared or
preserved beef and veal, except sausages), revises the base quota from
725,400,000 pounds to 737,000,000 pounds, and puts all powers to
regulate the quotas in the hands of the Secretary of Agriculture. '!:_/
A Senate bill provides for changing the base quota to 750,000,000
pounds and ties changes in quota levels for each calendar quarter to
the ratio of the number of fed cattle slaughtered to the number of
cattle commercially slaughtered in the first 2 months of the preceding
calendar quarter. The Secretary of Agriculture is authorized to
allocate the quotas,and all Presidential powers (such as suspension
of. quotas and trade agreements) are deleted. ]_/
Another bill provides the same as the one just discussed but in
addition allows for adjustment of the base quota level over time in
relationship to U.S. domestic production. !!_/
]:_/ Bills S. 294, R.R. 1500, R.R. 6879, R.R. 7399, and R.R. 7724. 2/ Bill R.R. 3574. )/ Bill S. 239. 4/ Bill R.R. 1154.
118
PROPOSALS PRESENTED AT THE HEARINGS
Changes in the Operation of the Meat Import Act of 1964
Countercyclical quotas
A majority of the witnesses in favor of providing some form of import relief
for the domestic cattle and beef industry, including several members of Congress,
suggested that the Meat Import Act, which currently permits imports to rise and fall
with domestic production, be modified so that imports fall when domestic production
rises and rise when domestic production falls. Such countercyclical quotas, they
asserted, would tend to increase imports at times of high prices and decrease im
ports at times of low prices. It was argued that such quotas would tend to sta
bilize prices for the domestic industry and for consumers. A few witnesses sug
gested mechanisms for such countercyclical quotas. One was that import quotas
could be tied to the relationship between U.S. costs of production and domestic
prices or to parity prices for meat (e.g., a 25-percent cut in import quota levels
for each 5-point drop in U.S. cattle prices below parity prices). Another proposed
mechanism was to tie import quota levels to the ratio of the number of fed cattle
slaughtered to the total number of cattle slaughtered, with the intent of reducing
imports during the liquidation phase of the U.S. cattle cycle. In addition, there
were suggestions that quotas be established quarterly rather than annually.and
that limitations be placed on quota entries through any single port of entry.
Closing loouholes in the act
A majority of the witnesses, including most congressional witnesses, proposed
that coverage of the quotas under the Meat Import Act of 1964 be broadened. Such
proposals ranged from adding prepared or preserved (processed) beef and veal to the
articles covered by the quotas to putting all red meat in whatever form (live animals
119
and fresh, chilled, frozen, or processed meat) under the quotas. Several witnesses
wanted limitations on imports of live cattle; it was felt, however, that this should
be done by means other than the meat import quota, since the witnesses did not want
to restrict imports of breeding stock, or they felt that it would be difficult to
develop an acceptable conversion formula for live cattle to meat equivalents.
Most witnesses at the hearings advocated broadening the quota coverage as.one
method of closing a so-called loophole. The loophole allowed meat processed in
foreign trade zones or territories of the United States, or transhipped through
Canada, to be imported outside the quotas. There were complaints that there are
imports of meat under the quotas that had merely been transshipped through the
listed country of origin and that Canada imported meat for its own needs and exported
its domestic product to the United States, but suggestions that this problem be
solved did not include mechanisms for dealing with the problem.
Several Congressmen suggested that the ba~~ periods and formulas for the
establishment of quotas under the Meat Import Act should be updated to account for
current conditions. Several congressional witnesses also called for improvements
in the Department of Agriculture statistics and estimates used to administer the
act.
Many witnesses, including congressional witnesses, suggested changes in the
administration of the act. It was proposed that the requirement that estimated
imports exceed quota levels by 10 percent before quotas are tri.ggered be eliminated
or that the trigger level be reduced to 5 percent. It was suggested that limitations
be placed on the power of the President to suspend quotas in cases of national
120
emergency. Several witnesses said that the provisions for negotiation of voluntary
restraint agreements with meat importers were used more to serve international
rather than domestic interests. It was reconnnended that the power to negotiate
such agreements be transferred to the Secretary of Agriculture. Some witnesses
suggested that authority to administer the act be moved to the Department of
Agriculture. One Congressman suggested that domestic producers be empowered to
take the administrators of the act to court if they disagree on the administration
of the act. It was also suggested that advisory connnittees to aid in administer
ing the act be established. Suggestions were made that the act include provisions
for embargoes on meat imports.
Changes in the Tariff
Besides revisions in meat import quotas, there were proposals for tariff actions
on meat imports. Several witnesses proposed putting a variable tariff on meat
imports tied to parity prices. There were proposals to change the tariff on meat
imports to reflect current parity prices or to equalize the costs of production
between domestic and foreign producers. One witness suggested that this action
could be accompanied by allowing duty-free treatment for such imports when U.S.
prices exceeded "fair market values" for a period of 90 days. Increases in duties
on meat products from 5 to 10 cents per pound higher than the difference between
domestic and imported meat prices were proposed. Short-term increases in tariffs
to deal with current problems were suggested by a number.of witnesses, .including
Congressional witnesses.
121
Other Suggested Congressional Actions
Several witnesses, including several congressional witnesses, suggested that
meat imports be restricted· to. products subject to similar standards of health and
sanitation as are required in U.S. production. It was urged that 100 percent of
the imported meat be inspected by U.S. inspectors, that drugs not allowed in the
production of domestic cattle be prohibited in the production of foreign cattle the
meat of which is destined for the U.S. market, that slaughter of foreign beef for
the U.S. market be carried out under the same 'standards as U.S. slaughter, and that
the internal organs of all imported meat be inspected by U.S. inspectors. Virtually
all such proposals for improved standards for imported meat included the suggestion
that the cost of the increased inspections required to achieve these results be
borne by the importers of such meat. In addition, some witnesses suggested that
improved inspection of live cattle imports was needed,: and one congressional i;·1it
ness proposed that reciprocal inspection standards be imposed (i.e., if Canada
requires inspection for blue tongue disease on U.S. exports of live cattle to
Canada, the U.S. should require the same inspection on live cattle imports from
Canada).
It was proposed by many witnesses that imported meat products be labeled as
"imported" or "imported in part" through all distribution channels to the retail
level. It was suggested that grocery stores, meat markets, and fast food chains
that sell imported meat be required to advertise it as such, and that restaurants
should identify imported meat on their menus. Some witnesses proposed a prohibition
on mixing imported and domestic meats.
Some witnesses suggested that Congress prohibit the use of Federal funds for
the purchase of imported meats, and a further suggestion was made that such funds
be prohibited from going to any institution which buys or serves imported meats.
122
One Congressman urged enactment of laws to improve the reporting of market
information in the domestic meat market, particularly price information. It was
suggested that market manipulation was likely without improvements in market
information. There were also suggestions for an investigation of practices iri the
futures markets for meat products.
Import Interests
During the investigation, the import interests indicated that they preferred
to eliminate all restrictions on imports of beef and veal..l/ Second to that, they
preferred no changes in the existing act; they contended that imports already comply
with U.S. health, sanitary, and labeling laws and regulations. Third, they contended
that some of the processed beef and veal products not presently covered by the Meat
Import Act are either not produced or are not produced in significant commercial
quantities in the United States.
The import interests pointed out that much of the testimony of domestic witnesses
at the hearings consisted of recommendations for legislative changes which would add
to the already formidable protection enjoyed by the domestic industry under the
Meat Import Act. The importers contended that, without exception, the recommendations
would add to the unique protection already enjoyed by the U.S. beef industry. One
way or another, they contended,each of the recommendations would add to the expense
and complication of importing or would actually limit imports.
Major Proposals of Domestic Producers and Importers
1. Quota coverage for b~ef and veal
The domestic producers contended that the quota should be modified to close
loopholes in the existing act, so as to prohibit quota-type meat from being processed
±./ Several econometric models received in the course of the invee.t1gation relate to the- impact of imports upon domestic producers and consumers; they are shown in appendices D and E.
123
in foreign trade zones, or in other countries, and then imported and not counted
in the quota. They maintain that all imported beef is competitive with domestic
beef.
Importers contend that imported grass-fed beef is complementary to domestic
grain-fed beef and, at best, the imported beef could be considered competitive only
with the limited domestic production of lean beef. They further point out that a
representative of the National Cattlemen's Association estimated that sales of culls
would represent 15 percent of beef producers' income. Some importers claim that
processed beef should not be covered by quota unless the quota base is adjusted to
consider processed meat imports, and they assert that the foreign trade zones
problem has been corrected by the Department of Agriculture. Some noted that
canned corned beef is not produced conunercially in the United States and that other
meats, such as frozen cooked beef are produced only on a limited scale. They believe
that this type of beef should not be subject to a quota, as it does not compete with
domestic products.
2. Quota coverage for live cattle
Domestic producers claim that including live cattle in the existing quota, or
establishing a separate quota for live cattle, will protect local markets from market
disruption by large imports of feeder calves or cattle for slaughter from Canada or
Mexico.
Importers contend that imports of live cattle are negligible in relation to the
total domestic market and that imports of feeder calves benefit domestic feedlot
operators. They point out that Canada and Mexico have a balance of trade with the
United States in live cattle that is mutually beneficial. The importers contend that
no conversion formula can be written to determine meat equivalents of live cattle
and that proposals for quotas should not include live cattle for breeding purposes.
124
3. Countercyclical quotas
Domestic producers assert ~hat current quotas should be made countercyclical
so that imports would be high when domestic prices rise and low when domestic prices
fall, This, they assert~ will allow market stability for producers and consumers.
Some called for quarterly quotas and others called for imports to enter at par
ticular ports~
Importers oppose quotas in any form and would prefer to have the Meat Import Act
eliminated. Second to that, they prefer no changes in the existing laws. Counter
cyclical quotas~ they claim, would tend to keep imported meat out of the U.S. market
when foreign suppliers are also liquidating herds and are most in need of these
markets. Also, importers contend that foreign supplies could not be turned on or
off at will under such a proposed system in order to satisfy the U,S. market. They
point out that U.S. consumers customarily begin to purchase less beef and start to
buy more substitutes when beef prices become disproportionately high. In order for
the U.S. market to be served by imports, they assert, it must be a consistent market
for imports.
4. Quota trigger level
Domestic producers contend that the 10-percent trigger has led to a continual
level of imports 10 percent above the adjusted base quota level, since voluntary
restraint agreements are negotiated to avoid the necessity of triggering the quota.
They claim that U~S. Department of Agriculture estimates of imports have been
faulty in the past.
Importers claim that the lO~percent trigger level provides room for the
negotiation of voluntary restraint ag~eementst
5. President's power to suspend quotas
Domestic producers want to eliminate the President's power to suspend the quotas
and they believe that the e:llml~ ,.._inistration of the quotas should be vested
125
with the Secretary of Agriculture. Domestic producers point out that the President
has suspended quotas in the past in pursuit of consumer interests and has not admin-
istered the act in the interest of producers.
Importers testified that quota suspensions are used because imported meat is
needed in the domestic market since the domestic industry does not produce enough
lean meat for U.S. demand. They point out that the U.S. supply of manufacturing
beef is a byproduct of two other operations--cow/calf and dairy. Also, they point
out that in periods such as late 1972 and 1973,. they supplied beef to the U.S.
market when it was wanted and needed.
6. Inspection of foreign beef
Domestic producers and consumers contend that inspection of foreign meat is
not as rigorous as inspection of domestic meat. They want the cost of the addi-
tional inspection to be borne by the importers.
Foreign suppliers claim that their standards are in conformity with applicable
U.S. law and are already as high, or higher, than U.S. standards and that their
standards are adequately enforced. They point out that U.S. inspectors are perma-
nently stationed abroad and that they regularly visit foreign plants. The plants
are approved by these U.S. officers and this approval is a prerequisite for shipping
beef to the United States. During the investigation, the Council for the Australian
Meat Board quoted the U.S. Secretary of Agriculture as stating:
We have a fine cooperative program with the Governments of Australia and New Zealand. We are satisfied that the beef which comes from those countries is clean; it is slaughtered and handled under sanitary conditions comparable to our own. We do not have the slightest doubt about the cleanliness and wholesomeness of beef which comes from Australia and New Zealand.
7. Labeling of imported beef
Domestic producers and consumers want imported beef to be labeled "imported"
or "imported in part" with country of origin at all levels of distribution,
126
including the retail level, so that consumers will know they are eating imported
meat. The producers claim consumers would prefer ''higher quality" domestic meat.
Importers contend that this would be an undue burden on interstate and foreign
commerce as the courts have found with regard to several State laws, Imported meat~
they assert, satisfies U.S. laws regarding labeling and that even if there were any
truth to the allegations concerning the inferiority of foreign inspection, the
corrective action to be taken would be in administration of the present law rather
than in changing the law. The importers believe that requiring the labeling of
domestically processed meat would mean that labeling would be required of all
imported products processed domestically. The importers point out that containers
of imported beef are labeled pursuant to statutory requirements (19 U.S.C. 1304) with
country of origin in such manner as to advise the "ultimate purchaser, 1' meaning
the manufacturer and not the retail buyer (housewife), of such country. They claim
that imported quota beef is essentially a raw material used in manufacturing.
Under the law, they contend, the "ultimate purchaser" of quota beef is the manufac
turer who uses it, with other materials, to produce a new and different product.
Such product, they point out, is a product of the United States.
8. Other proposals
The importers made no major proposals at the hearing. The importers asserted,
however, that virtually. without exception, the proposals of the domestic interests
had a common denominator--that all of them would add to the unique and unprecedented
protection already enjoyed by the U.S. beef industry. One way or another, they
claimed, each would add to the expense and complication of importing, or would
limit imports or discourage their use. Also, the importers asserted that the
Commission's report on this investigation should set forth the facts. They contend,
in effect, that section 332 neither directs nor empowers the Commission to make
policy recommendations designed to improve the position of domestic industries.
A-1
APPENDIX A
NOTICES OF INVESTIGATION NO. TA-201-25 AND HEARINGS, THREE CONGRESSIONAL.LETTERS REQUESTING A 332 INVESTIGATION OF U.S. IMPORTS OF LIVE CATTLE AND BEEF, AND NOTICE OF THE INSTITUTION OF INVESTIGATION NO. 332-85 AND HEARINGS
A-2
UNITED STATES INTERNATIONAL TRADE COMMISSION Washington, D.C.
[TA-201-25]
LIVE CATTLE AND CERTAIN EDIBLE MEAT PRODUCTS OF CATTLE
Notice of Investigation and Hearings
Investigation instituted. Following the receipt on March 17, 1977,
of a petition filed by the National Association of American Meat Promoters,
the Meat Promoters of South Dakota, the Meat Promoters of North Dakota,
the Meat Promoters of Montana, and the Meat Promoters of Wyoming, the
United States International Trade Commission, on March 26, 1977, insti-
tuted an investigation to determine whether live cattle and certain meat
products of cattle fit for human consumption, provided for in items
100.40 through 100.55,inclusive; 106.10, 106.80, and 106.85; 107.20 and
107.25; 107.40 through 107.60, inclusive; and 107.75 of the Tariff
Schedules of the United States, are being imported into the United States
in such increased quantities as to be a substantial cause of serious
injury, or the threat thereof, to the domestic industry producing articles
like or directly competitive with the imported articles.
Public hearings. P.ublic hearings in connection with this investiga-
tion will be held in Rapid City, S. Dak., beginning on Tuesday,-June 14,
1977; in Dallas, Tex., beginning on Tuesday, June 28, 1977; and in
New York, N. Y., beginning on Tuesday, July 12-, 1977. Times and locations of
the hearings will be announced later. Requests for appearances should be
filed with the Secretary of the United States International Trade
Commission, in writing, at his office in Washington, D.C., not later than
A-3
noon of the fifth calendar day preceding the hearing at which the
appearance is requested.
Inspection of the petition. The public portion of the petition
filed in this case is available for pt1blic inspection at the Office of
the Secretary, United States International Trade Commission, 701 E
Street NW.; Washington, D.C. 20436, and at the-New York City office of
JAMES 0. EASTLAND, MISS. ROBERT DOLE, KANS. GEORGE MC GOVERN, S. OAK. MILTON R. YOUNG, N, OAK. JAMES B. ALLEN, A~. CARL T. CURTIS, NEBR. HUBERT H. HUMPHREY, MINN. HENRY BELLMON, OKLA. WALTER D. HUODLES-:"ON, KY. JESSE HELMS, N.C. DICK CL.ARK, IOWA S. I. HAYAKAWA, CALIF. RICHARD S. STONE, FLA. RICHARD G. LUGAR, IND.
PATRICK J. LEAHY, VT. EDWARD ZORINSKY, NEBR. COMMITTEE ON JOHN MELCHER, MONT. AGRICULTURE, NUTRITION, AND FORESTRY
MICHAEL R. MCLEOD WAS
N<neN!i~f:~;~~ r ~; 9. I GENERAL COUNSEL AND STAFF DIRECTOR
y 18, l~Y7'i'~a :.:-~· -J..>··· ·....:.-: _..,. ,-. ,_, ----
Da~,i el Minchew, Chairman :·_,: c.c· ,..;~-S: International Trade Commission , .. -o
.-</ .. 1 sh in gt on , D. C. 20436 l /;J ~-: A J f:L __ ~~ ·~ ;. :;:;: ~~- //Dea~ Mr. Minchew: C;·;;;,,) r•! t11e ~~·:_·:·~ :-:
~": ,/' It is our understanding that the Inte -at.li';;hl~tPJ~~ti'ln );;:~·an ~ !f rt has underway an investigation under Section 201 of the Tra-de- ·Act of
~.~.~-~\\i( 1974 concerning beef imports. As you know, beef imports are also .~~ \)i'' subject to the Meat Import Act of 1964 and that.~ct may limit the· .J c:;,~ 1 Commission's ability to provide any relief that may be found
necessary in the Section 201 case. ·
-:n
...... -
We understand that hearings on the Section 201 case are now scheduled to begin June 14 in Rapid City, South Dakota; June 18 in Dallas, Texas; July 12 in New York, New York; and July 19, 1977, in Kansas City, Missouri. We believe those hearings would be the most efficient means of gathering information pursuant to Section 332 of the Tariff Act relevant to the need for any legislative action with respect to beef imports. Consequently, we urge that the Commission, on its own motion, act promptly to broaden the pending Section 201 proceeding to permit~ parties interested in legislative relief to appear and be heard pursuant to Section 332 of the Tariff Ac't at the hearings already scheduled ..
We are gratified that the lnternation~l Trade Commission has moved quickly to consider the beef import problem and we do hope that it will now permit a full exploration of the problems. We look forward to a comprehensive recommendation as to any needed legislation.
Sincerely,
~~~
/
~/ /~-z_.:_£? ~"~--fl'f.- ;.7v1v·
I···.
.MC::C. l\LIONOR • n [)1~1mrT, Soulft UA.kOTA A-6
r.0P.o.n11 11 .
l'lllll.U: \\'f°Jlit\ ... , ANU "J HAN~l'CJl<'I A I IPN
Hon. Daniel Minchew, Chairman u. s. International ·Trade Commission Washington, D. C. 20436
Dear Mr. Minchew:
_ _M_-:_c3Z~-orfice of the c
Secretary lnt'I Trade Commission
We commend the investigation the International Trade Commission has undertaken with respect to beef imports. We are concerned, however, that ·the current limitation of the scope of the investigation to Section 201 of the Trade Act of 1974 will result in less than adequate coverage of the issues involved.-
:.::::o '-) Pl
Accordingly, we urge that the investigation be expanded pursuant to the authorities contained in Section 332 of the Tariff Act of 1930. It is our understanding this will cause the inquiry to be conducted with specific regard to legislative changes which may be needed as well as to administrative actions which may be justified.
Your prompt attention to this matter will be appreciated.
The llo;;or:ablc D;.,nicl Ki.nchew, Chair:;nn U.S. Int:crnati(•nal Tnide Co:i1;nission Washin~ton, D.C, 20436
D.:?a r Nt·. M.i n.ch e:w:
I undcrst<ind that the International Trade> Co::::nission h.1s underway an invcstiGation under Section 201 of the Trade Act of 1974 with respect to beef i~ports.
Since the Coi~i'.liss:i.on hns chosen to· investigate beef ir:iports under Section 201, ·I believe it would be most 'appropriate and useful if this investigi1tion \·~ere brc2de:ned to include consideration of this icport situation as it is affected by Section 332 of the Tariff :\ct.
The hearings slated by the Cc~~ission around the country will be most useful in gatlierinc information on beef imports, and it would be unfortunate if the scope of the investigations were to be limited to Section 201.
I therefore urge the Co::uilission to <let pror;iptly nnd broaden the pending Section 201 procce2ing and permit those parties interested :tn legislative relief to appc;ir and be hear regardine Section 332 of the Tariff Act at the hearings slated in napid City, Kew York, Kew York and Knnsas City.
Th;ink you for your consideration and pro:.1pt response. : .·;.
LP:pl
Sincerely,
"-:!'~ 0~·~/1~; Lnrry 1'r~ys1er Member ot Congress
l J : I! . : I•"': . ·,,
:-r: .~. jJ,_1 ... . .
0 ~: .. · .. .
1· .. ' .... .;
. ·.· I .. ''i
. ··.'I i,J
: . ~:: ·J
·- .
.· . . , ·- . <-•.)
-:.-:.
C..•.J c_;)
. i
'···}
A-9
UNITED STATES INTERNATIONAL TRADE COMMISSION Washington, D.C.
[TA-201-25)
LIVE CATTLE AND CERTAIN EDIBLE MEAT PRODUCTS OF CATTLE
[332-85)
CONDITIONS OF COMPETITION IN U.S. MARKETS BETWEEN DOMESTIC AND FOREIGN LIVE CATTLE AND CATTLE MEAT FIT FOR HUMAN CONSUMPTION
Section 332 investigation instituted. On May 31,. 1977, the United
States International Trade Commission instituted, on its own motion,
an investigation under section 332(g) of the Tariff Act of 1930, as
amended (19 U.S.C. 1332(g)), to study the conditions of competition in
U.S. markets between domestic and foreign live cattle and cattle meat
fit for human consumption. Such live cattle and cattle meat are of the
types provided for in items 100.40 through 100.55, inclusive; 106.10,
106.80, and 106.85; 107.20 and 107.25; 107.40 through 107.60, inclusive;
and 107.75 of the Tariff Schedules of the United States.
In its investigation, the Commission will be concerned with,
among other things, the effects of imports of such articles on domestic
producers and processors of live cattle and products thereof fit for
human consumption. The Commission invites the.submission of information
on the product characteristics of foreign and domestic articles; the
characteristics of the domestic industry or industries producing and/or
processing such articles; U.S. consumption; production, imports, and
exports; inventories held in the United States; pricing practices, price
A-10
trends, and price relationships between the imported and domestic products;
trends of the major cost elements and profitability of operations of
producers and processors; and the actions taken under or in connection
with the co-called Meat Import Act of 1964 (Public Law 88-482, approved
August 22, 1964 (19 U.S.C. 1202)).
Public hearings. Public hearings in connection with these investi
gations will be held in Rapid City, S. Dak., beginning on Tuesday·,
June 14, 1977, at 10:00 a.m., m.d.t., at the Rushmore Plaza Civic Center,
444 Mt. Rushmore Road North, Rapid City, S. Dak.; in Dallas, Tex.,
beginning on Tuesday, June 28, 1977, at 10:.00 a.m., c.d.t., in
Room 7A23, 1100 Commerce Street, Dallas, Tex.; in New York, N.Y.,
beginning on Tuesday, July 12, 1977, at 10:00 a.m., e.d.t., in the
auditorium of the United States Mission to the United Nations,
799 U.S. Plaza, 45th Street and First Avenue, New York, N.Y. (please
use 45th Street entrance); and in Kansas City, Mo., beginning on
Tuesday, July 19, 1977, at 10:00 a.m., c.d.t., in Room 302,
911 Walnut Street, Kansas City, Mo. An additional public hearing
in connection with the section 332 investigation will be held
beginning oµ Tuesday, September 20, 1977, at 10:00 a.m., e.d.t., in the
Hearing Room, U.S. International Trade Commis~ion Building, 701 E Street
NW., Washington, D.C. 20436.
The Rapid City, Dal.las, New York, and Kansas City hearings will be
held in conjunction with the Commission's investigation No. TA-201-25,
being conducted under section 20l(b) of the Trade Act of 1974 (19 U.S.C.
A-11
225l(b)), concerning live cattle and certain meat products of cattle
fit for human consumption, notice of which was published· in the
Federal Registers of April 13, 1977, and May 19, 1977 (42 F.R. 19389
and 42 F.R. 25774, respectively). To the maximum·extent possible,
witnesses who are addressing testimony to investigation No. TA-201-25
and the criteria relative to relief under section 20l(b) of the Trade
Act of 1974 are requested to first present their testimony with respect
to that investigation and then give their testimony with respect to
investigation No. 332-85.
Requests for appearances shquld be filed with the Secretary of the
U.S. International Trade C.ommission, in writing, at his office in
Washington, D.C., not later than noon of the fifth calendar day pre-
ceding the hearing at which the appearance is requested. Requests should
(a) identify each witness by name and interest and (b) indicate
whether the testimony relates to investigation No. TA-201-25 or
No. 332-85 or both. Written statements will be accepted in lieu of or
in addition to oral testimony. Such statements should be submitted at
the earliest practicable time, but in no event later than the closing
of the final hearing for each investigation.
KENNETH R.
(d_:__ MASON
By order of the Commission:
,..-· ,/· .
- -""-' ---· ~·----:::-
Secretary
Issued: June 8, 1977
B-1
APPENDIX B
STATISTICAL TABLES
Table 1.--Meat, poultry, and fish: U.S. civilian consumption, total and.per capita,.1963-76
Red meat (carcass weight) : Poultry meat : (chicken
Year : : : Total : : Lamb : Total : and turkey·;, : Fish All : Beef : Veal :beef and: Pork : and : red : ready to iiieat. .. : veal : : mutton : meat : cook)
: : : : : : : - -__ / Estimated weighted average price of retail cuts.
Source: Compiled from official statistics of the U.S. Department of Agriculture.
Table 3.--Beef and veal: U.S. production, imports, exports, and e:ivilian eonsumption, 1963-76 1/
Year . . Civilian : .
Production : . Im-2
: Exports : consump- : Ratio of imports to--B f · V 1 · T tal ·ports I · · t · Jj · · ····-··· ·. ;· ··- p d · ee . ea . o · - · · . i9n · ConsumJ:!t10n :ro uct1on
Total~----------:132,667 : 7,956 : 1,547 : 7,299 : 201 : 8,922 : 134,417 : 24,180 . . . . . . !I Number-of- feedlots with I,OOO~head or-more capacity is number of lots operating any time during
year. Number under 1,000-head capacity is number at end of year. 2/ The 23 State totals show actual number of feedlots and number of animals marketed in each size
group. The sum of numbers shown by States under specified size group may not add to 23-State total for that size group, since for some States size groups are combined to avoid disclosing individual operations.
1/ Lots and marketing from larger size groups are included to avoid disclosing individual operations.
Source: Compiled from official statistics of the U.S. Department of Agriculture.
Source: Compiled from official statistics of the U.S. Department of Agriculture.
Table 9 .. -~verage prices rece;i.,yed by far~ers ~. aye;r;:~ge pa:i;;i.,ty. pri.ces.7. and. ·B&:r;i_ty'\rat;f.os for beef: cattle ~nd calves;·and parity ratios for all farm products, 1963 ... 76
Beef cattle . Calves : ;
Average : : P . . : Average : : P . i : Parity 1ratt6 Year arity ratio . arity rat o ( ) : price : Average : . : price : Average : : percent_,
. (price received . (price received 11 ~ -received : parity : : received : parity : : a. ~rm b . . . as percent of . b . i . as percent of . products y . price . . . ) . y . pr ce . . ) • f parity price f parity price armers : : : armers : ·
Per 100 : Per 100 : : Per 100 : Per 100 pounds : pounds : : Eounds : _Eounds
1/ Net ranch income less a nominal charge (annual wage to yearround hands times 1.25) for operator's labor and management, divided by total ranch investment.
]:_/ Not available.
Source: u~s. Department of Agriculture, ERS-525, Costs and returns, Northwest Cattle Ranches, 1972. ·
Table 14.--Feeder calves: 1/ Variable and total expenses in typical cow-calf operations 2/ of 5 U.S. regions, - and average selling price, 1974 and 1975 -
Total expenses (cost of livestock, machinery, etce.tera; also imputed charges for land and management)--------: 89.88 : 98.85 : 108.8:1. : 119.81 : 85.88 : 91.37 : 125.03 : 124.30 : 91.40 : 88.51
ll 400 to 500 pounds. '];_/ Not necessarily representative of region as a whole. ]_/ Sales price of cull cows subtracted from expenses. The average selling price per hundred weight in Kansas City for steers of choice arid
good grades in 1974 was $38.40 and in 1975 was $29.90; for heifers of the same grades the price in 1974 was $33.58, and in 1975 it was $23.4?.
Source: Based on information from the U.S. Department of Agriculture, Livestock and Meat Situation, "Estimated Production and Expenses for Beef Cow-Calf Enterprises in Five Regions of the United States", August 1976.
t;d I
I-' V1
B-16
Table 15.--Cattle feeding industry, in 23 States: Estimated cash receipts, cost of goods sold, and net income, by quarters, 1970-76
(In millions of dollars ) Operating costs of goodsb
Year and Gross
I I quarter receipts8 Calves Feeding Interest expenses charges
1aFat cattle are assumed marke\ed at 1,050 lb. Prices for fat cattle are based on quarterly average for choice 900-1,100 lb. steers at Omaha. bcosts based on prices paid for feeder steers two quarters prior to quarter marketed and feed prices during fattening period. Feeder calves are bought at 450 lb. and prices are based on quarterly averages for 400-500 lb. Choice steers in Kansas City. Cattle are assumed to gain 644 lb. (600 lb. net gain
plus 44 lb. shrink-4%). Number of head purchased assumed to be two percent more than number sold to allow for death loss. Interest charges based on· debt funds outstanding items Production Credit Association average interest ra.tes. clncludes interest expenses on long term investment Iii"!~ _d~l:l~ ~n..5!_
depreciation on long term fixed capital. eForecast.
Source: Based on table 1 of Capital Flows in the Cattle Feeding lndustry by J . .Bruce Hottel and J. Rod Martin, in USDA,"Livestock & Heat Situation~" LMS-209, June 1976, p. 39.
:S-1,.7
Table 16.--Meatpacking industry: Financial data, averages 1925-47, 1947-63, and ~963-76, and annual, 1963-76
Earnings as a
Period Total . : Net Net percent of--sales worth earnings Total sales Net worth
Source: American Meat Institute Annual Financial Review of the Meat Packing Industry, 1976.
Note.--The 1925-47 P & S Series represents summary reports by the USDA compiled from financial statements of meatp8cking companies filed with the Packers and Stockyarcls Administration. These figures have not been available since 1947. The 194.7-63 figures (AMI Series (A)) are estimates of AMI based on Census of Manufacturers reports for meatpacking published by the Bureau of the Census. The 1963-76 figures (AMI Series (B)) are estimates of AMI based on USDA's annual reports on commercial slaughter and meat production.
B-18
Table 17.--Forbes data for the meatpacking industry and all industries: 3 median profitability measures for selected large public companies, average, 1970~74 and annual, 1974-76
Median return on stockholders' . . equity!±_/-------: 13.1 16.6 13.8 12.9 . .
Median return on total capital~--: 9.1 11.8 10.2 . 10.1 .
Median net profit . . per sale 2_/-----: - . 1-2 . 1.2 .1.0 . . 1/ 30-industries, 963 public.companies. 1/ 12-month period ending with the last quarterly available financial
report,. and i:i.receding 4 years • . l/ 12-month period ending with the last available quarterly financial
Source: Compiled from official statistics of the U.S. Department of Agriculture.
B-25
Table 28.--Beef, Choice: Average retail price, net farm value, farm-retail spread, and farmers' share of retail price, by quarters, January 1963-June 1977
Period
1963--------------~--:
1st quarter---------: 2d quarter---------: 3d quarter---------: 4th quarter---------:
1964--------------~--:
1st quarter---------: 2d quarter---------: 3d quarter---------: 4th quarter---------:
1965-~------~-~----:
1st quarter---------: 2d quarter---------: 3d ·quarter---------: 4th quarter---------:
1966-~-------~-~---:
1st quarter---------: 2d quarter---------: 3d quarter---------: 4th quarter---------:
1967-~---------------:
1st quarter---------: 2d quarter---------: 3d quarter---------: 4th quarter---------:
1968-~----------~---:
1st quarter-----~--: 2d quarter---------: 3d quarter---------: 4th quarter---------:
1969-~-------~---~-: 1st quarter---------: 2d quarter---------: 3d quarter------~-:
4th quarter-------~: 1970-~---------------:
1st quarter---------: 2d quarter---------: 3d quarter---------: 4th quarter---------:
1971 ----------------: 1st quarter-~------: 2d quarter---------: 3d quarter---------: 4th quarter---------:
1972~~----------~---: 1st quarter---------: 2d quarter---------: 3d quarter---------: 4th quarter---------:
Table 28.--Beef, Choice: Average retail price, net farm value, farm-retail spread, and farmers' share of retail price, by quarters, January 1963-June 1977--Continued
Retail Net farm Farm-retail s2read Farmers' Period price value !/ Total Carcass- Farm-
Source: Compiled from daily statistics of "The Meat Sheet," published by Meet Sheet, Inc.
B-28
Table 30.--Beef and veal: Per capita consumption in specified countries, 1971-75
Area and country
North America: Canada-----------•-----------: Costa Rica-------------------: Dominican Republic-----------: El Salvador------------------: Guatemala--------------------: Honduras---------------------: Mexico-----------------------: Nicaragua--------------------: Panama-----------------------: United States----------------:
South America: Argentina--------------------: Brazil-----------------------: Chile------------------------: Colombia---------------------: Paraguay---------------------: Peru-------------------------: Uruguay----------------------: Venezuela--------------------:
1/ Estimated. 2! Forecast. 3/ Fer year ended Sept. 30,
Source: Compiled from official statistics of the U.S. Department of Agriculture.
Table 32.--Beef and veal; Exports by selected countries or areas and the EC, 1972-77
(In millions of pounds, carcass-weight equivalent)
Exporter
Australia----------: Argentina----------: New Zealand 1./-----: Uruguay------------: EC 4/--------------: Central America 'ii-: Canada-------------: Mexico-------------: All other----------:
Total----------:
1/ Preliminary. I./ Forecast.
1972
1,644 1,486
638 322 188 306
92 128 898
5,702
3/ For year ended Sept. 30.
1973 1974
2,028 1,070 1,102 638
696 568 240 264 180 456 292 254
90 60 86 42
1,550 1~168 6,266 4,520
4/ Excludes intra-Cbmmunity trade. S/ Includes Dominican Republic and Haiti.
1/ TSUS items 100.40 and 100.43 (in 1963,under.Schedule A No. 0010600). Z/ TSUS item 100.45 (in 1963, under Schedule A No. 0010700).. 3! TSUS item 100.50 (in 1963,under Schedule A No. 0010800). °§._/ TSUS items 100.53 and 100.55 (in 1963,.under Schedule A No. 0010900).
1967
98 10,624
2,784
608 218,658 47,562
13 14,012
3,863
22 22,401 4,762
740 265,695 58,971
1974
78 8,383 4,022
414 162,437
65,285
10 11,131
5,435
55 50,846 31,876
556' ~ 232,798 106,618
Source: Compiled from official statistics of the U.S. Department of Commerce.
Note.--Because of rounding, figures may not add to the totals shown.
1968
147 15,683
4,429
803 290,611 67,901
16 17 ,171
4,861
59 59,758 13,910
1,024 383,223
91,100
1975
10 885 312
221 92,164 29,080
2 2,686 1,062
150 158,327
46,789
383 254,062 77' 243
1969
159 18,822
5,750
792 272,459 66,635
23 25,064
7 ,425
47 48,071 13,840
1,021 364,416
93,650
1976
120 11,108
3,238
563 225,846
70,355
16 18,008
7,631
274 292,166
76,259
973 547,128 157,483
B-37
Table 38.--Dutiable-live cattle: U.S. imports for consumption, by principal sources and by weip,ht categories, 1963-76
(Quantity in number of headJ value in thousands of dollars)
Canada Mexico Other Total Year
:Quantity Value Quantity: Value ~Quantity~Value~ Quantity: Value
17 ltc1:1s subject to the·p-rovl'sron·s of the :teat Import Act of 1964. . 2/ TSi:SA items 106 .11J20 and 106 .1040 (Sche~ule A "o. 1)1)1A3tin :prior to September 1963). J/ TSl:SA itcci 106.1080 (Schedule A No. 0019000 prior to September 1963). 7.1 TSt:SA itern 106.1060 (Schedule A No. 0018500 prior to September 1963). 5! Items not subject to quota limitations of !1eat Import Act of 1964.
689.5 742.4 871.2 : 1,183.9 908.9
GI TSUSA items 107.4820 and 107.4840 (107.5020 and 107.5040 prior to 1976). }I 'fSl:SI\ ite:n 107. 6040 (Schedule A No, 002.9000 prior to September 1963). . 8/ TS USA 1 terns 10 7. 5220 and 107. 5240 (107. 5060 and 107. 5080 were part of 107. 5000 prior to 1967 and part of Schedule A lio. 0028000 prior
to-September 1%3; data for 1963-67 include corned beef.· ·
672. 7
:!_/ TSUS items 106. 80 and 106. 85 (Schedule A No. 0023600 prior to September 1963), . }!!/ TSUS or TSUSA items 107.20, 107.2520, 107.45, 107.55, 107.6020 1 107.7000, 107.7540, and including items 107.7560, 107,7500 prior to 1969. !!_/ Includes lamb and mutton.
Source: Compiled from official statistics of the U.S. DePartment of Commerce,
~cte.--Bccause of rounding, figures do not add to totals shown.
924. 2 481.9 420.3
t:l:t I -"' N
B-43
Table 42.--Beef and veal: U.S. imports for consumption, by principal.sources, 1972-76
Source: Compiled from official statistics of the U.S. Department of Commerce.
B-44
Table 43.--Beef and veal, fresh, chilled, or frozen: U.S. imports for consumption covered by the Meat Import Act of 1964, by types and by principal sources, 1972-76
Type and year
Beef, bone in: '!:_/ 1972------------: 1973------------: 1974------------~ 1975------------: 1976------------:
New York, N.Y---------------------: Philadelphia, Pa---------.;.. _________ : Miami, fl.a----------~-------------:
San Juan, P.R---------------------: Los Angeles, Calif----------------: Seattle, Wash---------------------: San Francisco, Calif--------------: Ogdensburg, N.Y-------------------: Charfeston, S.C-------------------: El Paso, T·ex----------------------: Other------·-------.:..---------------:
Philadelphia, Pa------------------: Mobile, Ala-----------------------: San Francisco, Calif--------------: New York, N.Y---------------------: Los Angeles, Calif----------------: Seattle, Wash---------------------: Houston, Tex----------------------: Baltimore, Md---------------------: Charleston, S.C-------------------: San Juan, P.R---------------------: Other-----------------------------:
Value (1,000 dollars)
8,783 555
4,255 1,404
265 401
3,364
2,795 1,236 1,657
216 62
116 339 104 122
3,344 2,503 2,299
853 786 621 420 411 262 100 157
Total-------------------------:
595 172
9 5,682
25,486
8 129
6,784 11,755
Source: Compiled from officials statistics of the U.S. Department of Commerce.
Note.--Because of rounding, figures may not add to the totals shown.
B-50
Table 49.--Live cattle and certain meat of cattle fit for human consumption: Rates of duty and average ad valorem equivalents of the rates, 1930, 1967, and 1977
(Cents per pound; percent ad valorem)
Rate of duty Description and TSUS item
Cattle: Weighing under 200 pounds each:
For not over 200,000 head entered in the 12-month period beginning Apr. 1 in any year (item 100.40)------------:
Other (item 100.43)--------------------:
Weighing 200 pounds or more but under 700 pouuds each (item 100.45)-----------:
Weighing 700 pounds or more each: Cows imported specially for dairy
purposes (item 100.50)---------------: Other:
For not over 400,000 head entered in the 12-month period beginning Apr. 1 in any year, of which not over 120,000 shall be entered in · any quarter beginning Apr. 1, July 1, Oct. 1, or Jan. 1
1930
2.5¢ 2.5¢
2.5¢
3¢
(item 100.53)----------------------: 3¢ Other (item 100.55)------------------: 3¢
Meats of cattle (except meat offal), fresh,: chilled, or frozen (item 106.10)---------: 6¢
Edible meat offal, fresh, chilled, or frozen:
Valued not over 20 cents per pound (item 106.80) !/-----------------------------: 6¢
Valued over 20 cents per pound (item 106.85) !/-----------------------------: 30%
Sausages, whether or not in airtight containers:
Beef, in airtight containers (item 107.20) 1/-----------------------------: 30%
Other beef-(item 107.25) !/--------------: 20% Beef and veal, prepared or preserved
(except sausages): Beef or veal, cured or pickled:
Valued not over 30 cents per pound (item 107.40) 1/---------------------: 4.5¢
Valued over 30 cents per pound (item 107.45) !/---------------------: 30%
See footnotes at end of table.
1967
1.5¢ 2.5¢
2.5¢
1.5¢
1.5¢ 2.5¢
3¢
1¢
5%
15% 10%
3¢
10%
..
1977
1.5¢ 2.5¢
2.5¢
0.7¢
1. 5¢ 2.5¢
3¢
0.5¢
2.5%
7.5% 5%
3¢
10%
Average ad valorem equivalent of 1976 duty
5.1 9.5
8.0
1. 7
5.7 11. 9
5.0
3.4
B-51
Table 49.--Live cattle and certain meat of cattle fit for human consumption: Rates of duty and average ad valorem equivalents of the rates, 1930, 1967, and 1977--Continued
Description and TSUS item
Beef and veal, prepared or preserved (except sausages)--Continued: Beef in airtight containers:
Corned beef (item 107.48) 1/3/---------: Other (item 107.52)------~=-=-~--------:
Other: Valued not over 30 cents per pound
(item 107.55)------------------------: Valued over 30 cents per pound (item
107.60)--~---------------------------: Other meats and edible meat offal, pre-
. pared. or preserved: Valued over 30 cents per pound (item
107.75) ±_/-----------------------------:
Rate of duty
1930 i967 ·1977
·30% 30%
6¢
20%
20%
15% 15%
3¢
10%
10%
7.5% 7.5%
3¢
10%
5%
Average ad valorem equivalent of 1976 duty
11..2
1/ Imports are eligible for duty-free treatment under the Generalized System of Preferences.
2/ No imports. 3/ Included in item 107.50 at the same rates of duty prior to Jan. 1, 1976.
Source: Rates of duty from Tariff Schedules of the United States; ad. valorem equivalent computed from official statistics of the U.S. Department of Commerce.
C-1
APPENDIX C
THE MEAT IMPORT ACT OF 1964, SECTION 204 OF THE AGRICULTURAL ACT OF 1956, AND ACTIONS THEREUNDER
C-2
Public Law 88-482 88th Congress, H-. R. 1839
August 22~ 1964
S?ln 2lrt 78 STAT. 594.
T•• ,iro\·i1lc for tile frre lwp,,riatlon .nf <'rrt:iin wiltl l\Himnls, n111l t.o prn,·i1lc tor the ln:positlc.n o! quotas on <:er tu in ment 111111 meut product~.
Be it e1uicti:J hy tlie Senate and 110118e of Representatives of the United States of .:111wricn in Congress 11.ssemblcd, Tlia.t (a) item 8ii2.~0 of title I of the Tariff Act of 1!):30 {Tariff Schedules of the tTniteJ States; 28 F.lt, put II, August 17, HW3) is amen<le<l to read as follows:
use, or for s.ile for u.;;e, in c.ny schmttfic i.iublic collec~ 1
"I ~~.20 j Wild nnimo~< (lnc!u~lni blnls 1111d fi'h) Imported for I I j · I ~~:.~~'.1 '.~:'. 1.~~ .'~.'. ~'.~~'. 1.fi~ .~~ ~~u'.~'.l~n~~ .~~~:. Free Ffff I '
(b) I fo1dnote 1 of part 4 of schedule 8 of such title I is .amended Ly striking out "item 850.50," and inserting in lieu thereof "items s:.o.:iO and 85:2.~o.~·.
(c) The amemiments made by this section sh:lll take effect ·on the tenth clay afte1· the date of the C"acllllt'nt of this ..-\ct.
SEc. :t (a) It is the policy of the Congress tluit the aggl'egate q!1:111tity ~f the articles specilicd in items lOG.lt) (relating to fresh, chilled, or frozen cattle meat) a•1Cl lOG.~0 (relating to fresh, chilled, or frozen meat o! goats ancl sheco (except lambs)) of the Tarilf Schedules of the rnite<l Stales wliich may be imported into the Uniti:d States in itny c:ilendar ye'.tr beginning after December 31, l!)(i4, should 11ot exceed ';"~;;,400,00o pounds; except that this quantity sh:ill be increased 01· dccrt'ascd for r.ny calendar year hv the same J)crcenta!!C that estinrntet.i un:rage amnial domestic cominercial production of
·these articles i:-i tlrnt calendar year and the two preceding calendar years increases or decreases in comparison with the. !\\"eragc a111iual domestic conu!1ercial t>roduction of these articles <luring the years 1!)5!) th re.ugh 1!)6!3~ inclusive.
(b) The Secretary of Agriculture, for each calr:ndar year after 1964, shall estiinate and publisl1- ."
(1) before the be~inning of such calendar year, the aggregate quantity prescribed tor sud1 calenrlar year by subsection (a), and
(2) before the first day of each calendar quarter in such cal· enclar year, the nggregate quantity of the articles described in subsection (a) which (but for this section) would be imported in such calendar year.
In applying paragraph (2) for the second or any suci:ee<ling calendar . quartet· in any c:tlendar year, actual imports for the preceding calendar quarter or quarters in such calendar year shall be taken into account to the extent U:\ta is avr.'.bble.
(c} (1) If the aggreg~te quantity estimated before any calendar quarter by t}1e Secretary of Agric~iture pursuant to sub:;cction (b) (2) eq.unls or ~Xcel'1l3 110 p~rcent of tne aggregate qu:rnt:ty estimated bv hun pursua11t to subsection (b) (1), and if there is no limit:o.tion in effect under •.his st-ction w!th ri:sp.cct to such calendar year, the Pr.::sident .shaU by p_:-oc~amr.t10n h:n
11t the total qunntity ?f !he art_icks
described m sub~ect1on (a~ wh1c11 may be e11tered, or w1thcir:>.wa trom warehouse,. for co!:sumption, during such calendar year, to the r.ggrcgate. quantity e.=t:mated for !'l!~h calendar· year by the 3ecreta1·y oi .A,gr1culturo pursuant to s11bscct1on (b) (1).
(2) If the aggregate quant_ity estimated. before any calewhr qtmrter by the Seererary of Agr1cult.ur<l pur;;uant to s:.ibscction (b) (2) does not eq;ial or exceed !10. i;er<:ent of the nggreg;:te qnnntity €sti· mated by lum _pur.m_ant t'! sub.:;l'~t1on (b) (1), nnci. if a lim!tiu.ion is in e.ffect uncfor th1s;;ect1on with resrot'<:t to ;;uch caiendar year, such limi~a· t1011 shall ccnse to apply as of the first duy cf such c:ilendar ~uarter;
Presidential Procla..'11:-:.:;ion.
Pub. Law 88-482 -2- August 22, 1964 78 STAT. 595 0
ProCllamation suspension.
except that any limitn.tion which has been in effe<:t for the third calendar qu·arter of any calendar ye:ir shall continue in effect for the fourth calendar quarter of such year unless the proclamation is suspended or the total quantity is increased pursuant to subsection ( d).
(3) The Secretary of Agriculture shall allocate the total quantity proclaimed under pa.ragTaph ( 1), and any increase in such qimnt i1y pursmmt to sub~ection ( d), among supplying countries on the basis of the shares such countries supplied to the Fnite<l States market during a representatirn period of the articles described in subSEction (a), except that due account may he given to special factors which ha\·e affected or may affect the trade in such articles. The Secretnry of .Agriculture sha.11 certify such aUocations to the !3ecretary of the Treasury.
( d) The President mav suspend any proclamation made under subsection ( c), or increase' tfie total quantity proclaimed under such subsection, 1£ he determines and proclaims that-
(1) such action is required by overriding economic or national security interests of the Cnited States, giving special weight .to the iml?ortance to the nation of the economic welJ .. being of the domestic livestock indm;try;
(2) the supply of articles of the kind described in subsection (a) wiH be inadequate to meet domestic demand at reasonable prices; or .
(3) trade ngreements entered into after the dnte of the enactment of this Act ensure that the policy set forth in subsection (a.) will be cnrried out.
Any such suspension shall he for such period, nnd any such increase shall be in such nmount, as the President determines anrl proclaims to be necessary to carry out the purposes of t!1is subsection.
(e) The Secretnry of Agriculture shall issue such regulations as he determines to be necessary to pre\·ent circumvention of the purpo!:'es of this section.
(f) AU determinations by the President and the Secretary of Agriculture under this section shall be final.
Approved August 22, 1964.
LEGISLATIVE HISTOR't':
HOUSE REPO"TS: No. 25 (Comm. on Wa,ys & Means) of Coro·~ rence).
e.nd No. 1824 (Comm.
SENATE REPORT No. 1167 (Col:!l!I. on Finance). CONGRESSIONAL RECORD:
Vol. 109 (1963): Vol. no {1964):
Feb. 26, considered and passed House. July 27, considered in Senate, July 28, considered and passed Senate, amended. Aug. 11, Ho'..lSe dis~reed to Senate amendments e.nd requested conference. Aug. 18, House and Senate agreed to conferer~e report.
c.,.4
SECTION 204 OF THE AGRICULTURAL ACT OF 1956
1854. Agreements limiting imports. -The President ma7, whenever he determines such action appropriate, negotiate wlth representatives of foreign governments in an effort to obtain agreements l!mitlng the export from such countries and the !m:;::ortation into the United States of ~my agricultural commodity or product manufactured therefrom or textiles or textile products, and the President is euthor!zed to issue regulations governing the entry or withd:-a '.Val from \':'2.rehouse of any such commodity, prolluct, textiles, or textile products to carry out · any such agreement. In addition, if a multilateral agreement has been or shall , be concluded under the authority of this · section among countries accounting for a significant part of world trade in the articles with respect to which the agreement was concluded, the President may also issue, In order to carry out such an agreement, regulations governing the entry or withdrawal from warehouse of the same articles which are the products of countries not parties to the agreement. Nothing herein shall affect the authority. pro·•ided under section 22 of the .'\gr!cul- I tural Adjustment Act (Of 1933> ns amend-· ed [§ 624 of this title). <May 23, 1956, c. 327, Title II, § 204, 70 Stat. 200; June 19, 1962, P. L. 87-488, 76 Stat. 104.)
Table C-1.--Actions under the Meat Import Act of 1964, 1964-77
(In millions of EOunds) Adjuste-cf base : Trigg-er level : Import level : Actual imports
Year · prescribed : adjusted base : estimated : under TSUS Nos.: Action taken by President uri.der : plus 10% : under sec. : 106.10 and . sec. 2(a) : sec. 2 (c) : 2(b)(2) ii : 106.20
Voluntary restraints negotiated with Haiti, Pana~a, Australia, Ireland, New Zealand, Dominican Republic, Honduras, Guatemala, Nicaragua, Costa Rica, Mexico.
Executive proclamation issued for enforcing quotas and simultaneously suspended .
Voluntary restraints negotiated with Panama, Costa Rica, Guatemala, New Zealand, Ireland, Australia, Haiti, Dominican Republic, Mexico, Nicaragua, and Honduras.
Executive.proclamation imposed quotas and simultaneously suspended.
(") 1
"'
Year-
Table C-1.--Actions under the Meat Import Act of 1964, 1964-77--Continued
Adjusted base : Trigger level prescribed : adjusted base
urider : plus 10% sec. 2(a) : sec. 2(c)
(In millions of p()un<!~} Import level : Actual imports
estimated : under TSUS Nos.: under sec. : 106.10 and Action taken by President
2(b)(2) 1./ : 106.20
Table C-1.--Actions under the Meat Import Act of 1964, 1964-77--Continued
(!11_ m!_llio_ns_ of pounds) Adjusted base : Trigger level : Import level : Actual imports
Year prescribed : adjusted base : estimated : under TSUS Nos.: urider : plus 10% : under sec. : 106.10 and Action taken by President
sec. 2(a) : sec. 2(c) : 2(b)(2) l./ : 106.20
C-9
Table C-2.--Meats subject to the Meat Import Act of 1964: Voluntary restraint quantities negotiated under sec. 204 of· the Agri;.cMltural Act, by sources, 1969-72 and 1975-77
Source: Compiled from U,S. Treaties and Other International Agreements (TIAS).
Note.--There were no voluntary restraint agreements negotiated for 1973 and 1974.
D-1
APPENDIX D
ECONOMETRIC MODELS PRESENTED AT COMMISSION HEARINGS
D-2
Econometric Models :Presented at Connn~ssion Hearings
Several econometric models were presented at the Commission hearings on
imports of live cattle and beef. Most of these models are concerned princi-
pally with the relationship between the level of imports of beef and the
effect changes in this level would have on domestic prices received by cattle
growers or on retail prices for beef. This appendix reviews the main results
of these models
The models were presented by the following persons: George L. Abraham,
President of Abraham & Associates, Inc., a private research and consulting
firm in Sarasota, Florida; Dr. Ernest E. Davis, Livestock Marketing Economist,
Texas Agricultural Extension Service, Texas A & M University; Thomas M.
Leonard, Senior Economist, Council on Wage and Price Stability; and Dr. James
P. Houck, Department of Agricultural and Applied Economics, University of
Minnesota, St. Paul, Minnesota.
Submissions by George L. Abraham: Rapid City hearings, June 15, 1977; Fort Worth, Texas, hearings, June 29, 1977: Kansas City, Missouri, hearings, July 20, 1977; Washington, D.C., hearings, September 22, 1977
Mr. Abraham submitted some of the specifications of three models his con-
sulting firm has developed. They were presented in Table D-6 of Mr. Abraham's
testimony at the Rapid City hearings, as follows:
I.
II.
III.
D-3
ABRAHAM &ASSOCIATES BEEF PRICE FORECASTING MODELS Historical Base Period 1960-1975 - Quarterly Observations
CARCASS STEER PRICES - R2 = 97.4
One (1) Standard Deviation is 3.8300
VARIABLES Degree of Importance to Explain Price Change
1. 2. 3. 4. 5. 6. 7. 8. 9.
10.
1.1329 -1. 2003
.1812 - .1450
.1184 - .0911
.0460
.0338
. 0215 2.4906
Income Block Beef Production Hog Slaughter Processing Beef Disappearance Spot Commodity Index Beef Freezer Stocks Dummy 3 Dummy 2 Dummy 1 Constant
2 90% LEAN BONELESS BEEF PRICE - R = 92.0
One (1) Standard Deviation is 7.9100
VARIABLES Degree of Importance to Explain Price Change
1. 2. 3. 4. 5. 6.
.9639 - .9126
.4625
.4288 - .1810 - .1009
Income Processing Beef Disappearance Spot Commodity Index Block Beef Production Beef Freezer Stocks Constant
50% LEAN BEEF TRIMMING PRICE - R2 = 87.1 One (1) Standard Deviation is 13.6600
and workers----------------------------------- $1,125 million Total benefits------------------------------ $1,125 million
(3) Costs: Cost to consumers------------------------------- $1,167 million Decline in tariff revenue----------------------- $ 42 million Decline in tariff equivalent revenue "J:_/--------- $ 28 million
Total costs--------------------------------- $1,237 million
(4) Net cost (i.e., total costs minus total be~efits)---- $ 112 million
Thus, the Council estimates that eliminating imports would raise the average price
of beef and veal by six percent and raise the food component of the Consumer Price
Index by about 0.7 percent.
Submission by Dr. James P. Houck, Kansas City hearings, July 17, 1977
The analysis by Professor James P. Houck breaks down the consumption demand
of beef in the United States into two interrelated product categories: (1) table
cuts such as steaks and roasts; and (2) processed items such as hamburgers, frank-
furters, and sausage. He estimates the short-run effects on prices of a 10-percent
decrease in processed beef supply and in beef imports.
1/ A quota operates like a·tariff, but rather than the revenue going to the Government, it is shared between importers and exporters.
D-7
Reef: Price effP-cts of a 10-percent decrease in domestic supply and'in U.S. imports
Effects on retail price of==
Processed beef--------------: Table beef------------------: All beef 2/-----------------:
10-percent decrease in--
Total processed beef supply
Beef imports 1/
Percent change
+3 +l +2
Other meat------------------:
+15 + 4 + 8 + 1 +0.2
Other food------------------: +0.2
1/ Imports at 20 percent of processed beef supply to reflect average 1970-76 conditions.
!:._/Weighted average of processed beef (.35) and table beef (.65).
As the above table indicates, the principal impact is on prices of processed
beef. As a result of shifting demand away from processed beef, prices of table
beef also increas~•. Small price increases would also result for other meats
(e.g., pork, poultry, lamb) and for fish.
Professor Houck also estimated the short-run impact in prices of more substan-
tial decreases in processed beef imports.
Beef imports: Price effects of a reduction to half of 1976 level and to zero
Effects on retail price of--
Result of import reduction--
Processed beef--------------: Table beef------------------: All beef 2/--------------~-: Other meat------------------: Other food------------------:
To half of 1976 level !_/
Percent change
+13 + 3 + 7 + 1
+0.1
'J:./ 1976 imports at 1,486 million pounds, product weight. 2/ Weighted average of processed beef (.35) and table-beef (.65).
To zero
+26 + 7 +14 + 2
+0.3
Thus in the short run, these results indicate that total imports hold processed
beef prices at retail about 26 percent lower than they would be otherwise. Table
o ... a
beef prices are also affected, but to a much smaller extent (7 percent). Other
meat prices (i.e., pork, poultry, lamb, and fish) are barely affected.
Another series of computations by Professor Houck indicate the annual effects
of changing imports of beef and veal:
Beef imports: Costs and benefits of reducing to zero and of reducing to one-half of 1976 level
1/ Estimates by the Council on Wage and Price Stability. 2.J Equivalent to tariff-equivalent computation presented in testimony by the
Council on Wage and Price Stability.
Professor Houck notes that he uses the same methodology as the Council on Wage and
Price Stability at the New York hearing. His estimated net effect on the economy
is a social cost of $45.5 million.
E-1
APPENDIX E
THE IMPACT OF UNITED STATES BEEF IMPORTS: A REPORT PREPARED BY DR. ANDREW SCHMITZ AND MR. RAY NELSON FOR THE U.S. INTERNATIONAL TRADE COMMISSION
E-2
The Impact of United States Beef Imports *
Andrew Schmitz and Ray Nelson **
This study quantitatively assesses the impact on United States beef prices
of changes in governmental policy which directly affects the volume of beef
imported. The major emphasis is on imports which are subject to the Meat Import
Act of 1964. Spatial price equilibrium models and import demand functions
estimated by econometric techniques are among the approaches us-ed in the quanti
tative assessment of the impact of beef quotas. The results of the various
approaches are presented and compared.
I. Historical Background
The issue of United States beef imports has been a controversial one.
For example, beef producers have contended that if beef imports are not re
stricted, irreparable harm can be done to the live stock industry. On the
other hand, consumers here argued that increases in beef prices in the late
1960's and early l970 1 s were partly caused by beef import quotas.
* This report was prepared by the authors for the United States International Trade Commission.
** Andrew Schmitz is Professor of Agricultural and Resource Economics, University of California, Berkeley and Ray Nelson is a graduate student in the Department of Agricultural and Resource Economics at the University of California, Berkeley. The assistance of G. Russell McCracken and Colin Carter in preparing this report is acknowledged and appreciated.
Table 1: United States Imports of Cattle, Beef, and Veal 1960-1975
Total 1 2 Total 1 Total 1 Fresh3 Total
Total Frozen Imports U.S. Cattle U.S. Beef & Veal or Chilled Percent of
Year Marketings Imported Production Imports Imports Production
1,000 head cattle 1 million lbs carcass 1 million percent weight equivalent pounds
Sources: l. United States Department of Agrfculture, Statistical Reporting Service, Livestock and Meat Statistics., Statistfcal Bulletin.333,.and Annual Supplement.
2. United States Department of Agriculture, Economic Research Service, Livestock and Meat Situation., various issues.
3. United States Department of Agriculture, Economic Research Service. United States Foreign Agl'ieultural Trade Statistical Report., Calenda:t> year., 1976 and 1974.
E-4
A. United States Beef Imports
1. Magnitude and Types
To gain prospective on the beef quota issue, Table l presents
data on United States imports of cattle, beef and veal. During the period 1960-
1975, United States _beef imports have not exceeded 10% of domestic production.
However while the percentage of imports is not large, the absolute amounts are
substantial (eg: 2.02 billion pounds, expressed in carcass weight equivalent,
for 1973). Also the largest percentage of beef imported into the United States
is fresh, frozen and chilled -- the categories of beef upon which this study
focuses. Further, over 90% of the beef impo.rted in these forms is "boneless"
beef.·
2. Source of Imports
Table 2 illustrates the sources of United States beef imports
of the fresh, frozen and chilled categories. The principal supplier·s are Aus
tralia, New Zealand and Central America in descending order of importance. Note
that Australia provides roughly 20% of the total. Thus together Australia and
New Zealand supplies roughly 70% of the above types of beef imported into the
United States.
Table 2: United States Imports of Beef and Veal (Fresh, Chilled and Frozen) by Sources of Supply, 1972-76
YEAR AUSTRALIA NEW ZEALAND CANADA I CENTRAL AMERICA ALL OTHERS
Source: Compiled from official statistics of the United States Department of
Commerce.
3. Beef Shipments to the United States from Australia and New Zealand
The two major suppliers of beef to the United States are Australia
and new Zealand. Table 3 illustrates the percentage of beef production of each
country that is exported to the United States and the corresponding percentage
of each country's total beef exports. Note that at times more than 50% of their
beef exports go to the United States. Also more than 20% of the production in
these two countries is exported which is unlike in the United State where, as
seen earlier, less than 10% of total domestic production is imported.
4. The Meat Import Act of 1964
In 1964, because of the significant increase in United States beef
imports and depressed domestic prices, Congress passed the Meat Import Act.
This Act applies only to fresh, frozen and chilled beef and veal entering the
United States and limits the amount of imports to a predetermined level . .!/
The base level for the quota is determined annually by the Department of Agri
culture and must be published in the Federal Register. The amount of the quota
is 11 increased and decreased for any calendar year by the same percentage that
estimated average annual domestic-correnercial production of these articles dur
ing the years 1959 through 1963, inclusive. 11~ Whenever the projected amount
of imported meat subject to the law exceeds the trigger level or 110 percent of
the quota base, the President is required to limit by proclamation the quantity
of beef and veal legally importable. However, the quota proclamation can be
]J Actually the Act also covers meat from sheep and goats. However because the amounts are insignificant the numbers used are taken to be beef and veal imports.
2/ United States Congress House, 1964. Meat Importation Act, 88th Congress 2nd Session. H.R. 1839.
E-6
Table 3: Australia and New Zealand Beef and Veal Production and Exports, 1967-1974
Australia
Total Total Shipments U.S. Imports U.S. Imports Production Exports to U.S. Australia's Production Australia's Exports
Table 11: Estimated Impacts on Total Receipts from Beef Given Import Levels, 1975-1976
Study
Cattle Farris.and Freebairn Classification Graeber and Rausser
1975 1976 1975 1976
mill ion dollars
Utility Cows 607. l 770. 7 350.2 444.9
Slaughter Steers l 09. l 168.2 274.4 425.9
Choice Feeders 477. l 677 .6
All Slaughter Cattle
Folwell and Ehrich and Shapouri Usman
1975 1976 1975 1976
Ut i l ity Cows 346.9 440.8
Slaughter Steers
Choice Feeders
All Slaughter Cattle 1647.2 1792.6
Source: Same as Table 9.
E-20
IV. Additional and Recent Findings
A. Econometric Models
In this section results are presented for three econometric models.
Although these models are estimated using current data they patterned after
those of Edwards (1964), Ehrich and Usman (1974) and Jackson (1972) . ..!J
(1)
1. Model I
The estimated equation for the period 1959-1975 is:
P = 32.71 - 0.21 Qf - 0.44Q + 12.76 I+ 1.13 Pb 0
* (- 3.08) (- 2.38) * * (3.18) (3.01)
D.U. = 2.01
where: P =average real price of live choice grad~ steers ($/cwt.)
Qf = per capita production of fed beef (lbs)
Q0
= per capita production plus per capita imports of non-fed
beef (lbs)
I =natural log of per capita desposable increase ($1,000) 2/
Pb = real farm value of by products (¢/lb}
..!J In each model the number in brackets are 11 t 11 statistics. significance at the 5% level is indicated by*; 10% level of significance is **.
2/ The level of statistical significance does not change significantly even if logs are not used.
E-21
In equation (1) all of the coefficients are significant at least at the
5% level of probability;ll their signs are consistent with economic theory.
Interestingly the results are very similar to those obtained by Edwards (1974)
even though data from 1963-1975 are added to our model.
Of major importance in interpreting equation (1) is the effect of variable
Q0
• For example if imports are increased by 215 million pounds (which is roughly
18% of the current level of imports under the Meat Act) the average "real" price
(in 1967 dollars) of beef would decrease by roughly $0.44/cwt~ This price is
equivalent to $0.80/cwt. in 1977 dollars. This result is also very close to
that obtained by Freebairn and Rausser (1975) where they estimated the effect of
a 200 million pound increase in imports to be $0.60/cwt. and $1.09/cwt. for
slaughter steers and cull cows respectively
To interpret the results further, suppose imports were reduced to their 1964
l~vel. This would be a reduction, of roughly 600 million pounds. Such a reduction
would cause the nominal price of fed beef (at the farm level) to increase by over
$2.00/cwt.
1J Two assumptions implicit in equation (1) should be noted. The first of these is that the ~upply of beef coming on the market in any one year is a predetermined variable, i.e., supply is not a function of (does not depend upon) current price in the market.
The second assumption is that of perfect substitution between domestically produced cow beef and off-shore beef of similar quality. In simple tenns, this implies that a given decrease in domestic cow beef production will have no effect upon the average price of all domestically produced cattle if it is accompanied by an increase of equal volume in the quantity of beef imported. Furthermore, the rate at which beef from these two sources can be substituted for one another is independent of the volume of either of them, i . e. , the effect upon price of a given increase in imports will be the same when the production of domestic cow beef is equivalent to one pound per capita as it will be when domestic production is a hundred, or a thousand, pounds per capita.
E-22
2. Model II
The estimated equation for the period 1959-1975.l/
(2) ln Pc = 5.21 + 0.21 ln Qf - 0.99 ln Q0
+ 0.49 I
* * (0.91) (- 3.58) (2.47)
R2 = 0.53
D.lL = 1.85
where: Pc= real wholesale price of utility cows ($/cwt. dressed). All of the
other variables are the same as defined in Model I. Note that only Q0
and I
have significant effects on cow prices.
Since equation (2) is estimated in logs, the coefficient -0.99 is
aPc/Q0 , hence a 1% change in Q0 results in a 1% change in Pc. Because of our aQo Pc
definition of Q0 , a 215 million pound increase in imports results in; 2.8%
decrease in Pc. This translates into a $0.75/cwt. in real terms and $1 .37/cwt.
in nominal terms.
Additional equations were estimated:
(3)
(4)
Pc = 46.30 - 0.05 Qf - l .41 Q0
+ 22.18 I
( - 0. 36) (- 3.87) * (2.95) *
R = 0.58
D. W. = l. 98
Pc= 89.97 + 0.09 Qf - 2.17 Q0
+ 26.95 I - 0.63 QP
R2 = 0.67
o.w. = 1.78
* * * (0.77) (- 5.58) (4.35) (-2.93)
lJ The structure of the model is somewhat similar to that used by Ehrich and Usman (1974)_.
E-23
(5) Pc= 9.92 + 0.54 ln Qf - 1.58 1n Q0
+ 0.61 I - 1.06 1n QP
R2 = 0.67
D.W. = 1.81
* * * * (2.15} (- 4.40) (3.36) (- 2.22}
In the above equations QP is per capita pork production (lbs). All of the
other variables are the same as previously defined.
The estimated effects from the quota using equations (3), (4) and (5) are
greater than those obtained from equation (2). For example from equation (3) a
215 million pound increase in imports reduces the wholesale price of utility cow~
(dressed weight} by $1.41/cent which in nominal terms is $2~57/cwt. Equation 4
shows that the effect is $2.17/cwt. in real terms and $3.96/cwt. in current dollars.
From equation (5), a 215 million pound increase in imports results in a decrease
in Pc by 4.4% which is a $1.18/cwt. real price decrease or a $2.16/cwL nominal
price effect .
. The above findings are consistent with theory and previous results. The
coefficients indicate that meat imports have a greater effect on the price of
non-fed beef than on fed beef prices. This is because meat imports under the
Act fit the non-fed category and in consumption fed and non-fed beef are not
perfect substitutes.
3. Model III
In the following equations (estimated from 1959-1975 data} the effects
In terms of equation (6) a .215 million pound increase in imports, assuming
that they are substitable with domestic non-fed beef, decreases the real price
of Pf by $0.77/cwt .. ; in nominal terms this is $1.40/cwt.; from equati_on (7) the
effect on Pc is $1.68/cwt. in real terms and $3.08/cwt. i"nnomi.nal terr.is. Note
also that the effect of imports on the price of non-fed beef is much greater
than the effect on fed-beef price. This finding is consistent with other studies.
B. Spatia Z Price Mode Zs
The free-trade model for a single commodity is described in notation
form below:T/ Let
Subscript i =consuming regions l, ., n
Subscript j =producing regions l, ., m
o. = quantity consumed in region i 1
Jj The above framework can easily be modified to describe a multiply commodity model. However it is much easier computationally to solve for equilibrium prices, quantities, trade flows and the like in the single commodity case than in the multiple good case.
and
E-25
s. =quantity produced in region j J
OP. = the {destination) price in producing region 1
OP. =the {origin) price in producing region j J
X .. = quantity shipped to region i from region j lJ
Ti. =transfer cost to region i from region j. J .
Given demand equations for each region,
O. = a. - b. OP . . 1 1 1 ,
for all i;
supply equations for each region,
S. = c. + d. OP. J J J J for all j;
and transfer costs among all regions,
T.. between each i and j; lJ
find:
DP. , OP . , 0. , S . , and X .. 1 J , J lJ
for all i and j
by maximizing: l l f {P) =I. a
1. OP
1. - -2 I. b. OP. - I. c. OP. - -2 I. d. OP.
1 11 1 JJ J JJ J
subject to:
OP. 1 - OP. < T .. J - lJ
if x .. 1J = 0
DP; - OP. J
= T .. lJ ; f. X;j > 0
D; = IJ x .. lJ
s. - r. x .. J 1 lJ
DP;, OP., x .. > 0. J lJ -
E-26
Although the above model is specified for free trade in commodities, it
can be modified to incorporate tariffs, quotas, price supports and many other
governmental policies which affect international trade.~ Because of this, the
model is realistic in depicting actual trade flows among nations. Also it is
possible to determine the effects of removing or introducing governmental policies
such as a lowering or increasing of beef quotas.
A. Single Commodity Beef Model
In the pioneering study by McGarry (1969) beef prices, trade flows,
consumption and production were determined endogenously while wheat, feedgrains
and other commodities \·Jere exogenous to the model. McGarry estimated statistically
beef supply and demand functions for the United States, Argentina, United Kingdom,
Ireland, Denmark, the European Economic Community, Australia and New Zealand.
For the remaining regions, projections of import/export gaps were made based on
trend analysis.
The McGarry model has since been expanded to include wheat and feedgrains
endogenously hence only two of his major results will be presented. 41 First,
McGarry projected that by 1980 the competitive position of the United States
beef industry would improve relative to its position in the 1950's and 1960's
2/ The interested reader should refer to the following excellent paper on how to incorporate governmental policies into free trade spatial price equilibrium models. D. L. Bawden ''A Spatial Price Equilibrium Model of International Trade." Journal of Farm Economics, volume 48 (November 1966) pp.862-874.
3/ M. J. McGarry An Economic Anal sis of 1980 International Trade in Beef. Ph.D. Dissertation, Department of Economics, University of Hisconsin 1969).
4/ See D. L. Bawden and A. Schmitz "The Effects of Alternative Agricultural and Trade Policies on the World Hheat, Feed Grain and Beef Market," in Domestia and Foreign Gove1'Y!l7lent ~ograms and Poliaies Affecting United States AgriaultUPal Trade.
E-27
visa via the United States. Second, McGarry estimated the effect on the farm
price.of fat cattle of allowing imports from Australia to in~rease by 180,300
metric tons. This increase in imports caused producer prices to decrease from
$1057/metric ton to $1029/metric ton.
B. Multiple Corrunodity Model
The study by Bawden and Schmitz (1973) computes prices and trade flows
for beef, wheat and feedgrains in a spatial price equilibrium context. Supply
and demand equations were estimated for beef wheat and feedgrain for major trad
ing nations. For beef, supply and demand equations were estimated for the United
States, Canada, Australia, Argentina, the European Economic Community, Japan,
New Zealand, and the United Kingdom. In the 11 basic 11 solution which contained
E.E.C. levies, United States quotas and other barriers to trade, United States
producer price was $868/metric ton. This dollar amount is the weighted average
price received by farmers for beef cattle expressed in carcass· weight equivalents.
In the basic solution the demand price (which differs from the producers price
by transportation costs among production and consumption centers) is $908/metric
tons)/ Corresponding to the above~the production of beef and veal was 9581
thousand metric tons and imports were 518 thousand metric tons or roughly l billion
pounds expressed in carcass weight equivalents or roughly 670 million pounds in
terms of product weight equivalents.£/ This amount is roughly 60% of current im
ports under the Meat Act.
Based on this model, an increase in imports of 600 million pounds of the types
of meat imported under the Meat Act (which is mostly boneless beef) reduced United
Ji The basic solution is presented in Bawden and Schmitz (1973) p.417.
2/ See Table 218 United States Department of Agriculture, Economic Research Service. Livestock and Meat Statistics3 p.143 (July 1970), for the relationship between carcass weight and product weight.
E-28
States beef prices by 8%. This is a reduction of $69/metric ton in terms of
the weighted average producer price of beef expressed in carcass weight equi
valent, which is roughly $3.10/cwt. of carcass weight beef. It is important
to note that this price is for both fed and non-fed beef .l/ Interestingly the
above findings are consistent with our results which were presented earlier
{derived from completely different models) and with those of other authors (see
for example Tables 9 and 10).
Unlike in the previous studies, results are presented on the volume of
United States beef imports, if both the quota and the duties were re-
moved. With both the quota and duty removed, imports expressed in product weight
equivalent would increase by roughly 600 million pounds. If only the quotas
were removed, imports would increase by roughly 350 million pounds. This is
roughly 60%and 35% respectively when imports measured in product weight are ex
pressed as a percentage of the volume of carcass weight beef imported .. under the
tariff and quota. 2/
It is interesting to determine the effects of a change in quota levels when
the United States beef demand and supply functions are updated by including in
estimation data through 1975~ The results do not significently cnage. A change
in imports of 600 million pounds changes the price in terms of carcass weight by
roughly $70/metric ton. The producer price in the absence of both tariffs and
quotas is roughly $1100/metric ton and .imports: _would increase by between 600~70.Q
rui.11 ion pounds.
If one uses the standard concepts of economic rent and consumers' surplus
lf Due to the increase in imports beef production declines by 2% and gross revenue to the beef sector drops 10%.
2/ In addition to the quota, for meat imported which is subject to the Meat Act a 3¢/lb duty is imposed.
E-29
as a measure of welfare change, the change in economic rent (as a measure of
producer welfare) is approximately 375 million dollars computed for 1975 for
a change in boneless beef imports of 325 million pounds. Evaluated in terms
of the 1964 level of imports under the Act, the loss in economic rent by allow
inq imports under the Act to increase to current levels is roughly 500 million·
dollars. Note that this number is smaller than that given in previous studies
since they use the change in total gross receipts which, when the supply curve
is upwarding sloping, has to be greater than the change in economic rent.
In terms of the effect on consumers, the loss in consumers' surplus (whe;e
the demand curve is estimated at the wholesale level) due to a decrease in im
ports of 350 million pounds is roughly 500 million dollars .
. V. Interpretations and Conclusions
The previous findings show ·the approximate magnitudes of the effects of chang
ing the level of United States beef imports. While the econometric models used
are able to detect the effect of imports on different types of meat, one is unable
with this approach to determine the effect of a complete removal of duties and
quotas unless some assumption is made about the effect this has on the supply
price of exporters: On. the other hand, because of the complexity of spatial price
models, one generally has to aggregate non-fed and fed beef into one category.
Thus, while this approach can give results on the effects of free trade it car.not
differentiate the effects imports have on different types of meat unless separate
demand functions are estimated and included in the model. In our spatial ~odel,
beef was aggregated into one commodity; this should be kept firmly in mind when
interpreting the results.
One can use the quantitative findings reported in many ways. As a example,
E-30
effects measures in terms of aggregate welfare were presented. These were es
timated based on economic rent and consumers' surplus. Other authors presented
findings in terms of change in gross receipts due to a change in import levels.
One other way that the results may prove useful is to consider the effect of a
~hange in imports on a specialized cow-calf rancher who has a breeding herd of
200 cows and who sells the calves as feeders. Assume that imports increase by
400 million pounds which (based on the previous results) causes cull cow prices
to drop by roughly $2.25/cwt. and feeder calves to decrease by $2~15/cwt. As
suming a 5% death loss, a 10% cull rate and that calves are sold at a 450 lb.
weight, the change in total gross receipts for the rancher is roughly $2500.
How important this amount is to the rancher depends upon, among other things,
the general level of prosperity in the cattle industry.
The overall prosperity of the cattle industry, at the time when decisions
are made on import levels, is important. As. a recent study Onternat:ional Trade
Commission (1977) pointed out, the cattle industry has been under financial stress
si-nce 1973 .. The majority of cow-calf operations during the 1974-76 period did
not cover their total costs of operation. In certain cases, cow-calf operators
did not even cover variable costs. It is clear that an additional $2500/year to
a rancher during th1s period would have a greater effect than say during 1973
when the cattle business was quite profitable.
Because of the.ir current financial problems many cattle people are facing,
another point worth stressing in the link between the cattle cycle and the Meat
Act in which the quota is tied to domestic production. Because of a sharp rise
in grain prices and other factors, the number of cows slaughtered increased
dramatically since 1973 (see Table 5). This caused prices to drop even further.
However the decrease was strengthened by the growth in imports since, if the Act
is adhere to, more beef can be imported because domestic production is increased
even though
E-31
even though part of the production increase is due to herd liquid~tion due to
a depressed industry. Thus one could argue, that the present quota system (if
adhered to) can magnify the degree of price instatility in the cattle industry.
The data presented can also be used to examine the effect on cattle feeders
and consumers. With respect to the latter, imports do not effect the poor and
the wealthy equally. As studies have shown, the largest proportion of non-fed
beef is consumed by low income people. Hence they gain more from beef imports
than do people who purchase largely fed beef. As our results showed, the impact
of imports on fed beef prices is less than the impact on non-fed beef prices.
In evaluating the trade offs between producers and consumer groups from meat
imports, it should be remembered that in some cases producers derive their sole
source of income from the sale of beef. As a result, their livelihood greatly
depends on income derived from the sale of cattle. For consumers, due to sub
stitutes and the general level of affluence, clearly not all of their~income is
spent on meat.
In conclusion,· the empirical results show that changes in imports allowed
under the Meat Act will not have a major impact on various types of cattle pro
ducers (egs.: cattle feeders, ~ow-calf operators) nor on consumers in terms of
changing profits or consumer expenditures by say 50%. Any likely changes in
imports under the Act can at most have a 10 to 15% effect on beef prices and the
like for· any given year. Thus it is incorrect to argue, for example, that a 20%
reduction in beef imports will solve the financial problems of cattle producers
or a 20% increase in imports will cause a substantial drop in retail meat prices.
E-32
References
Barmettler, Edmund R., and Cothern, James H. "Developing the Potential for
Trade in Beef and Beef Products." International Beef Trade Issues.
Agricultural Extension, University of California. ~JEMC Publication 10.
(August 1973).
Bawden, D. Lee 11 /!i.. Spatial Price Equilibrium Model of International Trade. 11
Journal of Farm Economics. Volume 48, 4, part 1, pp.862-874
Bawden, D. L., and Schmitz, A. Domestic and Foreign Goverrzment Programs and
Policies Affecting United States Agricultu.r'al Trade. United States Tariff Commission Publication 613, Washington, O.C. (October 1973).
Cothern, James H. "Changing Institutional Forces and Trade in Beef and Beef Products." International Beef Trade Issues, Agricultural Extension, University of California, ~JEMC Publication 9. (August 1973).
Cothern, James H. "Import and Export Programs: Their Impact on Domestic and Foreign Beef Industries." International Beef Trade Issues. WEMC Publication 8 (August 1973).
Cothern, James H. "Institutions, Social and Economic Goals, and International Trade in Beef and Beef Products." Paper prepared for research project. "Changing Relations in Horld Markets for Meat," University of California, Davis (June 1974)
Cothern, James H. "Trade in Beef and Beef Products Throughout the Horld. 11
InteY'Yl.ational Beef Trade Issues, University of California, WEMC Publication 7, (August 1973).
Davis, Ernest E. "Impact of Beef Imports," Food and Fiber Economics. The Texas A & M University System, AECO, volume 9, no.7 (September 1977).
Ouymovic, Andrew, Crom, Richard, and Sullivan, James. Effects of Alternative
Beef Irrrport Policies on the Beef and Pork Sectors, United States Department of Agriculture, Economic Research Service, Agricultural Economics _ Report Number 233 (October 1972).
Edwards, John A. Beef Imports and the United States Beef Cattle Market,
Special Report 178, Agricultural Experiment Station, Oregon State University, Corvallis(l964).
E-33
Ehrich, Rollo L., and Usman, Mohammad Demand and Supply Functions for> Beef
Ehrich, Rollo L. Economic Analysis of the United States Beef Cattle Cycle.
Wyoming Agricultural Experiment Station, Science Monograph l {April 1966),
Freebairn, J. W., and Rausser, Gordon C. 11 Effects of Changes in the Level of United States Beef Imports." Journal of Agricultural Economics. Volume 57, No.) (November 1975): 676-688.
Ginn, Bruce A. "International Trade and the United States Beef Industry. 11
Western Livestock Marketing Information Project for Presentation to the Beef Industry Symposium, Swift Current, Saskatchewan, Canada (February 14~ 1977).
Houck, G. P. 11The Short Run Import of Beef Imports on United States Meat Priceso •; Australian Jounral of Agricultural Economics 18 (1974): · 60-72.
Houck, James P. 11A Proposed Change in the Meat Import Quota Formula: A Move Toward Stability." Statement before the United States International Trade ComrnissiOn in Connection with Investigation no. 332-85.
The Contrasted Effec·ts of Quota, Autarky, and Free Trade Policies Hunt, R. D. on United States Beef Production and Prices. Ph.D. Thesis, Department of
Agricultural Economics, University of Minnesota (1972).
Jackson, Geoffrey H. The Irrrpaet of Eliminating the Quota on United States Im
ports of Beef. Cornell Agricultural Experiment Station, Aricultural Economics Research 338 (January 1972).
Knox, Phillip L. The United States Beef Cattle Industry: A Policy Analysis,
Costs of Adjustments Theory~ Unpublished Ph.D. dissertation, University of California, Berkeley (February 1973)
Langemeier, Larry, and Thompson, Russell "Demand, Supply, and Price Relation~ ships for the Beef Sector, Post World War II Period," Journal of Agricul~
tural Economics, volume 49, no.l, Part 1 (February 1967).
McGarry, Michael J. An Economic Analysis of l980 Intei>national Trade in Beef9
Unpublished Ph.D. dissertation, University of Wisconsin (1969).
Menzie, E. L. Hillman, J. S. and Waelti, J. The Relevance of Livestock and
Meat Imports to the United States. Arizona Agriculture Experiment Station< Technical Bulletin 164 (July 1964).
E-34
Rausser, Gordon C. and Freebairn, J. W. "Estimation of Policy Preference ·Functions: An Application to United States Beef Import Quotas." The
Review of Economics and Statistics. Volume LVI (November 1974), no.4, pp.437-499.
Reutlinger, Shlomo "Short Run Beef Supply Response. 11 Journal of Farm Economios,
volume 48, no.4, part 1, pp.909-919 (November 1966).
Samuelson, Paul A. "Spatial Price Equilibrium and Linear Programming. 11 The
American Economic Review, volume XLII, no.3, pp.282-303.
Schaller, Neill "Beef Import and Export Policies islation. 11 International Beef Trade Issues.
versity of California, WEMC Publication no.6
Reasoning, Arguments and LegAgricultural Extension; Uni
(August 1973)
Schultz, Henry "The Statistical Measurement of the Elasticity of Demand for Beef." Journal of Farm Economics, volume VI, no.3, pp.254-278 (July 1924).
Takayama, T. and Judge, G.G. "Equilibrium Among Spatially Separated Markets: A Reforumlation. 11 Econometrica, volume 32, no.4 {October 1964), pp.510-524.
United States Congress. House. 1930. Tariff Act of l930. Publi~ Law 36l.
7lst Congress, 2nd Session, House Documents no.476.
United States Congress. House. 1964. An Act to Provide for Free Importation
of Certain Wild Animals, and to Provide for the Imposition of Quotas on
Certain Meat and Meat Products, Publication L., 88-482, 88th Congress, 2nd Session, H. R. 1839.
United States Senate Congressional Record. The Flanigan Report, volume 119, no.58.
United States Department of Agricultural, Economic Research Service. "Australia' Agricultural Production and Trade Policies Affecting United States Farm Exports." Foreign Agricultural Economic Report no.l3, Washington (December 1961).
United States Department of Agriculture, Economic Research Service. Livestock
and Meat Situation, various issues.
E-35
United States Department of Agriculture, Foreign Agriculture Service. Ne1J
Zealand's Livestock and Meat Industry, FAS-M-184 (October 1970).
United States Department of Agriculture, Statistical Reporting Service. Live
stock and Meat Statistics, various issues.
United States International Trade Commission. Conditions of Competition in
United States Markets Between Domestic and Foreign Live Cattle and Cattle
Meat Fit for Hwnan Consumption, Report on Investigation no. 332-83, 1977.
United States Tariff Commission. 1964. Beef and Beef Produc·ts, TC Publication 128, Washington, D.C.
United States Tariff Commission. Domestic and Foreign Government Programs and
Policies Affecting United States Agricultural Trade, Tariff Commission Staff Research Paper, Investigation no.332-59.
United States Tariff Commission. Swnrnaries of Trade and Tariff Information,
!}U.S. GOVERNMENT PRINTING OFFICE1 1977-720· ;55/2
Library Cataloging Data
U.S. International Trade Commission. Conditions of competition in U.S.
markets between domestic and foreign live cattle and cattle meat fit for human consumption. Report on investigation no.332-85 under section 332 of the Tariff act of 1930. Washington, 1977.
126, A-240 p. illus. 27 cm. (USITC Publication 842)
1. Meat industry and ~rade. 2. Meat industry and trade--U.S. 3. Beef cattle. 4. Beef cattle--Prices. 5. Beef--Tariff. 6. Cattle trade--U.S. 7. Meat import act--1964. 8. Agricultural act--1956--Sectiort 204. I. Title
UNITED STATES
INTERNATIONAL TRADE COMMISSION WASHINGTON. O.C. 20436
OFFICIAL BUSINESS
ADDRESS CORRECTION REQUESTED
ADDRESS CHANGE [J Remove from List [] Change as Shown
Please detach address label and mail to address shown above.