Copyright © Singapore Department of Statistics. All rights reserved.
About the Census of Population
Singapore carries out the Census of Population once in
ten years. Conducted by the Singapore Department of
Statistics (DOS), the Census is the largest national
survey undertaken to collect and compile information
on detailed characteristics and the profile of the
population and households. Since 2000, Singapore has
adopted a register-based approach for Census-taking,
using administrative data from different sources to
provide basic demographic information such as age,
sex and ethnicity for the whole population. In-depth
information on socio-economic and household
characteristics that are not already available from
administrative sources are then captured through a
large-scale sample survey.
To raise public awareness of the Census of Population
2020 (C2020) in general and to reach out to
survey respondents in particular, relevant information
about the C2020 was made available through the mass
media (e.g. radio and newspaper ads),
posters (e.g. in community centres, MRT trains,
neighbourhood police posts etc.) and the SingStat
Website (www.singstat.gov.sg/census2020). The Census
webpage includes a video on the conduct of C2020
and its purpose as well as access to the Census Online
Submission Form.
Even though Censuses have been conducted regularly
about once in 10 years since 1871 in Singapore,
the impact of the COVID-19 pandemic posed
unprecedented challenges for the conduct of C2020
and presented valuable lessons for the planning and
implementation of future household surveys.
Adjustments to C2020
Data Collection Strategy
The C2020 sample survey covering some 150,000
households, was launched on 4 Feb 2020. A tri-modal
data collection strategy is implemented to cater to the
varied profile and needs of the population while
balancing resource considerations. Based on the
experience of C2010, data collection for a Census was
expected to take about 6 months to complete.
However, the COVID-19 outbreak and the ensuing
measures implemented nationwide to control its
spread severely impact the timeline for the conduct of
C2020. The Census Office in DOS swiftly made
adjustments and adapted to the new operating
environment for the C2020 operations.
Online Self-Enumeration
In C2020, respondents are able to submit their survey
returns directly through the Internet. This provides
flexibility for respondents as the online submission
platform is available round the clock for them to
provide their returns at their convenience.
Through online enumeration, the manpower required
to reach out to respondents is reduced. Despite the
COVID-19 outbreak, the online submission mode
allows for the C2020 data collection to
continue as respondents could complete and submit
their returns themselves in the convenience of their
homes any time of the day. To encourage online
self-enumeration, respondents who did not complete
and submit their survey returns by the deadline would
receive up to three reminder letters, one more
compared to the two reminder letters that were sent
in C2010.
Conducting Census of Population 2020
in Singapore amidst COVID-19
by Chia Wai Yin and Wong Wei Lin
Census Office
Singapore Department of Statistics
2 Statistics Singapore Newsletter Issue 2, 2020
Computer-Assisted Telephone Interview
Respondents are able to complete the survey over the
phone via a Census hotline. The Census Call Centre
also reaches out to respondents who have not
completed their returns online by a stipulated date.
Besides providing assistance in the completion
of survey over phone interviews, the Census hotline
is critical in supporting respondents in completing
their online submission and attending to other
general enquiries and feedback on C2020.
With work-from-home arrangements being in place
during the Circuit Breaker period between April and
June 2020, operations at the Census Call Centre were
scaled down. Work processes were changed to allow
for a smaller pool of C2020 staff to continue
supporting the operation of certain scope of work over
the telephone. This includes receiving incoming calls
for phone interviews and survey enquiries. Calls made
to respondents were cut down.
Face-to-Face Interview
Face-to-face interviews are conducted for respondents
if they did not respond through the online survey
and could not be contacted by phone. At the initial
launch of C2020 in February, a small number of
households were visited by C2020 interviewers.
Due to the COVID-19 outbreak, face-to-face visits were
only arranged upon request from mid February to early
March, and face-to-face visits were only carried out
after health and travel declarations were obtained from
these households which had requested for face-to-face
interviews. These additional precautionary measures
were put in place to ensure the health and safety
of both the C2020 respondents and C2020 staff.
Field visits were suspended from April to mid July 2020
due to measures implemented nationwide to fight
against COVID-19, and only resumed towards
the second half of July, well into Phase 2 post Circuit
Breaker.
Lessons Learnt
In reviewing the design of C2020 and reflecting on the
adjustments made, the following areas were identified
to have helped mitigate the impact of COVID-19, and
will continue to be leveraged if needed.
Staggered Rollout
In the design of the Census workflow, the Census
Office has adopted a staggered approach where the
full Census sample is split into a number of smaller
groups, which have survey start dates spread over
3
3 Statistics Singapore Newsletter Issue 2, 2020
0
20
40
60
80
100
1 11 21 31 41 51 61 71 81 91 101 111 121 131 141 151 161 171 181 191 201 211
Elapsed Days
Completion Rate (%)
Completion rate starts to slow down with the suspension of reminder letters during Circuit Breaker
CHART 1
COMPLETION RATE OF C2020 BATCHES
several weeks. This is to help manage the case load on
the Internet server, call traffic to the Census hotline
and minimise risk of data exposure for individual
households on the Internet.
This design provided flexibility for the dispatch dates
and sizes of each batch to be adjusted in response to
the evolving COVID-19 situation and measures. For
example, when call operations were scaled back, we
were able to release smaller batches in less frequent
intervals to cushion the effect of reduced manpower.
Applying Analytics to Schedule Reminders and
Optimise Response
Analytics were used to monitor the progress of
individual batch and follow up with adjustments,
in particular on the intensity of reminders to
households. Due to the suspension of reminder letters
being sent during the Circuit Breaker period, there was
a drop in responses for selected groups (Chart 1).
This demonstrates the effectiveness of reminder letters
in boosting survey completion rates.
Earlier Census Launch Date
In C2010, contingency plans were discussed to provide
for potential challenges that may arise due to the
H1N1 outbreak between 2009 and 2010 ahead of the
launch of the Census but these were not activated
eventually. C2020 was launched one month ahead of
schedule compared to the previous Census, to cater for
unforeseen circumstances. The earlier launch provided
some buffer time for Census operations to gradually
resume after the main operations had to be scaled
down for over two months due to the implementation
of the Circuit Breaker measures between 7 April and
18 June 2020.
Online Submission
With more than half of the households submitting
their returns via the Internet, a large proportion of
responses continued to be received during the
Circuit Breaker. The higher take-up rate for online
mode compared to the previous Census was expected
but still served as a critical factor in reducing the load
that needs to be followed up on.
Register-Based Census
As data on population estimates are compiled from
administrative records, top-line population data such
as population count, sex ratio, age and ethnic
composition for 2020 have been made available
through the annual Population Trends report. This is
despite the impact of COVID-19 measures and scaled-
down Census operations over a protracted period.
Data Processing Enhancements
Using administrative data for consistency checks
and implementing machine learning to the coding
of selected data items mitigated resource constraints
in data processing during the COVID-19 pandemic
as work-from-home arrangements were put in place.
Current Progress
As of September 2020, the Census 2020 collection is
still ongoing. The Census Office strives to complete the
data collection as soon and safe as we can, while we
adapt to the COVID-19 situation when required.
Detailed statistical releases are expected to be released
progressively from 1Q 2021.
4 Statistics Singapore Newsletter Issue 2, 2020
1 SMEs (Small & Medium Enterprises) are defined as enterprises with operating receipts not exceeding $100mil or employment of not more than 200.
2 Programme details are available on the IMDA website (https://www.imda.gov.sg/SMEsGoDigital).
3 Refers to the number of unique firms adopting PSG solutions within each quarter.
Profile of SMEs Implementing Digital Solutions
Supported by the Productivity Solution Grant
by Jeremy Lim and Seng Li Cheng
Business Statistics Division, Singapore Department of Statistics
and
Chen Jia’en and Sim Han Qiang
SMEs Go Digital Division, Infocomm Media Development Authority
Introduction
Digitalisation is a key enabler for businesses to
improve their competitiveness, increase revenue and
raise productivity. By adopting digital technologies,
firms can reach a wider market through e-commerce
or improve efficiency by automating business
processes. Over the years, the Singapore Government
has implemented various initiatives and schemes
to help firms in their digital transformation efforts
and take advantage of the new opportunities that
come with it.
SMEs Go Digital Progamme
SMEs1 form the backbone of the Singapore economy,
contributing about two-thirds of employment and half
of Singapore’s Gross Domestic Product (GDP). To keep
up with the rapidly changing economic landscape, it is
thus crucial to develop digital capabilities of the SMEs.
Managed by the Infocomm Media Development
Authority (IMDA) and Enterprise Singapore (ESG),
the SMEs Go Digital programme2 aims to help
SMEs build stronger digital capabilities to improve
productivity and seize growth opportunities.
Under the programme, firms that adopt digital
solutions pre-approved by IMDA can receive funding
support from the Productivity Solution Grant (PSG)
to defray implementation costs. Between April 2018
and June 2020, about 14,700 SMEs implemented
digital solutions with support from the PSG scheme.
PSG-supported digital solutions can be grouped into
several broad categories. Commonly implemented
solutions include Sales Management, Inventory
Management, Customer Relationship Management
and Workforce Management solutions. These solutions
help firms manage sales and order fulfilment,
track inventory levels and movement, promote
customer retention via loyalty programmes and
manage human resource functions, such as payroll
and training. Remote Working solutions support
virtual meetings and online collaborations. E-Payment
(e.g. point-of-sales) and E-Commerce solutions are
also frequently implemented in industries with
business-to-customer (B2C) transactions, such as
retail trade and food services.
In this article, we examine the characteristics of
SMEs that implemented digital solutions under the
PSG scheme, and the type of solutions implemented
during the period of April 2018 to June 2020.
Significant Increase in the Take-Up Rate of
PSG-Supported Digital Solutions by SMEs
The number of SMEs adopting PSG-supported digital
solutions has been increasing over the years, rising
from a quarterly average of about 800 firms in 2018
to 4,000 firms in 2020 (Chart 1). In 2Q2020,
about 6,100 SMEs adopted PSG-supported digital
solutions, tripling the number of SMEs in the previous
quarter (1,800).
0
1,000
2,000
3,000
4,000
5,000
6,000
7,000
2Q 3Q 4Q 1Q 2Q 3Q 4Q 1Q 2Q
2018 2019 2020
No. of Firms
Firms adopting
Remote Working
solutions only
CHART 1
NUMBER OF FIRMS ADOPTING PSG-SUPPORTED
DIGITAL SOLUTIONS BY QUARTER3
Source: Infocomm Media Development Authority
5
5 Statistics Singapore Newsletter Issue 2, 2020
When the Circuit Breaker measures were implemented
from 7 April to 1 June 2020 to contain the
spread of the COVID-19 pandemic in Singapore,
remote working arrangements became necessary to
continue day-to-day operations for most businesses.
In response to this, IMDA introduced Remote Working
solutions in the month of April. The number of
firms adopting these solutions accounted for more
than 90% of the total increase in the number of
PSG-supported digital solutions adopters in 2Q2020
over the previous quarter.
Growth in Adoption of PSG Solutions
Across All Solution Types
Of the digital solutions taken up between the period of
April 2018 and June 2020, Sales Management,
Inventory Management and Customer Relationship
Management were the most frequently adopted
solutions, each accounting for about 20% of the
total number of adoptions.
Despite only being introduced in April 2020, Remote
Working solutions accounted for a significant share
(15%) of the total. Workforce Management and
E-Payments/E-Commerce solutions accounted for
about 8% of the total each.
Across the years, all solution types registered a growth
in the average number of solutions adopted per
quarter. In particular, the number of adoptions for
the top three types (Sales Management,
Inventory Management and Customer Relationship
Management) doubled from a quarterly average of
400 in 2018 to 800 in 2020 (Chart 2).
During the same period, accounts management
solutions registered the largest growth in the
number of solutions adopted, mainly due to
a low base in 2018.
Industry Profile
Firms in Business Services,
Wholesale & Retail Trade and Food Services
Had the Most Adopters
Firms in the services sector accounted for more
than 80% of those taking up PSG-supported
digital solutions. Of which, the Business Services,
Wholesale Trade, Retail Trade and Food Services
industries accounted for more than two-thirds of
all firms (Chart 3).
Source: Infocomm Media Development Authority
4 Excludes Remote Working solutions which was introduced in 2Q2020.
0 100 200 300 400 500 600 700 800
Workforce Management
Accounts Management
E-Payments / E-Commerce
Customer Relationship Management
Inventory Management
Sales Management
No. of Solutions2018 2019 2020
CHART 2
AVERAGE NUMBER OF PSG SOLUTIONS ADOPTED PER QUARTER BY SOLUTION TYPE 4, 2018– 2020
Business
Services
17%
Wholesale
Trade
16%
Food
Services
15%Retail Trade
12%
Manufacturing
9%
Others
9%
Construction
7%
Recreational &
Personal Services
7%
Transport & Storage
4%Information & Communications
4%
CHART 3
SHARE OF FIRMS IMPLEMENTING
PSG SOLUTIONS, BY INDUSTRY
Source: Infocomm Media Development Authority,
Singapore Department of Statistics
6 Statistics Singapore Newsletter Issue 2, 2020
The implementation of digital solutions by firms in the
Wholesale Trade, Retail Trade and Food Services
industries were mainly for streamlining their operations
and optimising resources, such as those related to
managing sales, inventory and customer relationships.
In line with the nature of their businesses, firms in the
Wholesale Trade and Retail Trade industries also took
up E-Commerce solutions, while firms in the Food
Services industry implemented E-Payment solutions.
Largest Increase in Number of PSG Solution
Adopters in Business Services and Wholesale
Trade in 2020
All industries in the services sector registered an
increase in the quarterly average number of adopters
in 2020 compared with that in 2018. In particular,
the Business Services and Wholesale Trade industries
registered the largest increases in the average
quarterly number of adopters of 700 and 500
respectively during the period (Chart 4). The increases
could be attributed to the implementation of Remote
Working solutions.
On the other hand, while the Food Services industry
had the highest number of PSG solution adopters
in 2018 and 2019, the industry saw a smaller increase
in 2020. This was mainly attributed to the relatively
lower number of firms adopting Remote Working
solutions in the Food Services industry as compared to
other industries, as remote working arrangements may
not be as relevant for the industry.
0 100 200 300 400 500 600 700 800
Transport & Storage
Recreational & Personal Services
Construction
Food Services
Manufacturing
Retail Trade
Wholesale Trade
Business Services
No. of Firms2018 2019 2020
CHART 4
AVERAGE NUMBER OF FIRMS ADOPTING PSG SOLUTIONS PER QUARTER BY SELECTED INDUSTRIES,
2018-2020
Source: Infocomm Media Development Authority, Singapore Department of Statistics
CHART 5
EMPLOYEE SIZE CATEGORY5
5 Employee sizes are defined as at the year of solution adoption.
Size Category Number of Employees
Micro ≤ 10
Small 11 - 50
Medium > 50
Micro
55%
Small
35%
Medium
10%
CHART 6
SHARE OF FIRMS IMPLEMENTING PSG
SOLUTIONS, BY EMPLOYEE SIZE CATEGORY
Source: Infocomm Media Development Authority,
Singapore Department of Statistics
Employee Size Profile
Micro firms accounted for majority of SMEs
adopting PSG-supported digital solutions
In this article, we define the employee size categories
as described in Chart 5. Between April 2018 and
June 2020, majority of firms taking up PSG solutions
were micro and small firms, accounting for 55% and
35% of total firms respectively (Chart 6).
7
7 Statistics Singapore Newsletter Issue 2, 2020
Further analysis at the industry level revealed that the
services industries had a larger proportion of micro
firms among PSG solution adopters. For instance,
micro firms accounted for 76% and 61% of PSG
solution adopters in the Retail and Wholesale Trade
industries respectively. On the other hand, the share of
micro firms among PSG solution adopters in
Manufacturing and Construction industries were
significantly lower at 34% and 25% respectively.
This could be attributed to the nature of the industries,
which lead to the Retail and Wholesale Trade
industries tending to have more micro firms than in the
Manufacturing and Construction industries.
Across the years, the number of SMEs implementing
PSG solutions increased across all employee size
categories, with micro firms showing the highest
growth rates. The number of firms adopting PSG
solutions per quarter grew by five times for micro firms
from 400 in 2018 to 2,100 in 2020. It tripled for small
and medium firms over the same period. As a result,
the proportion of micro firms adopting PSG solutions 6
increased from 48% in 2018 to 54% in 2020,
while the proportion of small and medium firms shrank
from 52% to 46% (Chart 7).
Micro Firms Accounted for About 60%
of PSG Adopters for Most Solution Types
In general, the employee size profile of the adopters
was similar across most solution types, with micro firms
accounting for about 60% which was relatively smaller
compared to the overall business landscape (Chart 8).
On the other hand, micro firms accounted for only
a quarter of all firms taking up Workforce Management
solutions, significantly lower compared to the other
solution types. Firms with more than 10 employees
accounted for 75% of Workforce Management
solutions adopters as compared to about 40% for the
other solution types. This suggests that firms with
larger employee size are more likely to implement
Workforce Management solutions since they have
a greater need for such solutions.
Concluding Remarks
The adoption of PSG-supported digital solutions grew
steadily over the years, with the strong growth in 2020
largely attributed to the implementation of Remote
Working solutions.
While the number of PSG solutions adopters increased
across all industries from 2018 to 2020, the Business
Services and Wholesale Trade industries registered the
strongest growths. Micro firms accounted for the
majority of adopters for most solution types, while
Workforce Management was mostly implemented
by larger firms.
Through initiatives such as the SMEs Go Digital
programme that help SMEs remain competitive,
the Singapore Government continues to support SMEs
in the building of digital capabilities in the age
of digitalisation.
0%
20%
40%
60%
80%
100%
2018 2019 2020
Micro Small Medium
CHART 7
SHARE OF FIRMS IMPLEMENTING PSG SOLUTIONS, BY EMPLOYEE SIZE CATEGORY AND YEAR,
2018-2020
6 Firms adopting multiple solutions in different years were counted in the respective years.
Source: Infocomm Media Development Authority, Singapore Department of Statistics
CHART 8
SHARE OF FIRMS IMPLEMENTING PSG SOLUTIONS BY EMPLOYEE SIZE AND SOLUTION TYPE
Source: Infocomm Media Development Authority,
Singapore Department of Statistics
0% 10% 20% 30% 40% 50% 60% 70% 80% 90% 100%
Customer Relationship Management
Sales Management
Accounts Management
E-Payments / E-Commerce
Inventory Management
Remote Working
Workforce Management
Micro Small Medium
8 Statistics Singapore Newsletter Issue 2, 2020
Services Producer Price Indices
by Edwin Boey
Prices Division
Singapore Department of Statistics
Introduction
The Singapore Department of Statistics (DOS) runs the
Services Producer Price Indices (SPPIs) programme
to develop and compile SPPIs that measure changes
in the average prices of services produced
by establishments, for selected industries of the
Singapore economy. The prices captured reflect the
amount received by a producer, exclusive of any taxes.
Quarterly SPPIs are now available on the
SingStat Website. These data series complement
the existing International Trade and Producer Price
Indices for goods (Table 1).
This article highlights the uses of SPPIs, the
background of the SPPI programme, and the process
to develop and rebase the SPPI.
Uses of Services Producer Price Indices
SPPIs are important indicators that support the making
of informed policy decisions and the monitoring of the
growth of the Singapore economy.
1) Improving Calculation of Real Growth
The services sector accounts for the largest share of
Singapore’s Gross Domestic Product (GDP). SPPIs are
used as price deflators in the national accounts by
converting the nominal values of services output into
volume measures. This improves the real growth
estimates of the services sector, and concomitantly
their productivity figures, which are based on the real
growth estimates.
As a consequence, the planning of the future economy
is better supported.
2) Monitoring and Analysing Price Trends
The monitoring of SPPIs at the respective service
industries facilitates policy agencies’ response to
potential cost push issues that may affect economic
growth or consumer prices downstream.
For example, the Sea Freight Transport Price Index and
Warehousing and Storage Price Index are used by
policy agencies to study their linkages with consumer
price movement in food prices during the
COVID-19 pandemic.
TABLE 1
PRODUCER PRICE INDICES PUBLISHED BY THE DEPARTMENT OF STATISTICS
International Trade Producer Price Indices for Goods
Import Price Index
Export Price Index
Producer Price Indices for Goods
Singapore Manufactured Products Price Index
Domestic Supply Price Index
Producer Price Indices for Services
Sea Freight Transport Price Index
Warehousing and Storage Price Index
Cargo Handling Price Index
Freight Forwarding Price Index
Telecommunications Services Price Index
Computer Consultancy and Information Services Price Index
Accounting Services Price Index
NEW!
9
9 Statistics Singapore Newsletter Issue 2, 2020
3) Evaluating Business Competitiveness and
International Comparison
Businesses may use the SPPIs to track the movements
of prices in their fields to evaluate their
competitiveness. Internationally, SPPIs are used by
research and marketing firms to provide economic
insights, as well as monitor and research producer
price trends by geography.
4) Using Price Indices in Contracts
SPPIs are official statistics that provide summary
measures of the price movement of selected service
industries over time. Although SPPIs are mainly used
for price deflation and economic analyses, they are
used in business and government contracts to adjust
payments and/or charges to account for changes in
prices as well.
Developing a Services Producer
Price Index
The selection of which SPPIs to develop was conducted
in consultation with key users based on several criteria,
such as the economic importance of the service
industries and availability of alternative price deflators.
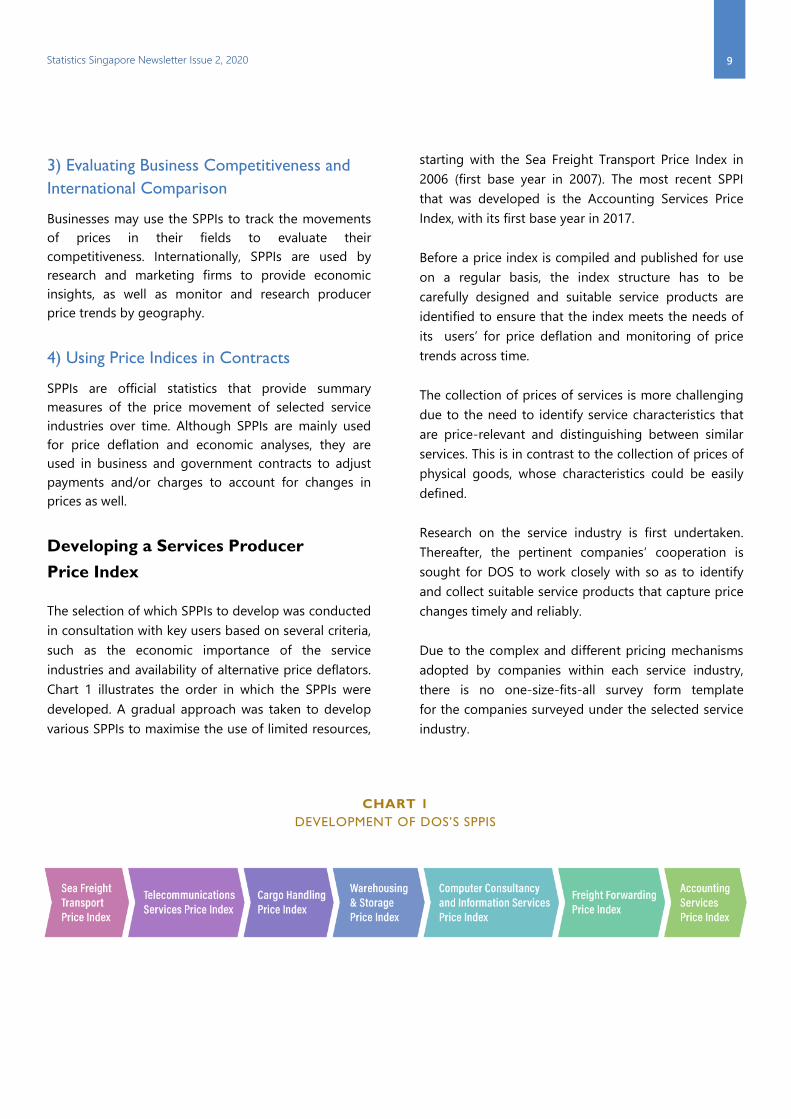
Chart 1 illustrates the order in which the SPPIs were
developed. A gradual approach was taken to develop
various SPPIs to maximise the use of limited resources,
starting with the Sea Freight Transport Price Index in
2006 (first base year in 2007). The most recent SPPI
that was developed is the Accounting Services Price
Index, with its first base year in 2017.
Before a price index is compiled and published for use
on a regular basis, the index structure has to be
carefully designed and suitable service products are
identified to ensure that the index meets the needs of
its users’ for price deflation and monitoring of price
trends across time.
The collection of prices of services is more challenging
due to the need to identify service characteristics that
are price-relevant and distinguishing between similar
services. This is in contrast to the collection of prices of
physical goods, whose characteristics could be easily
defined.
Research on the service industry is first undertaken.
Thereafter, the pertinent companies’ cooperation is
sought for DOS to work closely with so as to identify
and collect suitable service products that capture price
changes timely and reliably.
Due to the complex and different pricing mechanisms
adopted by companies within each service industry,
there is no one-size-fits-all survey form template
for the companies surveyed under the selected service
industry.
CHART 1
DEVELOPMENT OF DOS’S SPPIS
10 Statistics Singapore Newsletter Issue 2, 2020
Chart 2 illustrates the four-step process of developing
a new SPPI. The development phase takes more than
two years as time is needed to understand the local
industry’s practices in pricing their services; determine
the detailed weights data and subsequently engage
the companies’ respondents to identify suitable
services; as well as streamline and collect their prices
over a period of 15 to 18 months.
Throughout the process, data analysis and editing are
performed to test several index structures models and
compilation methods, to ensure that the eventual price
index is robust and representative of the industry
trends. It is important to note that the development
timeline may vary, depending on the complexity of the
service industry.
Rebasing a Services Producer
Price Index
Rebasing exercises are conducted periodically to
update the weights and ensure that the baskets
of service products remain representative of the
changing production patterns in the service industry.
This ranges from four to six years, depending on
market conditions.
The process of rebasing the index is similar to
developing a new SPPI, as it is necessary to study the
industry for possible emerging service products or new
pricing mechanisms arising from digitalisation or other
disruptive technologies.
An industry survey is conducted to obtain the latest
weights, followed by preliminary price surveys
(covering new establishments and service products),
which run concurrently with the routine price surveys
for at least 12 months to compile the new base year
prices.
The price index prior to the new base year can be
linked to the new series to facilitate comparison across
base years via a linked coefficient that is calculated
based on data from the year when both series
are compiled.
CHART 2
FOUR-STEP PROCESS OF DEVELOPING A NEW SPPI
Dissemination of SPPI Report
The SPPI report is published on the 25th day of the 3rd month after the reference quarter,
or the next working day if it falls on a Saturday, Sunday or Public Holiday.
Access the report via: SingStat Website (www.singstat.gov.sg/publications/economy/services-producer-price-indices)
Download SPPI data via: www.singstat.gov.sg/tablebuilder
11
11 Statistics Singapore Newsletter Issue 2, 2020
The eBook of Statistics Unveiled!
Launched on 30 Sep 2020, the eBook of Statistics
offers readers an enriching experience with new
and exciting interactive features.
The Yearbook of Statistics, Singapore (YOS) has a
long and established history. It was first published
in 1967, covering Singapore’s key economic and
socio-demographic statistics in its 16 chapters and
124 data tables. Over the years, the Department
has widened coverage of domains, presenting
readers with 27 chapters and 275 data tables. We
have also made available online editions on
SingStat Website, while ceasing the printing of hard
copy versions, to further enhance the usefulness
and accessibility of YOS as a key reference
publication.
In recent years, more reader-friendly features and
content were added such as infographics to better
communicate data to our readers. All data tables
were also hyperlinked to historical data series on
SingStat Table Builder, the Department’s e-service,
to facilitate data analyses with easy access to
a wide range of data.
In 2020, we further transformed YOS from a PDF
publication to the interactive digital eBook of
Statistics with content organised in 6 themes.
Sporting a refreshed layout, the eBook of Statistics
invites users on an interesting reading journey
with concise information on the data, videos to
explain statistical concepts, infographics and
interactive dashboards to explore data trends,
access to historical data for deeper analyses, and
links to relevant information and resources for
readers’ reference. With the added mobile
responsive feature, readers can enjoy eBook of
Statistics on their mobile devices anytime,
anywhere.
Check out the eBook of Statistics today at
www.singstat.gov.sg/publications/reference/eBook.
12 Statistics Singapore Newsletter Issue 2, 2020
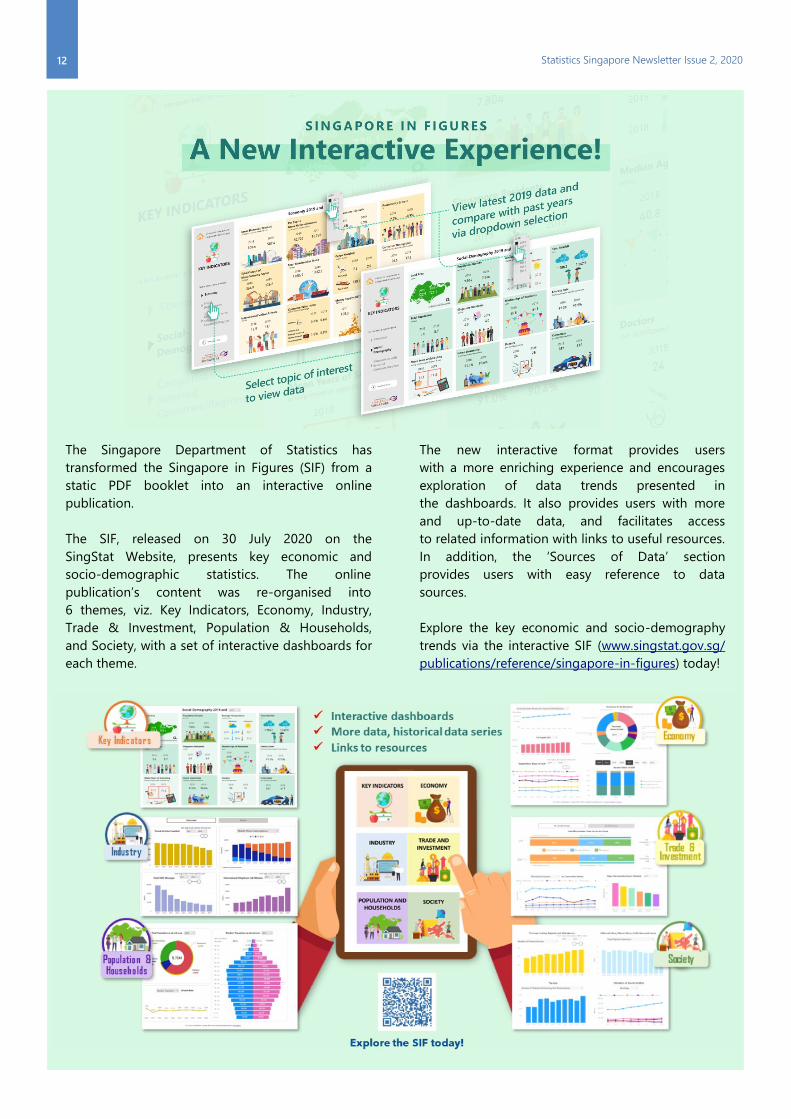
The Singapore Department of Statistics has
transformed the Singapore in Figures (SIF) from a
static PDF booklet into an interactive online
publication.
The SIF, released on 30 July 2020 on the
SingStat Website, presents key economic and
socio-demographic statistics. The online
publication’s content was re-organised into
6 themes, viz. Key Indicators, Economy, Industry,
Trade & Investment, Population & Households,
and Society, with a set of interactive dashboards for
each theme.
The new interactive format provides users
with a more enriching experience and encourages
exploration of data trends presented in
the dashboards. It also provides users with more
and up-to-date data, and facilitates access
to related information with links to useful resources.
In addition, the ‘Sources of Data’ section
provides users with easy reference to data
sources.
Explore the key economic and socio-demography
trends via the interactive SIF (www.singstat.gov.sg/
publications/reference/singapore-in-figures) today!
13
13 Statistics Singapore Newsletter Issue 2, 2020
CONTENTS
1 Conducting
Census of Population 2020 in
Singapore amidst COVID-19
4
Profile of SMEs Implementing
Digital Solutions Supported by
the Productivity Solution Grant
8
Services
Producer Price Indices
11 The eBook of Statistics
Unveiled!
12 Singapore in Figures -
A New Interactive Experience!
Statistics Singapore Newsletter Issue 2, 2020
The Statistics Singapore Newsletter is issued twice a year by the Singapore Department of Statistics.
It aims to inform readers on recent statistical findings as well as latest information on statistical methodologies, processes, products and services.
www.singstat.gov.sg
[email protected]
13 World Statistics Day 2020
Download a copy of the SBP 2020 Handbook today!
www.singstat.gov.sg/standards/standards-and-classifications/sbp
The Statistical Best Practices (SBP) 2020
handbook aims to provide the best practices
on statistical processes to improve the
quality of data produced across the Singapore
public sector.
View Singapore’s statistics on
Sustainable Development Goals indicators on the SingStat Website at:
www.singstat.gov.sg/find-data/sdg