Cone signals and activity in myopia and emmetropia Nanyu Zhou School of Optometry and Vision Science, Faculty of Health Vision Improvement Domain Institute of Health and Biomedical Innovation Queensland University of Technology A thesis submitted in fulfilment of the requirements for the Degree of Master of Applied Science (Research) 2013
Transcript
Cone signals and activity in myopia and emmetropia
Nanyu Zhou
School of Optometry and Vision Science, Faculty of Health
Vision Improvement Domain
Institute of Health and Biomedical Innovation
Queensland University of Technology
A thesis submitted in fulfilment of the requirements for the
Degree of Master of Applied Science (Research)
2013
Keywords
I
Keywords Colour vision
Cones
Emmetropia
L/M cone ratios Myopia
Multifocal visual evoked potential (mfVEP)
Retina
Visual evoked potential (VEP)
Abstract
II
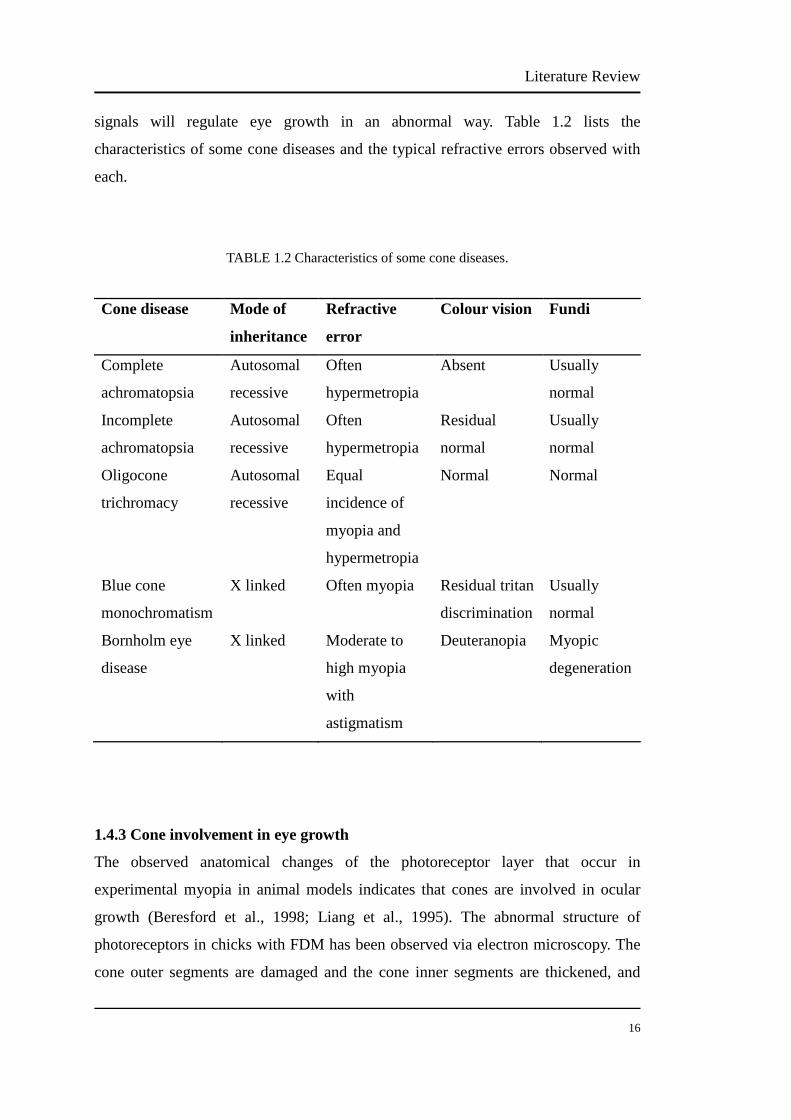
Abstract Myopia (short-sightedness) is a common ocular disorder of children and young
adults. Studies primarily using animal models have shown that the retina controls eye
growth and the outer retina is likely to have a key role. One theory is that the
proportion of L (long-wavelength-sensitive) and M (medium-wavelength-sensitive)
cones is related to myopia development; with a high L/M cone ratio predisposing
individuals to myopia. However, not all dichromats (persons with red-green colour
vision deficiency) with extreme L/M cone ratios have high refractive errors. We
predict that the L/M cone ratio will vary in individuals with normal trichromatic
colour vision but not show a systematic difference simply due to refractive error. The
aim of this study was to determine if L/M cone ratios in the central 30° are different
between myopic and emmetropic young, colour normal adults.
Information about L/M cone ratios was determined using the multifocal visual
evoked potential (mfVEP). The mfVEP can be used to measure the response of
visual cortex to different visual stimuli. The visual stimuli were generated and
measurements performed using the Visual Evoked Response Imaging System
(VERIS 5.1). The mfVEP was measured when the L and M cone systems were
separately stimulated using the method of silent substitution. The method of silent
substitution alters the output of three primary lights, each with physically different
spectral distributions to control the excitation of one or more photoreceptor classes
without changing the excitation of the unmodulated photoreceptor classes. The
stimulus was a dartboard array subtending 30° horizontally and 30° vertically on a
calibrated LCD screen. The m-sequence of the stimulus was 215-1. The N1-P1
amplitude ratio of the mfVEP was used to estimate the L/M cone ratio.
Data were collected for 30 young adults (22 to 33 years of age), consisting of 10
emmetropes (+0.3±0.4 D) and 20 myopes (–3.4±1.7 D). The stimulus and analysis
techniques were confirmed using responses of two dichromats. For the entire
Abstract
III
participant group, the estimated central L/M cone ratios ranged from 0.56 to 1.80 in
the central 3°-13° diameter ring and from 0.94 to 1.91 in the more peripheral 13°-30°
diameter ring. Within 3°-13°, the mean L/M cone ratio of the emmetropic group was
1.20±0.33 and the mean was similar, 1.20±0.26, for the myopic group. For the
13°-30° ring, the mean L/M cone ratio of the emmetropic group was 1.48±0.27 and it
was slightly lower in the myopic group, 1.30±0.27. Independent-samples t-test
indicated no significant difference between the L/M cone ratios of the emmetropic
and myopic group for either the central 3°-13° ring (p=0.986) or the more peripheral
13°-30° ring (p=0.108).
The similar distributions of estimated L/M cone ratios in the sample of emmetropes
and myopes indicates that there is likely to be no association between the L/M cone
ratio and refractive error in humans.
Table of Contents
IV
Table of Contents KEYWORDS………………………………………………………………………... I ABSTRACT……………………………………………………………..….….…… II TABLE OF CONTENTS…………………………………………………………. IV LIST OF FIGURES……………………………………………………………….VII LIST OF TABLES…………………………………………………………..……. IX ABBREVIATIONS…………………………………….……………………..……. X DECLARATION………………………………………………………………… XII ACKNOWLEDGEMENTS……………………………………………….…… XIII CHAPTER 1 LITERATURE REVIEW…………………………………………... 1 1.1 INTRODUCTION…………………………………………………………….. 1
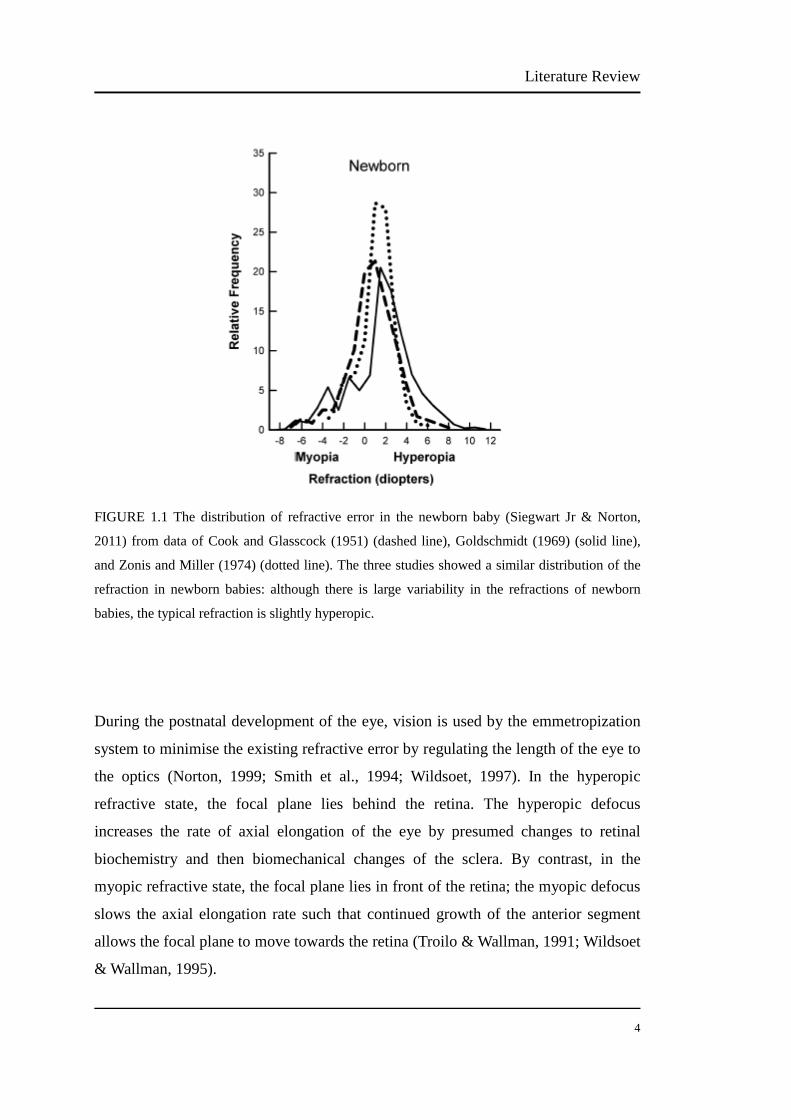
1.1.1 Emmetropization………………………………………………….…… 3
1.1.2 Prevalence of myopia………………………………………...….…….. 5
1.2 FACTORS SUGGUSTED TO INFLUENCE EYE GROWTH………………. 6
1.2.1 Hereditary and genetic factors…………………………………...…….. 6
1.2.2 Environmental risk factors for myopia……………………….….…….. 8
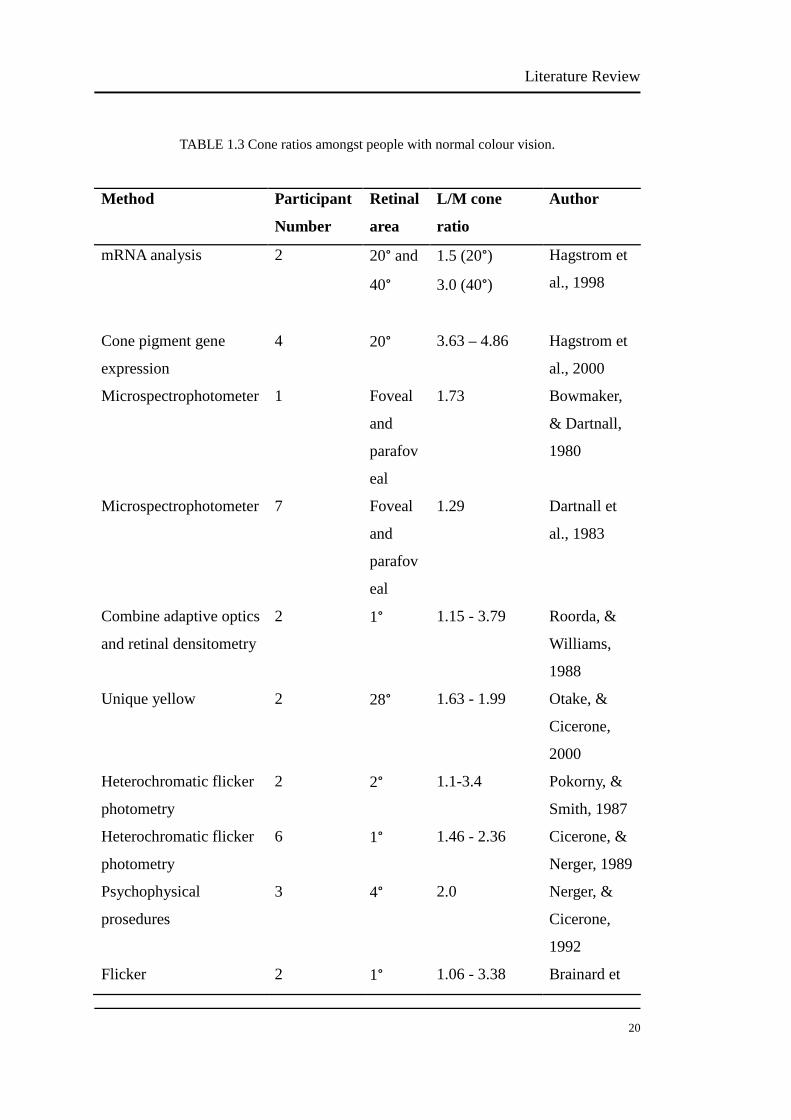
2000) (Table 1.4). From the first paper, the L/M ratios of one emmetrope and one
myope were 1.6 and 2.0. From the second paper, the L/M ratios of four emmetropes
were 2.1, 2.0, 1.5, 2.4, respectively; the L/M ratios of two mild myopes were 2.3 and
2.0. From the third paper, the L/M ratio of one emmetrope was 1.8; the L/M ratios of
two mild myopes were 2.2 and 1.5. These three studies showed similar L/M cone
ratios between myopia and emmetropia, however the sample sizes are small.
The present study investigated the L/M cone ratios in the central retina between
myopic and emmetropic normal trichromats using mfVEP. Although it is suggested
that the L/M ratios may be an important determinant of myopia progression (Rucker
& Kruger, 2006), the fact that individuals with red-green colour vision deficiency are
not all myopic (Qian et al., 2009), leads to the prediction that the L/M cone ratio will
Cone Ratios in Myopia and Emmetropia
54
vary in individuals but not show a regular difference simply due to refractive error.
3.2 Participants Data were collected on 30 young, colour normal adults aged 22 to 33 years,
including 10 emmetropic (spherical equivalent +1.00D to -0.25D), 10 lower myopic
(spherical equivalent -1.00D to -3.00D) and 10 higher myopic (spherical equivalent
-3.50D to -7.25D) individuals. To establish the reliability of the two stimulus light
conditions for isolating only one type of cone, two protanopes and one deuteranope
were examined. The protanopes and deuteranope were all emmetropic and aged 24,
30 and 36, respectively. The three dichromatic participants had normal
ophthalmological findings with visual acuities of 6/6. The colour vision defect of
these participants was confirmed using the Nagel Anomaloscope. One protanope
showed unreliable responses for the black-white modulation and thus did not proceed
with the rest of the testing. Email was used for recruiting initial participants and also
a snowballing method was used to recruit later participants within the University
community.
All experiments were conducted with human research ethics approval in accordance
with the National Statement on Ethical Conduct in Human Research published by the
National Health and Medical Research Council of Australia. Informed written
consent was obtained from all participants after the purpose and the procedures of
the study were explained. The QUT human research ethics approval number was
1100001318.
To determine suitability of potential participants, a screening eye examination was
conducted, including refraction (autorefractor), colour vision assessment (Ishihara)
and eye health assessment (slit lamp biomicrosopy and ophthalmoscopy). Corrected
visual acuity of 6/6 and normal trichromatic colour vision were required and were
tested by the researcher. Individuals with retinal pathology, abnormal ocular media,
strabismus, glaucoma and photosensitive epilepsy were not eligible to take part in
this study. Based on these criteria, one screened individual was excluded because of
Cone Ratios in Myopia and Emmetropia
55
amblyopia.
3.3 Procedure
3.3.1 The mfVEP visual stimuli
We used a CRT monitor with resolution of 1152*864 pixels to present the visual
stimuli and used the Visual Evoked Response Imaging System (VERIS 5.1,
Electro-Diagnostic Imaging Inc., San Mateo, CA, USA) to perform mfVEP
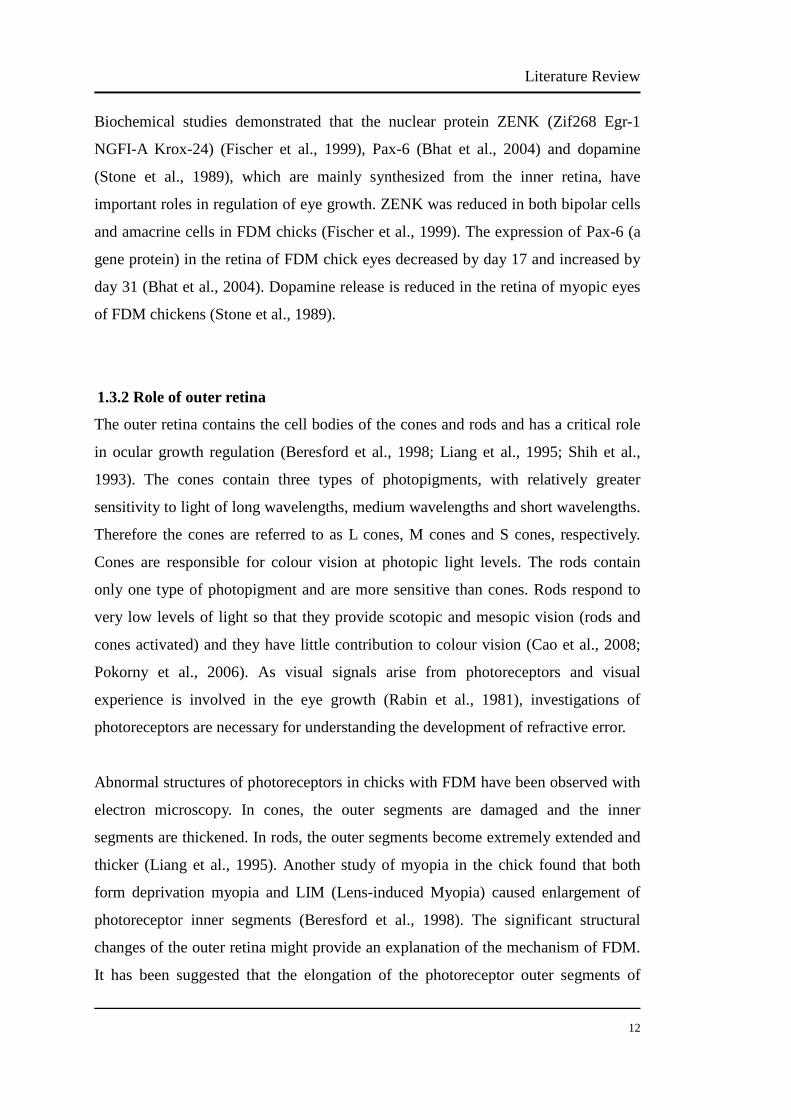
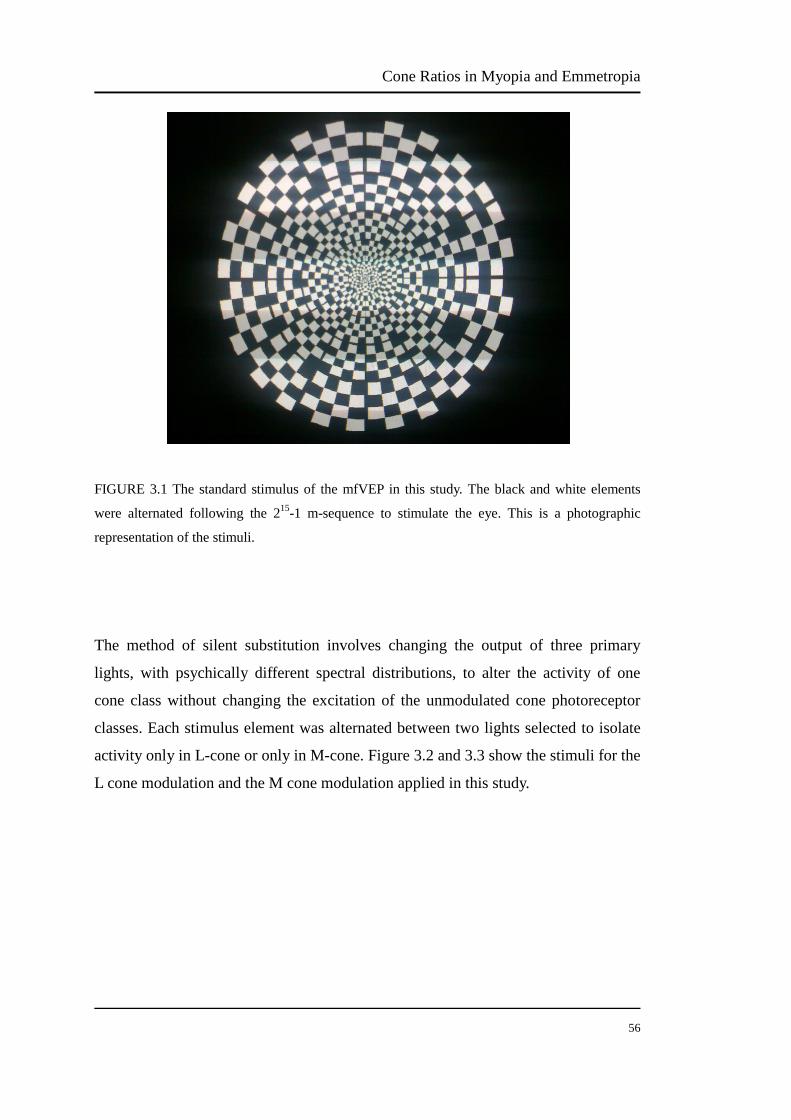
stimulation and data collection. Figure 3.1 shows the standard stimulus of the mfVEP.
The stimulus was a dartboard array consisting of 60 sectors and each sector was a
checkerboard pattern consisting of 16 checks. The stimuli were driven at a frame rate
of 75 Hz on the CRT monitor and subtended 30° horizontally and 30° vertically. The
sizes of the elements increased as they extended peripherally in order to give
approximately equal contrast response. Each of the elements was illuminated
following a pseudorandom m-sequence (215-1) to make the mean luminance of the
screen constant over time (Hood et al., 2002). The rod contribution to the mfVEP
was minimised by the bright rapid flicker and keeping the room lights on
(approximately 100 cd/m2).
Cone Ratios in Myopia and Emmetropia
56
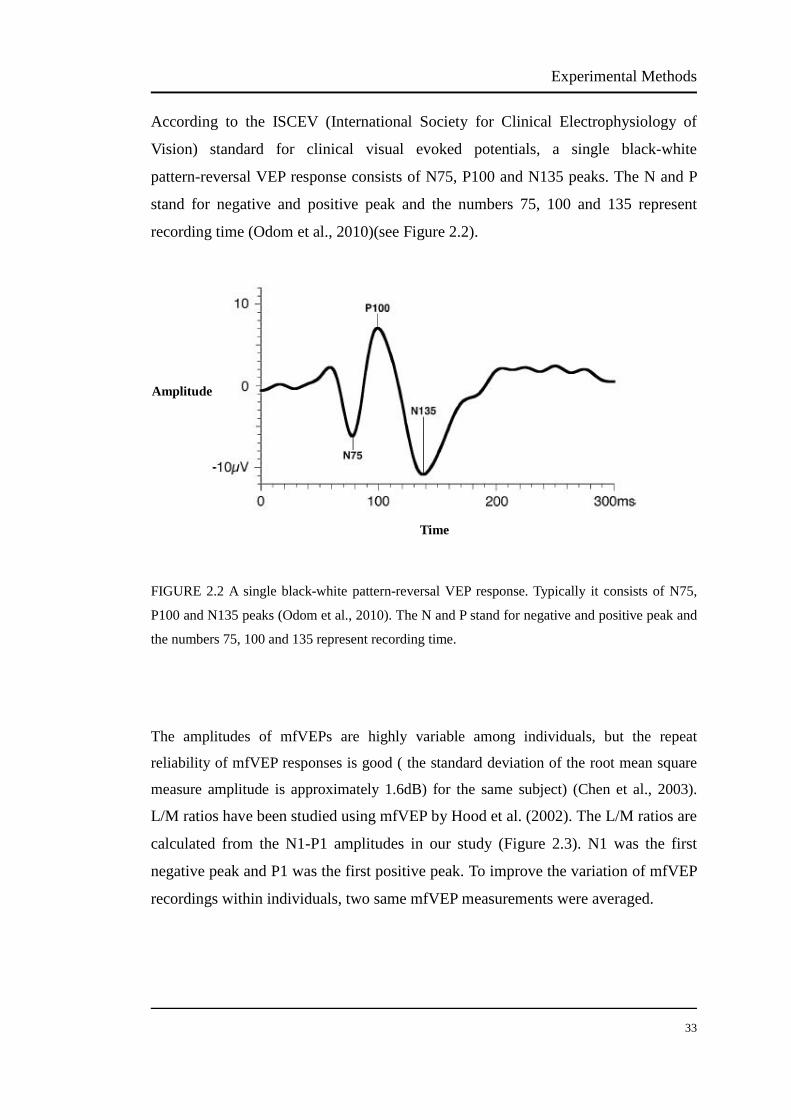
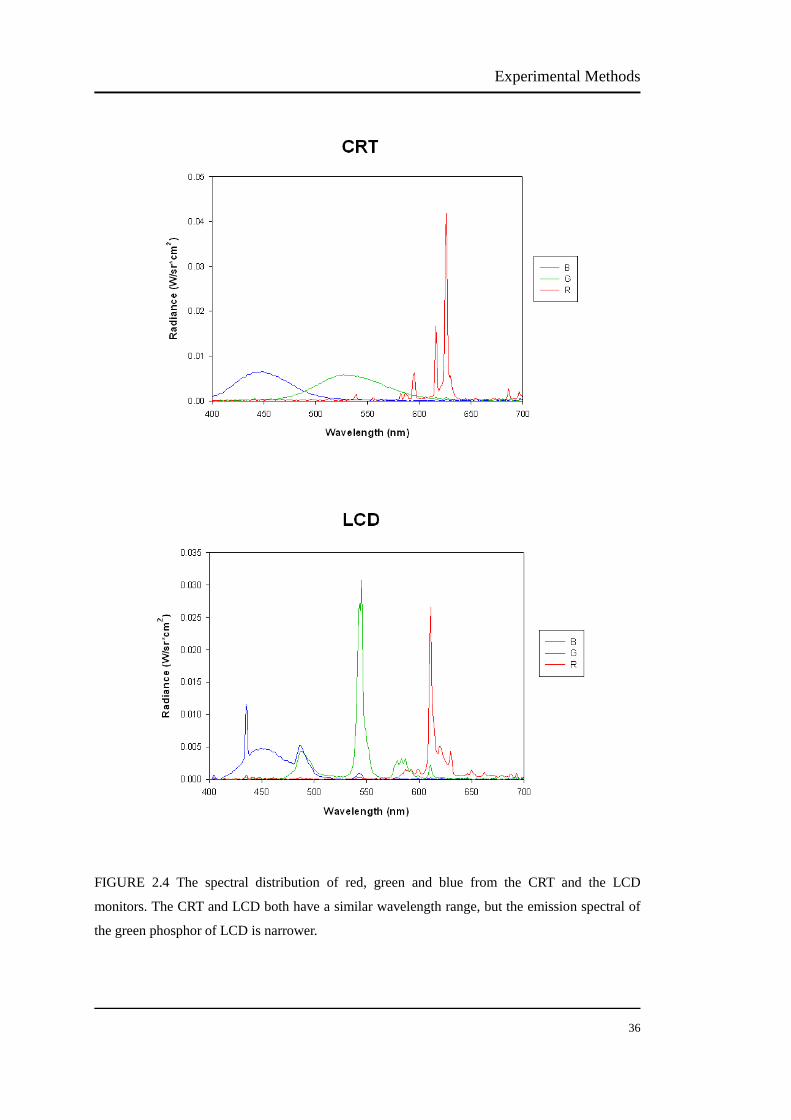
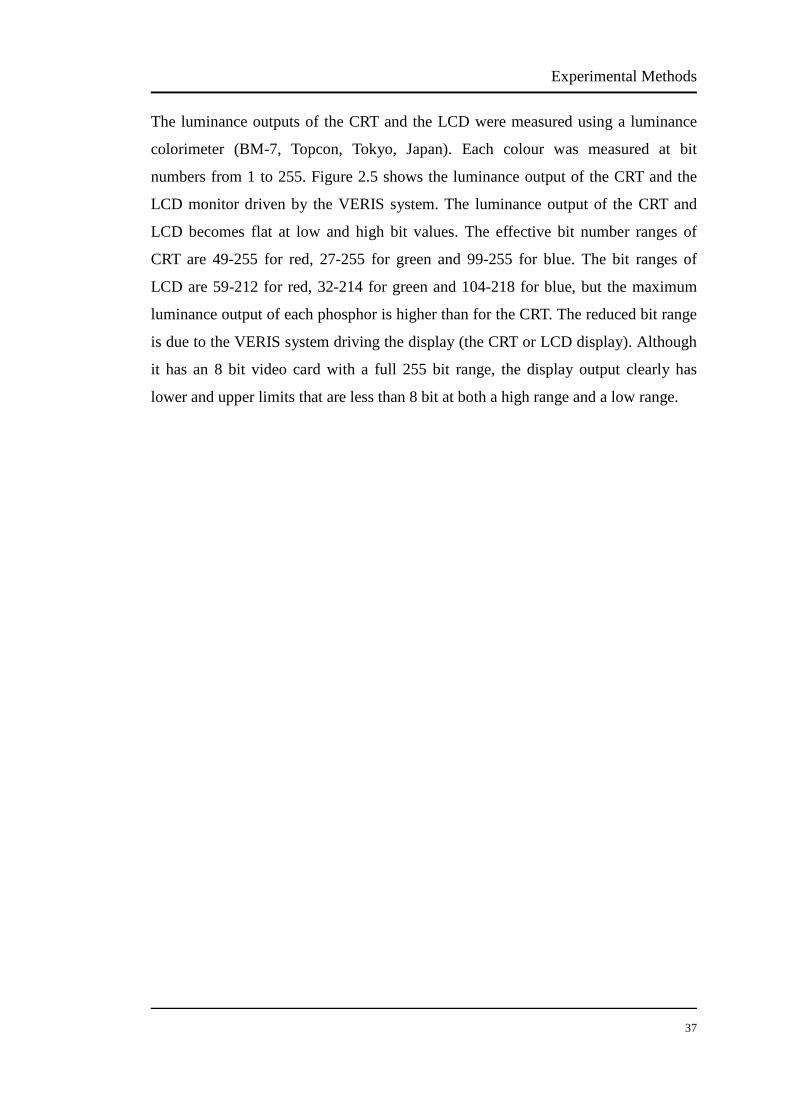
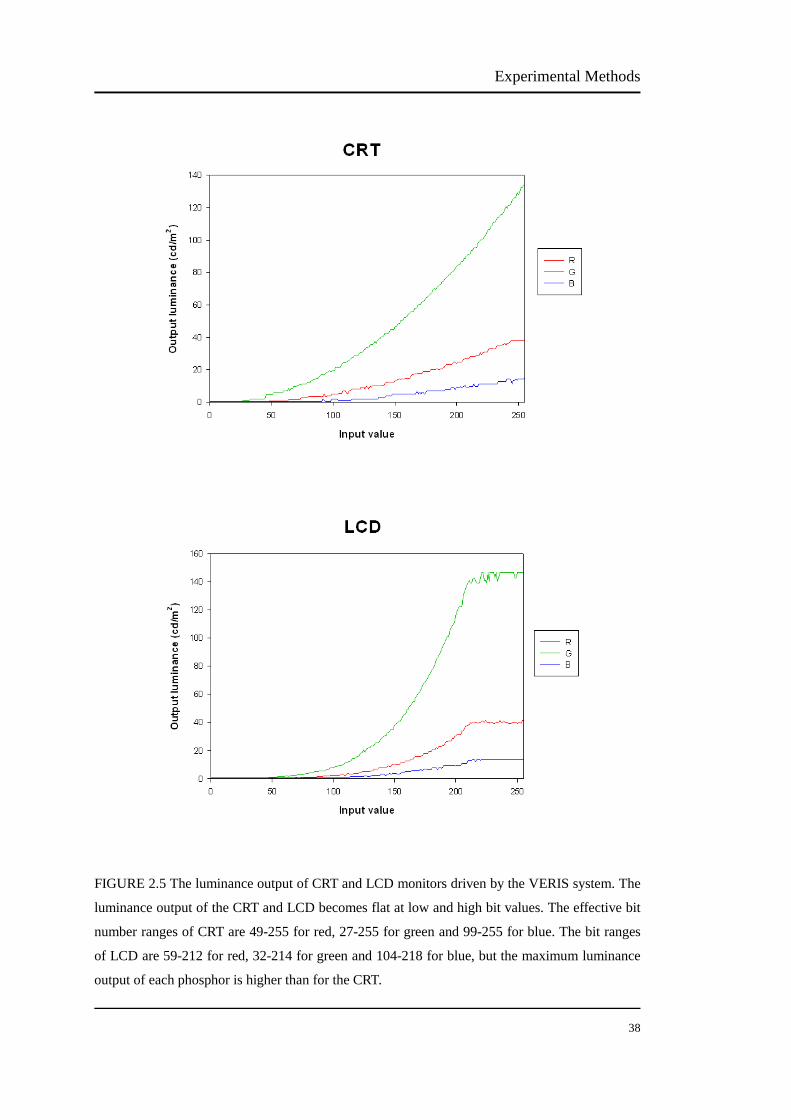
FIGURE 3.1 The standard stimulus of the mfVEP in this study. The black and white elements
were alternated following the 215-1 m-sequence to stimulate the eye. This is a photographic
representation of the stimuli.
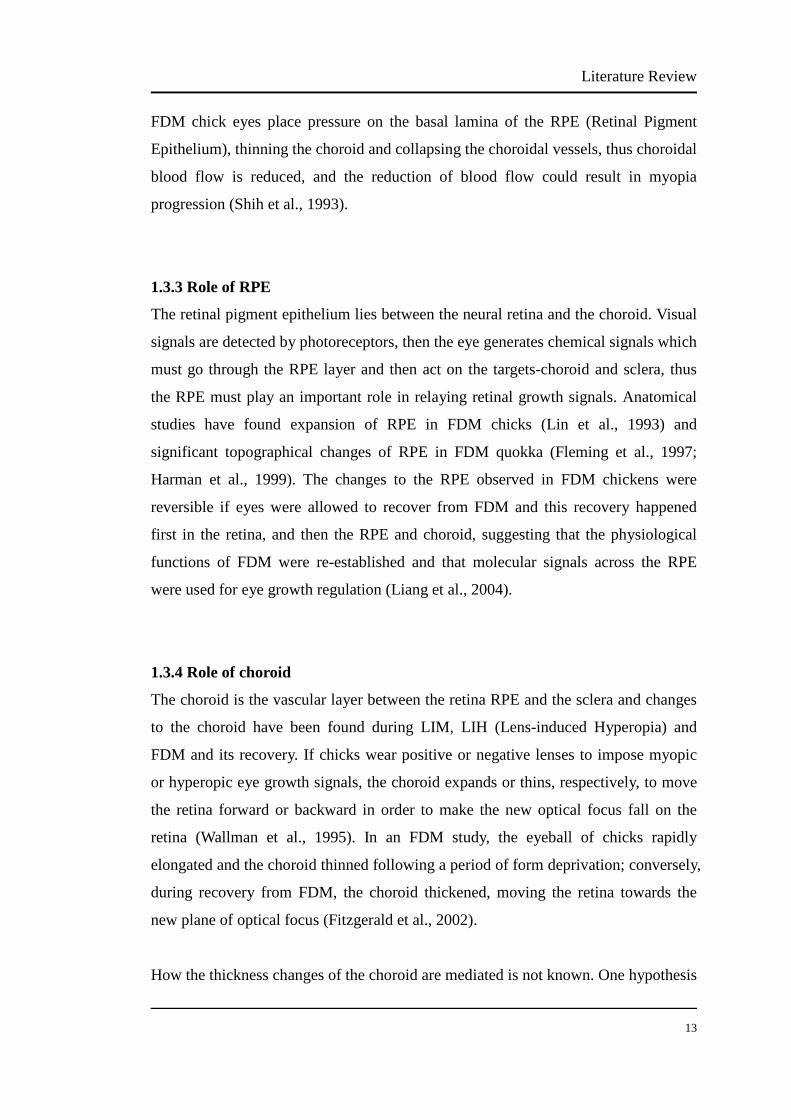
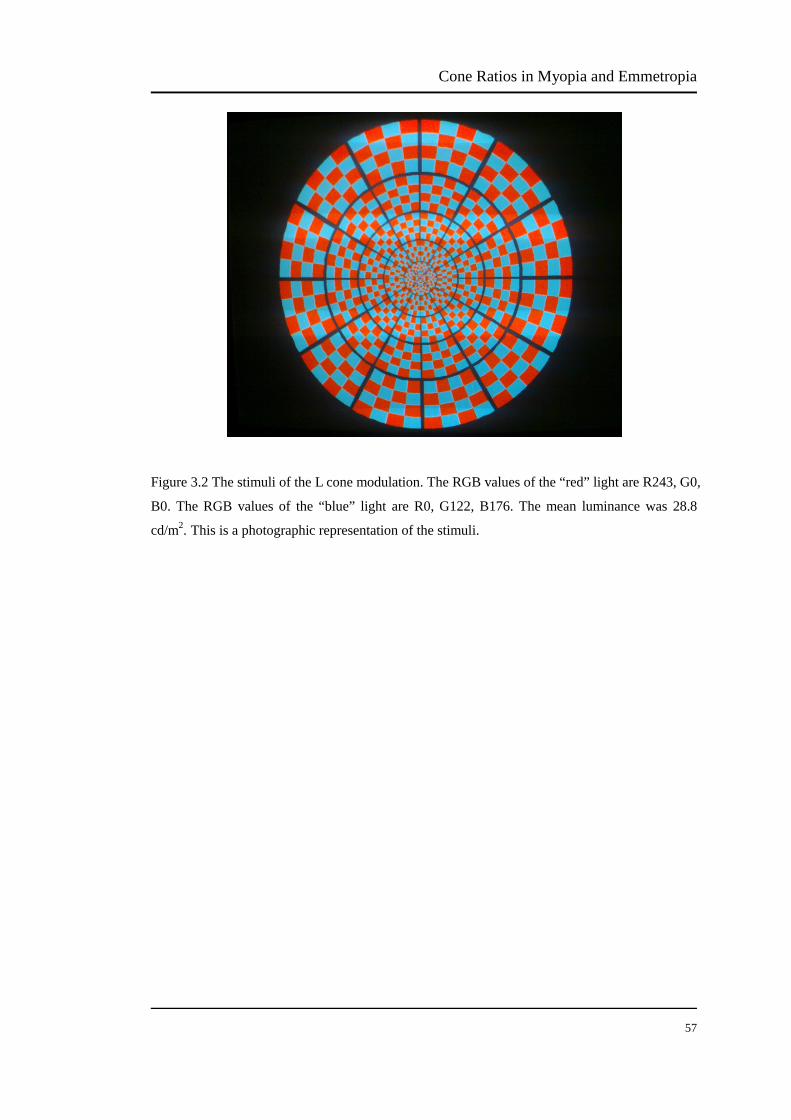
The method of silent substitution involves changing the output of three primary
lights, with psychically different spectral distributions, to alter the activity of one
cone class without changing the excitation of the unmodulated cone photoreceptor
classes. Each stimulus element was alternated between two lights selected to isolate
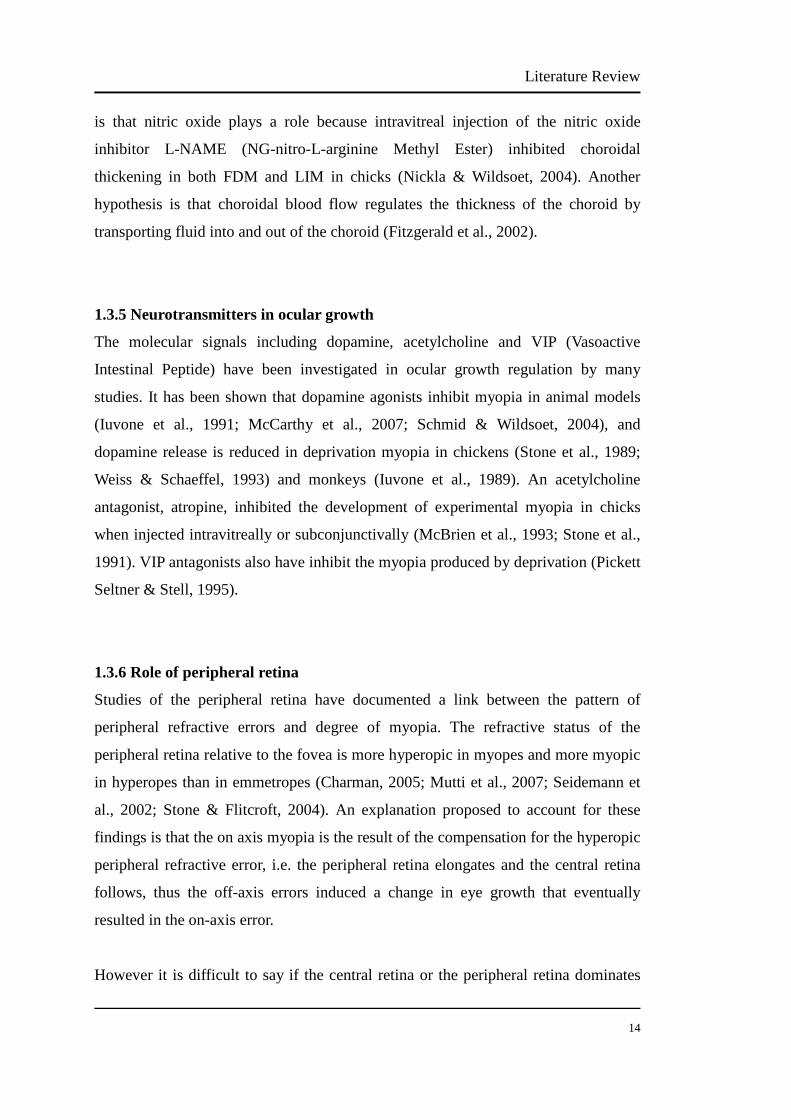
activity only in L-cone or only in M-cone. Figure 3.2 and 3.3 show the stimuli for the
L cone modulation and the M cone modulation applied in this study.
Cone Ratios in Myopia and Emmetropia
57
Figure 3.2 The stimuli of the L cone modulation. The RGB values of the “red” light are R243, G0,
B0. The RGB values of the “blue” light are R0, G122, B176. The mean luminance was 28.8
cd/m2. This is a photographic representation of the stimuli.
Cone Ratios in Myopia and Emmetropia
58
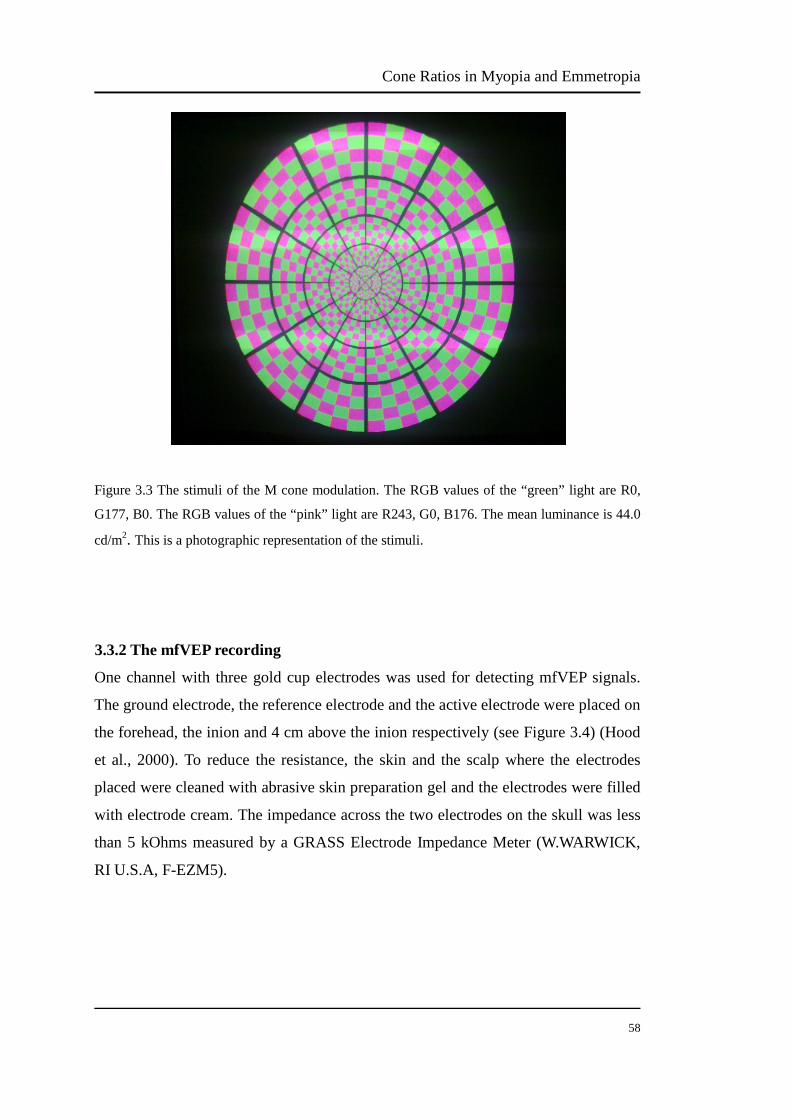
Figure 3.3 The stimuli of the M cone modulation. The RGB values of the “green” light are R0,
G177, B0. The RGB values of the “pink” light are R243, G0, B176. The mean luminance is 44.0
cd/m2. This is a photographic representation of the stimuli.
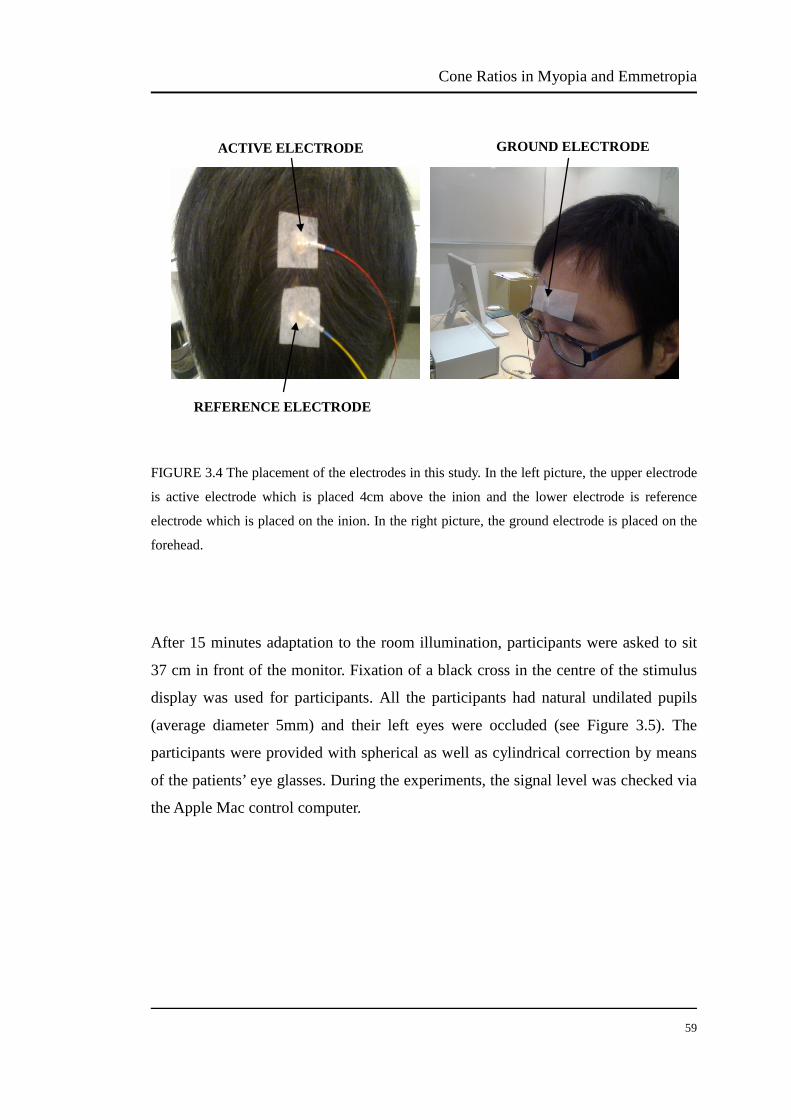
3.3.2 The mfVEP recording
One channel with three gold cup electrodes was used for detecting mfVEP signals.
The ground electrode, the reference electrode and the active electrode were placed on
the forehead, the inion and 4 cm above the inion respectively (see Figure 3.4) (Hood
et al., 2000). To reduce the resistance, the skin and the scalp where the electrodes
placed were cleaned with abrasive skin preparation gel and the electrodes were filled
with electrode cream. The impedance across the two electrodes on the skull was less
than 5 kOhms measured by a GRASS Electrode Impedance Meter (W.WARWICK,
RI U.S.A, F-EZM5).
Cone Ratios in Myopia and Emmetropia
59
FIGURE 3.4 The placement of the electrodes in this study. In the left picture, the upper electrode
is active electrode which is placed 4cm above the inion and the lower electrode is reference
electrode which is placed on the inion. In the right picture, the ground electrode is placed on the
forehead.
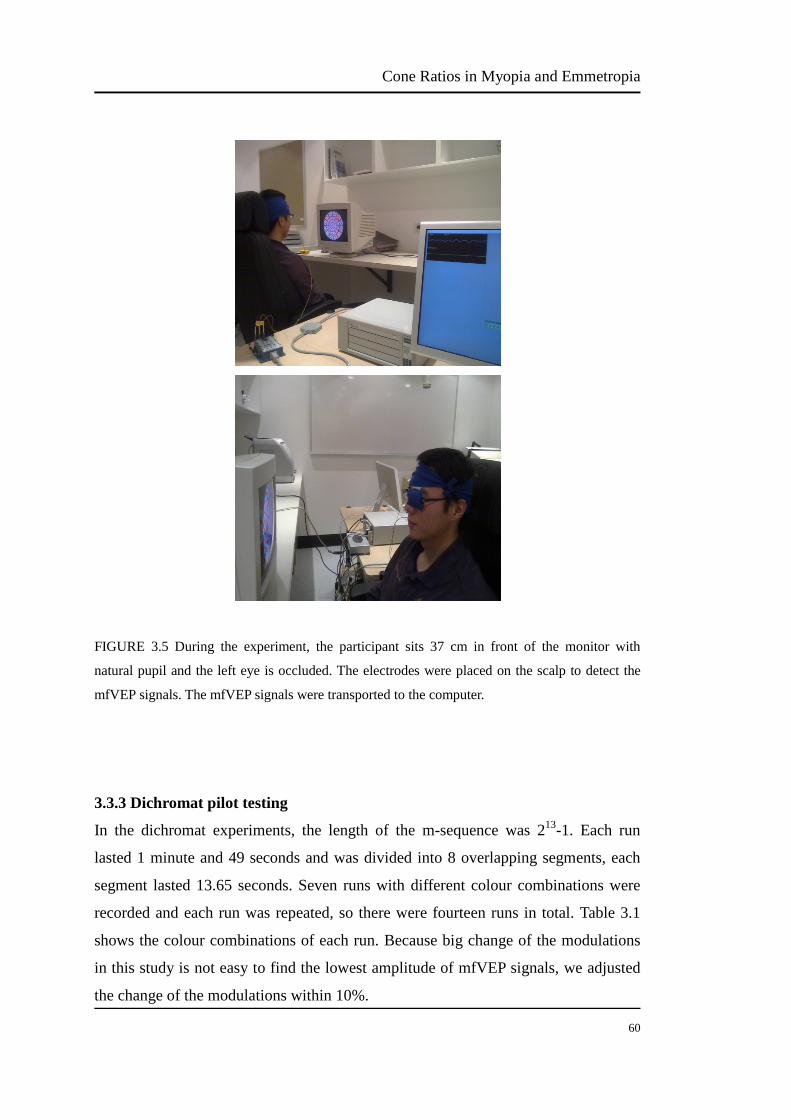
After 15 minutes adaptation to the room illumination, participants were asked to sit
37 cm in front of the monitor. Fixation of a black cross in the centre of the stimulus
display was used for participants. All the participants had natural undilated pupils
(average diameter 5mm) and their left eyes were occluded (see Figure 3.5). The
participants were provided with spherical as well as cylindrical correction by means
of the patients’ eye glasses. During the experiments, the signal level was checked via
the Apple Mac control computer.
ACTIVE ELECTRODE
REFERENCE ELECTRODE
GROUND ELECTRODE
Cone Ratios in Myopia and Emmetropia
60
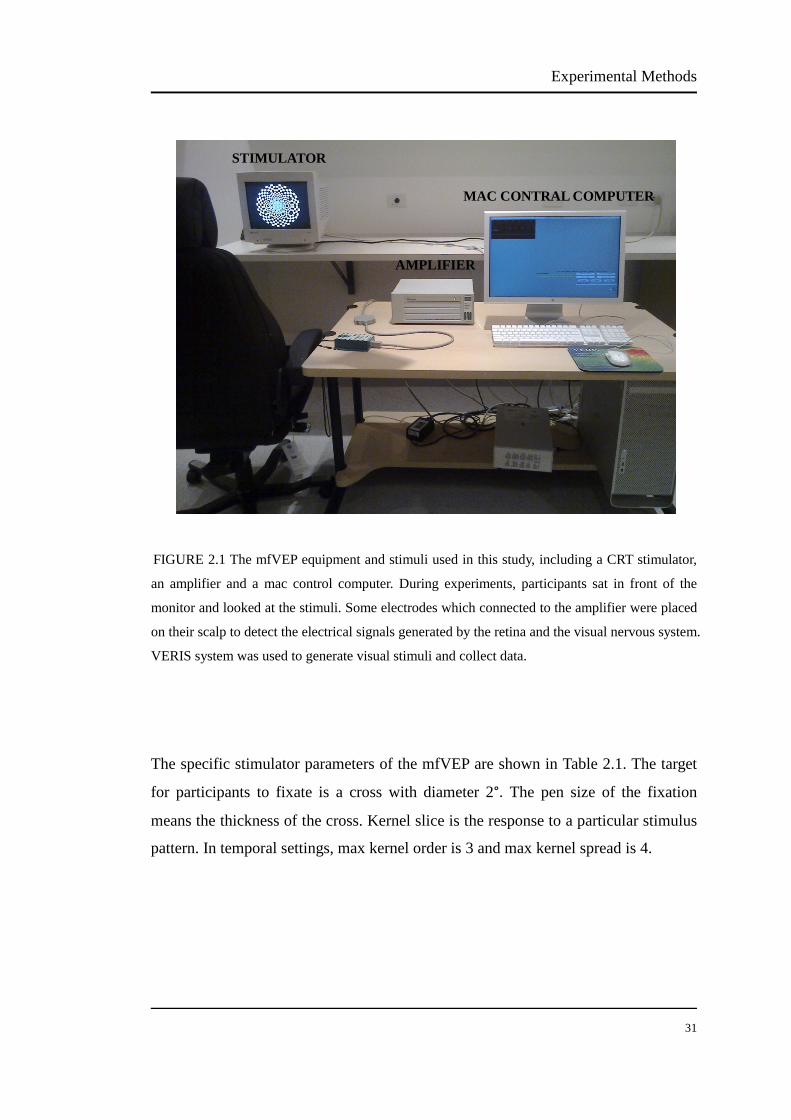
FIGURE 3.5 During the experiment, the participant sits 37 cm in front of the monitor with
natural pupil and the left eye is occluded. The electrodes were placed on the scalp to detect the
mfVEP signals. The mfVEP signals were transported to the computer.
3.3.3 Dichromat pilot testing
In the dichromat experiments, the length of the m-sequence was 213-1. Each run
lasted 1 minute and 49 seconds and was divided into 8 overlapping segments, each
segment lasted 13.65 seconds. Seven runs with different colour combinations were
recorded and each run was repeated, so there were fourteen runs in total. Table 3.1
shows the colour combinations of each run. Because big change of the modulations
in this study is not easy to find the lowest amplitude of mfVEP signals, we adjusted
the change of the modulations within 10%.
Cone Ratios in Myopia and Emmetropia
61
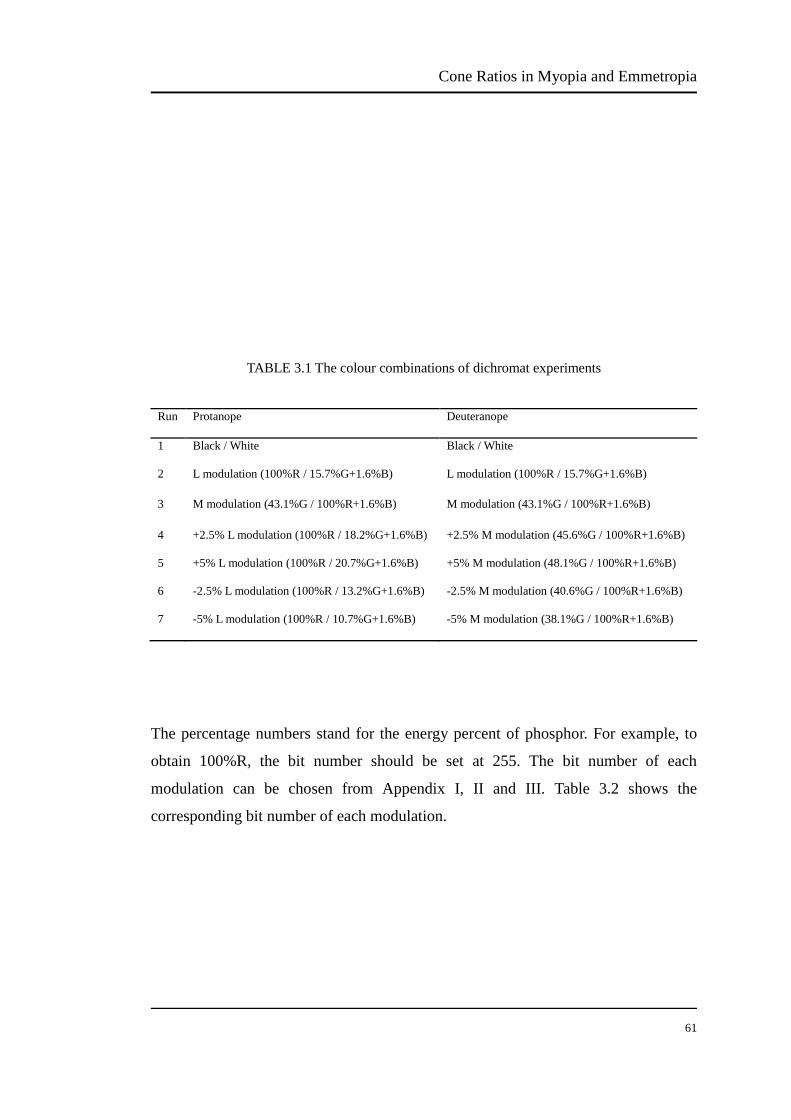
TABLE 3.1 The colour combinations of dichromat experiments
Run Protanope Deuteranope
1 Black / White Black / White
2 L modulation (100%R / 15.7%G+1.6%B) L modulation (100%R / 15.7%G+1.6%B)
3 M modulation (43.1%G / 100%R+1.6%B) M modulation (43.1%G / 100%R+1.6%B)
4 +2.5% L modulation (100%R / 18.2%G+1.6%B) +2.5% M modulation (45.6%G / 100%R+1.6%B)
5 +5% L modulation (100%R / 20.7%G+1.6%B) +5% M modulation (48.1%G / 100%R+1.6%B)
6 -2.5% L modulation (100%R / 13.2%G+1.6%B) -2.5% M modulation (40.6%G / 100%R+1.6%B)
7 -5% L modulation (100%R / 10.7%G+1.6%B) -5% M modulation (38.1%G / 100%R+1.6%B)
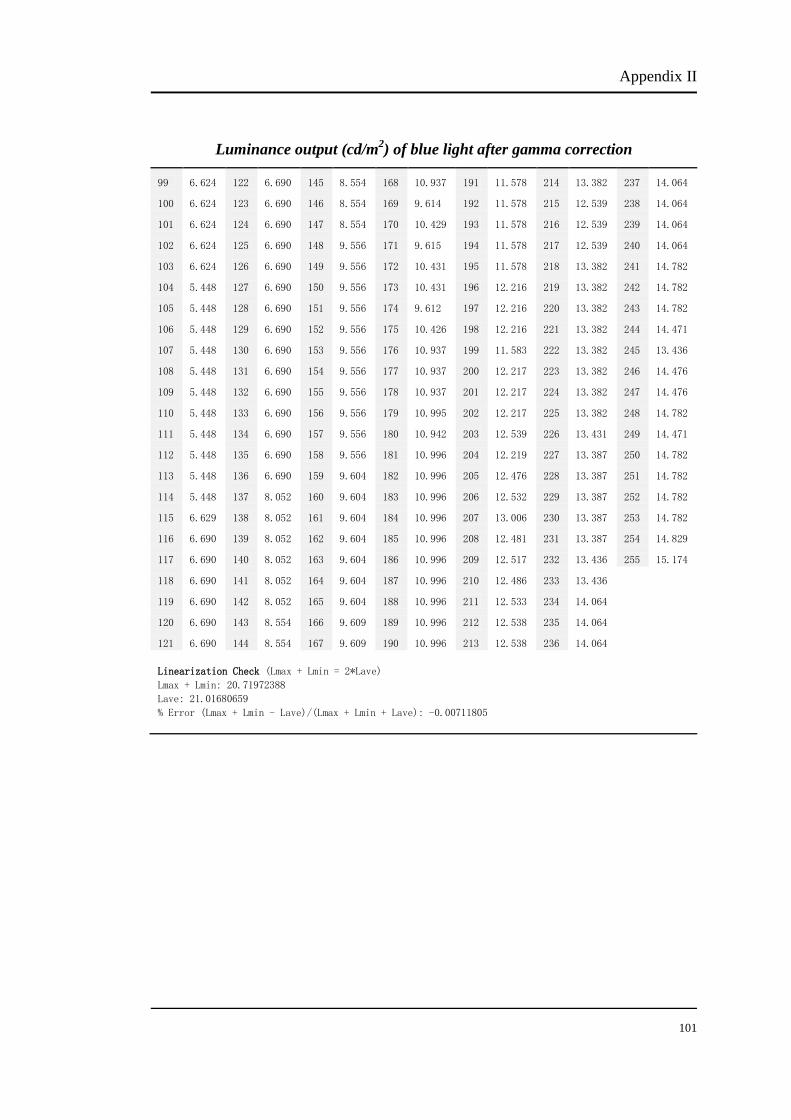
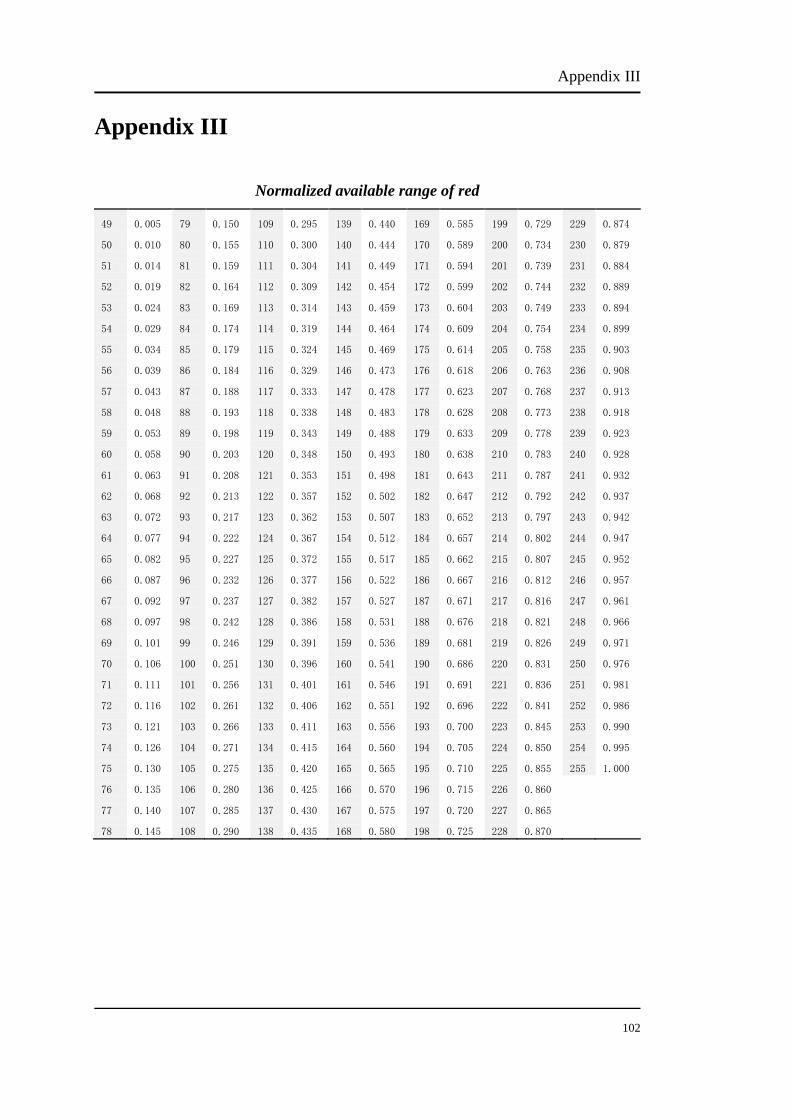
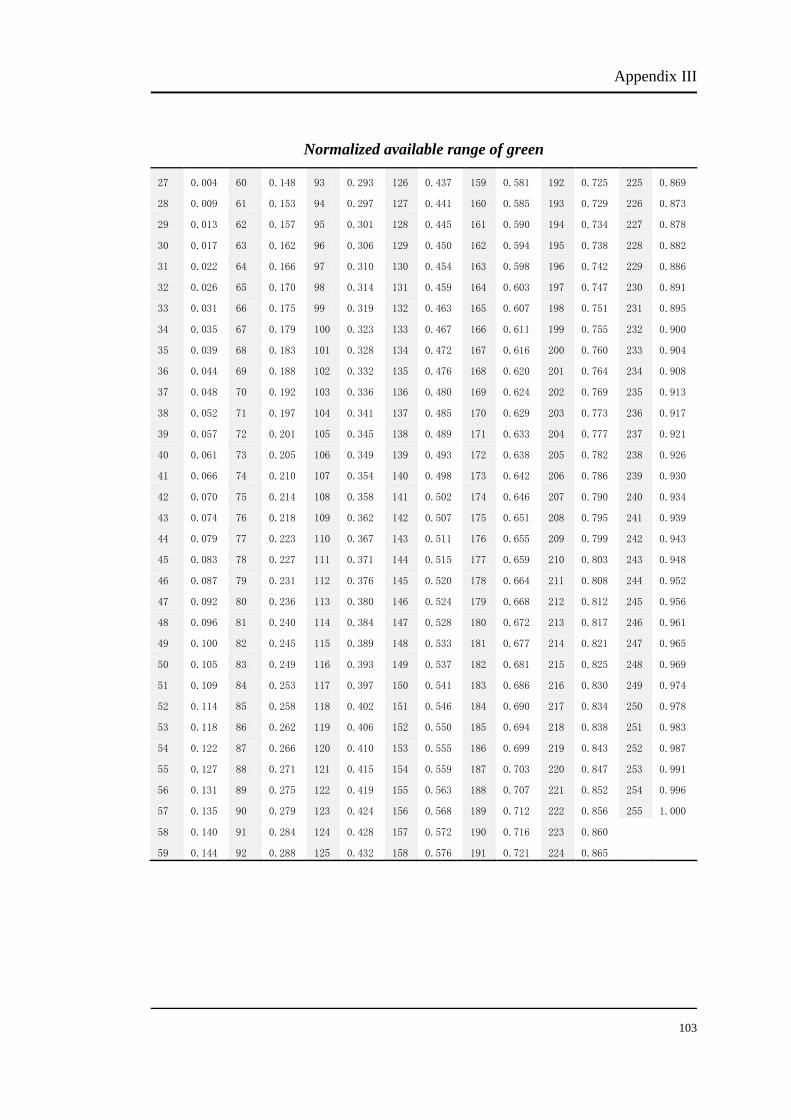
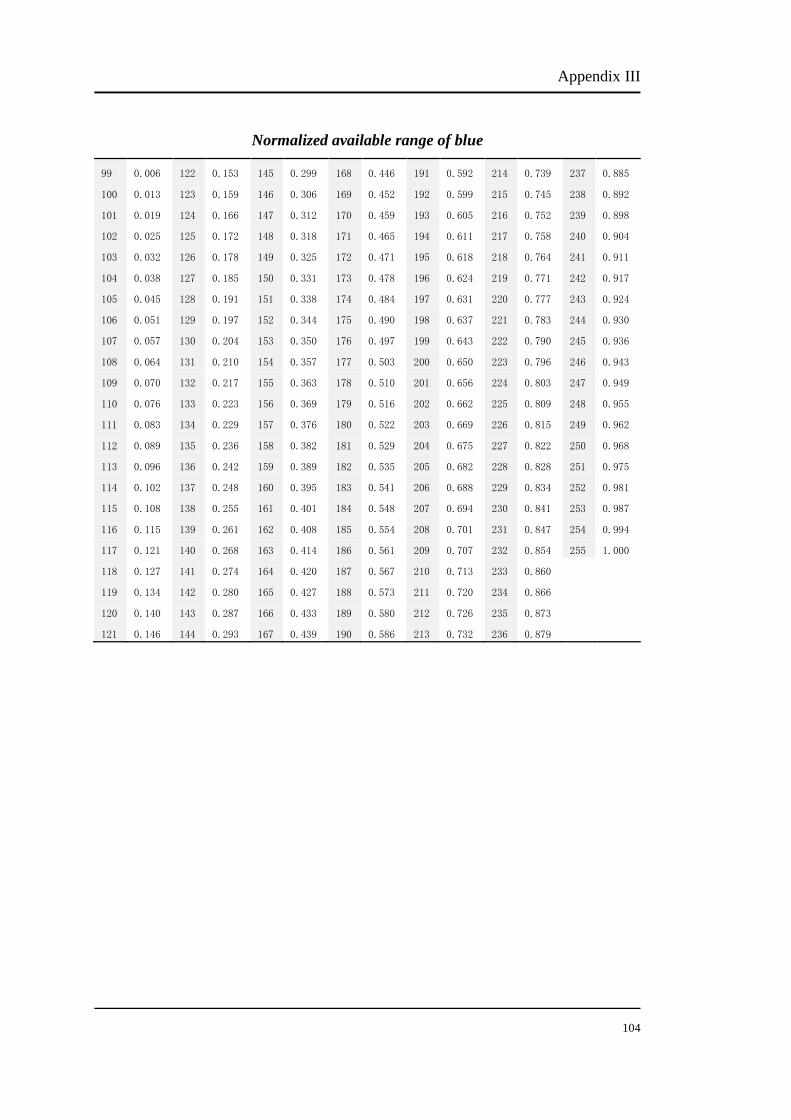
The percentage numbers stand for the energy percent of phosphor. For example, to
obtain 100%R, the bit number should be set at 255. The bit number of each
modulation can be chosen from Appendix I, II and III. Table 3.2 shows the
corresponding bit number of each modulation.
Cone Ratios in Myopia and Emmetropia
62
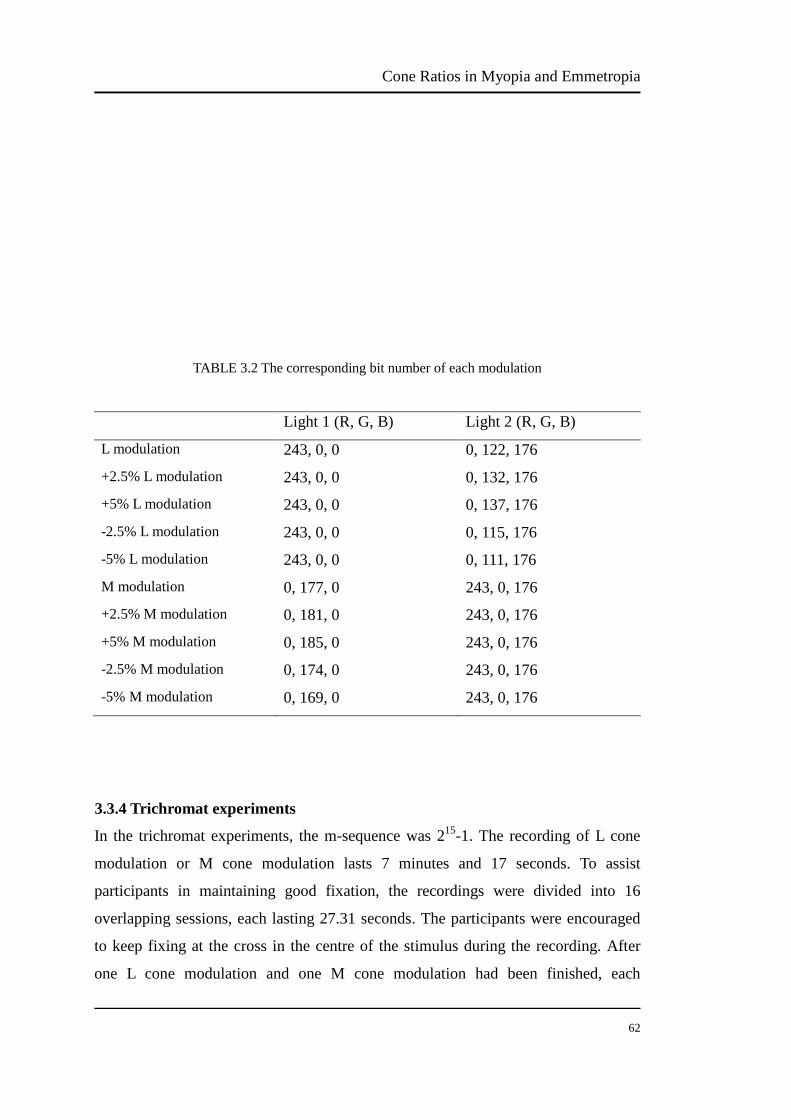
TABLE 3.2 The corresponding bit number of each modulation
Light 1 (R, G, B) Light 2 (R, G, B)
L modulation 243, 0, 0 0, 122, 176
+2.5% L modulation 243, 0, 0 0, 132, 176 +5% L modulation 243, 0, 0 0, 137, 176
-2.5% L modulation 243, 0, 0 0, 115, 176 -5% L modulation 243, 0, 0 0, 111, 176
M modulation 0, 177, 0 243, 0, 176 +2.5% M modulation 0, 181, 0 243, 0, 176
+5% M modulation 0, 185, 0 243, 0, 176 -2.5% M modulation 0, 174, 0 243, 0, 176
-5% M modulation 0, 169, 0 243, 0, 176
3.3.4 Trichromat experiments
In the trichromat experiments, the m-sequence was 215-1. The recording of L cone
modulation or M cone modulation lasts 7 minutes and 17 seconds. To assist
participants in maintaining good fixation, the recordings were divided into 16
overlapping sessions, each lasting 27.31 seconds. The participants were encouraged
to keep fixing at the cross in the centre of the stimulus during the recording. After
one L cone modulation and one M cone modulation had been finished, each
Cone Ratios in Myopia and Emmetropia
63
modulation was repeated one more time, so there are two runs of the L cone
modulation and two runs of the M cone modulation.
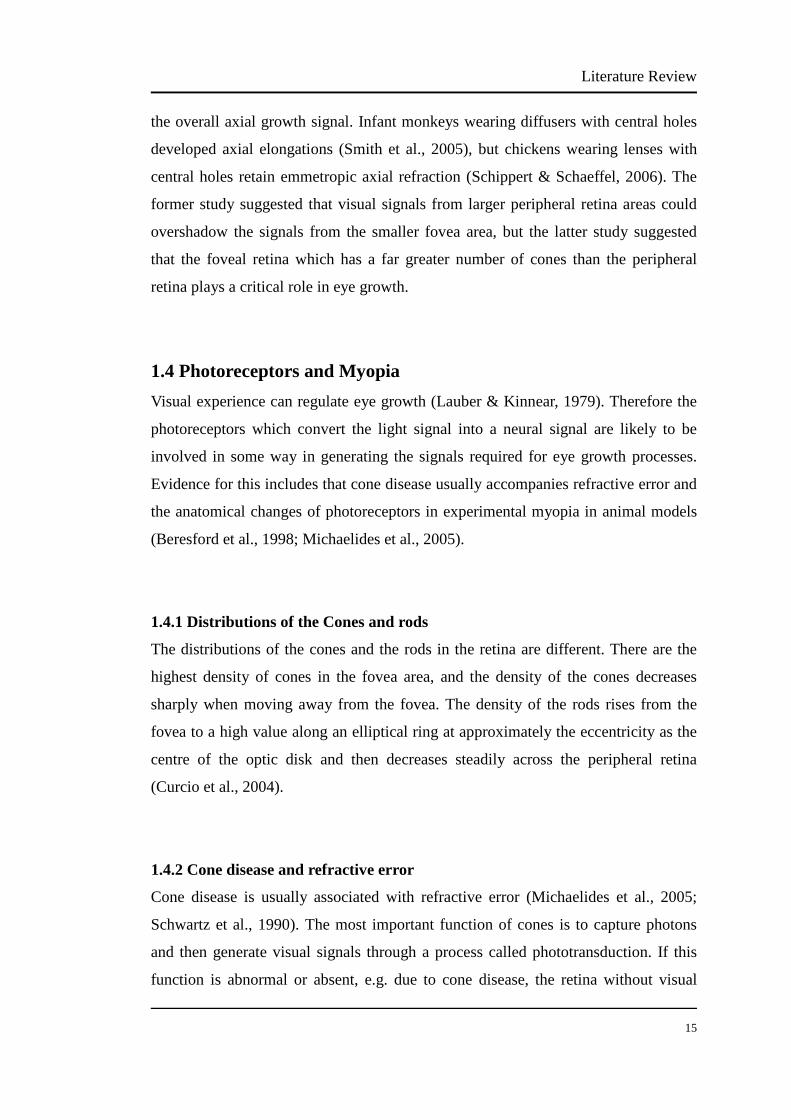
3.3.5 Exporting mfVEP data
To increase the signal to noise ratio, the mfVEP outputs were grouped and averaged
(Hood et al., 2000). The data of mfVEP signals of each participant were exported
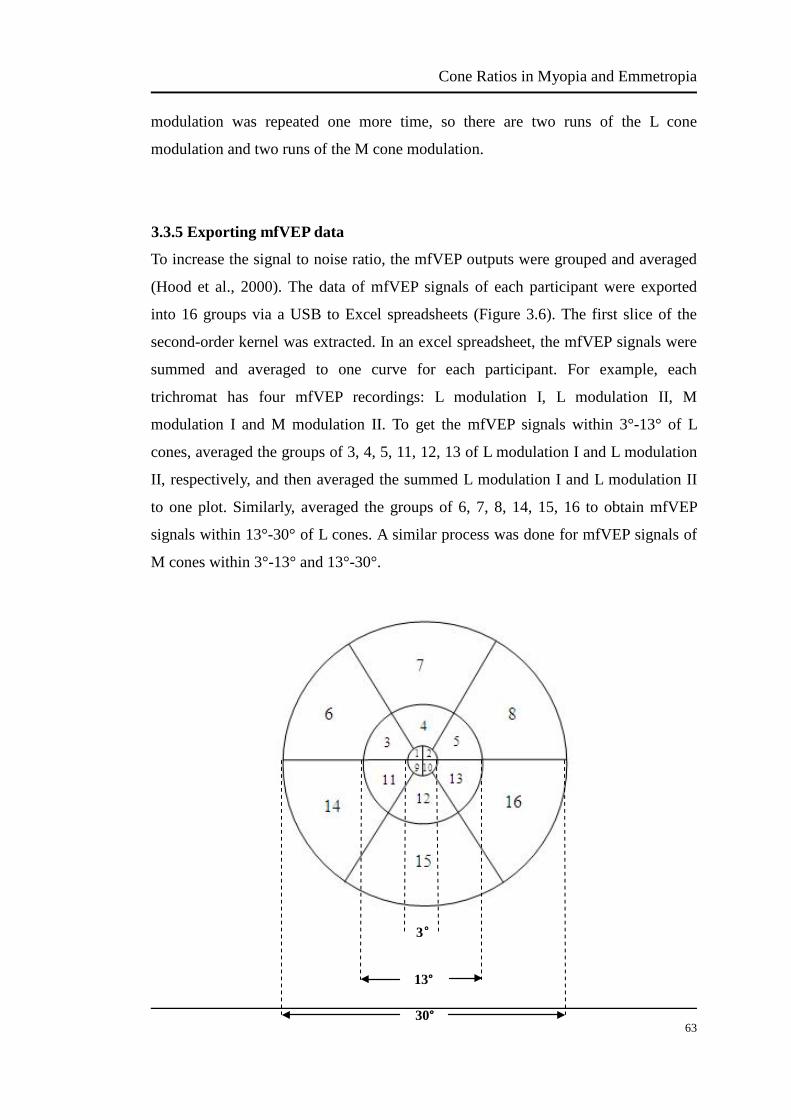
into 16 groups via a USB to Excel spreadsheets (Figure 3.6). The first slice of the
second-order kernel was extracted. In an excel spreadsheet, the mfVEP signals were
summed and averaged to one curve for each participant. For example, each
trichromat has four mfVEP recordings: L modulation I, L modulation II, M
modulation I and M modulation II. To get the mfVEP signals within 3°-13° of L
cones, averaged the groups of 3, 4, 5, 11, 12, 13 of L modulation I and L modulation
II, respectively, and then averaged the summed L modulation I and L modulation II
to one plot. Similarly, averaged the groups of 6, 7, 8, 14, 15, 16 to obtain mfVEP
signals within 13°-30° of L cones. A similar process was done for mfVEP signals of
M cones within 3°-13° and 13°-30°.
13°
30°
3°
Cone Ratios in Myopia and Emmetropia
64
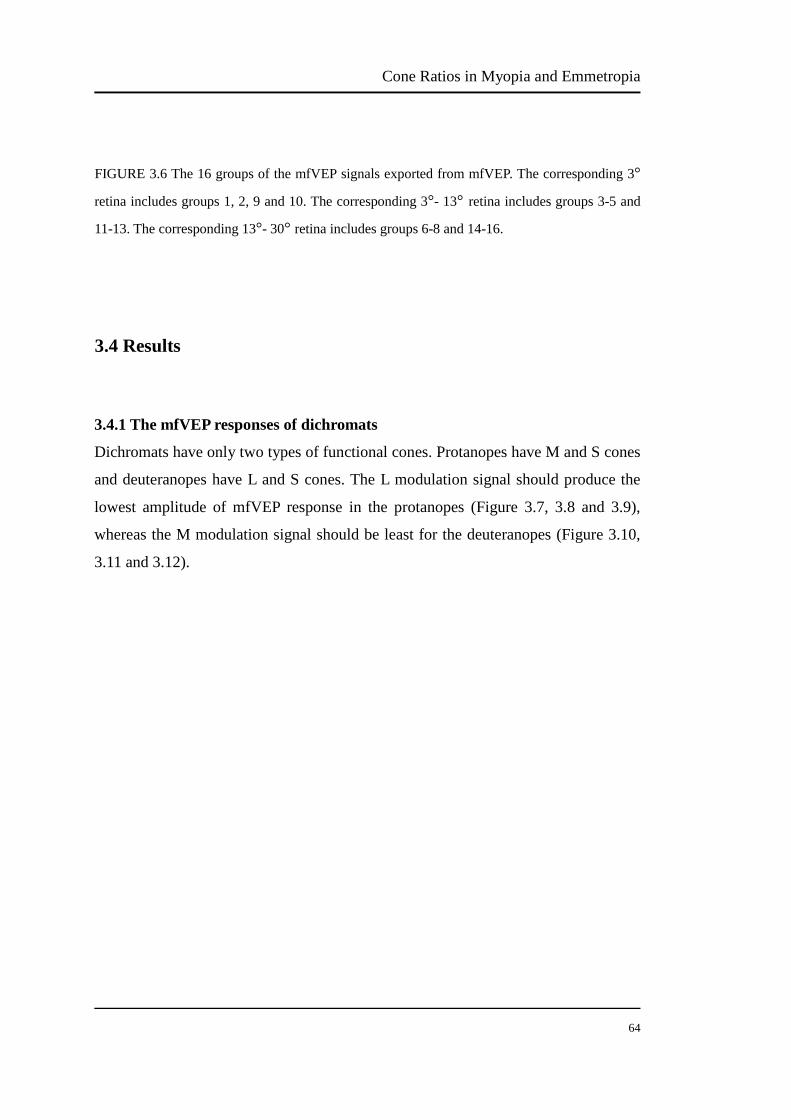
FIGURE 3.6 The 16 groups of the mfVEP signals exported from mfVEP. The corresponding 3°
retina includes groups 1, 2, 9 and 10. The corresponding 3°- 13° retina includes groups 3-5 and
11-13. The corresponding 13°- 30° retina includes groups 6-8 and 14-16.
3.4 Results
3.4.1 The mfVEP responses of dichromats
Dichromats have only two types of functional cones. Protanopes have M and S cones
and deuteranopes have L and S cones. The L modulation signal should produce the
lowest amplitude of mfVEP response in the protanopes (Figure 3.7, 3.8 and 3.9),
whereas the M modulation signal should be least for the deuteranopes (Figure 3.10,
3.11 and 3.12).
Cone Ratios in Myopia and Emmetropia
65
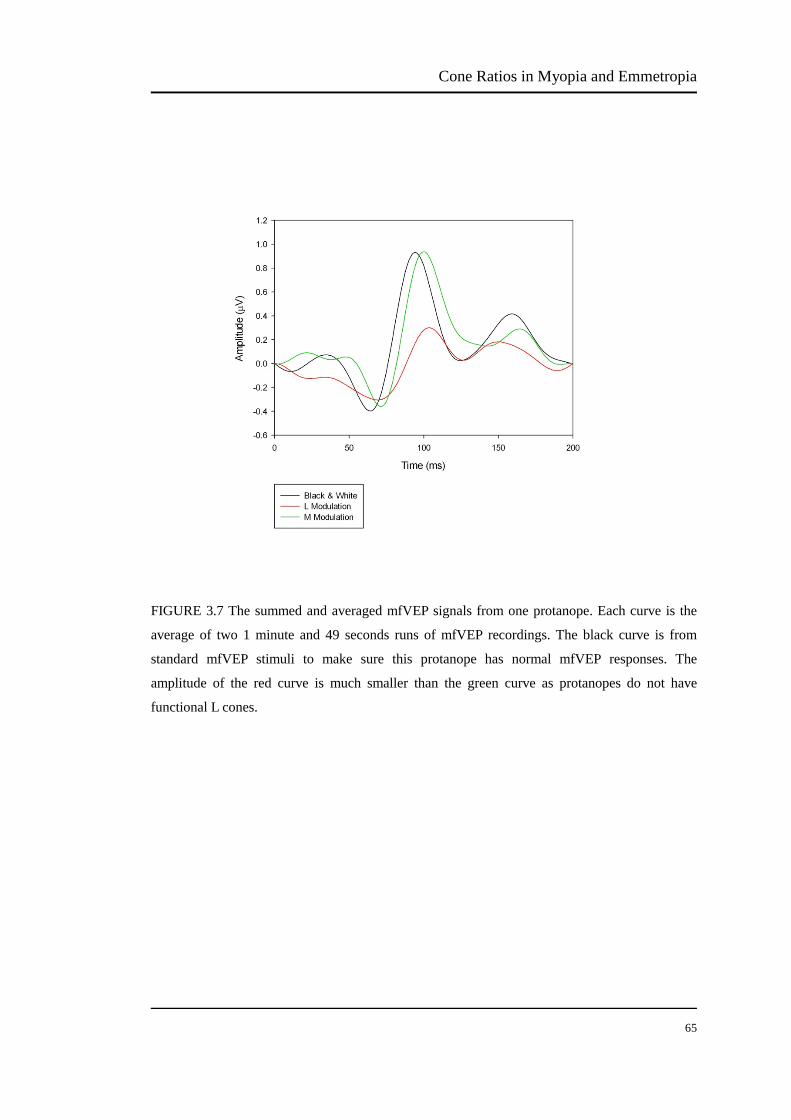
FIGURE 3.7 The summed and averaged mfVEP signals from one protanope. Each curve is the
average of two 1 minute and 49 seconds runs of mfVEP recordings. The black curve is from
standard mfVEP stimuli to make sure this protanope has normal mfVEP responses. The
amplitude of the red curve is much smaller than the green curve as protanopes do not have
functional L cones.
Cone Ratios in Myopia and Emmetropia
66
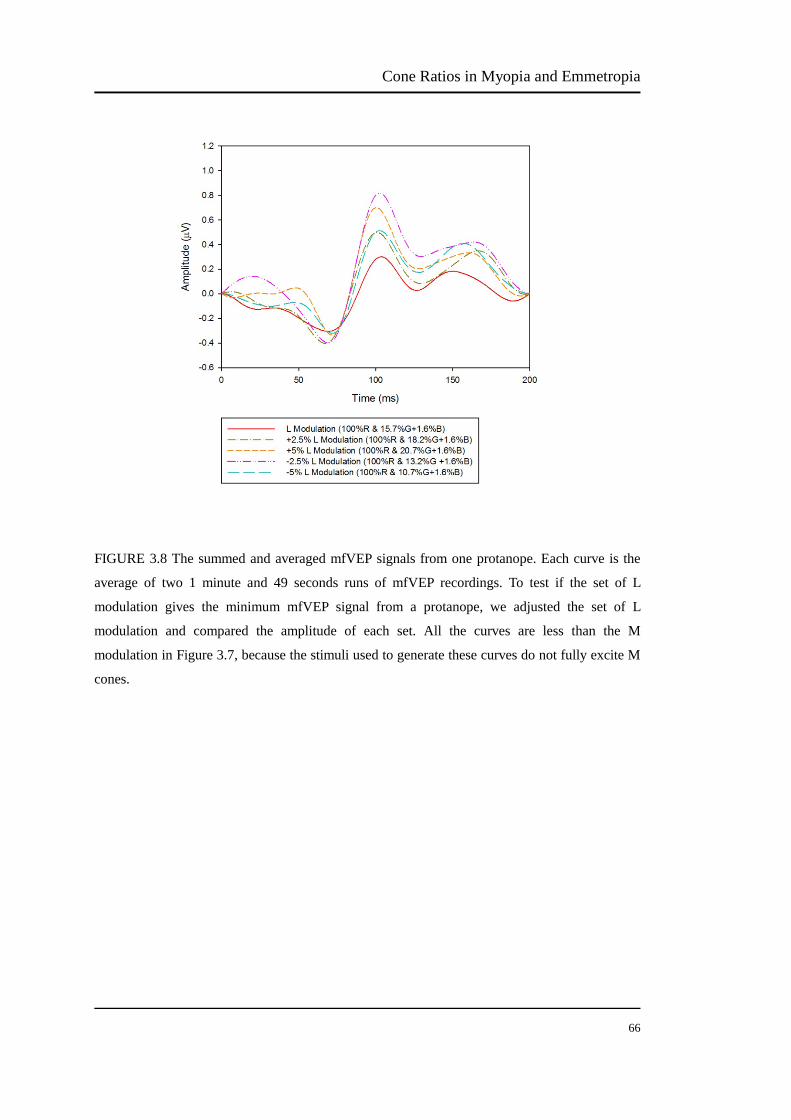
FIGURE 3.8 The summed and averaged mfVEP signals from one protanope. Each curve is the
average of two 1 minute and 49 seconds runs of mfVEP recordings. To test if the set of L
modulation gives the minimum mfVEP signal from a protanope, we adjusted the set of L
modulation and compared the amplitude of each set. All the curves are less than the M
modulation in Figure 3.7, because the stimuli used to generate these curves do not fully excite M
cones.
Cone Ratios in Myopia and Emmetropia
67
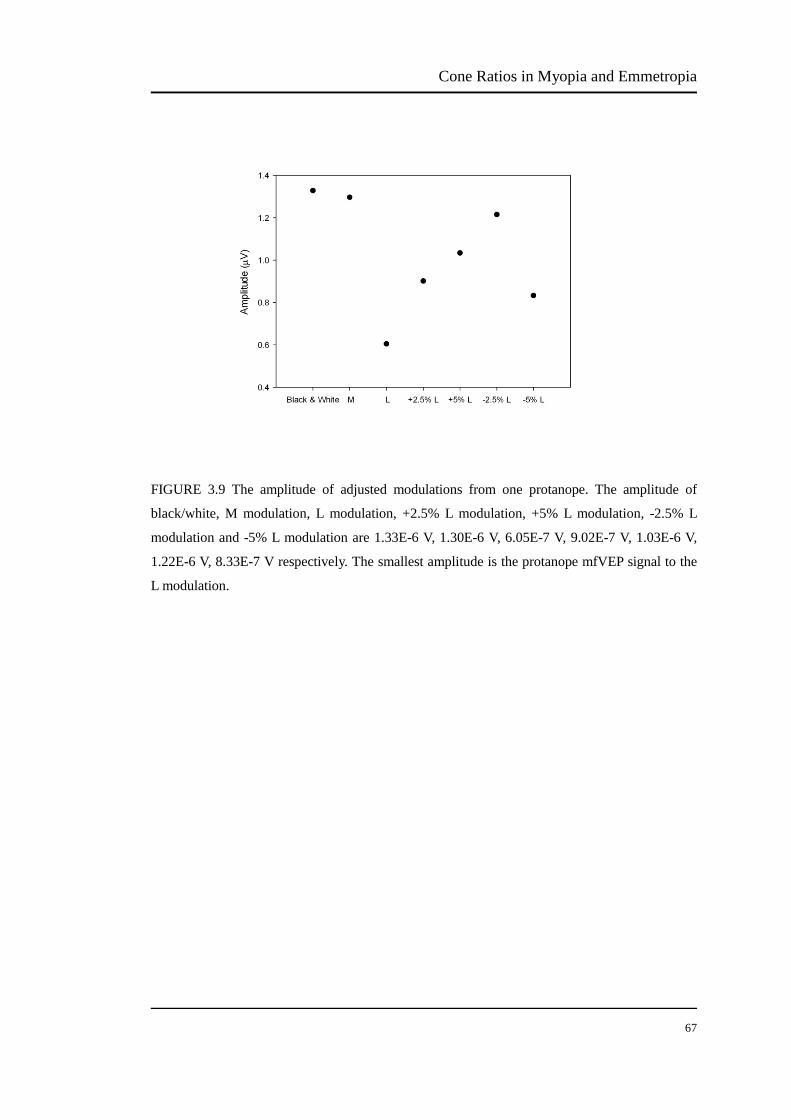
FIGURE 3.9 The amplitude of adjusted modulations from one protanope. The amplitude of
black/white, M modulation, L modulation, +2.5% L modulation, +5% L modulation, -2.5% L
modulation and -5% L modulation are 1.33E-6 V, 1.30E-6 V, 6.05E-7 V, 9.02E-7 V, 1.03E-6 V,
1.22E-6 V, 8.33E-7 V respectively. The smallest amplitude is the protanope mfVEP signal to the
L modulation.
Cone Ratios in Myopia and Emmetropia
68
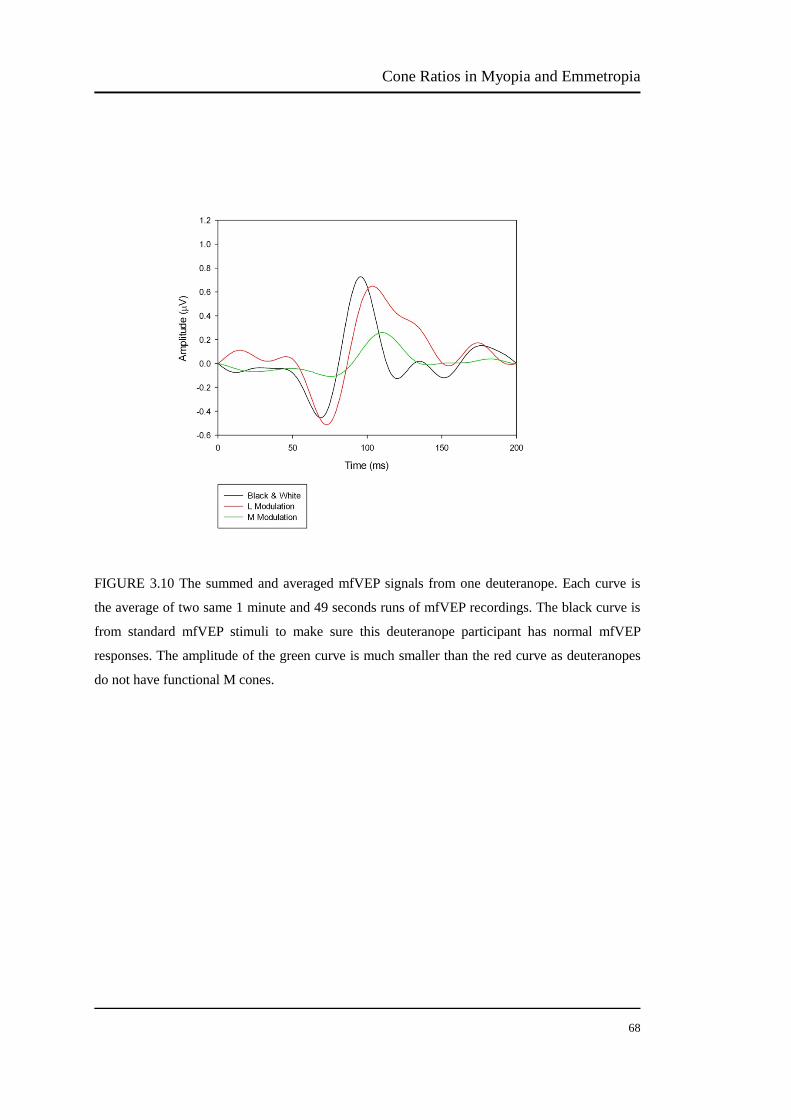
FIGURE 3.10 The summed and averaged mfVEP signals from one deuteranope. Each curve is
the average of two same 1 minute and 49 seconds runs of mfVEP recordings. The black curve is
from standard mfVEP stimuli to make sure this deuteranope participant has normal mfVEP
responses. The amplitude of the green curve is much smaller than the red curve as deuteranopes
do not have functional M cones.
Cone Ratios in Myopia and Emmetropia
69
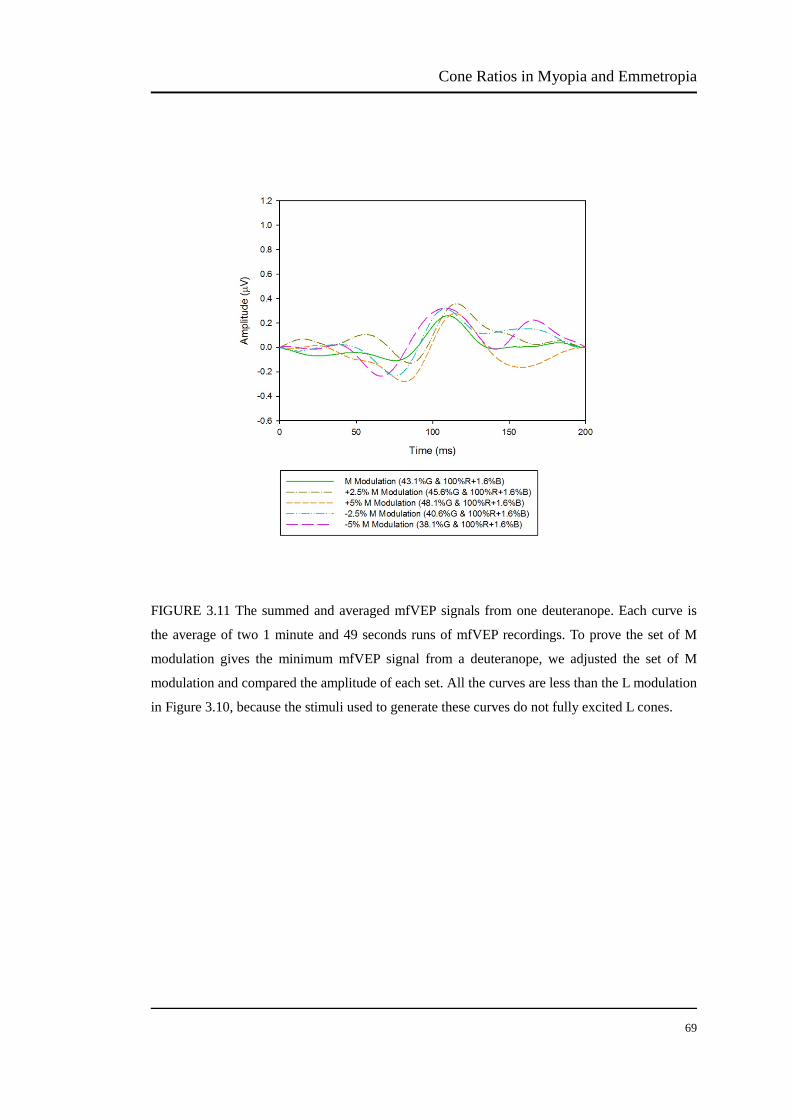
FIGURE 3.11 The summed and averaged mfVEP signals from one deuteranope. Each curve is
the average of two 1 minute and 49 seconds runs of mfVEP recordings. To prove the set of M
modulation gives the minimum mfVEP signal from a deuteranope, we adjusted the set of M
modulation and compared the amplitude of each set. All the curves are less than the L modulation
in Figure 3.10, because the stimuli used to generate these curves do not fully excited L cones.
Cone Ratios in Myopia and Emmetropia
70
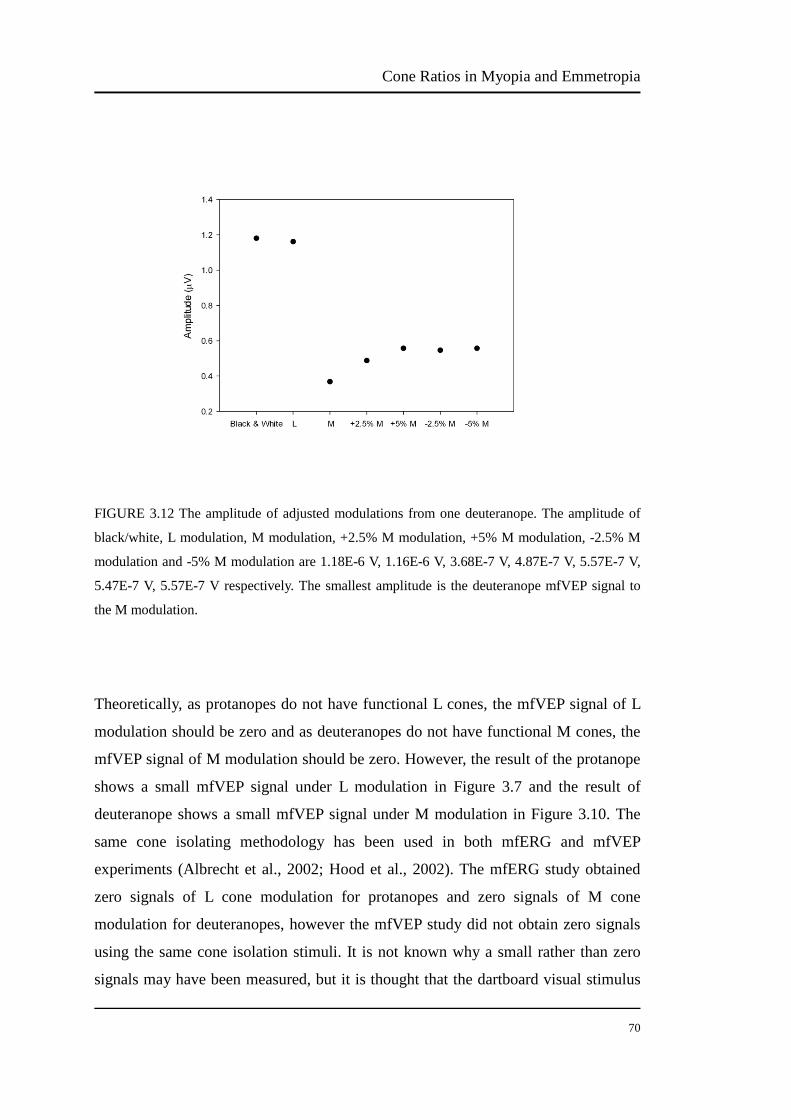
FIGURE 3.12 The amplitude of adjusted modulations from one deuteranope. The amplitude of
black/white, L modulation, M modulation, +2.5% M modulation, +5% M modulation, -2.5% M
modulation and -5% M modulation are 1.18E-6 V, 1.16E-6 V, 3.68E-7 V, 4.87E-7 V, 5.57E-7 V,
5.47E-7 V, 5.57E-7 V respectively. The smallest amplitude is the deuteranope mfVEP signal to
the M modulation.
Theoretically, as protanopes do not have functional L cones, the mfVEP signal of L
modulation should be zero and as deuteranopes do not have functional M cones, the
mfVEP signal of M modulation should be zero. However, the result of the protanope
shows a small mfVEP signal under L modulation in Figure 3.7 and the result of
deuteranope shows a small mfVEP signal under M modulation in Figure 3.10. The
same cone isolating methodology has been used in both mfERG and mfVEP
experiments (Albrecht et al., 2002; Hood et al., 2002). The mfERG study obtained
zero signals of L cone modulation for protanopes and zero signals of M cone
modulation for deuteranopes, however the mfVEP study did not obtain zero signals
using the same cone isolation stimuli. It is not known why a small rather than zero
signals may have been measured, but it is thought that the dartboard visual stimulus
Cone Ratios in Myopia and Emmetropia
71
of the mfVEP is more complex than the hexagonal visual stimulus array of the
mfERG and the smaller stimulus areas of the dartboard array might introduce some
other signals.
Another possibility is that the post-receptoral pathways exchange information
between each other. The electrical signal travelling through a nerve due to M cone
activation in a protanope, for instance, might induce a signal in a neighbouring
pathway originally associated with L cones. Therefore, detecting the stimulation at
the retinal level will yield a zero signal while detecting the signal at a later stage will
show a weak signal for the L cone, around the same time of the M cone signal, but
with a much lower amplitude. The phenomenon described above is referred to as
“nerve cross talk”, and was reported earlier by Gardner et al (Gardner, 1966). This is
one possible explanation for the non-zero signal detected by the mfVEP without L
cone stimulation. Moreover, there might be small contribution from the S cones and
rods (see section 4.5).
Figure 3.9 and 3.12 compared the amplitudes of adjusted L modulations and M
modulations. In the results of the protanope participant, the black/white stimulus has
the highest amplitude and then the M modulation. The lowest amplitude is the L
modulation, but the other four adjusted L modulations did not give an expected
amplitude order. For example, the amplitudes of -5% L modulation should be higher
than the -2.5% L modulation, however the results are opposite. The results of the
deuteranope participant revealed a similar problem. The unexpected relationship of
the amplitudes between the adjusted modulations might because of “nerve cross talk”.
The visual pathway system is a very complex system. Visual nerves influence
between each other (Gardner, 1966). Another reason could be that the participants
fixated to the stimuli differently. The mfVEP responses are sensitive to the change of
gaze position of the participants (Menz & Sutter, 2004).
Cone Ratios in Myopia and Emmetropia
72
3.4.2 The mfVEP responses of all the trichromats
The mfVEP responses of the central 3°-13° retina (Figure 3.13) and peripheral 13°-30°
retinal ring (Figure 3.14) of all trichromat participants were summed and averaged.
The data of foveal 3° retina were excluded because there is a gain adjustment in the
neural pathway in the foveal retina, resulting the L/M cone ratio to 1 (Hood et al.,
2002). Because of poor mfVEP signals (no typical N1-P1 amplitudes), the 3°-13°
data of participants SS, SV, NC and RJY and the 13°-30° data of participants SS, MC,
NC and IF were excluded (indicated by circles around the mfVEP data shown in
Figure 3.13 and 3.14).
Cone Ratios in Myopia and Emmetropia
73
CR
JYZ
DJ
PT
YH
YF
ZNY
SS
AW
SV
QM
MLC
MC
AM
CD
NC
WCC
FS
JG
CMJ
SPP
XZW
HPP
RJY
YSB
IF
WJJ
HY
MGL
ZXF
200 ms 1 µV
Cone Ratios in Myopia and Emmetropia
74
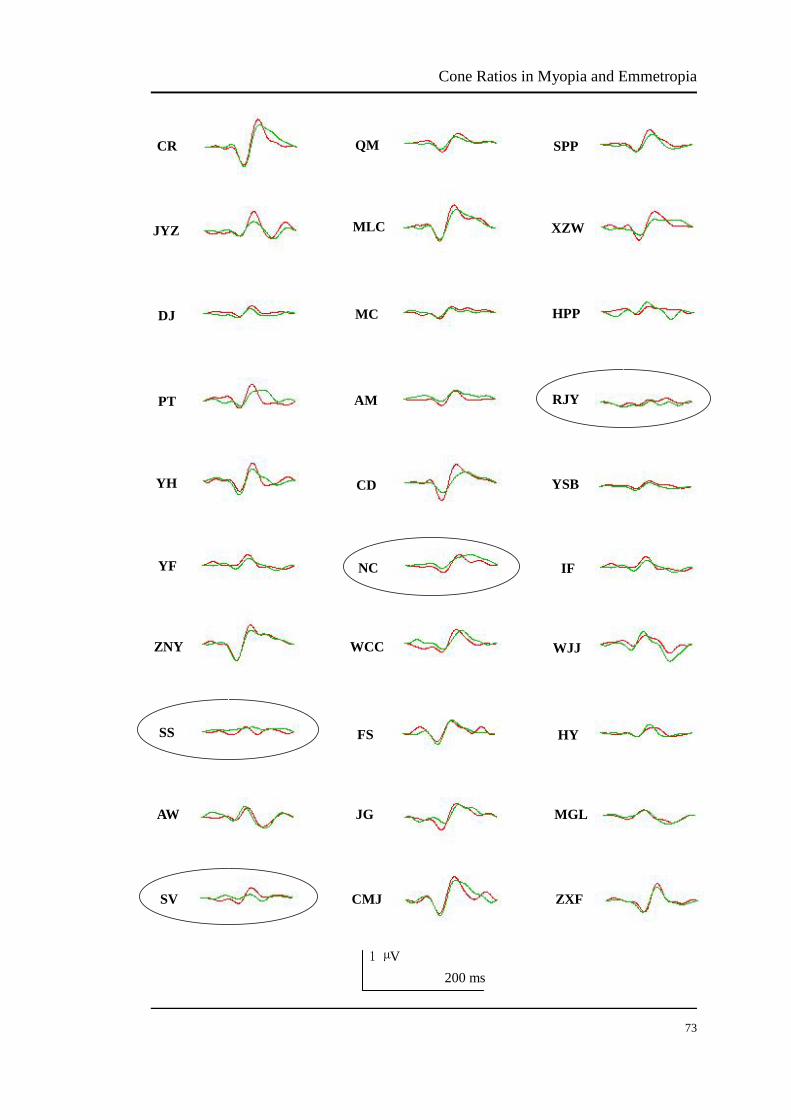
FIGURE 3.13 The summed and averaged mfVEP signals in the central 3°-13° retina of all
trichromat participants. The red curve is the average of two same L modulations and the green
curve is the average of two same M modulations. The ellipses represent poor mfVEP responses
that were deleted. Data of participants SS, SV, NC and RJY were excluded.
Cone Ratios in Myopia and Emmetropia
75
CR
JYZ
DJ
PT
YH
YF
ZNY
SS
AW
SV
QM
MLC
MC
AM
CD
NC
WCC
FS
JG
CMJ
SPP
XZW
HPP
RJY
YSB
IF
WJJ
HY
MGL
ZXF
200 ms 1 µV
Cone Ratios in Myopia and Emmetropia
76
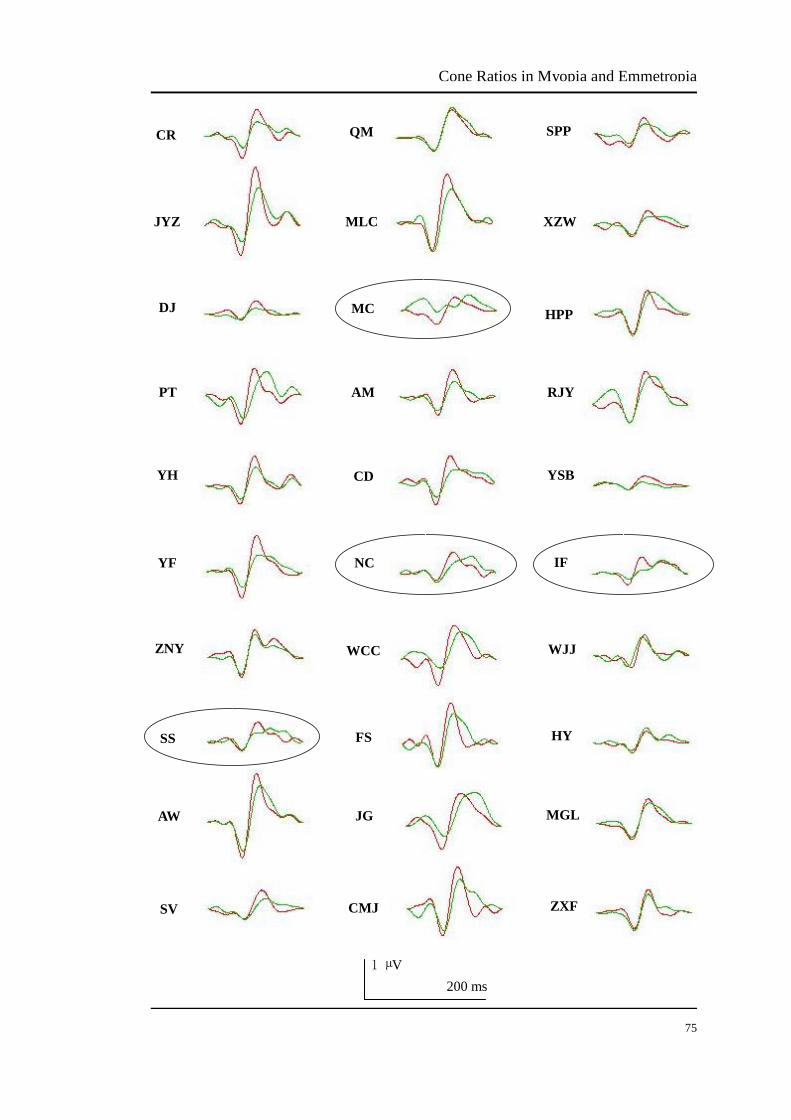
FIGURE 3.14 The summed and averaged mfVEP signals in the 13°-30° retina of all trichromat
participants. The red curve is the average of two same L modulations and the green curve is the
average of two same M modulations. The ellipses represent poor mfVEP responses that were
deleted. Data of participants SS, MC, NC and IF were excluded.
Cone Ratios in Myopia and Emmetropia
77
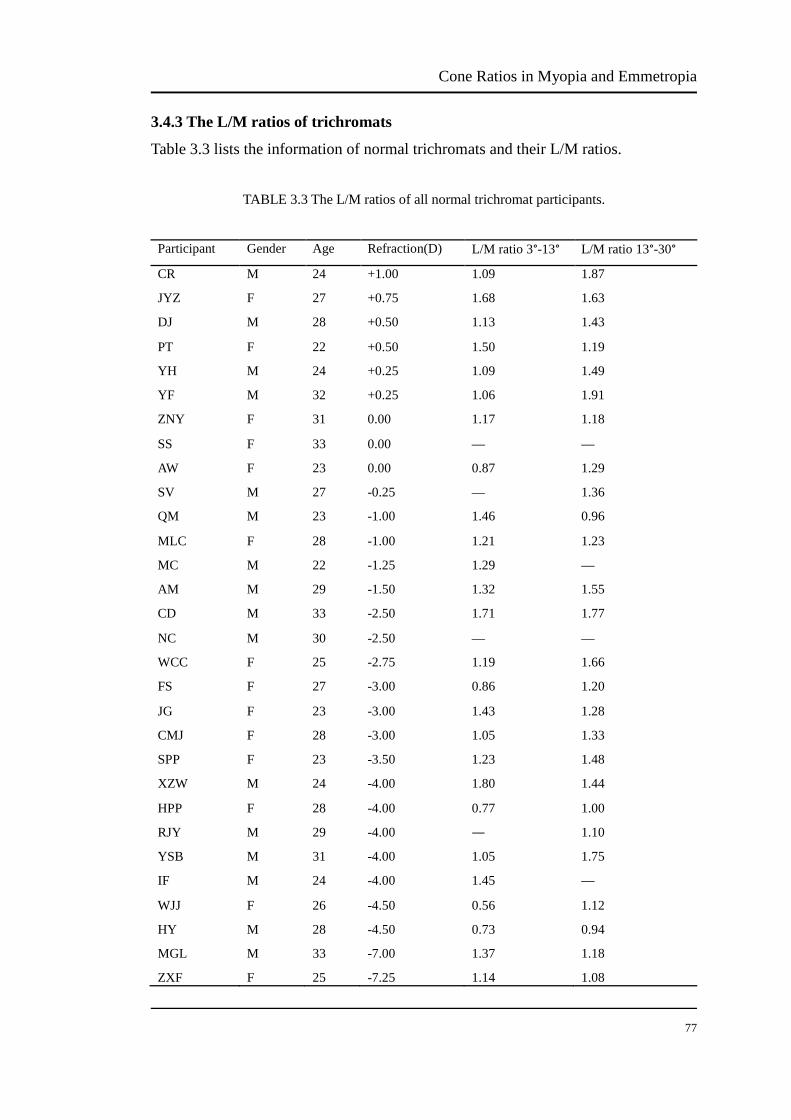
3.4.3 The L/M ratios of trichromats
Table 3.3 lists the information of normal trichromats and their L/M ratios.
TABLE 3.3 The L/M ratios of all normal trichromat participants.
Participant Gender Age Refraction(D) L/M ratio 3°-13° L/M ratio 13°-30°
CR M 24 +1.00 1.09 1.87
JYZ F 27 +0.75 1.68 1.63
DJ M 28 +0.50 1.13 1.43
PT F 22 +0.50 1.50 1.19
YH M 24 +0.25 1.09 1.49
YF M 32 +0.25 1.06 1.91
ZNY F 31 0.00 1.17 1.18
SS F 33 0.00 — —
AW F 23 0.00 0.87 1.29
SV M 27 -0.25 — 1.36
QM M 23 -1.00 1.46 0.96
MLC F 28 -1.00 1.21 1.23
MC M 22 -1.25 1.29 —
AM M 29 -1.50 1.32 1.55
CD M 33 -2.50 1.71 1.77
NC M 30 -2.50 — —
WCC F 25 -2.75 1.19 1.66
FS F 27 -3.00 0.86 1.20
JG F 23 -3.00 1.43 1.28
CMJ F 28 -3.00 1.05 1.33
SPP F 23 -3.50 1.23 1.48
XZW M 24 -4.00 1.80 1.44
HPP F 28 -4.00 0.77 1.00
RJY M 29 -4.00 ― 1.10
YSB M 31 -4.00 1.05 1.75
IF M 24 -4.00 1.45 —
WJJ F 26 -4.50 0.56 1.12
HY M 28 -4.50 0.73 0.94
MGL M 33 -7.00 1.37 1.18
ZXF F 25 -7.25 1.14 1.08
Cone Ratios in Myopia and Emmetropia
78
3.4.4 Data analysis between emmetropic, low myopic and high myopic groups
The One-way ANOVA analysis was conducted. When applying one-way analysis of
variance, three following assumptions should be satisfied: i) the populations from
which the samples were obtained should be normally or approximately normally
distributed; ii) the samples must be independent; iii) the variances of the population
must be equal. In this study, we recruited 30 participants and tested their own
LWS/MWS ratios, so the observations in this study were independent. The results of
the homogeneity of variances test revealed that there were no significant differences,
and the results showed that the normal distribution of population from which the
samples were recruited was not violated.
Within the central 3°-13° of retina, the L/M cone ratios of the emmetropic, low
myopic and high myopic groups were 1.20 ± 0.26, 1.28 ± 0.25 and 1.12 ± 0.39,
respectively. There were no significant differences in the value of L/M cone ratio
amongst the three groups (p=0.565).
Within the 13°-30° retinal ring, the L/M cone ratios of the emmetropic, low myopic
and high myopic groups were 1.49 ± 0.27, 1.37 ± 0.27 and 1.23 ± 0.27, respectively.
There were no significant differences in the value of L/M cone ratio amongst the
three groups (p=0.161).
3.4.5 Data analysis between emmetropic and myopic groups
All myopes were being grouped together and the independent-samples t-test analysis
was conducted. Three assumptions should be met for conducting the
independent-samples t-test: i) the populations from which the samples were obtained
should be normally or approximately normally distributed; ii) the samples must be
independent; iii) the variances of the population must be equal. This study tested the
participants’ own L/M ratio, so the observations in this study were independent, and
the homogeneity of variances test showed that here were no significant differences
and the normal distribution of population from which the samples were recruited was
not violated.
Cone Ratios in Myopia and Emmetropia
79
Within the central 3°-13° of retina, the L/M cone ratios of the emmetropic and
myopic group were 1.20 ± 0.26 and 1.20 ± 0.33, respectively. The L/M ratios of the
two groups were not different in the central ring (p=0.986).
Within the 13°-30° retinal ring, the L/M cone ratios of the emmetropic and myopic
group were 1.48 ± 0.27 and 1.30 ± 0.27, respectively. The L/M ratios of the two
groups were not different in the mid-peripheral ring (p=0.108).
3.4.6 Data analysis between central and peripheral retina
Paired-samples t-test was conducted between central 3°-13° and peripheral 13°-30°
of L/M cone ratios in 24 trichromat participants (SS, SV, NC, RJY, MC and IF were
excluded). There was significant statistic difference of L/M cone ratios between the
central and peripheral retina (p=0.017). The L/M cone ratios of the central retina
were 1.19±0.31. The L/M cone ratios of the peripheral retina were 1.37±0.29.
3.4.7 Post hoc effect size analysis
Although there was no statistical difference in the L/M ratios between myopes and
emmetropes, there was a trend toward significance for the most peripheral retinal
ring tested. Thus a post hoc power analysis was conducted on the peripheral data to
predict effect size for L/M ratio studies using mfVEP.
For one-way ANOVA, according to the data in the peripheral ring of current study,
the power value was 0.38 using GPower (3.1.5) software, and in order to get a power
value of 0.8, 66 participants in total are required.
For unpaired t-tests, according to the data in the peripheral ring of current study, the
power value was 0.34 using GPower (3.1.5) software, and in order to get a power
value of 0.8, 82 participants in total are required.
Discussion
79
CHAPTER 4
Discussion The present study estimated the L/M cone ratios of the central and mid-peripheral
retina using the mfVEP in 30 participants with normal colour vision. Statistical
analysis indicated that there were no significant differences in the L/M cone ratio
between the emmetropic, lower myopic and higher myopic groups for both the
central 3°-13° retina (p=0.565) and 13°-30° ring (p=0.161). There were also no
significant differences in L/M cone ratios between the emmetropic group and the
pooled data of all myopes, i.e to form one myopic group. The L/M cone ratios in
normal trichromat participants, comparisons between myopes and emmetropes, as
well as the reliability of the cone isolation stimuli and the limitations of the L/M
cone ratio estimates will be discussed.
4.1 Cone ratios in trichromats
In all normal trichromatic participants, the total L/M ratio ranged from 0.56 to 1.80
within the central 3°-13° and from 0.94 to 1.91 within the 13°-30° ring. A previous
study used mfVEP to estimate the L/M ratios in 6 colour normal trichromats (Hood
et al., 2002); the L/M ratio ranged from 1.1 to 1.7 within the central ring and 5.8° to
22.2° mid-peripheral ring. The range of L/M ratios reported here are thus similar to
the range reported in that paper; particularly given the small differences in visual
field area and the larger sample size (n=30) in this study.
Some of the factors that may impact on mfVEP responses have been investigated,
with Winn et al. (2005) concluding that mfVEP responses are affected by simulated
refractive errors, cataracts and fixations errors; these were not issues for the young,
Discussion
80
spectacle corrected participants of this study. The poor mfVEP responses were from
those participants who easily go to sleep during the experiments and were excluded
from the data. The test re-test reliability of the mfVEP is stated to be good, with an
r=0.85 for amplitude measures made on two separate days (Chen et al., 2003). Here
the agreement between the two test runs was r=0.95 for the L modulation and r=0.95
for the M modulation.
Other techniques have also been used to estimate L/M cone ratios. L/M cone ratios
determined using gene expression range from 1.3 to 4.9 in the central 40° of retina.
Direct imaging from the foveal retina gave L/M ratios ranging from 1.15 to 3.79.
Several psychophysical studies have been carried out and reported L/M ratios range
from 1.1 to 3.4 in the central 28° of retina. Electrophysiology has been widely used
to estimate L/M ratios, which range from 0.4 to 13 across the 124° of the retina; the
extreme values were rare, eighty percent of the L/M ratios were within the range of
1.0-4.0. These studies report a larger range of L/M cone ratios than our study, and
this probably reflects the difference in measured retinal areas and the principals of
the technique employed. For example, electrophysiological study which can measure
retinal area up to 124° gives L/M cone ratio from 0.4 to 13.
4.2 Myopes vs emmetropes
There was no statistical difference between the L/M ratio of the emmetropic and
myopic groups. Given the fact that not all protanopes are emmetropic and not all
deuteranopes are myopic, we predicted the L/M cone ratio was not a crucial factor in
the development of myopia. The finding of no difference of L/M cone ratios between
myopic and emmetropic groups is consistent with this prediction.
Some studies have suggested the L and M cone activities are related to myopic
refractive error. One small study has been carried out to determine the effect on
myopia progression of balancing the L and M cone activities in children (Neitz &
Neitz, 2011). This study indicated special eye glasses which equalize the L and M
cone activities reduced myopia progression to 10 times slower than that observed
Discussion
81
with normal eyeglasses. Another study has demonstrated that myopes are more
sensitive to the long-wavelength component (Rucker & Kruger, 2006). They
explained this may be due to a shift in cone pigment sensitivity towards
long-wavelength in myopia or relatively more L cones number than M cones in
myopia.
If the higher sensitivity of L cones related to myopia, it could be assumed that
protanopes without any L cones should not develop myopia. In contrast,
deuteranopes without any M cones should be myopic. One paper investigated the
prevalence of myopia in 309 red-green colour deficiency students (Qian et al., 2009).
They found that 43.7% protanopes and 47.3% deuteranopes are myopic, i.e the
prevalence of myopia was the same. This finding seems to challenge the above
assumption. While in the colour normal 927 students, myopia was present in 65.8%.
The difference of the prevalence in colour deficiency and colour normal group was
significant (random-effects logistic test: p<0.001). Therefore, the result that
red-green colour deficiency group had a lower prevalence of myopia cannot be
simply explained by L/M cone ratios. The L and M chromatic opponent has reduced
function in the red-green colour deficiency group, but the S chromatic opponent has
not been significantly affected.
In the 13°-30° diameter ring, the trend was for the L/M cone ratio to be lower in the
myopes; this is opposite to the predicted direction of the difference of a greater L/M
cone ratio in myopia. A post hoc power analysis of the peripheral ring data suggests
that with a power of 0.8, 27 participants in each group would be required to detect a
significantly lower cone ratio in myopes than in emmetropes in the peripheral ring. A
difference in this direction (i.e. lower L/M ratio in myopia), while not related to
myopia development per se, may occur as a consequence of myopia. Alternately a
recent study suggests that myopes may have lower L/M cone ratios; although this
was based on data of only 6 participants (Yamauchi et al., 2013). The lower L/M
ratio in myopes in Yamauchi’s study was consistent with the results in our study.
The peripheral eye shape could be considered as a reason that influences myopia
Discussion
82
development in the colour deficiency students. Most of the cones only take over a
small area of the fovea retina. The much bigger peripheral area of the retina may play
an important role in myopic progression. It has been reported that emmetropes and
myopes have different pattern of peripheral refractive errors (Charman, 2005; Mutti
et al., 2007; Seidemann et al., 2002; Stone & Flitcroft, 2004).
4.3 Central retina vs peripheral retina
There was a significant difference between the L/M cone ratio for the central 3°-13°
and peripheral 13°-30° rings. The L/M cone ratios of the central retina were lower
than that of the peripheral retina. This result is consistent with other L/M cone ratio
studies using different methods. In the mRNA analysis, the L/M cone ratios of the 20°
and 40° retina were 1.5 and 3.0 respectively (Hagstrom et al., 1998). The multifocal
pattern electroretinogram technique estimates of the L/M cone ratios for the 8° and
12.8°-26° retina areas were 1.00-2.78 and 1.29-2.78 respectively (Langrová et al.,
2007). The mfERG measurement suggested the L/M cone ratios were 1.4 for the
central 5° retina and 2.3 of the 40° retina (Albrecht et al., 2002).
This difference in estimated L/M ratio across the retina suggest the number of L
cones increases with retina excentricity or the number of M cones decreases with
retina excentricity. Direct images of trichromatic cone mosaic in human can address
this question. However, studies with this technique only measured the cone mosaic in
the foveal retina (Roorda, & Williams, 1988).
4.4 Validity of the cone isolating stimuli
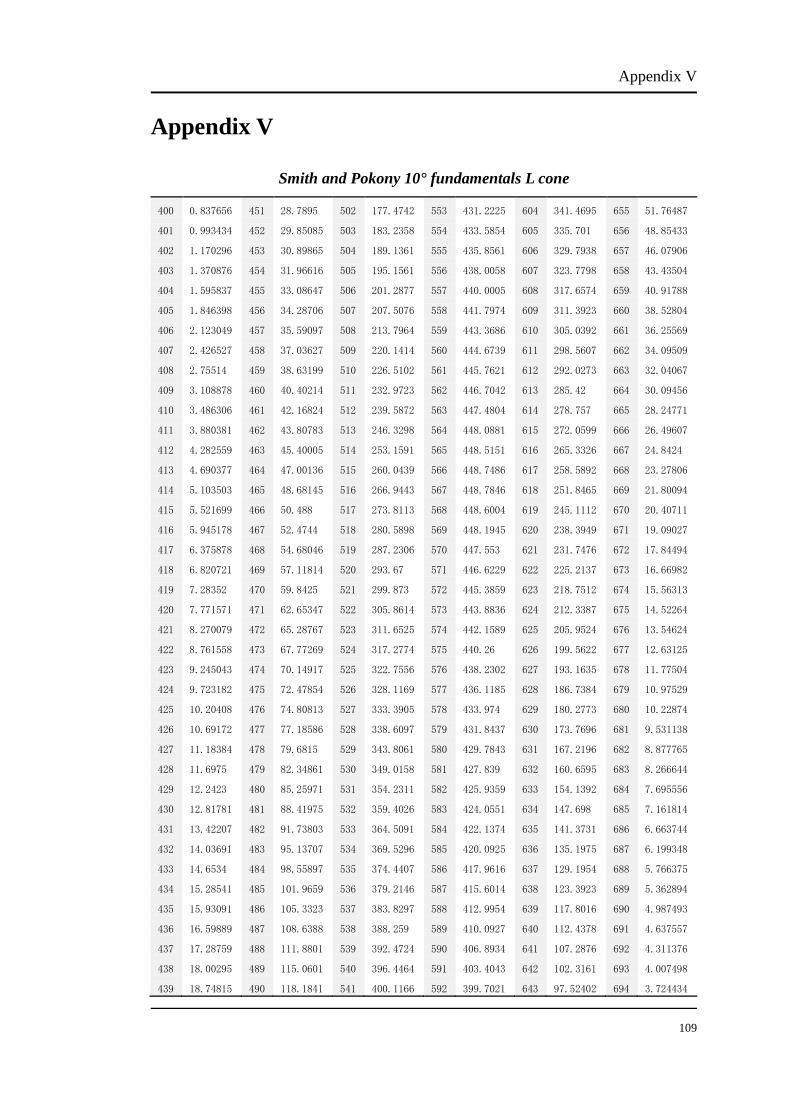
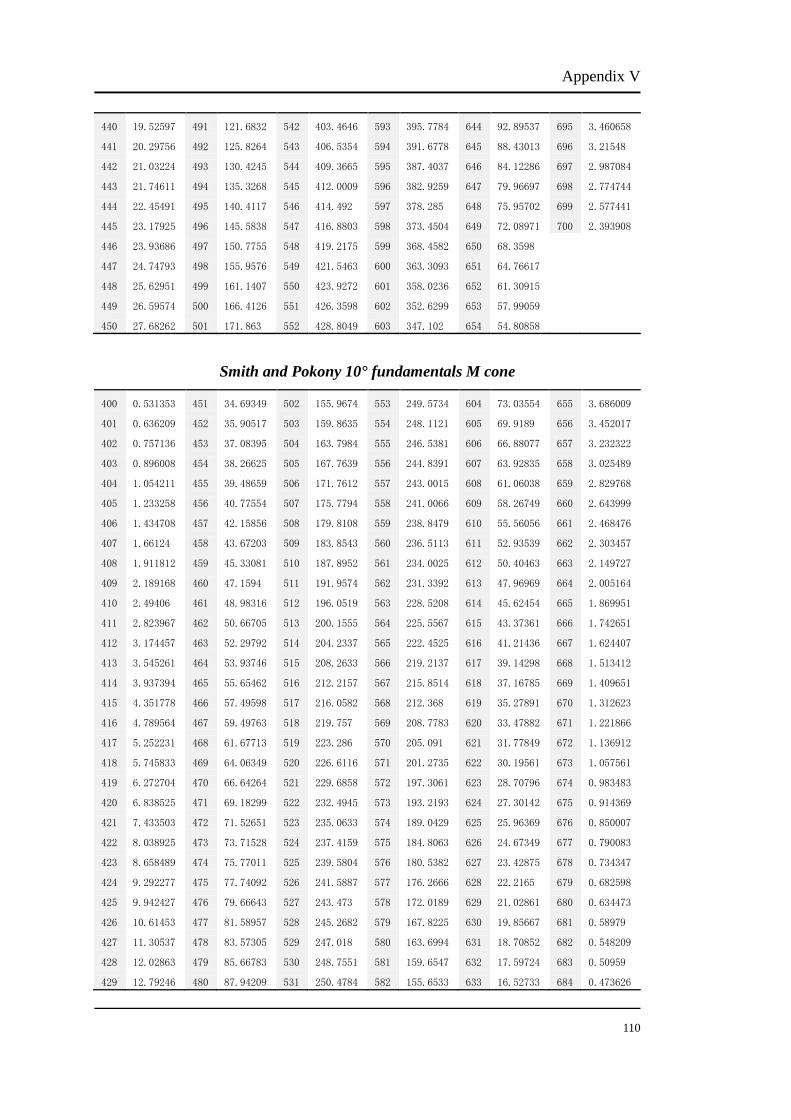
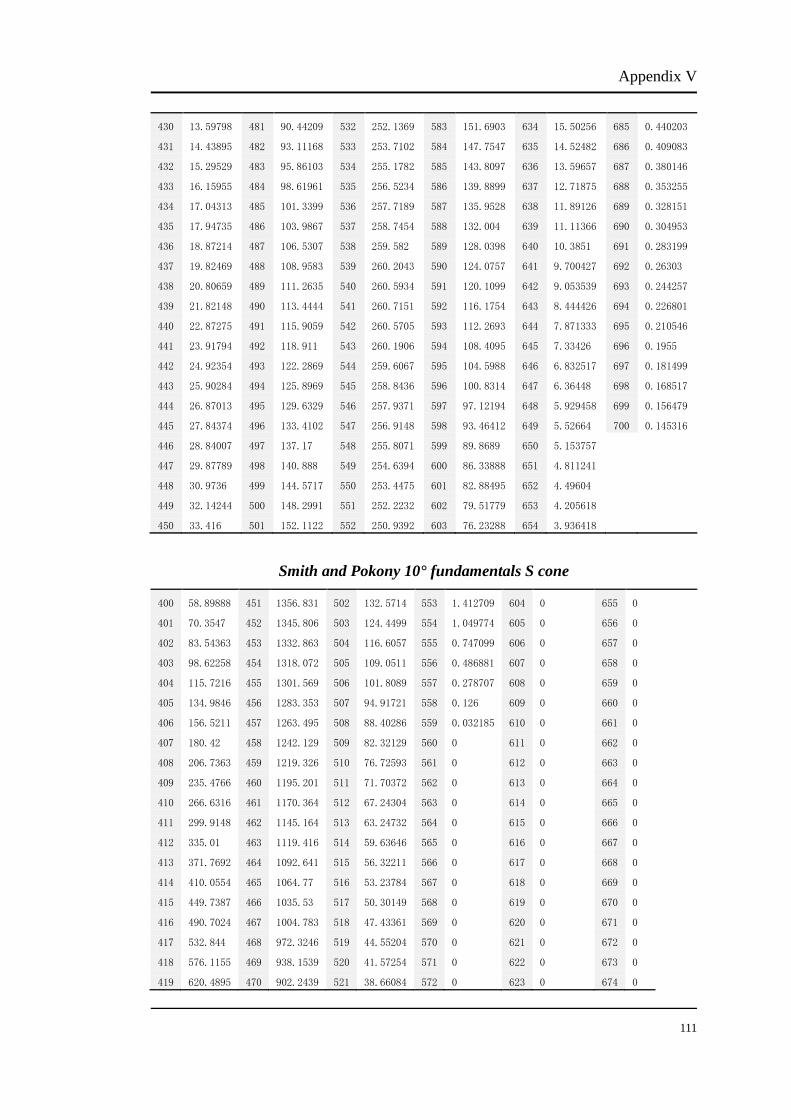
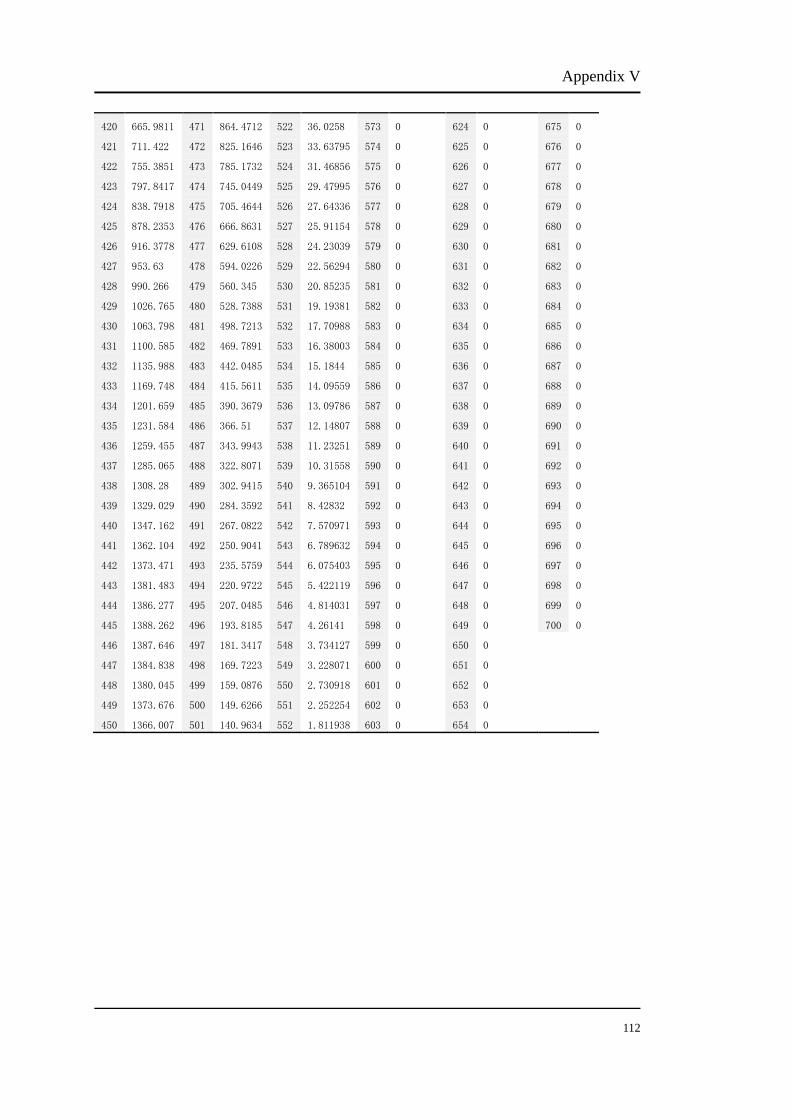
The Smith and Pokony 10° fundamentals were used to calculate L and M isolating
stimuli in this study. Other fundamentals are also available for the calculation, e.g.
Smith and Pokony 2° fundamentals. As this study investigated the L/M cone ratios
for 30° retina, we chose the fundamentals calculated for the larger retina area. In fact,
using different fundamentals is stated to give only minor changes in the calculated
parameters of cone isolation stimuli (Kremers et al., 1999). This study did not correct
Discussion
83
for individual differences in pre-receptoral filtering by the lens or macular pigment,
which will affect cone isolation. The effect of lens attenuation however, would be
small due to the younger age range of the sample (22-33 years old).
The luminance output of CRT monitors change with the temperature and the
luminance output remain stable after they have been turned on for at least 40
minutes (Metha et al., 1993). All the calibrations and experiments described in this
thesis were conducted after the monitor was allowed to warm up for 1 hour; this
avoided the influence of luminance changes on cone isolating stimuli.
The cone isolating stimuli were also tested on one protanope and one deuteranope.
To minimize any unwanted signals, the cone isolating settings were adjusted slightly,
and we chose the best parameters (see section 3.4.1).
4.5 Limitation of the mfVEP study of L/M cone ratios
It might be possible that there are some small S cone and rod signals. We used a
three primaries CRT to display the mfVEP stimuli, but to isolate one of the
photoreceptor classes, four primaries are required (Zele et al., 2012). In this study,
the L or M cone was isolated from other types of cones by the silent substitution
technique. The activity of the rods was minimised by prior light adaption and a fast
flickering stimuli. The 75 Hz frame rate of the CRT monitor and the mean luminance
of the L and M cone modulation were suggested not bright enough to separately
investigate L or M cone responses (Kremers et al., 2009; Zele & Vingrys, 2005). The
average pupil size was 5 mm during the mfVEP measurements. The retinal
illuminance of L modulation and M modulation were approximately 565.2 Td and
863.5 Td, respectively, during experiments. It has been suggested that if the retinal
illuminance is below 1000 Td (Zele et al., 2008), the rod signals might impact on the
results.
The PC and MC pathways are known to process information from both L and M
cones (Lee, 1996). In the foveal 1° retina, mfVEP responses mainly come from the PC
Discussion
84
pathway, because 95% of the ganglion cells in the fovea are midget ganglion cells
which subject to the PC pathway (Dacey, 1993). It is suggested that a gain
adjustment resulting 1:1 L/M ratio in the PC pathway has taken place after the
mfERG but before the mfVEP is generated in the central fovea (Hood et al., 2002).
Outside the foveal retina, mfVEP combine signals mainly from both PC and MC
pathways, because the midget ganglion cells projecting PC pathway make up around
45% and the parasol ganglion cells projecting MC pathway contribute 20% of the
total ganglion cells in the peripheral retina (Dacey & Petersen, 1992). In this study,
the MC pathway is already saturated at high contrast (Baseler & Sutter, 1997), so the
combination of PC and MC pathways in mfVEP response is not linear to the
numerosity of cones. Moreover, the positive and negative peaks of mfVEP signals
from the PC and MC pathways can cancel out each other (Baseler & Sutter, 1997).
According to the results of this study, the sample size might be not enough to detect
real L/M cone ratio differences in the peripheral retina of myopic and emmetropic
groups. Although both one-way ANOVA and independent-samples t-test analysis
indicated similar L/M cone ratios in the central retina, the variation of the L/M cone
ratios in the peripheral retina were greater between individuals. The P value of
one-way ANOVA and independent-samples t-test analysis in the peripheral retina
were 0.161 and 0.108. Power calculations suggest that increasing the total participant
numbers to 27 in each group would be required to prove whether the lack of
difference is due to insufficient power or is actually a real difference. In any case, the
effect size is likely to be very small if the effect were real.
The practical limitations of recording mfVEP are the placement of electrodes and the
fixation of participants during experiments. A proper and clean electrodes placement
can reduce the signal to noise ratio of the mfVEP responses. Before starting
measurements, the scalp-electrode impedances were checked and measurements only
proceeded when these were below 5 kOhms. This study used one channel electrodes
placement, it has been suggested that additional electrodes and channels can improve
the mfVEP signals and reduce the signal to noise ratio (Hood et al., 2002). The
fixation of participants during mfVEP tests was checked visually by the examiner.
Discussion
85
An objective method using a camera to monitor the fixation can more accurately
monitor fixation; minor changes of fixation can produce large variations of the
amplitude of mfVEP signals (Menz & Sutter, 2004).
4.6 Future directions
A relative large number of participants were tested in this study, compared to
previous research, using mfVEP to determine L/M ratios. No statistical difference
has been detected in this study; according to the post hoc power analysis, 27
participants were required of each group to find such differences. This study with 10
participants of each group provided basic data for the future L/M ratios studies using
mfVEP. In the future study, more participants will be recruited to meet the
requirement of powers of at least 0.8.
This study recruited about 70% Asian participants. It is known that the prevalence of
myopia of Asia countries is the highest over the world, so the high proportion of
Asian participants in this study could bias the results to this group. Recruiting
different ethnic groups with balanced number of participants could answer the
question whether the L/M cone ratio only impacts myopia for some racial groups.
However, the results from the mfVEP indicate that there are no significant individual
differences in cone ratios between persons with emmetropia or myopia and thus
differences in the suggested experiments unlikely. The future study can match one
Asian participant to one Western participant to balance the ethnic bias. Alternatively,
only one racial group can be considered. There has been a study suggesting that
myopes may have lower L/M cone ratios in Japanese, but it only had 6 participants
(Yamauchi et al., 2013).
Bibliography
86
BIBLIOGRAPHY
Albrecht, J., Jägle, H., Hood, D. C. & Sharpe, L. T. (2002). The multifocal electroretinogram (mfERG) and cone isolating stimuli: variation in L- and M-cone driven signals across the retina. Journal of Vision, 2(8), 543-558.
Ashby, R., Ohlendorf, A. & Schaeffel, F. (2009). The effect of ambient illuminance on the development of deprivation myopia in chicks. Investigative Ophthalmology and Visual Science, 50(11), 5348-5354.
Ashby, R. S. & Schaeffel, F. (2010). The effect of bright light on lens compensation in chicks. Investigative Ophthalmology and Visual Science, 51(10), 5247-5253.
Baseler, H.A., Sutter, E.E. (1997). M and P component of the VEP and their visual field distribution. Vision Research 37(6), 675-690.
Beresford, J. A., Crewther, S. G. & Crewther, D. P. (1998). Anatomical correlates of experimentally induced myopia. Australian and New Zealand Journal of Ophthalmology, 26, S84-S87.
Bhat, S. P., Rayner, S. A., Chau, S. C. & Ariyasu, R. G. (2004). Pax-6 expression in posthatch chick retina during and recovery from form-deprivation myopia. Developmental Neuroscience, 26(5-6), 328-335.
Bowmaker, J. & Dartnall, H. (1980). Visual pigments of rods and cones in a human retina. The Journal of Physiology, 298(1), 501-511.
Brainard, D. H., Roorda, A., Yamauchi, Y., Calderone, J. B., Metha, A., Neitz, M. et al. (2000). Functional consequences of the relative numbers of L and M cones. Journal of the Optical Society of America A, 17(3), 607-614.
Brainard, G. C. & Morgan, W. W. (1987). Light-induced stimulation of retinal dopamine: a dose-response relationship. Brain Research, 424(1), 199-203.
Cao, D., Pokorny, J., Smith, V. C. & Zele, A. J. (2008). Rod contributions to color perception: Linear with rod contrast. Vision Research, 48(26), 2586-2592.
Carroll, J., McMahon, C., Neitz, M. & Neitz, J. (2000). Flicker-photometric electroretinogram estimates of L: M cone photoreceptor ratio in men with photopigment spectra derived from genetics. Journal of the Optical Society of America A, 17(3), 499-509.
Carroll, J., Neitz, J. & Neitz, M. (2002). Estimates of L: M cone ratio from ERG flicker photometry and genetics. Journal of Vision, 2(8), 531-542.
Charman, W. (2005). Aberrations and myopia. Ophthalmic and Physiological Optics, 25(4), 285-301.
Chen, C. S., Hood, D. C., Zhang, X., Karam, E. Z., Liebmann, J. M., Ritch, R. et al. (2003). Repeat reliability of the multifocal visual evoked potential in normal and glaucomatous eyes. Journal of Glaucoma, 12(5), 399-408.
Chen, J. C., Brown, B. & Schmid, K. L. (2006). Delayed mfERG responses in myopia. Vision Research, 46(8-9), 1221-1229.
Chen, J. C., Brown, B. & Schmid, K. L. (2006). Evaluation of inner retinal function in myopia using
Bibliography
87
oscillatory potentials of the multifocal electroretinogram. Vision Research, 46(24), 4096-4103.
Chen, J. C., Schmid, K. L. & Brown, B. (2003). The autonomic control of accommodation and implications for human myopia development: a review. Ophthalmic and Physiological Optics, 23(5), 401-422.
Cicerone, C. M. & Nerger, J. L. (1989). The relative numbers of long-wavelength-sensitive to middle-wavelength-sensitive cones in the human fovea centralis. Vision Research, 29(1), 115-128.
Colombo, E. & Derrington, A. (2001). Visual calibration of CRT monitors. Displays, 22(3), 87-95.
Curcio, C. A., Sloan, K. R., Kalina, R. E. & Hendrickson, A. E. (2004). Human photoreceptor topography. The Journal of Comparative Neurology, 292(4), 497-523.
Dacey, D. M. (1993). The mosaic of midget ganglion cells in the human retina. The Journal of Neuroscience, 13(12), 5334-5355.
Dacey, D. M. & Petersen, M. R. (1992). Dendritic field size and morphology of midget and parasol ganglion cells of the human retina. Proceedings of the National Academy of Sciences, 89(20), 9666-9670.
Dartnall, H., Bowmaker, J. & Mollon, J. (1983). Human visual pigments: microspectrophotometric results from the eyes of seven persons. Proceedings of the Royal society of London. Series B. Biological Sciences, 220(1218), 115-130.
DeMarco, P., Pokorny J., Smith VC. (1992). Full-spectrum cone sensitivity functions for X-chromosome-linked anomalous trichromats. Journal of the Optical Society of America A, 9, 1465-1476.
Ellingson, R.J. (1966). Development of visual evoked responses in human infants recorded by a response averager. Electroenceph Clin Neurophysiol, 21, 403-404.
Diether, S. & Schaeffel, F. (1997). Local changes in eye growth induced by imposed local refractive error despite active accommodation. Vision Research, 37(6), 659.
Edwards, M., Leung, S. & Lee, W. (1996). Do variations in normal nutrition play a role in the development of myopia? Optometry and Vision Science, 73(10), 638-643.
Estévez, O. & Spekreijse, H. (1982). The “silent substitution” method in visual research. Vision Research, 22(6), 681-691.
Fan, D. S. P., Lam, D. S. C., Lam, R. F., Lau, J. T. F., Chong, K. S., Cheung, E. Y. Y. et al. (2004). Prevalence, incidence, and progression of myopia of school children in Hong Kong. Investigative Ophthalmology and Visual Science, 45(4), 1071-1075.
Fischer, A. J., McGuire, J. J., Schaeffel, F. & Stell, W. K. (1999). Light-and focus-dependent expression of the transcription factor ZENK in the chick retina. Nature Neuroscience, 2(8), 706-712.
Fitzgerald, M. E. C., Wildsoet, C. F. & Reiner, A. (2002). Temporal relationship of choroidal blood flow and thickness changes during recovery from form deprivation myopia in chicks. Experimental Eye Research, 74(5), 561-570.
Fleming, P. A., Harman, A. M. & Beazley, L. D. (1997). Changing topography of the RPE resulting from experimentally induced rapid eye growth. Visual Neuroscience, 14(03), 449-461.
Bibliography
88
Flitcroft, D. I. (1998). A model of the contribution of oculomotor and optical factors to emmetropization and myopia. Vision Research, 38(19), 2869-2879.
Fujikado, T., Hosohata, J. & Omoto, T. (1996). ERG of form deprivation myopia and drug induced ametropia in chicks. Current Eye Research, 15(1), 79-86.
Fujikado, T., Kawasaki, Y., Suzuki, A., Ohmi, G. & Tano, Y. (1997). Retinal function with lens-induced myopia compared with form-deprivation myopia in chicks. Graefe's Archive for Clinical and Experimental Ophthalmology, 235(5), 320-324.
Fulk, G. W., Cyert, L. A. & Parker, D. A. (2002). Seasonal variation in myopia progression and ocular elongation. Optometry and Vision Science, 79(1), 46-51.
Godley, B. F. & Wurtman, R. J. (1988). Release of endogenous dopamine from the superfused rabbit retina in vitro: effect of light stimulation. Brain Research, 452(1), 393-395.
Graham, B. & Judge, S. J. (1999). Normal development of refractive state and ocular component dimensions in the marmoset (Callithrix jacchus). Vision Research, 39(2), 177-187.
Hagstrom, S. A., Neitz, J. & Neitz, M. (1998). Variations in cone populations for red-green color vision examined by analysis of mRNA. Neuroreport, 9(9), 1963-1967.
Hagstrom, S. A., Neitz, M. & Neitz, J. (2000). Cone pigment gene expression in individual photoreceptors and the chromatic topography of the retina. Journal of the Optical Society of America A, 17(3), 527-537.
Halliday, A. M., McDonald, W. I., Mushin, J. (1972). Delayed visual evoked response in opticneuritis. Lancet, 1, 982-985.
Hammond, C. J., Andrew, T., Tat Mak, Y. & Spector, T. D. (2004). A susceptibility locus for myopia in the normal population is linked to the PAX6 gene region on chromosome 11: A genomewide scan of dizygotic twins. The American Journal of Human Genetics, 75(2), 294-304.
Hammond, C. J., Snieder, H., Gilbert, C. E. & Spector, T. D. (2001). Genes and environment in refractive error: the twin eye study. Investigative Ophthalmology and Visual Science, 42(6), 1232-1236.
Harman, A. M., Hoskins, R. & Beazley, L. (1999). Experimental eye enlargement in mature animals changes the retinal pigment epithelium. Visual Neuroscience, 16(4), 619-628.
Hood, D. C., Odel, J. G. & Winn, B. J. (2003). The multifocal visual evoked potential. Journal of Neuro-ophthalmology, 23(4), 279-289.
Hood, D. C., Odel, J. G. & Zhang, X. (2000). Tracking the recovery of local optic nerve function after optic neuritis: a multifocal VEP study. Investigative Ophthalmology and Visual Science, 41(12), 4032-4038.
Hood, D. C., Yu, A. L., Zhang, X., Albrecht, J., Jägle, H. & Sharpe, L. T. (2002). The multifocal visual evoked potential and cone-isolating stimuli: Implications for L-to M-cone ratios and normalization. Journal of Vision, 2(2), 178-189.
Hood, D. C., Zhang, X., Greenstein, V. C., Kangovi, S., Odel, J. G., Liebmann, J. M. & Ritch, R. (2000). An interocular comparison of the multifocal VEP: a possible technique for detecting local damage to the optic nerve. Investigative Ophthalmology and Visual Science, 41(6), 1580-1587.
Hood, D. C., Zhang, X. & Winn, B. J. (2003). Detecting glaucomatous damage with multifocal visual
Bibliography
89
evoked potentials: how can a monocular test work? Journal of Glaucoma, 12(1), 3-15.
Ip, J. M., Saw, S.-M., Rose, K. A., Morgan, I. G., Kifley, A., Wang, J. J. & Mitchell, P. (2008). Role of near work in myopia: findings in a sample of Australian school children. Investigative Ophthalmology and Visual Science, 49(7), 2903-2910.
Iuvone, P., Tigges, M., Stone, R., Lambert, S. & Laties, A. (1991). Effects of apomorphine, a dopamine receptor agonist, on ocular refraction and axial elongation in a primate model of myopia. Investigative Ophthalmology and Visual Science, 32(5), 1674-1677.
Iuvone, P. M., Tigges, M., Fernandes, A. & Tigges, J. (1989). Dopamine synthesis and metabolism in rhesus monkey retina: development, aging, and the effects of monocular visual deprivation. Visual Neuroscience, 2(5), 465-471.
Jacobsen, N., Jensen, H. & Goldschmidt, E. (2008). Does the level of physical activity in university students influence development and progression of myopia?—a 2-year prospective cohort study. Investigative Ophthalmology and Visual Science, 49(4), 1322-1327.
Jaworski, A., Gentle, A., Zele, A. J., Vingrys, A. J. & McBrien, N. A. (2006). Altered visual sensitivity in axial high myopia: A local postreceptoral phenomenon? [Article]. Investigative Ophthalmology and Visual Science, 47(8), 3695-3702.
Jones, L. A., Sinnott, L. T., Mutti, D. O., Mitchell, G. L., Moeschberger, M. L. & Zadnik, K. (2007). Parental history of myopia, sports and outdoor activities, and future myopia. Investigative Ophthalmology and Visual Science, 48(8), 3524-3532.
Kawabata, H. & Adachi-Usami, E. (1997). Multifocal electroretinogram in myopia. Investigative Ophthalmology and Visual Science, 38(13), 2844-2851.
Kremers, J., Czop, D. & Link, B. (2009). Rod and S-cone driven ERG signals at high retinal illuminances. Documenta Ophthalmologica, 118(3), 205-216.
Kremers, J., Scholl, H. P. N., Knau, H., Berendschot, T. T. J. M., Usui, T. & Sharpe, L. T. (2000). L/M cone ratios in human trichromats assessed by psychophysics, electroretinography, and retinal densitometry. Optical Society of America A, 17(3), 517-526.
Kremers, J., Usui, T., Scholl, H. & Sharpe, L. T. (1999). Cone signal contributions to electroretinograms [correction of electrograms] in dichromats and trichromats. Investigative Ophthalmology and Visual Science, 40(5), 920-930.
Kröger, R. H. H. & Binder, S. (2000). Use of paper selectively absorbing long wavelengths to reduce the impact of educational near work on human refractive development. British Journal of Ophthalmology, 84(8), 890-893.
Lam, C. S. Y., Goldschmidt, E. & Edwards, M. H. (2004). Prevalence of myopia in local and international schools in Hong Kong. Optometry and Vision Science, 81(5), 317-322.
Lam, C. Y., Tam, P. O. S., Fan, D. S. P., Fan, B. J., Wang, D. Y., Lee, C. W. S. et al. (2008). A genome-wide scan maps a novel high myopia locus to 5p15. Investigative Ophthalmology and Visual Science, 49(9), 3768-3778.
Lam, D. S. C., Fan, D. S. P., Lam, R. F., Rao, S. K., Chong, K. S., Lau, J. T. F. et al. (2008). The effect of parental history of myopia on children's eye size and growth: results of a longitudinal study. Investigative Ophthalmology and Visual Science, 49(3), 873-876.
Lam, D. S. C., Tam, P. O. S., Fan, D. S. P., Baum, L., Leung, Y. & Pang, C. P. (2003). Familial high myopia linkage to chromosome 18p. Ophthalmologica, 217(2), 115-118.
Bibliography
90
Langrová, H., Jägle, H., Zrenner, E. & Kurtenbach, A. (2007). The multifocal pattern electroretinogram (mfPERG) and cone-isolating stimuli. Visual Neuroscience, 24(6), 805-816.
Lauber, J. & Kinnear, A. (1979). Eye enlargement in birds induced by dim light. Canadian Journal of Ophthalmology, 14(4), 265.
Lee, B. B. (1996). Receptive field structure in the primate retina. Vision Research, 36(5), 631-644.
Liang, H., Crewther, D. P., Gillard Crewther, S. & Barila, A. M. (1995). A role for photoreceptor outer segments in the induction of deprivation myopia. Vision Research, 35(9), 1217-1225.
Liang, H., Crewther, S. G., Crewther, D. P. & Junghans, B. M. (2004). Structural and elemental evidence for edema in the retina, retinal pigment epithelium, and choroid during recovery from experimentally induced myopia. Investigative Ophthalmology and VisualSscience, 45(8), 2463-2474.
Lin, L. L. K., Shih, Y. F., Tsai, C. B., Chen, C. J., Lee, L. A., Hung, P. T. & Hou, P. K. (1999). Epidemiologic study of ocular refraction among schoolchildren in Taiwan in 1995. Optometry and Vision Science, 76(5), 275-281.
Lin, T., Grimes, P. A. & Stone, R. A. (1993). Expansion of the retinal pigment epithelium in experimental myopia. Vision Research, 33(14), 1881-1885.
Lyhne, N., Sjølie, A. K., Kyvik, K. O. & Green, A. (2001). The importance of genes and environment for ocular refraction and its determiners: a population based study among 20–45 year old twins. British Journal of Ophthalmology, 85(12), 1470-1476.
Ma, J.-H., Shen, S.-H., Zhang, G.-W., Zhao, D.-S., Xu, C., Pan, C.-M. et al. (2010). Identification of a locus for autosomal dominant high myopia on chromosome 5p13.3-p15.1 in a Chinese family. Molecular Vision, 16, 2043-2054.
McBrien, N. A., Moghaddam, H. & Reeder, A. (1993). Atropine reduces experimental myopia and eye enlargement via a nonaccommodative mechanism. Investigative Ophthalmology and Visual Science, 34(1), 205-215.
McBrien, N. A., Moghaddam, H. O., Cottriall, C. L., Leech, E. M. & Cornell, L. M. (1995). The effects of blockade of retinal cell action potentials on ocular growth, emmetropization and form deprivation myopia in young chicks. Vision Research, 35(9), 1141-1152.
McCarthy, C. S., Megaw, P., Devadas, M. & Morgan, I. G. (2007). Dopaminergic agents affect the ability of brief periods of normal vision to prevent form-deprivation myopia. Experimental Eye Research, 84(1), 100-107.
Menz, M. & Sutter, E. (2004). The effect of fixation instability on the multifocal VEP. Documenta Ophthalmologica, 109(2), 147-156.
Metha, A., Vingrys, A. & Badcock, D. (1993). Calibration of a color monitor for visual psychophysics. Behavior Research Methods, 25(3), 371-383.
Meyer, C., Mueller, M., Duncker, G. & Meyer, H. J. (1999). Experimental animal myopia models are applicable to human juvenile-onset myopia. Survey of Ophthalmology, 44, S93-S102.
Mollon, J.D. (1989). "Tho'she kneel'd in that place where they grew…" The uses and origins of primate colour vision. Journal of Experimental Biology, 146(1), 21-38.
Bibliography
91
Michaelides, M., Johnson, S., Bradshaw, K., Holder, G. E., Simunovic, M. P., Mollon, J. D. et al. (2005). X-Linked cone dysfunction syndrome with myopia and protanopia. Ophthalmology, 112(8), 1448-1454.
Miele, D. L., Odel, J. G., Behrens, M. M., Zhang, X. & Hood, D. C. (2000). Functional bitemporal quadrantopia and the multifocal visual evoked potential. Journal of Neuro-ophthalmology, 20(3), 159-162.
Mutti, D. O., Hayes, J. R., Mitchell, G. L., Jones, L. A., Moeschberger, M. L., Cotter, S. A. et al. (2007). Refractive error, axial length, and relative peripheral refractive error before and after the onset of myopia. Investigative Ophthalmology and Visual Science, 48(6), 2510-2519.
Nathan, J., Crewther, S., Crewther, D. & Kiely, P. (1984). Effects of retinal image degradation on ocular growth in cats. Investigative Ophthalmology and Visual Science, 25(11), 1300-1306.
Neitz, J. & Neitz, M. (2011). Photoreceptor activity patterns and the cause and prevention of myopia. Optometry and Vision Science 88(3), 424.
Nerger, J. L. & Cicerone, C. M. (1992). The ratio of L cones to M cones in the human parafoveal retina. Vision Research, 32(5), 879-888.
Nickla, D. L. & Wildsoet, C. F. (2004). The effect of the nonspecific nitric oxide synthase inhibitor NG-nitro-L-arginine methyl ester on the choroidal compensatory response to myopic defocus in chickens. Optometry and Vision Science, 81(2), 111-118.
Norton, T. (1999). Animal Models of Myopia: Learning How Vision Controls the Size of the Eye. ILAR Journal/National Research Council, Institute of Laboratory Animal Resources, 40(2), 59-77.
Norton, T. T., Essinger, J. A. & McBRIEN, N. A. (1994). Lid-suture myopia in tree shrews with retinal ganglion cell blockade. Visual Neuroscience, 11, 143-143.
Odom, J. V., Bach, M., Brigell, M., Holder, G. E., McCulloch, D. L. & Tormene, A. P. (2010). ISCEV standard for clinical visual evoked potentials (2009 update). Documenta Ophthalmologica, 120(1), 111-119.
Otake, S. & Cicerone, C. M. (2000). L and M cone relative numerosity and red–green opponency from fovea to midperiphery in the human retina. Journal of the Optical Society of America A, 17(3), 615-627.
Paluru, P., Ronan, S. M., Heon, E., Devoto, M., Wildenberg, S. C., Scavello, G. et al. (2003). New locus for autosomal dominant high myopia maps to the long arm of chromosome 17. Investigative Ophthalmology and Visual Science, 44(5), 1830-1836.
Pickett Seltner, R. L. & Stell, W. K. (1995). The effect of vasoactive intestinal peptide on development of form deprivation myopia in the chick: a pharmacological and immunocytochemical study. Vision Research, 35(9), 1265-1270.
Pokorny, J., Lutze, M., Cao, D. & Zele, A. J. (2006). The color of night: Surface color perception under dim illuminations. Visual Neuroscience, 23(3/4), 525-530.
Pokorny, J. & Smith, V. (1987). L/M cone ratios and the null point of the perceptual red/green opponent system. Die Farbe, 34, 53–57.
Pokorny, J., Smith, V. C. & Wesner, M. F. (1991). Variability in cone populations and implications. From Pigments to Perception, Plenum New York, 23-34.
Bibliography
92
Qian, Y.-S., Chu, R.-Y., He, J. C., Sun, X.-H., Zhou, X.-T., Zhao, N.-Q. et al. (2009). Incidence of myopia in high school students with and without red-green color vision deficiency. Investigative Ophthalmology and Visual Science, 50(4), 1598-1605.
Rabin, J., Van Sluyters, R. & Malach, R. (1981). Emmetropization: a vision-dependent phenomenon. Investigative Ophthalmology and Visual Science, 20(4), 561-564.
Regan, D., Cartwright, R. F. (1970). A method of measuring the potentials evoked by simultaneous stimulation of different retinal regions. Electroenceph CLin Neurophysiol, 28, 314-319.
Rohrer, B., Spira, A. W. & Stell, W. K. (1993). Apomorphine blocks form-deprivation myopia in chickens by a dopamine D~ 2-receptor mechanism acting in retina or pigmented epithelium. Visual Neuroscience, 10, 447-447.
Roorda, A. & Williams, D. R. (1988). The arrangement of the three cone classes in the living human eye. Acoustical Society of America, 83, 1102-1116.
Rose, K. A., Morgan, I. G., Ip, J., Kifley, A., Huynh, S., Smith, W. & Mitchell, P. (2008). Outdoor activity reduces the prevalence of myopia in children. Ophthalmology, 115(8), 1279-1285.
Rose, K. A., Morgan, I. G., Smith, W., Burlutsky, G., Mitchell, P. & Saw, S.-M. (2008). Myopia, lifestyle, and schooling in students of Chinese ethnicity in Singapore and Sydney. Archives of Ophthalmology, 126(4), 527-530.
Rucker, F. J. & Kruger, P. B. (2006). Cone contributions to signals for accommodation and the relationship to refractive error. Vision Research, 46(19), 3079-3089.
Saw, S. M., Chua, W. H., Hong, C. Y., Wu, H. M., Chan, W. Y., Chia, K. S. et al. (2002). Nearwork in early-onset myopia. Investigative Ophthalmology and Visual Science, 43(2), 332-339.
Saw, S. M., Hong, R. Z., Zhang, M. Z., Fu, Z. F., Ye, M., Tan, D. & Chew, S. J. (2001). Near-work activity and myopia in rural and urban schoolchildren in China. Journal of Pediatric Ophthalmology and Strabismus, 38(3), 149-155.
Schippert, R. & Schaeffel, F. (2006). Peripheral defocus does not necessarily affect central refractive development. Vision Research, 46(22), 3935-3940.
Schmid, K. L. & Wildsoet, C. F. (2004). Inhibitory effects of apomorphine and atropine and their combination on myopia in chicks. Optometry and Vision Science, 81(2), 137-147.
Schwartz, M., Haim, M. & Skarsholm, D. (1990). X‐linked myopia: Bornholm Eye Disease. Clinical Genetics, 38(4), 281-286.
Seidemann, A., Schaeffel, F., Guirao, A., Lopez-Gil, N. & Artal, P. (2002). Peripheral refractive errors in myopic, emmetropic, and hyperopic young subjects. The Optical Society of America A, 19(12), 2363-2373.
Sherman, S. M., Norton, T. & Casagrande, V. (1977). Myopia in the lid-sutured tree shrew (Tupaia glis). Brain Research, 124(1), 154-157.
Shih, Y. F., Fitzgerald, M. E. C., Norton, T. T., Gamlin, P. D. R., Hodos, W. & Reiner, A. (1993). Reduction in choroidal blood flow occurs in chicks wearing goggles that induce eye growth toward myopia. Current Eye Research, 12(3), 219-227.
Siegwart Jr, J. T. & Norton, T. T. (2011). Perspective: How Might Emmetropization and Genetic Factors Produce Myopia in Normal Eyes? Optometry and Vision Science, 88(3), E365.
Bibliography
93
Simensen, B. & Thorud, L. O. (2009). Adult‐onset myopia and occupation. Acta Ophthalmologica, 72(4), 469-471.
Smith, E. L. (1998). Environmentally induced refractive errors in animals. Myopia and Nearwork. Oxford: Butterworth-Heinemann, 57-90.
Smith, E. L., Huang, J., Hung, L. F., Blasdel, T. L., Humbird, T. L. & Bockhorst, K. H. (2009). Hemiretinal form deprivation: evidence for local control of eye growth and refractive development in infant monkeys. Investigative Ophthalmology and Visual Science, 50(11), 5057-5069.
Smith, E. L., Kee, C., Ramamirtham, R., Qiao-Grider, Y. & Hung, L. F. (2005). Peripheral vision can influence eye growth and refractive development in infant monkeys. Investigative Ophthalmology and Visual Science, 46(11), 3965-3972.
Smith, E. L., Li-Fang, H. & Harwerth, R. S. (1994). Effects of optically induced blur on the refractive status of young monkeys. Vision Research, 34(3), 293-301.
Smith, E.L., Ramamirtham, R., Qiao-Grider, Y., Hung, L.F., Huang, J., Kee, C.S., Coats, D., Paysse, E. (2007). Effects of foveal ablation on emmetropization and form-deprivation myopia. Investigative Ophthalmology and Visual Science, 48, 3914-3922.
Smith, V. C. & Pokorny, J. (1975). Spectral sensitivity of the foveal cone photopigments between 400 and 500 nm. Vision Rresearch, 15(2), 161-171.
Stambolian, D., Ibay, G., Reider, L., Dana, D., Moy, C., Schlifka, M. et al. (2004). Genomewide linkage scan for myopia susceptibility loci among Ashkenazi Jewish families shows evidence of linkage on chromosome 22q12. American Journal of Human Genetics, 75(3), 448-459.
Stone, R. & Flitcroft, D. (2004). Ocular shape and myopia. Annals-academy of Medicine Singapore, 33(1), 7-15.
Stone, R. A., Lin, T. & Laties, A. M. (1991). Muscarinic antagonist effects on experimental chick myopia. Experimental Eye Research, 52(6), 755-758.
Stone, R. A., Lin, T., Laties, A. M. & Iuvone, P. M. (1989). Retinal dopamine and form-deprivation myopia. Proceedings of the National Academy of Sciences, 86(2), 704-706.
Thorington, L. (1985). Spectral, irradiance, and temporal aspects of natural and artificial light. Annals of the New York Academy of Sciences, 453(1), 28-54.
Ting, P. W. K., Lam, C. S. Y., Edwards, M. H. & Schmid, K. L. (2004). Prevalence of myopia in a group of Hong Kong microscopists. Optometry and Vision Science, 81(2), 88-93.
Tong, L., Wong, E. H., Chan, Y. H. & Balakrishnan, V. (2002). A multiple regression approach to study optical components of myopia in Singapore school children. Ophthalmic and Physiological Optics, 22(1), 32-37.
Troilo, D., Gottlieb, M. D. & Wallman, J. (1987). Visual deprivation causes myopia in chicks with optic nerve section. Current Eye Research, 6(8), 993-999.
Troilo, D. & Wallman, J. (1991). The regulation of eye growth and refractive state: an experimental study of emmetropization. Vision Research, 31(7), 1237-1250.
Usui, T., Kremers, J., Sharpe, L. T. & Zrenner, E. (1998). Flicker cone electroretinogram in dichromats and trichromats. Vision Research, 38(21), 3391-3396.
Bibliography
94
Varughese, S., Varghese, R. M., Gupta, N., Ojha, R., Sreenivas, V. & Puliyel, J. M. (2005). Refractive error at birth and its relation to gestational age. Current Eye Research, 30(6), 423-428.
Villarreal, M. G., Ohlsson, J., Abrahamsson, M., Sjöström, A. & Sjöstrand, J. (2001). Myopisation: the refractive tendency in teenagers. Prevalence of myopia among young teenagers in Sweden. Acta Ophthalmologica Scandinavica, 78(2), 177-181.
Vitale, S., Ellwein, L., Cotch, M. F., Ferris III, F. L. & Sperduto, R. (2008). Prevalence of refractive error in the United States, 1999–2004. Archives of Ophthalmology, 126(8), 1111-1119.
Wachtmeister, L. (1998). Oscillatory potentials in the retina: what do they reveal. Progress In Retinal And Eye Research, 17(4), 485-521.
Wallman, J., Adams, J. & Trachtman, J. (1981). The eyes of young chickens grow toward emmetropia. Investigative Ophthalmology and Visual Science, 20(4), 557-561.
Wallman, J., Gottlieb, M.D., Rajaram, V., Fugate-Wentzek, L.A. (1987). Local retinal regions control local eye growth and myopia. Science, 237, 73-77.
Wallman, J., Wildsoet, C., Xu, A., Gottlieb, M. D., Nickla, D. L., Marran, L. et al. (1995). Moving the retina: choroidal modulation of refractive state. Vision Research, 35(1), 37-50.
Wallman, J., Winawer, J. (2004). Homeostasis of the eye growth and the question of myopia. Neuron, 43, 447-468.
Weiss, S. & Schaeffel, F. (1993). Diurnal growth rhythms in the chicken eye: relation to myopia development and retinal dopamine levels. Journal of Comparative Physiology A: Neuroethology, Sensory, Neural, and Behavioral Physiology, 172(3), 263-270.
Wensor, M., McCarty, C. A. & Taylor, H. R. (1999). Prevalence and risk factors of myopia in Victoria, Australia. Archives of Ophthalmology, 117(5), 658-663.
Wienke, R. E. (1960). Refractive error and the green/red ratio. Journal of the Optical Society of America, 50(4), 341-341.
Wiesel, T. N. & Raviola, E. (1977). Myopia and eye enlargement after neonatal lid fusion in monkeys. Nature Publishing Group, 266, 66-68.
Wildsoet, C. (1997). Active emmetropization—evidence for its existence and ramifications for clinical practice. Ophthalmic and Physiological Optics, 17(4), 279-290.
Wildsoet, C. & Wallman, J. (1995). Choroidal and scleral mechanisms of compensation for spectacle lenses in chicks. Vision Research, 35(9), 1175-1194.
Wildsoet, C. F. (2003). Neural pathways subserving negative lens-induced emmetropization in chicks-Insights from selective lesions of the optic nerve and ciliary nerve. Current Eye Research, 27(6), 371-385.
Wilson, A. & Woo, G. (1989). A review of the prevalence and causes of myopia. Singapore Med J, 30(5), 479-484.
Winn, B., Shin, E., Odel, J., Greenstein, V., Hood, D. (2005). Interpreting the multifocal visual evoked potential: the effects of refractive errors, cataracts, and fixation errors. British Journal of Ophthalmology, 89(3), 340-344.
Wollensak, G., Iomdina, E., Dittert, D. D., Salamatina, O. & Stoltenburg, G. (2005). Cross‐linking of scleral collagen in the rabbit using riboflavin and UVA. Acta Ophthalmologica
Bibliography
95
Scandinavica, 83(4), 477-482.
Wong, L., Coggon, D., Cruddas, M. & Hwang, C. (1993). Education, reading, and familial tendency as risk factors for myopia in Hong Kong fishermen. Journal of Epidemiology and Community Health, 47(1), 50-53.
Wong, T. Y., Foster, P. J., Hee, J., Ng, T. P., Tielsch, J. M., Chew, S. J. et al. (2000). Prevalence and risk factors for refractive errors in adult Chinese in Singapore. Investigative Ophthalmology and Visual Science, 41(9), 2486-2494.
Wu, H. M., Seet, B., Yap, E. P. H., Saw, S. M., Lim, T. H. & Chia, K. S. (2001). Does education explain ethnic differences in myopia prevalence? A population-based study of young adult males in Singapore. Optometry and Vision Science, 78(4), 234-239.
Xu, L., Li, J., Cui, T., Hu, A., Fan, G., Zhang, R. et al. (2005). Refractive error in urban and rural adult Chinese in Beijing. Ophthalmology, 112(10), 1676-1683.
Yamauchi Y, Yatsu K, Kuchenbecker J, Neitz M, Neitz J. (2013). L:M Cone Ratio of Japanese Derived with ERG Flicker Photometry Method. The Association for Research in Vision and Ophthalmology, 619-B0190.
Young, T. L., Ronan, S. M., Alvear, A. B., Wildenberg, S. C., Oetting, W. S., Atwood, L. D. et al. (1998). A second locus for familial high myopia maps to chromosome 12q. The American Journal of Human Genetics, 63(5), 1419-1424.
Young, T. L., Ronan, S. M., Drahozal, L. A., Wildenberg, S. C., Alvear, A. B., Oetting, W. S. et al. (1998). Evidence that a locus for familial high myopia maps to chromosome 18p. The American Journal of Human Genetics, 63(1), 109-119.
Zele, A. J., Cao, D. & Pokorny, J. (2008). Rod-cone interactions and the temporal impulse response of the cone pathway. Vision Research, 48(26), 2593-2598.
Zele, A. J., Kremers, J. & Feigl, B. (2012). Mesopic rod and S-cone interactions revealed by modulation thresholds. Journal of the Optical Society of America A, 29(2), A19-A26.
Zele, A. J. & Vingrys, A. J. (2005). Cathode-ray-tube monitor artefacts in neurophysiology. Journal of Neuroscience Methods, 141(1), 1-7.
Zhang, Q., Guo, X., Xiao, X., Jia, X., Li, S. & Hejtmancik, J. F. (2005). A new locus for autosomal dominant high myopia maps to 4q22-q27 between D4S1578 and D4S1612. Molecular Vision, 11, 554-560.
Zhao, J., Pan, X., Sui, R., Munoz, S. R., Sperduto, R. D. & Ellwein, L. B. (2000). Refractive error study in children: results from Shunyi District, China. American Journal of Ophthalmology, 129(4), 427-435.
Appendix I
96
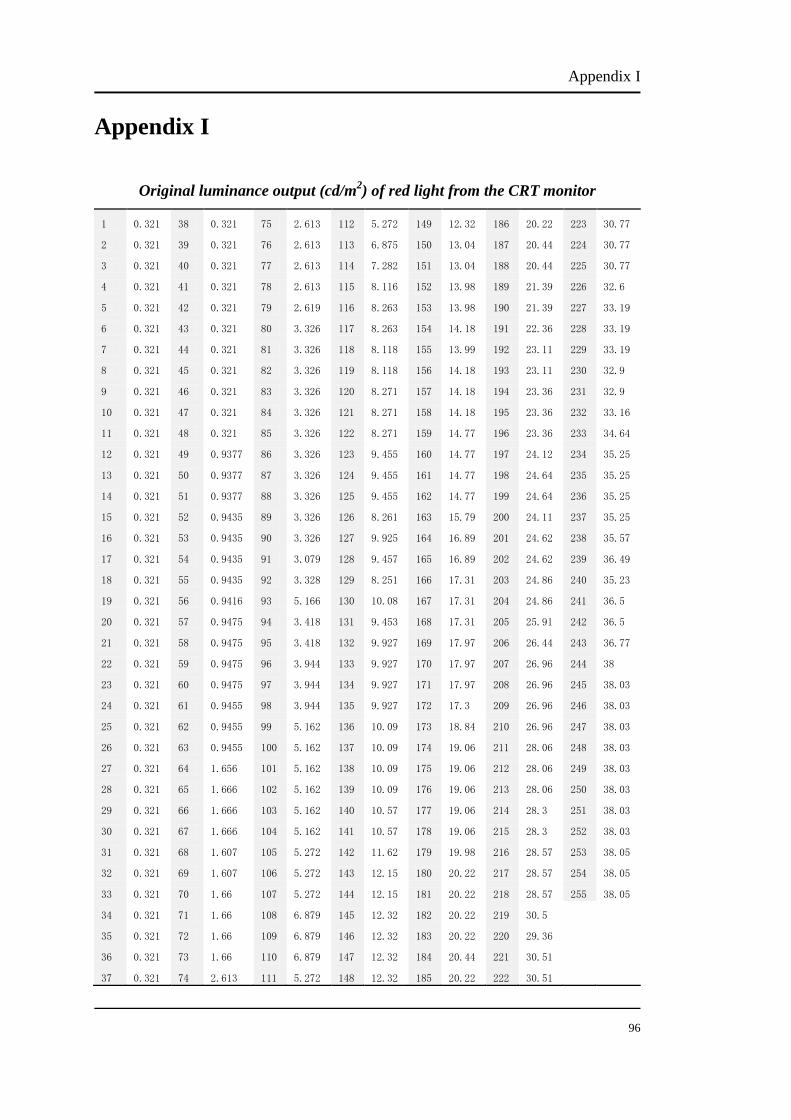
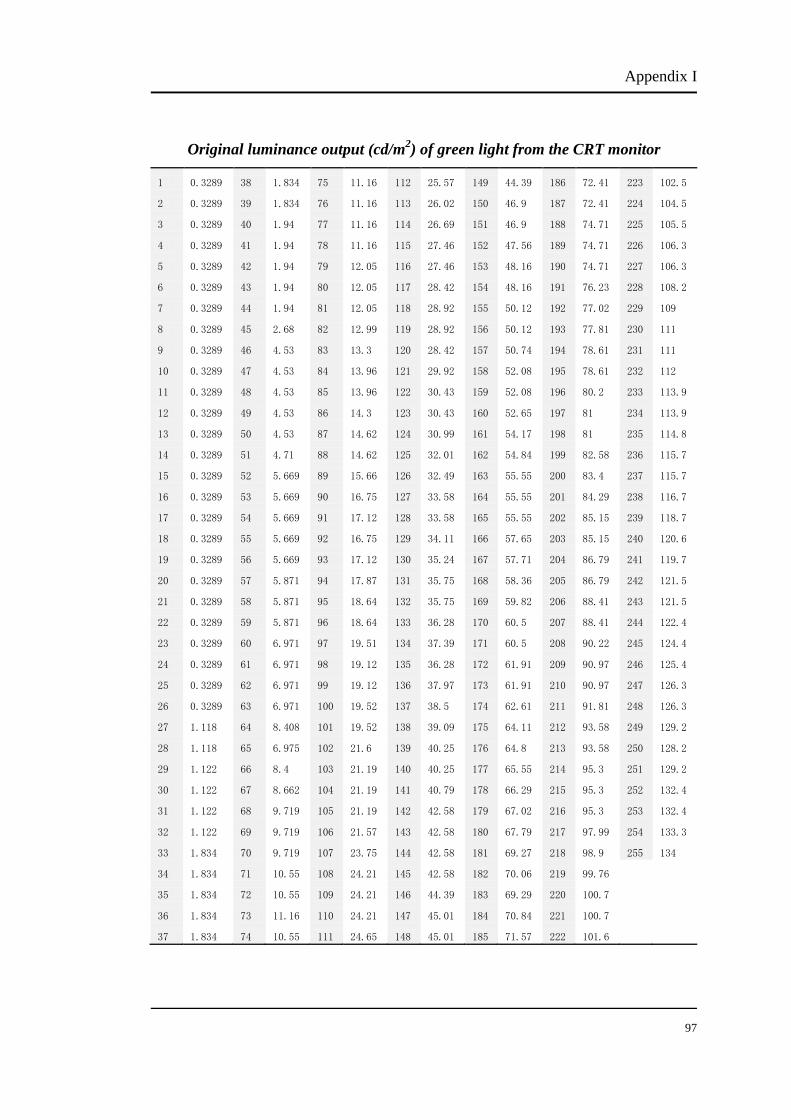
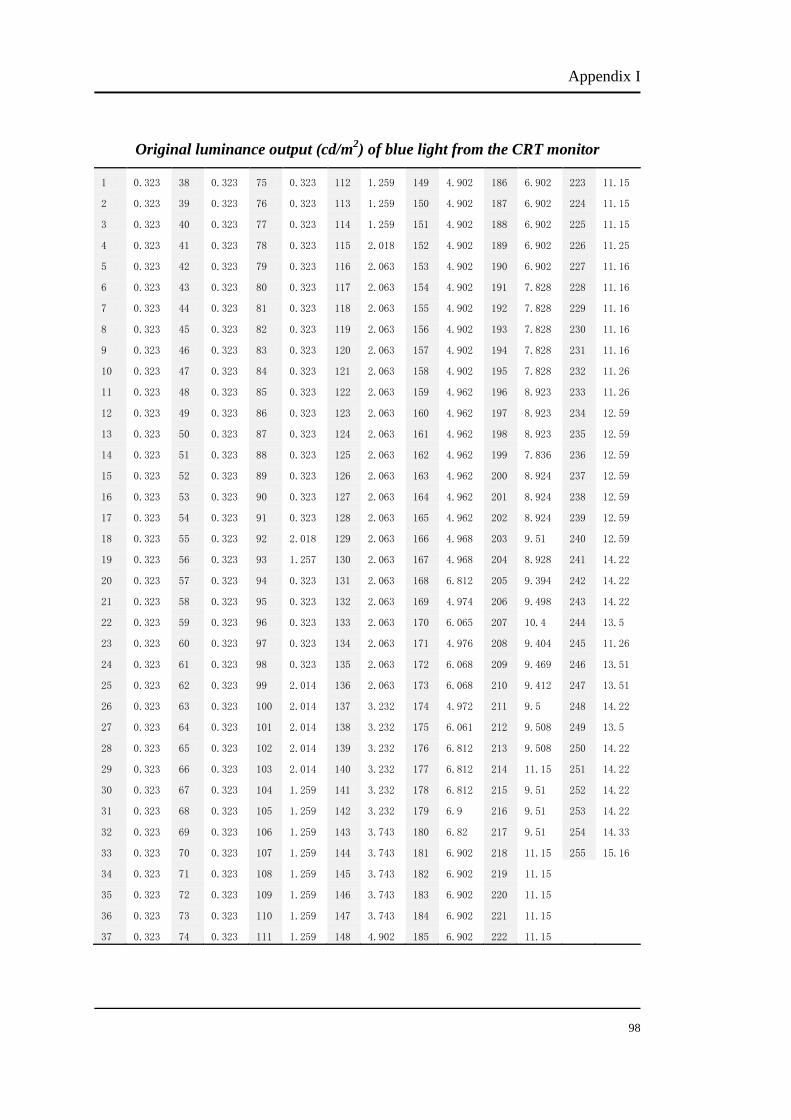
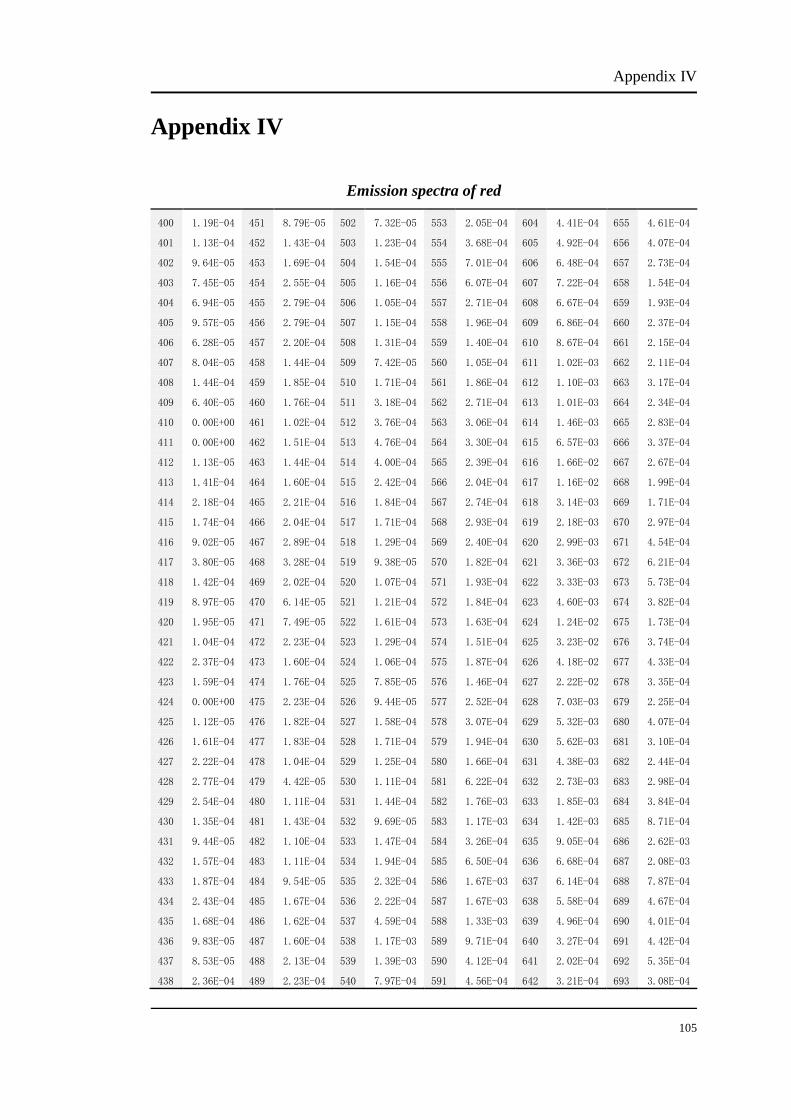
Appendix I
Original luminance output (cd/m2) of red light from the CRT monitor