18
Conference call First nine months of 2019
Conference callFirst nine months of 2019
Slide 2
Agenda
Conference call First nine months of 2019
Highlights and key events
R&D update
Financials and outlook
Sales update
Slide 3
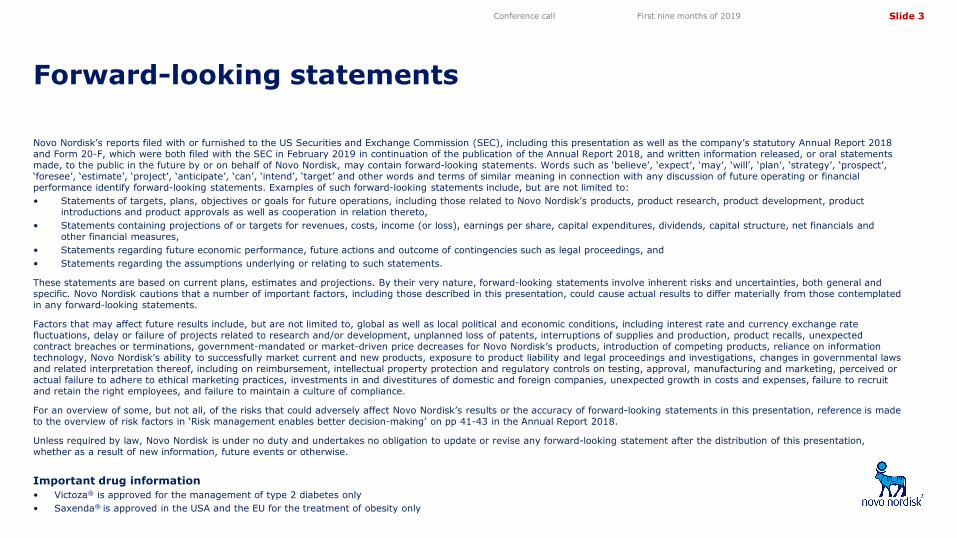
Forward-looking statements
Novo Nordisk’s reports filed with or furnished to the US Securities and Exchange Commission (SEC), including this presentation as well as the company’s statutory Annual Report 2018 and Form 20-F, which were both filed with the SEC in February 2019 in continuation of the publication of the Annual Report 2018, and written information released, or oral statements made, to the public in the future by or on behalf of Novo Nordisk, may contain forward-looking statements. Words such as ‘believe’, ‘expect’, ‘may’, ‘will’, ‘plan’, ‘strategy’, ‘prospect’, ‘foresee’, ‘estimate’, ‘project’, ‘anticipate’, ‘can’, ‘intend’, ‘target’ and other words and terms of similar meaning in connection with any discussion of future operating or financial performance identify forward-looking statements. Examples of such forward-looking statements include, but are not limited to: • Statements of targets, plans, objectives or goals for future operations, including those related to Novo Nordisk’s products, product research, product development, product
introductions and product approvals as well as cooperation in relation thereto,• Statements containing projections of or targets for revenues, costs, income (or loss), earnings per share, capital expenditures, dividends, capital structure, net financials and
other financial measures,• Statements regarding future economic performance, future actions and outcome of contingencies such as legal proceedings, and• Statements regarding the assumptions underlying or relating to such statements.
These statements are based on current plans, estimates and projections. By their very nature, forward-looking statements involve inherent risks and uncertainties, both general and specific. Novo Nordisk cautions that a number of important factors, including those described in this presentation, could cause actual results to differ materially from those contemplated in any forward-looking statements.
Factors that may affect future results include, but are not limited to, global as well as local political and economic conditions, including interest rate and currency exchange rate fluctuations, delay or failure of projects related to research and/or development, unplanned loss of patents, interruptions of supplies and production, product recalls, unexpected contract breaches or terminations, government-mandated or market-driven price decreases for Novo Nordisk’s products, introduction of competing products, reliance on information technology, Novo Nordisk’s ability to successfully market current and new products, exposure to product liability and legal proceedings and investigations, changes in governmental laws and related interpretation thereof, including on reimbursement, intellectual property protection and regulatory controls on testing, approval, manufacturing and marketing, perceived or actual failure to adhere to ethical marketing practices, investments in and divestitures of domestic and foreign companies, unexpected growth in costs and expenses, failure to recruit and retain the right employees, and failure to maintain a culture of compliance.
For an overview of some, but not all, of the risks that could adversely affect Novo Nordisk’s results or the accuracy of forward-looking statements in this presentation, reference is made to the overview of risk factors in ‘Risk management enables better decision-making’ on pp 41-43 in the Annual Report 2018.
Unless required by law, Novo Nordisk is under no duty and undertakes no obligation to update or revise any forward-looking statement after the distribution of this presentation, whether as a result of new information, future events or otherwise.
Important drug information• Victoza® is approved for the management of type 2 diabetes only• Saxenda® is approved in the USA and the EU for the treatment of obesity only
Conference call First nine months of 2019
Slide 4
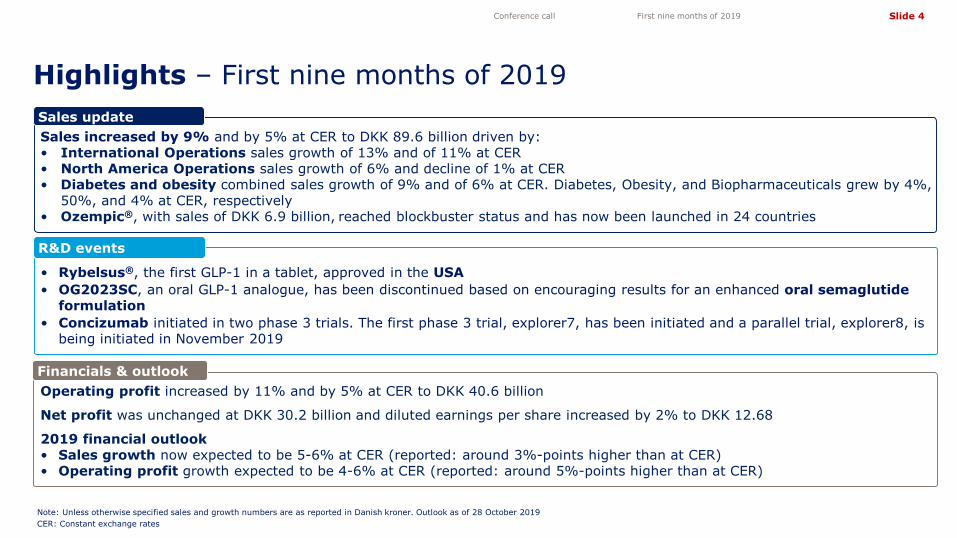
Sales increased by 9% and by 5% at CER to DKK 89.6 billion driven by:• International Operations sales growth of 13% and of 11% at CER• North America Operations sales growth of 6% and decline of 1% at CER• Diabetes and obesity combined sales growth of 9% and of 6% at CER. Diabetes, Obesity, and Biopharmaceuticals grew by 4%,
50%, and 4% at CER, respectively• Ozempic®, with sales of DKK 6.9 billion, reached blockbuster status and has now been launched in 24 countries
Sales update
Highlights – First nine months of 2019
Conference call First nine months of 2019
Note: Unless otherwise specified sales and growth numbers are as reported in Danish kroner. Outlook as of 28 October 2019 CER: Constant exchange rates
• Rybelsus®, the first GLP-1 in a tablet, approved in the USA• OG2023SC, an oral GLP-1 analogue, has been discontinued based on encouraging results for an enhanced oral semaglutide
formulation• Concizumab initiated in two phase 3 trials. The first phase 3 trial, explorer7, has been initiated and a parallel trial, explorer8, is
being initiated in November 2019
R&D events
Operating profit increased by 11% and by 5% at CER to DKK 40.6 billion
Net profit was unchanged at DKK 30.2 billion and diluted earnings per share increased by 2% to DKK 12.68
2019 financial outlook • Sales growth now expected to be 5-6% at CER (reported: around 3%-points higher than at CER)• Operating profit growth expected to be 4-6% at CER (reported: around 5%-points higher than at CER)
Financials & outlook
Slide 5
05
101520253035404550
IO RegionEurope
RegionAAMEO
RegionChina
RegionJ&K
RegionLATAM
NAO
11%
Reported sales split for first nine months of 2019
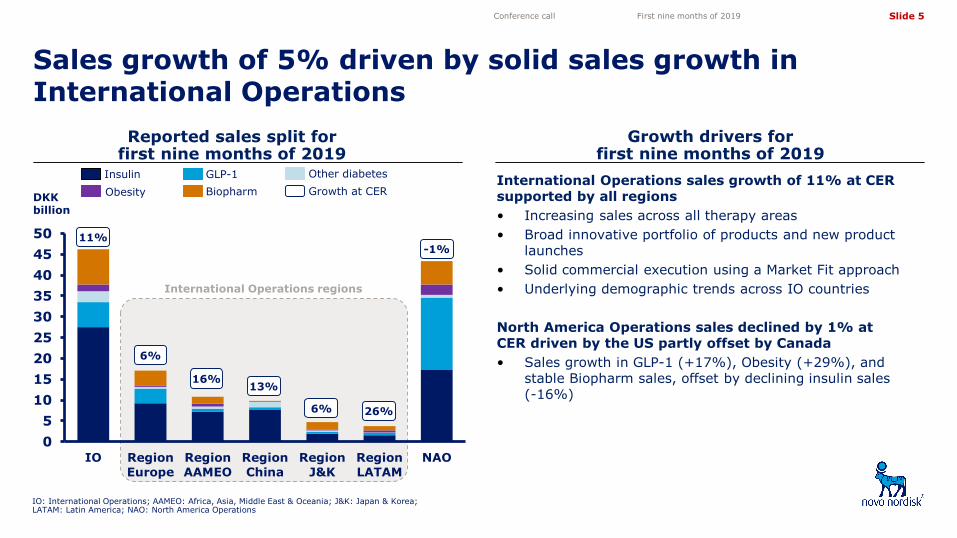
Sales growth of 5% driven by solid sales growth in International Operations
Conference call First nine months of 2019
GLP-1 Other diabetesInsulinBiopharmDKK
billion
-1%
6%
16%13%
6% 26%
Obesity
International Operations regions
IO: International Operations; AAMEO: Africa, Asia, Middle East & Oceania; J&K: Japan & Korea; LATAM: Latin America; NAO: North America Operations
Growth at CER
Growth drivers for first nine months of 2019
International Operations sales growth of 11% at CER supported by all regions • Increasing sales across all therapy areas • Broad innovative portfolio of products and new product
launches• Solid commercial execution using a Market Fit approach• Underlying demographic trends across IO countries
North America Operations sales declined by 1% at CER driven by the US partly offset by Canada• Sales growth in GLP-1 (+17%), Obesity (+29%), and
stable Biopharm sales, offset by declining insulin sales (-16%)
Slide 6
-2-1012345678
Total Insulin GLP-1 Obesity Biopharm
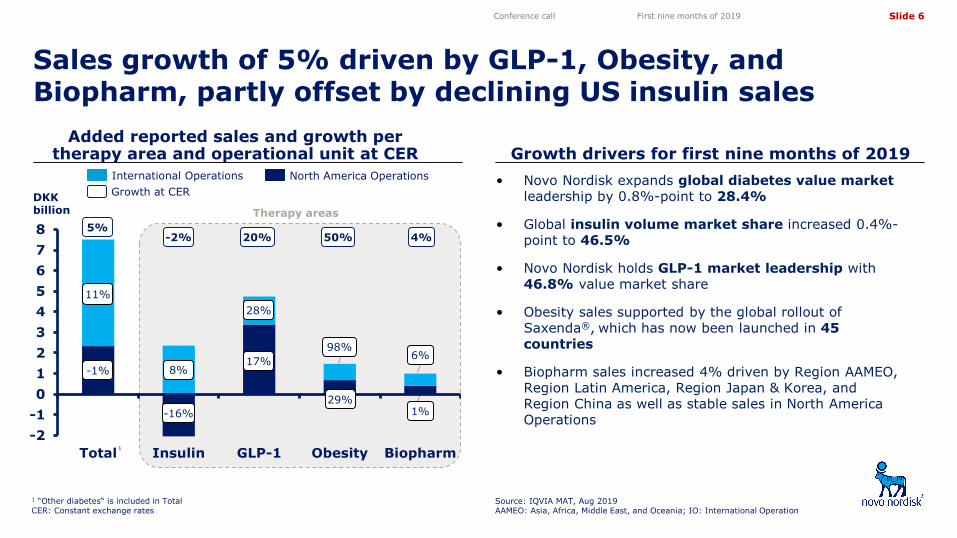
Sales growth of 5% driven by GLP-1, Obesity, and Biopharm, partly offset by declining US insulin sales
Conference call First nine months of 2019
Added reported sales and growth per therapy area and operational unit at CER
International Operations North America Operations
1 “Other diabetes“ is included in TotalCER: Constant exchange rates
-1%
11%
8%
-16%
17%
28%
29%
98%6%
1%
1
5%-2% 20% 50% 4%
Growth at CER• Novo Nordisk expands global diabetes value market
leadership by 0.8%-point to 28.4%
• Global insulin volume market share increased 0.4%-point to 46.5%
• Novo Nordisk holds GLP-1 market leadership with 46.8% value market share
• Obesity sales supported by the global rollout of Saxenda®, which has now been launched in 45 countries
• Biopharm sales increased 4% driven by Region AAMEO, Region Latin America, Region Japan & Korea, and Region China as well as stable sales in North America Operations
Growth drivers for first nine months of 2019
Therapy areas
Source: IQVIA MAT, Aug 2019AAMEO: Asia, Africa, Middle East, and Oceania; IO: International Operation
DKKbillion
Slide 7
28.4% 22.0% 30.8%
0%
5%
10%
15%
20%
25%
30%
35%
Global IO NAO
Source: IQVIA MAT, Aug 2019IO: International Operations; NAO: North America Operations
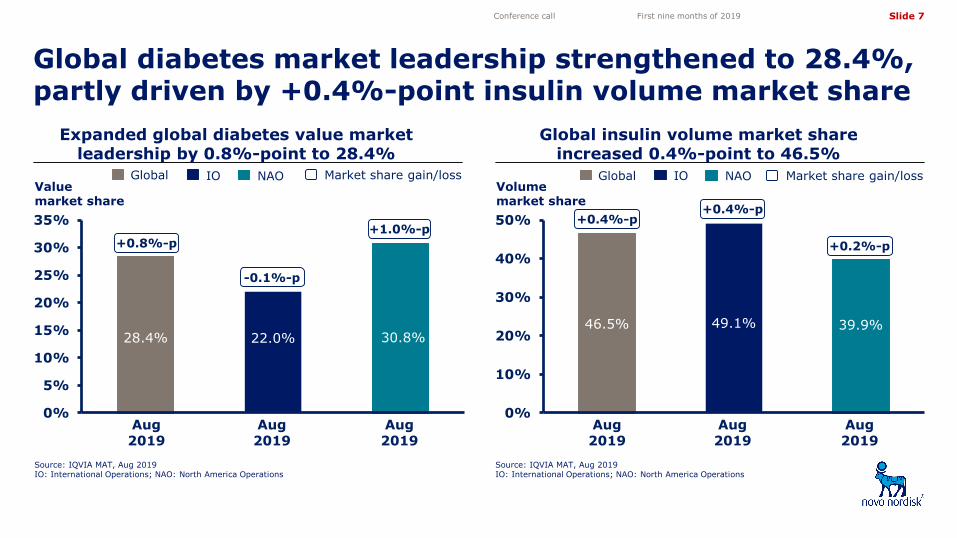
Expanded global diabetes value market leadership by 0.8%-point to 28.4%
Global insulin volume market share increased 0.4%-point to 46.5%
Global diabetes market leadership strengthened to 28.4%, partly driven by +0.4%-point insulin volume market share
Source: IQVIA MAT, Aug 2019IO: International Operations; NAO: North America Operations
Conference call First nine months of 2019
46.5% 49.1% 39.9%
0%
10%
20%
30%
40%
50%
Global IO NAO
+0.8%-p+1.0%-p
+0.4%-p+0.4%-p
+0.2%-p
Value market share
Volume market share
Market share gain/lossGlobal IO NAO
Aug 2019
Aug 2019
Aug 2019
Aug 2019
Aug 2019
Aug 2019
Market share gain/lossGlobal IO NAO
-0.1%-p
Slide 8
38%
37%
16%
8%
54%
0%
10%
20%
30%
40%
50%
60%
45%
19%
27%
9%
47%
0%
10%
20%
30%
40%
50%
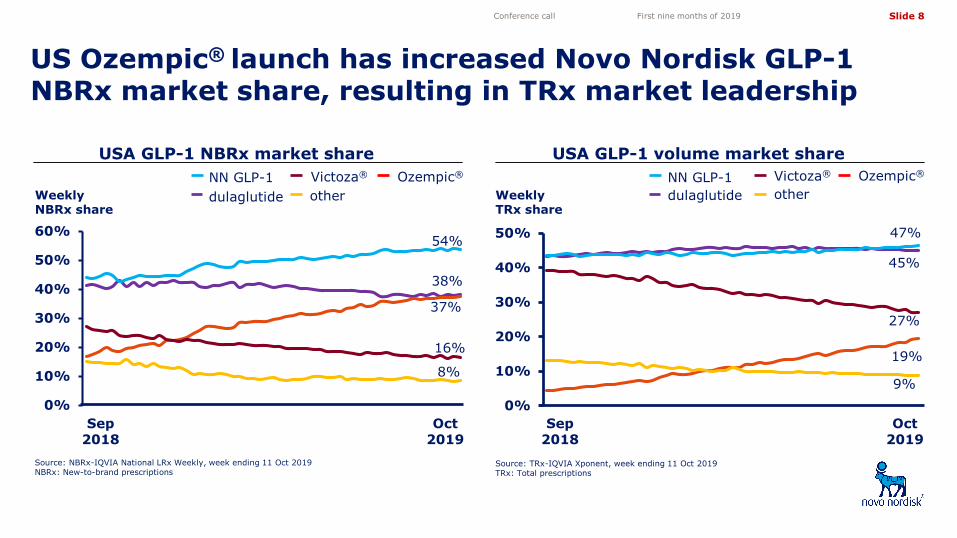
USA GLP-1 NBRx market share
US Ozempic® launch has increased Novo Nordisk GLP-1 NBRx market share, resulting in TRx market leadership
Conference call First nine months of 2019
USA GLP-1 volume market share
WeeklyTRx share
Source: TRx-IQVIA Xponent, week ending 11 Oct 2019TRx: Total prescriptions
Sep2018
Oct2019
Weekly NBRx share
Source: NBRx-IQVIA National LRx Weekly, week ending 11 Oct 2019NBRx: New-to-brand prescriptions
NN GLP-1 Victoza® Ozempic®
dulaglutide otherNN GLP-1 Victoza® Ozempic®
dulaglutide other
Sep2018
Oct2019
Slide 9
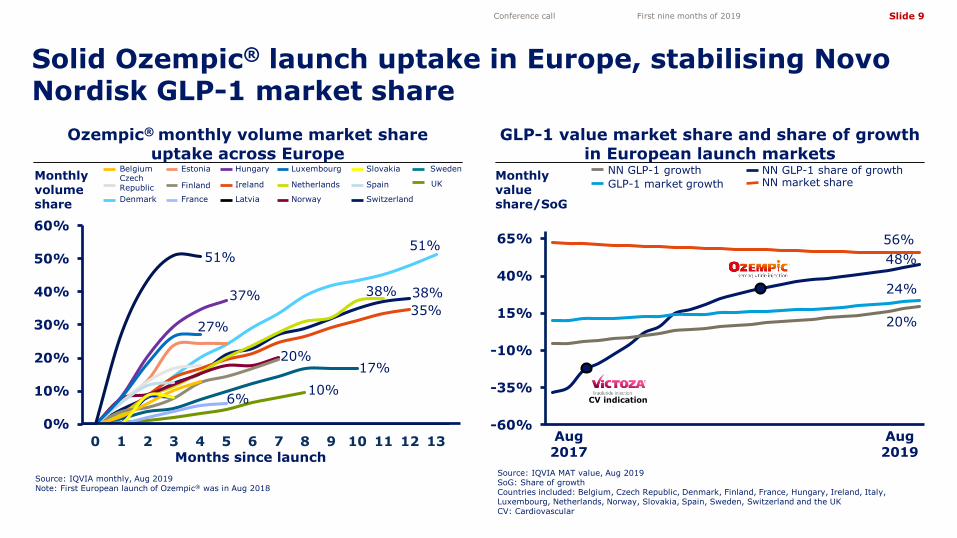
56%48%
24%
20%
-60%
-35%
-10%
15%
40%
65%
Solid Ozempic® launch uptake in Europe, stabilising Novo Nordisk GLP-1 market share
Conference call First nine months of 2019
NN GLP-1 share of growthGLP-1 market growthNN GLP-1 growth
NN market share
Aug 2017
Aug2019
Monthly value share/SoG
CV indication
Ozempic® monthly volume market share uptake across Europe
GLP-1 value market share and share of growth in European launch markets
Source: IQVIA MAT value, Aug 2019SoG: Share of growth Countries included: Belgium, Czech Republic, Denmark, Finland, France, Hungary, Ireland, Italy, Luxembourg, Netherlands, Norway, Slovakia, Spain, Sweden, Switzerland and the UK CV: Cardiovascular
Denmark Switzerland
Ireland Netherlands
Norway
Finland UK
Source: IQVIA monthly, Aug 2019Note: First European launch of Ozempic® was in Aug 2018
Belgium Hungary
France
Months since launch
51%
38%35%
38%
17%10%
20%
6%
37%
27%
51%
0%
10%
20%
30%
40%
50%
60%
0 1 2 3 4 5 6 7 8 9 10 11 12 13
Latvia
LuxembourgEstoniaCzech Republic Spain
SlovakiaMonthly volume share
Sweden
Slide 10
0.0
0.4
0.8
1.2
1.6
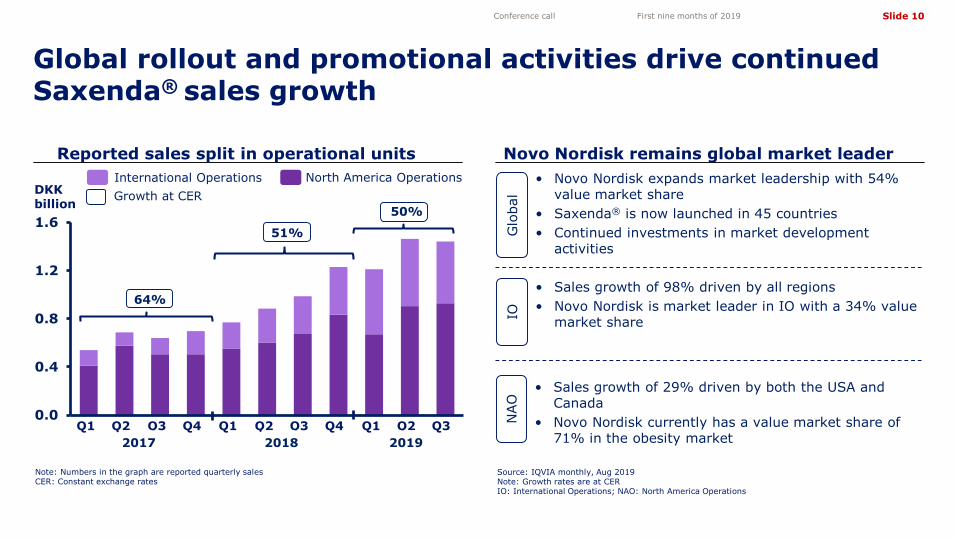
Reported sales split in operational units Novo Nordisk remains global market leader
Global rollout and promotional activities drive continued Saxenda® sales growth
Conference call First nine months of 2019
DKK billion
Source: IQVIA monthly, Aug 2019Note: Growth rates are at CERIO: International Operations; NAO: North America Operations
Q2 Q3 Q4 Q2
North America OperationsInternational Operations
ION
AO
• Sales growth of 98% driven by all regions • Novo Nordisk is market leader in IO with a 34% value
market share
• Sales growth of 29% driven by both the USA and Canada
• Novo Nordisk currently has a value market share of 71% in the obesity market
Glo
bal
• Novo Nordisk expands market leadership with 54% value market share
• Saxenda® is now launched in 45 countries• Continued investments in market development
activities
Growth at CER
Q1Q3 Q1Q4Q2Q1
64%
50%
Note: Numbers in the graph are reported quarterly salesCER: Constant exchange rates
51%
2017 2018 2019Q3
Slide 11
0.0
0.2
0.4
0.6
0.8
1.0
Haemophilia
Conference call First nine months of 2019
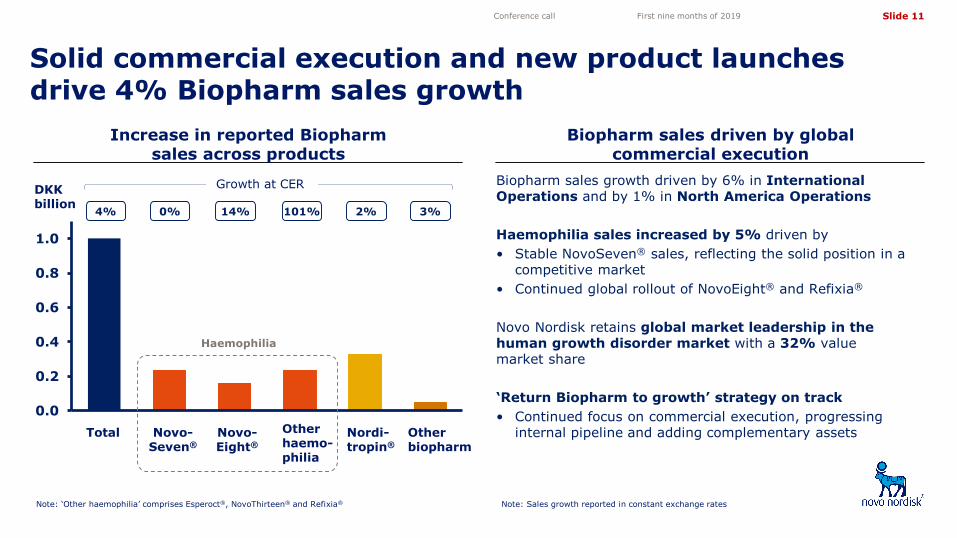
Solid commercial execution and new product launches drive 4% Biopharm sales growth
Increase in reported Biopharmsales across products
Biopharm sales driven by global commercial execution
Biopharm sales growth driven by 6% in International Operations and by 1% in North America Operations
Haemophilia sales increased by 5% driven by• Stable NovoSeven® sales, reflecting the solid position in a
competitive market• Continued global rollout of NovoEight® and Refixia®
Novo Nordisk retains global market leadership in the human growth disorder market with a 32% value market share
‘Return Biopharm to growth’ strategy on track• Continued focus on commercial execution, progressing
internal pipeline and adding complementary assets
Note: ‘Other haemophilia’ comprises Esperoct®, NovoThirteen® and Refixia®
Total Novo-Seven®
Novo-Eight®
Other haemo-philia
Nordi-tropin®
Other biopharm
4% 0% 14% 101% 2% 3%
Growth at CERDKK billion
Note: Sales growth reported in constant exchange rates
Slide 12
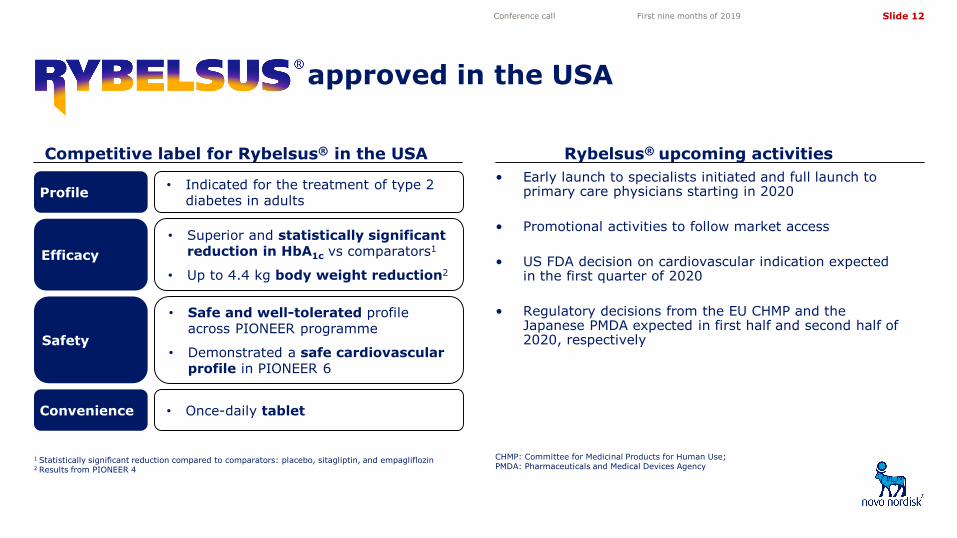
• Early launch to specialists initiated and full launch to primary care physicians starting in 2020
• Promotional activities to follow market access
• US FDA decision on cardiovascular indication expected in the first quarter of 2020
• Regulatory decisions from the EU CHMP and the Japanese PMDA expected in first half and second half of 2020, respectively
Competitive label for Rybelsus® in the USA Rybelsus® upcoming activities
approved in the USA
Conference call First nine months of 2019
• Once-daily tablet
Efficacy
Safety
• Indicated for the treatment of type 2 diabetes in adults
• Safe and well-tolerated profile across PIONEER programme
• Demonstrated a safe cardiovascular profile in PIONEER 6
Convenience
Profile
• Superior and statistically significant reduction in HbA1c vs comparators1
• Up to 4.4 kg body weight reduction2
1 Statistically significant reduction compared to comparators: placebo, sitagliptin, and empagliflozin2 Results from PIONEER 4
CHMP: Committee for Medicinal Products for Human Use;PMDA: Pharmaceuticals and Medical Devices Agency
Slide 13
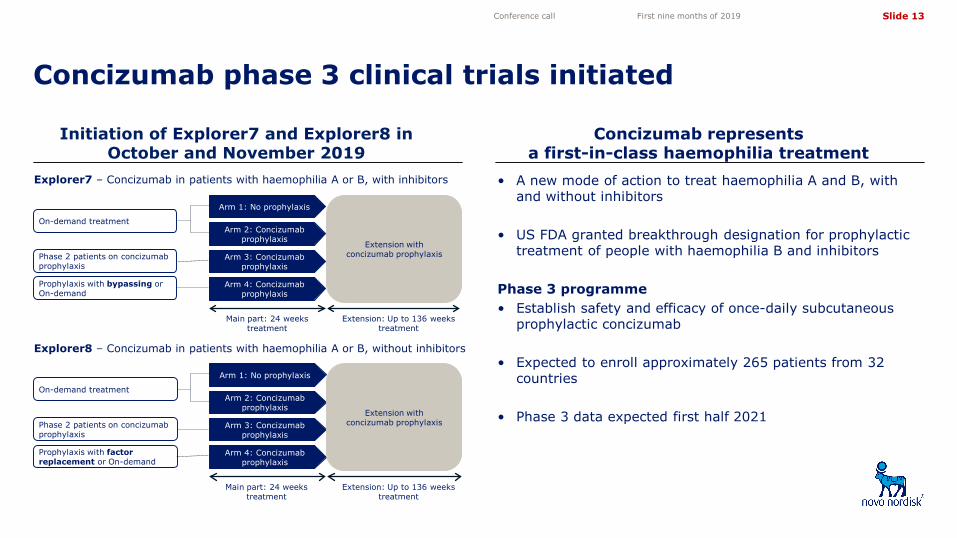
Concizumab represents a first-in-class haemophilia treatment
Initiation of Explorer7 and Explorer8 in October and November 2019
Concizumab phase 3 clinical trials initiated
Conference call First nine months of 2019
Explorer7 – Concizumab in patients with haemophilia A or B, with inhibitors
Explorer8 – Concizumab in patients with haemophilia A or B, without inhibitors
On-demand treatment
Phase 2 patients on concizumabprophylaxis
Prophylaxis with bypassing or On-demand
Arm 1: No prophylaxis
Arm 2: Concizumabprophylaxis
Arm 3: Concizumabprophylaxis
Arm 4: Concizumabprophylaxis
Main part: 24 weeks treatment
Extension: Up to 136 weeks treatment
On-demand treatment
Phase 2 patients on concizumabprophylaxis
Prophylaxis with factor replacement or On-demand
Arm 1: No prophylaxis
Arm 2: Concizumabprophylaxis
Arm 3: Concizumabprophylaxis
Arm 4: Concizumabprophylaxis
Main part: 24 weeks treatment
Extension: Up to 136 weeks treatment
• A new mode of action to treat haemophilia A and B, with and without inhibitors
• US FDA granted breakthrough designation for prophylactic treatment of people with haemophilia B and inhibitors
Phase 3 programme• Establish safety and efficacy of once-daily subcutaneous
prophylactic concizumab
• Expected to enroll approximately 265 patients from 32 countries
• Phase 3 data expected first half 2021
Extension with concizumab prophylaxis
Extension with concizumab prophylaxis
Slide 14
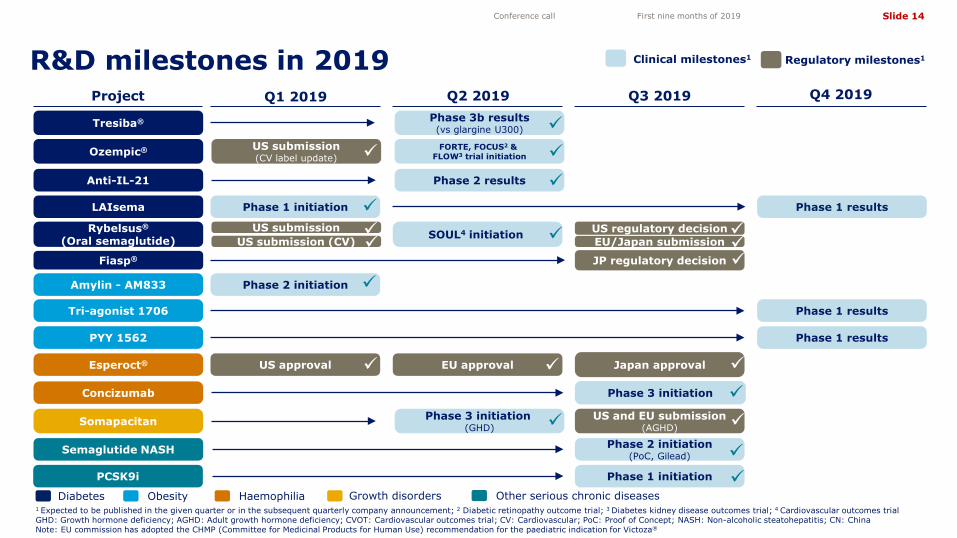
R&D milestones in 2019Project Q1 2019 Q2 2019 Q3 2019 Q4 2019
Rybelsus®
(Oral semaglutide)
Clinical milestones1 Regulatory milestones1
√
Conference call First nine months of 2019
1 Expected to be published in the given quarter or in the subsequent quarterly company announcement; 2 Diabetic retinopathy outcome trial; 3 Diabetes kidney disease outcomes trial; 4 Cardiovascular outcomes trialGHD: Growth hormone deficiency; AGHD: Adult growth hormone deficiency; CVOT: Cardiovascular outcomes trial; CV: Cardiovascular; PoC: Proof of Concept; NASH: Non-alcoholic steatohepatitis; CN: ChinaNote: EU commission has adopted the CHMP (Committee for Medicinal Products for Human Use) recommendation for the paediatric indication for Victoza®
Phase 1 initiationLAIsema
SOUL4 initiation EU/Japan submission
Phase 1 results
US regulatory decision
Anti-IL-21 Phase 2 results
Tresiba® Phase 3b results(vs glargine U300)
Ozempic® US submission(CV label update)
Somapacitan
PYY 1562
Esperoct®
Tri-agonist 1706
US approval EU approval
Phase 3 initiation (GHD)
US and EU submission(AGHD)
Phase 1 results
Phase 1 results
Concizumab Phase 3 initiation
US submission (CV)US submission
FORTE, FOCUS2 & FLOW3 trial initiation
Fiasp® JP regulatory decision
Japan approval
Semaglutide NASH Phase 2 initiation(PoC, Gilead)
Diabetes Haemophilia Growth disordersObesity Other serious chronic diseases
Amylin - AM833 Phase 2 initiation
PCSK9i Phase 1 initiation
Slide 15
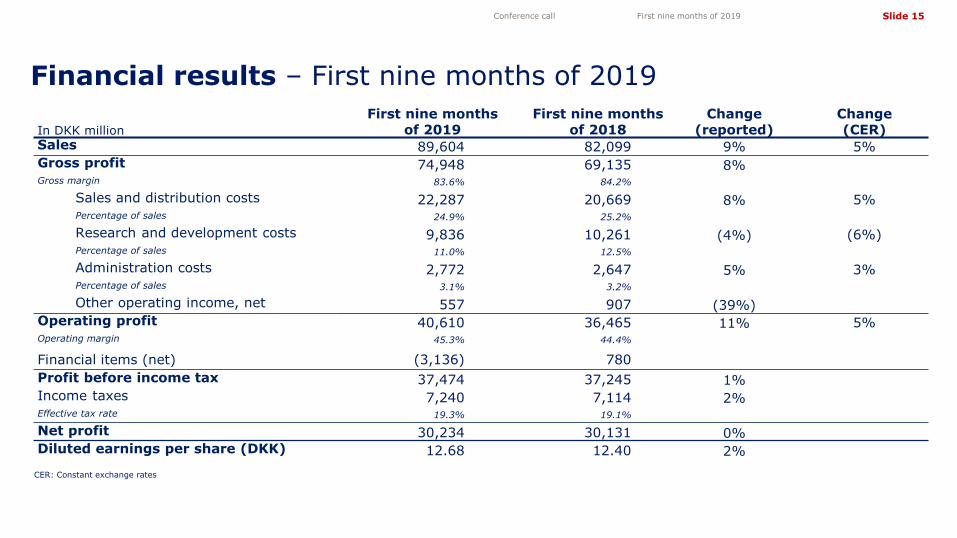
Financial results – First nine months of 2019
Conference call First nine months of 2019
In DKK millionFirst nine months
of 2019First nine months
of 2018Change
(reported)Change(CER)
Sales 89,604 82,099 9% 5%Gross profit 74,948 69,135 8%Gross margin 83.6% 84.2%
Sales and distribution costs 22,287 20,669 8% 5%Percentage of sales 24.9% 25.2%
Research and development costs 9,836 10,261 (4%) (6%)Percentage of sales 11.0% 12.5%
Administration costs 2,772 2,647 5% 3%Percentage of sales 3.1% 3.2%
Other operating income, net 557 907 (39%)Operating profit 40,610 36,465 11% 5%Operating margin 45.3% 44.4%
Financial items (net) (3,136) 780Profit before income tax 37,474 37,245 1%Income taxes 7,240 7,114 2%Effective tax rate 19.3% 19.1%
Net profit 30,234 30,131 0%Diluted earnings per share (DKK) 12.68 12.40 2%
CER: Constant exchange rates
Slide 16
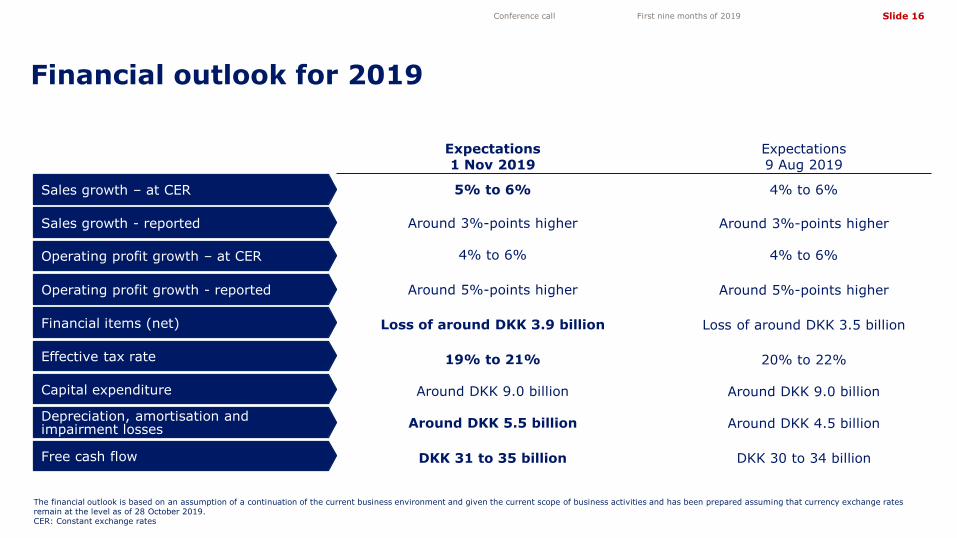
Financial outlook for 2019
The financial outlook is based on an assumption of a continuation of the current business environment and given the current scope of business activities and has been prepared assuming that currency exchange rates remain at the level as of 28 October 2019.CER: Constant exchange rates
Conference call First nine months of 2019
Sales growth – at CER
Sales growth - reported
Operating profit growth – at CER
Operating profit growth - reported
Financial items (net)
Effective tax rate
Capital expenditure
Free cash flow
Depreciation, amortisation and impairment losses
Expectations1 Nov 2019
5% to 6%
4% to 6%
Loss of around DKK 3.9 billion
19% to 21%
Around DKK 9.0 billion
Around DKK 5.5 billion
DKK 31 to 35 billion
Around 3%-points higher
Around 5%-points higher
Expectations9 Aug 2019
4% to 6%
4% to 6%
Loss of around DKK 3.5 billion
20% to 22%
Around DKK 9.0 billion
Around DKK 4.5 billion
DKK 30 to 34 billion
Around 3%-points higher
Around 5%-points higher
Slide 17
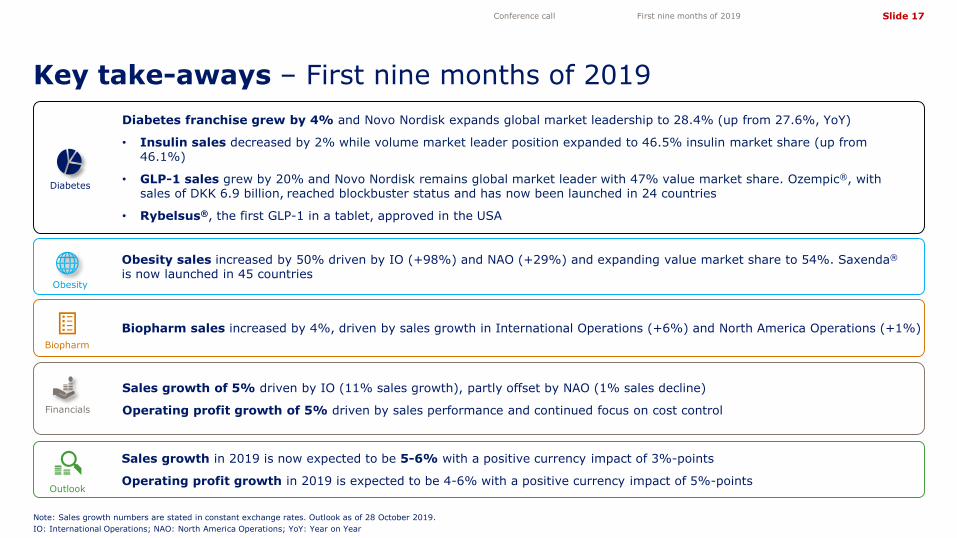
Diabetes franchise grew by 4% and Novo Nordisk expands global market leadership to 28.4% (up from 27.6%, YoY)
• Insulin sales decreased by 2% while volume market leader position expanded to 46.5% insulin market share (up from 46.1%)
• GLP-1 sales grew by 20% and Novo Nordisk remains global market leader with 47% value market share. Ozempic®, with sales of DKK 6.9 billion, reached blockbuster status and has now been launched in 24 countries
• Rybelsus®, the first GLP-1 in a tablet, approved in the USA
Sales growth of 5% driven by IO (11% sales growth), partly offset by NAO (1% sales decline)
Operating profit growth of 5% driven by sales performance and continued focus on cost control
Obesity sales increased by 50% driven by IO (+98%) and NAO (+29%) and expanding value market share to 54%. Saxenda®
is now launched in 45 countries
Key take-aways – First nine months of 2019
Conference call First nine months of 2019
Diabetes
Obesity
Note: Sales growth numbers are stated in constant exchange rates. Outlook as of 28 October 2019. IO: International Operations; NAO: North America Operations; YoY: Year on Year
Financials
Biopharm sales increased by 4%, driven by sales growth in International Operations (+6%) and North America Operations (+1%)Biopharm
Sales growth in 2019 is now expected to be 5-6% with a positive currency impact of 3%-points
Operating profit growth in 2019 is expected to be 4-6% with a positive currency impact of 5%-pointsOutlook
Slide 18
Share information Investor Relations contacts
Investor contact information
Conference call First nine months of 2019
Novo Nordisk’s B shares are listed on the stock exchange in Copenhagen under the symbol ‘NOVO B’. Its ADRs are listed on the New York Stock Exchange under the symbol ‘NVO’.
For further company information, visit Novo Nordisk on: www.novonordisk.com
Peter Hugreffe Ankersen +45 3075 9085 [email protected]
Valdemar Borum Svarrer +45 3079 0301 [email protected]
Ann Søndermølle Rendbæk +45 3075 2253 [email protected]
Mark Joseph Root +45 3079 4211 [email protected]
Kristoffer Due Berg (USA) +1 609 235 2989 [email protected]
Novo Nordisk A/S Investor Relations Novo Allé DK-2880 Bagsværd
Upcoming events20 Nov 2019 Capital Markets Day
05 Feb 2020 Financial statement for the full year of 2019


