16
CONFERENCE CALL CONFERENCE CALL FIRST QUARTER FIRST QUARTER May 12, 2000 May 12, 2000 Available at our site www.itau.com.br/ri Available at our site www.itau.com.br/ri
| Date post: | 21-Dec-2015 |
| Category: |
Documents |
| View: | 214 times |
| Download: | 0 times |

CONFERENCE CALLCONFERENCE CALLFIRST QUARTERFIRST QUARTER
May 12, 2000May 12, 2000
Available at our site www.itau.com.br/riAvailable at our site www.itau.com.br/ri
2
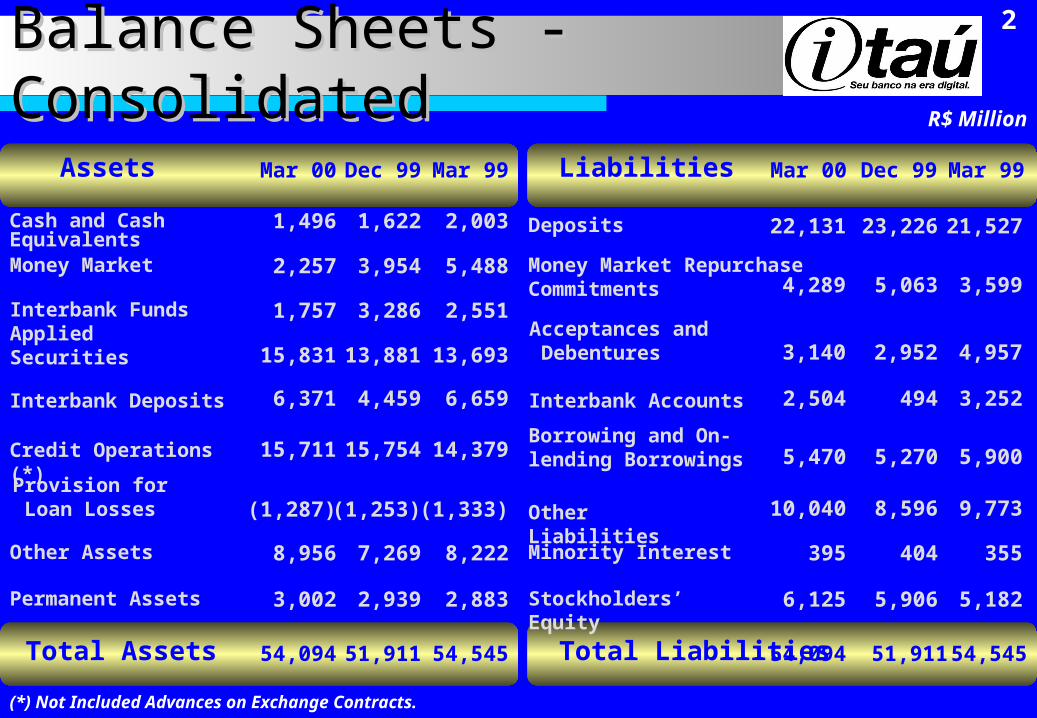
Balance Sheets - Consolidated Balance Sheets - Consolidated
Dec 99
51,911
3,954
13,881
4,459
23,226
5,063
494
5,270
8,596
404
51,911
5,906
3,286
Mar 00
54,094
R$ Million
Cash and Cash Equivalents
Money Market
Securities
Interbank Deposits
Credit Operations (*)
Other Assets
Permanent Assets
Provision for Loan Losses
Interbank Funds Applied
Deposits
Borrowing and On-lending Borrowings
Other Liabilities
Minority Interest
Interbank Accounts
Stockholders’ Equity
Liabilities
Total Liabilities
Assets
Total Assets
(*) Not Included Advances on Exchange Contracts.
Mar 99
54,545
2,003
14,379
8,222
2,883
(1,333)
1,622
15,754
7,269
2,939
(1,253)
1,496
2,257
15,831
6,371
15,711
8,956
3,002
(1,287)
1,757
5,488
13,693
6,659
2,551
2,952Acceptances and Debentures
Money Market Repurchase Commitments
Dec 99
22,131
2,504
5,470
10,040
395
54,094
6,125
3,140
4,289
Mar 00
21,527
4,957
3,599
3,252
5,900
9,773
355
5,182
54,545
Mar 99

3
Income StatementIncome StatementR$ Million
Net Income
Itaú Consolidated
Net Income from Financial Operations Provision for Loan Losses Banking Service FeesSalaries, Employee Benefits and Other Adm. ExpensesEquity Share in Income of Subsidiaries and AffiliatesOther Operating and Non Operating IncomeIncome before taxesExtraordinary ResultsIncome Tax and Social ContributionProfit SharingMinority Interest
1Q991Q99
415
4Q99
1,120(134)
978(1,228)
(194)(143)
399(107)
115(7)15
365
1,179(153)
802(1,156)
(53)(69)550
- (158)(29)
2
1Q00
1,214(299)
697(1,050)
32(157)
437535
(130)(23)(58)
761
4
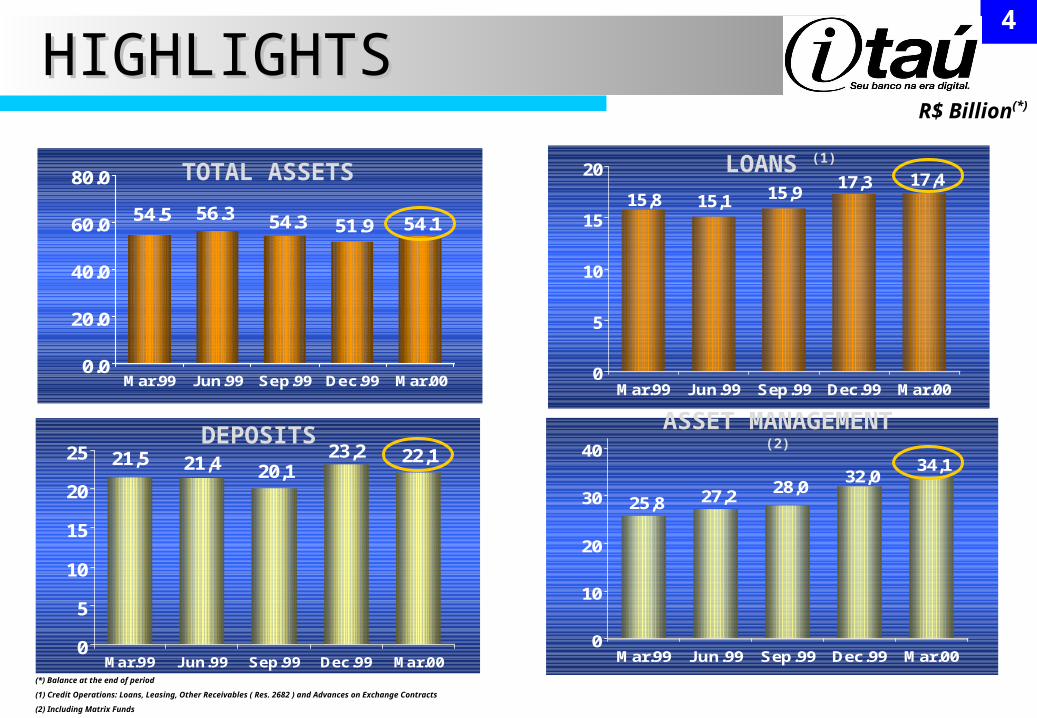
HIGHLIGHTS HIGHLIGHTS R$ Billion(*)
54.5 56.3 54.3 51.9 54.1
0.0
20.0
40.0
60.0
80.0
Mar.99 Jun.99 Sep.99 Dec.99 Mar.00
TOTAL ASSETS15,8 15,1 15,9
17,3 17,4
0
5
10
15
20
Mar.99 Jun.99 Sep.99 Dec.99 Mar.00
LOANS (1)
21,5 21,4 20,123,2 22,1
0
5
10
15
20
25
Mar.99 Jun.99 Sep.99 Dec.99 Mar.00
DEPOSITS
25,8 27,228,0
32,034,1
0
10
20
30
40
Mar.99 Jun.99 Sep.99 Dec.99 Mar.00
ASSET MANAGEMENT (2)
(*) Balance at the end of period
(1) Credit Operations: Loans, Leasing, Other Receivables ( Res. 2682 ) and Advances on Exchange Contracts
(2) Including Matrix Funds

5
Market Capitalization, Stockholders’ Equity and Market Capitalization, Stockholders’ Equity and
Consolidated Net IncomeConsolidated Net Income (1)(1)
6,1255,9075,8015,5635,182
16,56617,834
11,1099,9148,911226
333 360415
365
0
2,000
4,000
6,000
8,000
10,000
12,000
14,000
16,000
18,000
20,000
1Q99 2Q99 3Q99 4Q99 1Q00
0
100
200
300
400
500
600
700
800Consolidated Stockholders' Equity
Market Capitalization
Consolidated Net Income
R$ Million
(1) Net Income of Quarter; Stockholders’ Equity and Market Capitalization as of period ended.
761
Ext
raor
din
ary
Res
ult
(2)
(2) In the first quarter of 1999, the Banco Itaú has Extraordinary Result of R$ 535 million, related to the valorization of permanent Bank investments abroad.
Con
solid
ate
d N
et
Inco
me
Mar
ket C
apita
lizat
ion,
Sto
ckho
lder
s’ E
quity

6
Excelent PerformanceExcelent Performance
ROE
18.6%
48.1%
33.8% 40.3%
-5.2% -7.0%
26.1%26.2%
-20.0%-10.0%
0.0%10.0%
20.0%30.0%40.0%
50.0%60.0%
70.0%80.0%
1Q99 2Q99 3Q99 4Q99 1Q00
Extraordinary Recurring
ROA
1.7%
4.0%
3.3% 4.1%
-0.6% -0.8%
2.7%2.4%
-2.0%
-1.0%
0.0%
1.0%
2.0%
3.0%
4.0%
5.0%
6.0%
7.0%
1Q99 2Q99 3Q99 4Q99 1Q00
Extraordinary Recurring
(*) Annualized
72.9%
26.2%27.3% 31.2%
26.1%
5.7%
3.2%2.7%2.4% 2.7%

7
Excelent PerformanceExcelent Performance
BIS RATIO
21.3% 24.0% 20.9% 21.0% 20.8%
2.4%2.9%3.0%
0.0%
5.0%
10.0%
15.0%
20.0%
25.0%
30.0%
1Q99 2Q99 3Q99 4Q99 1Q00
Calculated in accordance with previous criteria
Calculated in accordance with criteria in place
23.9% 23.9% 23.2%
EFFICIENCY RATIO
55.0%57.0%
63.2%
57.3% 56.6%
50.0%
52.0%
54.0%
56.0%
58.0%
60.0%
62.0%
64.0%
1Q99 2Q99 3Q99 4Q99 1Q00
EFFICIENCY RATIO
R$ Million
8
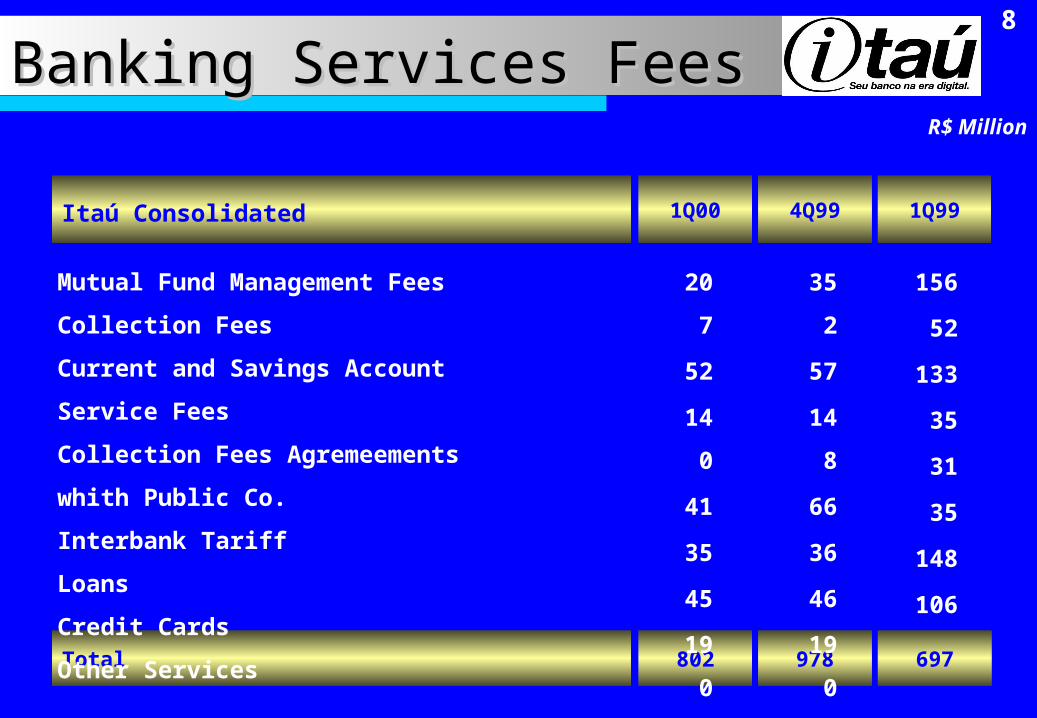
Banking Services FeesBanking Services FeesR$ Million
Total
Itaú Consolidated
978
4Q99
352
57
148
66
36
46
190
85
Mutual Fund Management Fees
Collection Fees
Current and Savings Account Service Fees
Collection Fees Agremeements whith Public Co.
Interbank Tariff
Loans
Credit Cards
Other Services
802
1Q00
697
1Q99
156
52
133
35
31
35
148
106
207
52
140
41
35
45
190
92

9
8.022
12.325
6.328
11.572
5.5313.958
17.299
17.39314.127
9.057
4.6345.846
11.798
6.366
20.005
20.241
0
2.000
4.000
6.000
8.000
10.000
12.000
14.000
16.000
18.000
20.000
82 83 84 85 86 87 88 89 90 91 92 93 94 95 96 97 98 99 00
Credit Operations (**)
Credit Operations Mar.00 Dec.99 Mar.99
Loans 15,123 15,220 13,927 Leasing 589 534 452O.Receivable 168 187 154 AEC 1,513 1,357 1,314 Sub-total 17,393 17,299 15,847 Guarantees 2,848 2,706 2,302 Total 20,241 20,005 18,149
Credit Operations Mar.00 Dec.99 Mar.99
Loans 15,123 15,220 13,927 Leasing 589 534 452O.Receivable 168 187 154 AEC 1,513 1,357 1,314 Sub-total 17,393 17,299 15,847 Guarantees 2,848 2,706 2,302 Total 20,241 20,005 18,149
( * ) In currency of Constant Purchasing Power as of December 31, 1995 until then, after which the calculation will be made in accordance to the Corporation Lawe ACC/ACE
Credit Operations (1)
Credit Operations and Guarantees (2)
( * * ) Until 1999 (Dec 31st); 2000 (Mar 31st)
( 1 ) Credit Operations: Loans, Leasings, Other Receivables and Advances on Exchange Contracts (AEC)
( 2 ) Guarantees: Endorsements, Sureties and Other Guarantees
R$ Million(*)

10
Provision For Loan Losses - Res. 2682Provision For Loan Losses - Res. 2682
Provision for Loan Losses (R$Thousand)
Itaú Consolidated (R$ Thousand)
1,287,388
Provision For Loan Losses Under Res. 2682Excess Provision for Loan Losses
662,761 624,627
Mar. 2000
Risk
AAABCDEFGH
Balances
4,906,983 6,021,657 3,506,932 1,530,268 723,475 90,347 298,218 39,920 275,180
%
0.0% 0.5% 1.0% 3.0% 10.0% 30.0% 50.0% 70.0% 100.0%
0 0 2,284 7,819 11,686 26,295 40,976 26,034 206,505
Specific
Provision (1)
Generic
Provision (2)
0 30,104 32,786 38,086 60,660 809 108,132 1,910 68,675
Total 17,392,980 321,599 341,162
Excess
Provision
624,627
Total
Provision
1,287,388

11
Provision for Loan Losses (*)Provision for Loan Losses (*)
Itaú Consolidated (R$ Million)
Beginning Balances Expenses allocated as: Provision for Loan Losses Extraordinary ResultsWrite-offEnd Balances
Beginning Balances of Non-accrual LoansNew Operations includedWrite-offEnd Balances of Non-accrual Loans
Recoveries
(1,253)(153)(153)
0119
(1,287)
196150119227
92
1Q00
(1,310)(134)(134)
0190
(1,253)
251134190196
80
4Q99
(1,303)(146)(146)
0140
(1,310)
249143140251
86
3Q99
(1,333)(235)(235)
0265
(1,303)
279235265249
40
2Q99
(1,340)(299)(299)
0306
(1,333)
313272306279
70
1Q99
(*) According to criteria previous to the Res. 2682.(*) According to criteria previous to the Res. 2682.
12
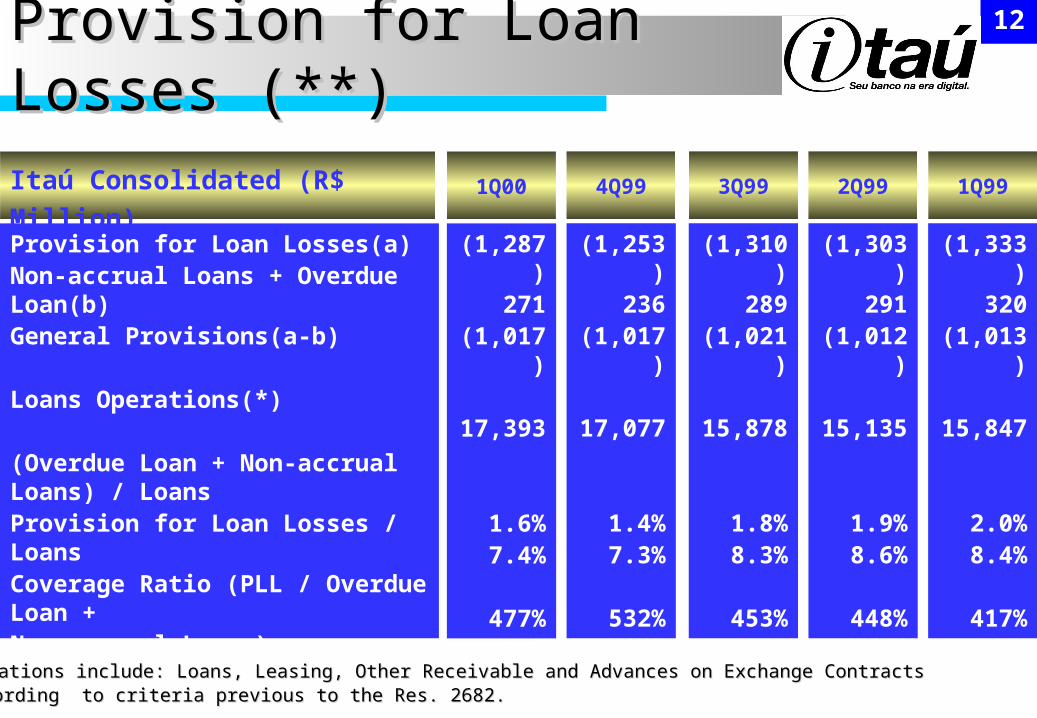
Provision for Loan Losses (**)Provision for Loan Losses (**)
Itaú Consolidated (R$ Million)
Provision for Loan Losses(a) Non-accrual Loans + Overdue Loan(b)General Provisions(a-b)
Loans Operations(*)
(Overdue Loan + Non-accrual Loans) / LoansProvision for Loan Losses / LoansCoverage Ratio (PLL / Overdue Loan + Non-accrual Loans)Additional Provision / Loans
(1,287)271
(1,017)
17,393
1.6%7.4%
477%5.8%
1Q00
(1,253)236
(1,017)
17,077
1.4%7.3%
532%6.0%
4Q99
(1,310)289
(1,021)
15,878
1.8%8.3%
453%6.4%
3Q99
(1,303)291
(1,012)
15,135
1.9%8.6%
448%6.7%
2Q99
(1,333)320
(1,013)
15,847
2.0%8.4%
417%6.4%
1Q99
* Loans Operations include: Loans, Leasing, Other Receivable and Advances on Exchange Contracts* Loans Operations include: Loans, Leasing, Other Receivable and Advances on Exchange Contracts** According to criteria previous to the Res. 2682.** According to criteria previous to the Res. 2682.
13
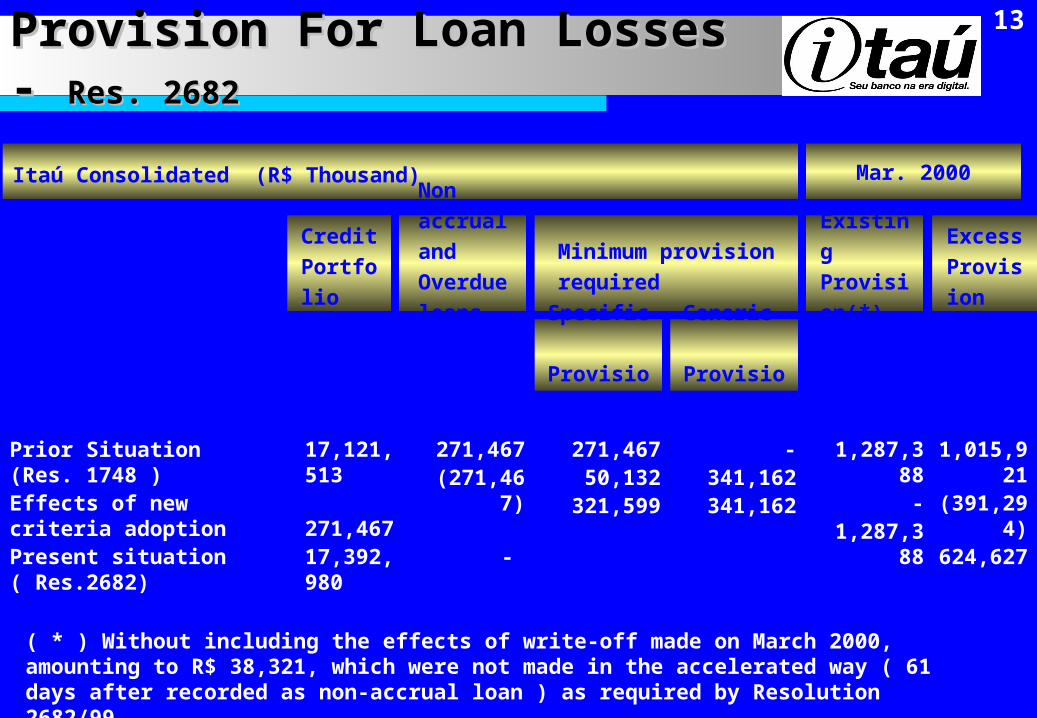
Provision For Loan Losses - Provision For Loan Losses - Res. 2682Res. 2682
Itaú Consolidated (R$ Thousand)
Prior Situation (Res. 1748 )Effects of new criteria adoptionPresent situation ( Res.2682)
Mar. 2000
17,121,513 271,46717,392,980
Credit
Portfolio
Non accrual
and Overdue
loans (*)
271,467(271,467)
-
Existing
Provision(*)Minimum provision required
Specific
Provision (1)
Generic
Provision (2)
Excess
Provision
271,46750,132
321,599
-341,162341,162
1,287,388-
1,287,388
1,015,921(391,294)
624,627
( * ) Without including the effects of write-off made on March 2000, amounting to R$ 38,321, which were not made in the accelerated way ( 61 days after recorded as non-accrual loan ) as required by Resolution 2682/99.

14
Net Interest MarginNet Interest MarginR$ Million
Itaú Consolidated
Loans and Leases Securities Portfolio Trade Finance and Foreign Exchange Portfolio Compulsory DepositsIncome from Financial OperationsExpenses from Financial OperationsFinancial Margin
Average Loans Average Earning Assets Average Funding Resources
Annual Average Rate of Income from Loans and Leases Annual Average Rate of Income from Financial Operations Annual Average Rate of Expenses from Financial Operations Annual Average Rate of Financial Margin
1Q00
1,046863
749
1,965(786)1,179
26.6%18.8%10.0%11.0%
17,23544,69132,593
4Q99
8587583149
1,696(576)1,120
22.4%16.2%7.2%
10.5%
16,51744,45533,074
1Q99
1,5671,709
2389
3,388(2,175)
1,214
14,85642,87833,834
49.3%35.6%28.3%11.8%

15
Changes in the Valuation Allowance for SecuritiesChanges in the Valuation Allowance for Securities
R$ Thousand
Balances as of March 31, 2000
Balances as of December 31, 1999
Write-offs:. Reversals. Losses for sales
156,401(13,727)(11,695)( 2,032)
Balances as of March 31, 2000 with additional provision
Additional provision (*)
142,674
888,574
745,900
(*) Additional provisions were constituted to cover the risk of future price fluctuations.
Securities and interbank deposits
Valuation allowance
Net Book Value
18,475,698 17,027,818
( 888,574) ( 783,430)
17,587,124 16,244,388
03/31/1999 03/31/2000Summary

16
US$
PREFERRED SHARES - APPRECIATION *PREFERRED SHARES - APPRECIATION *EVOLUTION OF US$ 100 INVESTED IN MARCH OF 1990EVOLUTION OF US$ 100 INVESTED IN MARCH OF 1990
Acrobat Document
ANNUAL APPRECIATIONANNUAL APPRECIATION. 10 years (Average). 10 years (Average) 66.94 % 66.94 %. 5 years (Average). 5 years (Average) 35.41 % 35.41 %. 12 months (Average). 12 months (Average) 81.78 % 81.78 %. 2000 2.55 % . 2000 2.55 %
ANNUAL APPRECIATIONANNUAL APPRECIATION. 10 years (Average). 10 years (Average) 66.94 % 66.94 %. 5 years (Average). 5 years (Average) 35.41 % 35.41 %. 12 months (Average). 12 months (Average) 81.78 % 81.78 %. 2000 2.55 % . 2000 2.55 %
ITAÚITAÚ BOVESPABOVESPA
MAR-90 DEC-91 DEC-92 DEC-93 DEC-94 DEC-95 DEC-96 DEC-97 DEC-98 DEC-99 MAR-00
* Without Reinvestiment
16,884
2,177100Collor Plan
Real Plan
Mexican Crisis
Asian Crisis
Russian Crisis
Real Devaluation


