Conference paper – GTAP 2020 Preliminary draft: Not for quotation Subject The potential local and regional impacts of COVID-19 in New Zealand with a focus on tourism Laëtitia Leroy de Morel, Glyn Wittwer, Dion Gämperle, Christina Leung Note: Given the recent global events, we have refocused our paper on the potential economic effects of COVID-19 on New Zealand tourism instead of looking at an increase in tourism and foreign students. 1.1 Abstract Due to the on-going global COVID-19 pandemic, there is a growing concern regarding its potential impacts on economies. With restrictions on entry and movements imposed by most countries, the tourism industry is particularly at risk. In New Zealand, where tourism contributes 5.8 percent to the national GDP and represents 20 percent of national exports, businesses in the tourism industry are already starting to see the effects of the latest travel restrictions imposed by the government. We present a CGE modelling application with a disaggregated tourism sector in our database to explore the potential impacts of COVID-19 on tourism for the local, regional and national New Zealand economies. In this paper, we focus on New Zealand’s major urban areas and tourist destinations in New Zealand, and we use a multi-regional bottom-up computable general equilibrium (CGE) model based on the original TERM model (Wittwer 2012, 2017). TERM-NZ is calibrated using Statistics NZ’s 2013 Input- Output tables and updated with the latest National Accounts data available. The model database has been extended so that it contains information on 149 industries, 149 commodities and 88 districts. This includes 68 territorial authorities across New Zealand plus, within Auckland, 20 local community boards. It includes a tourism sector that can distinguish between domestic tourism, foreign tourism and foreign students. We also provide an overview of the methodology we used to prepare the TERM-NZ database, focusing on tourism industries and regional detail. We use a 54-sector, 10-region aggregation of the model to simulate the effects of the ongoing COVID-19 pandemic. To this extent, we model three scenarios, each representing a different level of alert defined by the New Zealand government and associated with different degrees of foreign and domestic travel restrictions, including a travel ban, borders closures and confinement. Key words: computable general equilibrium, tourism, New Zealand, COVID-19, pandemic. 1.2 Introduction The outbreak of COVID-19, which started in China in December 2019, has since spread to the rest of the world and was recognised as a pandemic on 11 March 2020. COVID-19 has brought major disruptions in the global economy as many countries have closed their borders to foreign visitors and adopted measures of social distancing and confinement. Due to its geographic isolation, New Zealand has been able to watch as the situation evolved in China, Italy, Spain, France and the USA. As a consequence, the country rapidly implemented strict measures to limit and contain the spread. New Zealand’s lockdown was imposed on 25 March 2020 when the country had only 262 cases.
Transcript
Conference paper – GTAP 2020
Preliminary draft: Not for quotation
Subject The potential local and regional impacts of COVID-19 in New Zealand with a focus on tourism
Laëtitia Leroy de Morel, Glyn Wittwer, Dion Gämperle, Christina Leung
Note: Given the recent global events, we have refocused our paper on the potential economic effects of
COVID-19 on New Zealand tourism instead of looking at an increase in tourism and foreign students.
1.1 Abstract
Due to the on-going global COVID-19 pandemic, there is a growing concern regarding its potential
impacts on economies. With restrictions on entry and movements imposed by most countries, the
tourism industry is particularly at risk. In New Zealand, where tourism contributes 5.8 percent to the
national GDP and represents 20 percent of national exports, businesses in the tourism industry are
already starting to see the effects of the latest travel restrictions imposed by the government.
We present a CGE modelling application with a disaggregated tourism sector in our database to explore
the potential impacts of COVID-19 on tourism for the local, regional and national New Zealand
economies.
In this paper, we focus on New Zealand’s major urban areas and tourist destinations in New Zealand,
and we use a multi-regional bottom-up computable general equilibrium (CGE) model based on the
original TERM model (Wittwer 2012, 2017). TERM-NZ is calibrated using Statistics NZ’s 2013 Input-
Output tables and updated with the latest National Accounts data available. The model database has
been extended so that it contains information on 149 industries, 149 commodities and 88 districts. This
includes 68 territorial authorities across New Zealand plus, within Auckland, 20 local community boards.
It includes a tourism sector that can distinguish between domestic tourism, foreign tourism and foreign
students.
We also provide an overview of the methodology we used to prepare the TERM-NZ database, focusing
on tourism industries and regional detail. We use a 54-sector, 10-region aggregation of the model to
simulate the effects of the ongoing COVID-19 pandemic. To this extent, we model three scenarios, each
representing a different level of alert defined by the New Zealand government and associated with
different degrees of foreign and domestic travel restrictions, including a travel ban, borders closures and
confinement.
Key words: computable general equilibrium, tourism, New Zealand, COVID-19, pandemic.
1.2 Introduction
The outbreak of COVID-19, which started in China in December 2019, has since spread to the rest of the
world and was recognised as a pandemic on 11 March 2020. COVID-19 has brought major disruptions in
the global economy as many countries have closed their borders to foreign visitors and adopted
measures of social distancing and confinement.
Due to its geographic isolation, New Zealand has been able to watch as the situation evolved in China,
Italy, Spain, France and the USA. As a consequence, the country rapidly implemented strict measures to
limit and contain the spread. New Zealand’s lockdown was imposed on 25 March 2020 when the
country had only 262 cases.
2
As of April 8, New Zealand’s confirmed and probable cases reached 1,160. Similarly to other countries,
New Zealand closed its borders to foreign travellers and declared a 4-week confinement period with all
business premises closed except for essential services such as medical, pharmaceutical and food supply.
The duration of the New Zealand’s business restrictions under COVID alert levels is uncertain and will
mostly depend on how fast the country can flatten the curve.1 If the lockdown succeeds, social
distancing measures will be eased, and non-essential businesses will be able to re-open. However,
borders are likely to remain closed or entry to the country severely curtailed for the next few months.
Given the importance of the tourism sector for the New Zealand economy, COVID-19 is expected to
have significant negative impacts for the economy.
To date, no publicly available study has looked at the economic impacts of COVID-19 on New Zealand
and its tourism sector using a CGE modelling framework. Through the work presented here, we provide
an attempt to fill the gap by focusing on measuring the impacts of COVID-19 on tourism and the wider
economy, at both the regional and national levels. Using our regional bottom-up CGE model, TERM-NZ,
which allows for a disaggregated tourism sector, we model three different scenarios to better
understand the potential economic impacts of COVID-19 on foreign and domestic tourism in New
Zealand.
The paper is structured as follows. We first conduct a literature review to explore what has been done in
terms of CGE modelling regarding tourism and pandemics and we present a snapshot of the New
Zealand tourism sector. We then outline the model, scenarios and input data used for our modelling
application. In the subsequent sections, we present and discuss results, as well as the conclusions drawn
for industry stakeholders and policy-makers.
1.3 Literature review
Measuring the contribution of tourism to a national economy is a difficult exercise as, on the demand-
side, tourism represents the sum of tourist expenditure on a wide range of products. From the supply-
side, tourism can be viewed as a collection of productive activities that are mostly used by tourists. As
such, tourism is not identified as a single industry in national accounts (United Nations, 2010).
A significant amount of research work has been done over the last few decades to fill the gap and better
estimate the economy-wide effects of tourism.
Until recently, tourism analysis was heavily relying on Input-Output (I-O) analysis. Archer (1977) and
Fletcher (1989) provide examples of and discuss some of these studies. However, I-O models suffer
several shortcomings. For example, they assume that all wages and prices remain constant, regardless
of the levels of production and demand. Hence, they consider that economic resources such as land,
labour and capital are infinitely available, are never idle or can be reallocated without adjustment costs.
They also do not consider any crowding out effects (Dwyer et al, 2004). As such, I-O models can lead to
misleading results, including in tourism analysis, as they do not take into account the effects of tourism
on factor prices, incomes or income distribution.
In contrast, CGE models are not only driven by prices that respond to changes in supply and demand,
they also account for resource constraints and flow-on effects. Contrary to I-O analysis, CGE models
capture the complex and multidirectional flows between tourism, other sectors in the economy and
foreign producers and consumers.
Given their versatility, CGE models have recently appeared as a relevant and important tool for tourism
policy analysis (Dwyer, 2015), and as such, are now increasingly used for tourism economic analysis and
policy implications. CGE analysis of tourism has been facilitated with the introduction of tourism
satellite accounts (TSAs) in the mid-1990s,2 which have enabled tourism to be identified as an economic
1 I.e. reduce the number of new cases.
2 Canada was one of the first to adopt a tourism satellite account and published results in 1994, followed by other countries such as France, New Zealand, Mexico, Norway, Singapore, Sweden and the USA (United Nations, 2010).
3
driver for GDP, employment, investment, and consumption. See Dwyer et al. (2006) for an illustration
and discussion on the differences, similitudes and complementarities between TSAs and CGE
application.
In the last fifteen years or so, applications of CGE modelling in tourism has included evaluation of the
economic contribution of the tourism sector (Dwyer et al., 2003), economic impact evaluations of
government policies (Blake and Sinclair, 2003) changes in inbound tourism (Dwyer et al., 2003, Dixon et
al., 2019) and changes in the number of foreign students (Dixon et al., 2019).
Several studies that use CGE modelling have also looked at the impacts of a special event or crisis,
including disease pandemic. For example, Dixon et al. (2001), Giesecke et al. (2012 and 2015), Nassios
and Giesecke (2018), all looked at the tourism and economy-wide effects of the 9/11 terrorism attack in
Australia. Other studies, such as Moss et al. (2016) explore the impacts of a possible Ebola outbreak in
the Asia-Pacific.
Dwyer et al. (2006) use a CGE model of the Australian economy to show that the effects of SARS on the
Australian tourism industry were less severe than what was perceived by stakeholders of the tourism
industry. Authors show that the economic impact of a crisis on an economy is contingent on whether
cancelled or delayed outbound travel are substituted by savings, domestic tourism, or for the purchases
of other goods and services. The results indicate that substitution effects must be considered in
estimating the impact of some adverse situation on the economic contribution of tourism to a
destination.
Keogh-Brown et al. (2010) and Smith et al. (2011) use a CGE model to measure the potential economic
impact of a global infectious disease pandemic on the United Kingdom, France, Belgium and the
Netherlands. In both papers, authors conclude that the impact of a pandemic influenza is less significant
than disease mitigation policies, such as school closures and increased absenteeism of healthy workers.
Verikios et al. (2015) assess the global effects of two influenza pandemics with a global CGE model and
show that the economic impacts are more significant in the case of a pandemic characterised by high
infectiousness and low virulence, rather than a pandemic with low infection rate and high virulence.
More recently and topical, Wittwer (2020) used a multi-regional, dynamic CGE model of Australia,
TERM-WINE, to provides an assessment of the economic impacts induced by bushfires and COVID-19 in
the country, with a particular focus on the grape and wine sectors.
As far as we know, no publicly available study has been done that looks at the economic impacts of a
disease pandemic on tourism and the wider economy in New Zealand within a CGE modelling
framework. We provide an attempt to fill the gap by focusing on measuring the impacts of COVID-19 on
regional tourism in New Zealand.
1.4 Snapshot of the tourism sector in New Zealand
New Zealand tourism is a $41 billion industry (from Statistics NZ’s TSA). Tourism expenditure
contributed to $16.2 billion of direct value-added, which represents a 5.8 percent of direct contribution
to GDP. It accounted for 20 percent of New Zealand total exports in the year to March 2019, with
international visitors spending $17 billion. Domestically, New Zealanders spend $24 billion annually in
places outside their residence (40 km radius from home). Tourism also benefits the New Zealand
government, providing 3.8 billion in value added tax (GST).
Figure 1 shows that retail trade significantly benefits from tourism, with tourists spending $12 billion
annually on alcohol, food, fuel and other retail products. This is followed by transport ($10 billion), food
and beverage services ($4.7 billion) and accommodation services ($3.3 billion). Both air transport and
accommodation are highly dependent on tourism with over 90 percent of all spending in these
industries coming from tourists compared to only 43 percent for the food and beverage services
industry.
4
Figure 1 Share of tourism expenditure by product in New Zealand
5 NZIER’s quarterly predictions are calculated using a multi-sector macro-economic model of the New Zealand economy. Complimentary data analysis is also employed to make professional judgements when macro-economic conditions have changed from trend.
8
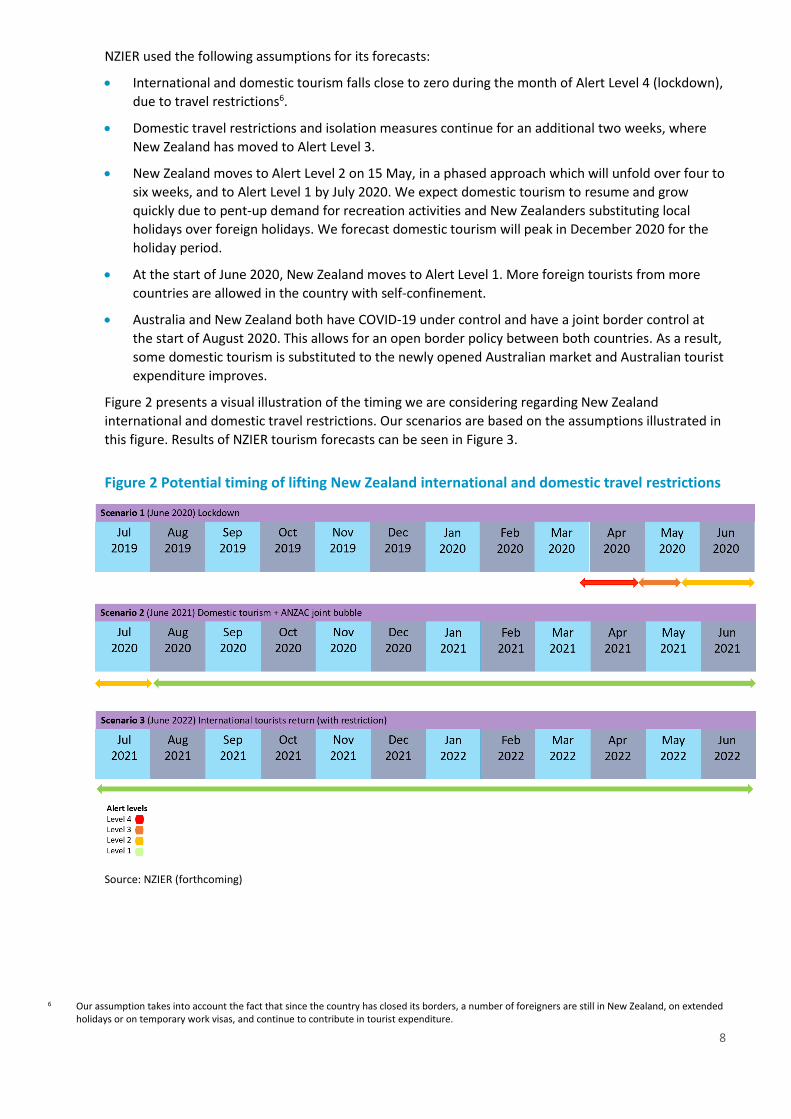
NZIER used the following assumptions for its forecasts:
• International and domestic tourism falls close to zero during the month of Alert Level 4 (lockdown),
due to travel restrictions6.
• Domestic travel restrictions and isolation measures continue for an additional two weeks, where
New Zealand has moved to Alert Level 3.
• New Zealand moves to Alert Level 2 on 15 May, in a phased approach which will unfold over four to
six weeks, and to Alert Level 1 by July 2020. We expect domestic tourism to resume and grow
quickly due to pent-up demand for recreation activities and New Zealanders substituting local
holidays over foreign holidays. We forecast domestic tourism will peak in December 2020 for the
holiday period.
• At the start of June 2020, New Zealand moves to Alert Level 1. More foreign tourists from more
countries are allowed in the country with self-confinement.
• Australia and New Zealand both have COVID-19 under control and have a joint border control at
the start of August 2020. This allows for an open border policy between both countries. As a result,
some domestic tourism is substituted to the newly opened Australian market and Australian tourist
expenditure improves.
Figure 2 presents a visual illustration of the timing we are considering regarding New Zealand
international and domestic travel restrictions. Our scenarios are based on the assumptions illustrated in
this figure. Results of NZIER tourism forecasts can be seen in Figure 3.
Figure 2 Potential timing of lifting New Zealand international and domestic travel restrictions
Source: NZIER (forthcoming)
6 Our assumption takes into account the fact that since the country has closed its borders, a number of foreigners are still in New Zealand, on extended
holidays or on temporary work visas, and continue to contribute in tourist expenditure.
9
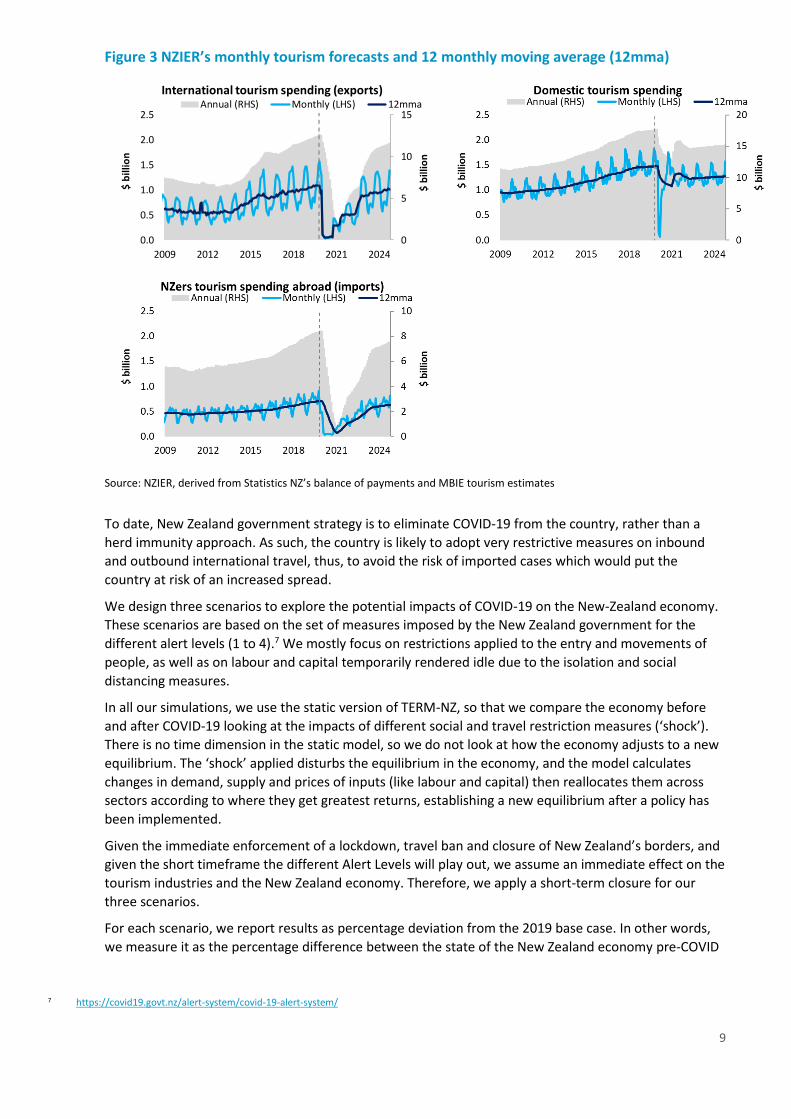
Figure 3 NZIER’s monthly tourism forecasts and 12 monthly moving average (12mma)
Source: NZIER, derived from Statistics NZ’s balance of payments and MBIE tourism estimates
To date, New Zealand government strategy is to eliminate COVID-19 from the country, rather than a
herd immunity approach. As such, the country is likely to adopt very restrictive measures on inbound
and outbound international travel, thus, to avoid the risk of imported cases which would put the
country at risk of an increased spread.
We design three scenarios to explore the potential impacts of COVID-19 on the New-Zealand economy.
These scenarios are based on the set of measures imposed by the New Zealand government for the
different alert levels (1 to 4).7 We mostly focus on restrictions applied to the entry and movements of
people, as well as on labour and capital temporarily rendered idle due to the isolation and social
distancing measures.
In all our simulations, we use the static version of TERM-NZ, so that we compare the economy before
and after COVID-19 looking at the impacts of different social and travel restriction measures (‘shock’).
There is no time dimension in the static model, so we do not look at how the economy adjusts to a new
equilibrium. The ‘shock’ applied disturbs the equilibrium in the economy, and the model calculates
changes in demand, supply and prices of inputs (like labour and capital) then reallocates them across
sectors according to where they get greatest returns, establishing a new equilibrium after a policy has
been implemented.
Given the immediate enforcement of a lockdown, travel ban and closure of New Zealand’s borders, and
given the short timeframe the different Alert Levels will play out, we assume an immediate effect on the
tourism industries and the New Zealand economy. Therefore, we apply a short-term closure for our
three scenarios.
For each scenario, we report results as percentage deviation from the 2019 base case. In other words,
we measure it as the percentage difference between the state of the New Zealand economy pre-COVID
10 As Level 1 measures are becoming less restrictive over time, there is a possibility of NZ moving into a “Level 0” (close to pre-COVID-19 life) during this period. Our forecasts and assumptions take this possibility into account.
11 As Level 1 measures are becoming less restrictive over time, there is a possibility of NZ moving into a “Level 0” (close to pre-COVID-19 life) during this period. Our forecasts and assumptions take this possibility into account.
the country. Domestic tourism is allowed, and most economic activities have returned to normal, with
the exception of air transport12.
Our shocks have been annualized based on the number of weeks we assumed New Zealand stays under
each alert level. Each scenario can have multiple alert levels within them.
Table 1 presents our assumptions for domestic and international tourism (outbound and inbound)
under the three different scenarios.
Table 1 Tourism and foreign students’ forecasts under different scenario assumptions13 Annual percentage change. Note: each scenario is compared with 2019 baseline
Scenario Period14 International Domestic NZers spending abroad Foreign students
Scenario 1 2020 -94% -27% -94% -20%
Scenario 2 2021 -58% -10% -65% -10%
Scenario 3 2022 -30% -11% -40% +2%
Source: Derived from NZIER tourism forecasts for Quarterly Predictions
1.6.2 Simulation results
In this section, we present and discuss results from our simulations to show the potential impacts of
COVID-19 on the local, regional and national New Zealand economies. Results of the simulation help us
to understand the importance of the tourism industry in New Zealand and to identify the potential risks
to a strong downturn of activities mostly dedicated to tourism.
Results are subject to change as we revise our simulations with latest forecasts on the expect impacts of
COVID-19 on tourism data.
Macroeconomic impacts of restriction measures from COVID-19 in New Zealand
Table 2 shows the national impacts of COVID-19 on main economic variables. Real GDP decreases by
between 7.1% ($21.2 billion) and 2.2% ($6.8 billion) as New Zealand transitions through the different
alert levels. For all three scenarios, real GDP loss is dominated by labour and capital temporarily not
used because of the lockdown measures and restrictions imposed on international and domestic travel.
We estimate the decrease in real household consumption to be between 13.1% (Scenario 1) and 3.2%
(Scenario 3). Real household consumption falls by more than the decline in GDP due to a deterioration
in the terms of trade from weaker global demand. Export prices are falling more than import prices.
Hence, exports are becoming cheaper while imports become relatively more expensive. This leads to a
decline in household purchasing power and hence, in consumption.
Due to the significant drop in employment and utilised capital, there is no offsetting switch in sales to
exports. At the national level, export volumes fall by between 10.8% (Scenario 1) and 5.6% (Scenario 3).
12 Air New Zealand has permanently reduced its fleet on domestic and international flights. https://www.airnewzealand.co.nz/covid19-airnz-
updates#flight-changes
13 We use a monthly comparison with the same month last year instead of annual data. This is because if we used annual data the sharp decline in domestic tourism will be hidden in the pre-COVID-19 peak and the recovery, once New Zealand moves to Alert Level 2 or 1.
14 Dates were chosen to see the impact as travel bans and alert level restrictions were implemented.
Hamilton City -6.6% -725.6 -3.8% -419.1 -1.8% -200.5
Tauranga -7.1% -531.5 -4.3% -318.9 -2.3% -175.1
Rotorua -8.8% -307.7 -5.5% -196.4 -3.2% -117.0
Dunedin -7.5% -462.0 -4.5% -282.7 -2.4% -153.0
Rest of North Island -6.2% -4,089.3 -3.6% -2,351.5 -1.7% -1,150.1
Rest of South Island -6.2% -2,186.3 -3.7% -1,330.1 -1.9% -689.2
National -7.1% -21,136.5 -4.3% -12,704.3 -2.2% -6,759.3
Notes:
1 * Greater Wellington includes Wellington, Lower Hutt, Upper Hutt and Porirua.
2 Prior to the COVID-19 outbreak, the New Zealand economy had been expected to grow by around 2% between 2020 and 2022. This highlights how significant the estimated reduction in key macroeconomic metrics are when we compare with the counterfactual, in which the economy would have grown in the absence of the COVID-19 pandemic.
Source: Results from authors’ simulations
Figure 5 shows the recovery path of different regions, in terms of real GDP. Under Scenario 1 (lockdown
in 2020), Queenstown-Lakes’ real GDP falls to 85% of its 2019 level. Under Scenario 2 (2021) and
Scenario 3 (2022), Queenstown-Lakes’ real GDP is slowly recovering but is still at 90% and 94%,
respectively, of its 2019 level. Rotorua is the second most affected region from COVID-19 in terms of
real GDP, with a drop to 92%, 95% and 97% under Scenarios 1, 2 and 3, respectively.
14
Figure 5 Regional real GDP recovery path under the different scenarios Annual changes from 2019 baseline, in percentage
Source: Results from authors’ simulations
Regional household spending – our proxy for ‘economic welfare’ – in dollar value (Table 4) is expected
to decrease the most in Auckland, Greater Wellington and Christchurch under each scenario. This is
because household spending is higher in regions that are more populated and wealthier. Therefore,
even a small percentage decrease will have a larger monetary impact than less populated and less
wealthy regions.
The decrease in regional household spending share is the most significant in regions whose economy is
more reliant on tourism activities, such as Queenstown-Lakes, Auckland, Christchurch, and Rotorua.
Table 4 Impacts on regional real household spending Annual changes compared to 2019 baseline, in percentage and in $ million in real terms (2019 prices)
Region (TLA) Scenario 1
(Lockdown)
Scenario 2
(Alert Level 2)
Scenario 3
(Alert Level 1)
in % in $ million in % in $ million in % in $ million
Hamilton City -12.5% -806.8 -7.1% -466.3 -3.1% -202.7
Tauranga -12.8% -536.9 -7.4% -313.6 -3.3% -140.2
Rotorua -13.5% -275.8 -7.8% -161.3 -3.4% -71.3
Dunedin -13.1% -457.9 -7.7% -273.3 -3.5% -123.7
Rest of North Island -11.9% -4,730.7 -6.6% -2,649.0 -2.6% -1,049.5
Rest of South Island -11.9% -2,550.2 -6.6% -1,436.7 -2.6% -565.6
National -13.1% -22,031.8 -7.5% -12,824.5 -3.2% -5,588.5
Note: * Greater Wellington includes Wellington, Lower Hutt, Upper Hutt and Porirua.
Source: Results from authors’ simulations
15
Impacts on sector activities
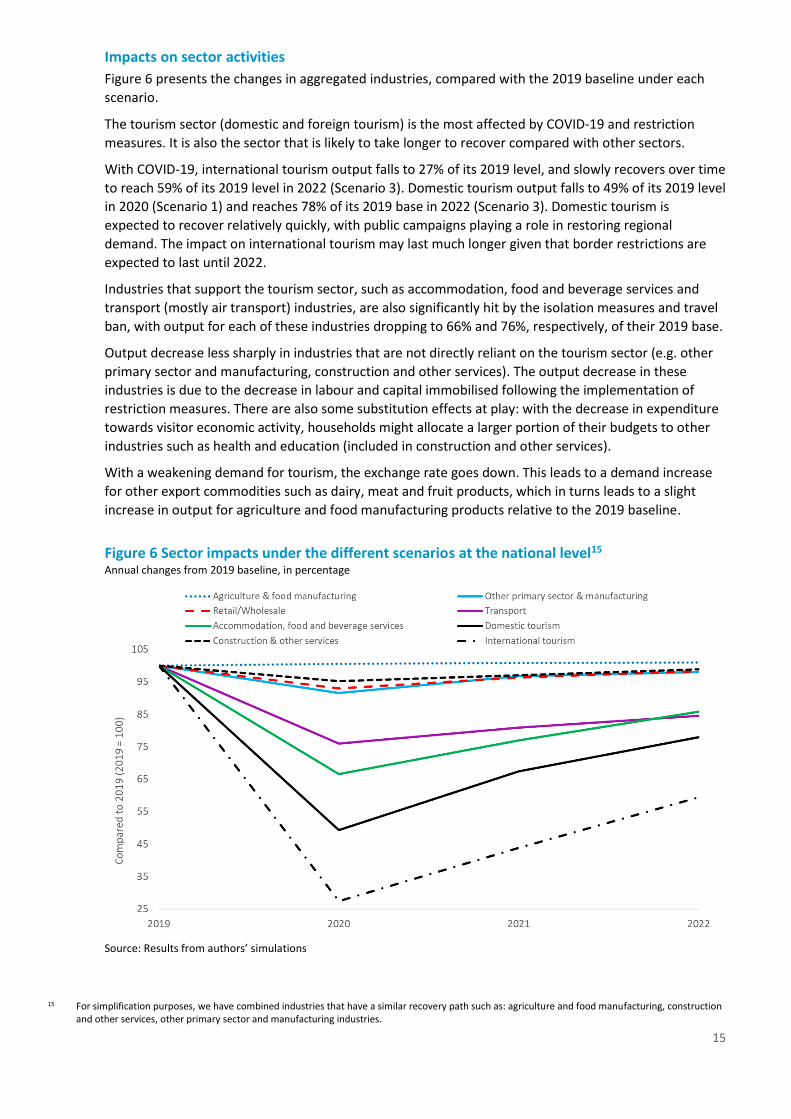
Figure 6 presents the changes in aggregated industries, compared with the 2019 baseline under each
scenario.
The tourism sector (domestic and foreign tourism) is the most affected by COVID-19 and restriction
measures. It is also the sector that is likely to take longer to recover compared with other sectors.
With COVID-19, international tourism output falls to 27% of its 2019 level, and slowly recovers over time
to reach 59% of its 2019 level in 2022 (Scenario 3). Domestic tourism output falls to 49% of its 2019 level
in 2020 (Scenario 1) and reaches 78% of its 2019 base in 2022 (Scenario 3). Domestic tourism is
expected to recover relatively quickly, with public campaigns playing a role in restoring regional
demand. The impact on international tourism may last much longer given that border restrictions are
expected to last until 2022.
Industries that support the tourism sector, such as accommodation, food and beverage services and
transport (mostly air transport) industries, are also significantly hit by the isolation measures and travel
ban, with output for each of these industries dropping to 66% and 76%, respectively, of their 2019 base.
Output decrease less sharply in industries that are not directly reliant on the tourism sector (e.g. other
primary sector and manufacturing, construction and other services). The output decrease in these
industries is due to the decrease in labour and capital immobilised following the implementation of
restriction measures. There are also some substitution effects at play: with the decrease in expenditure
towards visitor economic activity, households might allocate a larger portion of their budgets to other
industries such as health and education (included in construction and other services).
With a weakening demand for tourism, the exchange rate goes down. This leads to a demand increase
for other export commodities such as dairy, meat and fruit products, which in turns leads to a slight
increase in output for agriculture and food manufacturing products relative to the 2019 baseline.
Figure 6 Sector impacts under the different scenarios at the national level15 Annual changes from 2019 baseline, in percentage
Source: Results from authors’ simulations
15 For simplification purposes, we have combined industries that have a similar recovery path such as: agriculture and food manufacturing, construction
and other services, other primary sector and manufacturing industries.
16
1.7 Discussion on assumptions and policy implications
At the national level, restriction measures and the travel ban due to COVID-19 led to substantial real
GDP loss (between $21 billion and $6.8 billion between Scenario 1 and Scenario 3, respectively). For all
three scenarios, the fall in real GDP is dominated by labour and capital temporarily not used because of
the social and travel restriction measures imposed in the country. The decrease in domestic and foreign
tourism is also expected to have a significant impact on regional economies, especially those for which
tourism activities represent a larger share of the regional economy, such as Queenstown-Lakes,
Christchurch, Auckland and Rotorua.
Domestic tourism has the potential to partially mitigate the negative impacts of COVID-19 on foreign
tourism in New Zealand. Further research is needed to estimate the extent to which expenditure in both
inter-region/district and intra-region/district tourism represent a substitution from foreign travellers’
expenses foregone.
There is considerable uncertainty about the severity of the potential economic impacts of COVID-19. We
attempted to explore some of these uncertainties through the design of modelling scenarios. The
magnitude of these impacts is highly dependent on the assumptions made regarding the duration of
travel ban and restriction measures and their likely effects on labour, capital, or household demand for
consumer goods and services. Most of our assumptions are derived from NZIER’s Quarterly Predictions.
We are mindful that our assumptions are based on data that were available at the moment we wrote
this paper and that the situation is evolving rapidly. This means that assumptions made at the time this
paper was written might need to be updated as more timely information comes to hand.
We use the static version of our regional CGE model, TERM-NZ, which looks at ‘before’ (i.e pre COVID-
19) and ‘after’ (with different COVID-19 alert levels). We therefore do not explicitly model the timing of
the different restriction measures imposed by the New Zealand government under the different alert
levels. There is no time dimension in the static model, so we do not look at how the economy adjusts to
a new equilibrium over time16. We also do not take into consideration the economic growth that would
have happened without COVID-19. Prior to the COVID-19 outbreak, the New Zealand economy had been
expected to grow by around 2% between 2020 and 2022. This highlights how significant the estimated
reduction in key macroeconomic metrics are when we compare with the counterfactual, in which the
economy would have grown in the absence of the COVID-19 pandemic.
Additionally, and given the information available at the time this paper was written, we have not
explicitly modelled labour productivity loss resulting from social distancing measures in essential
industries as its importance is still uncertain. However, labour productivity loss has been taken into
account in NZIER’s labour forecasts, hence in our assumptions as well.
We also assume no fiscal response by government outside wage subsidies, which are implicitly taken
into account in NZIER’s labour forecasts. Therefore, public consumption follows the decrease in
household consumption (in nominal terms). While the New Zealand government has recently
announced a substantial COVID-19 Economic Response Package, we decided to not explicitly model any
fiscal response in order to showcase the base against which fiscal policies can be assessed.
At time of writing (15 May 2020), the cost of the COVID-19 Economic Response Package has been
increased from an initial $12 billion to $20 billion. Given the welfare loss modelled in this study, this
fiscal response could be a bit more ambitious.
16 These fluctuations may have significant impacts in their own right and could be captured in future research by using our more sophisticated, dynamic
CGE model.
17
1.8 References
Archer, B.H. (1977), Tourism multipliers: the state of the art. Occasional papers in economics, No. 11,
University of Wales Press, Bangor.
Blake, Adam, Jonathan Gillham, and M. Thea Sinclair. (2006) ‘CGE Tourism Analysis and Policy
Modeling’. Larry Dwyer & Peter Forsyth (ed.), International Handbook on the Economics of
Tourism, chapter 14, Edward Elgar Publishing. https://ideas.repec.org/h/elg/eechap/2827_14.html.
De Melo, J. and S. Robinson (1982), ‘General equilibrium models for development policy’, Cambridge,
MA: Cambridge University Press.
Dixon, P.B., P.D. Adams, J. Madden, R. Waschik, and J. Pyke. (2019) ‘Modelling the Visitor Economy’. A
Report for Victoria University’s School for the Visitor Economy,
Appendix A Extending the TERM-NZ database – methodology
Adding tourism industries
In the classic TERM-NZ database, tourism17 is not identified as a separate industry or products but rather
is nested in the expenditure of households and industries on products such as accommodation, food
and beverages or transport.
Following the approach of Wittwer (2017) which is detailed in Dixon (2019), we extended the TERM
database with the addition of five new tourism industries. This has been done by combining together all
the economic activities linked to tourism. These new tourism industries are:
• Domestic holiday, which represents tourist expenditure made by New Zealanders, undertaken
domestically, either locally or inter-regionally. We used visitor expenditure by New Zealanders,
including all corresponding taxes and margins.
• Foreign holiday (imported New Zealand tourism) represents tourism related expenditure made by
New Zealanders travelling abroad. We used international expenditure of New Zealanders travelling
abroad.
• Export tourism (foreign tourism) covers tourism expenditure by foreign visitors in New Zealand, not
travelling for education purposes. We used expenditure by foreign travellers in New Zealand other
than foreign students studying in the country.
• Export student (foreign student) represents the expenditure by foreign students in New Zealand.
We used expenditure by foreign students in New Zealand. This expenditure includes all
corresponding taxes and margins.
• International flights cover the use of imported and domestically-produced air transport by New
Zealanders travelling abroad
Unlike all the other industries in the database, the new tourism industries do not use labour and capital
directly. Instead, tourism industries purchase goods and services (e.g. accommodation, food and
beverage, transport) and sell them to foreign and domestic visitors. As such, these tourism industries
can be seen as combining goods and services produced by a variety of industries, so that all tourism
expenditure are grouped within these five tourism industries.
We build cost and sale structures for each of the new tourism industries by disaggregating the existing
TERM-NZ database using the TSA from Statistics NZ and the Monthly Regional Tourism estimates from
MBIE.
Table 5 in Appendix B presents a summary of the data requirements for extending the TERM-NZ
database, at the sector and district levels.
Domestic tourism
This section describes the steps done to build the domestic tourism industry in the TERM-NZ database.
Statistics NZ’ TSA provides data on the value of total domestic consumption on the seven tourism-
characteristic products18 and the two tourism-related products19 purchased by New Zealand
households, businesses and governments at purchaser (market)’s prices.
17 In its definition, tourism includes usual travellers who are holidaying, visiting friends and relatives, on business or travelling for educational
purposes. 18 Statistics NZ classifies tourism-characteristic product a product whose at least 25 percent of its production is purchased by tourist and for
which the level of consumption would decrease significantly in the absence of tourists.
19 Statistics NZ defines a tourism-related product as a product that is purchased up to 25 percent of its production by tourists. However, ‘Retail sales – clothing and footwear’, which exceeds the 25 percent of production threshold, is categorised as a tourism-related retail commodity, because the activity undertaken specifically relates to retail.
20
Using this information and concordance between TSA’s tourism products and commodities in the TERM
database, we derive domestic tourism ratios, defined at the national level as follows:
𝐷(𝑐) = 𝑁𝑍𝑒𝑟 𝑡𝑜𝑢𝑟𝑖𝑠𝑡 𝑑𝑜𝑚𝑒𝑠𝑡𝑖𝑐 𝑠𝑝𝑒𝑛𝑑𝑖𝑛𝑔 (𝑐)
𝑇𝑜𝑡𝑎𝑙 𝑒𝑥𝑝𝑒𝑛𝑑𝑖𝑡𝑢𝑟𝑒(𝑐) with c defined as commodity (1)
With information for the numerator taken from Statistics NZ’s TSA and data for the denominator taken
from the TERM database and defined as the total expenditure from household and industry on tourism
commodity at purchasers’ prices.
Because of data inconsistencies, the ratio can be higher than one. When this happens, we manually set
its value to one.
We assign this domestic tourism ratio across all regions of destination, household, industries and
associated sales taxes and margins to the TERM database. This allows us to pull out expenditure on
tourism-related products made by New Zealanders travelling domestically. This expenditure is then
placed into the cost structure of domestic tourism industry. For each affected industry other than
domestic tourism industry, total cost is lower than total sales because of costs associated with domestic
travel being removed. Conversely, total costs for domestic tourism industry exceeds total sales and
consumption expenditure is lower than its initial level due to the costs of domestic travel being
removed.
Foreign holiday (New Zealanders travelling abroad)
This section describes the steps done to build the foreign holiday industry in the TERM database.
The TSA from Statistics NZ provide data on the market price value of total external consumption on
tourism-characteristic and tourism-related products by New Zealand households, businesses and
governments.
We use concordance between tourism products described in Statistics NZ’s TSA and commodities that
are in the TERM-NZ database to estimate the foreign holiday ratios, defined at the national level as
follows:
𝐹𝐻(𝑐) = 𝑁𝑍𝑒𝑟 𝑡𝑜𝑢𝑟𝑖𝑠𝑡 𝑠𝑝𝑒𝑛𝑑𝑖𝑛𝑔 𝑜𝑣𝑒𝑟𝑠𝑒𝑎𝑠 (𝑐)
𝐼𝑚𝑝𝑜𝑟𝑡 𝑒𝑥𝑝𝑒𝑛𝑑𝑖𝑡𝑢𝑟𝑒 (𝑐) with c defined as commodity (2)
Where data for the numerator is from Statistics NZ’s TSA and data for the denominator is the sum of
household and industry use of a commodity at purchasers’ prices from the TERM database. Because of
data inconsistencies, the ratio can be higher than one. When this happens, we manually set its value to
one.
We assign this ratio across all regions of destination, household, industries and associated sales taxes
and margins to the TERM database. This allows us to pull out expenditure on tourism-related products
made by New Zealanders travelling abroad. Once these tourism-related values are taken out from the
industry costs matrices, the sum of costs is less than the sum of sales for each affected industry.
Similarly, the value of consumption expenditure is below its initial level after we removed overseas
travel costs.
International air transport
The international air transport industry represents the use of imported and domestically-produced air
transport by New Zealanders travelling abroad.
In the TERM-NZ database, air transport is used indirectly as a margin for freight and directly for
passenger transport. Here we are only interested in passenger transport demand. As such, we isolate
the expenditure of New Zealanders travelling overseas, including air transport, from the existing flows
21
of imported goods and corresponding taxes and margins. Given that New Zealanders who travel
overseas might also purchase domestic air flights, we account for this domestic spending as follows:
• We first make an informed guess of the Air New Zealand revenue share generated by fares bought
by New Zealanders travelling abroad and apply this share to the existing value of domestic air
transport in the database.20 This gives us a dollar value which we allocate toward fares paid by New
Zealanders travelling abroad.
• We maintain the same allocation to industry and household users and regions as the initial
allocation of imported air transport expenditure.
• Expenditure on domestic flights are added into the margin matrices (for passenger transport not
for freight) in the database. This expenditure represents the use of domestically-produced air
transport in the purchase of imported New Zealand tourism (outbound New Zealand tourism).
• As a final step, we ensure that the total purchasers’ value of air transport associated with outbound
New Zealand tourism corresponds to what is reported in the TSA (Statistics NZ). To do so, we
decrease the basic value of imported air transport which was initially taken out from the basic
value of industry spending on domestic or imported commodities and from the basic value of
regional household expenditure, and associated taxes and margins.
We ensure the database is balanced by adding sales of the domestic holiday industry into the cost
matrices of industries and households. At this stage, regional users (household and industries) purchase
small amounts on imported tourism products (e.g. accommodation and air transport) and their
expenditure is now indirectly taken into account through spending on imported domestic tourism
services.
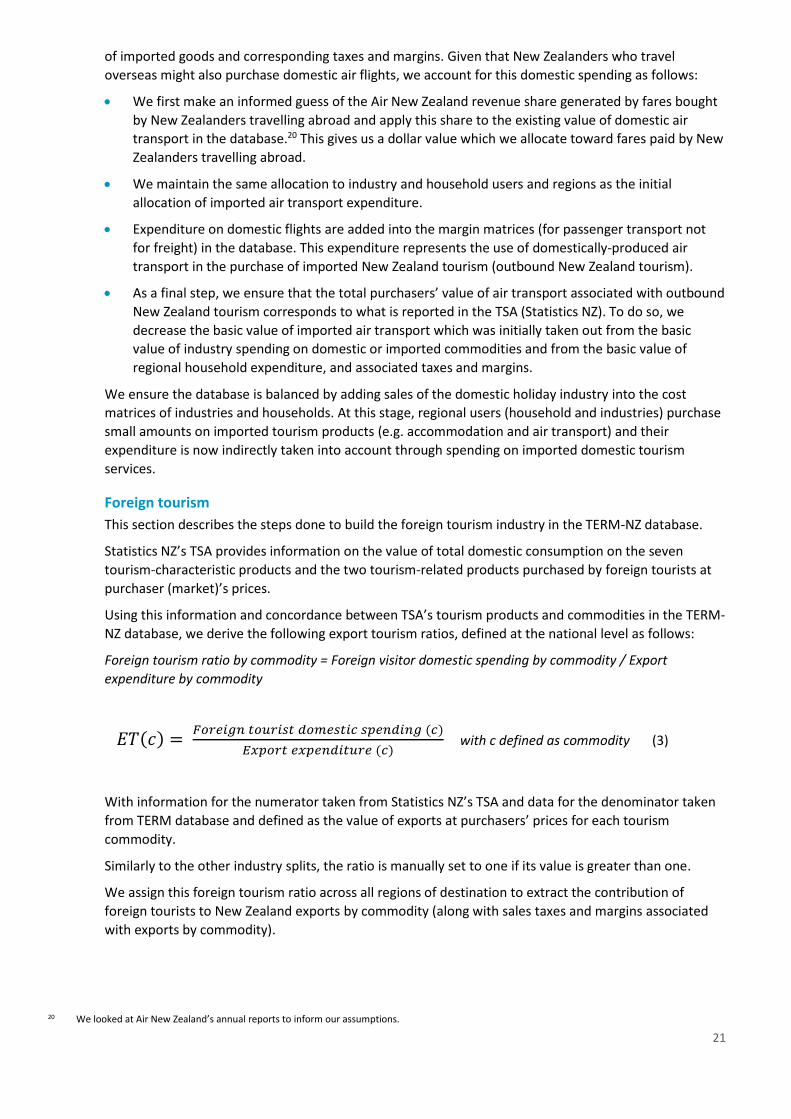
Foreign tourism
This section describes the steps done to build the foreign tourism industry in the TERM-NZ database.
Statistics NZ’s TSA provides information on the value of total domestic consumption on the seven
tourism-characteristic products and the two tourism-related products purchased by foreign tourists at
purchaser (market)’s prices.
Using this information and concordance between TSA’s tourism products and commodities in the TERM-
NZ database, we derive the following export tourism ratios, defined at the national level as follows:
Foreign tourism ratio by commodity = Foreign visitor domestic spending by commodity / Export
expenditure by commodity
𝐸𝑇(𝑐) = 𝐹𝑜𝑟𝑒𝑖𝑔𝑛 𝑡𝑜𝑢𝑟𝑖𝑠𝑡 𝑑𝑜𝑚𝑒𝑠𝑡𝑖𝑐 𝑠𝑝𝑒𝑛𝑑𝑖𝑛𝑔 (𝑐)
𝐸𝑥𝑝𝑜𝑟𝑡 𝑒𝑥𝑝𝑒𝑛𝑑𝑖𝑡𝑢𝑟𝑒 (𝑐) with c defined as commodity (3)
With information for the numerator taken from Statistics NZ’s TSA and data for the denominator taken
from TERM database and defined as the value of exports at purchasers’ prices for each tourism
commodity.
Similarly to the other industry splits, the ratio is manually set to one if its value is greater than one.
We assign this foreign tourism ratio across all regions of destination to extract the contribution of
foreign tourists to New Zealand exports by commodity (along with sales taxes and margins associated
with exports by commodity).
20 We looked at Air New Zealand’s annual reports to inform our assumptions.
22
Foreign students
Spending by foreign visitors in New Zealand by commodity and region of expenditure generated in the
previous step is split into spending by students and non-students based on the number of foreign
students arriving in New Zealand.
It is unlikely that the Statistics NZ’s I-O tables account for spending of foreign students as sales to
exports after their first year of study. As such, we focus on the expenditure of new foreign student
arrivals.
To do so, we consider that the tourism-related product “education” in Statistics NZ’s TSA represents the
expenditure made by foreign students on higher education services that are domestically-produced. We
then estimate the value of foreign student expenditure for all the other commodities in TERM-NZ as the
product of the number of first year foreign students and the per capita spending by commodity
reported for a single person aged under 35 in the Household Expenditure Survey from Statistics NZ.
We then removed expenditure made by foreign tourists and students in New Zealand by commodity
and by regions from the existing export values and associated sales taxes and margins. We insert these
expenditure values into the cost structure of foreign tourism and foreign student industries. In the
TERM-NZ database, we take into account imports of goods and services purchased by foreign tourists
and students in New Zealand as re-exports. In other words, we consider that re-exports correspond to
the own-use of imported tourism products and therefore, we estimate the value of tourism re-exports
as the ratio of imports to total sales by commodity, at the national level.
At this stage, the total costs of foreign tourism and foreign student industries are lower or equal than
the sum of sales. Export expenditure in each of these two industries is lower than its original level due
to visitor exports being taken out.
We ensure the TERM-NZ database is balanced by taking out export sales (equal to the previous value of
re-exports to foreign visitors) and adding them to domestic tourism industry to equal the cost of inputs
that are domestically-produced and imported. This allows for export expenditure to return to its original
level. In the extended TERM-NZ database, tourism-related industries such as accommodation have few
direct exports and little inputs of imported own product. Exports of the foreign tourism industry are
now produced by the newly created domestic tourism sectors.
Bottom-up regional modelling
Our methodology to extend the database at the regional/district level is based on Wittwer and Horridge
(2010) and follows a bottom-up approach. In a bottom-up approach, each region/district is modelled as
a separate economy, linked by trade of goods and services, common but imperfectly mobile factor
markets, a common central government and exchange rate. The use of a bottom-up framework allows
to estimate variations in both quantities and prices, at the regional/district levels.
TERM-NZ database is based on a master database which contains information for 88 districts (68
territorial authorities and 20 local boards in the Auckland region).21 Similarly to the original TERM model
(Wittwer 2012, 2017), we usually run TERM-NZ with an aggregated version of the database to speed-up
the model computation and because it is not technically possible to run the model with such a large
database in its full dimensions.
Wittwer and Horridge (2010) use Census data to represent regional database at a smaller regional level
for Australia. We follow their methodology to introduce detail at the district level in our TERM-NZ
database.
21 The 16 regions of New Zealand are defined according to Statistics New Zealand,
We use regional employment data from Statistics NZ, by industry and for each district (i.e. territorial
authority or local board in Auckland) to estimate the following industry and district-level shares:
• R001: Production/output shares
• R002: Investment shares (same as R001)
• R003: Household consumption shares
• R004: Export shares
• R005: Government shares
To estimate these shares at the regional and district level, we use available information on employment
by disaggregated industry and available at the district level (territorial authority or local board) and we
assume an identical technology or input cost structure for a given industry in all districts, following
Wittwer and Horridge’s methodology (2018).
A.2.1 District-level share of industry value added
The district shares of industry value added 𝑉𝐴𝑖 for industry 𝑖 is aggregated from districts 𝑡𝑎 to the
regional level 𝑟 and from industry 𝑖 to broad sectors 𝑠, so that the sum of district shares of industry value added equals to the regional level of sector value added 𝑉𝐴𝑠,𝑟 .
∑ ∑(𝑅001𝑖,𝑡𝑎. 𝑉𝐴𝑖) = 𝑉𝐴𝑠,𝑟
𝑖∈𝑠𝑡𝑎∈𝑟
(4)
From the above equation, we may need to adjust district production shares in a given region if the sum
of these shares over industries and districts is different from the national account data.
A.2.2 Household consumption shares at the district level
We define as 𝑅𝑂𝑂3 the share of household consumption by commodity and district. 𝑅003 is equal to
the product of the district’s share of regional population and the region’s share of national broad
commodity consumption, aggregated from the granular commodity level 𝑐 to the broad sector level 𝑠:
𝑅003𝑐,𝑟 = (𝑃𝑂𝑃𝑡𝑎
𝑃𝑂𝑃𝑟(𝑡𝑎)⁄ ) . (
𝑉3_𝑅𝑠(𝑐),𝑟(𝑡𝑎)𝑉3𝑁𝐴𝑇𝑠(𝑐)
⁄ ) (5)
A.2.3 Government consumption shares at the district level
As there is no sector breakdown in government spending in the national accounts (for the regional
level), we simply define 𝑅005, the share of government expenditure by commodity and district, as
follows:
𝑅005𝑐𝑡𝑎 = (𝑃𝑂𝑃𝑡𝑎
𝑃𝑂𝑃𝑟(𝑡𝑎)⁄ ) . (
𝑉5_𝑅𝑟(𝑡𝑎)
𝑉5𝑁𝐴𝑇⁄ )
(6)
For local commodities, we assume that household and government consumption shares are equal to the
production shares (one commodity corresponds to one industry in the TERM-NZ database), such as:
𝑅005𝑐𝑡𝑎 = 𝑅001𝑖𝑡𝑎 (7)
And
𝑅003𝑐𝑡𝑎 = 𝑅001𝑖𝑡𝑎 (8)
24
Figure 7 provides an overview of the different steps undertaken to extend our TERM-NZ and add sector
and district-level detail.
Figure 7 Process overview to extend the TERM-NZ database
Source: Authors, based on Wittwer (2012,2017)
25
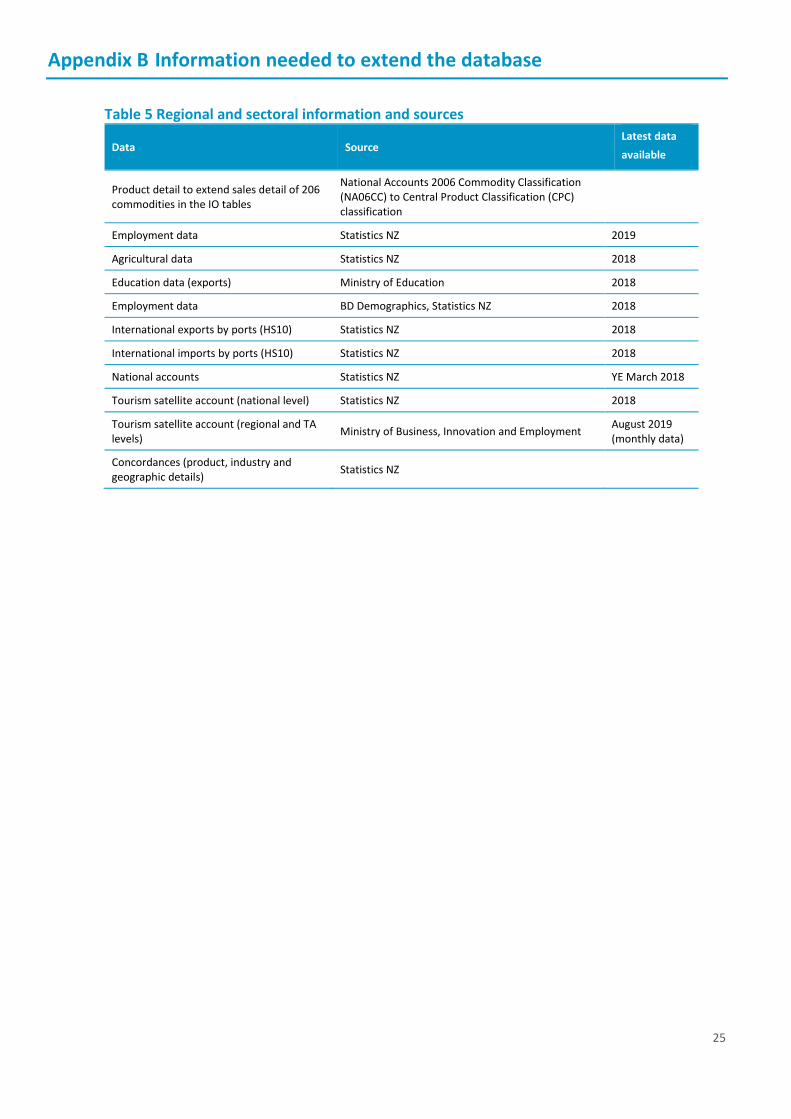
Appendix B Information needed to extend the database
Table 5 Regional and sectoral information and sources
Data Source Latest data
available
Product detail to extend sales detail of 206 commodities in the IO tables
National Accounts 2006 Commodity Classification (NA06CC) to Central Product Classification (CPC) classification
Employment data Statistics NZ 2019
Agricultural data Statistics NZ 2018
Education data (exports) Ministry of Education 2018
Employment data BD Demographics, Statistics NZ 2018
International exports by ports (HS10) Statistics NZ 2018
International imports by ports (HS10) Statistics NZ 2018