de Crombrugghe, Guerric; Chazot, Olivier (2012). Investigation of gas-surface interaction and modelling of the reference catalycity for thermal protection material testing in plasma wind tunnels. Presentation at the 63rd International Astronautical Congress, Naples, Italy. 1 - 5 october 2012. Paper ID Nr.: IAC-12, C2,8,8,x12868.
INVESTIGATION OF GAS-SURFACE INTERACTIONS AND MODELLING OF THE REFERENCE CATALYCITY FOR THERMAL PROTECTION MATERIAL TESTING IN PLASMA WIND TUNNELS Guerric de Crombrugghe von Karman Institute for Fluid Dynamics October 4, 2012 1 / 20
Transcript
INVESTIGATION OF GAS-SURFACEINTERACTIONS AND MODELLING OF THEREFERENCE CATALYCITY FOR THERMALPROTECTION MATERIAL TESTING IN
PLASMA WIND TUNNELS
Guerric de Crombrugghe
von Karman Institute for Fluid Dynamics
October 4, 2012
1 / 20
PART I: SCOPE
PART II: TEST CAMPAIGNS
PART III: GAS-SURFACE INTERACTIONS
PART IV: CONCLUSION
2 / 20
PART I: SCOPE
3 / 20
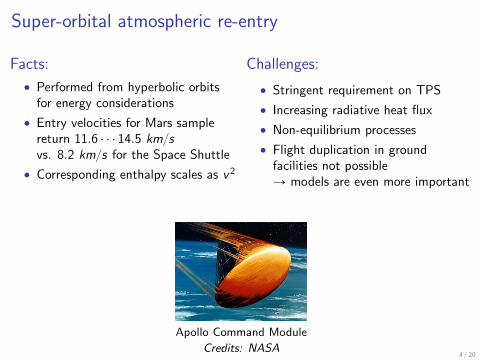
Super-orbital atmospheric re-entry
Facts:
• Performed from hyperbolic orbitsfor energy considerations
• Entry velocities for Mars samplereturn 11.6 ¨ ¨ ¨ 14.5 km{svs. 8.2 km{s for the Space Shuttle
• Corresponding enthalpy scales as v2
Challenges:
• Stringent requirement on TPS
• Increasing radiative heat flux
• Non-equilibrium processes
• Flight duplication in groundfacilities not possibleÑ models are even more important
Apollo Command Module
Credits: NASA4 / 20
Catalycity modeling
Catalycity model todayProbability of dissociated species recombination at the wall.Recombination being an exothermeric reaction, it adds to the alreadyimportant heat transfer.
IssueA probability hides the very physical nature of catalycity: a balancebetween diffusion of dissociated species to the wall, and reaction rate atthe wall.
5 / 20
PART II: TEST CAMPAIGNS
6 / 20
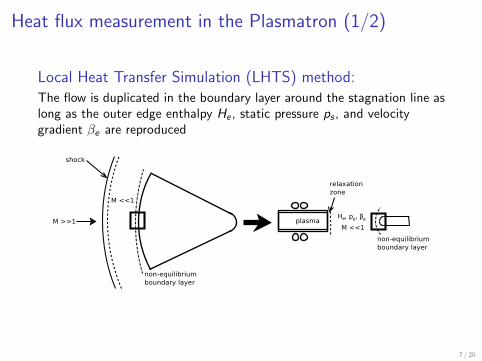
Heat flux measurement in the Plasmatron (1/2)
Local Heat Transfer Simulation (LHTS) method:The flow is duplicated in the boundary layer around the stagnation line aslong as the outer edge enthalpy He , static pressure ps , and velocitygradient βe are reproduced
7 / 20
Heat flux measurement in the Plasmatron (2/2)
Probe in the plasma flow andcorresponding measured heat flux
0 25 50 75 100−100
100
300
500
700
900
1100
Time [s]
Heat flux [kW
/m2]
For a given measurement of heat flux andpressure, the output of the numericalre-building is a correlation between outeredge enthalpy He and material catalycity γ
10−5
10−4
10−3
10−2
10−1
100
20
30
40
50
Catalycity (log) [−]
Oute
r edge e
nth
alp
y [M
J/k
g]
8 / 20
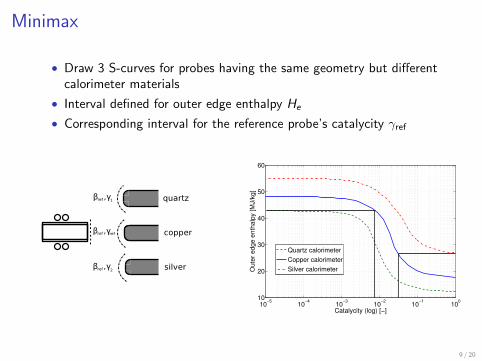
Minimax
• Draw 3 S-curves for probes having the same geometry but differentcalorimeter materials
• Interval defined for outer edge enthalpy He
• Corresponding interval for the reference probe’s catalycity γref
10−5
10−4
10−3
10−2
10−1
100
10
20
30
40
50
60
Catalycity (log) [−]
Oute
r edge e
nth
alp
y [M
J/k
g]
Quartz calorimeter
Copper calorimeter
Silver calorimeter
9 / 20
Damkohler probes (1/2)
• The reference catalycity being fixed, the heat flux is recorded varyingthe LHTS parameters: outer edge enthalpy He , static pressure ps ,and velocity gradient βe
• Different velocity gradient βe are obtained with different probe radius
10 / 20
Damkohler probes (2/2): results low pressure
0 500 1000 1500 20000
500
1000
1500
2000
2500
3000
3500
4000
Heat flux Reference probe [kW/m2]
Heat flux F
rozen p
robe [kW
/m2]
Experiment
Qw(frozen) = 1.6876*Qw(reference)
H−W. Krass. (2006)
F. Panerai (2012)
0 500 1000 1500 20000
500
1000
1500
2000
Heat flux Reference probe [kW/m2]
Heat flux E
quili
brium
pro
be [kW
/m2]
H−W. Krass. (2006)
Experiment
F. Panerai (2012)
Qw(equilibrium) = 0.8061*Qw(reference)
11 / 20
PART III: GAS-SURFACE INTERACTIONANALYSIS
12 / 20
1. Wall Damkohler number
2. Gas-phase Damkohler number
3. Catalycity
13 / 20
Wall Damkohler number (1/3)Wall Damkohler Daw : state of the flow close to the wall
Daw “τdiffτhete
“kwvdiff
with kw “ f pTw q “ cst and vdiff “De
δ
• Daw Ñ 0: reaction-controlled wall
• Daw Ñ 8: diffusion-controlled wall
0 1000 2000 3000 4000 5000 6000 70000
0.1
0.2
0.3
0.4
0.5
0.6
0.7
0.8
Gas temperature [K]
N d
iffu
sio
n c
oeffic
ient [m
2/s
]
Fully recombined mixture
Mixture for H = 36.24 MJ/kg
1500 Pa
5000 Pa
10000 Pa
0 1000 2000 3000 4000 5000 6000 70000
0.1
0.2
0.3
0.4
0.5
0.6
0.7
0.8
Gas temperature [K]
O d
iffu
sio
n c
oeffic
ient [m
2/s
]
Fully recombined mixture
Mixture for H = 36.24 MJ/kg 1500 Pa
5000 Pa
10000 Pa
14 / 20
Wall Damkohler number (2/3): diffusion velocity
vdiff “De
δ
ps “ 1, 500 Pa
15 20 25 30 35 400
2
4
6
8
10
12
Outer edge enthalpy [MJ/kg]
Diffu
sio
n v
elo
city [m
/s]
Frozen
Equilibrium
nitrogen
oxygen
ps “ 10, 000 Pa
15.5 16 16.5 17 17.5 18 18.50
0.2
0.4
0.6
0.8
1
1.2
1.4
1.6
Outer edge enthalpy [MJ/kg]
Diffu
sio
n v
elo
city [m
/s]
Frozen
Equilibrium
nitrogen
oxygen
15 / 20
Wall Damkohler number (3/3): conclusion
He Ò βe Ò ps Ò N vs. O
kw ´ ´ ´ ?vdiff Ò Ò Ó ă
Daw Ó Ó Ò ?
16 / 20
Catalycity
ps “ 1, 500 Pa
15 20 25 30 35 4010
−3
10−2
10−1
100
Outer edge enthalpy [MJ/kg]
Cata
lycity (
log)
[−]
Frozen
Equilibrium
ps “ 10, 000 Pa
15.5 16 16.5 17 17.5 18 18.510
−3
10−2
10−1
100
Outer edge enthalpy [MJ/kg]
Cata
lycity (
log)
[−]
Frozen
Equilibrium
He Ò βe Ò ps Ò N vs. O
γ Ò Ò Ó “
17 / 20
PART IV: CONCLUSION
18 / 20
Conclusion
He Ò βe Ò ps Ò N vs. O
kw ´ ´ ´ ?vdiff Ò Ò Ó ă
Daw Ó Ó Ò ?γ Ò Ò Ó “
• The variations of γ are linked to that of the parameters of Daw , asboth describe the chemistry at the wall
• As kw is not varied, one can only conclude that γ varies as vdiff
• If kw was to be varied, one would most probably conclude that γalso varies as kw
• Therefore γ is not described by the inverse of Daw but by anotherfunction γ “ f pvdiff, kw q