Permanent Mission of Switzerland to the United Nations Programme Schedule Workbook Module 1: Funding for UN operational activities for development: key trends and issues Preparations for the 2012 Quadrennial Comprehensive Policy Review of the General Assembly of UN operational activities for development organized jointly with the Permanent Mission of Switzerland and the UN Department of Economic and Social Affairs United Nations Headquarters, New York Conference Room E Wednesday, 1 February 2012
Transcript
Permanent Mission of Switzerland
to the United Nations
Programme Schedule
Workbook Module 1: Funding for UN operational activities for development: key trends and issues
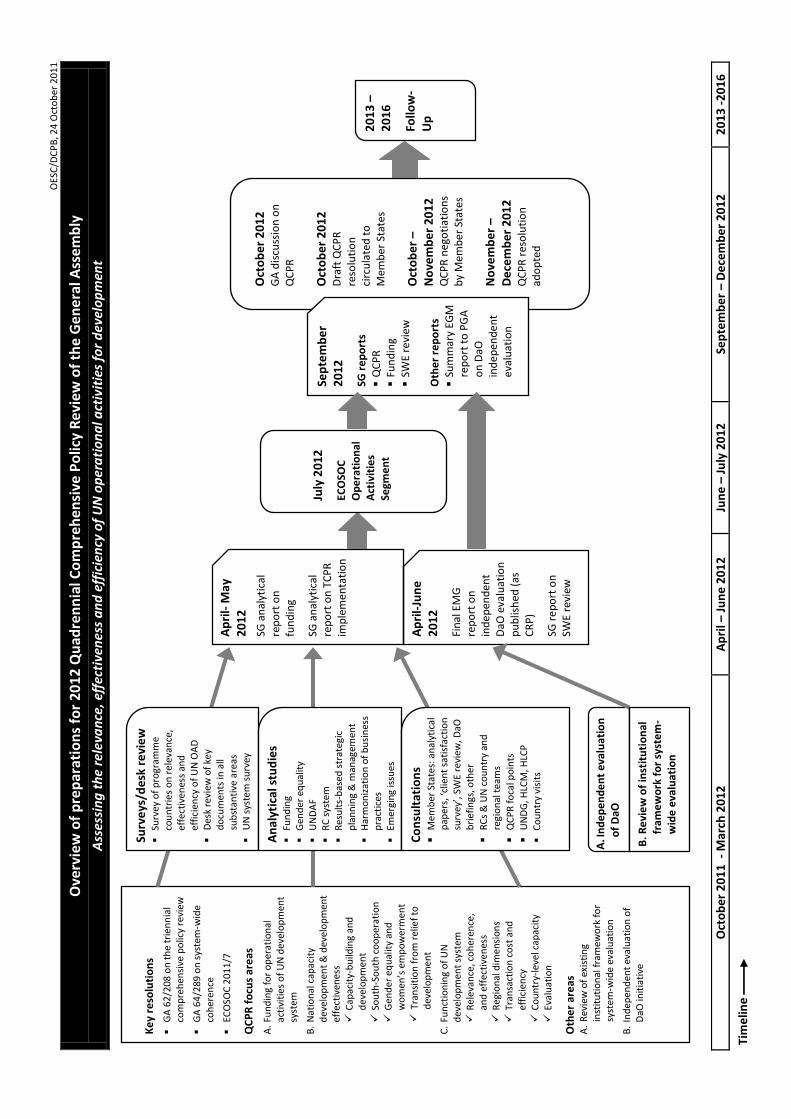
Preparations for the 2012 Quadrennial Comprehensive Policy Review of the General Assembly of UN operational
activities for development organized jointly with the Permanent Mission of Switzerland
and the UN Department of Economic and Social Affairs
United Nations Headquarters, New York Conference Room E
Wednesday, 1 February 2012
Permanent Mission of Switzerland
to the United Nations
Programme Schedule Module 1: Funding for UN operational activities for development: key trends and issues
TIME SESSION
09:30 a.m.
09:40 a.m.
Welcome remarks
Yvonne Lodico, Head, UNITAR New York Office
H.E. Paul Seger, Ambassador Extraordinary and Plenipotentiary and Permanent Representative of Switzerland to the United Nations
The QCPR process
Nadia Isler or Pio Wennubst, Permanent Mission of Switzerland to the UN
Navid Hanif, Acting Director, Office for ECOSOC Support and Coordination, UNDESA
10:00 a.m. UNICEF’s Funding Architecture: key trends and challenges
Afshan Khan, Director, Public-Sector Alliances and Resource Mobilization Office (PARMO), UNICEF
o Structure of funding contributions and expenditures
o Overview of key funding trends
Questions and answers/discussion
Preparations for the 2012 Quadrennial Comprehensive Policy Review of the General Assembly of UN operational
activities for development organized jointly with the Permanent Mission of Switzerland
and the UN Department of Economic and Social Affairs
United Nations Headquarters, New York Conference Room E
Wednesday, 1 February 2012
Permanent Mission of Switzerland
to the United Nations
10:45 a.m. UNDP’s Funding Architecture: key trends and challenges
Six module course series organized jointly with the UN Department of Economic and Social Affairs
Sponsored by the Permanent Mission of Switzerland to the UN
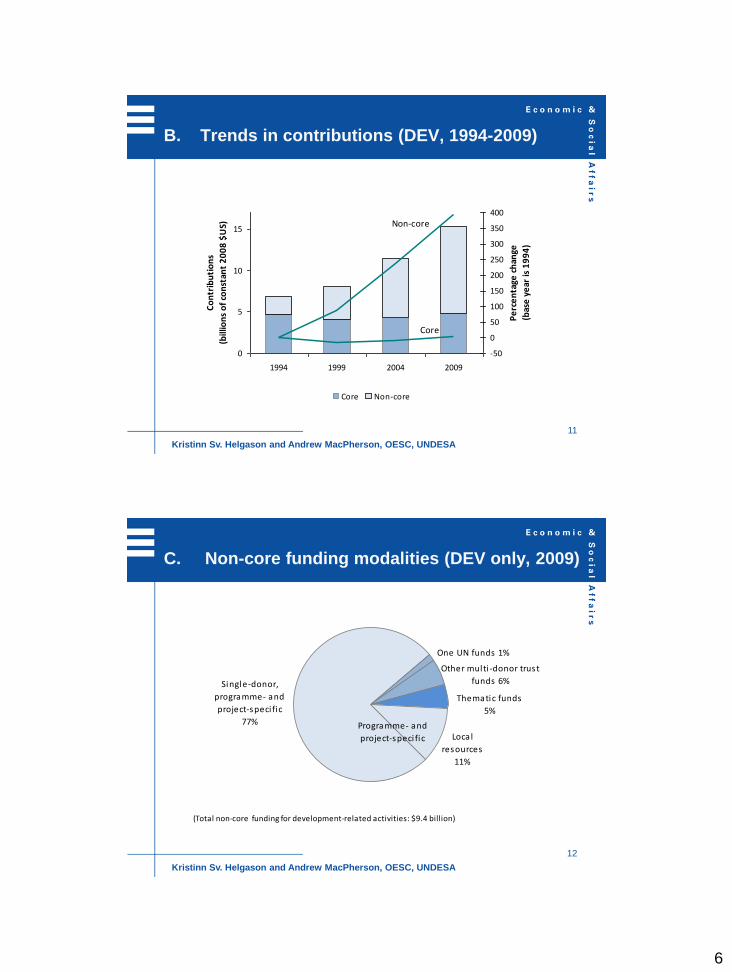
Agency-specific thematic funds
These are funds which generally allow UN agencies to programme more responsively, based on
country and global priorities, without having to negotiate project agreements and conditions.
Thematic funds are pooled and designed to have fewer restrictions on their use than traditional
non-core resources. Examples include UNFPA’s Maternal Health Thematic Fund and UNICEF’s
Thematic Fund for Basic Education and Gender Equality.
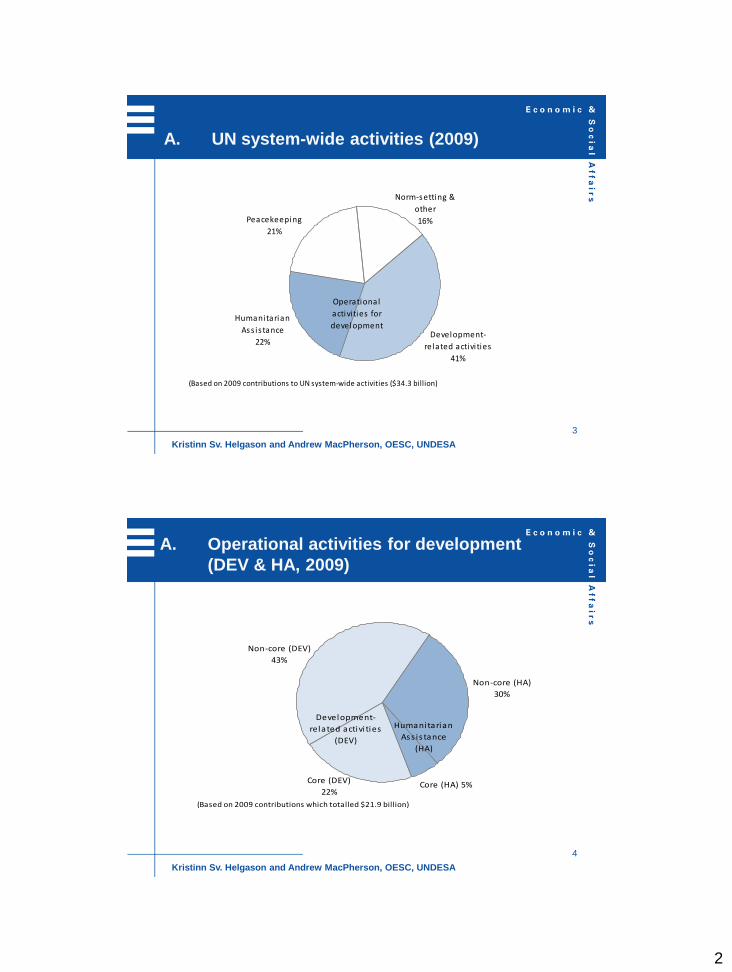
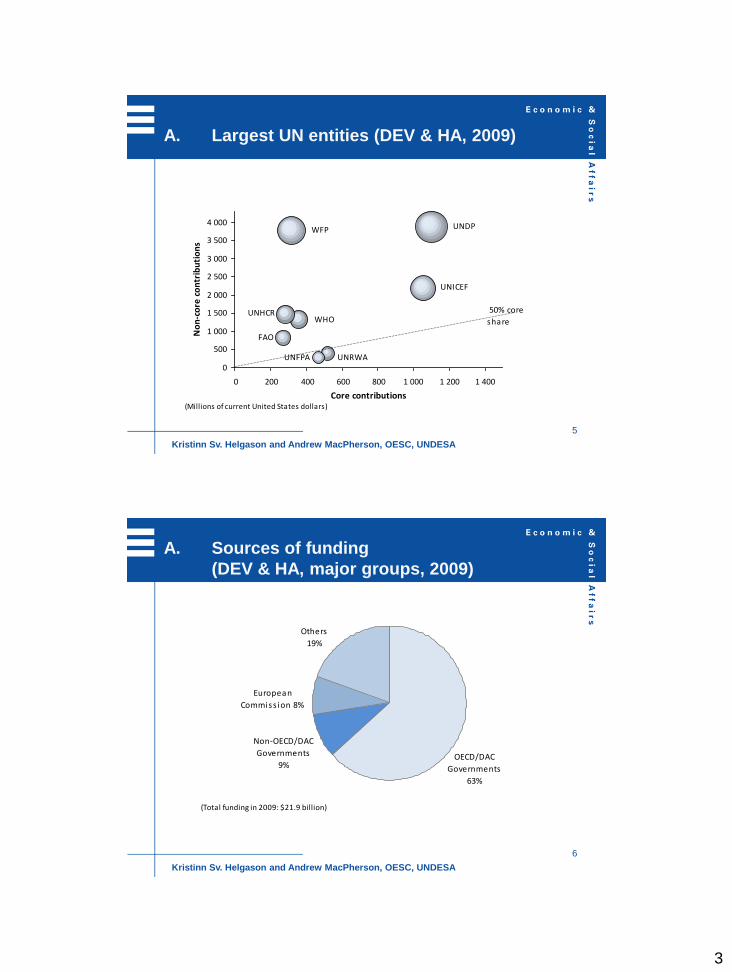
Core and non-core resources
Operational activities for development are funded by a combination of so-called core and non-
core resources. Core resources are those that are commingled without restrictions and whose use
and application are directly linked to the strategic mandates, guidelines, priorities and goals
established by the respective intergovernmental governing bodies. Non-core resources are
resources that are generally restricted with regard to their use and application as determined by
the contributor. The degree to which the use and application of non-core resources are subject to
and aligned with the mandates, guidelines, priorities, and goals established by intergovernmental
governing bodies is at best indirect. Core resources are generally preferred by UN agencies since
they are required to preserve the UN’s multilateral, impartial and universal character. Core
resources also tend to provide more flexibility to spend on the priorities of programme countries.
Selected Funding Terms
Preparations for the 2012 Quadrennial Comprehensive Policy Review of the General Assembly of UN operational
activities for development
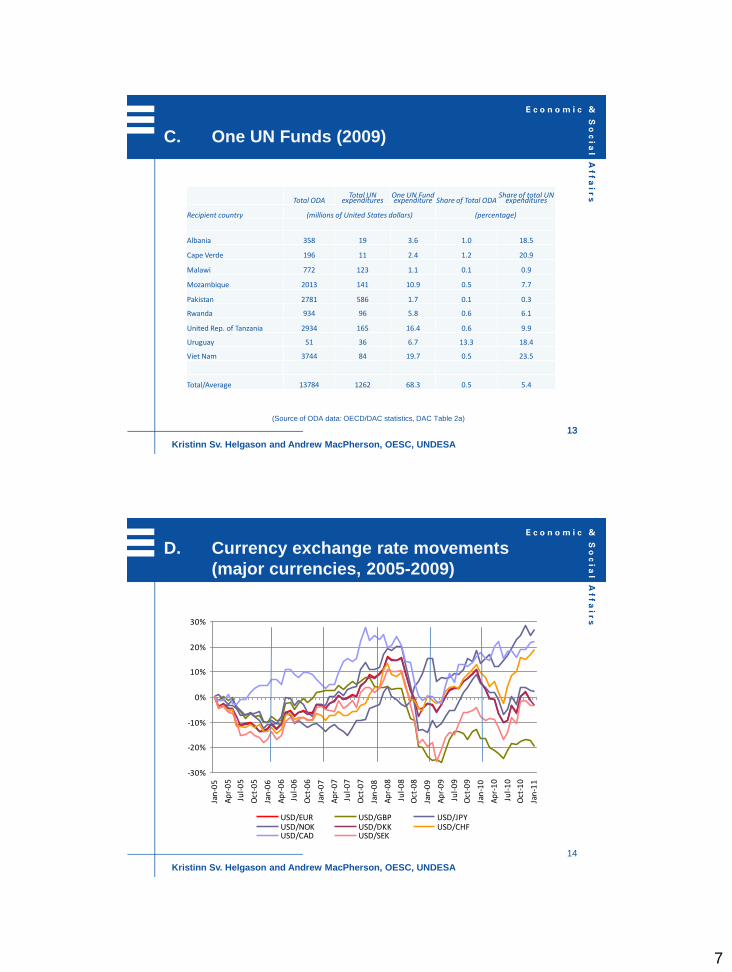
Multi-partner trust funds (MPTFs)
These funds are a type of joint programme which uses the pass-through fund management model.
Donors agree to channel the funds through one UN agency (the “Administrative Agent”) which
distributes the funds to multiple UN participating organizations. MPTFs are designed to enhance
coherence and provide more flexible funding than traditional non-core resources. One UN
Country Funds are a type of MPTF. For example, the Mozambique One UN Fund receives
contributions from 6 countries and engages 18 UN funds, programmes and agencies to deliver
results in support of the national development objectives and priorities.
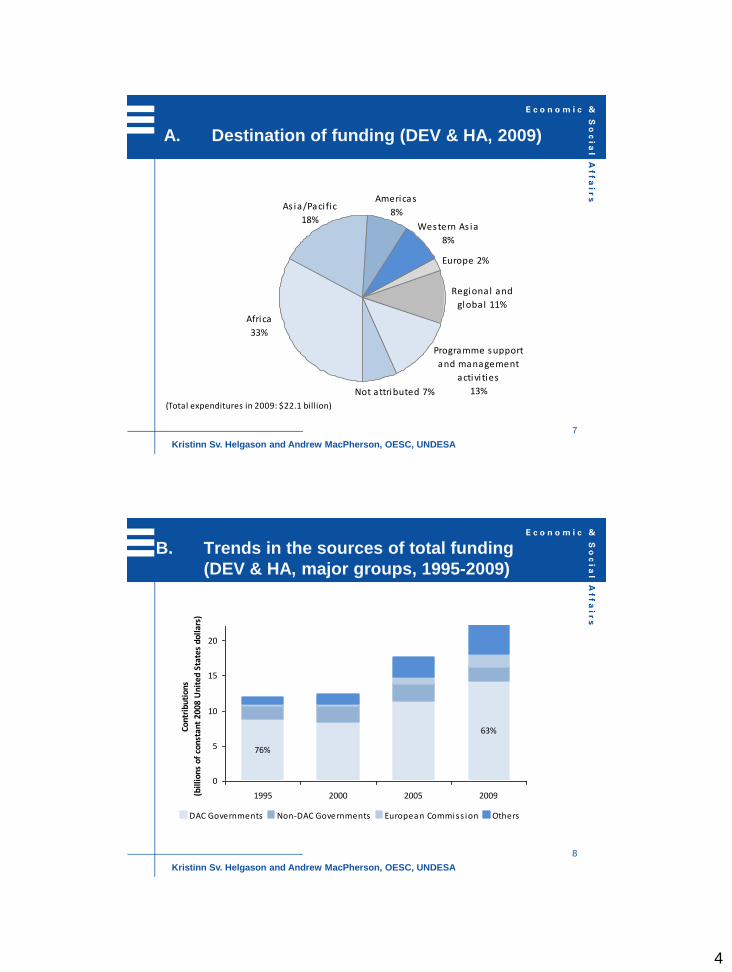
Nominal versus real terms
Comparisons and trend analyses in “real terms” are based on nominal amounts expressed in
constant United States dollars which take into account the combined effect of inflation and
exchange rate movements. This is done to make data comparable across different time periods.
Operational activities for development
These are activities of UN funds, programmes and agencies which have the specific objective of
promoting development. Most United Nations entities have specific mandates in this regard.
Thirty-six UN entities received contributions for operational activities for development in 2009.
Operational activities for development cover both longer-term development-related activities as
well as activities with a humanitarian assistance focus. Humanitarian assistance refers to activities
that respond to an immediate crisis, such as the emergency operations put in place following the
2010 earthquake in Haiti.
31/01/2012
1
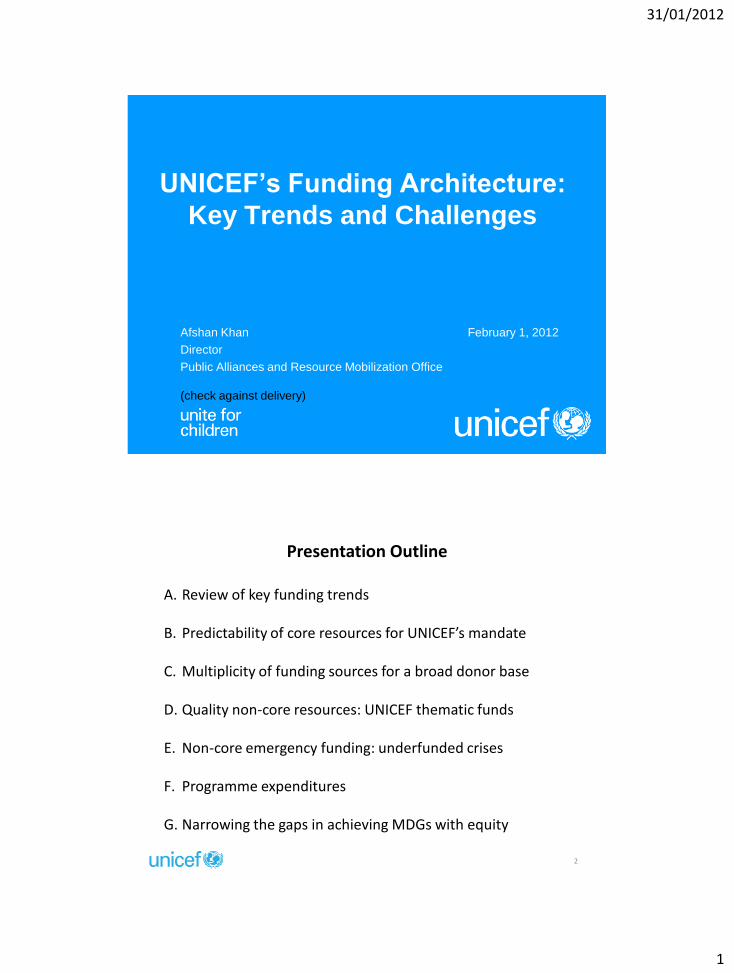
UNICEF’s Funding Architecture:
Key Trends and Challenges
Afshan Khan February 1, 2012
Director
Public Alliances and Resource Mobilization Office
(check against delivery)
Presentation Outline
2
A. Review of key funding trends
B. Predictability of core resources for UNICEF’s mandate
C. Multiplicity of funding sources for a broad donor base
D. Quality non-core resources: UNICEF thematic funds
E. Non-core emergency funding: underfunded crises
F. Programme expenditures
G. Narrowing the gaps in achieving MDGs with equity
31/01/2012
2
UNICEF Total Income: 2002 – 2011(USD millions)
*2011 figures are provisional
3
• UNICEF is 100% voluntarily funded
Total UNICEF Income by Funding Type: 2011*
(USD)
*2011 figures are preliminary
4
Regular Resources (RR) Un-earmarked, core resources that help sustain UNICEF assisted programmes and enable UNICEF to carry out its mission to improve the lives of children and women.
Other Resources (OR)Earmarked contributions for programmes that are supplementary to the contributions to Regular Resources and are restricted to a particular programme, geographic area, or strategic priority, or (ORE) an emergency response.
31/01/2012
3
Un-earmarked regular resources –highest quality funding to UNICEF
5
• Regular resources:
Provide the highest quality and flexibility of funding and help ensure the organization’s independence, neutrality and role as a trusted partner, with adequate highly-skilled capacity at country level, for country-driven, innovative, and efficient programme activities
Enable quick and flexible responses to changing circumstances –allowing the channeling of resources to programme areas where most needed and to new emerging challenges, exploration of innovative approaches, and new partnerships
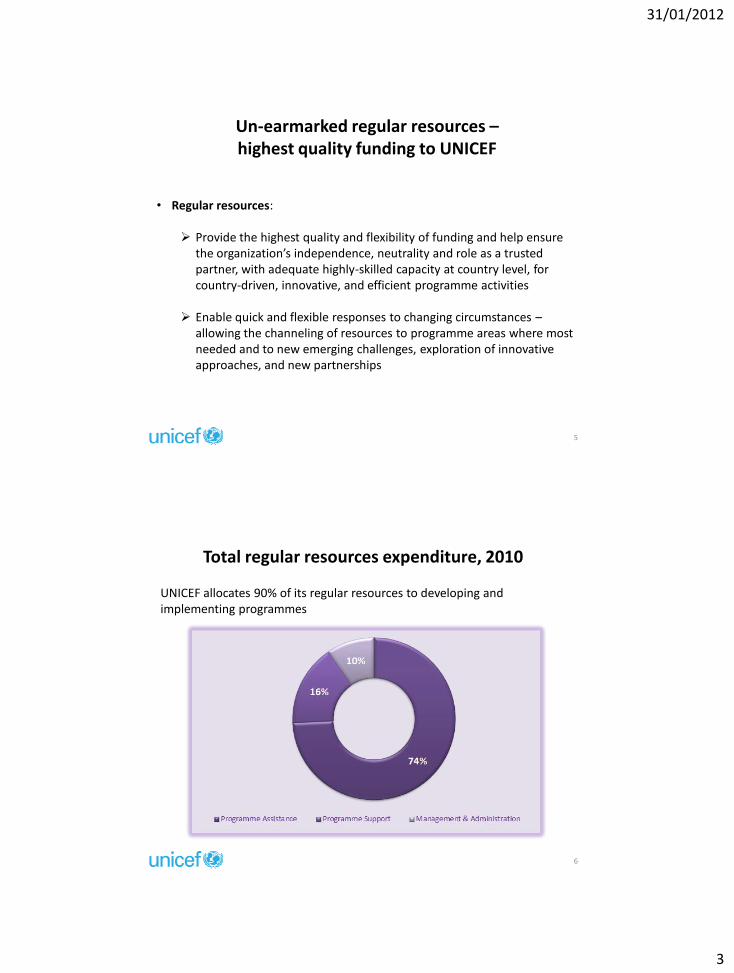
Total regular resources expenditure, 2010
6
UNICEF allocates 90% of its regular resources to developing and implementing programmes
31/01/2012
4
Regular resources narrow the gaps in MDGs achievement by investing in the most vulnerable
7
2010: Core resource programmeassistance expenditure: Top 10 Countries
• UNICEF utilizes a formula approved by its Executive Board that ensures LDCs receive at least 60% of core resources and countries in Sub-Saharan Africa receive at least 50%.
• In 2010, UNICEF allocated 90% of core programme assistance to priority countries based on under-5 child mortality rates, GNI per capita, and size of the child population.
Income by Funding Type: 2007-2011
*2011 figures are preliminary
8
UNICEF’s share of core resources has followed an overall trend of decline
31/01/2012
5
The risk to UNICEF of declining regular resources
9
• A reduced regular resource base:
Decreases the proportion directly regulated by UNICEF’s Executive Board
Compromises UNICEF’s ability to deliver on its mandate and complete the plan of work outlined by its Board and UN General Assembly
Risks curtailing UNICEF’s global presence
Reduces the organization’s capacity to provide continued leadership and innovation on child-related priorities, including during emergencies
Increases fragmentation and programmatic gaps
Risks changing the very character of UNICEF
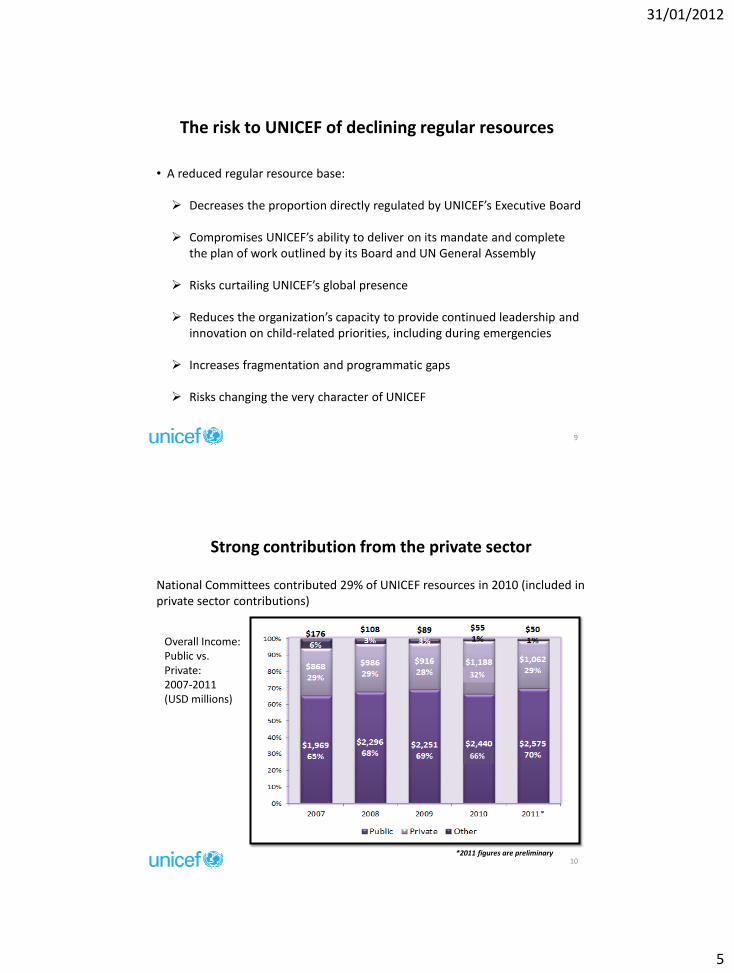
Overall Income: Public vs. Private: 2007-2011 (USD millions)
*2011 figures are preliminary10
Strong contribution from the private sector
National Committees contributed 29% of UNICEF resources in 2010 (included in private sector contributions)
USD
mill
ion
s
32%
66%
31/01/2012
6
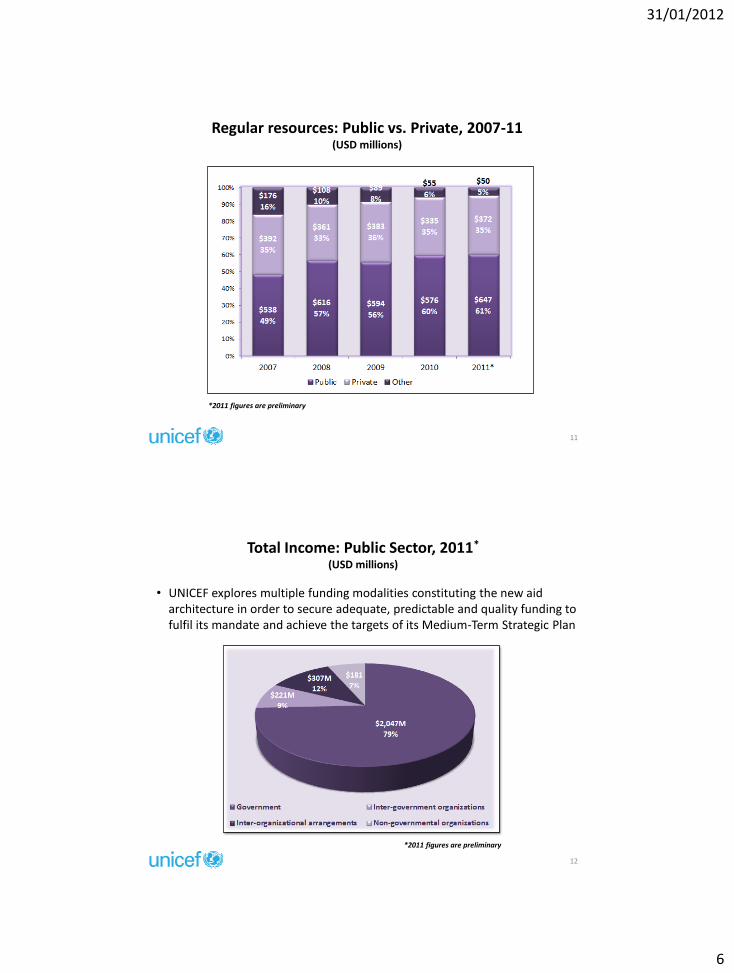
Regular resources: Public vs. Private, 2007-11(USD millions)
USD
mill
ion
s
*2011 figures are preliminary
11
Total Income: Public Sector, 2011*
(USD millions)
*2011 figures are preliminary
12
• UNICEF explores multiple funding modalities constituting the new aid architecture in order to secure adequate, predictable and quality funding to fulfil its mandate and achieve the targets of its Medium-Term Strategic Plan
31/01/2012
7
Overall Income - Public Sector, 2007-11(USD millions)
USD
mill
ion
s
*2011 figures are preliminary
13
DAC vs. Non-DAC donors, 2011*
*2011 figures are preliminary
14
• A broad donor base helps ensure impartial, neutral assistance, and decreases dependencies to implement UNICEF’s mandate
• UNICEF is committed to supporting South-South cooperation, through which developing countries are becoming supporters and contributors to other countries’ development, particularly in capacity building
31/01/2012
8
Top 10 Government Donors, 2011*
(USD millions)
*2011 figures are preliminary
15
Top 10 Non-DAC Donors, 2011*
(USD thousands)
*2011 figures are preliminary
16
31/01/2012
9
Quality other resource thematic funds
17
• UNICEF thematic funds are the best alternative to regular resources:
Pooled contributions from all donors
Earmarked only up to Medium-Term Strategic Programme focus area: Young Child Survival & Development; Basic Education and Gender Equality; HIV/AIDS; Child Protection; Policy & Practice; plus Humanitarian Action
Funding at either Global, Regional or Country level
Expenditure tracked for overall pooled contributions
Consolidated annual narrative report / financial statement per focus area
Lower recovery rate (5% vs. 7%) accounting for reduced transaction costs
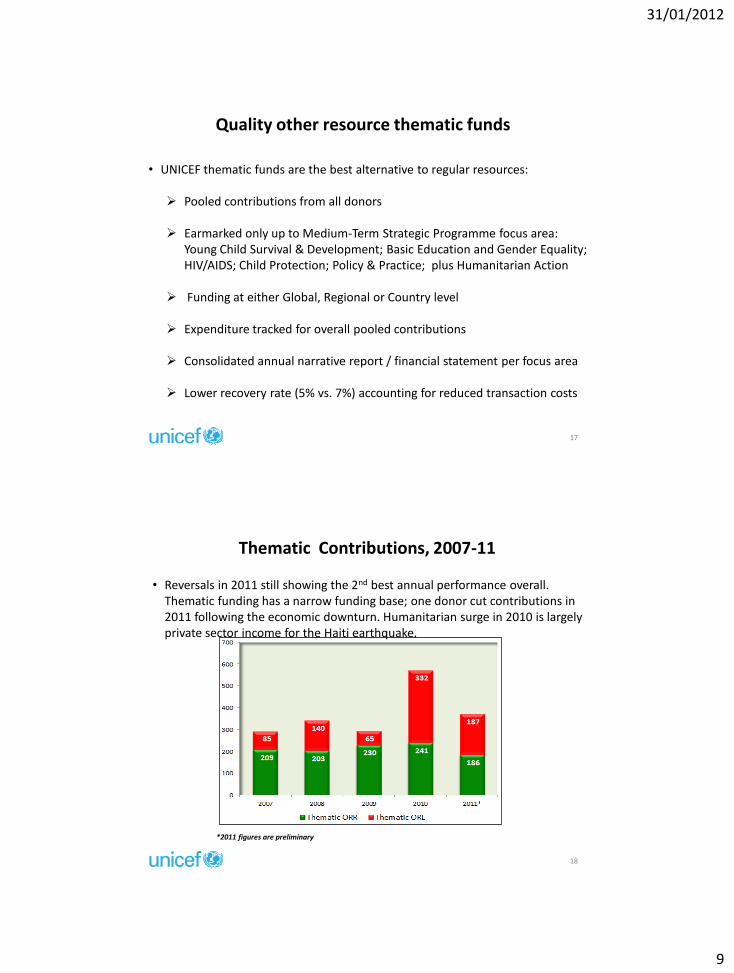
Thematic Contributions, 2007-11
*2011 figures are preliminary
18
• Reversals in 2011 still showing the 2nd best annual performance overall. Thematic funding has a narrow funding base; one donor cut contributions in 2011 following the economic downturn. Humanitarian surge in 2010 is largely private sector income for the Haiti earthquake.
31/01/2012
10
Thematic Contributions, 2011by MTSP Focus Areas & Humanitarian
Thematic Contributions 2011*: US$373 million
*2011 figures are preliminary
19
Other Resources – Emergency, 2002-2011(USD millions)
*2011 figures are preliminary
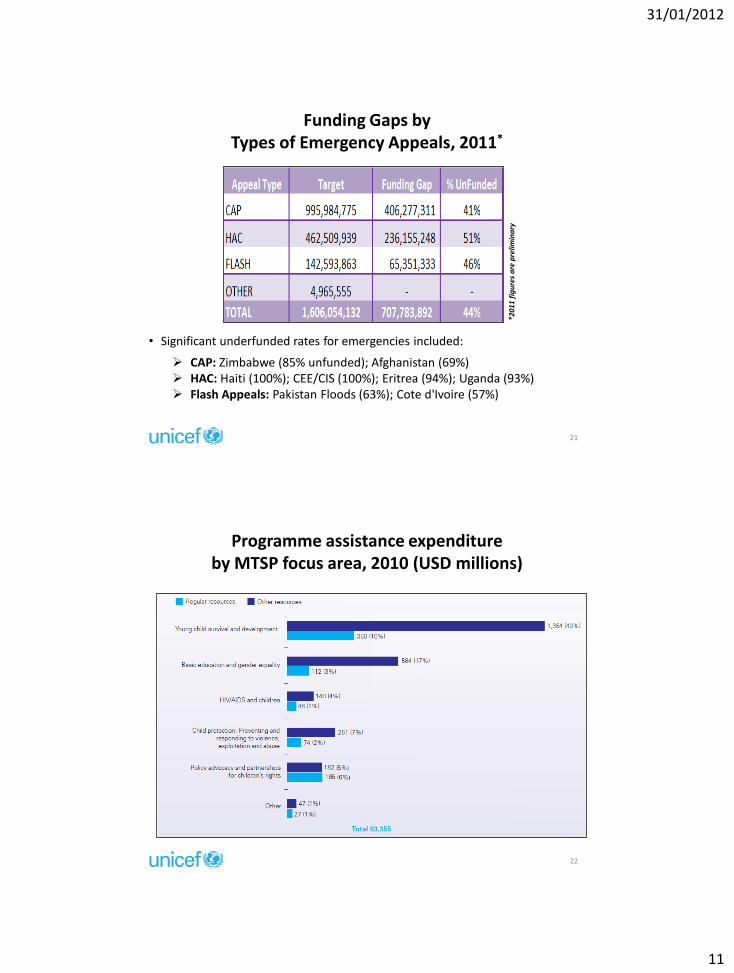
20
• Highly volatile income trend dependent on major global emergencies, e.g. a) 2004/05: East Asia Tsunami; b) 2010: Haiti earthquake and Pakistan floods; c) 2011: Horn of Africa crisis
• Significant underfunded rates for emergencies included:
22
Programme assistance expenditure by MTSP focus area, 2010 (USD millions)
31/01/2012
12
23
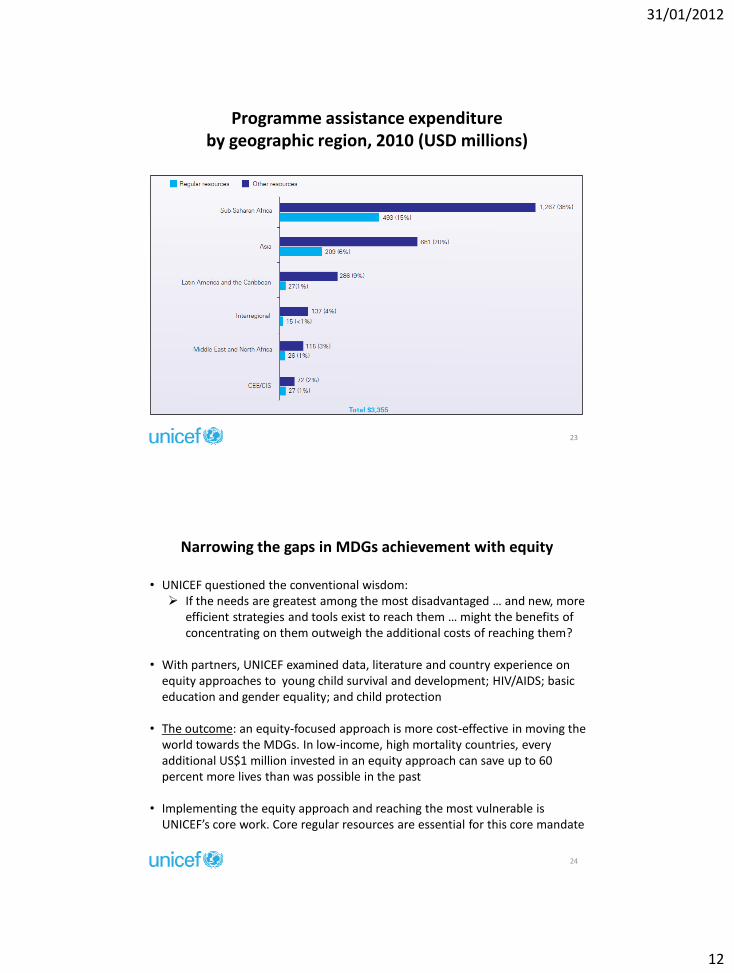
Programme assistance expenditure by geographic region, 2010 (USD millions)
Narrowing the gaps in MDGs achievement with equity
24
• UNICEF questioned the conventional wisdom: If the needs are greatest among the most disadvantaged … and new, more
efficient strategies and tools exist to reach them … might the benefits of concentrating on them outweigh the additional costs of reaching them?
• With partners, UNICEF examined data, literature and country experience on equity approaches to young child survival and development; HIV/AIDS; basic education and gender equality; and child protection
• The outcome: an equity-focused approach is more cost-effective in moving the world towards the MDGs. In low-income, high mortality countries, every additional US$1 million invested in an equity approach can save up to 60 percent more lives than was possible in the past
• Implementing the equity approach and reaching the most vulnerable is UNICEF’s core work. Core regular resources are essential for this core mandate
31/01/2012
13
Thank you!25
1
Regular Resources
OVERVIEW OF UNDP INCOME
REGULAR AND OTHER RESOURCES
Orientation session for Member States
Romesh Muttukumaru
Deputy Assistant Administrator
1 February 2012
Bureau for External Relations and Advocacy
SOME BASIC FACTS ABOUT UNDP
• UNDP is a voluntary funded organization
• UNDP is the United Nations' global development network and fulfills two roles: as manager of the UN resident coordinator system; and as a development agency working to achieve sustainable development
• UNDP has a universal presence working in 177 countries; with representational country offices in 127 countries in the world
2
Some key definitions
• Core or regular resources
• Non core or other resources
• Third party Cost-sharing and (vertical) Trust Funds