29
Confidential Financing Memorandum South San Francisco, California

Confidential Financing Memorandum South San Francisco, California

Palmer Capital, Inc. (“Palmer Capital”) and the owner (“Owner”) of the property referenced herein (“Property”) present this Confidential Financing Memorandum (“Memorandum”) to assist the recipient(s) (“You” or “Your”) in evaluating the Property and it is intended for Your use only. This Memorandum contains brief, selected information pertaining to the Property and should not be considered all-inclusive or permanent. The information in this Memorandum has been obtained from sources believed to be reliable, but has not been verified and is not guaranteed. You should independently verify each item of information and have the same reviewed by Your tax advisor and/or legal counsel. Assumptions, projections, estimates and/or opinions are provided as examples only and all information is subject to change, error, omissions and/or withdrawal without notice. Palmer Capital and Owner assume no responsibility for and make no warranty as to the accuracy or completeness of any information in this Memorandum. Palmer Capital and Owner expressly disclaim any implied or expressed warranties of merchantability, fitness for a particular purpose or non-infringement of intellectual property relating to this Memorandum. In no event shall Palmer Capital or Owner be liable for any damages resulting from the reliance on or use of any information in this Memorandum, including but not limited to direct, special, indirect, consequential or incidental damages. By accepting receipt of this Memorandum, You agree to the following: (a) This Memorandum is of a highly confidential nature, will be held in the strictest confidence and shall be returned to Palmer Capital upon request; (b) You shall not contact any property manager, employee or tenant of the Property regarding the Property or this Memorandum, without prior approval of Palmer Capital or Owner; and (c) You understand and agree that Palmer Capital represents Owner and not You. Neither Palmer Capital nor Owner shall have any obligation to pay any commission, finder’s fee, or any other compensation to any broker or other person. You may provide information to persons retained to evaluate the Property only after first obtaining a signed confidentiality agreement from such persons and providing a copy of such agreement to Palmer Capital. By accepting receipt of this Memorandum, you agree to defend, indemnify and hold harmless Palmer Capital and Owner (including all of their agents, employees, subsidiaries, affiliated entities, successors and assigns) from and against any and all claims, disputes, litigation, demands, damages, liabilities, losses, judgments, expenses, fines, contributions, charges, injuries and/or costs and expenses, including reasonable attorneys’ fees, arising or resulting from acts by You. The Owner expressly reserves the right, at its sole discretion, to reject any or all expressions of interest or offers to finance the Property, and/or to terminate discussions with any entity at any time with or without notice which may arise as a result of review of this Memorandum. The Owner shall have no legal commitment or obligation to any entity reviewing this Memorandum or making an offer to lend on the Property unless and until written agreement(s) for the finance of the Property have been fully executed, delivered and approved by the Owner and any conditions to the Owner's obligations therein have been satisfied or waived.
Copyright © 2013 Palmer Capital, Inc.All use, disclosure and/or reproduction not specifically authorized is prohibited. All rights reserved. 00963368
(916) 462-6300 • www.palmercapital.com
IntroductIon
ProPerty SPecIfIcS
fInancIal analySIS
tenant/leaSe InformatIon
market InformatIon
5 CreditHighlights
10 PropertyDescription
12 CashFlowAnalysis
14 RentRoll
16 RentRollComments
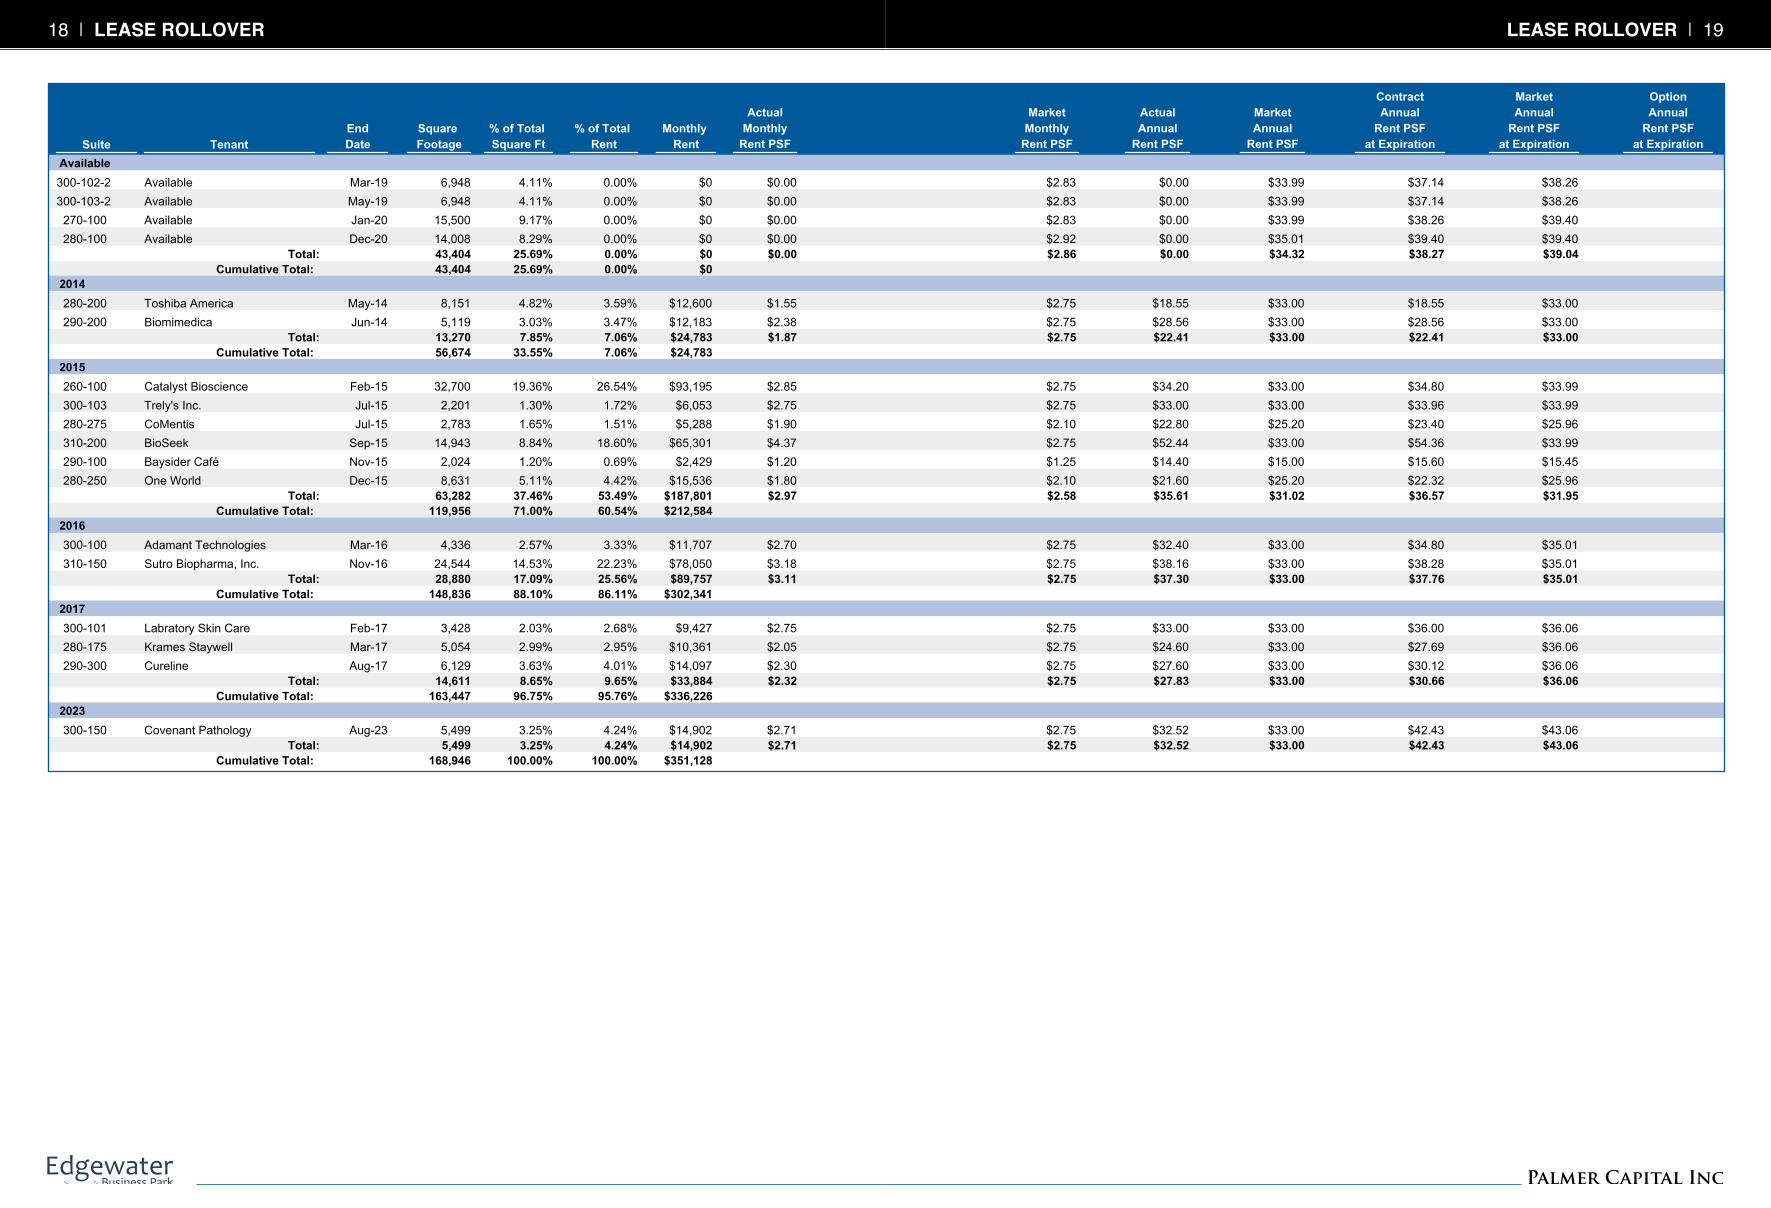
18 LeaseRollover
20 HistoricalSummary
21 TenantProfiles
24 MarketExecutiveSummary
27 MarketAnalysis
32 Comparables
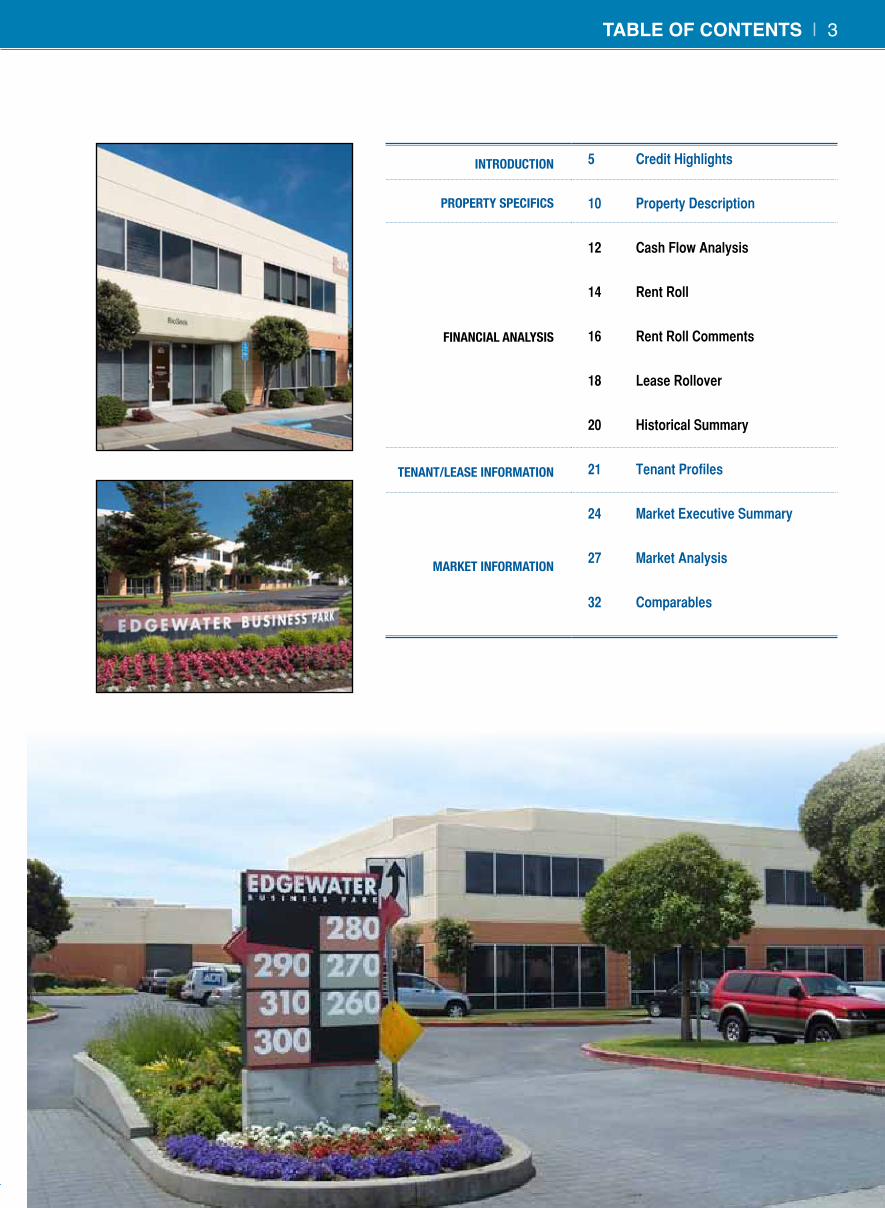
Table of ConTenTs | 3
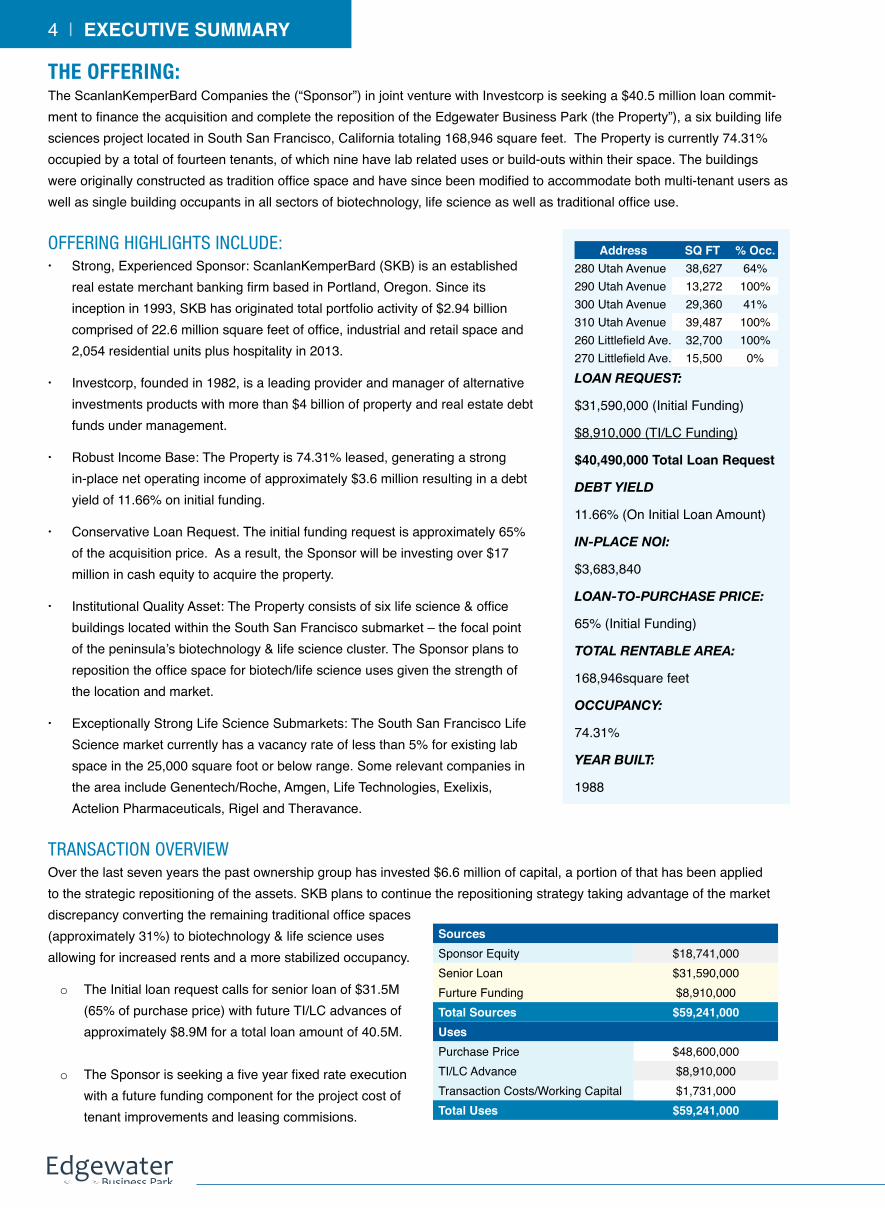
The Offering:The ScanlanKemperBard Companies the (“Sponsor”) in joint venture with Investcorp is seeking a $40.5 million loan commit-ment to finance the acquisition and complete the reposition of the Edgewater Business Park (the Property”), a six building life sciences project located in South San Francisco, California totaling 168,946 square feet. The Property is currently 74.31% occupied by a total of fourteen tenants, of which nine have lab related uses or build-outs within their space. The buildings were originally constructed as tradition office space and have since been modified to accommodate both multi-tenant users as well as single building occupants in all sectors of biotechnology, life science as well as traditional office use.
Offering HigHligHts include:· Strong, Experienced Sponsor: ScanlanKemperBard (SKB) is an established
real estate merchant banking firm based in Portland, Oregon. Since its inception in 1993, SKB has originated total portfolio activity of $2.94 billion comprised of 22.6 million square feet of office, industrial and retail space and 2,054 residential units plus hospitality in 2013.
· Investcorp, founded in 1982, is a leading provider and manager of alternative investments products with more than $4 billion of property and real estate debt funds under management.
· Robust Income Base: The Property is 74.31% leased, generating a strong in-place net operating income of approximately $3.6 million resulting in a debt yield of 11.66% on initial funding.
· Conservative Loan Request. The initial funding request is approximately 65% of the acquisition price. As a result, the Sponsor will be investing over $17 million in cash equity to acquire the property.
· Institutional Quality Asset: The Property consists of six life science & office buildings located within the South San Francisco submarket – the focal point of the peninsula’s biotechnology & life science cluster. The Sponsor plans to reposition the office space for biotech/life science uses given the strength of the location and market.
· Exceptionally Strong Life Science Submarkets: The South San Francisco Life Science market currently has a vacancy rate of less than 5% for existing lab space in the 25,000 square foot or below range. Some relevant companies in the area include Genentech/Roche, Amgen, Life Technologies, Exelixis, Actelion Pharmaceuticals, Rigel and Theravance.
SourcesSponsor Equity $18,741,000Senior Loan $31,590,000Furture Funding $8,910,000Total Sources $59,241,000UsesPurchase Price $48,600,000TI/LC Advance $8,910,000Transaction Costs/Working Capital $1,731,000Total Uses $59,241,000
4 | ExEcUTivE SUmmary
address SQ FT % Occ.280 Utah Avenue 38,627 64%290 Utah Avenue 13,272 100%300 Utah Avenue 29,360 41%310 Utah Avenue 39,487 100%260 Littlefield Ave. 32,700 100%270 Littlefield Ave. 15,500 0%Loan request:
$31,590,000 (Initial Funding)
$8,910,000 (TI/LC Funding)
$40,490,000 Total Loan request
debt yieLd
11.66% (On Initial Loan Amount)
in-pLace noi:
$3,683,840
Loan-to-purchase price:
65% (Initial Funding)
totaL rentabLe area:
168,946square feet
occupancy:
74.31%
year buiLt:
1988
transactiOn OverviewOver the last seven years the past ownership group has invested $6.6 million of capital, a portion of that has been applied to the strategic repositioning of the assets. SKB plans to continue the repositioning strategy taking advantage of the market discrepancy converting the remaining traditional office spaces (approximately 31%) to biotechnology & life science uses allowing for increased rents and a more stabilized occupancy.
o The Initial loan request calls for senior loan of $31.5M (65% of purchase price) with future TI/LC advances of approximately $8.9M for a total loan amount of 40.5M.
o The Sponsor is seeking a five year fixed rate execution with a future funding component for the project cost of tenant improvements and leasing commisions.

crEdiT HigHLigHTS | 5
CreditHiGHLiGHtS
TOp-Tier insTiTuTiOnal spOnsOrship
tHe scanlanKemperBard cOmpanies
(www.sKBcOs.cOm)The ScanlanKemperBard Companies (SKB) is an established real estate merchant banking firm based in Portland, Oregon. Since its inception in 1993, SKB has originated total portfolio activity of $2.94 billion comprised of 22.6 million square feet of office, industrial and retail space and 2,054 residential units plus hospitality. The company has completed multiple accusations located in over seventeen metros in eleven different states. With longstanding relationships in each of their markets, SKB has the ability to source, structure and execute value creation across a wide spectrum of real estate opportunities.
Investcorp, founded in 1982, is a leading provider and manager of alternative investment products, serving high-net worth private and institutional clients. The firm currently has approximately $10.5 billion of assets under management. Since 1985, Investcorp has acquired about 200 properties with a total value of approximately $10 billion. They currently have more than $4 billion of property and real estate debt funds under management.
sTable incOme sTreamThe Portfolio is currently 74.31% leased to fourteen tenants, of which nine have a specific lab use or build-out, and presently shows an in-place Net Operating Income of $3.6M which represents an underwritten Debt Service Coverage of 2.04x, with an underwritten NOI Debt Yield of 11.66%.
stabLe income
$3,250,000
$4,000,000
$4,750,000
$5,500,000
$6,250,000
Year 1 2 3 4 5 6 7 8 9 101.0
1.5
2.0
2.5
3.0
3.5

cOnservaTive lOan requesTThe requested initial loan amount of $31.5M represents a conservative loan basis of $186 per square foot, significantly below replacement costs, and equates to 65% of the purchase price. The Sponsor is also seeking the ability to draw a TI/LC advance of approximately $8.9M upon tenant demands or as when needed to reposition the suits when they come to market. The properties will be cross collateralized giving the lender further downside protection.
significanT cash equiTy invesTmenTThe Sponsor is in contract to acquire the Portfolio for $48.6M. At the close of acquisition, the Sponsor will invest $17M of new equity. Over the projected hold period of three to five years the Sponsor plans to execute a repositioning strategy of the traditional office portion (approximately 31% of the total square footage) of the Park to facilitate the strong demand for biotechnology & life science space.
insTiTuTiOnal qualiTy life science asseTThe Edgewater Business Park (the “Property”), is a six building life science project located in South San Francisco, California. The Buildings were constructed as traditional office and have been modified to accommodate both multi-tenant users as well as single building occupants in all sectors of biotechnology and life science with the building floor plates ranging in size from 15,000 to 35,000 square feet. The Property also has two “Vivariums”, an attribute that helps to position the buildings against the competitive properties in the area. Four out of the six buildings have existing wet labs and five of the six buildings can presently accommodate varying life science uses. There are three access points to the site, one off Utah Avenue and two off Littlefield Avenue, each provide direct access to all parking areas. The site is comprised of 8.42 acres.
lOading dOcKs:A combination of dock-high, at-grade, and ramp-to-dock loading areas are located at the various buildings throughout the site. A total of nine dock-high and five at-grade loading areas are provided. Loading dock doors are typically un-insulated, hollow metal roll up doors. Dock-high loading areas are typically recessed at the building perimeter and include dock leveler plates as well as dock bumpers.
building at grade dock-High280 Utah Avenue None None290 Utah Avenue 1 – 12' 0" x 12' 0" None310 Utah Avenue None 1 – 10' 0" x 10' 0"300 Utah Avenue 1 – 12' 0" x 12' 0" None
260 Littlefield Avenue None5 – 12' 0" x 12' 0"2 – 10' 0" x 10' 0"
270 Littlefield Avenue 1 – 12' 0" x 12' 0" None
6 | CrediT HigHligHTs

To DowntownSan Francisco
SAN FRANCISCOBAY
Oyster Point
OYSTE
R POIN
T BLV
D
FORB
ES B
LVD
E. G
RAND
AVE
NUE
GATEWAY BLVD
*
OuTsTanding regiOnal accessThe buildings are located off Highway 101 (the major north/south thoroughfare between Silicon Valley and San Francisco). The Property is only 15 minutes from Downtown San Francisco, 25 minutes from Palo Alto, and 15 minutes to both the Bay and San Mateo Bridges providing a competitive advantage for corporate users that require access to the labor pools throughout the Bay Area. Additionally, Edgewater Business Park is less than 4 miles north of San Francisco International Airport.
sTraTegic life science
business park
The Edgewater Business Park is positioned correctly to capture the increasing demand by life science & biotechnology companies looking for plug and play life science options that can accommodate users under 25,000 square feet. The Property’s suites range from approximately 2,000 SF to 33,000 SF and can accommodate a verity of life science build-outs. There is a lack of ready to use life science space within the South San Francisco Life Science market for companies looking to expand during and following the drug discovery phase. The ability to accommodate this type of small to mid-size space needs within the Edgewater Business Park helps to position it
against any competitive set within the market and in turn giving it a strong competitive advantage for the growth demand shown by emerging life science companies.
Existing lab space in the surrounding area for options less than 25,000 square feet is approximately 5%. The low vacancy level has a direct impact on increased rental rates in the area, shifting the leverage to the existing ownership base. The scarcity and barrier to entry is attributed to the significant initial capital investment associated with converting space to smaller life science uses which has already been executed at the Property.
CrediT HigHligHTs | 7
san mateo bridge
bay bridge

maTure biOTechnOlOgy and life science markeTThe Bay Area’s concentration of life science firms is the largest in Northern California with over 1,300 companies and 100,000 direct employees in the sector.
Over the last few decades, South San Francisco has emerged as the focal point for the growth of biotechnology and life science firms. Since the founding of Genentech, biotechnology has grown steadily in South San Francisco with over 70 biotech firms and close to 15,000 biotech related employees. Major tenants with significant footprints in the South San Francisco include such firms such as Genentech/ Roche, Amgen, Onyx Pharmaceuticals, Exelixis, Actelion Pharmaceuticals, Rigel, Rinat, and Theravance. Current market vacancy for existing built-out life science space for the past few quarters has ranged between 8% and 10%.
The Mission Bay district is one of the foremost urban redevelopment projects in the nation. This extraordinary 303 acre mixed-use redevelopment district will include 6 million square feet of office/lab space, 6,000 housing units, 500,000
square feet of retail, a 550-room hotel, and 41 acres of new park and recreational areas, all anchored by the University of California, San Francisco’s (UCSF) new multi-billion dollar research campus and hospital. Major tenants in Mission Bay include Nektar Therapeutics, Bayer Pharmaceuticals, California Institute for Regenerative Medicine, QB3, FibroGen, and Celegene.
Enormous scientific talent pool and direct access to the nation’s leading biomedical research institutions, including U.C.S.F., Stanford University, and U.C. Berkeley. As a result, the Bay Area is home to the largest concentration of industry related jobs (53,399 employees representing over 19% of all biomedical employment in California in 2008).
Motivated by evolving technologies, demographic trends, the current regulatory environment, and aging patent portfolios, venture capitalists continue to direct significant capital into life science firms based in the Bay Area.
MAJORBAYAREARESEARCHINSTITUTIONS&LIFESCIENCECOMPANIESSanFrancisco(MissionBay) Peninsula EastBay SiliconValley
Bayer Amgen Asta-Zeneca Alexza Pharm
Ca. Inst. Of Quantitative Biom. Res. BMS Baxter-Bioscience Affmetrix
CA Inst. Of Regenerative Medicine CardioDX Bayer Boston Scientific
Celgene Cytokinetics Bio-Rad Labs Durect Corp
Cloris Oncology DepoMed BMY Genencor International
Fibrogen Exelixis Inc. Boston Scientific Jazz Pharmaceuticals
Illumina FivePrime Therapeutics Celera MAP Pharm
J. Gladstone Institutes Genentech/Roche Cerus MedImmune
Medivation Geron Corp Children’s Hospital Oakland Res. Inst. NASA Ames Research Center
Nektar Therapeutics Gilead Sciences Dynavax Technologies Pacific Biosciences
Presidio Pharmaceuticals InterMune Kosan SRI International
University of Cal-San Francisco Life Technologies Lawrence Berkeley National Lab Stanford Linear Accelerator
Maxgen Lawrence Livermore National Lab Stem Cells Inc.
Monogram Biosciences Novartis Theranos
Morek Roche Molecular Systems Vivus
Natera Sandia National Lab Xeno Port
Novartis Theranos
NGM Bio University of Cal- Berkeley
Onyx Pharmaceuticals US Dept of Energy Joint Genome Inst.
Rigel Pharm
SciClone
Solazyme
Sunesis Pharm
Tercica, Inc.
Theravence Inc.
8 | CrediT HigHligHTs

9

SITE BOUNDARY
UTAH
AVENU
E
LITTLEFIELD AVENUE
300 Utah
310 Utah
280 Utah
270 Littlefield
260 Littlefield
290 Utah
Property descriptionBuilding Square Footage: 168,946Year Built: 1988 /1989Architect: Design and Engineering Systems, Inc.Land Area: 8.42 acresNumber of Buildings: 6
Number of Floors:1 two-story building, 2 one-story building and 3 one-story buildings with
mezzanine space
Loading Docks:
A total of nine dock-high and five at-grade loading docks are provided. Loading
dock doors are typically un-insulated, hollow metal roll up doors. Dock-high
loading areas are typically recessed at the building perimeter and include dock-
leveler plates and dock bumpers.
Parking:
435 parking stalls with 18 accessible stalls (6 of which are van-accessible).
Electronic vehicle charging stations are also provided.
Parking ratio 2.6/1,000 sf
10 | ProPerTy desCriPTion
41% Occupied
100% Occupied
64% Occupied
0% Occupied
100% Occupied
100% Occupied
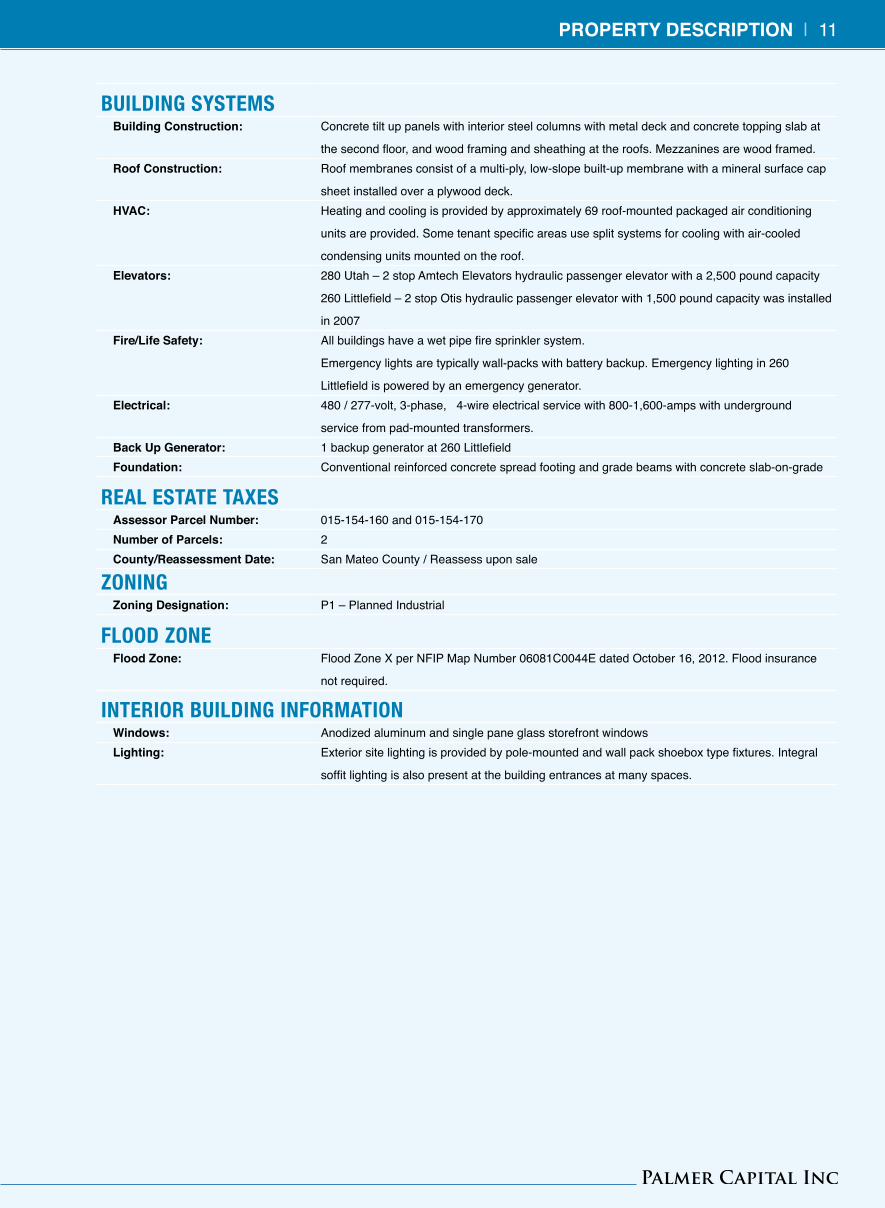
building sysTemsbuilding Construction: Concrete tilt up panels with interior steel columns with metal deck and concrete topping slab at
the second floor, and wood framing and sheathing at the roofs. Mezzanines are wood framed.roof Construction: Roof membranes consist of a multi-ply, low-slope built-up membrane with a mineral surface cap
sheet installed over a plywood deck.HvaC: Heating and cooling is provided by approximately 69 roof-mounted packaged air conditioning
units are provided. Some tenant specific areas use split systems for cooling with air-cooled
condensing units mounted on the roof.elevators: 280 Utah – 2 stop Amtech Elevators hydraulic passenger elevator with a 2,500 pound capacity
260 Littlefield – 2 stop Otis hydraulic passenger elevator with 1,500 pound capacity was installed
in 2007 fire/life safety: All buildings have a wet pipe fire sprinkler system.
Emergency lights are typically wall-packs with battery backup. Emergency lighting in 260
Littlefield is powered by an emergency generator.electrical: 480 / 277-volt, 3-phase, 4-wire electrical service with 800-1,600-amps with underground
service from pad-mounted transformers.back Up generator: 1 backup generator at 260 Littlefieldfoundation: Conventional reinforced concrete spread footing and grade beams with concrete slab-on-grade
real esTaTe Taxesassessor Parcel number: 015-154-160 and 015-154-170number of Parcels: 2County/reassessment date: San Mateo County / Reassess upon sale
ZOningZoning designation: P1 – Planned Industrial
flOOd ZOneflood Zone: Flood Zone X per NFIP Map Number 06081C0044E dated October 16, 2012. Flood insurance
not required.
inTeriOr building infOrmaTiOnWindows: Anodized aluminum and single pane glass storefront windowslighting: Exterior site lighting is provided by pole-mounted and wall pack shoebox type fixtures. Integral
soffit lighting is also present at the building entrances at many spaces.
ProPerTy desCriPTion | 11
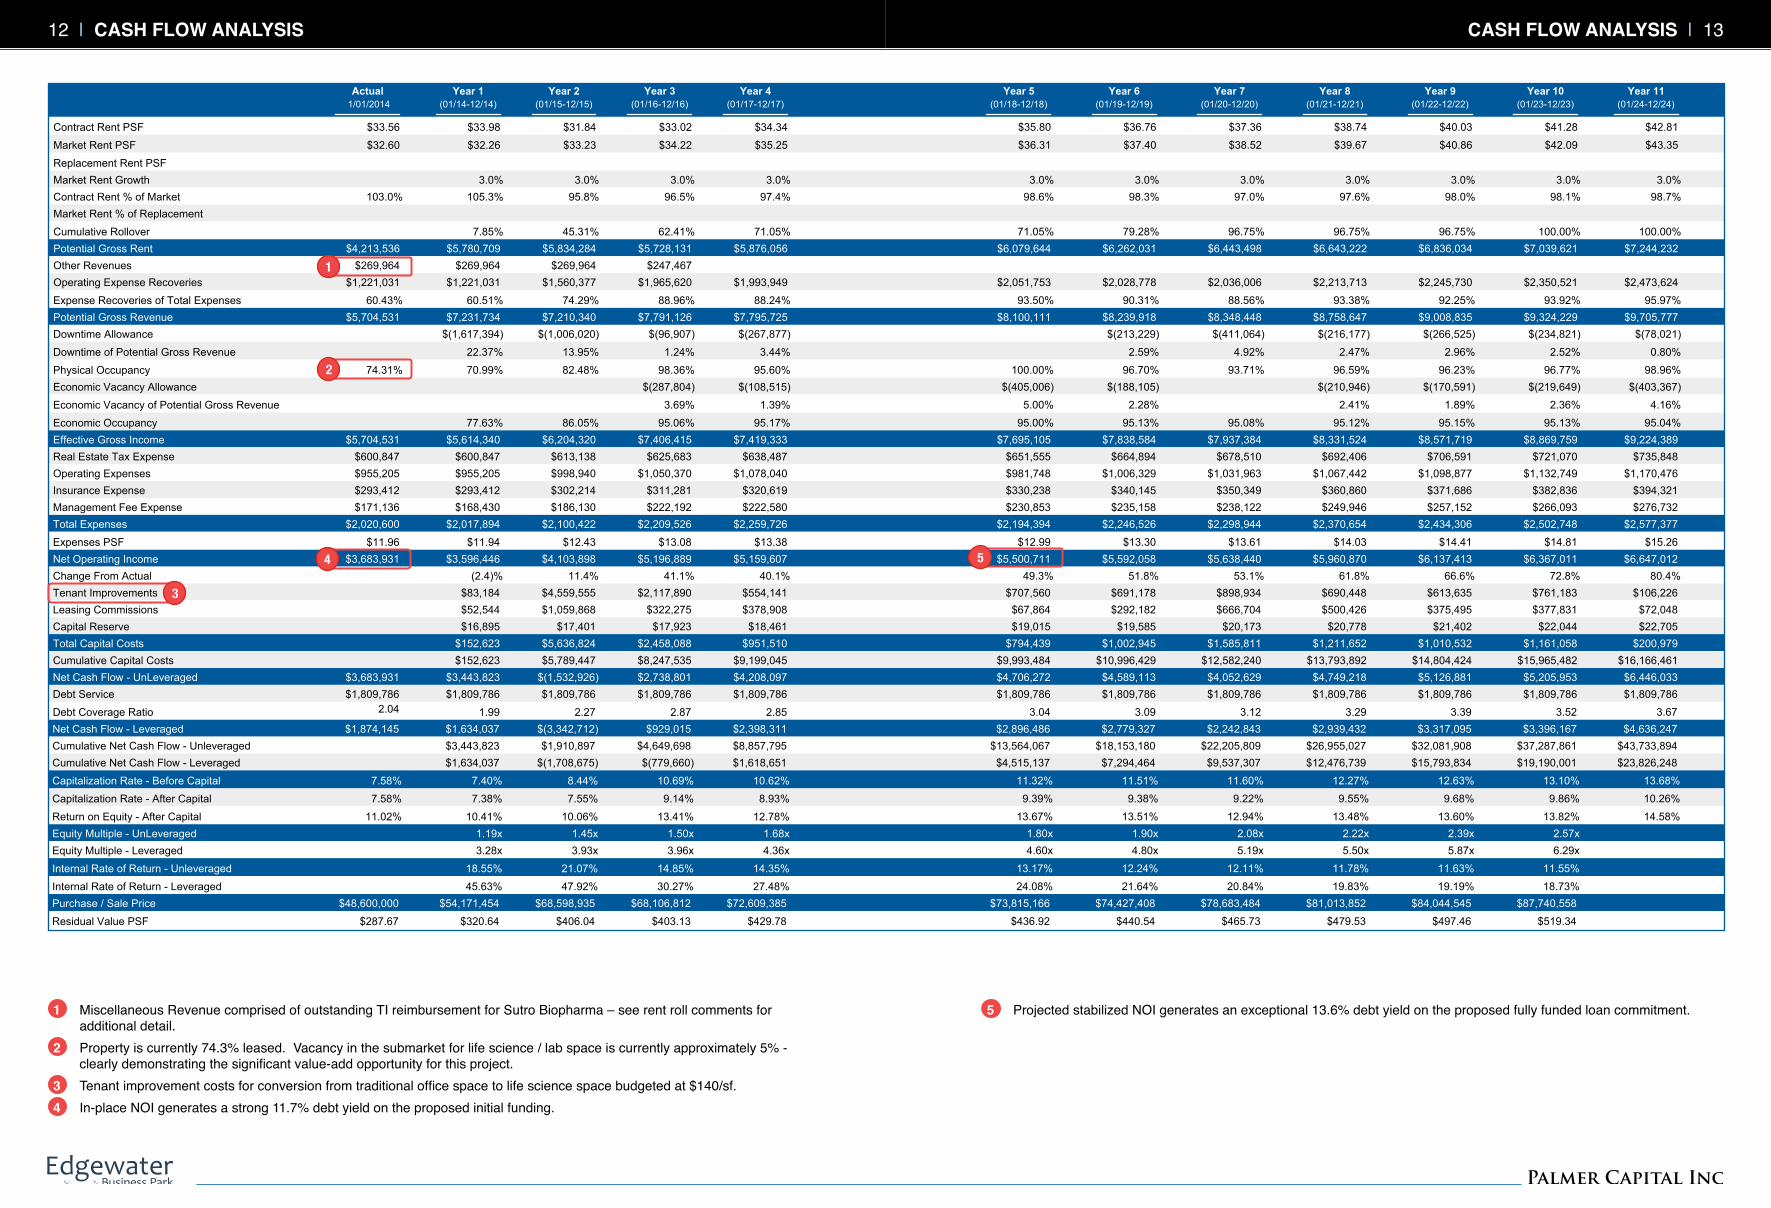
Actual Year 1 Year 2 Year 3 Year 4 Year 5 Year 6 Year 7 Year 8 Year 9 Year 10 Year 11 1/01/2014 (01/14-12/14) (01/15-12/15) (01/16-12/16) (01/17-12/17) (01/18-12/18) (01/19-12/19) (01/20-12/20) (01/21-12/21) (01/22-12/22) (01/23-12/23) (01/24-12/24)
Contract Rent PSF $33.56 $33.98 $31.84 $33.02 $34.34 $35.80 $36.76 $37.36 $38.74 $40.03 $41.28 $42.81
Market Rent PSF $32.60 $32.26 $33.23 $34.22 $35.25 $36.31 $37.40 $38.52 $39.67 $40.86 $42.09 $43.35
Replacement Rent PSF
Market Rent Growth 3.0% 3.0% 3.0% 3.0% 3.0% 3.0% 3.0% 3.0% 3.0% 3.0% 3.0%
Contract Rent % of Market 103.0% 105.3% 95.8% 96.5% 97.4% 98.6% 98.3% 97.0% 97.6% 98.0% 98.1% 98.7%
Market Rent % of Replacement
Cumulative Rollover 7.85% 45.31% 62.41% 71.05% 71.05% 79.28% 96.75% 96.75% 96.75% 100.00% 100.00%
Potential Gross Rent $4,213,536 $5,780,709 $5,834,284 $5,728,131 $5,876,056 $6,079,644 $6,262,031 $6,443,498 $6,643,222 $6,836,034 $7,039,621 $7,244,232
Other Revenues $269,964 $269,964 $269,964 $247,467
Operating Expense Recoveries $1,221,031 $1,221,031 $1,560,377 $1,965,620 $1,993,949 $2,051,753 $2,028,778 $2,036,006 $2,213,713 $2,245,730 $2,350,521 $2,473,624
Expense Recoveries of Total Expenses 60.43% 60.51% 74.29% 88.96% 88.24% 93.50% 90.31% 88.56% 93.38% 92.25% 93.92% 95.97%
Potential Gross Revenue $5,704,531 $7,231,734 $7,210,340 $7,791,126 $7,795,725 $8,100,111 $8,239,918 $8,348,448 $8,758,647 $9,008,835 $9,324,229 $9,705,777
Downtime Allowance $(1,617,394) $(1,006,020) $(96,907) $(267,877) $(213,229) $(411,064) $(216,177) $(266,525) $(234,821) $(78,021)
Downtime of Potential Gross Revenue 22.37% 13.95% 1.24% 3.44% 2.59% 4.92% 2.47% 2.96% 2.52% 0.80%
Physical Occupancy 74.31% 70.99% 82.48% 98.36% 95.60% 100.00% 96.70% 93.71% 96.59% 96.23% 96.77% 98.96%
Economic Vacancy Allowance $(287,804) $(108,515) $(405,006) $(188,105) $(210,946) $(170,591) $(219,649) $(403,367)
Economic Vacancy of Potential Gross Revenue 3.69% 1.39% 5.00% 2.28% 2.41% 1.89% 2.36% 4.16%
Economic Occupancy 77.63% 86.05% 95.06% 95.17% 95.00% 95.13% 95.08% 95.12% 95.15% 95.13% 95.04%
Effective Gross Income $5,704,531 $5,614,340 $6,204,320 $7,406,415 $7,419,333 $7,695,105 $7,838,584 $7,937,384 $8,331,524 $8,571,719 $8,869,759 $9,224,389
Real Estate Tax Expense $600,847 $600,847 $613,138 $625,683 $638,487 $651,555 $664,894 $678,510 $692,406 $706,591 $721,070 $735,848
Operating Expenses $955,205 $955,205 $998,940 $1,050,370 $1,078,040 $981,748 $1,006,329 $1,031,963 $1,067,442 $1,098,877 $1,132,749 $1,170,476
Insurance Expense $293,412 $293,412 $302,214 $311,281 $320,619 $330,238 $340,145 $350,349 $360,860 $371,686 $382,836 $394,321
Management Fee Expense $171,136 $168,430 $186,130 $222,192 $222,580 $230,853 $235,158 $238,122 $249,946 $257,152 $266,093 $276,732
Total Expenses $2,020,600 $2,017,894 $2,100,422 $2,209,526 $2,259,726 $2,194,394 $2,246,526 $2,298,944 $2,370,654 $2,434,306 $2,502,748 $2,577,377
Expenses PSF $11.96 $11.94 $12.43 $13.08 $13.38 $12.99 $13.30 $13.61 $14.03 $14.41 $14.81 $15.26
Net Operating Income $3,683,931 $3,596,446 $4,103,898 $5,196,889 $5,159,607 $5,500,711 $5,592,058 $5,638,440 $5,960,870 $6,137,413 $6,367,011 $6,647,012
Change From Actual (2.4)% 11.4% 41.1% 40.1% 49.3% 51.8% 53.1% 61.8% 66.6% 72.8% 80.4%
Tenant Improvements $83,184 $4,559,555 $2,117,890 $554,141 $707,560 $691,178 $898,934 $690,448 $613,635 $761,183 $106,226
Leasing Commissions $52,544 $1,059,868 $322,275 $378,908 $67,864 $292,182 $666,704 $500,426 $375,495 $377,831 $72,048
Capital Reserve $16,895 $17,401 $17,923 $18,461 $19,015 $19,585 $20,173 $20,778 $21,402 $22,044 $22,705
Total Capital Costs $152,623 $5,636,824 $2,458,088 $951,510 $794,439 $1,002,945 $1,585,811 $1,211,652 $1,010,532 $1,161,058 $200,979
Cumulative Capital Costs $152,623 $5,789,447 $8,247,535 $9,199,045 $9,993,484 $10,996,429 $12,582,240 $13,793,892 $14,804,424 $15,965,482 $16,166,461
Net Cash Flow - UnLeveraged $3,683,931 $3,443,823 $(1,532,926) $2,738,801 $4,208,097 $4,706,272 $4,589,113 $4,052,629 $4,749,218 $5,126,881 $5,205,953 $6,446,033
Debt Service $1,809,786 $1,809,786 $1,809,786 $1,809,786 $1,809,786 $1,809,786 $1,809,786 $1,809,786 $1,809,786 $1,809,786 $1,809,786 $1,809,786
Debt Coverage Ratio 2.04 1.99 2.27 2.87 2.85 3.04 3.09 3.12 3.29 3.39 3.52 3.67
Net Cash Flow - Leveraged $1,874,145 $1,634,037 $(3,342,712) $929,015 $2,398,311 $2,896,486 $2,779,327 $2,242,843 $2,939,432 $3,317,095 $3,396,167 $4,636,247
Cumulative Net Cash Flow - Unleveraged $3,443,823 $1,910,897 $4,649,698 $8,857,795 $13,564,067 $18,153,180 $22,205,809 $26,955,027 $32,081,908 $37,287,861 $43,733,894
Cumulative Net Cash Flow - Leveraged $1,634,037 $(1,708,675) $(779,660) $1,618,651 $4,515,137 $7,294,464 $9,537,307 $12,476,739 $15,793,834 $19,190,001 $23,826,248
Capitalization Rate - Before Capital 7.58% 7.40% 8.44% 10.69% 10.62% 11.32% 11.51% 11.60% 12.27% 12.63% 13.10% 13.68%
Capitalization Rate - After Capital 7.58% 7.38% 7.55% 9.14% 8.93% 9.39% 9.38% 9.22% 9.55% 9.68% 9.86% 10.26%
Return on Equity - After Capital 11.02% 10.41% 10.06% 13.41% 12.78% 13.67% 13.51% 12.94% 13.48% 13.60% 13.82% 14.58%
Equity Multiple - UnLeveraged 1.19x 1.45x 1.50x 1.68x 1.80x 1.90x 2.08x 2.22x 2.39x 2.57x
Equity Multiple - Leveraged 3.28x 3.93x 3.96x 4.36x 4.60x 4.80x 5.19x 5.50x 5.87x 6.29x
Internal Rate of Return - Unleveraged 18.55% 21.07% 14.85% 14.35% 13.17% 12.24% 12.11% 11.78% 11.63% 11.55%
Internal Rate of Return - Leveraged 45.63% 47.92% 30.27% 27.48% 24.08% 21.64% 20.84% 19.83% 19.19% 18.73%
Purchase / Sale Price $48,600,000 $54,171,454 $68,598,935 $68,106,812 $72,609,385 $73,815,166 $74,427,408 $78,683,484 $81,013,852 $84,044,545 $87,740,558
Residual Value PSF $287.67 $320.64 $406.04 $403.13 $429.78 $436.92 $440.54 $465.73 $479.53 $497.46 $519.34
1 Miscellaneous Revenue comprised of outstanding TI reimbursement for Sutro Biopharma – see rent roll comments for additional detail.
2 Property is currently 74.3% leased. Vacancy in the submarket for life science / lab space is currently approximately 5% - clearly demonstrating the significant value-add opportunity for this project.
3 Tenant improvement costs for conversion from traditional office space to life science space budgeted at $140/sf.4 In-place NOI generates a strong 11.7% debt yield on the proposed initial funding.
5 Projected stabilized NOI generates an exceptional 13.6% debt yield on the proposed fully funded loan commitment.
CasH floW analysis | 1312 | CasH floW analysis
2
1
4 5
3

TenantSuite
% of Total
Square Ft
% of Total
Rent
Square
Footage
Actual
Monthly
Rent PSF
Market
Monthly
Rent PSF
Start
Date
End
Date
Monthly
Rent
Recovery
Method
Actual
Annual
Rent PSF
Market
Annual
Rent PSF
Edgewater Business Park-SKB
260-100 Catalyst Bioscience 32,700 26.54% $2.85 $2.75Feb-07 Feb-15 19.36% $93,195 NNN - 260 - 100% GU$34.20 $33.00
270-100 Available 15,500 0.00% $0.00 $2.83Feb-15 Jan-20 9.17% $0 NNN 270$0.00 $33.99
280-100 Available 14,008 0.00% $0.00 $2.92Jan-16 Dec-20 8.29% $0 NNN 280$0.00 $35.01
280-175 Krames Staywell 5,054 2.95% $2.05 $2.75Feb-13 Mar-17 2.99% $10,361 BY 2013 - 280 - 95% GU$24.60 $33.00
280-200 Toshiba America 8,151 3.59% $1.55 $2.75Apr-04 May-14 4.82% $12,600 BY 2009 - 280 - 100% GU$18.55 $33.00
280-250 One World 8,631 4.42% $1.80 $2.10Dec-10 Dec-15 5.11% $15,536 $429,734 - BY11 - 280 - 95% GU$21.60 $25.20
280-275 CoMentis 2,783 1.51% $1.90 $2.10Aug-10 Jul-15 1.65% $5,288 $442,442 - BY10 - 280 - 95% GU$22.80 $25.20
290-100 Baysider Café 2,024 0.69% $1.20 $1.25Nov-05 Nov-15 1.20% $2,429 NNN (cafe)$14.40 $15.00
290-200 Biomimedica 5,119 3.47% $2.38 $2.75Jan-12 Jun-14 3.03% $12,183 NNN - 290 - 95% GU$28.56 $33.00
290-300 Cureline 6,129 4.01% $2.30 $2.75Jun-10 Aug-17 3.63% $14,097 NNN - 290 - 95% GU$27.60 $33.00
300-100 Adamant Technologies 4,336 3.33% $2.70 $2.75Mar-13 Mar-16 2.57% $11,707 NNN - 300 - 95% GU$32.40 $33.00
300-101 Labratory Skin Care 3,428 2.68% $2.75 $2.75Jan-14 Feb-17 2.03% $9,427 NNN 300$33.00 $33.00
300-102-2 Available 6,948 0.00% $0.00 $2.83Apr-15 Mar-19 4.11% $0 NNN 300$0.00 $33.99
300-103 Trely's Inc. 2,201 1.72% $2.75 $2.75Jul-13 Jul-15 1.30% $6,053 NNN - 300 - 95% GU$33.00 $33.00
300-103-2 Available 6,948 0.00% $0.00 $2.83Jun-15 May-19 4.11% $0 NNN 300$0.00 $33.99
300-150 Covenant Pathology 5,499 4.24% $2.71 $2.75Sep-13 Aug-23 3.25% $14,902 NNN - 300 - 95% GU$32.52 $33.00
310-150 Sutro Biopharma, Inc. 24,544 22.23% $3.18 $2.75May-08 Nov-16 14.53% $78,050 NNN - 310 - 95% GU$38.16 $33.00
310-200 BioSeek 14,943 18.60% $4.37 $2.75Oct-08 Sep-15 8.84% $65,301 NNN - 310 - 95% GU$52.44 $33.00
168,946 100.00% 100.00% $351,128 $2.80 $2.72
43,404 25.69%Total Available Space:
$33.56 $32.60
6 Tenant currently subletting 9,487 sf – see rent roll comments for additional detail.7 Remaining traditional office space.
renT roll | 1514 | renT roll
6
7
7
7

TenantSuite Date PSF
Rent Increases Termination
RightsOptions
Initial
Occupancy Underwriting Comments
260-100 Catalyst Bioscience Feb-14 $34.80Feb-07 260 Littlefield-Life Science / Lab space. Tenant entered into sublease agreement with Reset Therapeutics for 9,487 sf
commencing on 8/22/13 and maturing on 2/27/2015.
270-100 Available Feb-16 $35.01
Feb-17 $36.06
Feb-18 $37.14
Feb-19 $38.26
Feb-15 270 Littlefield-Life Science / Lab space. Space recently vacated by KAI pharmaceuticals in connection with the sale of the
company to Amgen and subsequent consolidation.
280-100 Available Jan-17 $36.06
Jan-18 $37.14
Jan-19 $38.26
Jan-20 $39.40
Jan-16 280 Utah-Traditional Office space.
280-175 Krames Staywell Feb-14 $25.34
Feb-15 $26.10
Feb-16 $26.88
Feb-17 $27.69
1 - 4 YR option
to renew at
FMV.
Feb-13 280 Utah Vacate-Traditional Office space. Assume vacate upon lease maturity to execute space conversion.
280-200 Toshiba America 1 - 2 YR option
to renew at
FMV.
Apr-04 280 Utah Vacate-Traditional Office space. Assume vacate upon lease maturity to execute space conversion.
280-250 One World Dec-14 $22.32 1 - 3 YR option
to renew at
FMV.
Dec-10 280 Utah - Office-Traditional Office space utlized by life science company. Assume renew existing office lease upon
maturity.
280-275 CoMentis Aug-14 $23.40Aug-10 280 Utah - Office-Traditional Office space utlized by life science company. Assume renew existing office lease upon
maturity.
290-100 Baysider Café Dec-14 $15.60 1 - 5 YR option
to renew at
FMV.
Nov-05 290 - Cafe-On-site cafe.
290-200 Biomimedica Jan-12 290 Utah-Life Science / Lab space.
290-300 Cureline Sep-14 $28.44
Sep-15 $29.28
Sep-16 $30.12
1 - 3 YR option
to renew at
FMV.
Jun-10 290 Utah-Life Science / Lab space.
300-100 Adamant Technologies Jun-14 $33.60
Oct-15 $34.80
1 - 3 YR option
to renew at
FMV but not
less than
previous base
rent.
Mar-13 300 Utah-Life Science / Lab space.
300-101 Labratory Skin Care Jan-15 $33.96
Jan-16 $34.92
Jan-17 $36.00
Jan-14 300 Utah-Life Science / Lab space.
300-102-2 Available Apr-16 $35.01
Apr-17 $36.06
Apr-18 $37.14
Apr-15 300 Utah-Traditional Office space.
300-103 Trely's Inc. Jul-14 $33.96 1 - 2 YR option
to renew at
FMV.
Jul-13 300 Utah-Life Science / Lab space. Tenant is entitled to abatement of base rent, operating expenses, and tax expenses not
to exceed $22,648 or 3 months base rent plus additional rent.
300-103-2 Available Jun-16 $35.01
Jun-17 $36.06
Jun-18 $37.14
Jun-15 300 Utah-Traditional Office space.
300-150 Covenant Pathology Sep-14 $33.50
Sep-15 $34.50
Sep-16 $35.54
Sep-17 $36.60
Sep-18 $37.70
Sep-19 $38.83
Sep-20 $40.00
Sep-21 $41.20
Sep-22 $42.43
2 - 5 YR
options to
renew at FMV.
Sep-13 300 Utah-Life Science / Lab space.
renT roll CommenTs | 1716 | renT roll CommenTs
TenantSuite
% of Total
Rent
Square
Footage
End
Date
Monthly
Rent
% of Total
Square Ft
Contract
Annual
Rent PSF
at Expiration
Market
Annual
Rent PSF
at Expiration
Option
Annual
Rent PSF
at Expiration
Market
Annual
Rent PSF
Actual
Monthly
Rent PSF
Actual
Annual
Rent PSF
Market
Monthly
Rent PSF
Available
300-102-2 Available 6,948 0.00% $2.83Mar-19 4.11% $0 $33.99 $38.26$0.00 $0.00 $37.14
300-103-2 Available 6,948 0.00% $2.83May-19 4.11% $0 $33.99 $38.26$0.00 $0.00 $37.14
270-100 Available 15,500 0.00% $2.83Jan-20 9.17% $0 $33.99 $39.40$0.00 $0.00 $38.26
280-100 Available 14,008 0.00% $2.92Dec-20 8.29% $0 $35.01 $39.40$0.00 $0.00 $39.40
43,404 0.00% $2.86 25.69% $0 $34.32 $39.04Total: $0.00 $0.00 $38.27
43,404 0.00% 25.69% $0 Cumulative Total:
2014
280-200 Toshiba America 8,151 3.59% $2.75May-14 4.82% $12,600 $33.00 $33.00$1.55 $18.55 $18.55
290-200 Biomimedica 5,119 3.47% $2.75Jun-14 3.03% $12,183 $33.00 $33.00$2.38 $28.56 $28.56
13,270 7.06% $2.75 7.85% $24,783 $33.00 $33.00Total: $1.87 $22.41 $22.41
56,674 7.06% 33.55% $24,783 Cumulative Total:
2015
260-100 Catalyst Bioscience 32,700 26.54% $2.75Feb-15 19.36% $93,195 $33.00 $33.99$2.85 $34.20 $34.80
300-103 Trely's Inc. 2,201 1.72% $2.75Jul-15 1.30% $6,053 $33.00 $33.99$2.75 $33.00 $33.96
280-275 CoMentis 2,783 1.51% $2.10Jul-15 1.65% $5,288 $25.20 $25.96$1.90 $22.80 $23.40
310-200 BioSeek 14,943 18.60% $2.75Sep-15 8.84% $65,301 $33.00 $33.99$4.37 $52.44 $54.36
290-100 Baysider Café 2,024 0.69% $1.25Nov-15 1.20% $2,429 $15.00 $15.45$1.20 $14.40 $15.60
280-250 One World 8,631 4.42% $2.10Dec-15 5.11% $15,536 $25.20 $25.96$1.80 $21.60 $22.32
63,282 53.49% $2.58 37.46% $187,801 $31.02 $31.95Total: $2.97 $35.61 $36.57
119,956 60.54% 71.00% $212,584 Cumulative Total:
2016
300-100 Adamant Technologies 4,336 3.33% $2.75Mar-16 2.57% $11,707 $33.00 $35.01$2.70 $32.40 $34.80
310-150 Sutro Biopharma, Inc. 24,544 22.23% $2.75Nov-16 14.53% $78,050 $33.00 $35.01$3.18 $38.16 $38.28
28,880 25.56% $2.75 17.09% $89,757 $33.00 $35.01Total: $3.11 $37.30 $37.76
148,836 86.11% 88.10% $302,341 Cumulative Total:
2017
300-101 Labratory Skin Care 3,428 2.68% $2.75Feb-17 2.03% $9,427 $33.00 $36.06$2.75 $33.00 $36.00
280-175 Krames Staywell 5,054 2.95% $2.75Mar-17 2.99% $10,361 $33.00 $36.06$2.05 $24.60 $27.69
290-300 Cureline 6,129 4.01% $2.75Aug-17 3.63% $14,097 $33.00 $36.06$2.30 $27.60 $30.12
14,611 9.65% $2.75 8.65% $33,884 $33.00 $36.06Total: $2.32 $27.83 $30.66
163,447 95.76% 96.75% $336,226 Cumulative Total:
2023
300-150 Covenant Pathology 5,499 4.24% $2.75Aug-23 3.25% $14,902 $33.00 $43.06$2.71 $32.52 $42.43
5,499 4.24% $2.75 3.25% $14,902 $33.00 $43.06Total: $2.71 $32.52 $42.43
168,946 100.00% 100.00% $351,128 Cumulative Total:
lease rollover | 1918 | lease rollover

2010 Owner’s actual
2011 Owner’s actual
2012 Owner’s actual
2014 Owner’s argUs
actual in Place (01/14)
initial Proforma
(01/14-12/14)
actual versus
Proforma
Utilities $329,306 $355,397 $412,981 $415,563 $415,563 $415,563 $0 Janitorial $70,667 $68,575 $44,327 $57,038 $57,038 $57,038 $0 Repairs and Maintenance $227,721 $236,829 $267,641 $245,284 $245,284 $245,284 $0 General and Administrative $67,465 $67,130 $66,202 $71,870 $71,870 $71,870 $0 Payroll $60,733 $41,372 $47,590 $165,450 $165,450 $165,450 $0 Other $0 $0 $906 $0 $0 $0 $0 ToTal oPeraTing exPenses $755,890 $769,303 $839,646 $955,205 $955,205 $955,205 $0 Per SF $4.47 $4.55 $4.97 $5.65 $5.65 $5.65
2010 Owner’s actual
2011 Owner’s actual
2012 Owner’s actual
2014 Owner’s argUs
actual in Place (01/14)
initial Proforma
(01/14-12/14)Psf
actual versus
ProformaBase Rent $4,068,127 $4,106,122 $3,978,636 $5,740,739 $4,213,536 $5,740,739 $33.98 $1,527,203
Other Revenues/TI Reimbursement $32,442 $5,398 $202,046 $269,964 $269,964 $269,964 $1.60 $0
Operating Expense Reimbursement $1,109,212 $1,090,021 $1,174,391 $1,221,031 $1,221,031 $1,221,031 $7.23 $0
Signage $0 $0 $0 $0 $0 $0 $0.00 $0
GROSS POTENTIAL REVENUE $5,209,781 $5,201,540 $5,355,073 $7,231,734 $5,704,531 $7,231,734 $42.81 $1,527,203
Downtime $0 $0 $0 ($1,617,394) $0 ($1,617,394) ($9.57) ($1,617,394)
Vacancy Allowance $0 $0 $0 $0 $0 $0 $0.00 $0
EFFECTIVE GROSS INCOME $5,209,781 $5,201,540 $5,355,073 $5,614,340 $5,704,531 $5,614,340 $33.23 ($90,191)
Real Estate Tax Expense $512,332 $519,479 $531,050 $600,847 $600,847 $600,847 $3.56 $0
Operating Expenses (See Schedule 2) $755,890 $769,303 $839,646 $955,205 $955,205 $955,205 $5.65 $0
Insurance Expense $314,438 $265,075 $269,440 $293,412 $293,412 $293,412 $1.74 $0
Management Fee Expense $154,791 $156,736 $152,731 $168,430 $171,136 $168,430 $1.00 ($2,706)
Non-Reimbursable $0 $0 $0 $0 $0 $0 $0.00 $0
TOTAL EXPENSES $1,737,451 $1,710,593 $1,792,866 $2,017,894 $2,020,600 $2,017,894 $11.94 ($2,706)
Per SF $10.28 $10.13 $10.61 $11.94 $11.96 $11.94
Percentage Expense Recovery 63.84% 63.72% 65.50% 60.51% 60.43% 60.51%
Average Occupancy 74.31% 70.99%
NET OPERATING INCOME $3,472,330 $3,490,946 $3,562,207 $3,596,446 $3,683,931 $3,596,446 $21.29 ($87,485)
20 | HisToriCal sUmmary
HisToriCal sUmmary – deTail

260 Littlefield suite 100
Catalyst biosciences, inc. square footage: 32,700www.catalystbiosciences.com lease expiration: Feb-15Comments:
Catalyst Biosciences, Inc. is a clinical-stage drug company focused on the development of novel catalytic biopharmaceutical products based on engineered human proteases. The company has formed partnerships with several international pharmaceutical companies to develop and commercialize their engineered human proteases, including Pfizer and South Korean biopharmaceutical company ISU Abxis. Additionally, Catalyst has the investor support of leading venture firms including Burrill & Company, Essex Woodlands Health Ventures, HealthCare Ventures, Johnson & Johnson Development Corporation, Morgenthaler Ventures, Rosetta Capital, and Sofinnova Ventures.
310 Utah suite 150
sutro biopharma, inc. square footage: 24,544www.sutrobio.com lease expiration: Nov-16Comments:
Sutro Biopharma develops new multi-functional antibody drug conjugate combination therapeutics and bifunctional antibody-based therapeutics for targeted cancer therapies. In addition to developing their own drug pipeline, Sutro Biopharma collaborates with select pharmaceutical and biotech companies in the discovery and development of novel protein therapeutics.
310 Utah suite 200
bioseek, inc. square footage: 14,943www.bioseekinc.com lease expiration: Sep-15Comments:
BioSeek, Inc. provides various products and services for the drug discovery and development process. Its solutions include BioMAP Systems that are platform and primary human cell based assays to incorporate predictive primary human cell-based disease models, which generate informative biological activity profiles for various drugs. The company was founded in 2000 and is based in South San Francisco, California. As of November 7, 2012, BioSeek, Inc. operates as a subsidiary of DiscoverRx Corporation.
280 Utah suite 250
The institute for oneWorld Health square footage: 8,631www.oneworldhealth.org lease expiration: Nov-15Comments:
The Institute for OneWorld Health, a non-profit pharmaceutical company, develops drugs for people with infectious diseases. They offer services ranging from drug lead identification and optimization to conducting clinical trials and securing regulatory approval of new medicines for patients. The company provides treatments for leishmaniasis, diarrheal diseases, malaria, chagas diseases, and chronic gastrointestinal infections. The Institute for OneWorld Health was founded in 2000 and is based in San Francisco, California.
TenanT Profiles | 21

280 Utah suite 200
Toshiba america, inc. square footage: 8,151www.toshiba.com lease expiration: May-14Comments:
Toshiba America, Inc. (TAI) is the holding company for high-tech giant Toshiba and handles North American business operations for its parent company. TAI’s operating companies’ market laptops, netbooks, and PCs; MRIs and other medical imaging systems; semiconductors and hard disk drives; copiers and other office equipment; and a range of consumer electronic products. The company also provides grants for science and mathematics education through its not-for-profit organization, the Toshiba America foundation. Other subsidiaries under the Toshiba America Inc. banner include Toshiba America Electrical Components, Toshiba America Information Systems, and Toshiba America Medical Systems.
290 Utah suite 300
Cureline, inc. square footage: 6,129www.cureline.com lease expiration: Aug-17Comments:
Cureline, Inc., is a human biospecimen CRO specializing in human tissue research projects including study design, regulatory affairs, clinical network management, specimen collection and analysis, and complete logistics. The company collaborates with major clinical centers in Europe, Asia, and the USA and maintains an extensive biorepository of human biospecimens in South San Francisco (CA, USA). Their expertise is biomarker research and diagnostic specimen collection for solid tumors, hematology, inflammation, cardiovascular conditions, sepsis/infectious diseases, and other indications.
300 Utah suite 150
Covenant Pathology services, llC square footage: 5,499www.covenantpath.com lease expiration: Aug-23Comments:
Headquartered in Nashville, Tennessee, Covenant Pathology Services, Inc. is a privately-held owner and operator of ambulatory surgery centers and pathology labratories in the U.S. The firm acquires and operates single and limited specialty surgery centers in partnership with leading physicians with locations in San Francisco, Nashville, and Tampa.
290 Utah suite 200
biomimedica, inc. square footage: 5,119www.biomimedica.com lease expiration: Jun-14Comments:
Biomimedica is a medical device company focused on new approaches to joint repair through synthetic cartilage technology. Biomimedica is developing earlier intervention solutions to treat osteoarthritis that will allow patients to maintain a pain-free, active lifestyle.
22 | TenanT Profiles

280 Utah suite 150
Krames staywell, llC square footage: 5,054www.kramesstaywell.com lease expiration: Apr-17Comments:
Established in 2011, Krames StayWell is the largest provider of interactive, print and mobile patient education solutions, consumer health information, and population health management communications in the U.S.
300 Utah suite 120
adamant Technologies, inc. square footage: 4,336www.adamanttech.com lease expiration: May-16Comments:
Adamant Technologies is a San Francisco based company that develops mobile chemical sensor devices which allow users to track their health and fitness through chemicals in their breath. Adamant Technologies allows users to monitor their own health through real time, non-invasive detection.
280 Utah suite 275
Comentis, inc. square footage: 2,783www.comentis.com lease expiration: Jul-15Comments:
CoMentis, Inc. is focused on the research and development of small molecule drugs to treat Alzheimer’s disease, with headquarters in South San Francisco and research operations in Oklahoma City. The firm is currently pursuing the development of beta-secretase inhibitor drugs in partnership with Astellas Pharma, Inc., under terms of an exclusive worldwide collaboration agreement initiated in 2008.
300 Utah suite 130
Trely’s Inc. square footage: 2,201N/A lease expiration: Jul-15
Comments:
Trelys, Inc. operates in the biotechnology sector. The company was incorporated in 2012 and is based in South San Francisco.
290 Utah suite 100
baysider Café square footage: 2,201
www.southcity.baysidercafe.com Lease Expiration: Nov-15
Comments:
Baysider Café is a restaurant and café company handling on-site food and beverages at the Property, as well as specializing in office and private event catering throughout the Peninsula and Silicon Valley. In addition to this location, Baysider also operates cafes in Mountain View and Brisbane.
TenanT Profiles | 23

marketexecutIve Summary
24 | marKeT exeCUTive sUmmary
markeT execuTive summary
Bay area life sciences marKetBeginning with the founding of Genentech in South San Francisco in 1976, the Bay Area’s concentration of life science firms is the largest in Northern California with over 1,300 companies and 100,000 direct employees in this sector. Over the past three decades, the life sciences industry has generated thousands of jobs and billions of dollars in revenue for California, and the state’s dynamic economy continues to stay at the forefront of high-growth life science industries such as biotechnology. The Bay Area is home to companies such as Genentech/Roche, Gilead Sciences, Bayer, Life Technologies, Exelixis, Onyx Pharma-ceuticals, and Genencor. Top universities such as Stanford, UC Berkeley and UC San Francisco have a strong history of drawing federal research capital and state-funded university collaboration, research that has historically spawned new technologies and spun off private companies to commer-cialize the technology. In additional to being worldwide leader in the technology and life sciences industries, the Bay
Area is also a leader in Venture Capital firms who use their capital to fund promising start-up companies.
There are five distinct clusters within the Bay Area Life Sciences Market – San Francisco, South San Francisco, Mid-Peninsula, South Peninsula, and the East Bay. Combined these five clusters represent approximately 20 million square feet. As the worldwide epicenter of the life science industry, the San Francisco Bay Area has one of the deepest pipelines of investigational drugs currently awaiting approval from the Food and Drug Administration. For life science users, large lease requirements can materialize overnight upon the approval of a drug. The current Bay Area pipeline includes 600+ total investigational drugs with 15% of these nearing the approval phase. The supply of existing life science space in the Bay Area Life Sciences Market was 2.281 million square feet, representing an overall vacancy rate for 11.34% as of the end of the 4th Quarter 2013.
marKeT exeCUTive sUmmary | 25
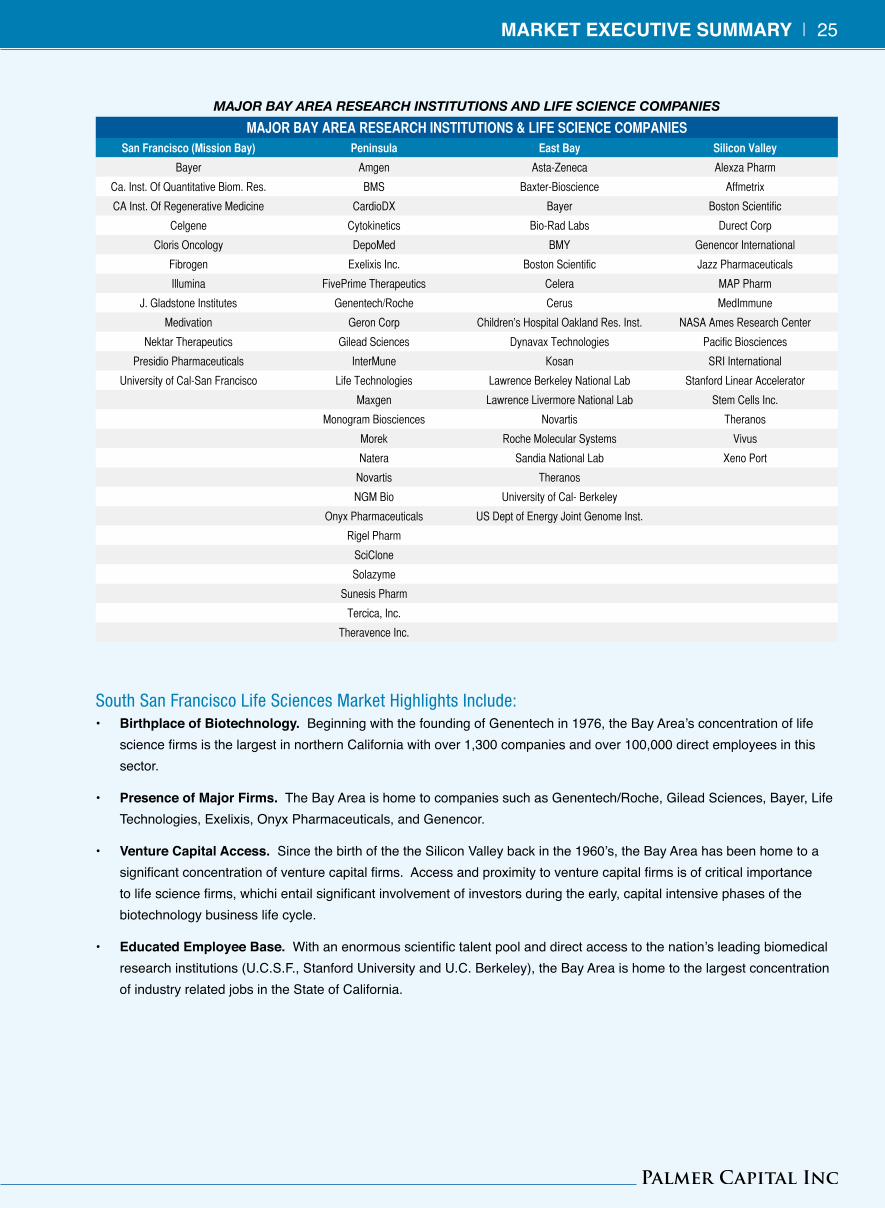
major bay area research institutions and Life science companiesMAJORBAYAREARESEARCHINSTITUTIONS&LIFESCIENCECOMPANIES
SanFrancisco(MissionBay) Peninsula EastBay SiliconValley
Bayer Amgen Asta-Zeneca Alexza Pharm
Ca. Inst. Of Quantitative Biom. Res. BMS Baxter-Bioscience Affmetrix
CA Inst. Of Regenerative Medicine CardioDX Bayer Boston Scientific
Celgene Cytokinetics Bio-Rad Labs Durect Corp
Cloris Oncology DepoMed BMY Genencor International
Fibrogen Exelixis Inc. Boston Scientific Jazz Pharmaceuticals
Illumina FivePrime Therapeutics Celera MAP Pharm
J. Gladstone Institutes Genentech/Roche Cerus MedImmune
Medivation Geron Corp Children’s Hospital Oakland Res. Inst. NASA Ames Research Center
Nektar Therapeutics Gilead Sciences Dynavax Technologies Pacific Biosciences
Presidio Pharmaceuticals InterMune Kosan SRI International
University of Cal-San Francisco Life Technologies Lawrence Berkeley National Lab Stanford Linear Accelerator
Maxgen Lawrence Livermore National Lab Stem Cells Inc.
Monogram Biosciences Novartis Theranos
Morek Roche Molecular Systems Vivus
Natera Sandia National Lab Xeno Port
Novartis Theranos
NGM Bio University of Cal- Berkeley
Onyx Pharmaceuticals US Dept of Energy Joint Genome Inst.
Rigel Pharm
SciClone
Solazyme
Sunesis Pharm
Tercica, Inc.
Theravence Inc.
south san francisco life sciences market Highlights include:• birthplace of biotechnology. Beginning with the founding of Genentech in 1976, the Bay Area’s concentration of life
science firms is the largest in northern California with over 1,300 companies and over 100,000 direct employees in this sector.
• Presence of major firms. The Bay Area is home to companies such as Genentech/Roche, Gilead Sciences, Bayer, Life Technologies, Exelixis, Onyx Pharmaceuticals, and Genencor.
• venture Capital access. Since the birth of the the Silicon Valley back in the 1960’s, the Bay Area has been home to a significant concentration of venture capital firms. Access and proximity to venture capital firms is of critical importance to life science firms, whichi entail significant involvement of investors during the early, capital intensive phases of the biotechnology business life cycle.
• educated employee base. With an enormous scientific talent pool and direct access to the nation’s leading biomedical research institutions (U.C.S.F., Stanford University and U.C. Berkeley), the Bay Area is home to the largest concentration of industry related jobs in the State of California.


seCTion | 27marKeT analysis | 27
MarketanaLySiS
The San Francisco Bay Area is among the preeminent economic regions in the world. As an international capital markets hub, the Bay Area is the most active venture capital market in the country. It features world class educational institutions, business support services, and is a robust tourist destination. As a result, the San Francisco Bay Area continues to prosper as one of the world’s most desirable places to live, work, and visit.
The San Francisco Bay Area consists of three major cities including San Francisco, Oakland, and San Jose. The South Bay Area is known internationally as the Silicon Valley, which has the largest concentration of technology related companies in the world. The nine counties that make up the Bay Area include: Alameda, Contra Costa, Marin, Napa, San Francisco, San Mateo, Santa Clara, Solano, and Sonoma.
vacancy analysis
Bay area life sciences marKetComprised of five distinct clusters, including San Francisco, South San Francisco, Mid-Peninsula, South Peninsula, and the East Bay, the Bay Area Life Sciences Market totals just over 20,000,000 square feet. As the 3rd largest life science cluster in the United States, the San Francisco Bay Area has one of the deepest pipelines of investigational drugs currently awaiting approval from the Food and Drug Administration (“FDA”).
Life sciences space by submarket size
0M SF1.0M SF2.0M SF3.0M SF4.0M SF5.0M SF6.0M SF7.0M SF8.0M SF
SF / M
ission
Bay
South
SF
Mid-
Penin
sula
South
Pen
insula
East
Bay
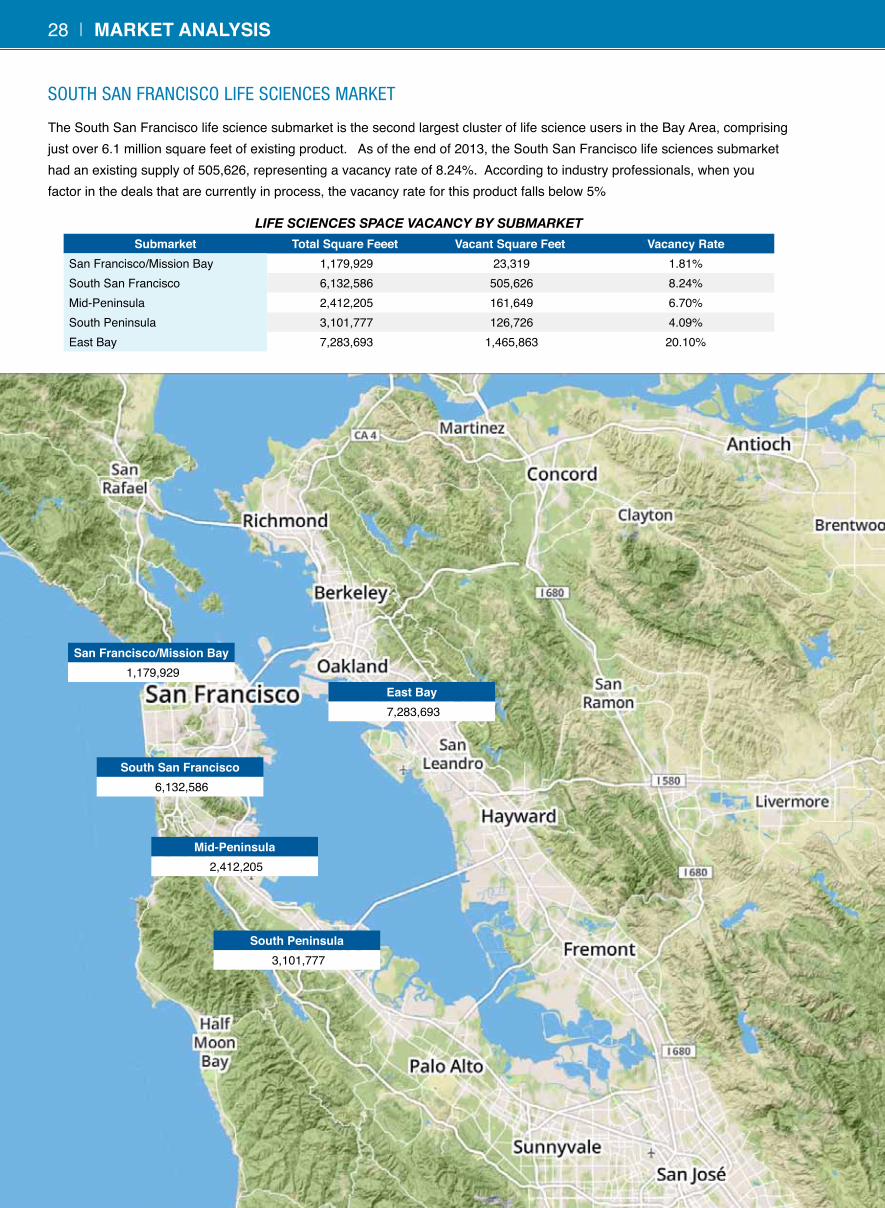
sOutH san franciscO life sciences marKet
The South San Francisco life science submarket is the second largest cluster of life science users in the Bay Area, comprising just over 6.1 million square feet of existing product. As of the end of 2013, the South San Francisco life sciences submarket had an existing supply of 505,626, representing a vacancy rate of 8.24%. According to industry professionals, when you factor in the deals that are currently in process, the vacancy rate for this product falls below 5%
Life sciences space Vacancy by submarketsubmarket Total square feeet vacant square feet vacancy rate
San Francisco/Mission Bay 1,179,929 23,319 1.81%South San Francisco 6,132,586 505,626 8.24%Mid-Peninsula 2,412,205 161,649 6.70%South Peninsula 3,101,777 126,726 4.09%East Bay 7,283,693 1,465,863 20.10%
san francisco/mission bay 1,179,929
south san francisco 6,132,586
mid-Peninsula 2,412,205
south Peninsula 3,101,777
east bay 7,283,693
28 | marKeT analysis

absOrpTiOn analysis
Bay area life sciences marKetThe Bay Area Life Sciences Submarket comprises just over 20 million square feet of product. Total Absorption during the 4th Quarter 2013 was 297,903 square feet. San Francisco and South San Francisco continue to lead the life sciences market with vacancy rates now below 5%.
sOutH san franciscO life sciences
suBmarKetThe South San Francisco Life Sciences submarket is the second largest cluster of life science space in the Bay Area, comprising 6.1 million square feet. Absorption in the 4th Quarter 2013 registered at a negative 112,516 square feet, a figure that is somewhat misleading based on activity in the market that had yet to be counted as signed leases. When these other market transactions are factored in, the actual vacancy rate in the South San Francisco Life Sciences markets falls below 5%. The supply of smaller, move-in ready lab space in the sub 20,000 square foot range is even tighter with limited vacancies outside of the Edgewater Busi-ness Park. San Francisco and South San Francisco remain the strongest life science clusters in the Bay Area, recording the lowest vacancy rates and the highest rental rates in the market.
renTal raTe analysis
sOutH san franciscO life sciences
suBmarKet Rental rates today vary dramatically by building and are dependent on the amount of lab build-out in the building, the condition of the tenant improvements, the quality of the real estate, the location and proximity to Highway 101, and the specific needs of the tenant. For space to be considered Life Sciences space, the percentage of wet lab space needs to be 35% or greater. Current rental rates are on the rise today and range between the high $2.50 per square foot per month NNN to the low $4.50 per square foot per month NNN for existing shell space. Given the size of the submarket and the proximity to a substantial number of life science tenants in the neighborhood, the South San Francisco Life Sciences Submarket has an advantage in attracting tenants who want to be located close to some of the industry titans. With San Francisco’s life sciences product availability limited at best, the South San Francisco life sciences submarket is ideally positioned to capture the lion’s share of space demand in these markets.
marKeT analysis | 29
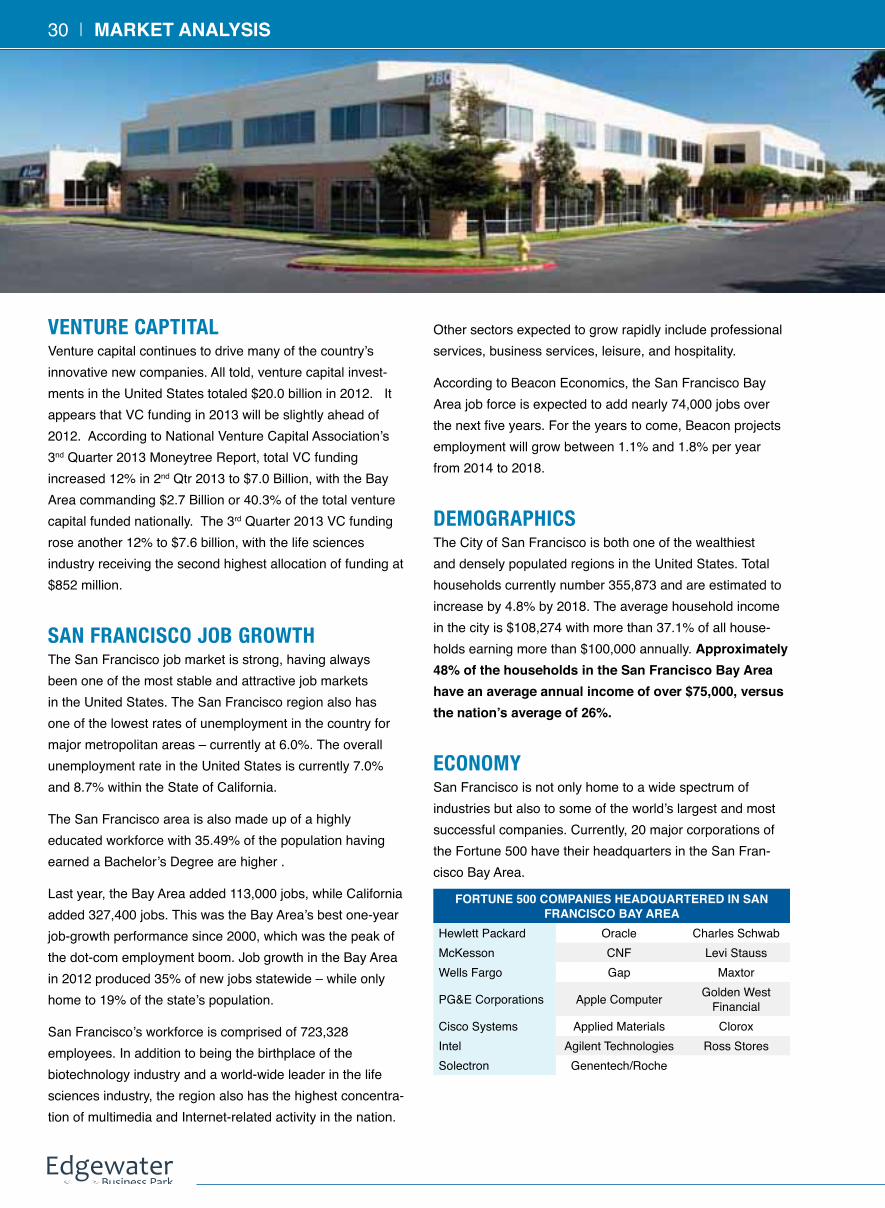
venTure capTiTalVenture capital continues to drive many of the country’s innovative new companies. All told, venture capital invest-ments in the United States totaled $20.0 billion in 2012. It appears that VC funding in 2013 will be slightly ahead of 2012. According to National Venture Capital Association’s 3nd Quarter 2013 Moneytree Report, total VC funding increased 12% in 2nd Qtr 2013 to $7.0 Billion, with the Bay Area commanding $2.7 Billion or 40.3% of the total venture capital funded nationally. The 3rd Quarter 2013 VC funding rose another 12% to $7.6 billion, with the life sciences industry receiving the second highest allocation of funding at $852 million.
san franciscO JOb grOwThThe San Francisco job market is strong, having always been one of the most stable and attractive job markets in the United States. The San Francisco region also has one of the lowest rates of unemployment in the country for major metropolitan areas – currently at 6.0%. The overall unemployment rate in the United States is currently 7.0% and 8.7% within the State of California.
The San Francisco area is also made up of a highly educated workforce with 35.49% of the population having earned a Bachelor’s Degree are higher .
Last year, the Bay Area added 113,000 jobs, while California added 327,400 jobs. This was the Bay Area’s best one-year job-growth performance since 2000, which was the peak of the dot-com employment boom. Job growth in the Bay Area in 2012 produced 35% of new jobs statewide – while only home to 19% of the state’s population.
San Francisco’s workforce is comprised of 723,328 employees. In addition to being the birthplace of the biotechnology industry and a world-wide leader in the life sciences industry, the region also has the highest concentra-tion of multimedia and Internet-related activity in the nation.
Other sectors expected to grow rapidly include professional services, business services, leisure, and hospitality.
According to Beacon Economics, the San Francisco Bay Area job force is expected to add nearly 74,000 jobs over the next five years. For the years to come, Beacon projects employment will grow between 1.1% and 1.8% per year from 2014 to 2018.
demOgraphicsThe City of San Francisco is both one of the wealthiest and densely populated regions in the United States. Total households currently number 355,873 and are estimated to increase by 4.8% by 2018. The average household income in the city is $108,274 with more than 37.1% of all house-holds earning more than $100,000 annually. approximately 48% of the households in the san francisco bay area have an average annual income of over $75,000, versus the nation’s average of 26%.
ecOnOmySan Francisco is not only home to a wide spectrum of industries but also to some of the world’s largest and most successful companies. Currently, 20 major corporations of the Fortune 500 have their headquarters in the San Fran-cisco Bay Area.
forTUne 500 ComPanies HeadQUarTered in san franCisCo bay area
Hewlett Packard Oracle Charles SchwabMcKesson CNF Levi StaussWells Fargo Gap Maxtor
PG&E Corporations Apple Computer Golden West Financial
Cisco Systems Applied Materials CloroxIntel Agilent Technologies Ross StoresSolectron Genentech/Roche
30 | marKeT analysis

Comparable lease TransactionsTenant / Property / address sf rate/sf/yr Term (yrs.) start lease Type owner/basis
5OXiGene Inc 701 Gateway Boulevard South San Francisco, CA
5,325 $3.15 1 April 2013 FSG Divco West $233/SF
6
Hyperion Therapeutics Sierra Point Towers 2000 Sierra Point Parkway Brisbane, CA
20,116 $2.96 6 Oct 2013 FSGDiamond Investment
Properties $177/SF
7
Genentech Britannia Modular Laboratories 285 E. Grand Avenue South San Francisco, CA
62,655 $2.75 10 July 2013 NNN HCP $160/SF
8Calithera Biociences 343 Oyster Point Blvd South San Francisco, CA
24,900 $2.67 5 June 2013 MG Alexandria Real Estate /NA
9
KalosBios Britannia Kimball 442 Littlefield Avenue South San Francisco, CA
24,000 $2.60 5 Pending NNNSouth City Properties
LLC N/A
Comparable sale PropertiesProperty / address Total sf
CoePrice (mm) Price/sf
Cap rate
buyer seller Comments
1
Mountain View Research Park & Mountain View Technology Park Logue Ave/E. Middlefield Rd Mountain View, CA
741,951 SF Apr 2013
$233.5M $315/SF 7.2% Boston Properties
BP Value Add FundTwo Class A single story office
/ R&D portfolios
2Woodside Corporate Center 700 Bay Street Redwood City, CA
255,253 SF March 2013
$87.0M $345/SF 5.8%
Biomed Realty Deutsche Asset Management
Business Park comprised of 76% Life Science / 24% Office
3Palo Alto Tech Center 1800-1850 Embarcadero Road Palo Alto, CA
269,327 SF Dec 2012
$119.0M $442/SF 5.8% KBS Realty Advisors
GE Real Estate10 building office / R&D
project in Bayshore submarket
4Fibrogen 409-499 Illinois Street San Francisco, CA
458,821 SF April 2011
$293.0M $639/SF 3.5% Alexandria Real Estate
ShorensteinTwo biotech office buildings in
Mission Bay
ComParables | 3332 | ComParables
subject PropertyProperty Total nra (sf) year built occupancy Comments
280 Utah Avenue South San Francisco, CA 38,627 1988 64% Two-story building
290 Utah Avenue South San Francisco, CA 13,272 1988 100% One-story building
300 Utah Avenue South San Francisco, CA 29,360 1988 41% Two-story building
310 Utah Avenue South San Francisco, CA 39,487 1988 100% Two-story building
260 Littlefield Avenue South San Francisco, CA 32,700 1988 100% Two-story building
270 Littlefield Avenue South San Francisco, CA 15,500 1988 0% One-story building
Total business Park 168,946 72.3%
04
01
03
02
06
08
05
07
09

31

1478 Stone Point Drive, Suite 250 • Roseville, California 95661(916)462-6300 • www.palmercapital.com


![Confidential Offering Memorandum - …images2.loopnet.com/d2/WT3AIYmotF44UG9DAPiAPCQ8B321MG1LF2NyjcAZGC0/...This Confidential Offering Memorandum [“Memorandum”] contains a brief](https://static.documents.pub/doc/80x56/5b0243267f8b9ad85d8f4725/confidential-offering-memorandum-confidential-offering-memorandum-memorandum.jpg)


