Conformational changes in quadruplex oligonucleotide structures probed by
Raman spectroscopy Cynthia V. Pagba,1 Stephen M. Lane,1, 2 and Sebastian Wachsmann-Hogiu1,3,*
1Center for Biophotonics Science and Technology, University of California Davis, 2700 Stockton Blvd., Suite 1400, Sacramento, CA 95817
2Department of Neurological Surgery, University of California Davis, 4860 Y Street, Sacramento, CA 95817 3Department of Pathology and Internal Medicine, University of California Davis, 4400 V Street, Sacramento,
References and links 1. A. N. Lane, J. B. Chaires, R. D. Gray, and J. O. Trent, “Stability and kinetics of G-quadruplex structures,”
Nucleic Acids Res. 36(17), 5482–5515 (2008). 2. J. L. Huppert, and S. Balasubramanian, “G-quadruplexes in promoters throughout the human genome,” Nucleic
Acids Res. 35(2), 406–413 (2006). 3. A. D. Ellington, and J. W. Szostak, “In vitro selection of RNA molecules that bind specific ligands,” Nature
346(6287), 818–822 (1990). 4. C. Tuerk, and L. Gold, “Systematic evolution of ligands by exponential enrichment: RNA ligands to
bacteriophage T4 DNA polymerase,” Science 249(4968), 505–510 (1990). 5. T. Hermann, and D. J. Patel, “Adaptive recognition by nucleic acid aptamers,” Science 287(5454), 820–825
(2000). 6. N. de-los-Santos-Álvarez, M. J. Lobo-Castañón, A. J. Miranda-Ordieres, and P. Tuñón-Blanco, “Aptamers as
recognition elements for label-free analytical devices,” Trends Analyt. Chem. 27(5), 437–446 (2008). 7. B. J. Hicke, C. Marion, Y.-F. Chang, T. Gould, C. K. Lynott, D. Parma, P. G. Schmidt, and S. Warren,
“Tenascin-C aptamers are generated using tumor cells and purified protein,” J. Biol. Chem. 276(52), 48644–48654 (2001).
8. C. Wang, M. Zhang, G. Yang, D. Zhang, H. Ding, H. Wang, M. Fan, B. Shen, and N. Shao, “Single-stranded DNA aptamers that bind differentiated but not parental cells: subtractive systematic evolution of ligands by exponential enrichment,” J. Biotechnol. 102(1), 15–22 (2003).
9. J. Ruckman, L. S. Green, J. Beeson, S. Waugh, W. L. Gillette, D. D. Henninger, L. Claesson-Welsh, and N. Janjić, “2′-Fluoropyrimidine RNA-based aptamers to the 165-amino acid form of vascular endothelial growth factor (VEGF165). Inhibition of receptor binding and VEGF-induced vascular permeability through interactions requiring the exon 7-encoded domain,” J. Biol. Chem. 273(32), 20556–20567 (1998).
10. C.-H. B. Chen, G. A. Chernis, V. Q. Hoang, and R. Landgraf, “Inhibition of heregulin signaling by an aptamer that preferentially binds to the oligomeric form of human epidermal growth factor receptor-3,” Proc. Natl. Acad. Sci. U.S.A. 100(16), 9226–9231 (2003).
11. L. C. Bock, L. C. Griffin, J. A. Latham, E. H. Vermaas, and J. J. Toole, “Selection of single-stranded DNA molecules that bind and inhibit human thrombin,” Nature 355(6360), 564–566 (1992).
12. K. Y. Wang, S. McCurdy, R. G. Shea, S. Swaminathan, and P. H. Bolton, “A DNA aptamer which binds to and inhibits thrombin exhibits a new structural motif for DNA,” Biochemistry 32(8), 1899–1904 (1993).
#137019 - $15.00 USD Received 22 Oct 2010; revised 7 Dec 2010; accepted 18 Dec 2010; published 23 Dec 2010(C) 2011 OSA 1 February 2011 / Vol. 2, No. 2 / BIOMEDICAL OPTICS EXPRESS 207
13. K. Y. Wang, S. H. Krawczyk, N. Bischofberger, S. Swaminathan, and P. H. Bolton, “The tertiary structure of a DNA aptamer which binds to and inhibits thrombin determines activity,” Biochemistry 32(42), 11285–11292 (1993).
14. R. F. Macaya, P. Schultze, F. W. Smith, J. A. Roe, and J. Feigon, “Thrombin-binding DNA aptamer forms a unimolecular quadruplex structure in solution,” Proc. Natl. Acad. Sci. U.S.A. 90(8), 3745–3749 (1993).
15. P. Schultze, R. F. Macaya, and J. Feigon, “Three-dimensional solution structure of the thrombin-binding DNA aptamer d(GGTTGGTGTGGTTGG),” J. Mol. Biol. 235(5), 1532–1547 (1994).
16. K. Padmanabhan, K. P. Padmanabhan, J. D. Ferrara, J. E. Sadler, and A. Tulinsky, “The structure of alpha-thrombin inhibited by a 15-mer single-stranded DNA aptamer,” J. Biol. Chem. 268(24), 17651–17654 (1993).
17. B. I. Kankia, and L. A. Marky, “Folding of the thrombin aptamer into a G-quadruplex with Sr(2+): stability, heat, and hydration,” J. Am. Chem. Soc. 123(44), 10799–10804 (2001).
18. S. Nagatoishi, Y. Tanaka, and K. Tsumoto, “Circular dichroism spectra demonstrate formation of the thrombin-binding DNA aptamer G-quadruplex under stabilizing-cation-deficient conditions,” Biochem. Biophys. Res. Commun. 352(3), 812–817 (2007).
19. M. Vairamani, and M. L. Gross, “G-quadruplex formation of thrombin-binding aptamer detected by electrospray ionization mass spectrometry,” J. Am. Chem. Soc. 125(1), 42–43 (2003).
20. F. Rosu, V. Gabelica, H. Poncelet, and E. De Pauw, “Tetramolecular G-quadruplex formation pathways studied by electrospray mass spectrometry,” Nucleic Acids Res. 38(15), 5217–5225 (2010).
21. G. W. Collie, G. N. Parkinson, S. Neidle, F. Rosu, E. De Pauw, and V. Gabelica, “Electrospray mass spectrometry of telomeric RNA (TERRA) reveals the formation of stable multimeric G-quadruplex structures,” J. Am. Chem. Soc. 132(27), 9328–9334 (2010).
22. J.-L. Mergny, A.-T. Phan, and L. Lacroix, “Following G-quartet formation by UV-spectroscopy,” FEBS Lett. 435(1), 74–78 (1998).
23. J. A. Mondragon-Sanchez, J. Liquier, R. H. Shafer, and E. Taillandier, “Tetraplex structure formation in the thrombin-binding DNA aptamer by metal cations measured by vibrational spectroscopy,” J. Biomol. Struct. Dyn. 22(3), 365–373 (2004).
24. M. R. Guzmán, J. Liquier, S. K. Brahmachari, and E. Taillandier, “Characterization of parallel and antiparallel G-tetraplex structures by vibrational spectroscopy,” Spectrochim. Acta A Mol. Biomol. Spectrosc. 64(2), 495–503 (2006).
25. T. Miura, and G. J. Thomas, Jr., “Structural polymorphism of telomere DNA: interquadruplex and duplex-quadruplex conversions probed by Raman spectroscopy,” Biochemistry 33(25), 7848–7856 (1994).
26. T. Miura, and G. J. Thomas, Jr., “Structure and dynamics of interstrand guanine association in quadruplex telomeric DNA,” Biochemistry 34(29), 9645–9654 (1995).
27. L. Laporte, and G. J. Thomas, Jr., “Structural basis of DNA recognition and mechanism of quadruplex formation by the beta subunit of the Oxytricha telomere binding protein,” Biochemistry 37(5), 1327–1335 (1998).
28. C. Krafft, J. M. Benevides, and G. J. Thomas, Jr., “Secondary structure polymorphism in Oxytricha nova telomeric DNA,” Nucleic Acids Res. 30(18), 3981–3991 (2002).
29. C. V. Pagba, S. M. Lane, and S. Wachsmann-Hogiu, “Raman and surface-enhanced Raman spectroscopic studies of the 15-mer DNA thrombin-binding aptamer,” J. Raman Spectrosc. 41, 241–247 (2010).
30. J. M. Benevides, and G. J. Thomas, Jr., “Characterization of DNA structures by Raman spectroscopy: high-salt and low-salt forms of double helical poly(dG-dC) in H2O and D2O solutions and application to B, Z and A-DNA,” Nucleic Acids Res. 11(16), 5747–5761 (1983).
31. B. Prescott, Jr., W. Steinmetz, and G. J. Thomas, Jr., “Characterization of DNA structures by laser Raman spectroscopy,” Biopolymers 23(2), 235–256 (1984).
32. Y. Nishimura, M. Tsuboi, T. Sato, and K. Aoki, “Conformation-sensitive Raman lines of mononucleotides and their use in a structure analysis of polynucleotides: guanine and cytosine nucleotides,” J. Mol. Struct. 146(3-4), 123–153 (1986).
33. D. Zhang, Y. Xie, M. F. Mrozek, C. Ortiz, V. J. Davisson, and D. Ben-Amotz, “Raman detection of proteomic analytes,” Anal. Chem. 75(21), 5703–5709 (2003).
34. C. Ortiz, D. Zhang, Y. Xie, A. E. Ribbe, and D. Ben-Amotz, “Validation of the drop coating deposition Raman method for protein analysis,” Anal. Biochem. 353(2), 157–166 (2006).
35. A. Barhoumi, D. Zhang, F. Tam, and N. J. Halas, “Surface-enhanced Raman spectroscopy of DNA,” J. Am. Chem. Soc. 130(16), 5523–5529 (2008).
36. J. M. Benevides, M. A. Weiss, and G. J. Thomas, Jr., “DNA recognition by the helix-turn-helix motif: investigation by laser Raman spectroscopy of the phage lambda repressor and its interaction with operator sites OL1 and OR3,” Biochemistry 30(24), 5955–5963 (1991).
37. W. L. Peticolas, E. Evertsz, M. J. L. David, and E. D. James, “[17] Conformation of DNA in Vitro and in Vivo from laser Raman scattering,” in Methods in Enzymology(Academic Press, 1992), pp. 335–352.
38. J. M. Benevides, A. H. J. Wang, G. A. van der Marel, J. H. van Boom, and G. J. Thomas, Jr., “Crystal and solution structures of the B-DNA dodecamer d(CGCAAATTTGCG) probed by Raman spectroscopy: heterogeneity in the crystal structure does not persist in the solution structure,” Biochemistry 27(3), 931–938 (1988).
39. C. Otto, T. J. J. van den Tweel, F. F. M. de Mul, and J. Greve, “Surface-enhanced Raman spectroscopy of DNA bases,” J. Raman Spectrosc. 17(3), 289–298 (1986).
40. M. Webba da Silva, “Geometric formalism for DNA quadruplex folding,” Chemistry 13(35), 9738–9745 (2007).
#137019 - $15.00 USD Received 22 Oct 2010; revised 7 Dec 2010; accepted 18 Dec 2010; published 23 Dec 2010(C) 2011 OSA 1 February 2011 / Vol. 2, No. 2 / BIOMEDICAL OPTICS EXPRESS 208
41. J. Dai, D. Chen, R. A. Jones, L. H. Hurley, and D. Yang, “NMR solution structure of the major G-quadruplex structure formed in the human BCL2 promoter region,” Nucleic Acids Res. 34(18), 5133–5144 (2006).
42. V. Kuryavyi, A. Majumdar, A. Shallop, N. Chernichenko, E. Skripkin, R. Jones, and D. J. Patel, “A double chain reversal loop and two diagonal loops define the architecture of a unimolecular DNA quadruplex containing a pair of stacked G(syn)-G(syn)-G(anti)-G(anti) tetrads flanked by a G-(T-T) Triad and a T-T-T triple,” J. Mol. Biol. 310(1), 181–194 (2001).
43. N. Jing, R. F. Rando, Y. Pommier, and M. E. Hogan, “Ion selective folding of loop domains in a potent anti-HIV oligonucleotide,” Biochemistry 36(41), 12498–12505 (1997).
44. W. L. Peticolas, and E. Evertsz, “Conformation of DNA in vitro and in vivo from laser Raman scattering,” in Methods in Enzymology, J. E. D. David, M. J. Lilley, eds. (Academic Press, 1992), pp. 335–352.
1. Introduction
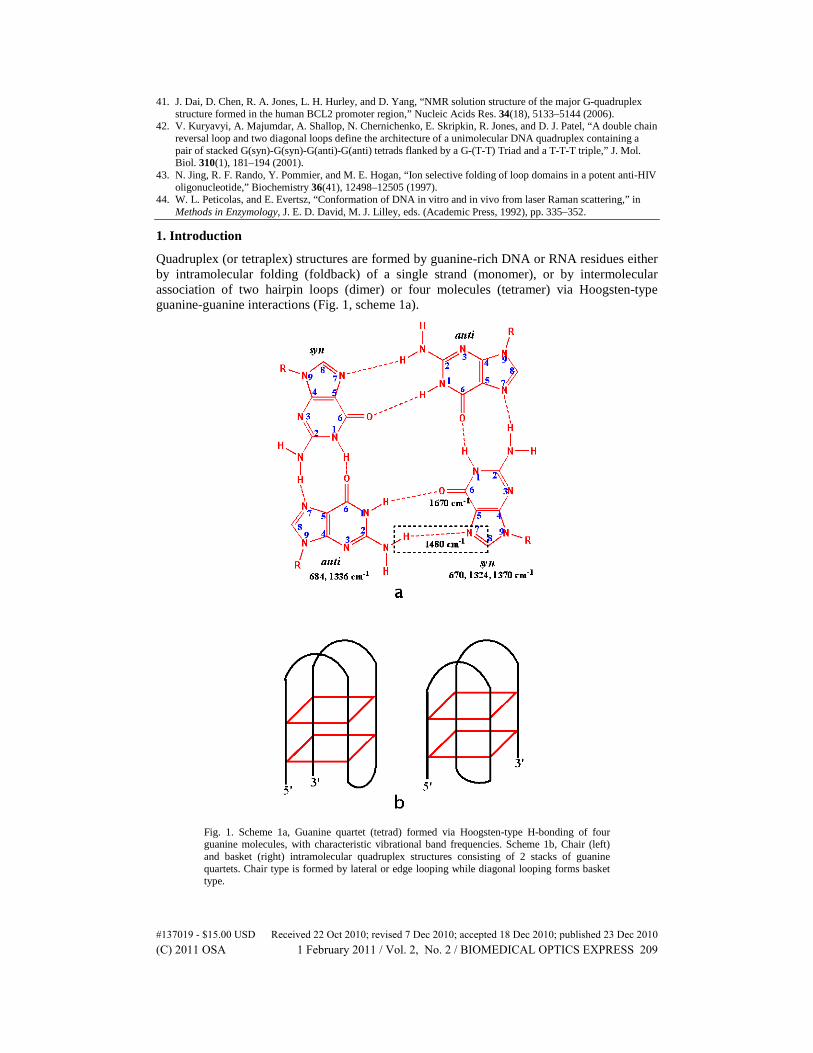
Quadruplex (or tetraplex) structures are formed by guanine-rich DNA or RNA residues either by intramolecular folding (foldback) of a single strand (monomer), or by intermolecular association of two hairpin loops (dimer) or four molecules (tetramer) via Hoogsten-type guanine-guanine interactions (Fig. 1, scheme 1a).
Fig. 1. Scheme 1a, Guanine quartet (tetrad) formed via Hoogsten-type H-bonding of four guanine molecules, with characteristic vibrational band frequencies. Scheme 1b, Chair (left) and basket (right) intramolecular quadruplex structures consisting of 2 stacks of guanine quartets. Chair type is formed by lateral or edge looping while diagonal looping forms basket type.
#137019 - $15.00 USD Received 22 Oct 2010; revised 7 Dec 2010; accepted 18 Dec 2010; published 23 Dec 2010(C) 2011 OSA 1 February 2011 / Vol. 2, No. 2 / BIOMEDICAL OPTICS EXPRESS 209
This structure consists of a series of guanine quartets (four guanine-bases) that are stacked on each other (Fig. 1, scheme 1b). The formation of this structure is dependent on temperature, DNA concentration, ligand binding, and the presence of certain cations such as Na+, K+, Ca2+, Pb,2+ and Sr2+ among others. They can be classified as parallel or anti-parallel, depending on the orientation of the strands and the conformation of the guanosine residues. In parallel structure, all guanosines have anti conformation, whereas in the antiparallel configuration, guanosine residues alternate between syn and anti (Fig. 1, scheme 1a).
These structures were first found in telomeres, which play an important part in apoptosis. It was also found that these structures bind to telomerase (which is active in ~80% of cancer cells), leading to inhibition of its activity. Thus, there has been an active search for quadruplex-stabilizing ligands for cancer therapy. Quadruplex structures are also found in several proto-oncogenes such as, c-Myc, Bcl2, c-kit, VEGF [1,2] making them a potential molecular target of anti-cancer cancer drugs.
Several aptamers, which are functional oligonucleotides (DNA, RNA and PNA), have also been reported to form such structures in the presence of their corresponding target molecules. Aptamers are generated by the process called Systematic Evolution of Ligands by Exponential Enrichment (SELEX) [3,4]. They have been shown to exhibit protein-binding affinities that are comparable to those of corresponding antibodies. This affinity results from the ability of the aptamers to form secondary structures such as hairpin loop, T-junction and quadruplex [5,6]. In particular, aptamers for certain cancer biomarkers [7–10], HIV-1 associated proteins and thrombin [11] have been shown to form quadruplex structures.
The formation of this structure can be detected by NMR spectroscopy [12–15], X-ray crystallography [16], circular dichroism spectroscopy [17,18], mass spectrometry [19–21], UV [22], infrared [23,24] and Raman spectroscopy [25–29]. Vibrational spectroscopy is a valuable tool in studying the secondary structures of nucleic acids, as it is sensitive to their different conformations. This is due to the fact that changes in the conformation often lead to changes in the vibrational frequencies of the sugar-phosphate backbone and nucleic acid vibrations [30–32].
In the present study, Raman spectra of the quadruplex-forming thrombin binding aptamer (TBA) are recorded at different temperatures both in the presence and absence of potassium ions. We show that the quadrudplex structure of TBA is lost at higher temperatures but is restored in the presence of stabilizing K+ ions. Raman spectra of other guanine-rich biologically important DNA sequences (HIV integrase aptamer, T30695; Human Telomeric Sequence 1 and Sequence 2, HT1 and HT2, respectively; Bcl-2 promoter sequence; and d(G2T4G2CAG2GT4G2T) that are capable of forming intramolecular quadruplex structures are also recorded. Our results show that drop coating deposition Raman spectroscopy could be used for analysis of guanine-rich DNA sequences to detect the formation of and the conformational changes in the quadruplex structures. The present study uses less concentrated (micromolar range) DNA solutions than what is normally required (millimolar range) for Raman measurements of biological solutions (e.g. refs 25-27), and is an extension of our previous work which presented Raman and SERS spectra of thiolated and unthiolated TBA (29).
2. Materials and methods
2.1. Reagents
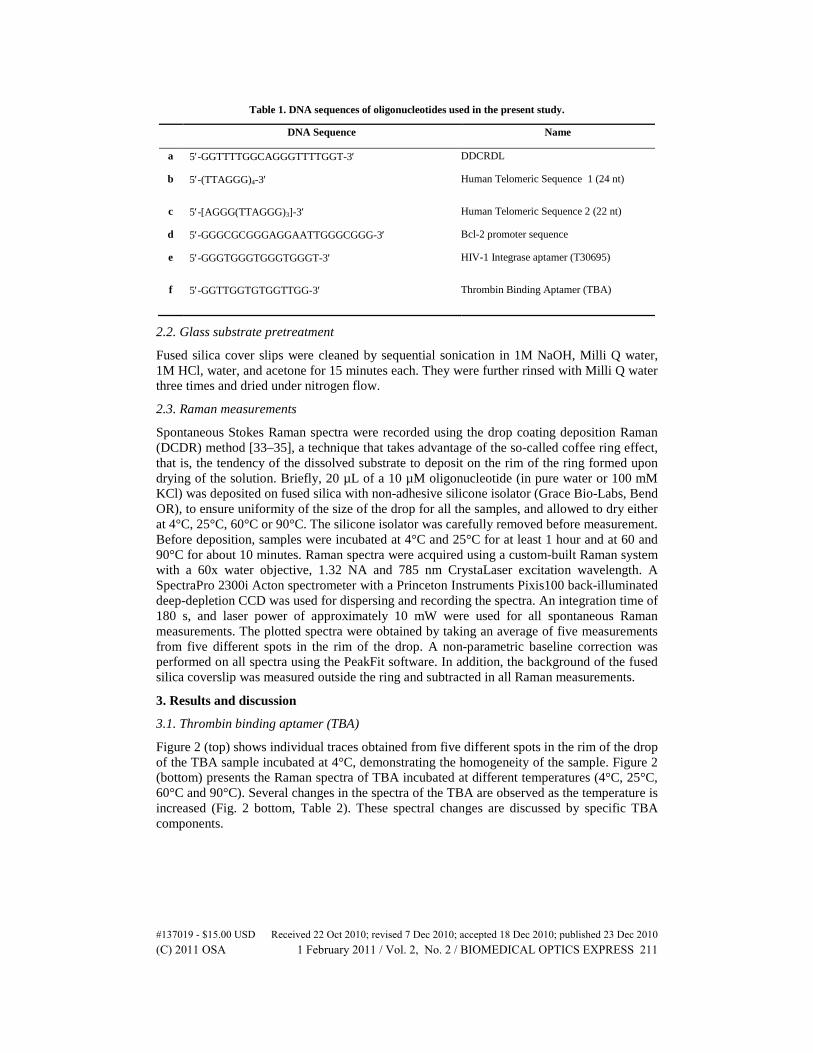
Potassium chloride and Hyclone water were obtained from Fisher Scientific. All the oligonucleotides were ordered from Sigma Chemical Company and used without further purification. The DNA sequences of the oligonucleotides used are listed in Table 1.
#137019 - $15.00 USD Received 22 Oct 2010; revised 7 Dec 2010; accepted 18 Dec 2010; published 23 Dec 2010(C) 2011 OSA 1 February 2011 / Vol. 2, No. 2 / BIOMEDICAL OPTICS EXPRESS 210
Table 1. DNA sequences of oligonucleotides used in the present study.
DNA Sequence Name
a 5′-GGTTTTGGCAGGGTTTTGGT-3′ DDCRDL
b 5′-(TTAGGG)4-3′
Human Telomeric Sequence 1 (24 nt)
c 5′-[AGGG(TTAGGG)3]-3′ Human Telomeric Sequence 2 (22 nt)
d 5′-GGGCGCGGGAGGAATTGGGCGGG-3′ Bcl-2 promoter sequence
e 5′-GGGTGGGTGGGTGGGT-3′
HIV-1 Integrase aptamer (T30695)
f 5′-GGTTGGTGTGGTTGG-3′
Thrombin Binding Aptamer (TBA)
2.2. Glass substrate pretreatment
Fused silica cover slips were cleaned by sequential sonication in 1M NaOH, Milli Q water, 1M HCl, water, and acetone for 15 minutes each. They were further rinsed with Milli Q water three times and dried under nitrogen flow.
2.3. Raman measurements
Spontaneous Stokes Raman spectra were recorded using the drop coating deposition Raman (DCDR) method [33–35], a technique that takes advantage of the so-called coffee ring effect, that is, the tendency of the dissolved substrate to deposit on the rim of the ring formed upon drying of the solution. Briefly, 20 µL of a 10 µM oligonucleotide (in pure water or 100 mM KCl) was deposited on fused silica with non-adhesive silicone isolator (Grace Bio-Labs, Bend OR), to ensure uniformity of the size of the drop for all the samples, and allowed to dry either at 4°C, 25°C, 60°C or 90°C. The silicone isolator was carefully removed before measurement. Before deposition, samples were incubated at 4°C and 25°C for at least 1 hour and at 60 and 90°C for about 10 minutes. Raman spectra were acquired using a custom-built Raman system with a 60x water objective, 1.32 NA and 785 nm CrystaLaser excitation wavelength. A SpectraPro 2300i Acton spectrometer with a Princeton Instruments Pixis100 back-illuminated deep-depletion CCD was used for dispersing and recording the spectra. An integration time of 180 s, and laser power of approximately 10 mW were used for all spontaneous Raman measurements. The plotted spectra were obtained by taking an average of five measurements from five different spots in the rim of the drop. A non-parametric baseline correction was performed on all spectra using the PeakFit software. In addition, the background of the fused silica coverslip was measured outside the ring and subtracted in all Raman measurements.
3. Results and discussion
3.1. Thrombin binding aptamer (TBA)
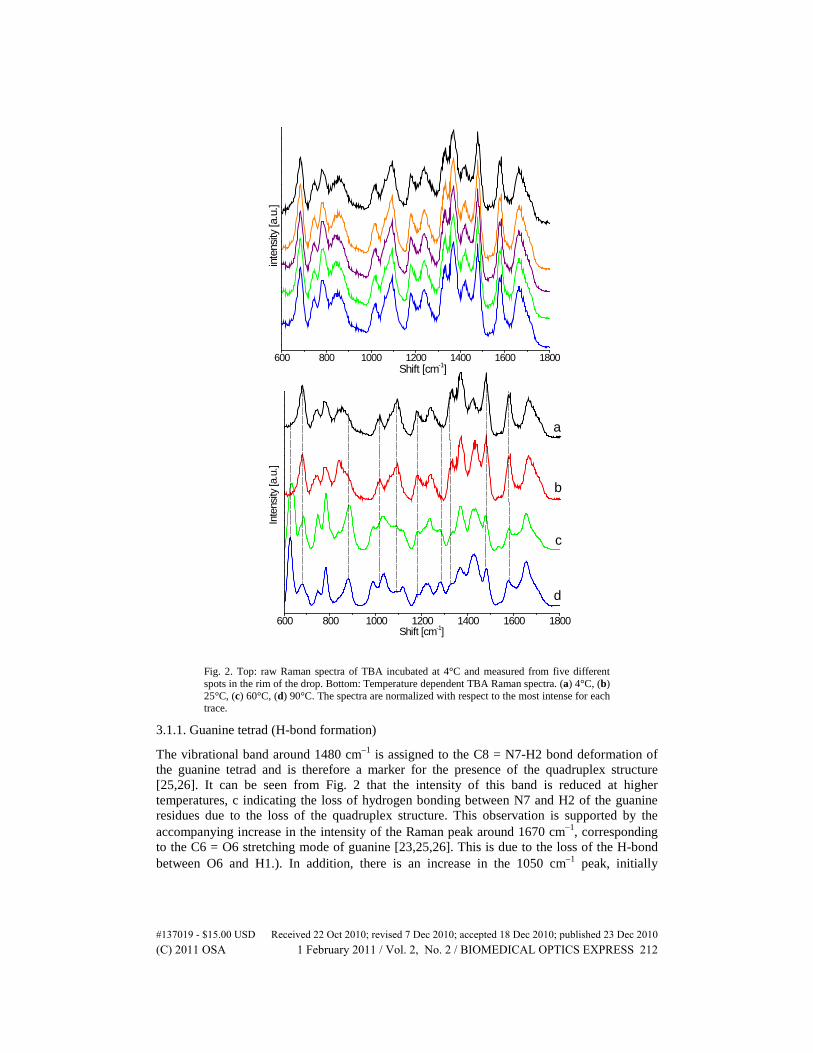
Figure 2 (top) shows individual traces obtained from five different spots in the rim of the drop of the TBA sample incubated at 4°C, demonstrating the homogeneity of the sample. Figure 2 (bottom) presents the Raman spectra of TBA incubated at different temperatures (4°C, 25°C, 60°C and 90°C). Several changes in the spectra of the TBA are observed as the temperature is increased (Fig. 2 bottom, Table 2). These spectral changes are discussed by specific TBA components.
#137019 - $15.00 USD Received 22 Oct 2010; revised 7 Dec 2010; accepted 18 Dec 2010; published 23 Dec 2010(C) 2011 OSA 1 February 2011 / Vol. 2, No. 2 / BIOMEDICAL OPTICS EXPRESS 211
600 800 1000 1200 1400 1600 1800
Inte
nsity
[a.u
.]
Shift [cm-1]
d
c
b
a
600 800 1000 1200 1400 1600 1800
inte
nsity
[a.u
.]
Shift [cm-1]
Fig. 2. Top: raw Raman spectra of TBA incubated at 4°C and measured from five different spots in the rim of the drop. Bottom: Temperature dependent TBA Raman spectra. (a) 4°C, (b) 25°C, (c) 60°C, (d) 90°C. The spectra are normalized with respect to the most intense for each trace.
3.1.1. Guanine tetrad (H-bond formation)
The vibrational band around 1480 cm−1 is assigned to the C8 = N7-H2 bond deformation of the guanine tetrad and is therefore a marker for the presence of the quadruplex structure [25,26]. It can be seen from Fig. 2 that the intensity of this band is reduced at higher temperatures, c indicating the loss of hydrogen bonding between N7 and H2 of the guanine residues due to the loss of the quadruplex structure. This observation is supported by the accompanying increase in the intensity of the Raman peak around 1670 cm−1, corresponding to the C6 = O6 stretching mode of guanine [23,25,26]. This is due to the loss of the H-bond between O6 and H1.). In addition, there is an increase in the 1050 cm−1 peak, initially
#137019 - $15.00 USD Received 22 Oct 2010; revised 7 Dec 2010; accepted 18 Dec 2010; published 23 Dec 2010(C) 2011 OSA 1 February 2011 / Vol. 2, No. 2 / BIOMEDICAL OPTICS EXPRESS 212
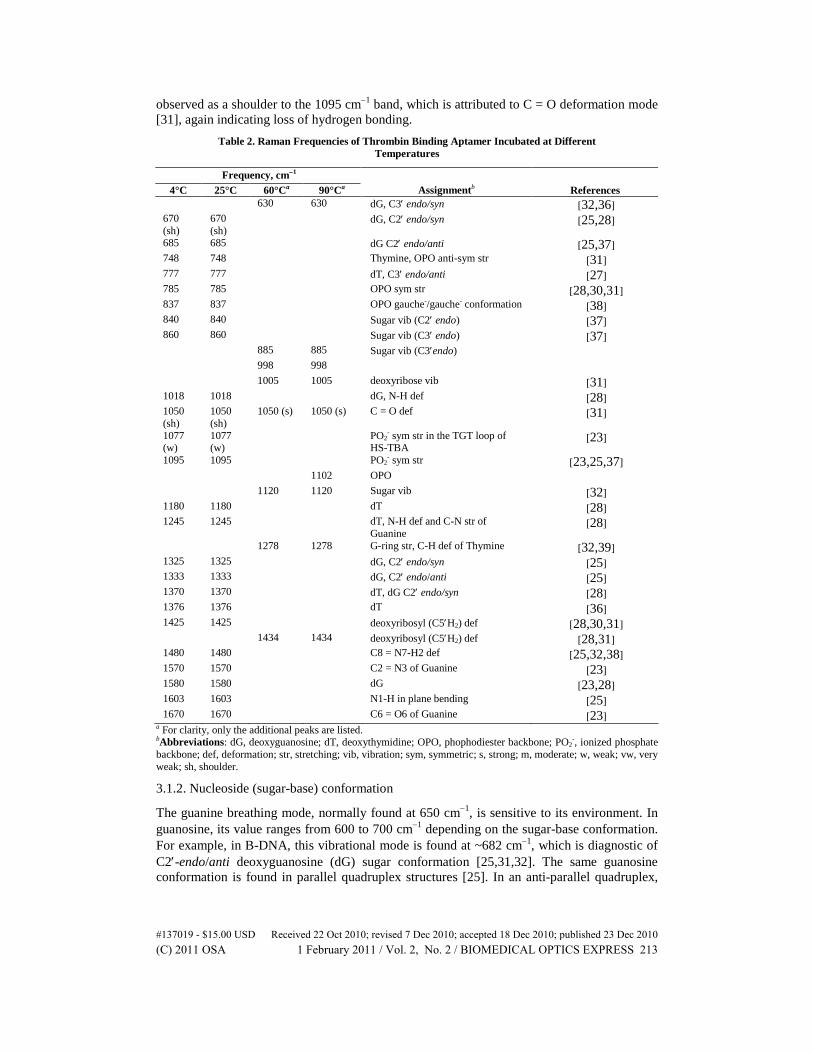
observed as a shoulder to the 1095 cm−1 band, which is attributed to C = O deformation mode [31], again indicating loss of hydrogen bonding.
Table 2. Raman Frequencies of Thrombin Binding Aptamer Incubated at Different Temperatures
The guanine breathing mode, normally found at 650 cm−1, is sensitive to its environment. In guanosine, its value ranges from 600 to 700 cm−1 depending on the sugar-base conformation. For example, in B-DNA, this vibrational mode is found at ~682 cm−1, which is diagnostic of C2′-endo/anti deoxyguanosine (dG) sugar conformation [25,31,32]. The same guanosine conformation is found in parallel quadruplex structures [25]. In an anti-parallel quadruplex,
#137019 - $15.00 USD Received 22 Oct 2010; revised 7 Dec 2010; accepted 18 Dec 2010; published 23 Dec 2010(C) 2011 OSA 1 February 2011 / Vol. 2, No. 2 / BIOMEDICAL OPTICS EXPRESS 213
where both parallel and anti-parallel strands are present, an additional peak at 670 cm−1 corresponding to the C2′-endo/syn conformation is also found [25]. TBA, which assumes an antiparallel topology exhibits a strong band at around 682 cm−1, indicating C2′-endo/anti guanosine conformation. The band corresponding to C2′-endo/syn conformation around 670 cm,−1 which should also be expected in an anti-parallel quadruplex is only seen as a shoulder to the much stronger 682 cm−1 band. The presence of C2′-endo/syn conformation, however, is indicated by the intense 1370 cm−1 band (also attributed to deoxythymidine, dT) and by the 1324 cm−1 shoulder to the 1336 cm−1 band due to C2′-endo/anti conformation [25,26,28].
As the temperature is raised, several changes in these regions (600-700 cm−1 and 1300-1400 cm−1) are observed. The band around 680 cm−1 disappears and a new band at 630 cm−1 emerges, suggesting a change from a C2′-endo/anti to C3′ -endo/syn conformation [32,36]. These changes are accompanied by a decrease in the 1370 cm−1 band and the disappearance of 1324 cm−1 and 1333 cm−1 peaks suggesting the loss of dG anti and syn conformation, respectively. These observations are further supported by the accompanying shift of 840 cm−1 band, due to C2′-endo sugar conformation, to 885 cm−1 band that is characteristic of C3′-endo sugar conformation [37]. The shift of 1422 cm−1 band, assigned to C5′H2 deformation in C2′- endo sugar conformation [28,30,31], to 1434 cm−1 band is also consistent with the loss of the C2′ -endo conformation.
It can also be seen that the intensities of the 1580 cm−1 and 1018 cm−1 bands both assigned to deoxyguanosine (dG) are greatly reduced at higher temperature suggesting that these bands are associated with the quadruplex form. In addition, the band around 1180 cm−1, which is due to deoxythymidine (dT), disappears. The disappearance of this band at higher temperature strongly indicates that this dT vibrational mode is associated with the quadruplex structure. A new band around 1280 cm−1, which corresponds to C-H deformation in thymine [32,39], starts to appear at 60°C.
3.1.3. Phosphate backbone
The intense 1095 cm−1 band, which corresponds to the symmetric stretching of the ionized phosphate (PO2
-) groups in the guanine nucleotides involved in the Hoogsten-base pairing [23] are indicative of the presence of the guanine tetrad. As the temperature is increased, the intensity of this band is reduced and is shifted to a less intense band at around 1100 cm−1, suggesting a change in phosphate backbone due to melting. This observation is supported by a dramatic decrease in the intensity of 745 cm−1 band (due to phosphodiester anti-symmetric stretching) with accompanying increase in intensity of 785 cm−1 band (due to phosphodiester symmetric stretching).
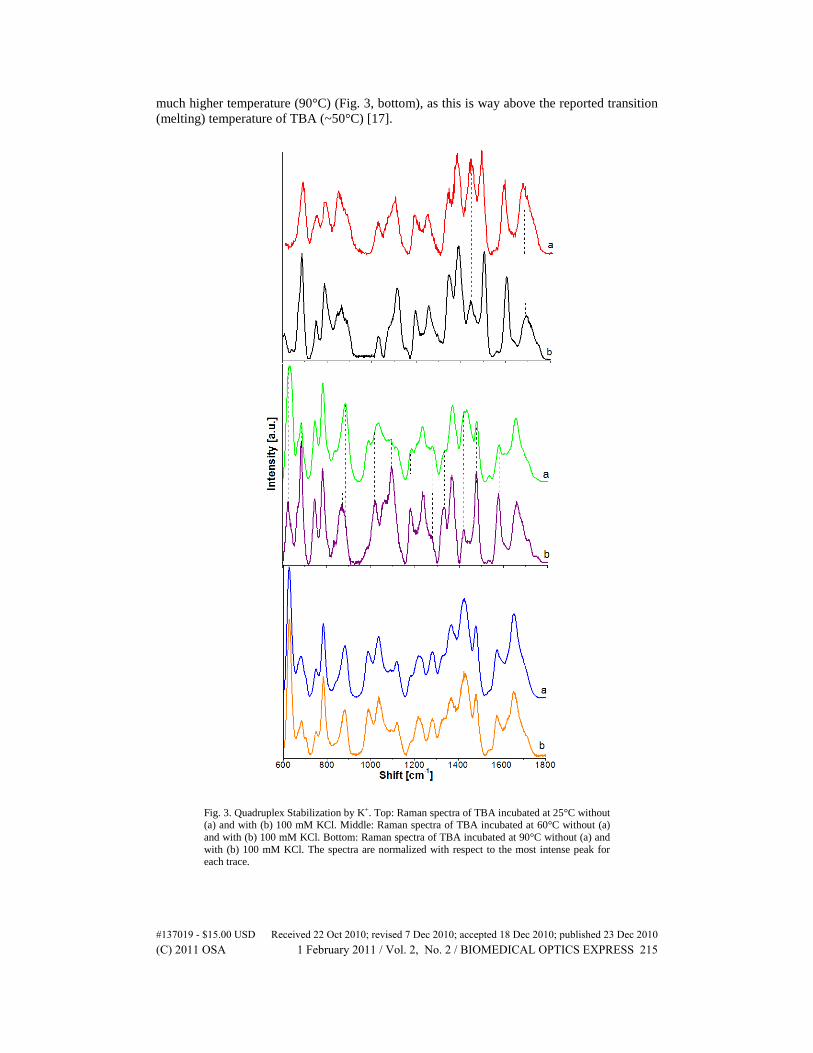
3.1.4. Stabilization by K+ ions
Figure 3 presents the spectra of TBA with and without KCl. The spectra obtained at 25°C (Fig. 3, top) both show the characteristic bands of a quadruplex structure but there are minor differences observed. Most notably, the C6 = O6 band (~1670 cm−1) in the spectrum of TBA with K+ is less intense relative to that of the 1580 cm−1 band. This reduction in intensity can be attributed to the interaction (i.e., coordination-bond formation) of the K+ ion with the H-bonded O6. The diagnostic 1480 cm−1 band is also more intense compared to the 1425 cm−1 peak. These observations point to the added stability of the quadruplex structure provided by the K+ ions.
It can also be seen that the addition of K+ ions restores the quadruplex structure of TBA incubated 60°C (Fig. 3 middle, a), as evidenced by the presence of the characteristic quadruplex peaks such as, 685, 850, 1090, 1327, 1333, and 1480 cm−1. In addition, the 1580 cm−1 peak becomes more intense compared to that of TBA in water alone, further supporting the presence of the quadruplex structure at 60°C. However, no stabilization is observed at a
#137019 - $15.00 USD Received 22 Oct 2010; revised 7 Dec 2010; accepted 18 Dec 2010; published 23 Dec 2010(C) 2011 OSA 1 February 2011 / Vol. 2, No. 2 / BIOMEDICAL OPTICS EXPRESS 214
much higher temperature (90°C) (Fig. 3, bottom), as this is way above the reported transition (melting) temperature of TBA (~50°C) [17].
Fig. 3. Quadruplex Stabilization by K+. Top: Raman spectra of TBA incubated at 25°C without (a) and with (b) 100 mM KCl. Middle: Raman spectra of TBA incubated at 60°C without (a) and with (b) 100 mM KCl. Bottom: Raman spectra of TBA incubated at 90°C without (a) and with (b) 100 mM KCl. The spectra are normalized with respect to the most intense peak for each trace.
#137019 - $15.00 USD Received 22 Oct 2010; revised 7 Dec 2010; accepted 18 Dec 2010; published 23 Dec 2010(C) 2011 OSA 1 February 2011 / Vol. 2, No. 2 / BIOMEDICAL OPTICS EXPRESS 215
3.2. Other quadruplex topologies
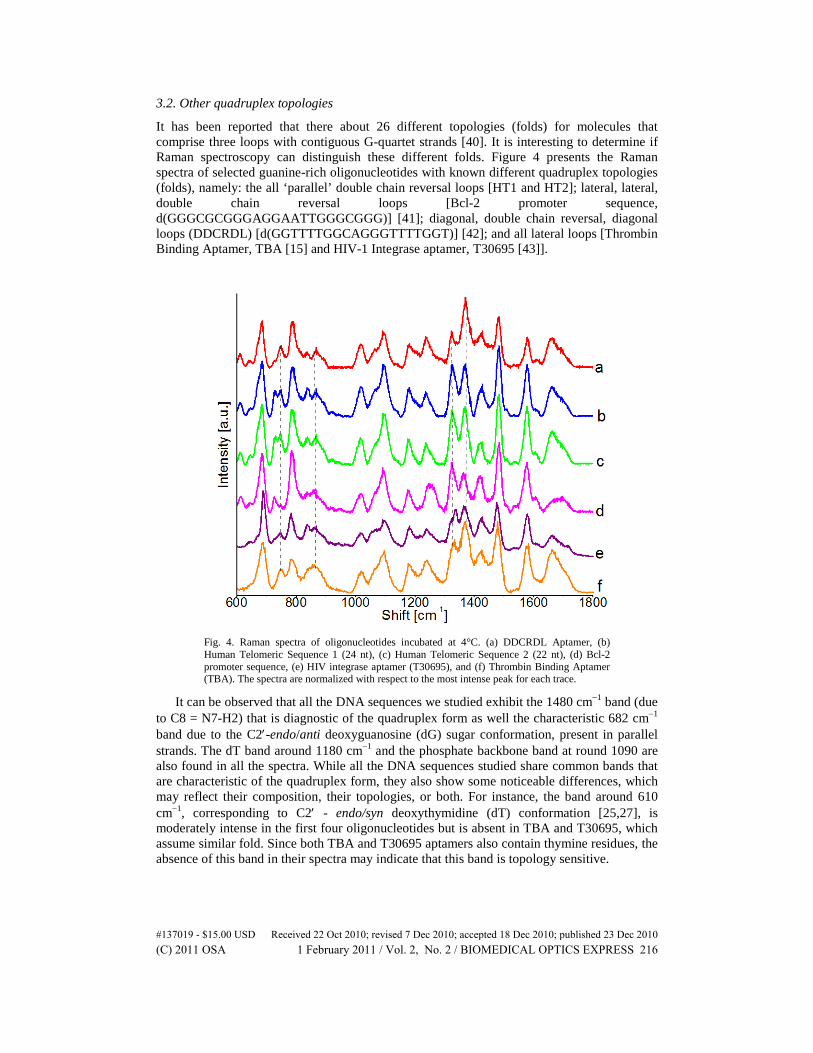
It has been reported that there about 26 different topologies (folds) for molecules that comprise three loops with contiguous G-quartet strands [40]. It is interesting to determine if Raman spectroscopy can distinguish these different folds. Figure 4 presents the Raman spectra of selected guanine-rich oligonucleotides with known different quadruplex topologies (folds), namely: the all ‘parallel’ double chain reversal loops [HT1 and HT2]; lateral, lateral, double chain reversal loops [Bcl-2 promoter sequence, d(GGGCGCGGGAGGAATTGGGCGGG)] [41]; diagonal, double chain reversal, diagonal loops (DDCRDL) [d(GGTTTTGGCAGGGTTTTGGT)] [42]; and all lateral loops [Thrombin Binding Aptamer, TBA [15] and HIV-1 Integrase aptamer, T30695 [43]].
Fig. 4. Raman spectra of oligonucleotides incubated at 4°C. (a) DDCRDL Aptamer, (b) Human Telomeric Sequence 1 (24 nt), (c) Human Telomeric Sequence 2 (22 nt), (d) Bcl-2 promoter sequence, (e) HIV integrase aptamer (T30695), and (f) Thrombin Binding Aptamer (TBA). The spectra are normalized with respect to the most intense peak for each trace.
It can be observed that all the DNA sequences we studied exhibit the 1480 cm−1 band (due to C8 = N7-H2) that is diagnostic of the quadruplex form as well the characteristic 682 cm−1 band due to the C2′-endo/anti deoxyguanosine (dG) sugar conformation, present in parallel strands. The dT band around 1180 cm−1 and the phosphate backbone band at round 1090 are also found in all the spectra. While all the DNA sequences studied share common bands that are characteristic of the quadruplex form, they also show some noticeable differences, which may reflect their composition, their topologies, or both. For instance, the band around 610 cm−1, corresponding to C2′ - endo/syn deoxythymidine (dT) conformation [25,27], is moderately intense in the first four oligonucleotides but is absent in TBA and T30695, which assume similar fold. Since both TBA and T30695 aptamers also contain thymine residues, the absence of this band in their spectra may indicate that this band is topology sensitive.
#137019 - $15.00 USD Received 22 Oct 2010; revised 7 Dec 2010; accepted 18 Dec 2010; published 23 Dec 2010(C) 2011 OSA 1 February 2011 / Vol. 2, No. 2 / BIOMEDICAL OPTICS EXPRESS 216
Another very noticeable difference is seen in the 1320-1370 cm−1 region. In T30695 spectrum, the 1336 cm−1 band, which corresponds to C2′ endo/anti dG conformation, is more prominent than 1327 cm−1 peak (due to C2′ -endo/syn conformation). The 1327 cm−1 band, which is diagnostic of the C2′ -endo/syn dG conformation is more intense in the spectrum of Bcl-2 promoter sequence, which reflects the higher guanine ratio. Similarly, the 1370 cm−1 peak, which corresponds to dT vibration, is much more intense in the DDCRDL oligonucleotide spectrum due to increased number of thymine residues in the aptamer.
There are also significant differences observed in the 700-800 cm−1 region. First, the 785 cm−1 band (assigned to the symmetric phosphodiester stretching and cytosine ring breathing mode) [30] is more intense in the Bcl-2 spectrum compared to the rest of the spectra, due to the presence of 3 cytosine residues in the sequence. Second, the 725 cm−1 band (assigned to the adenine ring breathing vibration) [31] is moderately intense in the spectra of adenine-containing oligonucleotide sequences, HT1, HT2 and Bcl-2 promoter but is only a shoulder in the spectrum of DDCRDL aptamer, as there is only one adenine residue in the sequence. Third, the 748 cm −1 band (assigned to the thymine ring breathing vibration) is observed in all the spectra except for that of Bcl-2 promoter sequence. These results may be showed that Raman spectroscopy may be explored to monitor the formation of as well as the stability of quadruplex structures.
4. Conclusion
We use Raman spectroscopy to show the formation of and stability of the TBA quadruplex structures at different temperatures. We show that at higher temperatures (≥ 60°C), TBA forms another structure that is dominated by a C3′- endo dG conformation, also found in A-DNA [44]. We also demonstrated that potassium ions can stabilize the quadruplex form of TBA at temperatures close to its melting point as evidenced by the restoration of the Raman bands that are associated with the quadruplex structure.
These results show that Raman spectroscopy may be used to monitor conformational changes in certain quadruplex structures. While this method provides low-level resolution, it provides sufficient information for verifying the presence of such structures, as well as their stability. It also offers the possibility of determining its topology (folding) and may also explored for routine diagnostic method of monitoring the conformational changes that a particular quadruplex topology undergoes in response to changes in its environment (e.g. ligand binding, metal binding, temperature change). We believe that the results will be particularly useful in initial structural studies of newly developed aptamers that are rich in guanine residues.
Acknowledgments
This work was supported by funding from the National Science Foundation (NSF). The Center for Biophotonics Science and Technology is a designated NSF Science and Technology Center, managed by the University of California, Davis under Cooperative Agreement No. PHY 0120999.
#137019 - $15.00 USD Received 22 Oct 2010; revised 7 Dec 2010; accepted 18 Dec 2010; published 23 Dec 2010(C) 2011 OSA 1 February 2011 / Vol. 2, No. 2 / BIOMEDICAL OPTICS EXPRESS 217